2017 · pt oto multiartha and pt summit oto finance, of indonesia, become equity method affiliates...
TRANSCRIPT

2017ANNUAL REPORT
YEAR ENDED MARCH 31, 2017
This annual report conveys financial and non-financial information about
the overall picture, business strategy, and corporate infrastructure of
Sumitomo Mitsui Financial Group (SMFG). It has been compiled with
reference to the International Integrated Reporting Framework issued by
the International Integrated Reporting Council (IIRC) in December 2013.
Scope of Report
Period covered: Fiscal 2016 (April 2016 to March 2017)
Some subsequent information is also included.
Organizations covered: Sumitomo Mitsui Financial Group and
its subsidiaries and affiliates
PublishedAugust 2017
CAUTIONARY STATEMENT REGARDING FORWARD-LOOKING STATEMENTS
This document contains “forward-looking statements” (as defined in the U.S. Private Securities Litigation Reform Act of 1995), regarding the intent, belief or current expectations of us and our managements with respect to our future financial condition and results of operations. In many cases but not all, these statements contain words such as “anticipate,” “believe,” “estimate,” “expect,” “intend,” “may,” “plan,” “probability,” “risk,” “project,” “should,” “seek,” “target,” “will” and similar expressions. Such forward-looking statements are not guarantees of future performance and involve risks and uncertainties, and actual results may differ from those expressed in or implied by such forward-looking statements contained or deemed to be contained herein. The risks and uncertainties which may affect future performance include: deterioration of Japanese and global economic conditions and finan-cial markets; declines in the value of our securities portfolio; incurrence of significant credit-related costs; our ability to successfully implement our business strategy through our subsidiaries, affiliates and alliance partners; and exposure to new risks as we expand the scope of our business. Given these and other risks and uncertainties, you should not place undue reliance on forward-looking statements, which speak only as of the date of this document. We undertake no obligation to update or revise any forward-looking statements.
Please refer to our most recent disclosure documents such as our annual report on Form 20-F and other docu-ments submitted to the U.S. Securities and Exchange Commission, as well as our earnings press releases, for a more detailed description of the risks and uncertainties that may affect our financial conditions and our operating results, and investors’ decisions.
Editorial Policy
44 Corporate Infrastructure
46 Corporate Governance
48 Outside Director Interview
50 SMFG Directors
52 Risk Management
56 Compliance
58 Internal Audit System
59 Customer Satisfaction (CS) and
Quality Improvement
60 Human Resources
62 Corporate Social Responsibility
(CSR)
66 Financial Review
70 Sponsorship / Websites
71 Appendix I
115 Appendix II
2 SMFG Overview
2 SMFG Group Outline
4 Financial and Non-Financial Highlights
6 SMFG’s Value Creation Process
8 Message from the Group CEO
18 Message from the Group CFO
22 Business Strategy
23 Business Unit Outline
24 Retail Business Unit
28 Wholesale Business Unit
32 International Business Unit
36 Global Markets Business Unit
40 Special Feature: Digitalization
42 Support for Mid-Sized Corporations
and SMEs, Vitalization of
Local Regions in Japan
Contents
12017 Annual Report
SMFG Group Outline
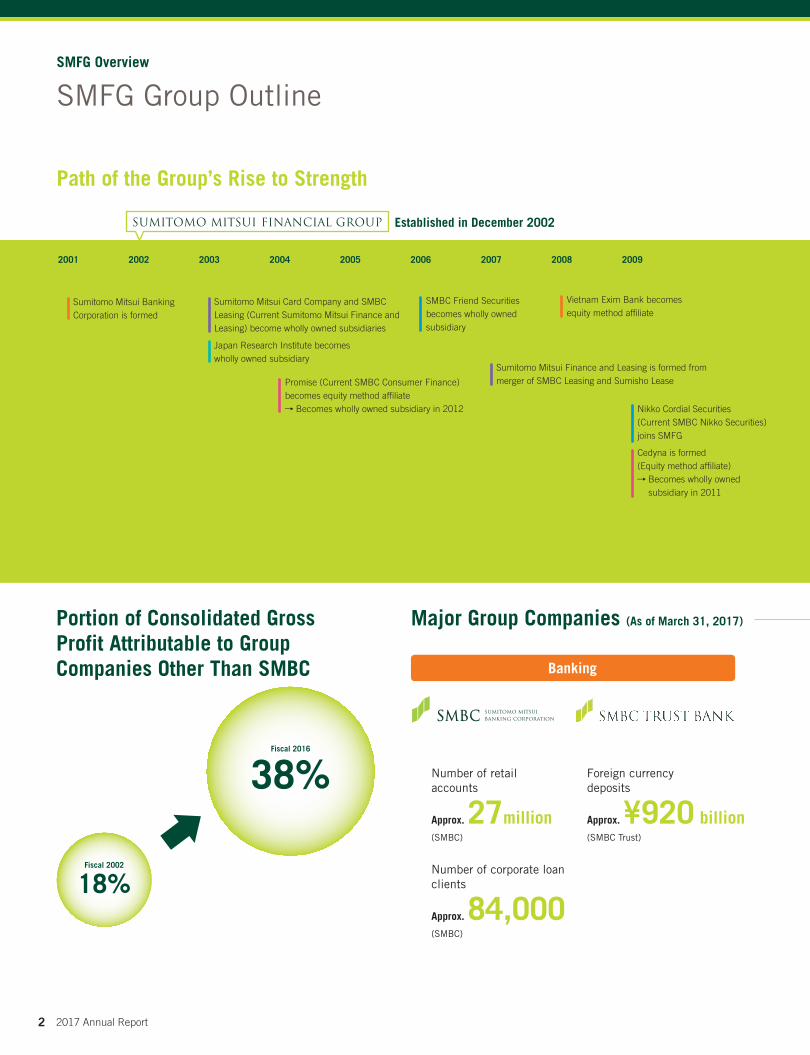
Path of the Group’s Rise to Strength
Established in December 2002
Major Group Companies (As of March 31, 2017)Portion of Consolidated Gross Profit Attributable to Group Companies Other Than SMBC
Number of retail accounts
Approx. 27million(SMBC)
Foreign currency deposits
Approx. ¥920 billion(SMBC Trust)
Number of corporate loan clients
Approx. 84,000(SMBC)
Vietnam Exim Bank becomes equity method affiliate
Sumitomo Mitsui Finance and Leasing is formed from merger of SMBC Leasing and Sumisho Lease
SMBC Friend Securities becomes wholly owned subsidiary
Nikko Cordial Securities (Current SMBC Nikko Securities) joins SMFG
Cedyna is formed (Equity method affiliate)
Becomes wholly owned subsidiary in 2011
Promise (Current SMBC Consumer Finance) becomes equity method affiliate
Becomes wholly owned subsidiary in 2012
Sumitomo Mitsui Card Company and SMBC Leasing (Current Sumitomo Mitsui Finance and Leasing) become wholly owned subsidiaries
Japan Research Institute becomes wholly owned subsidiary
Sumitomo Mitsui Banking Corporation is formed
SMFG Overview
Banking
2001 20032002 2004 2005 2006 2007 20092008
Fiscal 2002
18%
Fiscal 2016
38%
2 2017 Annual Report

Major Group Companies (As of March 31, 2017)
Credit Cards and Consumer Finance
Operating assets
Approx. ¥3.1trillionNumber of cardholders
Approx. 42million(Total for 2 companies)
Number of brokerage accounts
Approx. 3million(Total for 2 companies)
Number of consumer finance customers
Approx. 2.1million(Consolidated, includes overseas customers)
Royal Bank of Scotland’s aircraft leasing business is acquired and integrated into SMFG (Current SMBC Aviation Capital)
American Railcar Leasing, of the United States, joins SMFG
Bank Tabungan Pensiunan Nasional (BTPN), of Indonesia, becomes equity method affiliate
Citibank Japan’s retail banking operations are integrated into SMBC Trust Bank (Current SMBC Trust Bank PRESTIA)
ACLEDA Bank, of Cambodia, becomes equity method affiliate
The Bank of East Asia, of Hong Kong, becomes equity method affiliate
GE Group’s leasing operations in Japan are integrated into SMFG (Current SMFL Capital)
PT Oto Multiartha and PT Summit Oto Finance, of Indonesia, become equity method affiliates
Mitsui Sumitomo Asset Management becomes wholly owned subsidiary
(Scheduled to merge in 2018) Other Business
Securities
Leasing
2010 2011 2012 2013 2014 2015 2016 2017
Flagship Rail Services, of the United States, joins SMFG (Current SMBC Rail Services)
Societe Generale Private Banking Japan joins SMFG Group (Current SMBC Trust Bank)
32017 Annual Report
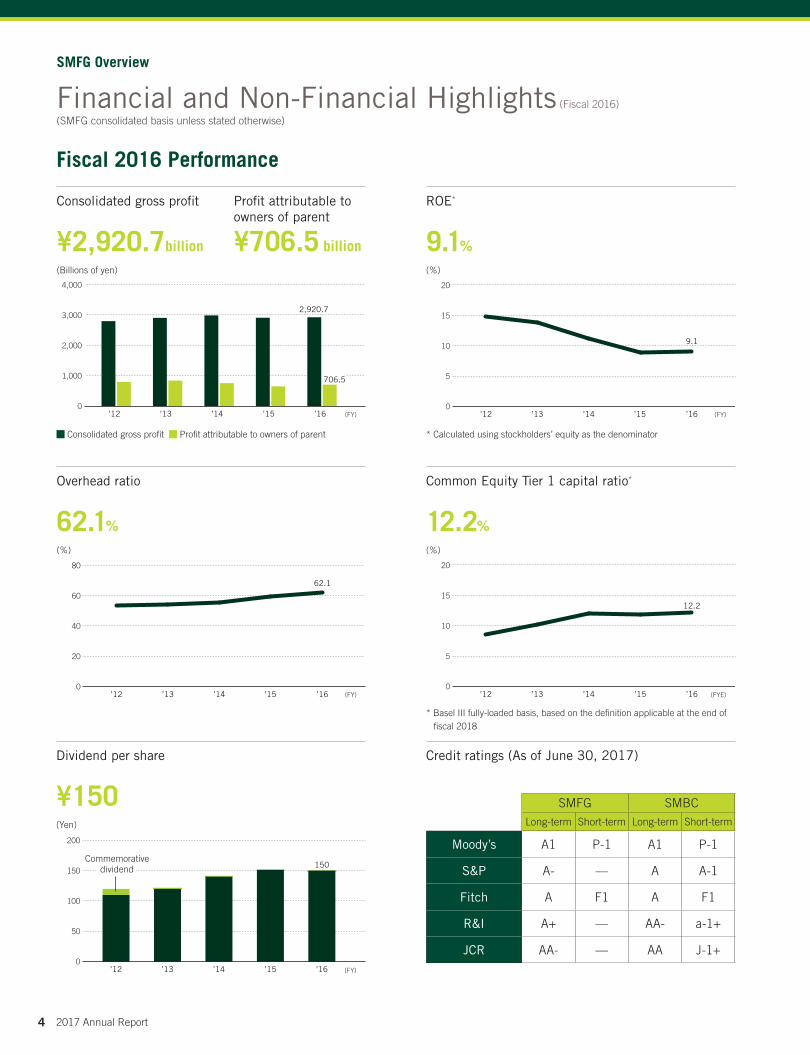
Financial and Non-Financial Highlights (Fiscal 2016)
(SMFG consolidated basis unless stated otherwise)
Fiscal 2016 Performance
* Calculated using stockholders’ equity as the denominator
20
15
10
5
0’13’12 ’14 ’15 ’16 (FY)
9.1
ROE*
9.1%
(%)
Common Equity Tier 1 capital ratio*
12.2%
(%)
20
15
10
5
0’12 ’13 ’14 ’16’15 (FYE)
12.2
* Basel III fully-loaded basis, based on the definition applicable at the end of fiscal 2018
Overhead ratio
62.1%
(%)
80
60
40
20
0’13’12 ’14 ’15 ’16 (FY)
62.1
4,000
3,000
2,000
1,000
0’12 ’13 ’14 ’15 ’16
2,920.7
706.5
(FY)
Consolidated gross profit Profit attributable to owners of parent
Consolidated gross profit
¥2,920.7billion
(Billions of yen)
Profit attributable to owners of parent
¥706.5 billion
Credit ratings (As of June 30, 2017)
SMFG SMBCLong-term Short-term Long-term Short-term
Moody’s A1 P-1 A1 P-1
S&P A- — A A-1
Fitch A F1 A F1
R&I A+ — AA- a-1+
JCR AA- — AA J-1+
SMFG Overview
Dividend per share
¥150(Yen)
200
150
100
50
0’12 ’13 ’14 ’15 ’16 (FY)
150Commemorative
dividend
4 2017 Annual Report
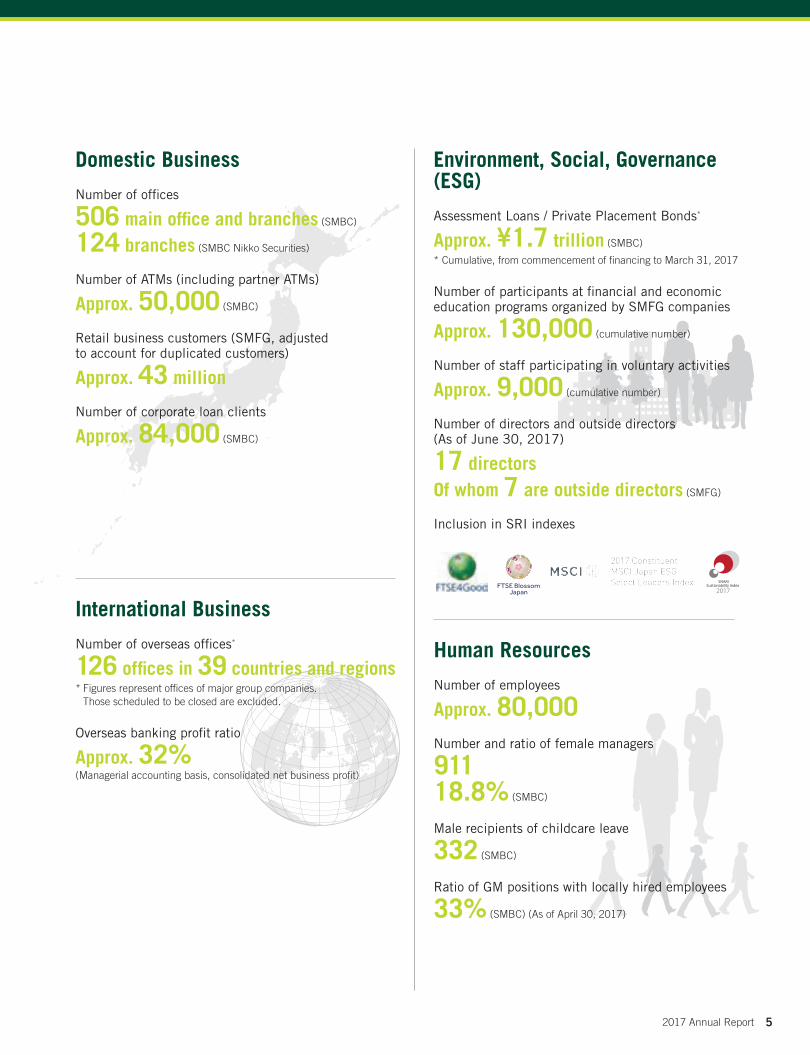
Environment, Social, Governance (ESG)
Assessment Loans / Private Placement Bonds*
Approx. ¥1.7 trillion (SMBC)
* Cumulative, from commencement of financing to March 31, 2017
Number of participants at financial and economic education programs organized by SMFG companies
Approx. 130,000 (cumulative number)
Number of staff participating in voluntary activities
Approx. 9,000 (cumulative number)
Number of directors and outside directors (As of June 30, 2017)
17 directorsOf whom 7 are outside directors (SMFG)
Inclusion in SRI indexes
SNAM Sustainability Index
2017
Human Resources
Number of employees
Approx. 80,000Number and ratio of female managers
91118.8% (SMBC)
Male recipients of childcare leave
332 (SMBC)
Ratio of GM positions with locally hired employees
33% (SMBC) (As of April 30, 2017)
International Business
Number of overseas offices*
126 offices in 39 countries and regions* Figures represent offices of major group companies.
Those scheduled to be closed are excluded.
Overseas banking profit ratio
Approx. 32% (Managerial accounting basis, consolidated net business profit)
Domestic Business
Number of offices
506 main office and branches (SMBC)
124 branches (SMBC Nikko Securities)
Number of ATMs (including partner ATMs)
Approx. 50,000 (SMBC)
Retail business customers (SMFG, adjusted to account for duplicated customers)
Approx. 43 million
Number of corporate loan clients
Approx. 84,000 (SMBC)
52017 Annual Report
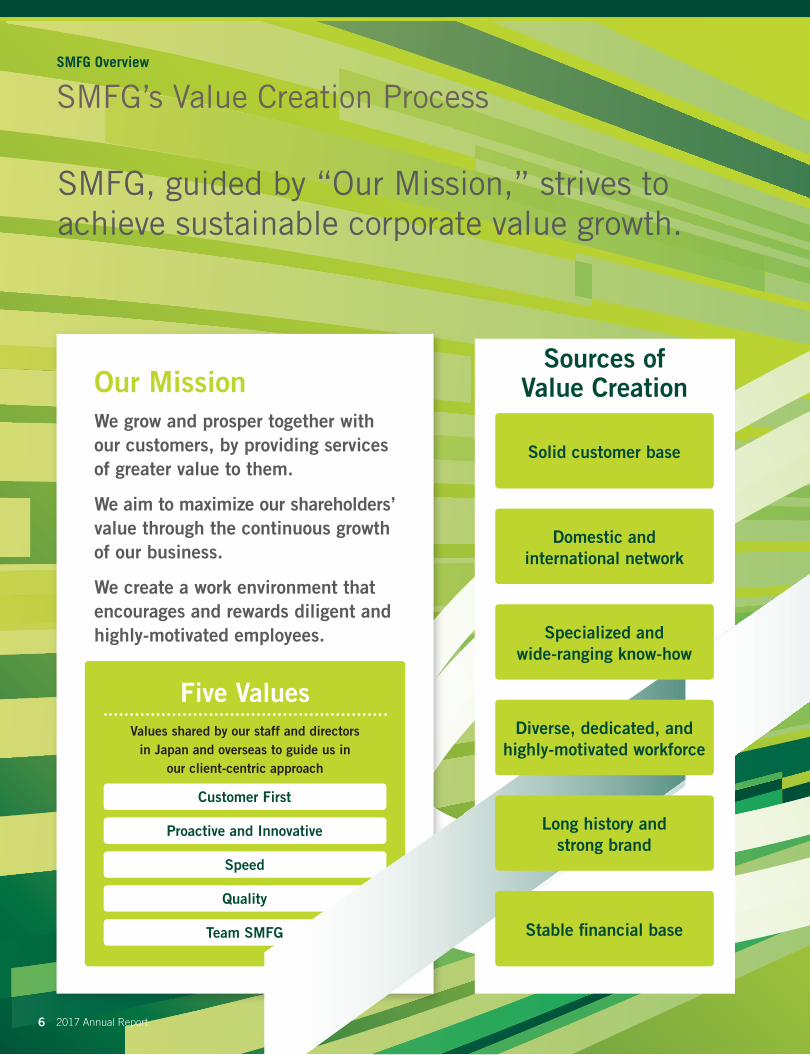
Our MissionWe grow and prosper together with our customers, by providing services of greater value to them.
We aim to maximize our shareholders’ value through the continuous growth of our business.
We create a work environment that encourages and rewards diligent and highly-motivated employees.
SMFG, guided by “Our Mission,” strives to achieve sustainable corporate value growth.
Five ValuesValues shared by our staff and directors
in Japan and overseas to guide us in our client-centric approach
Customer First
Proactive and Innovative
Speed
Quality
Team SMFG
Sources of Value Creation
Solid customer base
Domestic and international network
Specialized and wide-ranging know-how
Diverse, dedicated, and highly-motivated workforce
Long history and strong brand
Stable financial base
SMFG’s Value Creation ProcessSMFG Overview
2017 Annual Report6
SMFG, guided by “Our Mission,” strives to achieve sustainable corporate value growth.
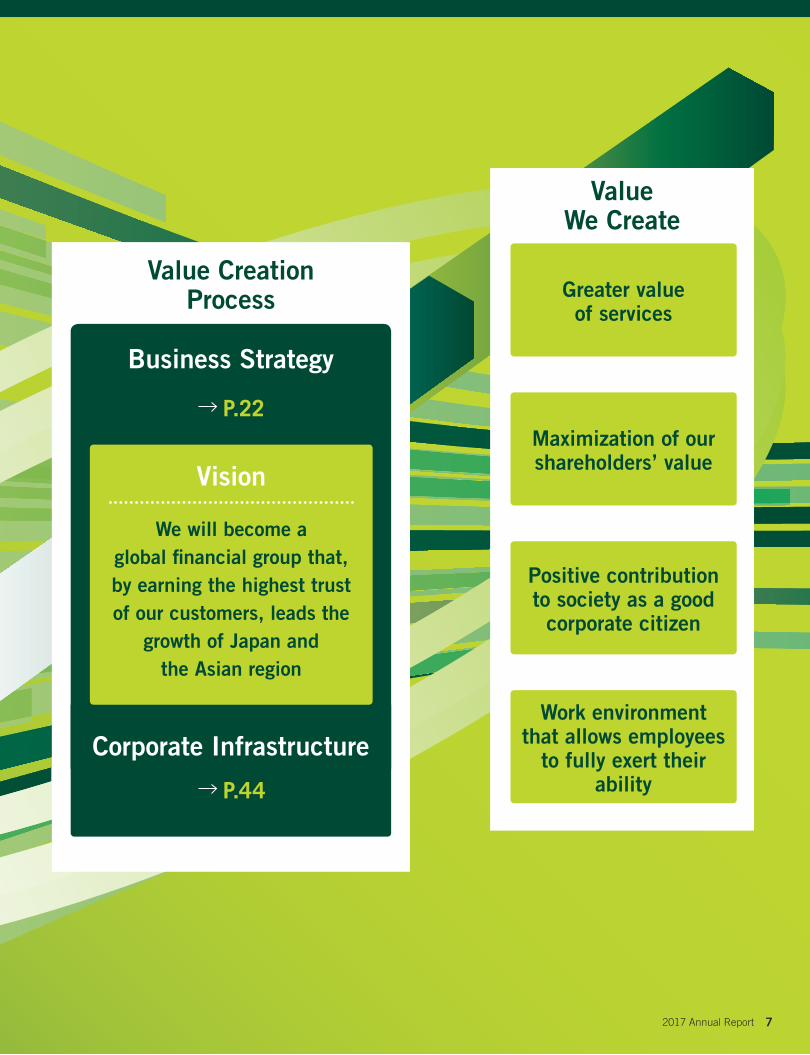
Value Creation Process
Vision
We will become a global financial group that, by earning the highest trust of our customers, leads the
growth of Japan and the Asian region
Business Strategy
Corporate Infrastructure
Value We Create
Greater value of services
Maximization of our shareholders’ value
Positive contribution to society as a good
corporate citizen
Work environment that allows employees
to fully exert their ability
SMFG’s Value Creation Process
P.22
P.44
72017 Annual Report
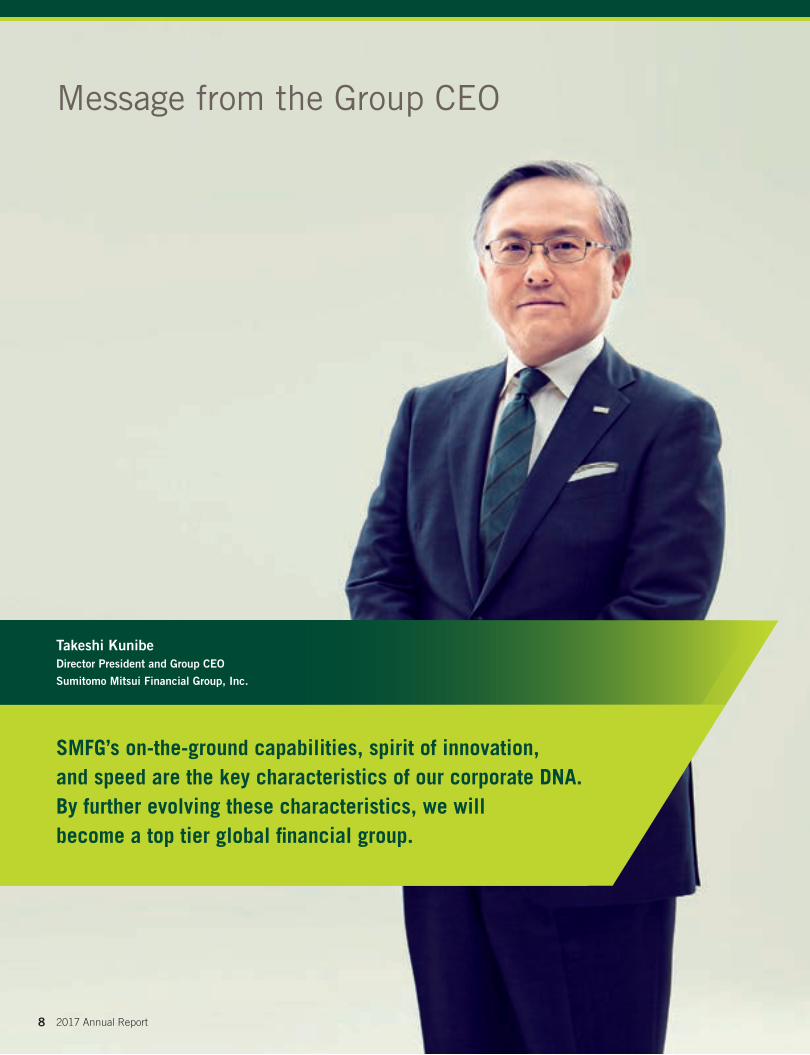
Message from the Group CEO
SMFG’s on-the-ground capabilities, spirit of innovation, and speed are the key characteristics of our corporate DNA. By further evolving these characteristics, we will become a top tier global financial group.
Takeshi KunibeDirector President and Group CEO
Sumitomo Mitsui Financial Group, Inc.
8 2017 Annual Report
We extend our sincerest appreciation to our stakeholders for the continued support and patronage. In April 2017, SMFG launched “SMFG Next Stage,” its new three-year Medium-Term Management Plan under a new group-wide operational structure. As Group CEO, I would like to take this opportunity to share with you my thoughts and expectations in regards to the plan.
IntroductionThe challenging business environment for financial institutions is expected to continue with the Bank of
Japan’s negative interest rate policy and the implementation of tighter international financial regulations.
From a political perspective, protectionism tendencies in some countries and geopolitical risks are also
likely to add to the climate of uncertainty.
When we turn our eyes to Japan, we expect to see retail customers shifting from cash savings to asset
building and adopting digital/cashless solutions, and corporate customers accelerating their overseas
expansion. Globally, we anticipate the comprehensive reorganization of industries along with a rise in
infrastructure investment in Asia.
It was against this backdrop that we launched “SMFG Next Stage,” our new Medium-Term Management
Plan, in April 2017. It was also at this time that we undertook a comprehensive overhaul of SMFG’s corporate
governance system coupled with structural reforms. SMFG was transformed into a Company with Three
Committees, and introduced Group-wide business units and the CxO system. With these changes, we
entered into the next stage of realizing our mid- to long-term vision: “We will become a global financial group
that, by earning the highest trust of our customers, leads the growth of Japan and the Asian region.”
I have had the privilege of being appointed Group CEO under this new structure, and I view my new
responsibilities with both great dedication and pride. I stand firmly committed to meeting the expectations
of our stakeholders by uniting the collective strengths of the Group, and forging ahead with structural reforms
so that we may realize sustainable growth and further increase corporate value.
Review of the Previous Medium-Term Management Plan (Fiscal 2014–2016)Before discussing “SMFG Next Stage,” I would like to go over the previous three-year Medium-Term
Management Plan, which represented the first stage of our efforts to realize our mid- to long-term vision.
Under the previous Medium-Term Management Plan, we sought to develop and evolve client-centric busi-
ness models for our main domestic and international businesses, and build a platform for realizing Asia-centric
operations and capture growth opportunities. We were able to achieve solid success in these efforts. We also
steadily accumulated profits, and were thus able to meet our target Common Equity Tier 1 capital ratio.
On the other hand, in terms of profit, the business environment proved to be more difficult than anticipated
three years ago, due to factors such as the Bank of Japan’s negative interest rate policy and the slowdown of
the Asian economy. As a result, growth in top-line profit proved to be sluggish. In response to changes in
the business environment, we revised our strategy to focus on bottom-line profit partway through fiscal 2015,
a move that entailed implementing stronger controls on expenses/costs. However, we were still unable to
achieve our targets for (a) growth rate of consolidated gross profit and (b) consolidated overhead ratio,
due in part to upfront investments in business model reform.
92017 Annual Report
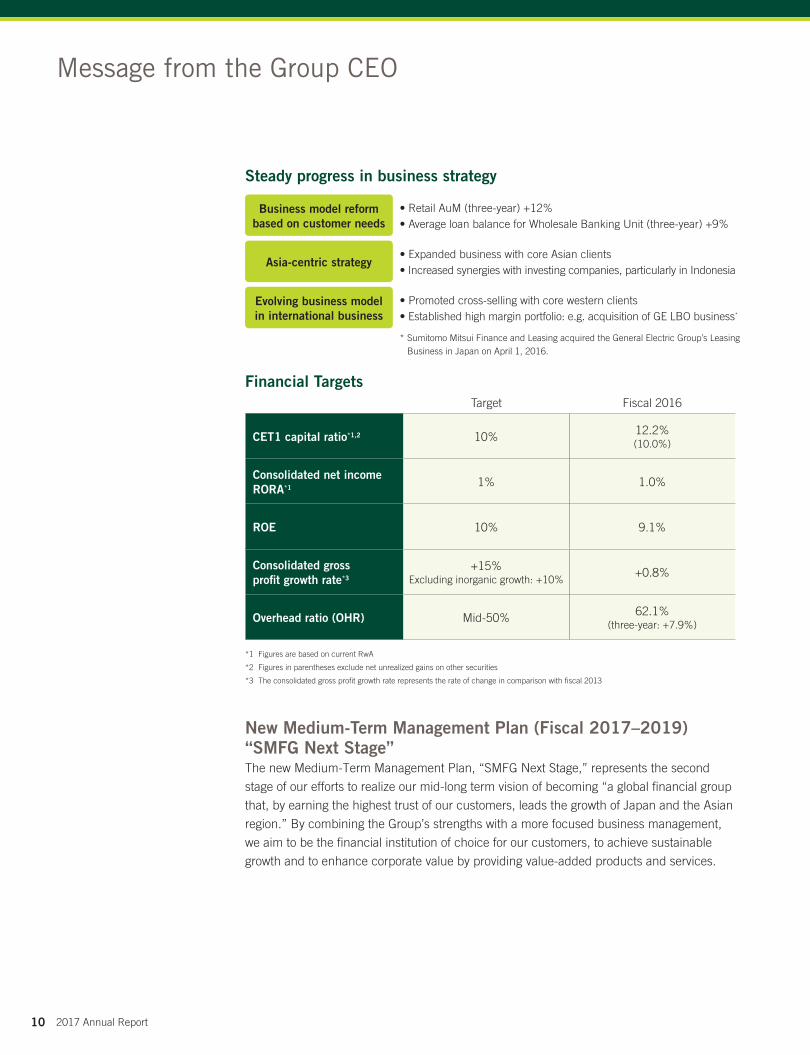
New Medium-Term Management Plan (Fiscal 2017–2019) “SMFG Next Stage”The new Medium-Term Management Plan, “SMFG Next Stage,” represents the second
stage of our efforts to realize our mid-long term vision of becoming “a global financial group
that, by earning the highest trust of our customers, leads the growth of Japan and the Asian
region.” By combining the Group’s strengths with a more focused business management,
we aim to be the financial institution of choice for our customers, to achieve sustainable
growth and to enhance corporate value by providing value-added products and services.
Steady progress in business strategy
Financial TargetsTarget Fiscal 2016
CET1 capital ratio*1,2 10% 12.2%(10.0%)
Consolidated net income RORA*1 1% 1.0%
ROE 10% 9.1%
Consolidated gross profit growth rate*3
+15%Excluding inorganic growth: +10%
+0.8%
Overhead ratio (OHR) Mid-50% 62.1%(three-year: +7.9%)
*1 Figures are based on current RwA
*2 Figures in parentheses exclude net unrealized gains on other securities
*3 The consolidated gross profit growth rate represents the rate of change in comparison with fiscal 2013
• Retail AuM (three-year) +12%• Average loan balance for Wholesale Banking Unit (three-year) +9%
• Expanded business with core Asian clients• Increased synergies with investing companies, particularly in Indonesia
• Promoted cross-selling with core western clients• Established high margin portfolio: e.g. acquisition of GE LBO business*
* Sumitomo Mitsui Finance and Leasing acquired the General Electric Group’s Leasing Business in Japan on April 1, 2016.
Business model reform based on customer needs
Asia-centric strategy
Evolving business model in international business
Message from the Group CEO
10 2017 Annual Report
For more about financial targets,please see page 18 and thereafter.
P.18
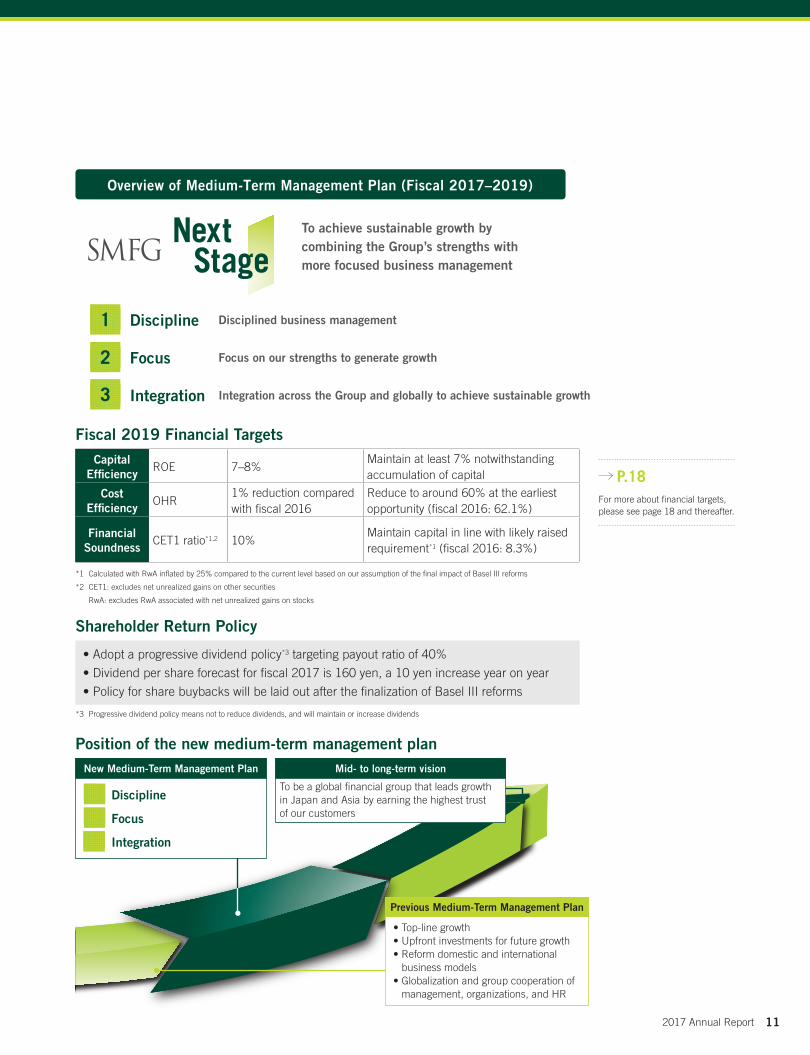
To be a global financial group that leads growth in Japan and Asia by earning the highest trust of our customers
Mid- to long-term vision
• Top-line growth• Upfront investments for future growth• Reform domestic and international
business models• Globalization and group cooperation of
management, organizations, and HR
Previous Medium-Term Management Plan
To achieve sustainable growth by combining the Group’s strengths with more focused business management
Overview of Medium-Term Management Plan (Fiscal 2017–2019)
Discipline Disciplined business management
Focus Focus on our strengths to generate growth
Integration Integration across the Group and globally to achieve sustainable growth
Discipline
Focus
Integration3
2
1
New Medium-Term Management Plan
2
3
1
*1 Calculated with RwA inflated by 25% compared to the current level based on our assumption of the final impact of Basel III reforms
*2 CET1: excludes net unrealized gains on other securities
RwA: excludes RwA associated with net unrealized gains on stocks
*3 Progressive dividend policy means not to reduce dividends, and will maintain or increase dividends
Capital Efficiency
ROE 7–8%Maintain at least 7% notwithstanding accumulation of capital
Cost Efficiency
OHR1% reduction compared with fiscal 2016
Reduce to around 60% at the earliest opportunity (fiscal 2016: 62.1%)
Financial Soundness
CET1 ratio*1,2 10%Maintain capital in line with likely raised requirement*1 (fiscal 2016: 8.3%)
• Adopt a progressive dividend policy*3 targeting payout ratio of 40%
• Dividend per share forecast for fiscal 2017 is 160 yen, a 10 yen increase year on year
• Policy for share buybacks will be laid out after the finalization of Basel III reforms
Fiscal 2019 Financial Targets
Position of the new medium-term management plan
Shareholder Return Policy
112017 Annual Report
Based on the aforementioned uncertainties in the business environment, and the emer-
gence of new global and domestic trends, “SMFG Next Stage” puts forth three core
policies: Discipline, Focus, and Integration. The plan also calls for us to promote digitaliza-
tion in all areas. I will now explain each of these core policies in depth.
Disciplined Business ManagementTransformation of Business/Asset Portfolios and the Quality of our Earnings BaseIn order to realize sustainable growth in bottom-line profit and improve return on equity,
we will bolster profitability by placing even greater emphasis on capital, asset, and cost
efficiencies. At the same time, we will promote healthy risk taking and sound credit cost
control. We will maximize returns through the optimized allocation of limited management
resources by adopting a disciplined approach to management, investments, expenses/
costs, and business operations.
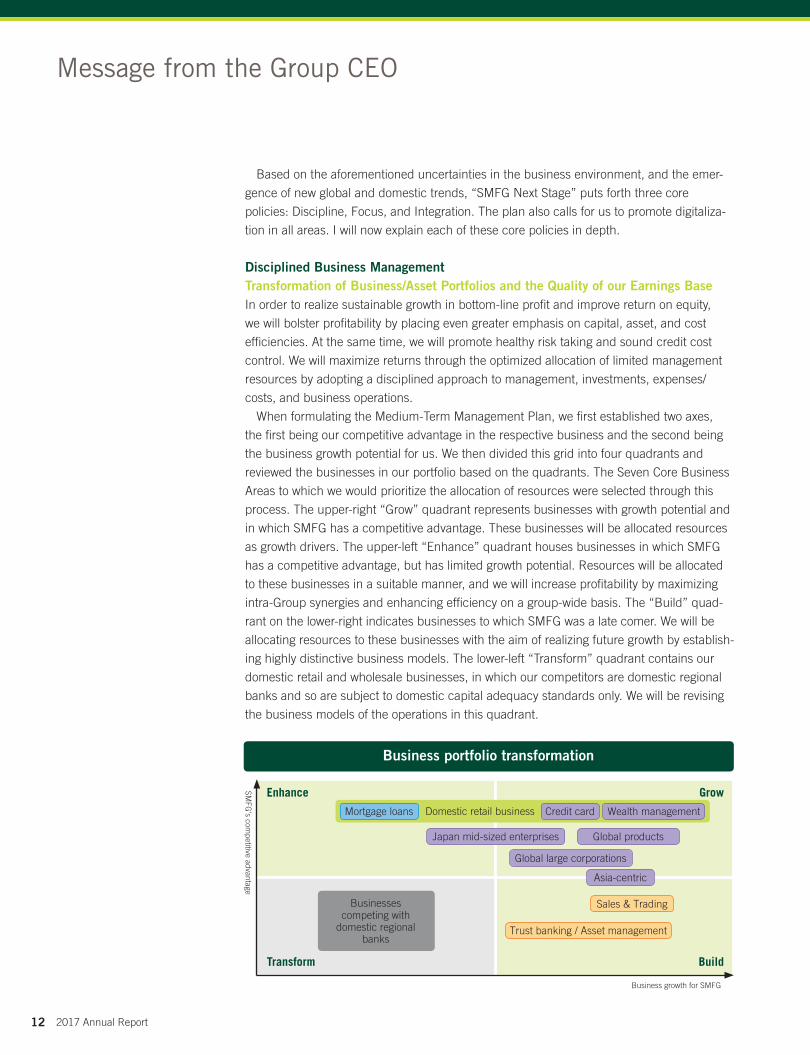
When formulating the Medium-Term Management Plan, we first established two axes,
the first being our competitive advantage in the respective business and the second being
the business growth potential for us. We then divided this grid into four quadrants and
reviewed the businesses in our portfolio based on the quadrants. The Seven Core Business
Areas to which we would prioritize the allocation of resources were selected through this
process. The upper-right “Grow” quadrant represents businesses with growth potential and
in which SMFG has a competitive advantage. These businesses will be allocated resources
as growth drivers. The upper-left “Enhance” quadrant houses businesses in which SMFG
has a competitive advantage, but has limited growth potential. Resources will be allocated
to these businesses in a suitable manner, and we will increase profitability by maximizing
intra-Group synergies and enhancing efficiency on a group-wide basis. The “Build” quad-
rant on the lower-right indicates businesses to which SMFG was a late comer. We will be
allocating resources to these businesses with the aim of realizing future growth by establish-
ing highly distinctive business models. The lower-left “Transform” quadrant contains our
domestic retail and wholesale businesses, in which our competitors are domestic regional
banks and so are subject to domestic capital adequacy standards only. We will be revising
the business models of the operations in this quadrant.
Message from the Group CEO
Enhance
Transform
Grow
Build
Business growth for SMFG
SMFG
’s competitive advantage
Global products
Sales & Trading
Trust banking / Asset management
Credit card
Global large corporations
Wealth management
Asia-centric
Japan mid-sized enterprises
Businesses competing with
domestic regional banks
Mortgage loans
Business portfolio transformation
Domestic retail business
12 2017 Annual Report
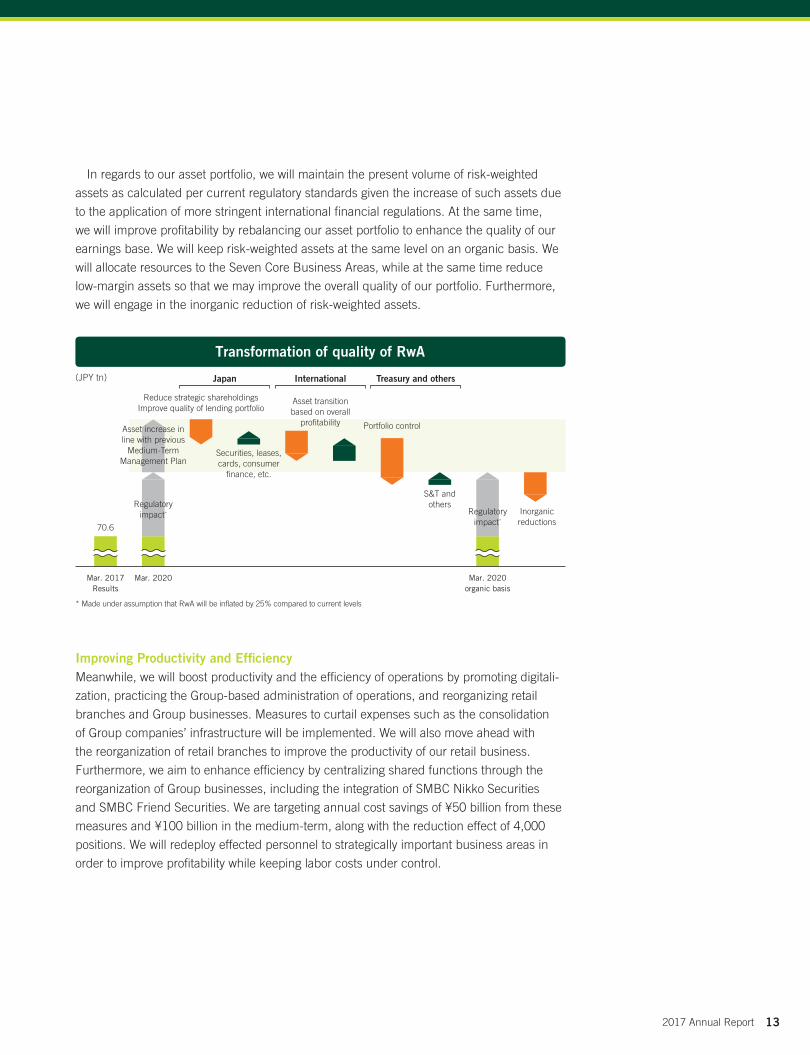
In regards to our asset portfolio, we will maintain the present volume of risk-weighted
assets as calculated per current regulatory standards given the increase of such assets due
to the application of more stringent international financial regulations. At the same time,
we will improve profitability by rebalancing our asset portfolio to enhance the quality of our
earnings base. We will keep risk-weighted assets at the same level on an organic basis. We
will allocate resources to the Seven Core Business Areas, while at the same time reduce
low-margin assets so that we may improve the overall quality of our portfolio. Furthermore,
we will engage in the inorganic reduction of risk-weighted assets.
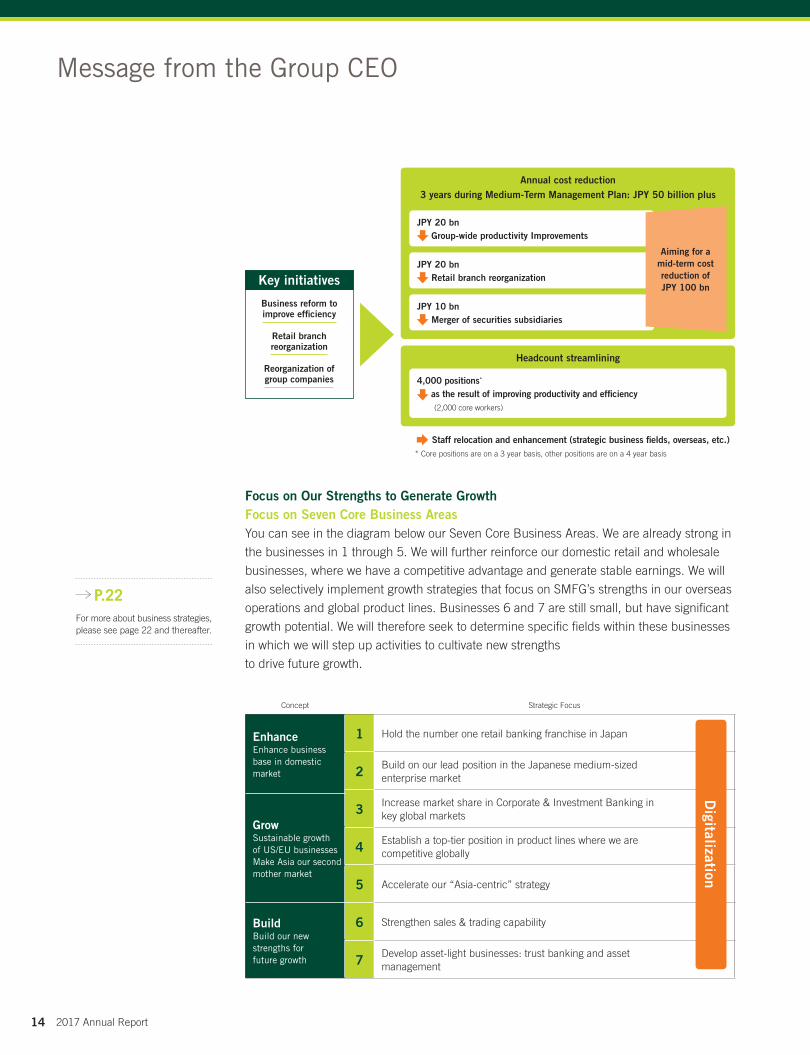
Improving Productivity and EfficiencyMeanwhile, we will boost productivity and the efficiency of operations by promoting digitali-
zation, practicing the Group-based administration of operations, and reorganizing retail
branches and Group businesses. Measures to curtail expenses such as the consolidation
of Group companies’ infrastructure will be implemented. We will also move ahead with
the reorganization of retail branches to improve the productivity of our retail business.
Furthermore, we aim to enhance efficiency by centralizing shared functions through the
reorganization of Group businesses, including the integration of SMBC Nikko Securities
and SMBC Friend Securities. We are targeting annual cost savings of ¥50 billion from these
measures and ¥100 billion in the medium-term, along with the reduction effect of 4,000
positions. We will redeploy effected personnel to strategically important business areas in
order to improve profitability while keeping labor costs under control.
(JPY tn)
Mar. 2017 Results
70.6
Mar. 2020 Mar. 2020 organic basis
Regulatory impact* Regulatory
impact*
Asset increase in line with previous
Medium-Term Management Plan
Securities, leases, cards, consumer
finance, etc.
S&T and others
Inorganic reductions
Portfolio control
Asset transition based on overall
profitability
Reduce strategic shareholdingsImprove quality of lending portfolio
Japan International Treasury and others
Transformation of quality of RwA
* Made under assumption that RwA will be inflated by 25% compared to current levels
132017 Annual Report
For more about business strategies,please see page 22 and thereafter.
P.22
Focus on Our Strengths to Generate GrowthFocus on Seven Core Business AreasYou can see in the diagram below our Seven Core Business Areas. We are already strong in
the businesses in 1 through 5. We will further reinforce our domestic retail and wholesale
businesses, where we have a competitive advantage and generate stable earnings. We will
also selectively implement growth strategies that focus on SMFG’s strengths in our overseas
operations and global product lines. Businesses 6 and 7 are still small, but have significant
growth potential. We will therefore seek to determine specific fields within these businesses
in which we will step up activities to cultivate new strengths
to drive future growth.
Concept Strategic Focus
EnhanceEnhance business base in domestic market
1 Hold the number one retail banking franchise in Japan
2 Build on our lead position in the Japanese medium-sized enterprise market
3 Increase market share in Corporate & Investment Banking in key global markets
GrowSustainable growth of US/EU businessesMake Asia our second mother market
4 Establish a top-tier position in product lines where we are competitive globally
5 Accelerate our “Asia-centric” strategy
BuildBuild our new strengths for future growth
6 Strengthen sales & trading capability
7 Develop asset-light businesses: trust banking and asset management
Digitalization
Message from the Group CEO
Annual cost reduction3 years during Medium-Term Management Plan: JPY 50 billion plus
Headcount streamlining
Staff relocation and enhancement (strategic business fields, overseas, etc.)* Core positions are on a 3 year basis, other positions are on a 4 year basis
Business reform to improve efficiency
Retail branch reorganization
Reorganization of group companies
Key initiatives
4,000 positions*
as the result of improving productivity and efficiency (2,000 core workers)
JPY 20 bn Group-wide productivity Improvements
JPY 20 bn Retail branch reorganization
JPY 10 bn Merger of securities subsidiaries
Aiming for a mid-term cost reduction of JPY 100 bn
14 2017 Annual Report
For more about corporate governance, please see page 46.
P.46
For more about risk appetite management, please see page 52.
P.52
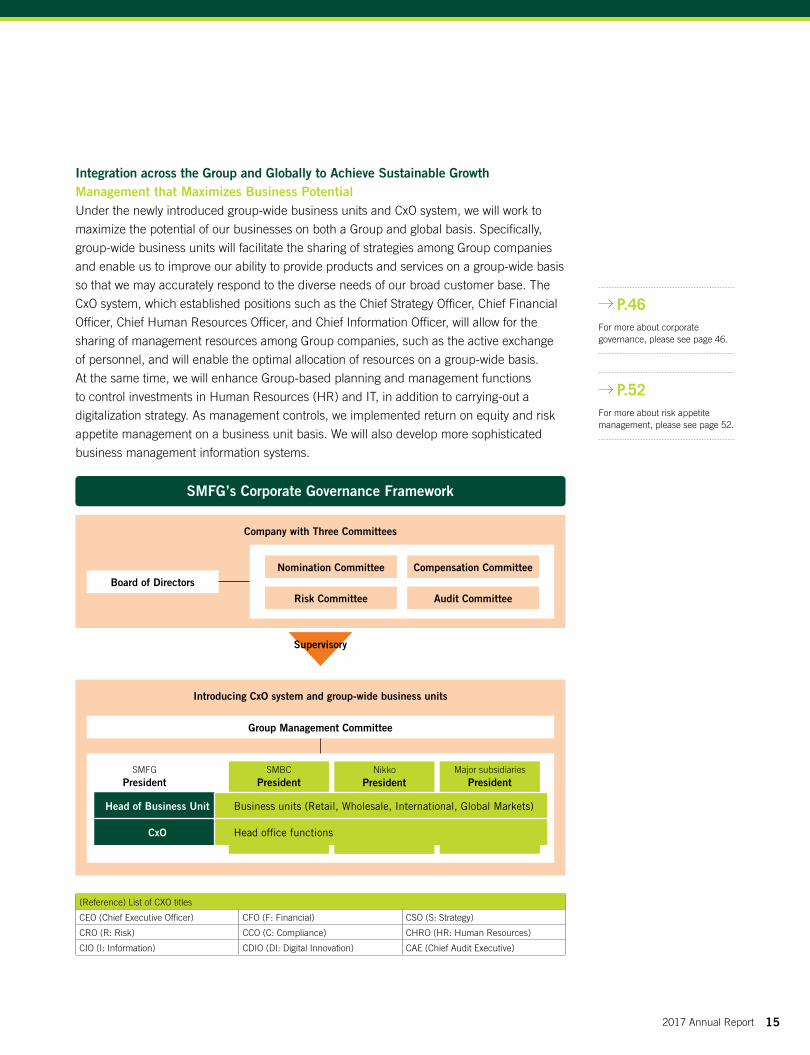
Integration across the Group and Globally to Achieve Sustainable GrowthManagement that Maximizes Business PotentialUnder the newly introduced group-wide business units and CxO system, we will work to
maximize the potential of our businesses on both a Group and global basis. Specifically,
group-wide business units will facilitate the sharing of strategies among Group companies
and enable us to improve our ability to provide products and services on a group-wide basis
so that we may accurately respond to the diverse needs of our broad customer base. The
CxO system, which established positions such as the Chief Strategy Officer, Chief Financial
Officer, Chief Human Resources Officer, and Chief Information Officer, will allow for the
sharing of management resources among Group companies, such as the active exchange
of personnel, and will enable the optimal allocation of resources on a group-wide basis.
At the same time, we will enhance Group-based planning and management functions
to control investments in Human Resources (HR) and IT, in addition to carrying-out a
digitalization strategy. As management controls, we implemented return on equity and risk
appetite management on a business unit basis. We will also develop more sophisticated
business management information systems.
Company with Three Committees
Board of Directors
Supervisory
Introducing CxO system and group-wide business units
Group Management Committee
SMBCPresident
SMFGPresident
NikkoPresident
Major subsidiariesPresident
Head of Business Unit Business units (Retail, Wholesale, International, Global Markets)
CxO Head office functions
SMFG’s Corporate Governance Framework
Nomination Committee
Risk Committee
Compensation Committee
Audit Committee
(Reference) List of CXO titles
CEO (Chief Executive Officer) CFO (F: Financial) CSO (S: Strategy)
CRO (R: Risk) CCO (C: Compliance) CHRO (HR: Human Resources)
CIO (I: Information) CDIO (DI: Digital Innovation) CAE (Chief Audit Executive)
152017 Annual Report

For more about digitalization,please see page 40.
P.40
DigitalizationThe digitalization of society is advancing at a rapid pace. Amid this trend, SMFG is actively
adopting new technologies and promoting digitalization in various areas of its business so
that we may enhance the customer experience, generate new businesses, improve produc-
tivity and efficiency, and upgrade management infrastructure.
Examples of our efforts on this front include the provision of cutting-edge services for
retail and corporate customers that utilize digital technologies to enhance the customer
experience, such as the introduction of paperless transactions. Furthermore, we will gener-
ate new businesses, for example by offering biometric authentication platforms as a
“Platformer.” We will also introduce public cloud services and advance work style reform in
order to boost productivity and efficiency. In addition, we will introduce state-of-the-art IT
infrastructure so that we may accurately track business management data, based on which
we will work to enhance management practices.
Environment, Social, and Governance (ESG)In June 2017, SMFG transitioned from a Company with a Board of Corporate Auditors to
a Company with Three Committees. The purpose of this move was to establish a corporate
governance system that is aligned with the standards required of a Global Systemically
Important Financial Institution and to strengthen the supervisory function of the Board
of Directors.
In addition, we revised the executive compensation systems of SMFG and Sumitomo
Mitsui Banking Corporation to ensure that management is well aligned with the shareholder
perspective. As part of this change, we introduced a stock-based compensation system that
utilizes restricted stock. This new system will strengthen linkage of executive compensation
with short-term and mid- to long-term performance, and thereby provide proper incentives to
pursue heightened performance while encouraging executives to hold stock in the Company.
Message from the Group CEO
Digitalization
Enhancing the customer experience
Improving productivity and efficiency
Generating new businesses
Upgrading management infrastructure
Cashless payments
Smartphone applications
Platform
B2B
RPA(Robotic Process Automation)
Workstyle reform (public cloud)
MIS(Management
Information System)
Cyber security
Smartphones SNS Biometric authentication
AI API IoT Big data Blockchain
16 2017 Annual Report
For more about CSR,please see page 62.
P.62
For more about human resources,please see page 60.
P.60
Furthermore, SMFG has identified the “Environment,” Next Generation,” and “Community”
as priority issues to be addressed over the mid- to long-term from a Corporate Social Respon-
sibility (CSR) perspective. Through ongoing initiatives revolving around these issues, we are
contributing to the development of society. The promotion of diversity and inclusion is also
a priority for management. We have been actively introducing initiatives to promote female
participation in the workplace and stepped up hiring of local employees outside of Japan
in line with the globalization of our business. Through such efforts we seek to develop an
organization that provides ample opportunities for a diverse work force.
In ClosingThe considerable changes we are seeing on a global scale are giving rise to an unparalleled
paradigm shift. The new Medium-Term Management Plan, “SMFG Next Stage”, was forged
in the midst of this upheaval. The timing of the plan’s establishment and our decision to
tackle new challenges are symbolic of our commitment to responding to changing customer
needs, by further uniting the strengths of the Group. It also represents our recognition of the
fact that structural reforms are necessary to address the implementation of more stringent
international financial regulations and transition to an earnings base with higher capital effi-
ciency. I am confident that, when each individual member of the Group comes together and
combines their respective strengths, we will be able to overcome any obstacle we may face.
We will, of course, continue to proactively adjust our internal systems and strategies in
response to external changes. At the same time, however, we will always remain true to the
transcendental values of the Company. Never losing sight of our core value - Customer
First, we will exercise the on-the-ground capabilities, spirit of innovation, and speed that
characterize SMFG’s corporate DNA while further evolving these key characteristics to
become the financial institution of our customers’ choice. This approach will remain
unchanged. My mission as Group CEO is to lead SMFG so that we may exceed the goals
put forth in the new Medium-Term Management Plan and achieve sustainable growth in
corporate value. We will accomplish this by becoming a top tier global financial group that
pursues quality in every aspect of our business, is trusted by our customers and society,
and has an unrivaled footprint in Asia.
I would like to ask for the continued understanding and support of all our stakeholders.
August 2017
Takeshi KunibeDirector President and Group CEO
Sumitomo Mitsui Financial Group, Inc.
172017 Annual Report

Jun OhtaGroup CFO
Director Deputy President and Executive Officer
Review of Fiscal 2016In fiscal 2016, consolidated gross profit increased by ¥16.8 billion year-on-year, to ¥2,920.7 billion. Although we felt the
adverse effects of the Bank of Japan’s negative interest rate policy, we were able to offset this downward pressure on revenue
with higher profits from SMBC Nikko Securities Inc., which benefited from an upturn in the markets.
General and administrative expenses were up by ¥87.6 billion year-on-year, to ¥1,812.4 billion, and total credit cost rose by
¥61.6 billion, to ¥164.4 billion. However, the absence of an one-off cost recorded in the previous fiscal year resulted in ordinary
profit increasing by ¥20.6 billion, to ¥1,005.9 billion.
Profit attributable to owners of parent increased by ¥59.8 billion year-on-year, to ¥706.5 billion, due in part to the tax benefits
associated with the implementation of the consolidated corporate-tax system in fiscal 2017.
For a detailed review of our business results and financials, please refer to page 66.
Financial TargetsTaking into consideration the current business environment, SMFG is working to improve capital, asset, and cost efficiencies in order
to become a top tier financial group. We have thus established financial targets for return on equity (ROE), overhead ratio, and
Common Equity Tier 1 capital ratio (CET1 ratio), to guide us in our efforts to improve profitability and secure financial soundness.
Capital Efficiency ROE 7–8% Maintain at least 7% notwithstanding accumulation of capital
Cost Efficiency OHR 1% reduction compared with fiscal 2016 Reduce to around 60% at the earliest opportunity (fiscal 2016: 62.1%)
Financial Soundness CET1 ratio*1,2 10% Maintain capital in line with likely raised requirement*1 (fiscal 2016: 8.3%)
*1 Calculated with RwA inflated by 25% compared to the current level based on our assumption of the final impact of Basel III reforms
*2 CET1: excludes net unrealized gains on other securities
RwA: excludes RwA associated with net unrealized gains on stocks
Message from the Group CFO
18 2017 Annual Report
8
9
7
6’19’16
Bottom line
(FY)
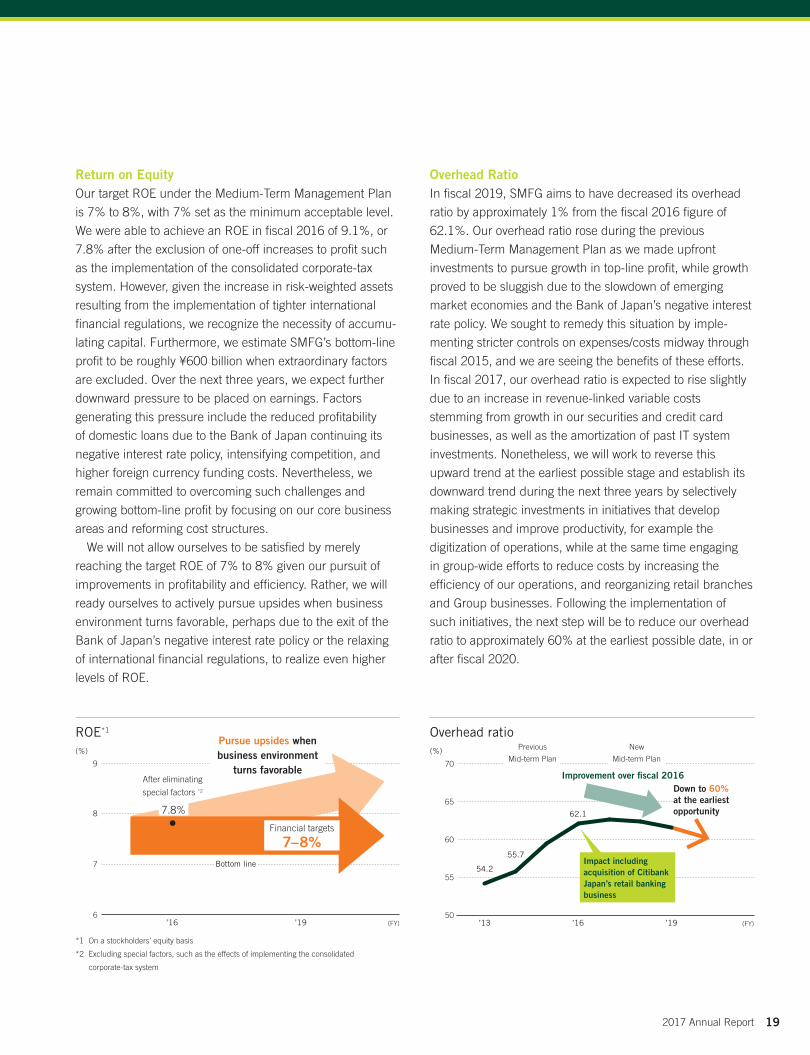
Return on EquityOur target ROE under the Medium-Term Management Plan
is 7% to 8%, with 7% set as the minimum acceptable level.
We were able to achieve an ROE in fiscal 2016 of 9.1%, or
7.8% after the exclusion of one-off increases to profit such
as the implementation of the consolidated corporate-tax
system. However, given the increase in risk-weighted assets
resulting from the implementation of tighter international
financial regulations, we recognize the necessity of accumu-
lating capital. Furthermore, we estimate SMFG’s bottom-line
profit to be roughly ¥600 billion when extraordinary factors
are excluded. Over the next three years, we expect further
downward pressure to be placed on earnings. Factors
generating this pressure include the reduced profitability
of domestic loans due to the Bank of Japan continuing its
negative interest rate policy, intensifying competition, and
higher foreign currency funding costs. Nevertheless, we
remain committed to overcoming such challenges and
growing bottom-line profit by focusing on our core business
areas and reforming cost structures.
We will not allow ourselves to be satisfied by merely
reaching the target ROE of 7% to 8% given our pursuit of
improvements in profitability and efficiency. Rather, we will
ready ourselves to actively pursue upsides when business
environment turns favorable, perhaps due to the exit of the
Bank of Japan’s negative interest rate policy or the relaxing
of international financial regulations, to realize even higher
levels of ROE.
Overhead RatioIn fiscal 2019, SMFG aims to have decreased its overhead
ratio by approximately 1% from the fiscal 2016 figure of
62.1%. Our overhead ratio rose during the previous
Medium-Term Management Plan as we made upfront
investments to pursue growth in top-line profit, while growth
proved to be sluggish due to the slowdown of emerging
market economies and the Bank of Japan’s negative interest
rate policy. We sought to remedy this situation by imple-
menting stricter controls on expenses/costs midway through
fiscal 2015, and we are seeing the benefits of these efforts.
In fiscal 2017, our overhead ratio is expected to rise slightly
due to an increase in revenue-linked variable costs
stemming from growth in our securities and credit card
businesses, as well as the amortization of past IT system
investments. Nonetheless, we will work to reverse this
upward trend at the earliest possible stage and establish its
downward trend during the next three years by selectively
making strategic investments in initiatives that develop
businesses and improve productivity, for example the
digitization of operations, while at the same time engaging
in group-wide efforts to reduce costs by increasing the
efficiency of our operations, and reorganizing retail branches
and Group businesses. Following the implementation of
such initiatives, the next step will be to reduce our overhead
ratio to approximately 60% at the earliest possible date, in or
after fiscal 2020.
70
50
60
65
55
’19’16’13
62.1
55.7
54.2
(FY)
Overhead ratio (%)
*1 On a stockholders’ equity basis
*2 Excluding special factors, such as the effects of implementing the consolidated
corporate-tax system
After eliminating
special factors *2
7.8%
Financial targets
7–8%
Down to 60% at the earliest opportunity
Impact including acquisition of Citibank Japan’s retail banking business
Improvement over fiscal 2016
ROE*1
(%) New
Mid-term Plan
Previous
Mid-term Plan
Pursue upsides when business environment
turns favorable
192017 Annual Report
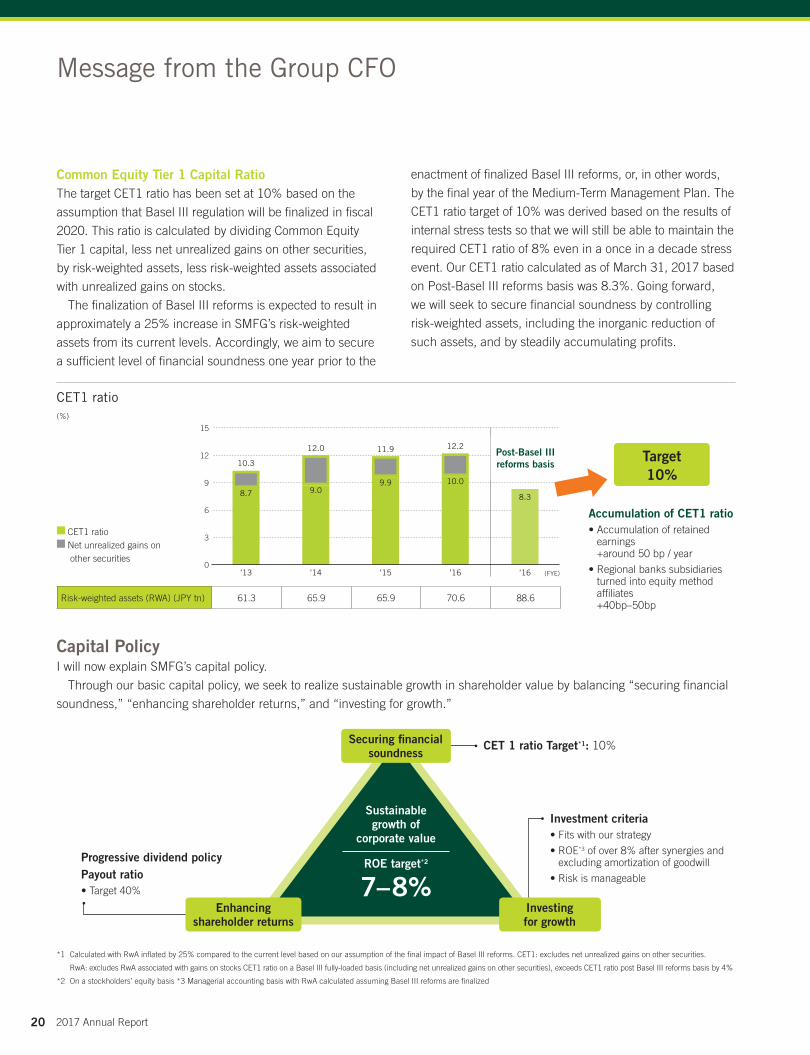
Common Equity Tier 1 Capital RatioThe target CET1 ratio has been set at 10% based on the
assumption that Basel III regulation will be finalized in fiscal
2020. This ratio is calculated by dividing Common Equity
Tier 1 capital, less net unrealized gains on other securities,
by risk-weighted assets, less risk-weighted assets associated
with unrealized gains on stocks.
The finalization of Basel III reforms is expected to result in
approximately a 25% increase in SMFG’s risk-weighted
assets from its current levels. Accordingly, we aim to secure
a sufficient level of financial soundness one year prior to the
Capital PolicyI will now explain SMFG’s capital policy.
Through our basic capital policy, we seek to realize sustainable growth in shareholder value by balancing “securing financial
soundness,” “enhancing shareholder returns,” and “investing for growth.”
enactment of finalized Basel III reforms, or, in other words,
by the final year of the Medium-Term Management Plan. The
CET1 ratio target of 10% was derived based on the results of
internal stress tests so that we will still be able to maintain the
required CET1 ratio of 8% even in a once in a decade stress
event. Our CET1 ratio calculated as of March 31, 2017 based
on Post-Basel III reforms basis was 8.3%. Going forward,
we will seek to secure financial soundness by controlling
risk-weighted assets, including the inorganic reduction of
such assets, and by steadily accumulating profits.
Progressive dividend policyPayout ratio• Target 40%
Investment criteria• Fits with our strategy
• ROE*3 of over 8% after synergies and excluding amortization of goodwill
• Risk is manageable
CET 1 ratio Target*1: 10%
*1 Calculated with RwA inflated by 25% compared to the current level based on our assumption of the final impact of Basel III reforms. CET1: excludes net unrealized gains on other securities.
RwA: excludes RwA associated with gains on stocks CET1 ratio on a Basel III fully-loaded basis (including net unrealized gains on other securities), exceeds CET1 ratio post Basel III reforms basis by 4%
*2 On a stockholders’ equity basis *3 Managerial accounting basis with RwA calculated assuming Basel III reforms are finalized
Securing financial soundness
Enhancing shareholder returns
Investing for growth
Sustainable growth of
corporate value
ROE target*2
7–8%
CET1 ratio(%)
’13 ’14 ’15 ’16 ’16
15
12
9
6
3
0
8.7 9.09.9 10.0
8.3
10.3
12.0 11.9 12.2
(FYE)
Accumulation of CET1 ratio• Accumulation of retained
earnings +around 50 bp / year
• Regional banks subsidiaries turned into equity method affiliates +40bp–50bp
Target10%
Risk-weighted assets (RWA) (JPY tn) 61.3 65.9 65.9 70.6 88.6
CET1 ratio Net unrealized gains on other securities
Post-Basel III reforms basis
Message from the Group CFO
20 2017 Annual Report
Securing Financial SoundnessAs I mentioned earlier, we are targeting a CET1 ratio of
approximately 10% based on the anticipated final impact of
tightened international financial regulations. We expect to
achieve the targeted figure through the disciplined reform of
our business and asset portfolios by which we will maintain
the present amount of risk-weighted assets as calculated
per current regulatory standards, while at the same time
we will rebalance our assets to a high margin portfolio and
accumulate profits.
We will continue to reduce our strategic shareholdings
to comply with Japan’s Corporate Governance Code, in
addition to mitigating the negative impact of stock price
fluctuations on our capital and the application of tighter
international financial regulations.
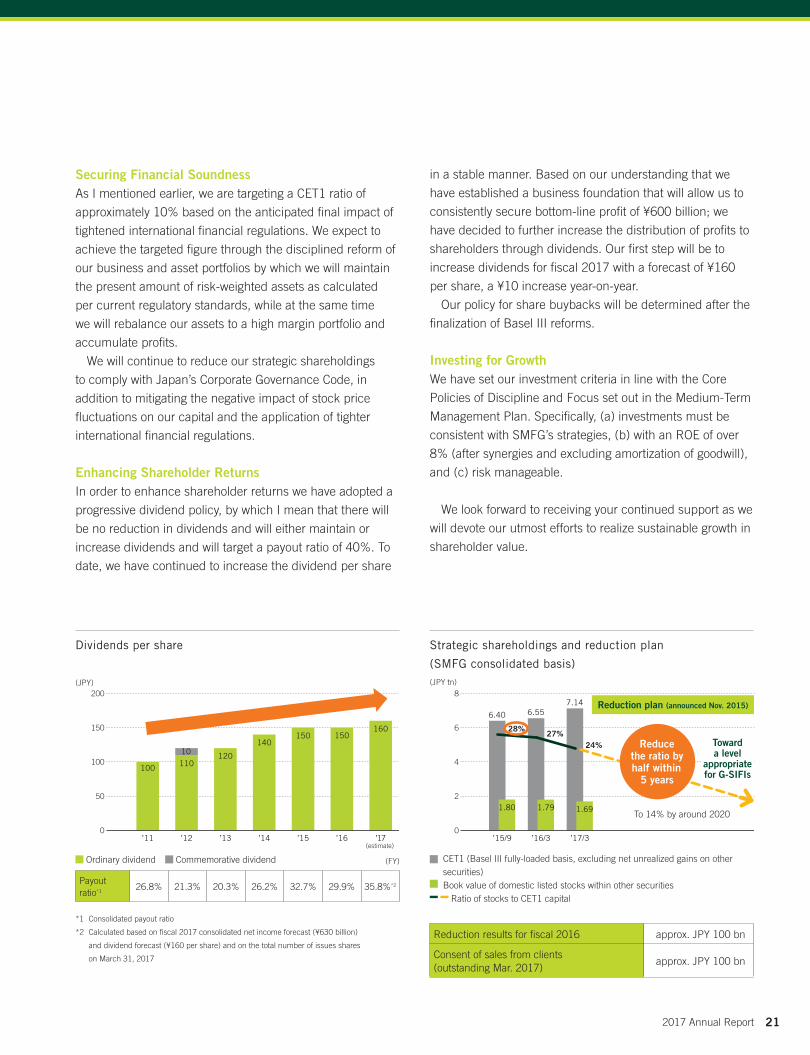
Enhancing Shareholder ReturnsIn order to enhance shareholder returns we have adopted a
progressive dividend policy, by which I mean that there will
be no reduction in dividends and will either maintain or
increase dividends and will target a payout ratio of 40%. To
date, we have continued to increase the dividend per share
in a stable manner. Based on our understanding that we
have established a business foundation that will allow us to
consistently secure bottom-line profit of ¥600 billion; we
have decided to further increase the distribution of profits to
shareholders through dividends. Our first step will be to
increase dividends for fiscal 2017 with a forecast of ¥160
per share, a ¥10 increase year-on-year.
Our policy for share buybacks will be determined after the
finalization of Basel III reforms.
Investing for GrowthWe have set our investment criteria in line with the Core
Policies of Discipline and Focus set out in the Medium-Term
Management Plan. Specifically, (a) investments must be
consistent with SMFG’s strategies, (b) with an ROE of over
8% (after synergies and excluding amortization of goodwill),
and (c) risk manageable.
We look forward to receiving your continued support as we
will devote our utmost efforts to realize sustainable growth in
shareholder value.
’17/3’16/3’15/90
2
4
6
87.14
6.556.40
1.691.791.80
24%27%
28%
’17(estimate)
’16’15’14’13’12’110
50
100
150
200
160150150
140
120110100
10
Dividends per share
(JPY)
Strategic shareholdings and reduction plan
(SMFG consolidated basis)(JPY tn)
Payout ratio*1
26.8% 21.3% 20.3% 26.2% 32.7% 29.9% 35.8%*2
Ordinary dividend Commemorative dividend
*1 Consolidated payout ratio
*2 Calculated based on fiscal 2017 consolidated net income forecast (¥630 billion)
and dividend forecast (¥160 per share) and on the total number of issues shares
on March 31, 2017
(FY)
Reduction plan (announced Nov. 2015)
Toward a level
appropriate for G-SIFIs
CET1 (Basel III fully-loaded basis, excluding net unrealized gains on other securities)
Book value of domestic listed stocks within other securities Ratio of stocks to CET1 capital
To 14% by around 2020
Reduction results for fiscal 2016 approx. JPY 100 bn
Consent of sales from clients (outstanding Mar. 2017)
approx. JPY 100 bn
Reduce the ratio by half within
5 years
212017 Annual Report
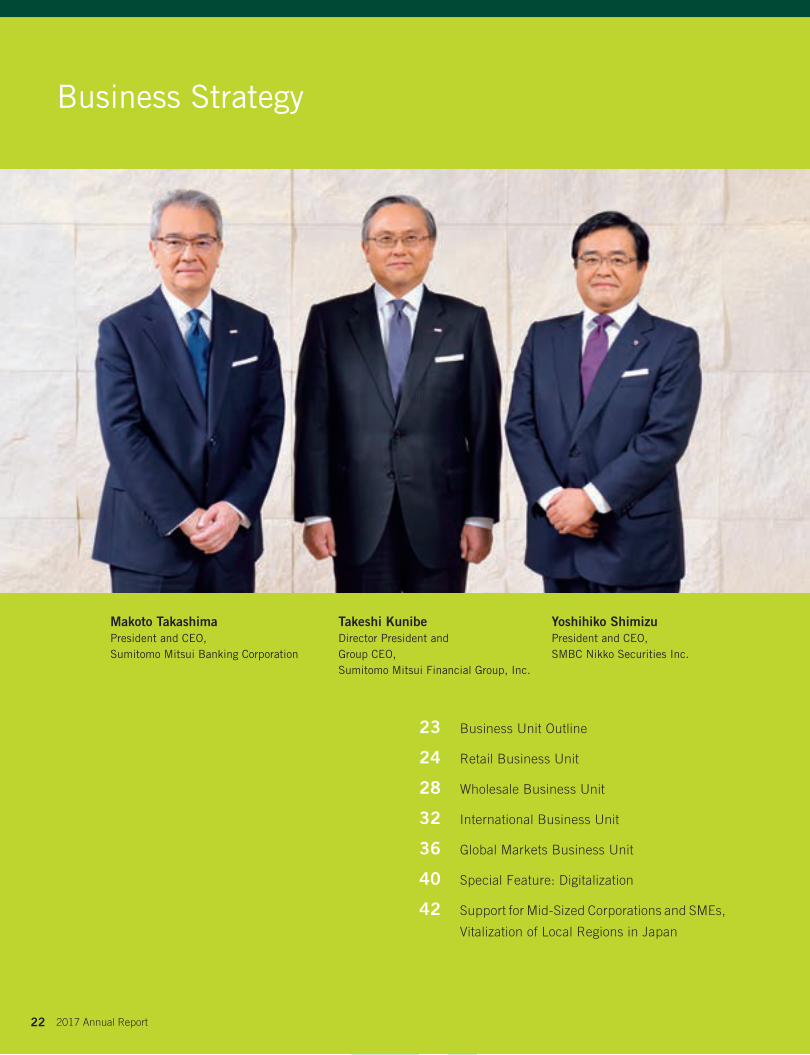
23 Business Unit Outline
24 Retail Business Unit
28 Wholesale Business Unit
32 International Business Unit
36 Global Markets Business Unit
40 Special Feature: Digitalization
42 Support for Mid-Sized Corporations and SMEs,
Vitalization of Local Regions in Japan
Business Strategy
Makoto TakashimaPresident and CEO,Sumitomo Mitsui Banking Corporation
Takeshi KunibeDirector President and Group CEO,Sumitomo Mitsui Financial Group, Inc.
Yoshihiko ShimizuPresident and CEO,SMBC Nikko Securities Inc.
22 2017 Annual Report
Business Strategy
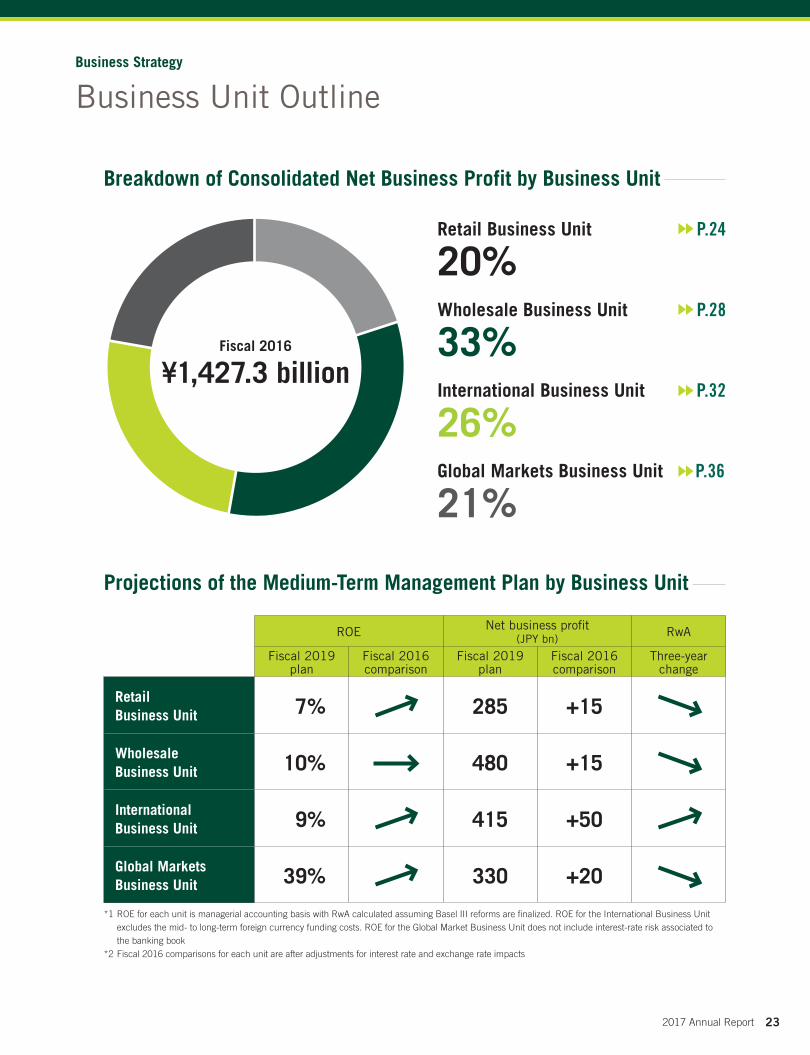
ROE Net business profit (JPY bn) RwA
Fiscal 2019 plan
Fiscal 2016 comparison
Fiscal 2019 plan
Fiscal 2016 comparison
Three-year change
Retail Business Unit 7% 285 +15
Wholesale Business Unit 10% 480 +15
International Business Unit 9% 415 +50
Global Markets Business Unit 39% 330 +20
Retail Business Unit
20%
Fiscal 2016
¥1,427.3 billion
Wholesale Business Unit
33%International Business Unit
26%Global Markets Business Unit
21%
Projections of the Medium-Term Management Plan by Business Unit
Breakdown of Consolidated Net Business Profit by Business Unit
P.28
P.24
P.32
P.36
Business Unit Outline
*1 ROE for each unit is managerial accounting basis with RwA calculated assuming Basel III reforms are finalized. ROE for the International Business Unit excludes the mid- to long-term foreign currency funding costs. ROE for the Global Market Business Unit does not include interest-rate risk associated to the banking book
*2 Fiscal 2016 comparisons for each unit are after adjustments for interest rate and exchange rate impacts
232017 Annual Report
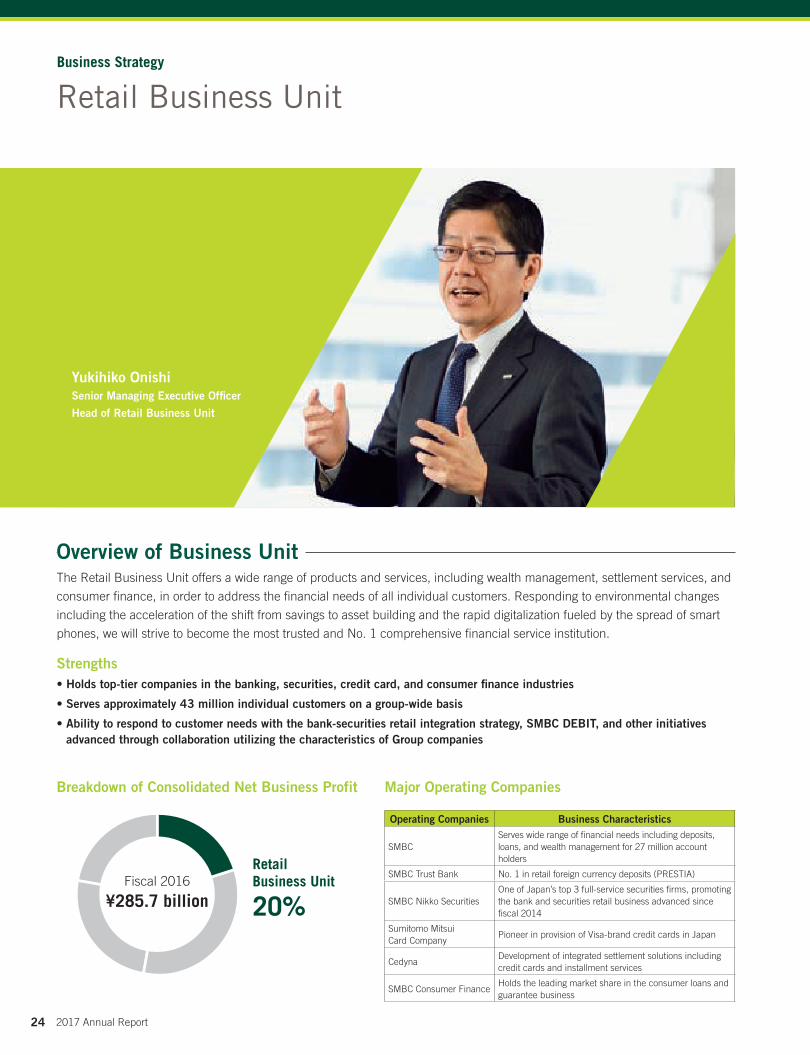
Retail Business UnitBusiness Strategy
The Retail Business Unit offers a wide range of products and services, including wealth management, settlement services, and
consumer finance, in order to address the financial needs of all individual customers. Responding to environmental changes
including the acceleration of the shift from savings to asset building and the rapid digitalization fueled by the spread of smart
phones, we will strive to become the most trusted and No. 1 comprehensive financial service institution.
Overview of Business Unit
Major Operating Companies
Operating Companies Business Characteristics
SMBCServes wide range of financial needs including deposits, loans, and wealth management for 27 million account holders
SMBC Trust Bank No. 1 in retail foreign currency deposits (PRESTIA)
SMBC Nikko SecuritiesOne of Japan’s top 3 full-service securities firms, promoting the bank and securities retail business advanced since fiscal 2014
Sumitomo Mitsui Card Company
Pioneer in provision of Visa-brand credit cards in Japan
CedynaDevelopment of integrated settlement solutions including credit cards and installment services
SMBC Consumer FinanceHolds the leading market share in the consumer loans and guarantee business
Breakdown of Consolidated Net Business Profit
Retail Business Unit
20%Fiscal 2016
¥285.7 billion
Strengths• Holds top-tier companies in the banking, securities, credit card, and consumer finance industries
• Serves approximately 43 million individual customers on a group-wide basis
• Ability to respond to customer needs with the bank-securities retail integration strategy, SMBC DEBIT, and other initiatives advanced through collaboration utilizing the characteristics of Group companies
Yukihiko OnishiSenior Managing Executive Officer
Head of Retail Business Unit
24 2017 Annual Report
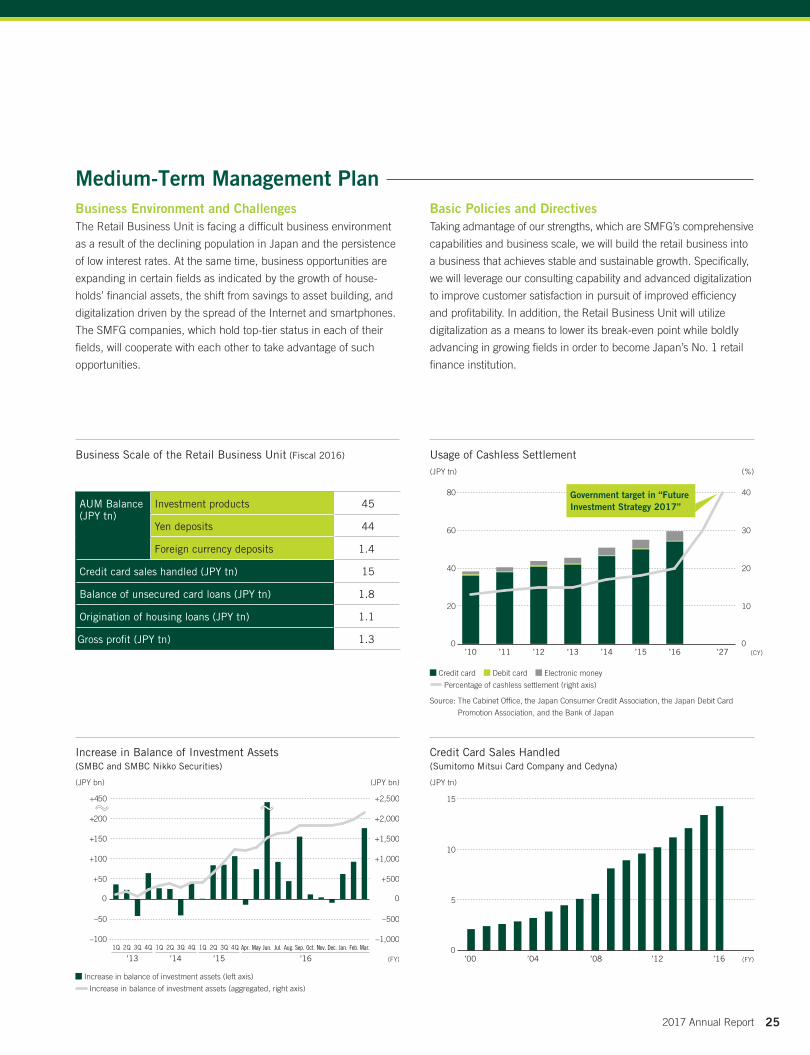
Usage of Cashless Settlement(JPY tn) (%)
Credit Card Sales Handled (Sumitomo Mitsui Card Company and Cedyna)
(JPY tn)
Increase in Balance of Investment Assets (SMBC and SMBC Nikko Securities)
(JPY bn) (JPY bn)
Credit card Debit card Electronic money
Percentage of cashless settlement (right axis)
Source: The Cabinet Office, the Japan Consumer Credit Association, the Japan Debit Card
Promotion Association, and the Bank of Japan
Business Scale of the Retail Business Unit (Fiscal 2016)
4Q3Q2Q1Q–100
–50
0
+50
+100
+150
+200
+450
–1,000
–500
0
+500
+1,000
+1,500
+2,000
+2,500
’134Q3Q2Q1Q
’16’144Q3Q2Q1Q Apr. May Jun. Jul. Aug. Sep. Oct. Nov. Dec. Jan. Feb. Mar.
’15 (FY)0
5
10
15
’16’12’08’04’00 (FY)
0
10
20
30
40
’27’16’15’14’13’12’11’100
20
40
60
80
(CY)
Government target in “Future Investment Strategy 2017”AUM Balance
(JPY tn)Investment products 45
Yen deposits 44
Foreign currency deposits 1.4
Credit card sales handled (JPY tn) 15
Balance of unsecured card loans (JPY tn) 1.8
Origination of housing loans (JPY tn) 1.1
Gross profit (JPY tn) 1.3
Increase in balance of investment assets (left axis)
Increase in balance of investment assets (aggregated, right axis)
Medium-Term Management PlanBusiness Environment and ChallengesThe Retail Business Unit is facing a difficult business environment
as a result of the declining population in Japan and the persistence
of low interest rates. At the same time, business opportunities are
expanding in certain fields as indicated by the growth of house-
holds’ financial assets, the shift from savings to asset building, and
digitalization driven by the spread of the Internet and smartphones.
The SMFG companies, which hold top-tier status in each of their
fields, will cooperate with each other to take advantage of such
opportunities.
Basic Policies and DirectivesTaking admantage of our strengths, which are SMFG’s comprehensive
capabilities and business scale, we will build the retail business into
a business that achieves stable and sustainable growth. Specifically,
we will leverage our consulting capability and advanced digitalization
to improve customer satisfaction in pursuit of improved efficiency
and profitability. In addition, the Retail Business Unit will utilize
digitalization as a means to lower its break-even point while boldly
advancing in growing fields in order to become Japan’s No. 1 retail
finance institution.
252017 Annual Report

Priority Strategies
Enhance Wealth Management Business through Bank-Securities IntegrationWe will further evolve the bank-securities retail integration strategy
implemented through coordination between SMBC and SMBC Nikko
Securities by leveraging the unique strengths of both companies. In
order to address our customers’ wealth management needs, we will
promote medium-to-long term diversified investment opportunities
to our customers as our basic approach through the bank- securities
integration.
Reform of Cost StructuresAt SMBC branches, we are promoting three reforms at once,
“changing the way we offer services to our customers,” “changing
the administration process,” and “changing the concept of
branches.” The scope of these reforms will be expanded to all
branches over the next three years to enable us to reduce costs
while providing customers with
convenient and high-quality
services.
Transform Business Model through Digitalization and Group IntegrationWe will promote the digitalization in the services we provide to
our customers and our business operation to become the most
advanced digital bank in Japan while also being regarded as
an innovative bank on a global basis. At the same time, Group
integration will be pursued in various fields, such as in the settle-
ment service field through collaboration leveraging the strengths
of SMBC, Sumitomo Mitsui Card Company, and Cedyna.
Paperless service counter
Introducing Next-Generation Branches
Fiscal 2017 Fiscal 2018 Fiscal 2019
Introduction of next-generation
branches100 280 430
Completed
Digitalization of processes
Cost reductionFiscal 2021: JPY 30 bn (reduce expenses associated with in-person banking by 20%)
Digitalization of interfaces
Increase use of straight-through processing with internal processes
* Clients using digital channels / (clients using physical branches + clients using digital channels)
Balance of Stock-Based Assets (SMBC and SMBC Nikko Securities)
(JPY tn)
Utilization Rate for Digital Channels (SMBC)*
(%)
15
10
5
0’16 ’19 (FYE)
45
30
15
0’16 ’19 (FY)
+ JPY 2.8 tn
+ 23%
JPY 20 bn plus
Retail Business Unit
26 2017 Annual Report
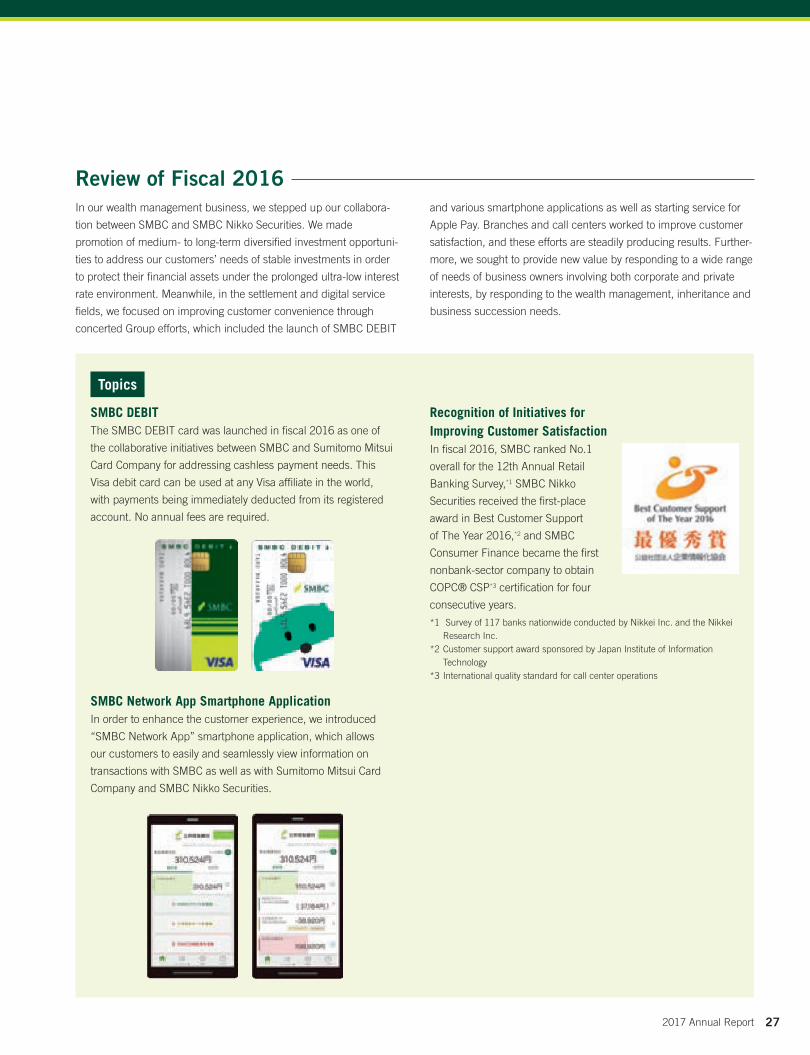
SMBC DEBITThe SMBC DEBIT card was launched in fiscal 2016 as one of
the collaborative initiatives between SMBC and Sumitomo Mitsui
Card Company for addressing cashless payment needs. This
Visa debit card can be used at any Visa affiliate in the world,
with payments being immediately deducted from its registered
account. No annual fees are required.
SMBC Network App Smartphone ApplicationIn order to enhance the customer experience, we introduced
“SMBC Network App” smartphone application, which allows
our customers to easily and seamlessly view information on
transactions with SMBC as well as with Sumitomo Mitsui Card
Company and SMBC Nikko Securities.
Recognition of Initiatives for Improving Customer SatisfactionIn fiscal 2016, SMBC ranked No.1
overall for the 12th Annual Retail
Banking Survey,*1 SMBC Nikko
Securities received the first-place
award in Best Customer Support
of The Year 2016,*2 and SMBC
Consumer Finance became the first
nonbank-sector company to obtain
COPC® CSP*3 certification for four
consecutive years.
*1 Survey of 117 banks nationwide conducted by Nikkei Inc. and the Nikkei Research Inc.
*2 Customer support award sponsored by Japan Institute of Information Technology
*3 International quality standard for call center operations
Review of Fiscal 2016In our wealth management business, we stepped up our collabora-
tion between SMBC and SMBC Nikko Securities. We made
promotion of medium- to long-term diversified investment opportuni-
ties to address our customers’ needs of stable investments in order
to protect their financial assets under the prolonged ultra-low interest
rate environment. Meanwhile, in the settlement and digital service
fields, we focused on improving customer convenience through
concerted Group efforts, which included the launch of SMBC DEBIT
and various smartphone applications as well as starting service for
Apple Pay. Branches and call centers worked to improve customer
satisfaction, and these efforts are steadily producing results. Further-
more, we sought to provide new value by responding to a wide range
of needs of business owners involving both corporate and private
interests, by responding to the wealth management, inheritance and
business succession needs.
Topics
272017 Annual Report

The Wholesale Business Unit provides financing, investment management, risk hedging, and settlement services primarily for
large- and mid-sized corporate clients in Japan. The Unit also provides financial solutions that respond to wide-ranging client
needs in relation to M&A, advisory, and leasing.
Overview of Business Unit
Major Operating Companies
Operating Companies Business Characteristics
SMBCBanking transactions for Japanese companies located in Japan and East Asia
SMBC Trust BankIntermediation, asset management, consulting, and other real estate-related services
Sumitomo Mitsui Finance and Leasing Leasing transactions for domestic companies
SMBC Nikko SecuritiesSecurities transactions for large domestic companies and financial institutions
Breakdown of Consolidated Net Business Profit
Wholesale Business Unit
33%Fiscal 2016
¥473.1 billion
Strengths• Speed in identifying and understanding customer needs, and providing financial solutions in respond to these needs
• The spirit of positive challenge inspiring employees to exercise creativity in developing new services and products to grow together with customers
• On-site capabilities born out of the organic union of frontline organizations with high sales proficiency and corporate organizations specializing in various areas
Wholesale Business UnitBusiness Strategy
Manabu NaritaDeputy President and Executive Officer
Head of Wholesale Business Unit
28 2017 Annual Report
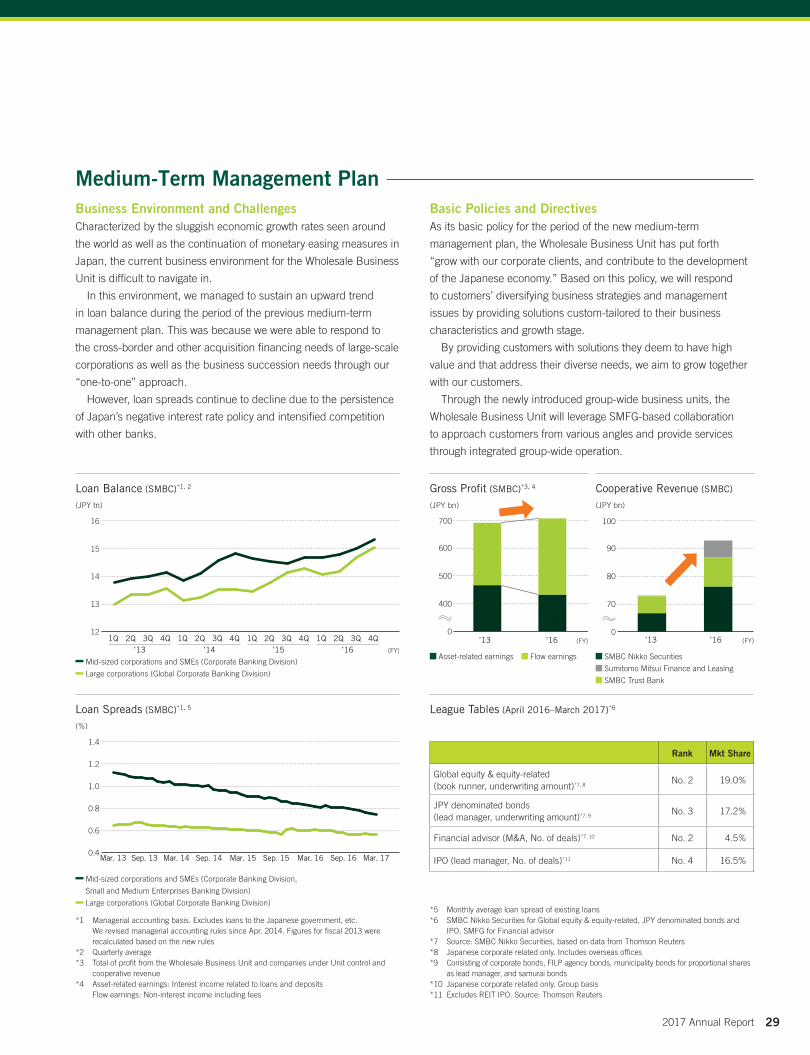
Medium-Term Management PlanBusiness Environment and ChallengesCharacterized by the sluggish economic growth rates seen around
the world as well as the continuation of monetary easing measures in
Japan, the current business environment for the Wholesale Business
Unit is difficult to navigate in.
In this environment, we managed to sustain an upward trend
in loan balance during the period of the previous medium-term
management plan. This was because we were able to respond to
the cross-border and other acquisition financing needs of large-scale
corporations as well as the business succession needs through our
“one-to-one” approach.
However, loan spreads continue to decline due to the persistence
of Japan’s negative interest rate policy and intensified competition
with other banks.
Basic Policies and DirectivesAs its basic policy for the period of the new medium-term
management plan, the Wholesale Business Unit has put forth
“grow with our corporate clients, and contribute to the development
of the Japanese economy.” Based on this policy, we will respond
to customers’ diversifying business strategies and management
issues by providing solutions custom-tailored to their business
characteristics and growth stage.
By providing customers with solutions they deem to have high
value and that address their diverse needs, we aim to grow together
with our customers.
Through the newly introduced group-wide business units, the
Wholesale Business Unit will leverage SMFG-based collaboration
to approach customers from various angles and provide services
through integrated group-wide operation.
League Tables (April 2016–March 2017)*6
*1 Managerial accounting basis. Excludes loans to the Japanese government, etc. We revised managerial accounting rules since Apr. 2014. Figures for fiscal 2013 were recalculated based on the new rules
*2 Quarterly average*3 Total of profit from the Wholesale Business Unit and companies under Unit control and
cooperative revenue*4 Asset-related earnings: Interest income related to loans and deposits
Flow earnings: Non-interest income including fees
1.4
0.4
1.2
1.0
0.8
0.6
Mar. 17Sep. 16Mar. 16Sep. 15Mar. 15Sep. 14Mar. 14Sep. 13Mar. 13
Loan Spreads (SMBC)*1, 5
(%)
Mid-sized corporations and SMEs (Corporate Banking Division,
Small and Medium Enterprises Banking Division)
Large corporations (Global Corporate Banking Division)
16
12
15
14
13
(兆円)
’13 ’14 ’15 ’164Q3Q2Q1Q4Q3Q2Q1Q4Q3Q2Q1Q4Q3Q2Q1Q
(FY)
Loan Balance (SMBC)*1, 2
(JPY tn)
Mid-sized corporations and SMEs (Corporate Banking Division)
Large corporations (Global Corporate Banking Division)
0
80
90
70
100
’16’13 (FY)0
600
500
400
700
’16’13 (FY)
Gross Profit (SMBC)*3, 4
(JPY bn)
Cooperative Revenue (SMBC)
(JPY bn)
*5 Monthly average loan spread of existing loans*6 SMBC Nikko Securities for Global equity & equity-related, JPY denominated bonds and
IPO. SMFG for Financial advisor*7 Source: SMBC Nikko Securities, based on data from Thomson Reuters*8 Japanese corporate related only. Includes overseas offices*9 Consisting of corporate bonds, FILP agency bonds, municipality bonds for proportional shares
as lead manager, and samurai bonds *10 Japanese corporate related only. Group basis*11 Excludes REIT IPO. Source: Thomson Reuters
Rank Mkt Share
Global equity & equity-related (book runner, underwriting amount)*7, 8
No. 2 19.0%
JPY denominated bonds(lead manager, underwriting amount)*7, 9
No. 3 17.2%
Financial advisor (M&A, No. of deals)*7, 10 No. 2 4.5%
IPO (lead manager, No. of deals)*11 No. 4 16.5%
Asset-related earnings Flow earnings SMBC Nikko Securities
Sumitomo Mitsui Finance and Leasing
SMBC Trust Bank
292017 Annual Report
Priority Strategies
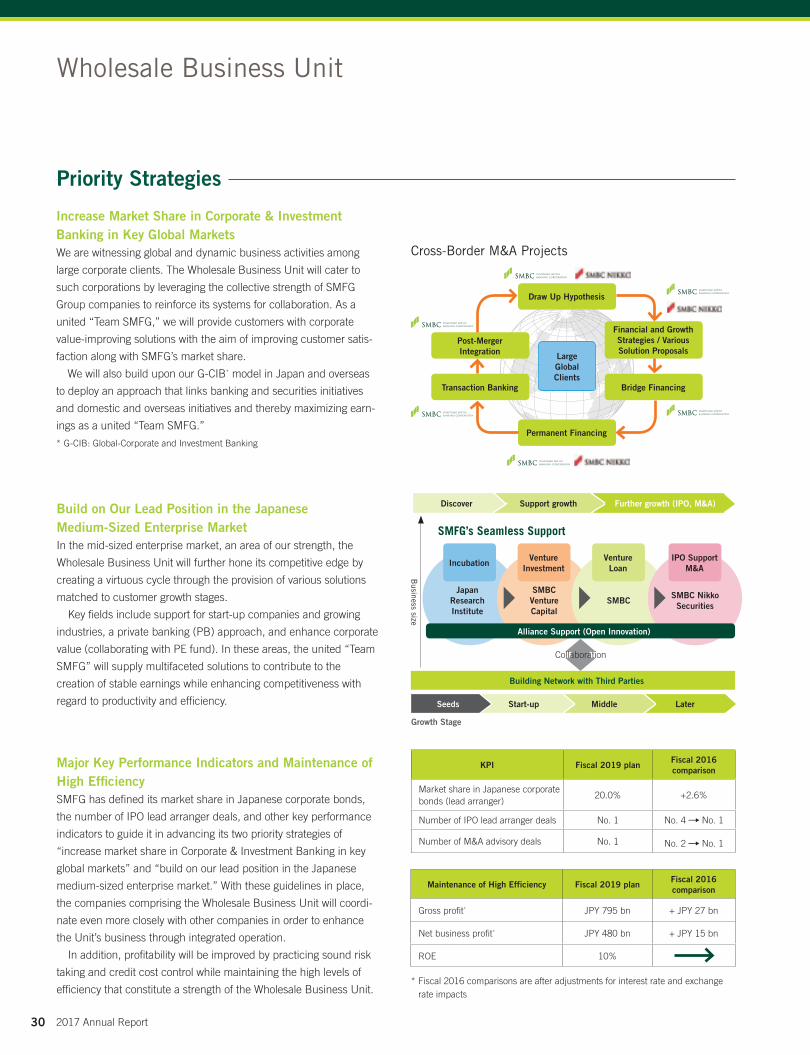
Increase Market Share in Corporate & Investment Banking in Key Global MarketsWe are witnessing global and dynamic business activities among
large corporate clients. The Wholesale Business Unit will cater to
such corporations by leveraging the collective strength of SMFG
Group companies to reinforce its systems for collaboration. As a
united “Team SMFG,” we will provide customers with corporate
value-improving solutions with the aim of improving customer satis-
faction along with SMFG’s market share.
We will also build upon our G-CIB* model in Japan and overseas
to deploy an approach that links banking and securities initiatives
and domestic and overseas initiatives and thereby maximizing earn-
ings as a united “Team SMFG.”
* G-CIB: Global-Corporate and Investment Banking
Major Key Performance Indicators and Maintenance of High EfficiencySMFG has defined its market share in Japanese corporate bonds,
the number of IPO lead arranger deals, and other key performance
indicators to guide it in advancing its two priority strategies of
“increase market share in Corporate & Investment Banking in key
global markets” and “build on our lead position in the Japanese
medium-sized enterprise market.” With these guidelines in place,
the companies comprising the Wholesale Business Unit will coordi-
nate even more closely with other companies in order to enhance
the Unit’s business through integrated operation.
In addition, profitability will be improved by practicing sound risk
taking and credit cost control while maintaining the high levels of
efficiency that constitute a strength of the Wholesale Business Unit.
Build on Our Lead Position in the Japanese Medium-Sized Enterprise MarketIn the mid-sized enterprise market, an area of our strength, the
Wholesale Business Unit will further hone its competitive edge by
creating a virtuous cycle through the provision of various solutions
matched to customer growth stages.
Key fields include support for start-up companies and growing
industries, a private banking (PB) approach, and enhance corporate
value (collaborating with PE fund). In these areas, the united “Team
SMFG” will supply multifaceted solutions to contribute to the
creation of stable earnings while enhancing competitiveness with
regard to productivity and efficiency.
Wholesale Business Unit
KPI Fiscal 2019 planFiscal 2016comparison
Market share in Japanese corporate bonds (lead arranger)
20.0% +2.6%
Number of IPO lead arranger deals No. 1 No. 4 No. 1
Number of M&A advisory deals No. 1 No. 2 No. 1
Maintenance of High Efficiency Fiscal 2019 planFiscal 2016comparison
Gross profit* JPY 795 bn + JPY 27 bn
Net business profit* JPY 480 bn + JPY 15 bn
ROE 10%
* Fiscal 2016 comparisons are after adjustments for interest rate and exchange rate impacts
SMFG’s Seamless Support
Growth Stage
Draw Up Hypothesis
Permanent Financing
Post-Merger Integration
Transaction Banking Bridge Financing
Financial and Growth Strategies / Various Solution Proposals
Large Global Clients
Incubation
Further growth (IPO, M&A)
LaterMiddleStart-upSeeds
Building Network with Third Parties
Venture Investment
Venture Loan
IPO SupportM&A
Alliance Support (Open Innovation)
Support growthDiscover
Japan Research Institute
SMBC Venture Capital
SMBCSMBC Nikko Securities
Business size
Cross-Border M&A Projects
Collaboration
30 2017 Annual Report
Review of Fiscal 2016Fiscal 2016 represented a turning point as it was the third year of
the domestic operational reform that was commenced in fiscal 2014
as well as the final year of the previous medium-term management
plan. The Wholesale Banking Unit was united in its efforts during
this important year. Looking back at fiscal 2016, we faced a highly
opaque business environment created by the slow growth rates
around the business world and ongoing monetary easing in Japan,
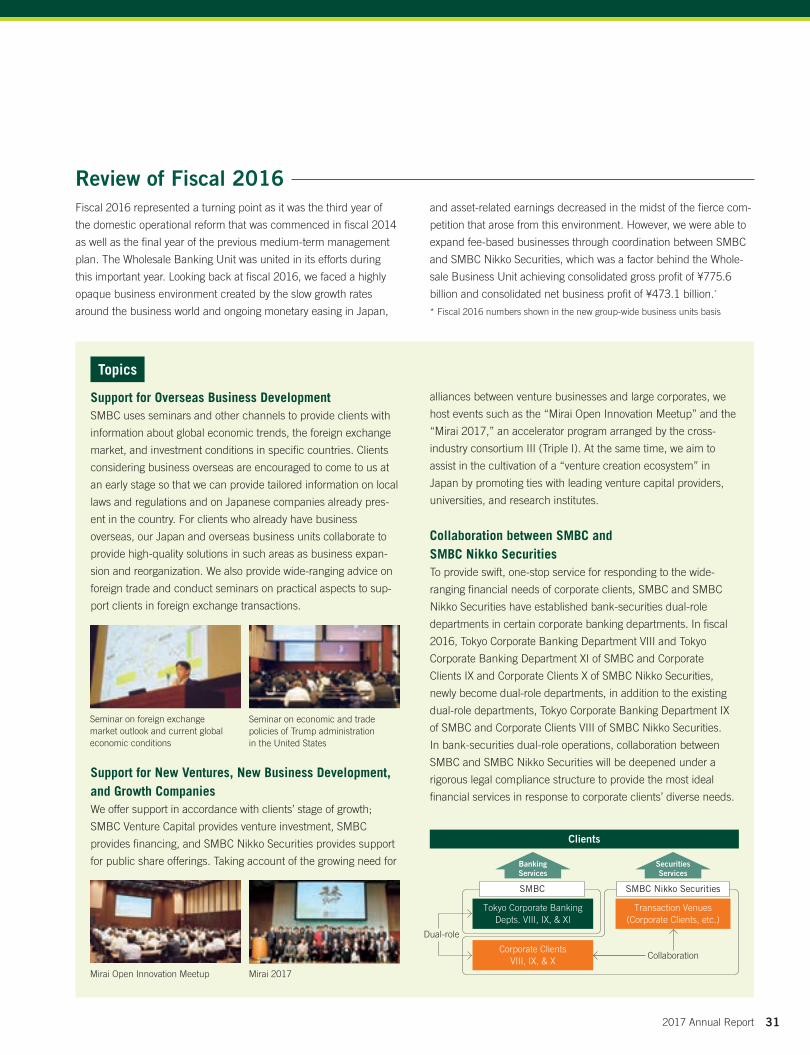
Support for Overseas Business DevelopmentSMBC uses seminars and other channels to provide clients with
information about global economic trends, the foreign exchange
market, and investment conditions in specific countries. Clients
considering business overseas are encouraged to come to us at
an early stage so that we can provide tailored information on local
laws and regulations and on Japanese companies already pres-
ent in the country. For clients who already have business
overseas, our Japan and overseas business units collaborate to
provide high-quality solutions in such areas as business expan-
sion and reorganization. We also provide wide-ranging advice on
foreign trade and conduct seminars on practical aspects to sup-
port clients in foreign exchange transactions.
Support for New Ventures, New Business Development, and Growth CompaniesWe offer support in accordance with clients’ stage of growth;
SMBC Venture Capital provides venture investment, SMBC
provides financing, and SMBC Nikko Securities provides support
for public share offerings. Taking account of the growing need for
and asset-related earnings decreased in the midst of the fierce com-
petition that arose from this environment. However, we were able to
expand fee-based businesses through coordination between SMBC
and SMBC Nikko Securities, which was a factor behind the Whole-
sale Business Unit achieving consolidated gross profit of ¥775.6
billion and consolidated net business profit of ¥473.1 billion.*
* Fiscal 2016 numbers shown in the new group-wide business units basis
Topics
Seminar on foreign exchange market outlook and current global economic conditions
Seminar on economic and trade policies of Trump administration in the United States
alliances between venture businesses and large corporates, we
host events such as the “Mirai Open Innovation Meetup” and the
“Mirai 2017,” an accelerator program arranged by the cross-
industry consortium III (Triple I). At the same time, we aim to
assist in the cultivation of a “venture creation ecosystem” in
Japan by promoting ties with leading venture capital providers,
universities, and research institutes.
Collaboration between SMBC and SMBC Nikko SecuritiesTo provide swift, one-stop service for responding to the wide-
ranging financial needs of corporate clients, SMBC and SMBC
Nikko Securities have established bank-securities dual-role
departments in certain corporate banking departments. In fiscal
2016, Tokyo Corporate Banking Department VIII and Tokyo
Corporate Banking Department XI of SMBC and Corporate
Clients IX and Corporate Clients X of SMBC Nikko Securities,
newly become dual-role departments, in addition to the existing
dual-role departments, Tokyo Corporate Banking Department IX
of SMBC and Corporate Clients VIII of SMBC Nikko Securities.
In bank-securities dual-role operations, collaboration between
SMBC and SMBC Nikko Securities will be deepened under a
rigorous legal compliance structure to provide the most ideal
financial services in response to corporate clients’ diverse needs.
Mirai Open Innovation Meetup Mirai 2017
Clients
Tokyo Corporate Banking Depts. VIII, IX, & XI
Dual-role
Corporate Clients VIII, IX, & X
Transaction Venues (Corporate Clients, etc.)
Collaboration
SMBC Nikko Securities
Securities Services
Banking Services
SMBC
312017 Annual Report
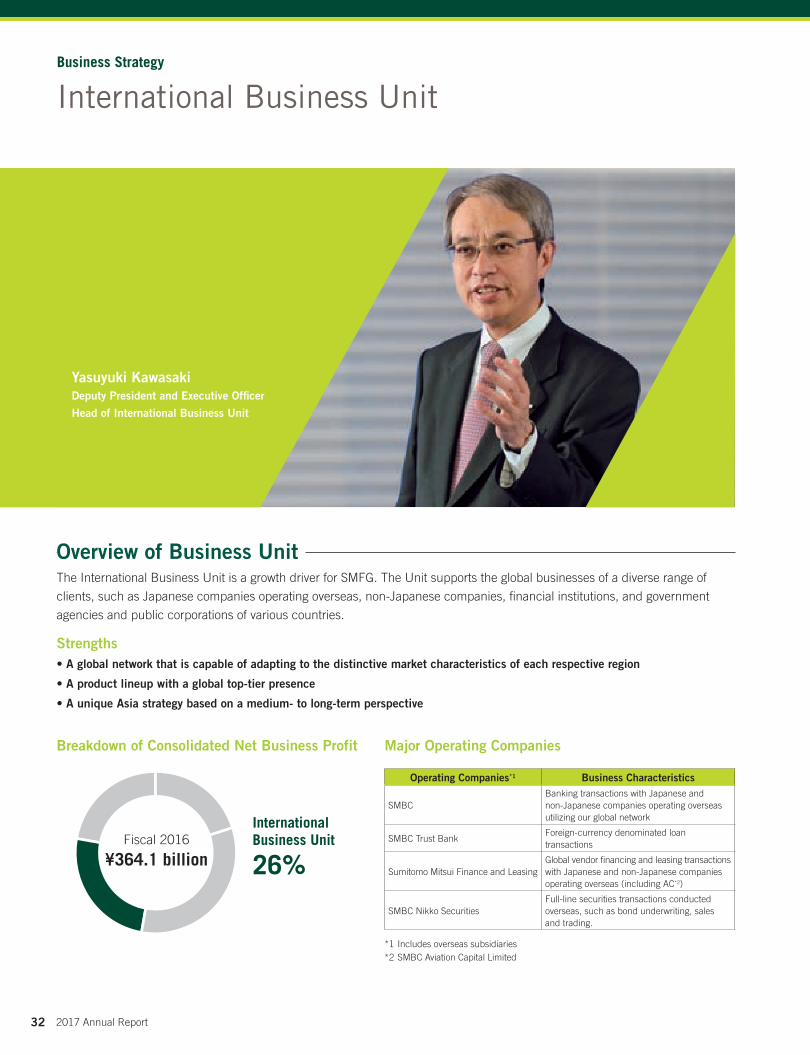
International Business UnitBusiness Strategy
The International Business Unit is a growth driver for SMFG. The Unit supports the global businesses of a diverse range of
clients, such as Japanese companies operating overseas, non-Japanese companies, financial institutions, and government
agencies and public corporations of various countries.
Overview of Business Unit
Major Operating Companies
Operating Companies*1 Business Characteristics
SMBCBanking transactions with Japanese and non-Japanese companies operating overseas utilizing our global network
SMBC Trust BankForeign-currency denominated loan transactions
Sumitomo Mitsui Finance and LeasingGlobal vendor financing and leasing trans actions with Japanese and non-Japanese companies operating overseas (including AC*2)
SMBC Nikko SecuritiesFull-line securities transactions conducted overseas, such as bond underwriting, sales and trading.
*1 Includes overseas subsidiaries*2 SMBC Aviation Capital Limited
Breakdown of Consolidated Net Business Profit
International Business Unit
26%Fiscal 2016
¥364.1 billion
Strengths• A global network that is capable of adapting to the distinctive market characteristics of each respective region
• A product lineup with a global top-tier presence
• A unique Asia strategy based on a medium- to long-term perspective
Yasuyuki KawasakiDeputy President and Executive Officer
Head of International Business Unit
32 2017 Annual Report
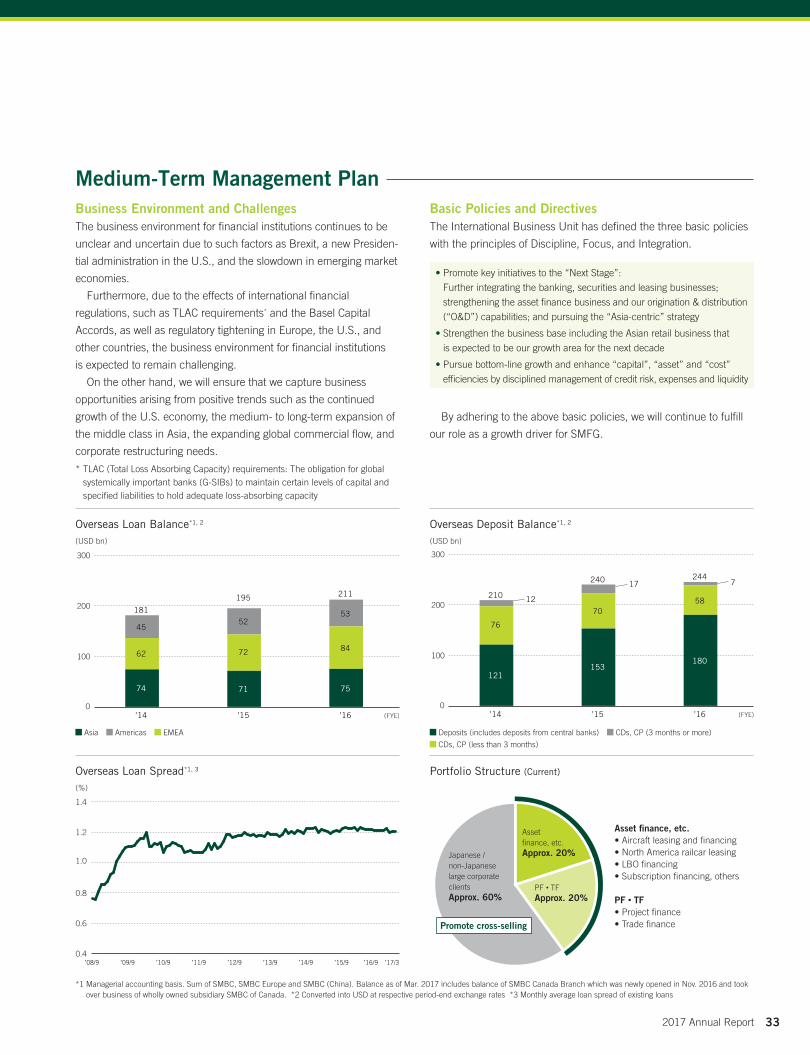
Overseas Loan Balance*1, 2
(USD bn)
Asia Americas EMEA
0
100
200
300
’14 ’16’15
181
211195
74 7571
628472
45
5352
(FYE)
Overseas Loan Spread*1, 3
(%)
*1 Managerial accounting basis. Sum of SMBC, SMBC Europe and SMBC (China). Balance as of Mar. 2017 includes balance of SMBC Canada Branch which was newly opened in Nov. 2016 and took over business of wholly owned subsidiary SMBC of Canada. *2 Converted into USD at respective period-end exchange rates *3 Monthly average loan spread of existing loans
’17/3’16/9’15/9’14/9’13/9’12/9’11/9’10/9’09/9’08/90.4
0.6
0.8
1.0
1.2
1.4
Overseas Deposit Balance*1, 2
(USD bn)
Deposits (includes deposits from central banks) CDs, CP (3 months or more)
CDs, CP (less than 3 months)
0
100
200
300
’14 ’16’15
210
244240
121
180153
76
5870
12
717
(FYE)
Portfolio Structure (Current)
Asset finance, etc.• Aircraft leasing and financing• North America railcar leasing• LBO financing• Subscription financing, others
PF • TF• Project finance• Trade finance
Asset finance, etc.Approx. 20%
PF • TFApprox. 20%
Japanese / non-Japanese large corporate clientsApprox. 60%
Promote cross-selling
Medium-Term Management PlanBusiness Environment and ChallengesThe business environment for financial institutions continues to be
unclear and uncertain due to such factors as Brexit, a new Presiden-
tial administration in the U.S., and the slowdown in emerging market
economies.
Furthermore, due to the effects of international financial
regulations, such as TLAC requirements* and the Basel Capital
Accords, as well as regulatory tightening in Europe, the U.S., and
other countries, the business environment for financial institutions
is expected to remain challenging.
On the other hand, we will ensure that we capture business
opportunities arising from positive trends such as the continued
growth of the U.S. economy, the medium- to long-term expansion of
the middle class in Asia, the expanding global commercial flow, and
corporate restructuring needs.
* TLAC (Total Loss Absorbing Capacity) requirements: The obligation for global systemically important banks (G-SIBs) to maintain certain levels of capital and specified liabilities to hold adequate loss-absorbing capacity
Basic Policies and DirectivesThe International Business Unit has defined the three basic policies
with the principles of Discipline, Focus, and Integration.
By adhering to the above basic policies, we will continue to fulfill
our role as a growth driver for SMFG.
• Promote key initiatives to the “Next Stage”:
Further integrating the banking, securities and leasing businesses;
strengthening the asset finance business and our origination & distribution
(“O&D”) capabilities; and pursuing the “Asia-centric” strategy
• Strengthen the business base including the Asian retail business that
is expected to be our growth area for the next decade
• Pursue bottom-line growth and enhance “capital”, “asset” and “cost”
efficiencies by disciplined management of credit risk, expenses and liquidity
332017 Annual Report
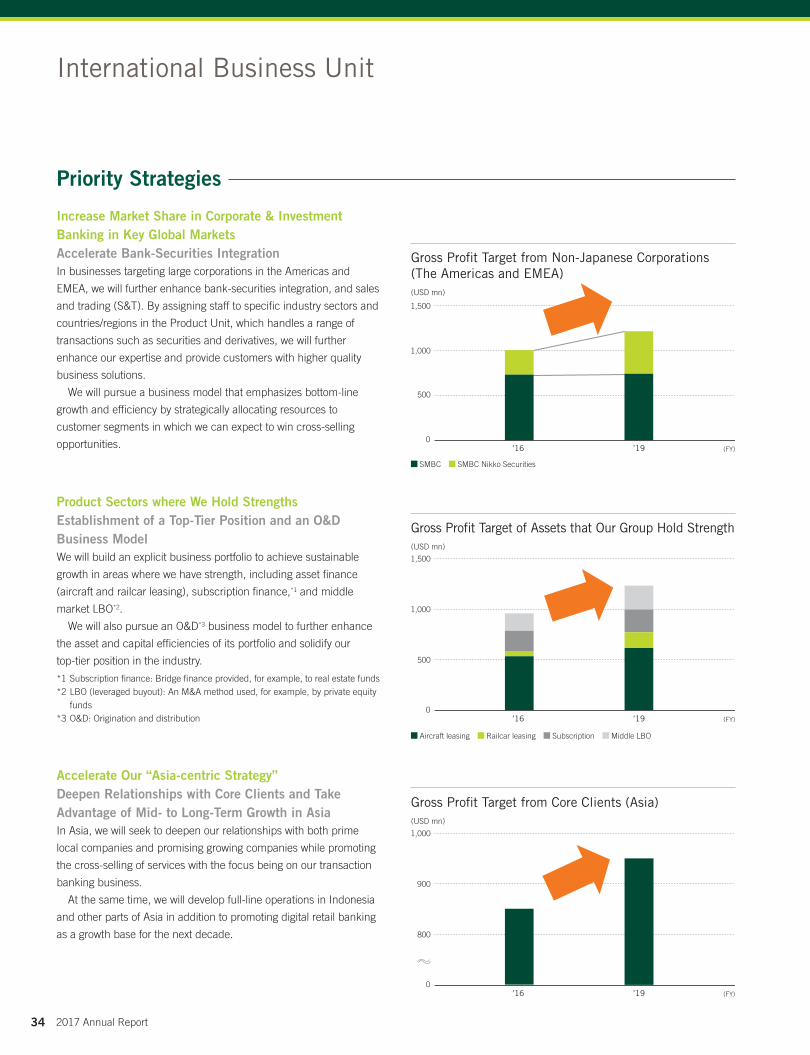
Gross Profit Target from Non-Japanese Corporations (The Americas and EMEA)(USD mn)
SMBC SMBC Nikko Securities
0
500
1,000
1,500
’16 ’19 (FY)
Gross Profit Target of Assets that Our Group Hold Strength(USD mn)
Aircraft leasing Railcar leasing Subscription Middle LBO
0
500
1,000
1,500
17
’16 ’19 (FY)
Gross Profit Target from Core Clients (Asia)(USD mn)
0
800
900
1,000
’16 ’19 (FY)
International Business Unit
Priority Strategies
Increase Market Share in Corporate & Investment Banking in Key Global Markets Accelerate Bank-Securities IntegrationIn businesses targeting large corporations in the Americas and
EMEA, we will further enhance bank-securities integration, and sales
and trading (S&T). By assigning staff to specific industry sectors and
countries/regions in the Product Unit, which handles a range of
transactions such as securities and derivatives, we will further
enhance our expertise and provide customers with higher quality
business solutions.
We will pursue a business model that emphasizes bottom-line
growth and efficiency by strategically allocating resources to
customer segments in which we can expect to win cross-selling
opportunities.
Accelerate Our “Asia-centric Strategy” Deepen Relationships with Core Clients and Take Advantage of Mid- to Long-Term Growth in AsiaIn Asia, we will seek to deepen our relationships with both prime
local companies and promising growing companies while promoting
the cross-selling of services with the focus being on our transaction
banking business.
At the same time, we will develop full-line operations in Indonesia
and other parts of Asia in addition to promoting digital retail banking
as a growth base for the next decade.
Product Sectors where We Hold Strengths Establishment of a Top-Tier Position and an O&D Business ModelWe will build an explicit business portfolio to achieve sustainable
growth in areas where we have strength, including asset finance
(aircraft and railcar leasing), subscription finance,*1 and middle
market LBO*2.
We will also pursue an O&D*3 business model to further enhance
the asset and capital efficiencies of its portfolio and solidify our
top-tier position in the industry.
*1 Subscription finance: Bridge finance provided, for example, to real estate funds*2 LBO (leveraged buyout): An M&A method used, for example, by private equity
funds*3 O&D: Origination and distribution
34 2017 Annual Report
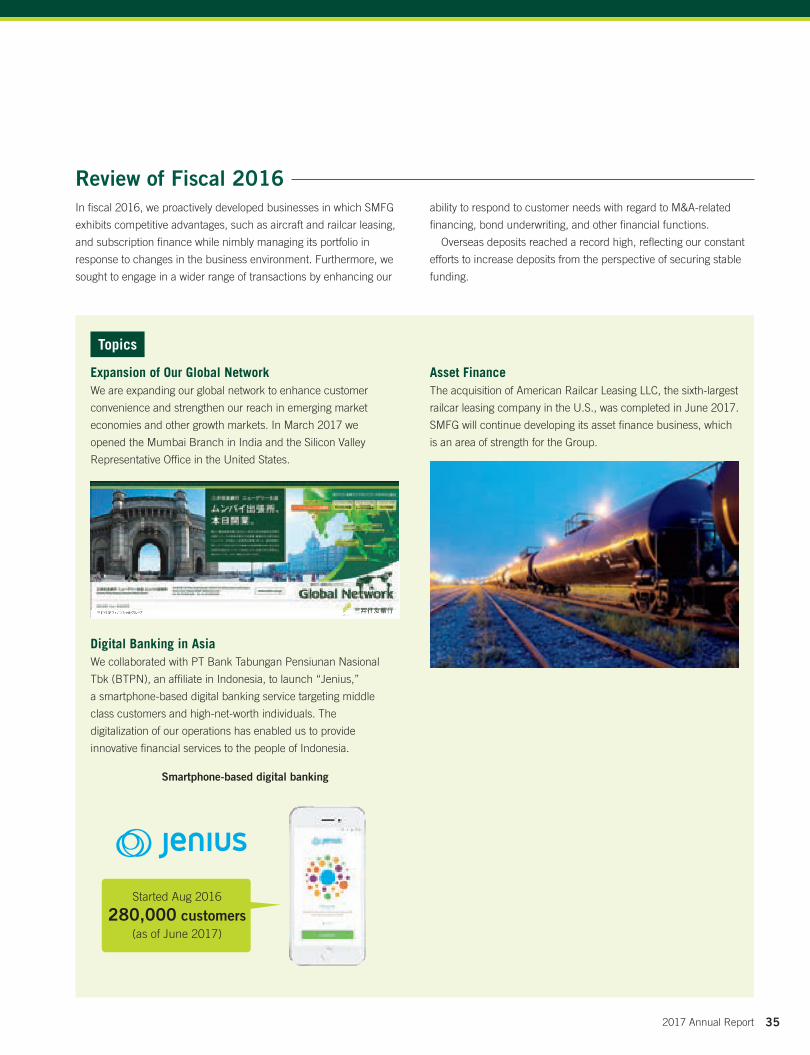
Review of Fiscal 2016In fiscal 2016, we proactively developed businesses in which SMFG
exhibits competitive advantages, such as aircraft and railcar leasing,
and subscription finance while nimbly managing its portfolio in
response to changes in the business environment. Furthermore, we
sought to engage in a wider range of transactions by enhancing our
ability to respond to customer needs with regard to M&A-related
financing, bond underwriting, and other financial functions.
Overseas deposits reached a record high, reflecting our constant
efforts to increase deposits from the perspective of securing stable
funding.
Expansion of Our Global NetworkWe are expanding our global network to enhance customer
convenience and strengthen our reach in emerging market
economies and other growth markets. In March 2017 we
opened the Mumbai Branch in India and the Silicon Valley
Representative Office in the United States.
Digital Banking in AsiaWe collaborated with PT Bank Tabungan Pensiunan Nasional
Tbk (BTPN), an affiliate in Indonesia, to launch “Jenius,”
a smartphone-based digital banking service targeting middle
class customers and high-net-worth individuals. The
digitalization of our operations has enabled us to provide
innovative financial services to the people of Indonesia.
Smartphone-based digital banking
Asset FinanceThe acquisition of American Railcar Leasing LLC, the sixth-largest
railcar leasing company in the U.S., was completed in June 2017.
SMFG will continue developing its asset finance business, which
is an area of strength for the Group.
Topics
Started Aug 2016
280,000 customers(as of June 2017)
352017 Annual Report
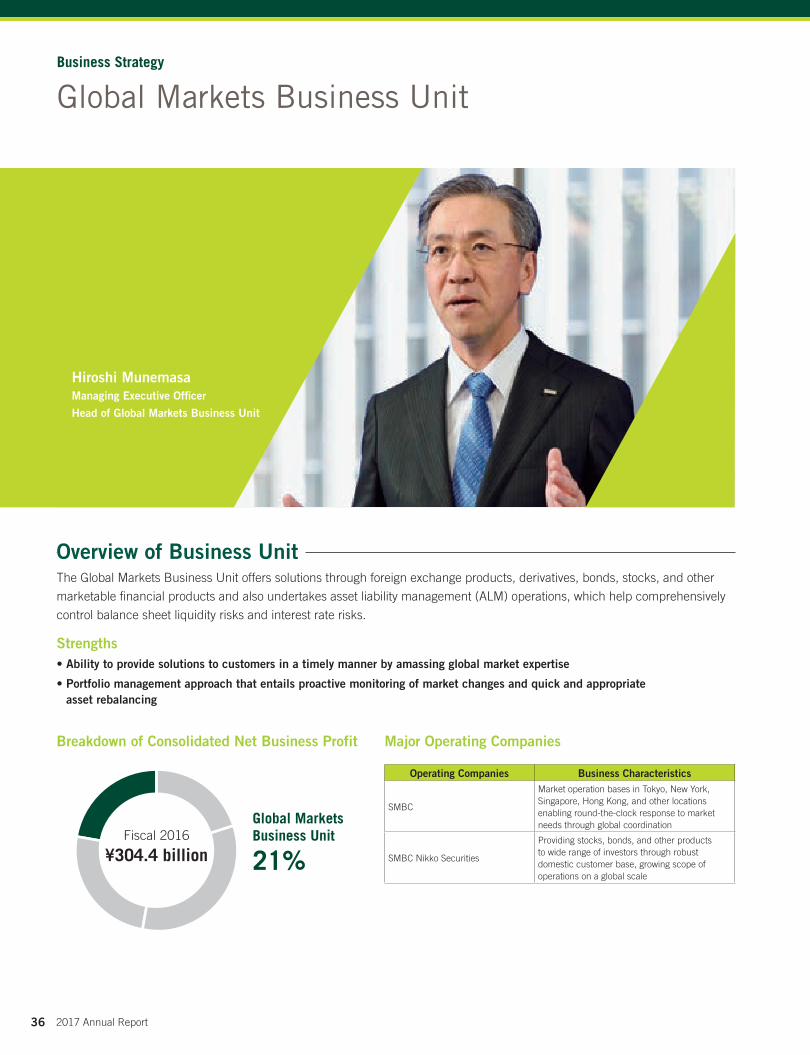
Hiroshi MunemasaManaging Executive Officer
Head of Global Markets Business Unit
The Global Markets Business Unit offers solutions through foreign exchange products, derivatives, bonds, stocks, and other
marketable financial products and also undertakes asset liability management (ALM) operations, which help comprehensively
control balance sheet liquidity risks and interest rate risks.
Overview of Business Unit
Major Operating Companies
Operating Companies Business Characteristics
SMBC
Market operation bases in Tokyo, New York, Singapore, Hong Kong, and other locations enabling round-the-clock response to market needs through global coordination
SMBC Nikko Securities
Providing stocks, bonds, and other products to wide range of investors through robust domestic customer base, growing scope of operations on a global scale
Breakdown of Consolidated Net Business Profit
Global Markets Business Unit
21%Fiscal 2016
¥304.4 billion
Strengths• Ability to provide solutions to customers in a timely manner by amassing global market expertise
• Portfolio management approach that entails proactive monitoring of market changes and quick and appropriate asset rebalancing
Global Markets Business UnitBusiness Strategy
36 2017 Annual Report
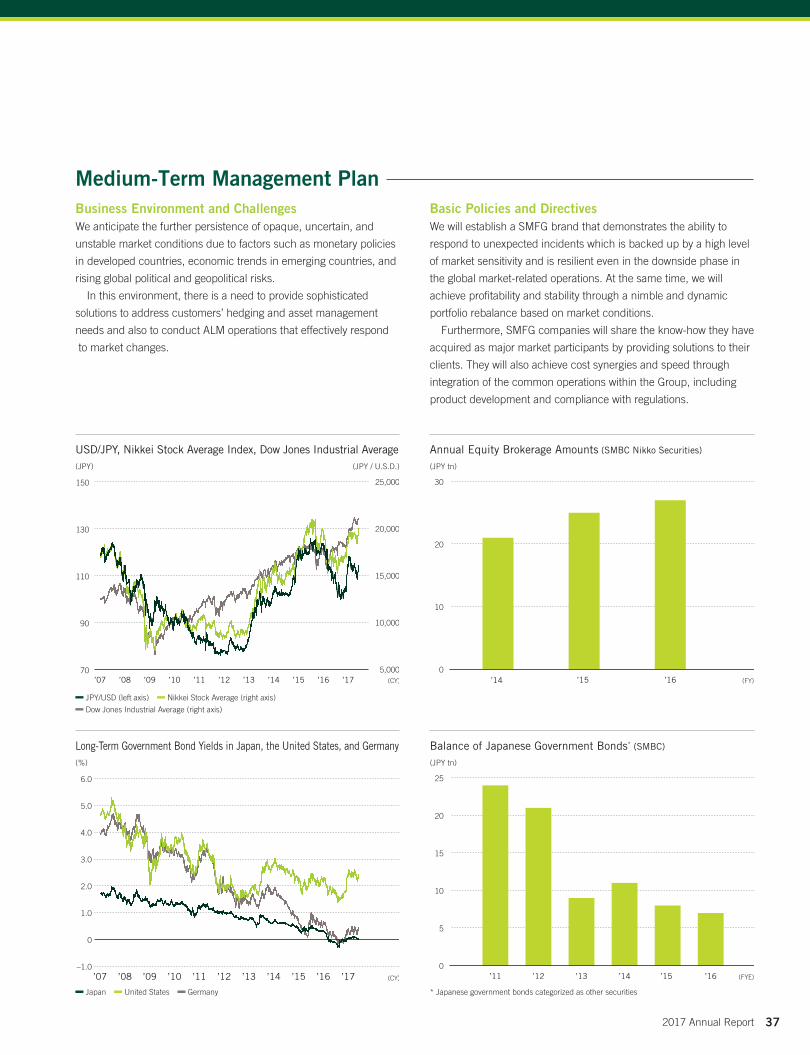
70
90
110
130
150
5,000
10,000
15,000
20,000
25,000
’17’16’15’14’13’12’11’10’09’08’07 (CY) ’16’15’140
10
20
30
(FY)
USD/JPY, Nikkei Stock Average Index, Dow Jones Industrial Average(JPY) (JPY / U.S.D.)
Annual Equity Brokerage Amounts (SMBC Nikko Securities)
(JPY tn)
Long-Term Government Bond Yields in Japan, the United States, and Germany(%)
Balance of Japanese Government Bonds* (SMBC)
(JPY tn)
’17’16’15’14’13’12’11’10’09’08’07–1.0
0
1.0
2.0
3.0
4.0
5.0
6.0
(CY) ’16’15’14’13’12’110
5
10
15
20
25
(FYE)
JPY/USD (left axis) Nikkei Stock Average (right axis)
Dow Jones Industrial Average (right axis)
* Japanese government bonds categorized as other securities Japan United States Germany
Medium-Term Management PlanBusiness Environment and ChallengesWe anticipate the further persistence of opaque, uncertain, and
unstable market conditions due to factors such as monetary policies
in developed countries, economic trends in emerging countries, and
rising global political and geopolitical risks.
In this environment, there is a need to provide sophisticated
solutions to address customers’ hedging and asset management
needs and also to conduct ALM operations that effectively respond
to market changes.
Basic Policies and DirectivesWe will establish a SMFG brand that demonstrates the ability to
respond to unexpected incidents which is backed up by a high level
of market sensitivity and is resilient even in the downside phase in
the global market-related operations. At the same time, we will
achieve profitability and stability through a nimble and dynamic
portfolio rebalance based on market conditions.
Furthermore, SMFG companies will share the know-how they have
acquired as major market participants by providing solutions to their
clients. They will also achieve cost synergies and speed through
integration of the common operations within the Group, including
product development and compliance with regulations.
372017 Annual Report
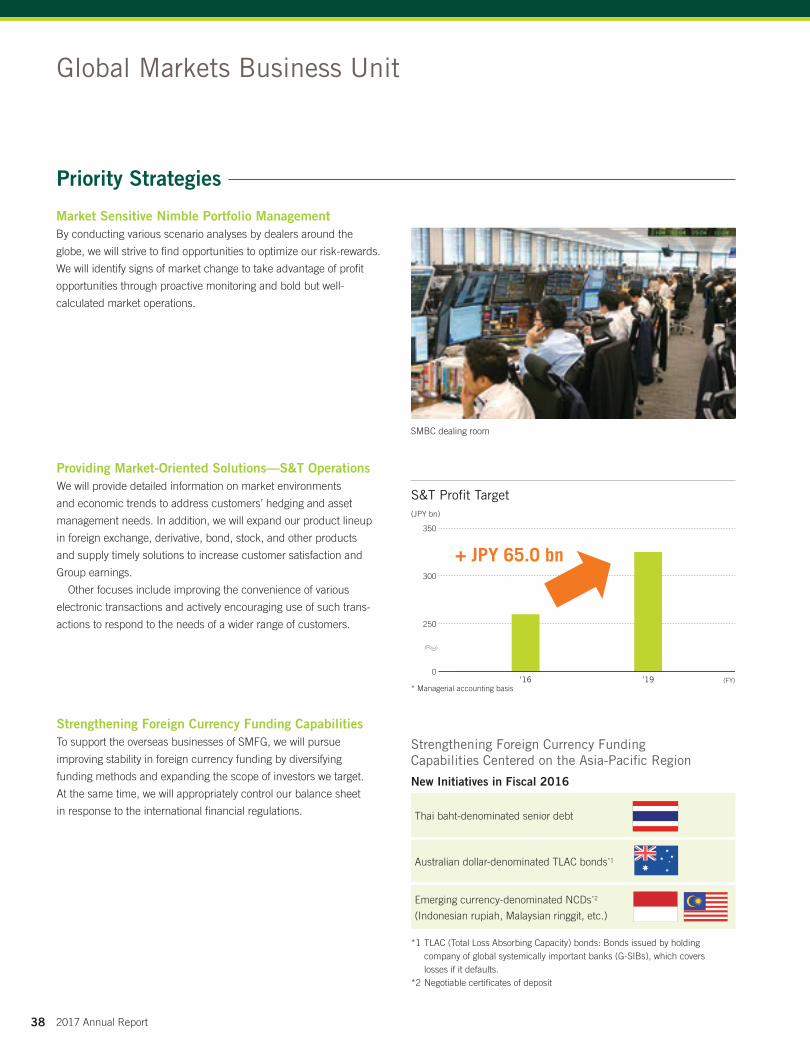
350
300
250
0’16 ’19 (FY)
SMBC dealing room
S&T Profit Target(JPY bn)
* Managerial accounting basis
+ JPY 65.0 bn
Strengthening Foreign Currency Funding Capabilities Centered on the Asia-Pacific Region
New Initiatives in Fiscal 2016
Thai baht-denominated senior debt
Australian dollar-denominated TLAC bonds*1
Emerging currency-denominated NCDs*2
(Indonesian rupiah, Malaysian ringgit, etc.)
*1 TLAC (Total Loss Absorbing Capacity) bonds: Bonds issued by holding company of global systemically important banks (G-SIBs), which covers losses if it defaults.
*2 Negotiable certificates of deposit
Priority Strategies
Market Sensitive Nimble Portfolio ManagementBy conducting various scenario analyses by dealers around the
globe, we will strive to find opportunities to optimize our risk-rewards.
We will identify signs of market change to take advantage of profit
opportunities through proactive monitoring and bold but well-
calculated market operations.
Strengthening Foreign Currency Funding CapabilitiesTo support the overseas businesses of SMFG, we will pursue
improving stability in foreign currency funding by diversifying
funding methods and expanding the scope of investors we target.
At the same time, we will appropriately control our balance sheet
in response to the international financial regulations.
Providing Market-Oriented Solutions—S&T OperationsWe will provide detailed information on market environments
and economic trends to address customers’ hedging and asset
management needs. In addition, we will expand our product lineup
in foreign exchange, derivative, bond, stock, and other products
and supply timely solutions to increase customer satisfaction and
Group earnings.
Other focuses include improving the convenience of various
electronic transactions and actively encouraging use of such trans-
actions to respond to the needs of a wider range of customers.
Global Markets Business Unit
38 2017 Annual Report
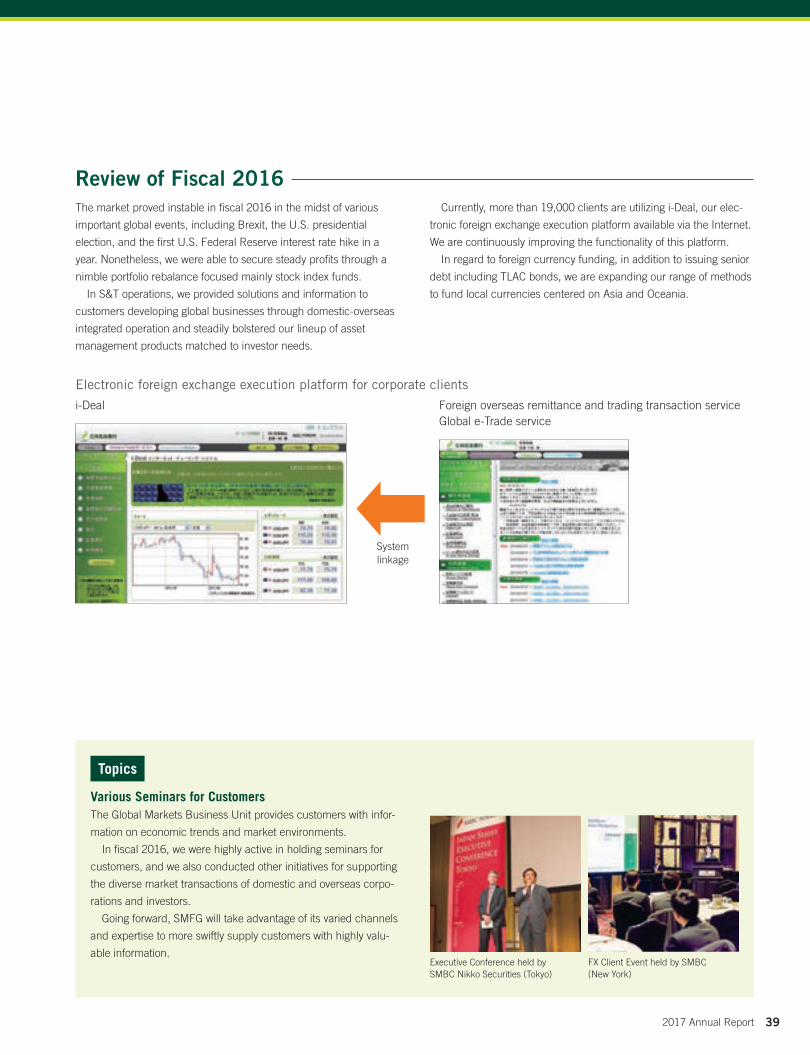
Executive Conference held by SMBC Nikko Securities (Tokyo)
i-Deal Foreign overseas remittance and trading transaction serviceGlobal e-Trade service
FX Client Event held by SMBC (New York)
Electronic foreign exchange execution platform for corporate clients
Review of Fiscal 2016The market proved instable in fiscal 2016 in the midst of various
important global events, including Brexit, the U.S. presidential
election, and the first U.S. Federal Reserve interest rate hike in a
year. Nonetheless, we were able to secure steady profits through a
nimble portfolio rebalance focused mainly stock index funds.
In S&T operations, we provided solutions and information to
customers developing global businesses through domestic-overseas
integrated operation and steadily bolstered our lineup of asset
management products matched to investor needs.
Currently, more than 19,000 clients are utilizing i-Deal, our elec-
tronic foreign exchange execution platform available via the Internet.
We are continuously improving the functionality of this platform.
In regard to foreign currency funding, in addition to issuing senior
debt including TLAC bonds, we are expanding our range of methods
to fund local currencies centered on Asia and Oceania.
Various Seminars for CustomersThe Global Markets Business Unit provides customers with infor-
mation on economic trends and market environments.
In fiscal 2016, we were highly active in holding seminars for
customers, and we also conducted other initiatives for supporting
the diverse market transactions of domestic and overseas corpo-
rations and investors.
Going forward, SMFG will take advantage of its varied channels
and expertise to more swiftly supply customers with highly valu-
able information.
Topics
System linkage
392017 Annual Report
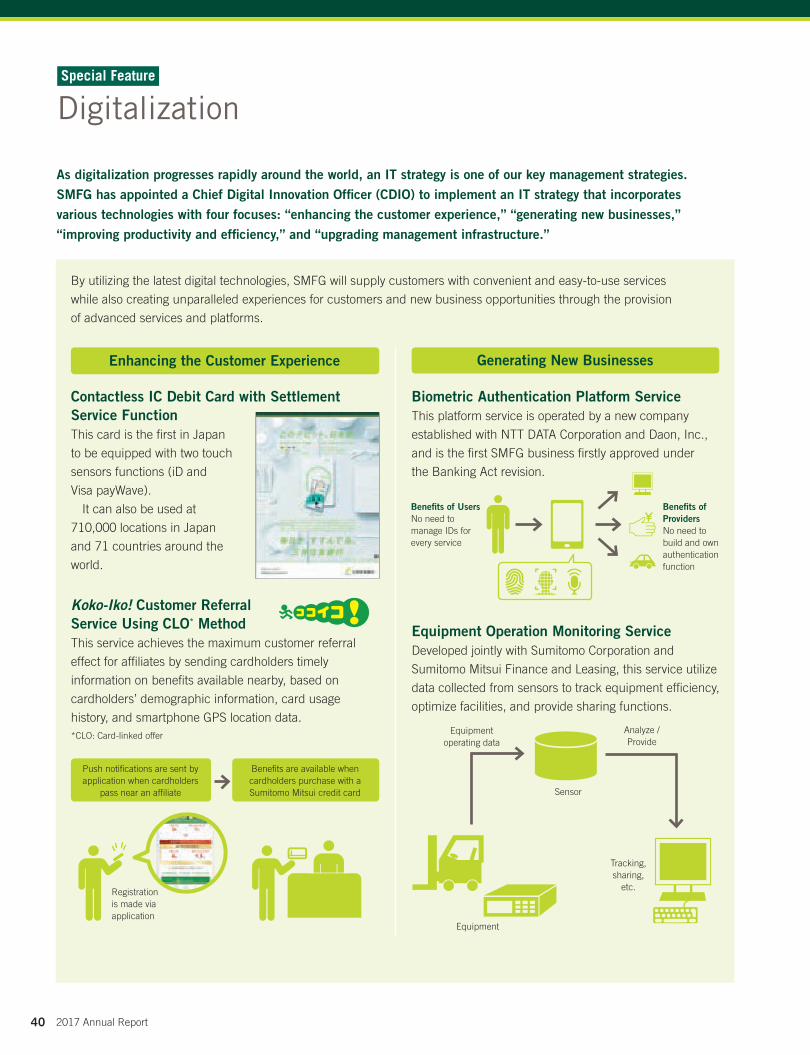
By utilizing the latest digital technologies, SMFG will supply customers with convenient and easy-to-use services
while also creating unparalleled experiences for customers and new business opportunities through the provision
of advanced services and platforms.
Equipment Operation Monitoring ServiceDeveloped jointly with Sumitomo Corporation and
Sumitomo Mitsui Finance and Leasing, this service utilize
data collected from sensors to track equipment efficiency,
optimize facilities, and provide sharing functions.
As digitalization progresses rapidly around the world, an IT strategy is one of our key management strategies. SMFG has appointed a Chief Digital Innovation Officer (CDIO) to implement an IT strategy that incorporates various technologies with four focuses: “enhancing the customer experience,” “generating new businesses,” “improving productivity and efficiency,” and “upgrading management infrastructure.”
Enhancing the Customer Experience Generating New Businesses
Contactless IC Debit Card with Settlement Service FunctionThis card is the first in Japan
to be equipped with two touch
sensors functions (iD and
Visa payWave).
It can also be used at
710,000 locations in Japan
and 71 countries around the
world.
Biometric Authentication Platform ServiceThis platform service is operated by a new company
established with NTT DATA Corporation and Daon, Inc.,
and is the first SMFG business firstly approved under
the Banking Act revision.
Benefits of UsersNo need to manage IDs for every service
Benefits of ProvidersNo need to build and own authentication function
Koko-Iko! Customer Referral Service Using CLO* MethodThis service achieves the maximum customer referral
effect for affiliates by sending cardholders timely
information on benefits available nearby, based on
cardholders’ demographic information, card usage
history, and smartphone GPS location data.*CLO: Card-linked offer
Sensor
Equipment
Analyze / Provide
Tracking, sharing,
etc.
Equipment operating data
Push notifications are sent by application when cardholders
pass near an affiliate
Benefits are available when cardholders purchase with a Sumitomo Mitsui credit card
Registration is made via application
DigitalizationSpecial Feature
40 2017 Annual Report
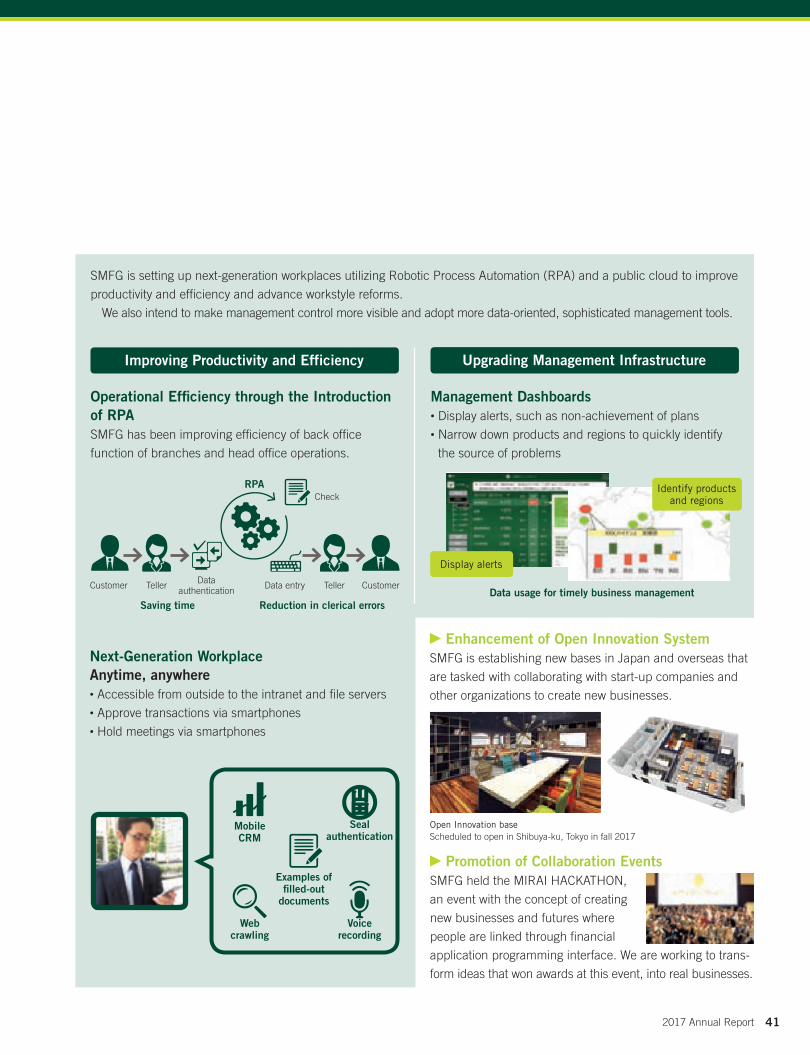
SMFG is setting up next-generation workplaces utilizing Robotic Process Automation (RPA) and a public cloud to improve
productivity and efficiency and advance workstyle reforms.
We also intend to make management control more visible and adopt more data-oriented, sophisticated management tools.
Open Innovation baseScheduled to open in Shibuya-ku, Tokyo in fall 2017
Improving Productivity and Efficiency Upgrading Management Infrastructure
Operational Efficiency through the Introduction of RPASMFG has been improving efficiency of back office
function of branches and head office operations.
RPA
Customer CustomerTeller TellerData entry
Check
Data authentication
Saving time Reduction in clerical errors
Management Dashboards• Display alerts, such as non-achievement of plans• Narrow down products and regions to quickly identify
the source of problems
Display alerts
Identify products and regions
Data usage for timely business management
Next-Generation WorkplaceAnytime, anywhere• Accessible from outside to the intranet and file servers• Approve transactions via smartphones • Hold meetings via smartphones
Enhancement of Open Innovation SystemSMFG is establishing new bases in Japan and overseas that
are tasked with collaborating with start-up companies and
other organizations to create new businesses.
Promotion of Collaboration EventsSMFG held the MIRAI HACKATHON,
an event with the concept of creating
new businesses and futures where
people are linked through financial
application programming interface. We are working to trans-
form ideas that won awards at this event, into real businesses.
Mobile CRM
Web crawling
Seal authentication
Voice recording
Examples of filled-out
documents
412017 Annual Report
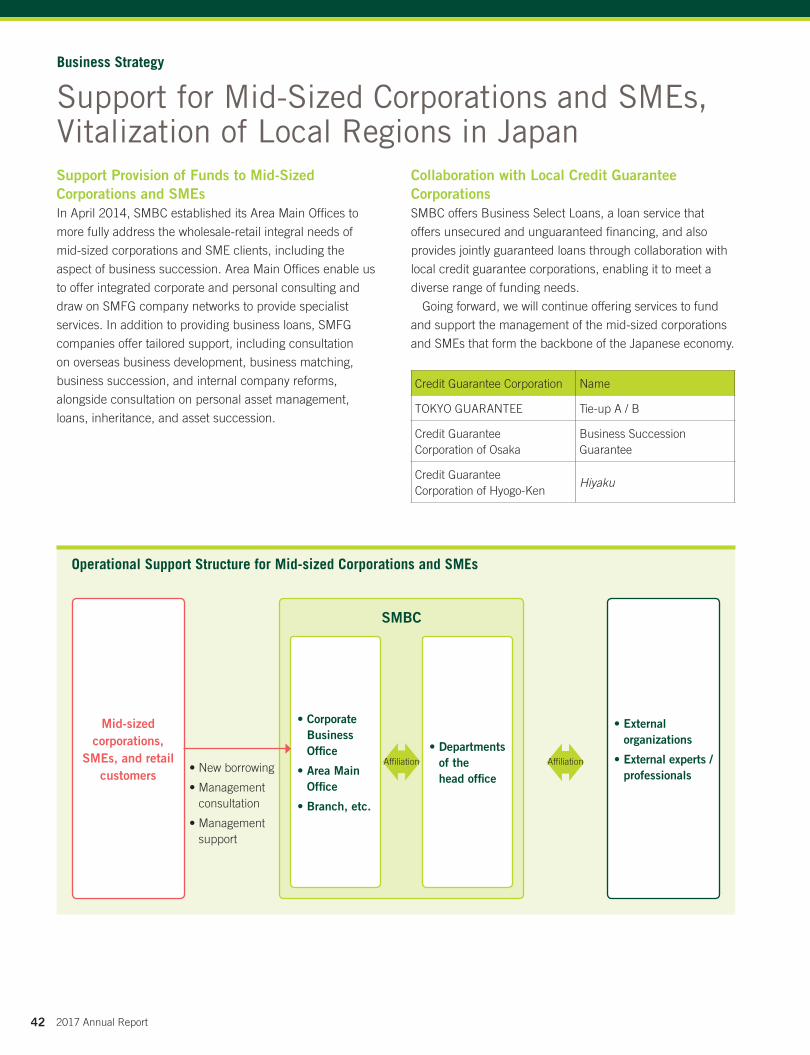
Operational Support Structure for Mid-sized Corporations and SMEs
Support Provision of Funds to Mid-Sized Corporations and SMEsIn April 2014, SMBC established its Area Main Offices to
more fully address the wholesale-retail integral needs of
mid-sized corporations and SME clients, including the
aspect of business succession. Area Main Offices enable us
to offer integrated corporate and personal consulting and
draw on SMFG company networks to provide specialist
services. In addition to providing business loans, SMFG
companies offer tailored support, including consultation
on overseas business development, business matching,
business succession, and internal company reforms,
alongside consultation on personal asset management,
loans, inheritance, and asset succession.
Collaboration with Local Credit Guarantee CorporationsSMBC offers Business Select Loans, a loan service that
offers unsecured and unguaranteed financing, and also
provides jointly guaranteed loans through collaboration with
local credit guarantee corporations, enabling it to meet a
diverse range of funding needs.
Going forward, we will continue offering services to fund
and support the management of the mid-sized corporations
and SMEs that form the backbone of the Japanese economy.
Credit Guarantee Corporation Name
TOKYO GUARANTEE Tie-up A / B
Credit Guarantee Corporation of Osaka
Business Succession Guarantee
Credit Guarantee Corporation of Hyogo-Ken
Hiyaku
Mid-sized corporations,
SMEs, and retail customers
• External organizations
• External experts / professionals
• New borrowing
• Management consultation
• Management support
SMBC
• Departments of the head office
• Corporate Business Office
• Area Main Office
• Branch, etc.
Affiliation Affiliation
Support for Mid-Sized Corporations and SMEs, Vitalization of Local Regions in Japan
Business Strategy
42 2017 Annual Report
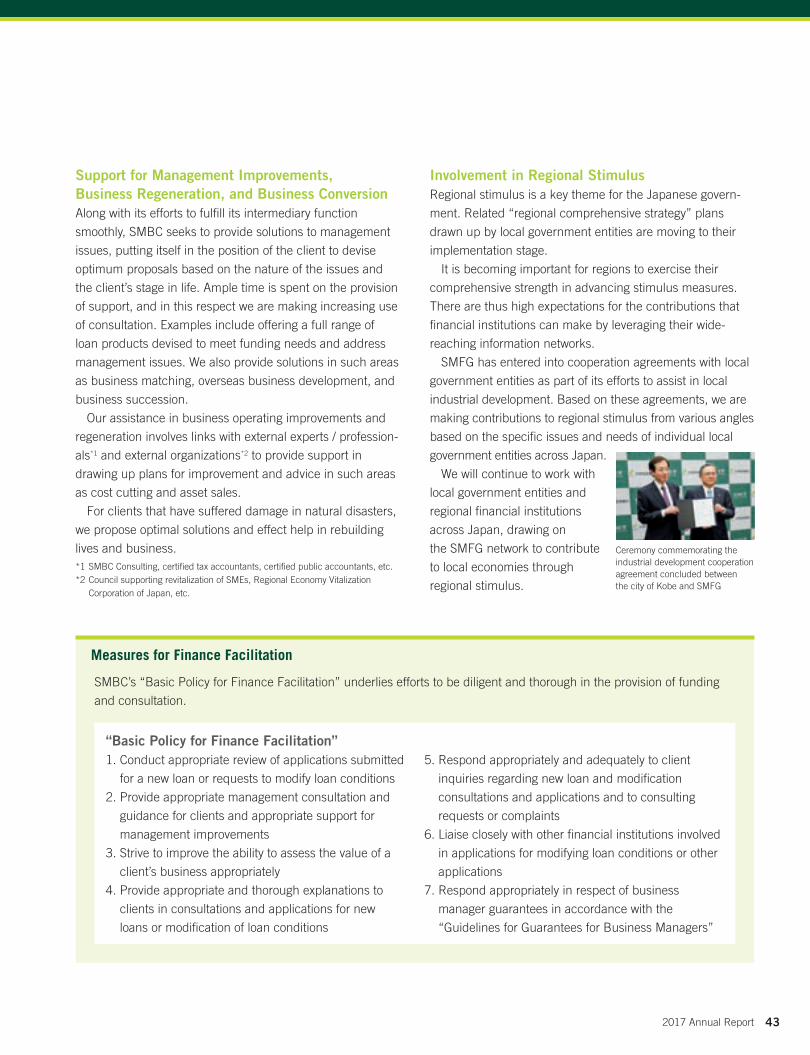
Support for Management Improvements, Business Regeneration, and Business ConversionAlong with its efforts to fulfill its intermediary function
smoothly, SMBC seeks to provide solutions to management
issues, putting itself in the position of the client to devise
optimum proposals based on the nature of the issues and
the client’s stage in life. Ample time is spent on the provision
of support, and in this respect we are making increasing use
of consultation. Examples include offering a full range of
loan products devised to meet funding needs and address
management issues. We also provide solutions in such areas
as business matching, overseas business development, and
business succession.
Our assistance in business operating improvements and
regeneration involves links with external experts / profession-
als*1 and external organizations*2 to provide support in
drawing up plans for improvement and advice in such areas
as cost cutting and asset sales.
For clients that have suffered damage in natural disasters,
we propose optimal solutions and effect help in rebuilding
lives and business.*1 SMBC Consulting, certified tax accountants, certified public accountants, etc.*2 Council supporting revitalization of SMEs, Regional Economy Vitalization
Corporation of Japan, etc.
Involvement in Regional StimulusRegional stimulus is a key theme for the Japanese govern-
ment. Related “regional comprehensive strategy” plans
drawn up by local government entities are moving to their
implementation stage.
It is becoming important for regions to exercise their
comprehensive strength in advancing stimulus measures.
There are thus high expectations for the contributions that
financial institutions can make by leveraging their wide-
reaching information networks.
SMFG has entered into cooperation agreements with local
government entities as part of its efforts to assist in local
industrial development. Based on these agreements, we are
making contributions to regional stimulus from various angles
based on the specific issues and needs of individual local
government entities across Japan.
We will continue to work with
local government entities and
regional financial institutions
across Japan, drawing on
the SMFG network to contribute
to local economies through
regional stimulus.
Measures for Finance Facilitation
SMBC’s “Basic Policy for Finance Facilitation” underlies efforts to be diligent and thorough in the provision of funding
and consultation.
“Basic Policy for Finance Facilitation”1. Conduct appropriate review of applications submitted
for a new loan or requests to modify loan conditions
2. Provide appropriate management consultation and
guidance for clients and appropriate support for
management improvements
3. Strive to improve the ability to assess the value of a
client’s business appropriately
4. Provide appropriate and thorough explanations to
clients in consultations and applications for new
loans or modification of loan conditions
5. Respond appropriately and adequately to client
inquiries regarding new loan and modification
consultations and applications and to consulting
requests or complaints
6. Liaise closely with other financial institutions involved
in applications for modifying loan conditions or other
applications
7. Respond appropriately in respect of business
manager guarantees in accordance with the
“Guidelines for Guarantees for Business Managers”
Ceremony commemorating the industrial development cooperation agreement concluded between the city of Kobe and SMFG
432017 Annual Report
46 Corporate Governance
48 Outside Director Interview
50 SMFG Directors
52 Risk Management
56 Compliance
58 Internal Audit System
59 Customer Satisfaction (CS) and
Quality Improvement
60 Human Resources
62 Corporate Social Responsibility (CSR)
66 Financial Review
Corporate Infrastructure
44 2017 Annual Report
452017 Annual Report
Board of DirectorsBusiness execution decisions +
Oversight of directors’ execution of duties
Board of DirectorsFocus on supervision of executive officers’
and directors’ execution of duties
Reporting line (including
personnel right of consent)
Management Committee(Inside directors + Executive officers)
Management CommitteeBusiness execution decisions*
Departments Departments Internal Audit Dept. Internal Audit Dept.
Internal Committees (Voluntarily)
Nominating Committee
Risk Committee
Compensation Committee
Audit Committee
Internal Committees (Mandatory)
Nomination Committee
(Voluntarily)
Risk Committee
Compensation Committee
Audit Committee
Board of Corporate Auditors
Link
Transition to a Company with Three Statutory Committees
SMFG had previously employed a board of corporate auditors governance system. In order to further enhance our
solid corporate governance system, we transitioned to a company with three statutory committees, which is globally
recognized and is aligned with international banking regulations and supervision, following approval at our ordinary
general meeting of shareholders held on June 29, 2017.
June 2017
* Excludes areas designated by laws and ordinances as the jurisdiction of the Board of Directors
Our Basic Position on Corporate GovernanceWe are working to improve the effectiveness of corporate
governance as we consider the strengthening and enhance-
ment of corporate governance to be one of our top priorities
in realizing “Our mission.” Further, SMFG has established
its “SMFG Corporate Governance Guideline” as its action
guidelines to be referred to for corporate governance by
Group officers and employees.
Please follow the link below for the SMFG Corporate
Governance Guideline.
http://www.smfg.co.jp/english/aboutus/pdf/cg_guideline_e.pdf
SMFG’s Corporate Governance SystemSMFG transitioned to a company with three statutory
committees from a company with a board of corporate
auditors, following approval at our ordinary general meeting
of shareholders held on June 29, 2017. The following
corporate governance system was adopted as a result.
Board of DirectorsThe Board of Directors delegates a large portion of decisions
on the execution of the operations to corporate executive
officers, excluding those issues legally required to be
decided by the Board of Directors, thereby enabling it to
better focus on supervising the exercise of duties by execu-
tive officers and directors. The chairman of SMFG, who does
Corporate Infrastructure
Corporate Governance
46 2017 Annual Report
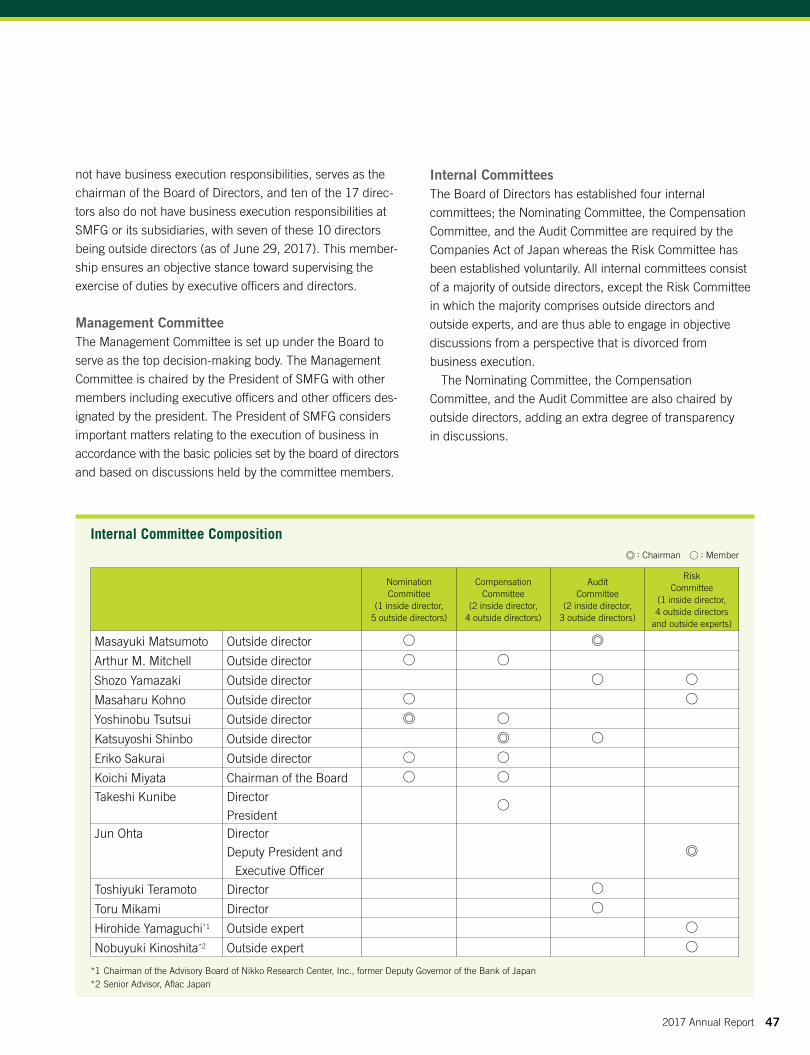
: Chairman : Member
Nomination Committee
(1 inside director,5 outside directors)
Compensation Committee
(2 inside director,4 outside directors)
Audit Committee
(2 inside director,3 outside directors)
Risk Committee
(1 inside director,4 outside directors
and outside experts)
Masayuki Matsumoto Outside director
Arthur M. Mitchell Outside director
Shozo Yamazaki Outside director
Masaharu Kohno Outside director
Yoshinobu Tsutsui Outside director
Katsuyoshi Shinbo Outside director
Eriko Sakurai Outside director
Koichi Miyata Chairman of the Board
Takeshi Kunibe Director
PresidentJun Ohta Director
D eputy President and
Executive Officer
Toshiyuki Teramoto Director
Toru Mikami Director
Hirohide Yamaguchi*1 Outside expert
Nobuyuki Kinoshita*2 Outside expert
*1 Chairman of the Advisory Board of Nikko Research Center, Inc., former Deputy Governor of the Bank of Japan*2 Senior Advisor, Aflac Japan
Internal Committee Composition
not have business execution responsibilities, serves as the
chairman of the Board of Directors, and ten of the 17 direc-
tors also do not have business execution responsibilities at
SMFG or its subsidiaries, with seven of these 10 directors
being outside directors (as of June 29, 2017). This member-
ship ensures an objective stance toward supervising the
exercise of duties by executive officers and directors.
Management CommitteeThe Management Committee is set up under the Board to
serve as the top decision-making body. The Management
Committee is chaired by the President of SMFG with other
members including executive officers and other officers des-
ignated by the president. The President of SMFG considers
important matters relating to the execution of business in
accordance with the basic policies set by the board of directors
and based on discussions held by the committee members.
Internal CommitteesThe Board of Directors has established four internal
committees; the Nominating Committee, the Compensation
Committee, and the Audit Committee are required by the
Companies Act of Japan whereas the Risk Committee has
been established voluntarily. All internal committees consist
of a majority of outside directors, except the Risk Committee
in which the majority comprises outside directors and
outside experts, and are thus able to engage in objective
discussions from a perspective that is divorced from
business execution.
The Nominating Committee, the Compensation
Committee, and the Audit Committee are also chaired by
outside directors, adding an extra degree of transparency
in discussions.
472017 Annual Report
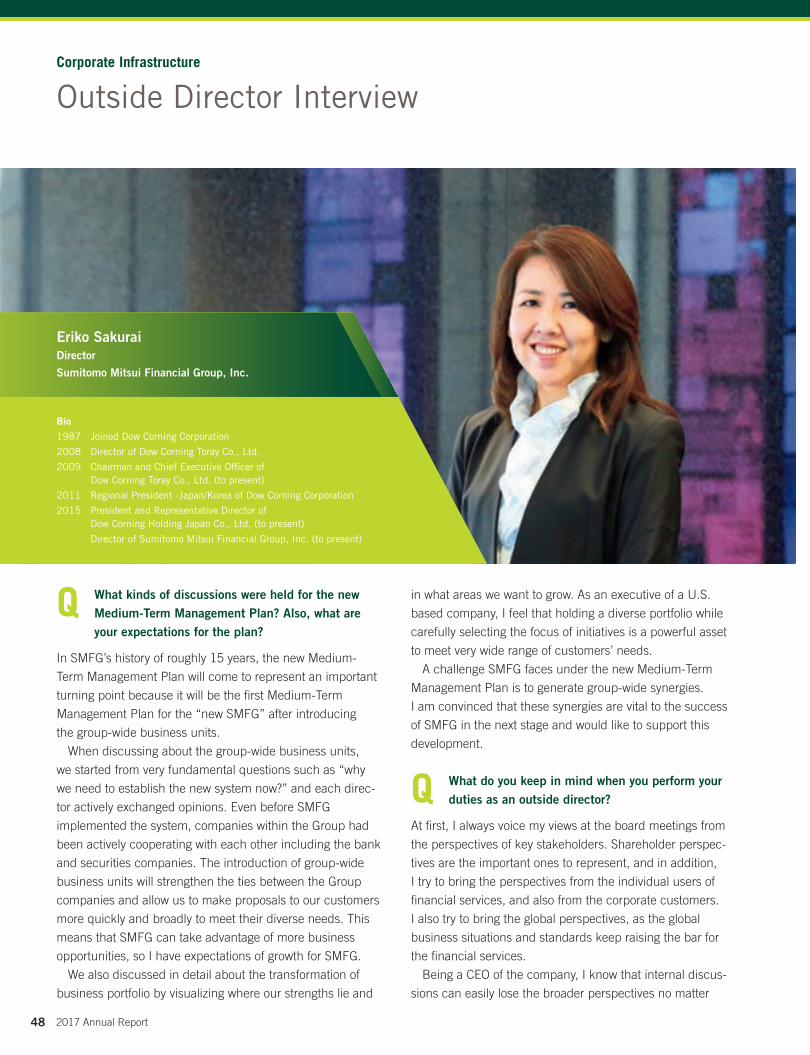
Bio
1987 Joined Dow Corning Corporation
2008 Director of Dow Corning Toray Co., Ltd.
2009 Chairman and Chief Executive Officer of Dow Corning Toray Co., Ltd. (to present)
2011 Regional President -Japan/Korea of Dow Corning Corporation
2015 President and Representative Director of Dow Corning Holding Japan Co., Ltd. (to present)
Director of Sumitomo Mitsui Financial Group, Inc. (to present)
Eriko SakuraiDirector
Sumitomo Mitsui Financial Group, Inc.
What kinds of discussions were held for the new Medium-Term Management Plan? Also, what are your expectations for the plan?
In SMFG’s history of roughly 15 years, the new Medium-
Term Management Plan will come to represent an important
turning point because it will be the first Medium-Term
Management Plan for the “new SMFG” after introducing
the group-wide business units.
When discussing about the group-wide business units,
we started from very fundamental questions such as “why
we need to establish the new system now?” and each direc-
tor actively exchanged opinions. Even before SMFG
implemented the system, companies within the Group had
been actively cooperating with each other including the bank
and securities companies. The introduction of group-wide
business units will strengthen the ties between the Group
companies and allow us to make proposals to our customers
more quickly and broadly to meet their diverse needs. This
means that SMFG can take advantage of more business
opportunities, so I have expectations of growth for SMFG.
We also discussed in detail about the transformation of
business portfolio by visualizing where our strengths lie and
Q in what areas we want to grow. As an executive of a U.S.
based company, I feel that holding a diverse portfolio while
carefully selecting the focus of initiatives is a powerful asset
to meet very wide range of customers’ needs.
A challenge SMFG faces under the new Medium-Term
Management Plan is to generate group-wide synergies.
I am convinced that these synergies are vital to the success
of SMFG in the next stage and would like to support this
development.
What do you keep in mind when you perform your duties as an outside director?
At first, I always voice my views at the board meetings from
the perspectives of key stakeholders. Shareholder perspec-
tives are the important ones to represent, and in addition,
I try to bring the perspectives from the individual users of
financial services, and also from the corporate customers.
I also try to bring the global perspectives, as the global
business situations and standards keep raising the bar for
the financial services.
Being a CEO of the company, I know that internal discus-
sions can easily lose the broader perspectives no matter
Q
Corporate Infrastructure
Outside Director Interview
48 2017 Annual Report

what we make efforts. That's why outside directors can
bring the value to the discussion table, by asking the right
questions – sometimes very simple and fundamental ques-
tions. Even though the end result could be the same, the
important thing is that we have enough discussions from the
broader perspectives, and confirm our visions and strategies
make sense to our business and to our stakeholders. We
never hesitated to ask, and we will never.
Second is to continue learning. When I first assumed the
position of outside director, my image towards SMFG was
very limited. I had a strong image of SMFG being a “Bank”
and being “domestic”. And with this limited view, I would not
have been able to fulfill my duties as an outside director. By
given the opportunity to talk to the top management of the
Group companies and the heads of business units, I was
able to learn that SMFG is operating in an incredibly broad
range of fields on a global basis. I am thus very grateful that
everyone at SMFG has been very open and providing infor-
mation to me. Furthermore, as an individual, I try to hold a
customer’s perspective, by trying out SMFG’s services and
smartphone applications.
In June 2017, SMFG transformed into a Company with
Three Committees from a Company with a Board of Corpo-
rate Auditors. This move did not represent a significant
change because SMFG was already managed under a gov-
ernance framework with discretionary internal committees
and independent outside directors. However, as the new
framework separates functions of “business execution” and
“supervision” more clearly, outside directors are now
expected to discuss decisions related to business execution
from a broader and more overarching perspective. There-
fore, I feel a renewed commitment to my role, recognizing
that I need to deepen my own insight.
What do you think will be most important to increase the corporate value of SMFG going forward?
I believe human resources are the origins of SMFG’s
corporate value. Of course, human resources are also
important in the manufacturing industry. However, the
more I learn about the financial industry, including the very
strict regulations it faces and the difficultly in developing
prominent innovation, the more it became apparent that
“cultivating human resources” is the key to differentiation.
I believe it is crucial that our customers feel that they
Q
worked with highly competent people and would want to
work with them again.
In my more than two years of experience as an outside
director at SMFG, I have learned that the Group houses
countless ambitious employees, who are sensible, intelligent
and have the desire to contribute to society. At the same
time, I have heard from global companies giving praise to
SMFG for its speed and superior teamwork. Building upon
these strengths to steadily create results from both financial
and non-financial perspectives will, in the end, enable
SMFG to grow profits and contribute to society. I believe
this process will also improve SMFG’s corporate value
and encourage shareholders to become long-term fans
of the Group.
Therefore, as an outside director, I would like to ensure
SMFG provides a working environment that motivates its
employees and an environment where they can fully exer-
cise their talents and generate various ideas, by offering
advice when necessary.
Support System for Outside Directors
SMFG views outside directors as representatives of
various stakeholders including shareholders, and
assign individuals that has a broad-ranging insight
and plentiful experience from their endeavors in
various fields.
SMFG expects outside directors to offer advice based
on their insight that contributes to the sustainable
growth and the increase of corporate value of SMFG.
Outside directors are regularly provided with opportuni-
ties to learn from external lecturers and share views
with officers to ensure that they are able to fulfill their
role and carry out their duties in an effective manner.
In addition, study sessions are held for new outside
directors on subjects such as company profile, business
plans and medium-term management plan, corporate
governance, and overview of major business units.
492017 Annual Report
Jun OhtaDirector
Deputy President and Executive Officer (Representative Executive Officer) Group CFO, Group CSO and Group CDIO
Koichi MiyataChairman of the Board
Chairman of the Board at SMBC
Katsunori TanizakiDirector
Senior Managing Executive Officer Group CIO
Director and Senior Managing Executive Officer at SMBC
Director at The Japan Research Institute, Limited
Takeshi KunibeDirector
President (Representative Executive Officer) and Group CEO
Toshikazu YakuDirector
Senior Managing Executive Officer Group CCO and Group CHRO
Director and Senior Managing Executive Officer at SMBC
Makoto TakashimaDirector
President and CEO at SMBC
Tetsuya Kubo Director
Representative Director-Chairman of SMBC Nikko Securities Inc.
Kozo Ogino Director
Deputy President and Executive Officer Group CRO
Director and Deputy President at SMBC
Toru Mikami Director
Toshiyuki TeramotoDirector
Corporate Auditor at SMBC
Corporate Infrastructure
SMFG Directors (As of June 29, 2017)
50 2017 Annual Report

Please see page 99 for SMBC directors and corporate auditors.
Masayuki MatsumotoDirector
Special Advisor of the Central Japan Railway Company
Arthur M. MitchellDirector
Attorney at law, admitted in New York, the U.S.A.
Foreign Attorney in Japan
Eriko SakuraiDirector
Chairman and Chief Executive Officer of Dow Corning Toray Co., Ltd.
Katsuyoshi ShinboDirector
Attorney at law
Masaharu KohnoDirector
Former diplomat
Shozo YamazakiDirector
Certified public accountant
Note: Messrs. and Ms. Matsumoto, Mitchell, Yamazaki, Kohno, Tsutsui, Shinbo and Sakurai satisfy the requirements for an “outside director” under the Companies Act.
Yoshinobu TsutsuiDirector
President of Nippon Life Insurance Company
512017 Annual Report
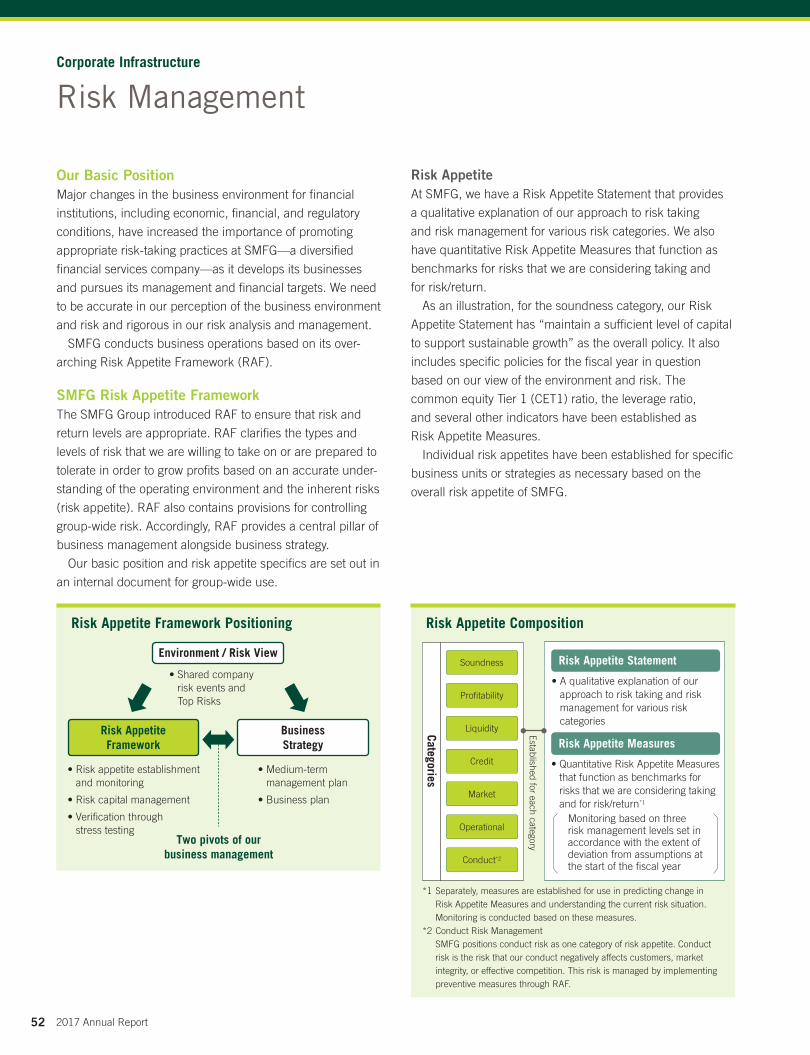
Risk Appetite Framework Positioning
Risk Appetite Statement
Risk Appetite Measures
• A qualitative explanation of our approach to risk taking and risk management for various risk categories
• Quantitative Risk Appetite Measures that function as benchmarks for risks that we are considering taking and for risk/return*1
Monitoring based on three risk management levels set in accordance with the extent of deviation from assumptions at the start of the fiscal year
*1 Separately, measures are established for use in predicting change in Risk Appetite Measures and understanding the current risk situation. Monitoring is conducted based on these measures.
*2 Conduct Risk Management SMFG positions conduct risk as one category of risk appetite. Conduct
risk is the risk that our conduct negatively affects customers, market integrity, or effective competition. This risk is managed by implementing preventive measures through RAF.
Risk Appetite Composition
Categories
Established for each category
Soundness
Credit
Profitability
Market
Conduct*2
Liquidity
Operational
Business Strategy
• Medium-term management plan
• Business plan
Risk Appetite Framework
• Risk appetite establishment and monitoring
• Risk capital management
• Verification through stress testing
Environment / Risk View
• Shared company risk events and Top Risks
Two pivots of our business management
Our Basic PositionMajor changes in the business environment for financial
institutions, including economic, financial, and regulatory
conditions, have increased the importance of promoting
appropriate risk-taking practices at SMFG—a diversified
financial services company—as it develops its businesses
and pursues its management and financial targets. We need
to be accurate in our perception of the business environment
and risk and rigorous in our risk analysis and management.
SMFG conducts business operations based on its over-
arching Risk Appetite Framework (RAF).
SMFG Risk Appetite FrameworkThe SMFG Group introduced RAF to ensure that risk and
return levels are appropriate. RAF clarifies the types and
levels of risk that we are willing to take on or are prepared to
tolerate in order to grow profits based on an accurate under-
standing of the operating environment and the inherent risks
(risk appetite). RAF also contains provisions for controlling
group-wide risk. Accordingly, RAF provides a central pillar of
business management alongside business strategy.
Our basic position and risk appetite specifics are set out in
an internal document for group-wide use.
Risk AppetiteAt SMFG, we have a Risk Appetite Statement that provides
a qualitative explanation of our approach to risk taking
and risk management for various risk categories. We also
have quantitative Risk Appetite Measures that function as
benchmarks for risks that we are considering taking and
for risk/return.
As an illustration, for the soundness category, our Risk
Appetite Statement has “maintain a sufficient level of capital
to support sustainable growth” as the overall policy. It also
includes specific policies for the fiscal year in question
based on our view of the environment and risk. The
common equity Tier 1 (CET1) ratio, the leverage ratio,
and several other indicators have been established as
Risk Appetite Measures.
Individual risk appetites have been established for specific
business units or strategies as necessary based on the
overall risk appetite of SMFG.
Corporate Infrastructure
Risk Management
52 2017 Annual Report
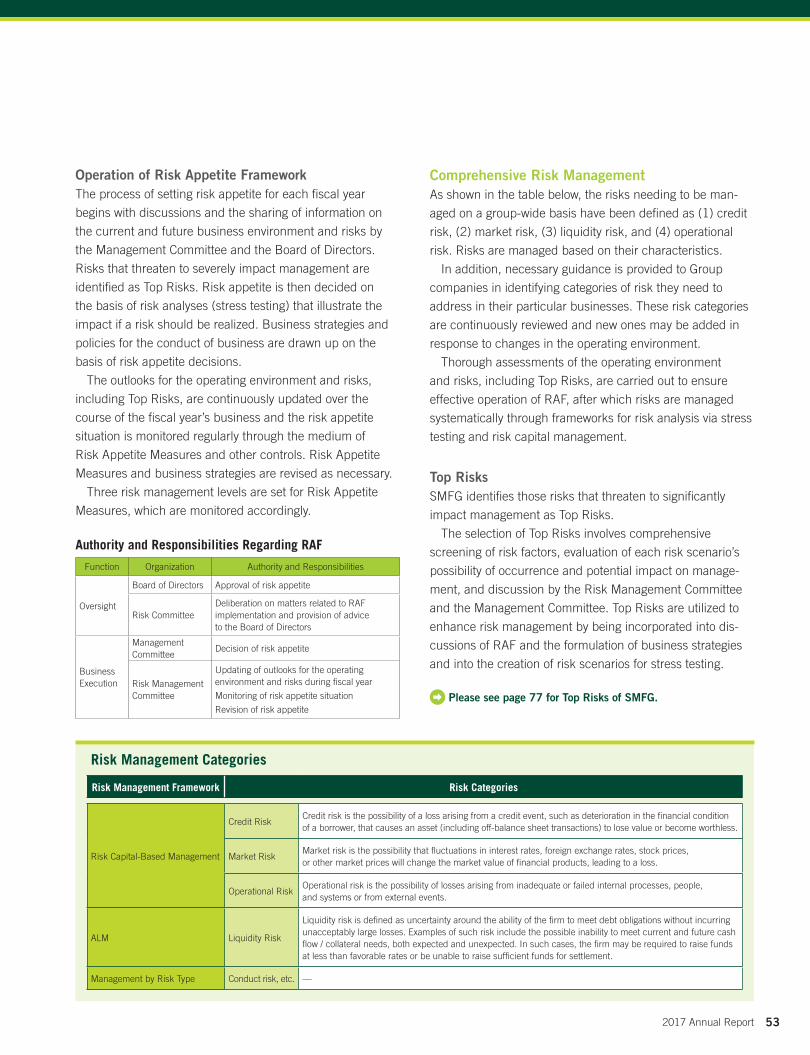
Risk Management Framework Risk Categories
Risk Capital-Based Management
Credit RiskCredit risk is the possibility of a loss arising from a credit event, such as deterioration in the financial condition of a borrower, that causes an asset (including off-balance sheet transactions) to lose value or become worthless.
Market RiskMarket risk is the possibility that fluctuations in interest rates, foreign exchange rates, stock prices, or other market prices will change the market value of financial products, leading to a loss.
Operational RiskOperational risk is the possibility of losses arising from inadequate or failed internal processes, people, and systems or from external events.
ALM Liquidity Risk
Liquidity risk is defined as uncertainty around the ability of the firm to meet debt obligations without incurring unacceptably large losses. Examples of such risk include the possible inability to meet current and future cash flow / collateral needs, both expected and unexpected. In such cases, the firm may be required to raise funds at less than favorable rates or be unable to raise sufficient funds for settlement.
Management by Risk Type Conduct risk, etc. —
Risk Management Categories
Operation of Risk Appetite FrameworkThe process of setting risk appetite for each fiscal year
begins with discussions and the sharing of information on
the current and future business environment and risks by
the Management Committee and the Board of Directors.
Risks that threaten to severely impact management are
identified as Top Risks. Risk appetite is then decided on
the basis of risk analyses (stress testing) that illustrate the
impact if a risk should be realized. Business strategies and
policies for the conduct of business are drawn up on the
basis of risk appetite decisions.
The outlooks for the operating environment and risks,
including Top Risks, are continuously updated over the
course of the fiscal year’s business and the risk appetite
situation is monitored regularly through the medium of
Risk Appetite Measures and other controls. Risk Appetite
Measures and business strategies are revised as necessary.
Three risk management levels are set for Risk Appetite
Measures, which are monitored accordingly.
Authority and Responsibilities Regarding RAF
Function Organization Authority and Responsibilities
Oversight
Board of Directors Approval of risk appetite
Risk CommitteeDeliberation on matters related to RAF implementation and provision of advice to the Board of Directors
Business Execution
Management Committee
Decision of risk appetite
Risk Management Committee
Updating of outlooks for the operating environment and risks during fiscal year
Monitoring of risk appetite situation
Revision of risk appetite
Comprehensive Risk ManagementAs shown in the table below, the risks needing to be man-
aged on a group-wide basis have been defined as (1) credit
risk, (2) market risk, (3) liquidity risk, and (4) operational
risk. Risks are managed based on their characteristics.
In addition, necessary guidance is provided to Group
companies in identifying categories of risk they need to
address in their particular businesses. These risk categories
are continuously reviewed and new ones may be added in
response to changes in the operating environment.
Thorough assessments of the operating environment
and risks, including Top Risks, are carried out to ensure
effective operation of RAF, after which risks are managed
systematically through frameworks for risk analysis via stress
testing and risk capital management.
Top RisksSMFG identifies those risks that threaten to significantly
impact management as Top Risks.
The selection of Top Risks involves comprehensive
screening of risk factors, evaluation of each risk scenario’s
possibility of occurrence and potential impact on manage-
ment, and discussion by the Risk Management Committee
and the Management Committee. Top Risks are utilized to
enhance risk management by being incorporated into dis-
cussions of RAF and the formulation of business strategies
and into the creation of risk scenarios for stress testing.
Please see page 77 for Top Risks of SMFG.
532017 Annual Report
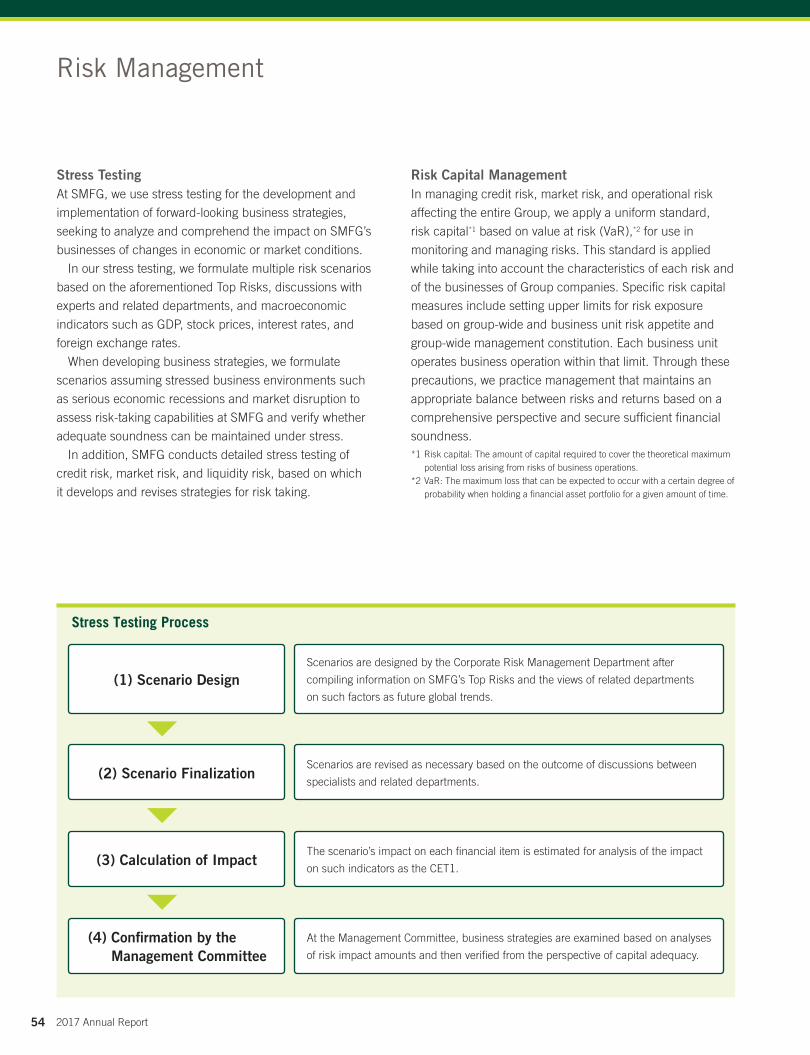
Stress TestingAt SMFG, we use stress testing for the development and
implementation of forward-looking business strategies,
seeking to analyze and comprehend the impact on SMFG’s
businesses of changes in economic or market conditions.
In our stress testing, we formulate multiple risk scenarios
based on the aforementioned Top Risks, discussions with
experts and related departments, and macroeconomic
indicators such as GDP, stock prices, interest rates, and
foreign exchange rates.
When developing business strategies, we formulate
scenarios assuming stressed business environments such
as serious economic recessions and market disruption to
assess risk-taking capabilities at SMFG and verify whether
adequate soundness can be maintained under stress.
In addition, SMFG conducts detailed stress testing of
credit risk, market risk, and liquidity risk, based on which
it develops and revises strategies for risk taking.
Risk Management
Risk Capital ManagementIn managing credit risk, market risk, and operational risk
affecting the entire Group, we apply a uniform standard,
risk capital*1 based on value at risk (VaR),*2 for use in
monitoring and managing risks. This standard is applied
while taking into account the characteristics of each risk and
of the businesses of Group companies. Specific risk capital
measures include setting upper limits for risk exposure
based on group-wide and business unit risk appetite and
group-wide management constitution. Each business unit
operates business operation within that limit. Through these
precautions, we practice management that maintains an
appropriate balance between risks and returns based on a
comprehensive perspective and secure sufficient financial
soundness.*1 Risk capital: The amount of capital required to cover the theoretical maximum
potential loss arising from risks of business operations.*2 VaR: The maximum loss that can be expected to occur with a certain degree of
probability when holding a financial asset portfolio for a given amount of time.
(1) Scenario DesignScenarios are designed by the Corporate Risk Management Department after
compiling information on SMFG’s Top Risks and the views of related departments
on such factors as future global trends.
(2) Scenario FinalizationScenarios are revised as necessary based on the outcome of discussions between
specialists and related departments.
(3) Calculation of ImpactThe scenario’s impact on each financial item is estimated for analysis of the impact
on such indicators as the CET1.
(4) Confirmation by the Management Committee
At the Management Committee, business strategies are examined based on analyses
of risk impact amounts and then verified from the perspective of capital adequacy.
Stress Testing Process
54 2017 Annual Report
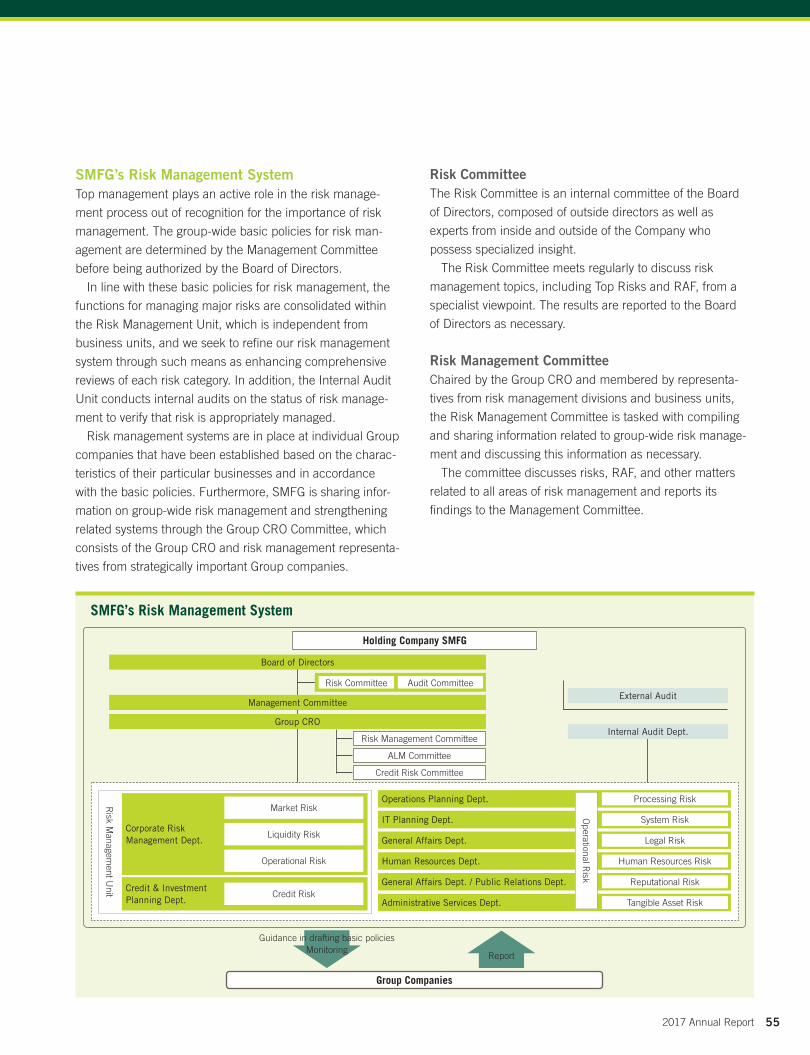
SMFG’s Risk Management System
Group Companies
External AuditR
isk Managem
ent Unit Credit & Investment
Planning Dept.
Corporate Risk Management Dept.
Credit Risk
Risk Management Committee
ALM Committee
Credit Risk Committee
Operations Planning Dept. Processing Risk
General Affairs Dept. Legal Risk
General Affairs Dept. / Public Relations Dept. Reputational Risk
IT Planning Dept. System Risk
Human Resources Dept. Human Resources Risk
Administrative Services Dept. Tangible Asset Risk
Operational R
isk
Holding Company SMFG
Board of Directors
Group CRO
Management Committee
Internal Audit Dept.
Risk Committee Audit Committee
Guidance in drafting basic policiesMonitoring
Report
SMFG’s Risk Management SystemTop management plays an active role in the risk manage-
ment process out of recognition for the importance of risk
management. The group-wide basic policies for risk man-
agement are determined by the Management Committee
before being authorized by the Board of Directors.
In line with these basic policies for risk management, the
functions for managing major risks are consolidated within
the Risk Management Unit, which is independent from
business units, and we seek to refine our risk management
system through such means as enhancing comprehensive
reviews of each risk category. In addition, the Internal Audit
Unit conducts internal audits on the status of risk manage-
ment to verify that risk is appropriately managed.
Risk management systems are in place at individual Group
companies that have been established based on the charac-
teristics of their particular businesses and in accordance
with the basic policies. Furthermore, SMFG is sharing infor-
mation on group-wide risk management and strengthening
related systems through the Group CRO Committee, which
consists of the Group CRO and risk management representa-
tives from strategically important Group companies.
Risk CommitteeThe Risk Committee is an internal committee of the Board
of Directors, composed of outside directors as well as
experts from inside and outside of the Company who
possess specialized insight.
The Risk Committee meets regularly to discuss risk
management topics, including Top Risks and RAF, from a
specialist viewpoint. The results are reported to the Board
of Directors as necessary.
Risk Management CommitteeChaired by the Group CRO and membered by representa-
tives from risk management divisions and business units,
the Risk Management Committee is tasked with compiling
and sharing information related to group-wide risk manage-
ment and discussing this information as necessary.
The committee discusses risks, RAF, and other matters
related to all areas of risk management and reports its
findings to the Management Committee.
Liquidity Risk
Operational Risk
Market Risk
552017 Annual Report
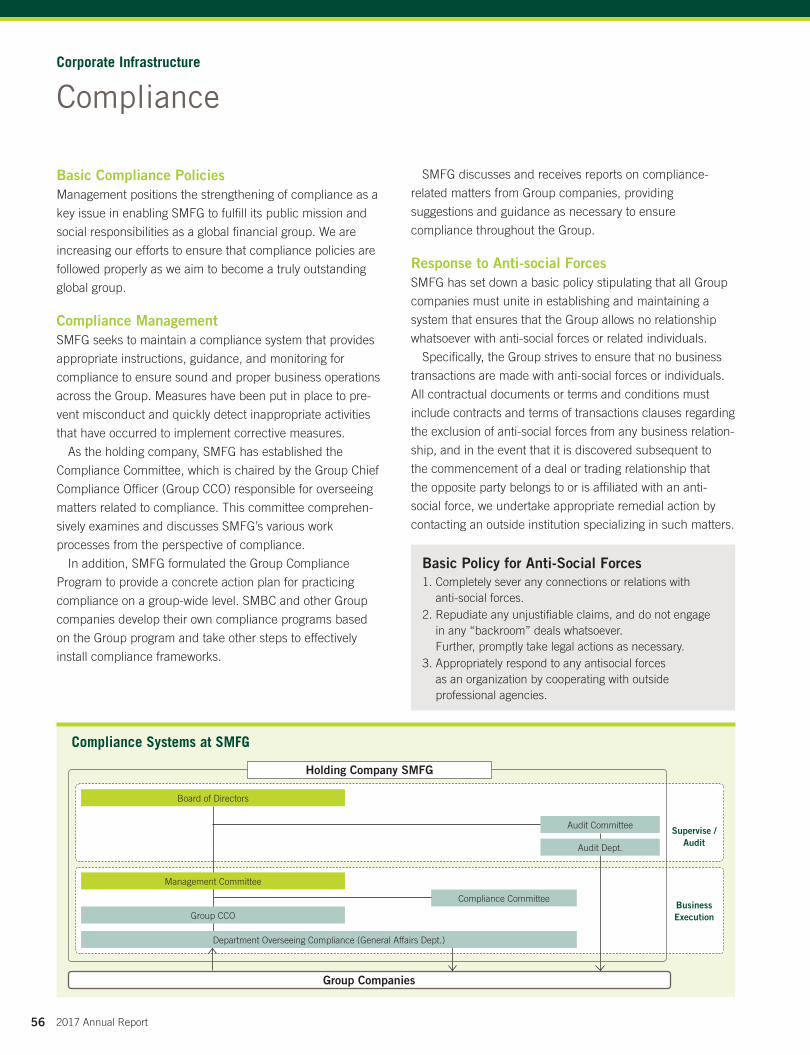
Basic Compliance PoliciesManagement positions the strengthening of compliance as a
key issue in enabling SMFG to fulfill its public mission and
social responsibilities as a global financial group. We are
increasing our efforts to ensure that compliance policies are
followed properly as we aim to become a truly outstanding
global group.
Compliance ManagementSMFG seeks to maintain a compliance system that provides
appropriate instructions, guidance, and monitoring for
compliance to ensure sound and proper business operations
across the Group. Measures have been put in place to pre-
vent misconduct and quickly detect inappropriate activities
that have occurred to implement corrective measures.
As the holding company, SMFG has established the
Compliance Committee, which is chaired by the Group Chief
Compliance Officer (Group CCO) responsible for overseeing
matters related to compliance. This committee comprehen-
sively examines and discusses SMFG’s various work
processes from the perspective of compliance.
In addition, SMFG formulated the Group Compliance
Program to provide a concrete action plan for practicing
compliance on a group-wide level. SMBC and other Group
companies develop their own compliance programs based
on the Group program and take other steps to effectively
install compliance frameworks.
SMFG discusses and receives reports on compliance-
related matters from Group companies, providing
suggestions and guidance as necessary to ensure
compliance throughout the Group.
Response to Anti-social ForcesSMFG has set down a basic policy stipulating that all Group
companies must unite in establishing and maintaining a
system that ensures that the Group allows no relationship
whatsoever with anti-social forces or related individuals.
Specifically, the Group strives to ensure that no business
transactions are made with anti-social forces or individuals.
All contractual documents or terms and conditions must
include contracts and terms of transactions clauses regarding
the exclusion of anti-social forces from any business relation-
ship, and in the event that it is discovered subsequent to
the commencement of a deal or trading relationship that
the opposite party belongs to or is affiliated with an anti-
social force, we undertake appropriate remedial action by
contacting an outside institution specializing in such matters.
Compliance Committee
Audit Committee Supervise / Audit
Business Execution
Audit Dept.
Group Companies
Board of Directors
Management Committee
Group CCO
Department Overseeing Compliance (General Affairs Dept.)
Compliance Systems at SMFG
Holding Company SMFG
Basic Policy for Anti-Social Forces1. Completely sever any connections or relations with
anti-social forces.2. Repudiate any unjustifiable claims, and do not engage
in any “backroom” deals whatsoever. Further, promptly take legal actions as necessary.
3. Appropriately respond to any antisocial forces as an organization by cooperating with outside professional agencies.
ComplianceCorporate Infrastructure
56 2017 Annual Report
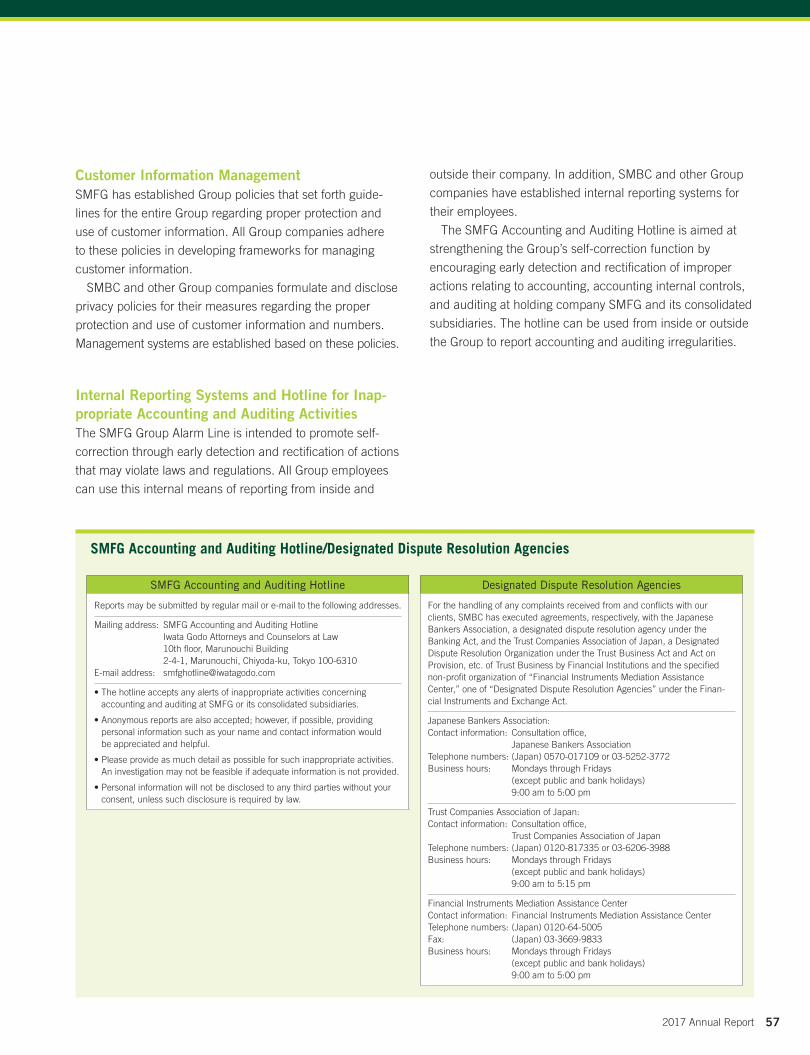
Customer Information ManagementSMFG has established Group policies that set forth guide-
lines for the entire Group regarding proper protection and
use of customer information. All Group companies adhere
to these policies in developing frameworks for managing
customer information.
SMBC and other Group companies formulate and disclose
privacy policies for their measures regarding the proper
protection and use of customer information and numbers.
Management systems are established based on these policies.
Internal Reporting Systems and Hotline for Inap-propriate Accounting and Auditing ActivitiesThe SMFG Group Alarm Line is intended to promote self-
correction through early detection and rectification of actions
that may violate laws and regulations. All Group employees
can use this internal means of reporting from inside and
outside their company. In addition, SMBC and other Group
companies have established internal reporting systems for
their employees.
The SMFG Accounting and Auditing Hotline is aimed at
strengthening the Group’s self-correction function by
encouraging early detection and rectification of improper
actions relating to accounting, accounting internal controls,
and auditing at holding company SMFG and its consolidated
subsidiaries. The hotline can be used from inside or outside
the Group to report accounting and auditing irregularities.
SMFG Accounting and Auditing Hotline/Designated Dispute Resolution Agencies
SMFG Accounting and Auditing Hotline
Reports may be submitted by regular mail or e-mail to the following addresses.
Mailing address: SMFG Accounting and Auditing Hotline Iwata Godo Attorneys and Counselors at Law 10th floor, Marunouchi Building 2-4-1, Marunouchi, Chiyoda-ku, Tokyo 100-6310
E-mail address: [email protected]
• The hotline accepts any alerts of inappropriate activities concerning accounting and auditing at SMFG or its consolidated subsidiaries.
• Anonymous reports are also accepted; however, if possible, providing personal information such as your name and contact information would be appreciated and helpful.
• Please provide as much detail as possible for such inappropriate activities. An investigation may not be feasible if adequate information is not provided.
• Personal information will not be disclosed to any third parties without your consent, unless such disclosure is required by law.
Designated Dispute Resolution Agencies
For the handling of any complaints received from and conflicts with our clients, SMBC has executed agreements, respectively, with the Japanese Bankers Association, a designated dispute resolution agency under the Banking Act, and the Trust Companies Association of Japan, a Designated Dispute Resolution Organization under the Trust Business Act and Act on Provision, etc. of Trust Business by Financial Institutions and the specified non-profit organization of “Financial Instruments Mediation Assistance Center,” one of “Designated Dispute Resolution Agencies” under the Finan-cial Instruments and Exchange Act.
Japanese Bankers Association:Contact information: Consultation office,
Japanese Bankers AssociationTelephone numbers: (Japan) 0570-017109 or 03-5252-3772Business hours: Mondays through Fridays
(except public and bank holidays) 9:00 am to 5:00 pm
Trust Companies Association of Japan: Contact information: Consultation office,
Trust Companies Association of JapanTelephone numbers: (Japan) 0120-817335 or 03-6206-3988Business hours: Mondays through Fridays
(except public and bank holidays) 9:00 am to 5:15 pm
Financial Instruments Mediation Assistance CenterContact information: Financial Instruments Mediation Assistance CenterTelephone numbers: (Japan) 0120-64-5005Fax: (Japan) 03-3669-9833Business hours: Mondays through Fridays
(except public and bank holidays) 9:00 am to 5:00 pm
572017 Annual Report

Overview of the Group’s Internal Audit SystemAt SMFG, the holding company, the Audit Department has
been established as an internal auditing division that is
positioned under the Audit Committee and is independent
from business units and compliance and risk management
divisions. In addition, the chief audit executive oversees
SMFG’s group-wide auditing activities.
Based on the Group Internal Audit Charter and the Basic
Audit Policy and Plan formulated by the Audit Committee
and the Board of Directors, the Audit Division verifies the
appropriateness and effectiveness of internal control sys-
tems, including those elements related to compliance and
risk management. This duty is accomplished through inter-
nal audits of Company divisions and Group companies
aimed at ensuring the appropriateness of Group operations
and the soundness of assets.
In addition, the appropriateness and effectiveness of inter-
nal control systems at Group companies are verified through
oversight of internal audit functions at these companies and
through ongoing monitoring of the status of internal audit
implementation. Major audit findings are regularly reported
to the Audit Committee, the Board of Directors, and the
Group Management Committee. Also, the department is
working to strengthen cooperation with accounting auditors
through frequent exchanges information for appropriate
audit practices
Enhancement of the Quality and Effectiveness of Internal AuditThe SMFG Audit Department has adopted auditing methods
in accordance with the standards of the Institute of Internal
Auditors (IIA)*. The department conducts risk-based audits
and extends the same approach to Group companies as well.
It seeks to enhance the expertise of internal auditors in
Group companies as it gathers up-to-date information on
internal audit offers that information to Group companies,
organizes training programs, and promotes the obtaining
of international certification as an auditor.
Moreover, the Audit Department seeks to enhance
group-wide audit processes through quality assessments of
internal audits based on the IIA standards and on exemplary
initiatives by G-SIFIs.* The Institute of Internal Auditors, Inc. (IIA), was founded in 1941 in the United
States as an organization dedicated to helping raise the level of specialization and the status of professionalism of internal auditing staff. Its main activity is to hold examinations and approve licenses for Certified Internal Auditor (CIA), which is an internationally recognized qualification in both theoretical and practical knowledge for internal auditor.
Internal Audit System
Auditing
Business units subject to auditing
Monitoring
Board of Directors
Reporting line (including personnel right of consent)
Communication line
Holding Company
SMFG
Group Companies
Internal Audits
Management Committee
Business units subject to auditing
Internal Audit Unit
Audit Committee
Head Office / Business Units
All Departments
Chief Audit Executive
Internal Audit Dept.
Corporate Infrastructure
Internal Audit System
Internal Audits
58 2017 Annual Report
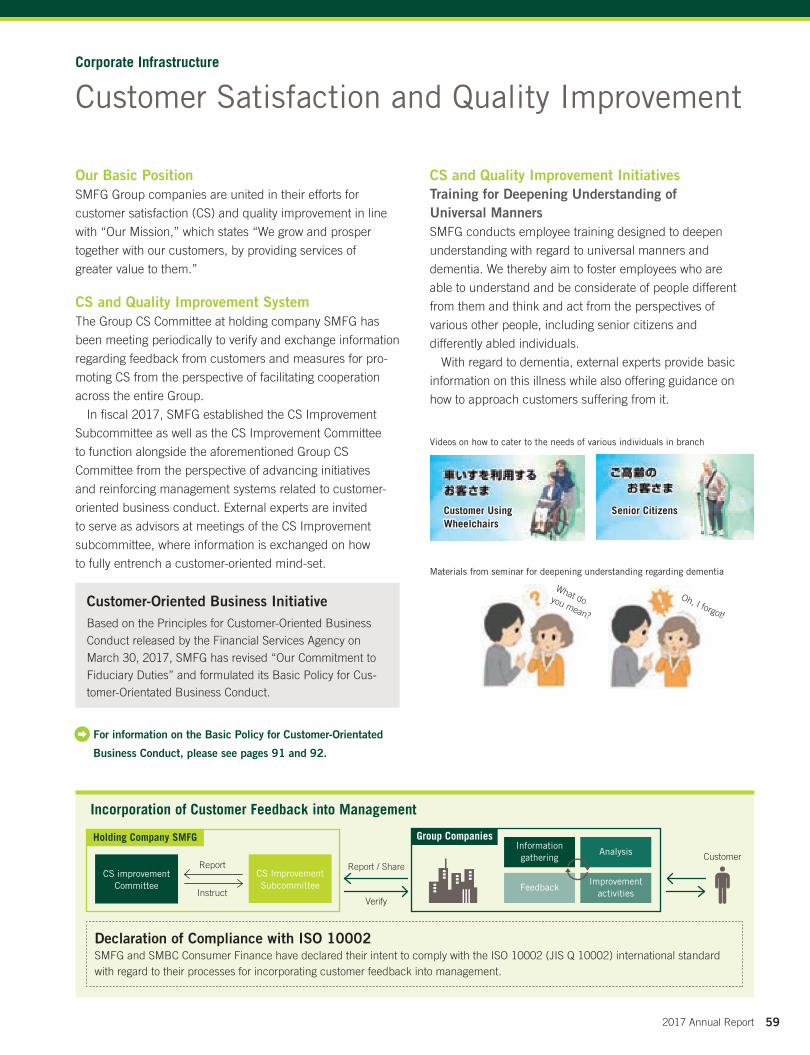
Incorporation of Customer Feedback into Management
Our Basic PositionSMFG Group companies are united in their efforts for
customer satisfaction (CS) and quality improvement in line
with “Our Mission,” which states “We grow and prosper
together with our customers, by providing services of
greater value to them.”
CS and Quality Improvement SystemThe Group CS Committee at holding company SMFG has
been meeting periodically to verify and exchange information
regarding feedback from customers and measures for pro-
moting CS from the perspective of facilitating cooperation
across the entire Group.
In fiscal 2017, SMFG established the CS Improvement
Subcommittee as well as the CS Improvement Committee
to function alongside the aforementioned Group CS
Committee from the perspective of advancing initiatives
and reinforcing management systems related to customer-
oriented business conduct. External experts are invited
to serve as advisors at meetings of the CS Improvement
subcommittee, where information is exchanged on how
to fully entrench a customer- oriented mind-set.
CS and Quality Improvement InitiativesTraining for Deepening Understanding of Universal MannersSMFG conducts employee training designed to deepen
understanding with regard to universal manners and
dementia. We thereby aim to foster employees who are
able to understand and be considerate of people different
from them and think and act from the perspectives of
various other people, including senior citizens and
differently abled individuals.
With regard to dementia, external experts provide basic
information on this illness while also offering guidance on
how to approach customers suffering from it.
Customer-Oriented Business InitiativeBased on the Principles for Customer-Oriented Business Conduct released by the Financial Services Agency on March 30, 2017, SMFG has revised “Our Commitment to Fiduciary Duties” and formulated its Basic Policy for Cus-tomer-Orientated Business Conduct.
Declaration of Compliance with ISO 10002SMFG and SMBC Consumer Finance have declared their intent to comply with the ISO 10002 (JIS Q 10002) international standard with regard to their processes for incorporating customer feedback into management.
For information on the Basic Policy for Customer-Orientated
Business Conduct, please see pages 91 and 92.
Customer Satisfaction and Quality ImprovementCorporate Infrastructure
Videos on how to cater to the needs of various individuals in branch
Materials from seminar for deepening understanding regarding dementia
Customer Using Wheelchairs
What do you mean?
Oh, I forgot!
Senior Citizens
CustomerInformation gathering
Feedback
Analysis
Improvement activities
Group Companies
CS improvement Committee
CS Improvement Subcommittee
Holding Company SMFG
Report
Instruct
Report / Share
Verify
592017 Annual Report

DisciplineDisciplined business management
Optimization of headcount and personnel expenses, and proper deployment of the human resources
FocusFocus on our strengths to generate growth
Hire and develop talents to lead the strategy
IntegrationIntegration across the Group and globally to achieve sustainable growth
Producing workplace environment to support diversified human resources
Optimization of Headcount and Personnel Expenses, and Proper Deployment of the Human ResourceOptimization of Headcount and Personnel ExpensesSMFG aims to optimize headcount and personnel expenses through
enhancing headcount management and personnel expenses man-
agement as well as implementing company-wide efforts to increase
productivity and operational efficiency.
Proper Deployment of the Human ResourceSMFG aims proper deployment of human resources through group-
wide personnel movement based on the business strategy and
employees’ skill, experience and career development. At the same
time, SMFG develops new job-position and focus on education of
employee in order to implement group-wide personnel movement
smoothly.
Hire and Develop Talents to Lead the StrategyAllocation of Human Resources to Strategic Growth FieldsSMFG is allocating human resources to strategic growth fields through
both personnel relocations and the hiring of mid-career individuals.
Stage-Based Human Resources DevelopmentSMFG categorizes the stages of development of our employees and
Human resources development programs are in place for each stage.
Stage Initiatives
Mid-level Employees(8th year–16th year)
Cultivation of Future Leaders• Planned employee rotation plans
• Identification of necessary skills and experience and training deliberately aimed at acquiring these
Junior Employees(1st year–7th year)
Development of Junior Employees• Enhancement of on-the-job training through
establishment of basic principles of working for SMFG and instructor systems
• Management skills training for managers
Human Resources Strategy under the Medium-Term Management Plan
Developing Global TalentAs our business globalizes rapidly, we are committed to strengthen
our employees’ global business capabilities. For example, we provide
various unique global training programs for both Japan hired and
overseas hired employees, including a leadership program organized
in collaboration with a world-leading business school. We also
support employees’ language trainings to encourage active
communications across borders.
In addition, we promote cross-border transfers and secondment of
employees around the world, for both business and training purposes.
Through these initiatives, there are increasing number of overseas
hired employees who have worked in Japan, contributing to globalize
our domestic offices.
By creating an environment where employees with different back-
grounds work together and inspire each other, we pursue to provide
services of greater value to our customers.
Foster Workplace Environment That Is Conducive to the Efforts of Diverse Human ResourcesPromotion of DiversitySMFG is fostering a workplace
environment that will enable diverse
human resources to work in diverse
manners on the broad field in SMFG
Through SMFG’s joint recruiting
activities, we implement hiring
practices regardless of gender,
nationality, and age, seeing only
applicants’ characters and aptitudes,
to actively hire individuals with highly
specialized skills.
1
2
3
Corporate Infrastructure
Human Resources
SMFG’s joint hiring event poster
60 2017 Annual Report
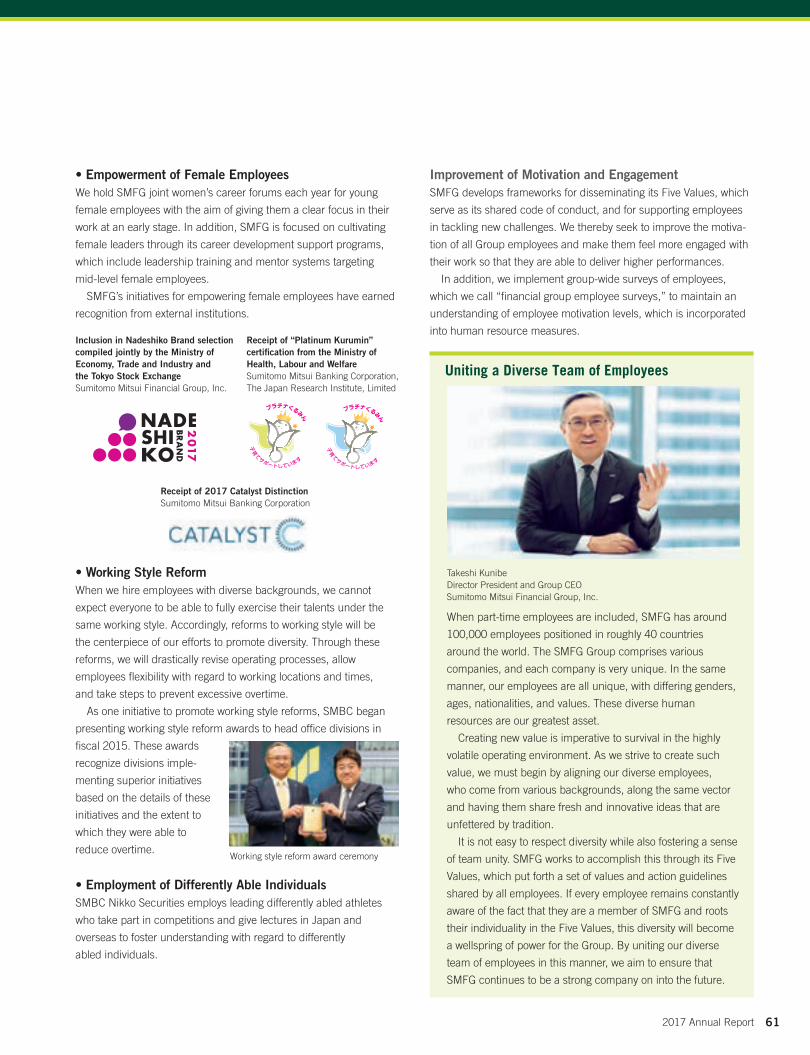
• Empowerment of Female EmployeesWe hold SMFG joint women’s career forums each year for young
female employees with the aim of giving them a clear focus in their
work at an early stage. In addition, SMFG is focused on cultivating
female leaders through its career development support programs,
which include leadership training and mentor systems targeting
mid-level female employees.
SMFG’s initiatives for empowering female employees have earned
recognition from external institutions.
• Working Style ReformWhen we hire employees with diverse backgrounds, we cannot
expect everyone to be able to fully exercise their talents under the
same working style. Accordingly, reforms to working style will be
the centerpiece of our efforts to promote diversity. Through these
reforms, we will drastically revise operating processes, allow
employees flexibility with regard to working locations and times,
and take steps to prevent excessive overtime.
As one initiative to promote working style reforms, SMBC began
presenting working style reform awards to head office divisions in
fiscal 2015. These awards
recognize divisions imple-
menting superior initiatives
based on the details of these
initiatives and the extent to
which they were able to
reduce overtime.
• Employment of Differently Able IndividualsSMBC Nikko Securities employs leading differently abled athletes
who take part in competitions and give lectures in Japan and
overseas to foster understanding with regard to differently
abled individuals.
Improvement of Motivation and EngagementSMFG develops frameworks for disseminating its Five Values, which
serve as its shared code of conduct, and for supporting employees
in tackling new challenges. We thereby seek to improve the motiva-
tion of all Group employees and make them feel more engaged with
their work so that they are able to deliver higher performances.
In addition, we implement group-wide surveys of employees,
which we call “financial group employee surveys,” to maintain an
understanding of employee motivation levels, which is incorporated
into human resource measures.
Working style reform award ceremony
Uniting a Diverse Team of Employees
Takeshi KunibeDirector President and Group CEOSumitomo Mitsui Financial Group, Inc.
Inclusion in Nadeshiko Brand selection compiled jointly by the Ministry of Economy, Trade and Industry and the Tokyo Stock ExchangeSumitomo Mitsui Financial Group, Inc.
Receipt of “Platinum Kurumin” certification from the Ministry of Health, Labour and WelfareSumitomo Mitsui Banking Corporation, The Japan Research Institute, Limited
Receipt of 2017 Catalyst DistinctionSumitomo Mitsui Banking Corporation
When part-time employees are included, SMFG has around
100,000 employees positioned in roughly 40 countries
around the world. The SMFG Group comprises various
companies, and each company is very unique. In the same
manner, our employees are all unique, with differing genders,
ages, nationalities, and values. These diverse human
resources are our greatest asset.
Creating new value is imperative to survival in the highly
volatile operating environment. As we strive to create such
value, we must begin by aligning our diverse employees,
who come from various backgrounds, along the same vector
and having them share fresh and innovative ideas that are
unfettered by tradition.
It is not easy to respect diversity while also fostering a sense
of team unity. SMFG works to accomplish this through its Five
Values, which put forth a set of values and action guidelines
shared by all employees. If every employee remains constantly
aware of the fact that they are a member of SMFG and roots
their individuality in the Five Values, this diversity will become
a wellspring of power for the Group. By uniting our diverse
team of employees in this manner, we aim to ensure that
SMFG continues to be a strong company on into the future.
612017 Annual Report

Aiming to Contribute to the Sustained Development of the Entire SocietySociety today is confronting numerous and wide-ranging
issues, including global warming, rapid population growth,
and low birthrates and aging populations in developed coun-
tries. As a global financial group, at SMFG we regard it as
our social responsibility to remind ourselves of our role and
play our part in addressing such issues in order to contribute
to the sustainable development of the entire society.
Basic CSR PoliciesSMFG has a CSR definition and “business ethics” which is a
common philosophy for CSR, to make the position of CSR
clear and promote CSR effectively.
Moreover, the Group CSR Department has been set up
within the Corporate Planning Department, and CSR com-
mittee is held periodically to facilitate improvements in CSR
initiatives by discussing matters related to group-wide CSR
activities. Such activities are advanced based on SMFG’s
definition of CSR, which constitutes our basic CSR policies,
and our priority issues.
Please follow the link to read about our CSR “business ethics.”
http://www.smfg.co.jp/english/responsibility/smfgcsr/
SMFG’s Definition of CSRIn the conduct of its business activities, SMFG fulfills its
social responsibilities by contributing to the sustainable
development of the entire society by offering higher value to
customers, shareholders and the market, the environment
and society, and employees.
Priority Issues (Materiality) that SMFG Should AddressSMFG has designated “Environment,” “Next Generation,”
and “Community” as its three priority issues (Materiality) for
the medium to long term.
Endorsement of Initiatives in Japan and OverseasAs a global corporate citizen, SMFG is fully aware of the
social influence of financial institutions, and it endorses the
following initiatives in Japan and overseas (action guidelines
and principles for corporate activities).
Please follow the link to read about initiatives endorsed by SMFG.
http://www.smfg.co.jp/english/responsibility/smfgcsr/structure/
Environment
The Vision We Aspire for 2030A financial group that contributes to the
preservation of the global environment;
the foundation for the lives of all, in order
to help realize a sustainable society
Issues We Should Address• Promotion of environmental businesses
• Management of environmental risks
• Reduction of environmental impacts
Next Generation
The Vision We Aspire for 2030A financial group that contributes to
the development of all people’s skills,
particularly by spreading and entrenching
financial literacy, to create a more
empowering future
Issues We Should Address• Support for growth industries
• Resolution of social issues in emerging
countries
• Promotion of financial literacy education
for all generations
Community
The Vision We Aspire for 2030A financial group that provides safety and
security to all, in order to contribute to the
creation of communities in which everyone
can participate
Issues We Should Address• Contribution to achieving and developing
safe and secure communities
• Promotion of social inclusion in
collaboration with NGOs and NPOs
• Support for reconstruction in areas
impacted by large-scale natural disasters
Corporate Social Responsibility (CSR)Corporate Infrastructure
Priority Issues (Materiality)
62 2017 Annual Report
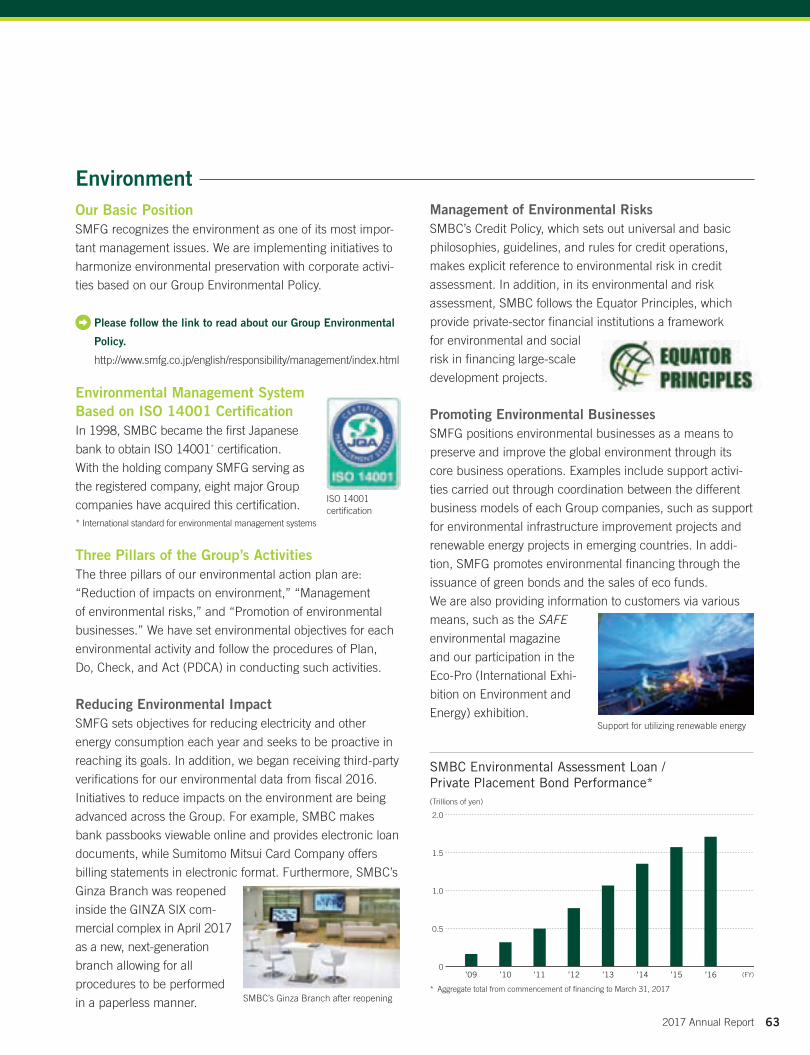
EnvironmentOur Basic PositionSMFG recognizes the environment as one of its most impor-
tant management issues. We are implementing initiatives to
harmonize environmental preservation with corporate activi-
ties based on our Group Environmental Policy.
Please follow the link to read about our Group Environmental
Policy.
http://www.smfg.co.jp/english/responsibility/management/index.html
Environmental Management System Based on ISO 14001 CertificationIn 1998, SMBC became the first Japanese
bank to obtain ISO 14001* certification.
With the holding company SMFG serving as
the registered company, eight major Group
companies have acquired this certification.* International standard for environmental management systems
Three Pillars of the Group’s ActivitiesThe three pillars of our environmental action plan are:
“Reduction of impacts on environment,” “Management
of environmental risks,” and “Promotion of environmental
businesses.” We have set environmental objectives for each
environmental activity and follow the procedures of Plan,
Do, Check, and Act (PDCA) in conducting such activities.
Reducing Environmental ImpactSMFG sets objectives for reducing electricity and other
energy consumption each year and seeks to be proactive in
reaching its goals. In addition, we began receiving third-party
verifications for our environmental data from fiscal 2016.
Initiatives to reduce impacts on the environment are being
advanced across the Group. For example, SMBC makes
bank passbooks viewable online and provides electronic loan
documents, while Sumitomo Mitsui Card Company offers
billing statements in electronic format. Furthermore, SMBC’s
Ginza Branch was reopened
inside the GINZA SIX com-
mercial complex in April 2017
as a new, next-generation
branch allowing for all
procedures to be performed
in a paperless manner.
Management of Environmental RisksSMBC’s Credit Policy, which sets out universal and basic
philosophies, guidelines, and rules for credit operations,
makes explicit reference to environmental risk in credit
assessment. In addition, in its environmental and risk
assessment, SMBC follows the Equator Principles, which
provide private-sector financial institutions a framework
for environmental and social
risk in financing large-scale
development projects.
Promoting Environmental BusinessesSMFG positions environmental businesses as a means to
preserve and improve the global environment through its
core business operations. Examples include support activi-
ties carried out through coordination between the different
business models of each Group companies, such as support
for environmental infrastructure improvement projects and
renewable energy projects in emerging countries. In addi-
tion, SMFG promotes environmental financing through the
issuance of green bonds and the sales of eco funds.
We are also providing information to customers via various
means, such as the SAFE
environmental magazine
and our participation in the
Eco-Pro (International Exhi-
bition on Environment and
Energy) exhibition.
ISO 14001 certification
Support for utilizing renewable energy
SMBC’s Ginza Branch after reopening
SMBC Environmental Assessment Loan / Private Placement Bond Performance*(Trillions of yen)
0
0.5
1.0
1.5
2.0
’13’12’11’10’09 ’14 ’16’15 (FY)
* Aggregate total from commencement of financing to March 31, 2017
632017 Annual Report
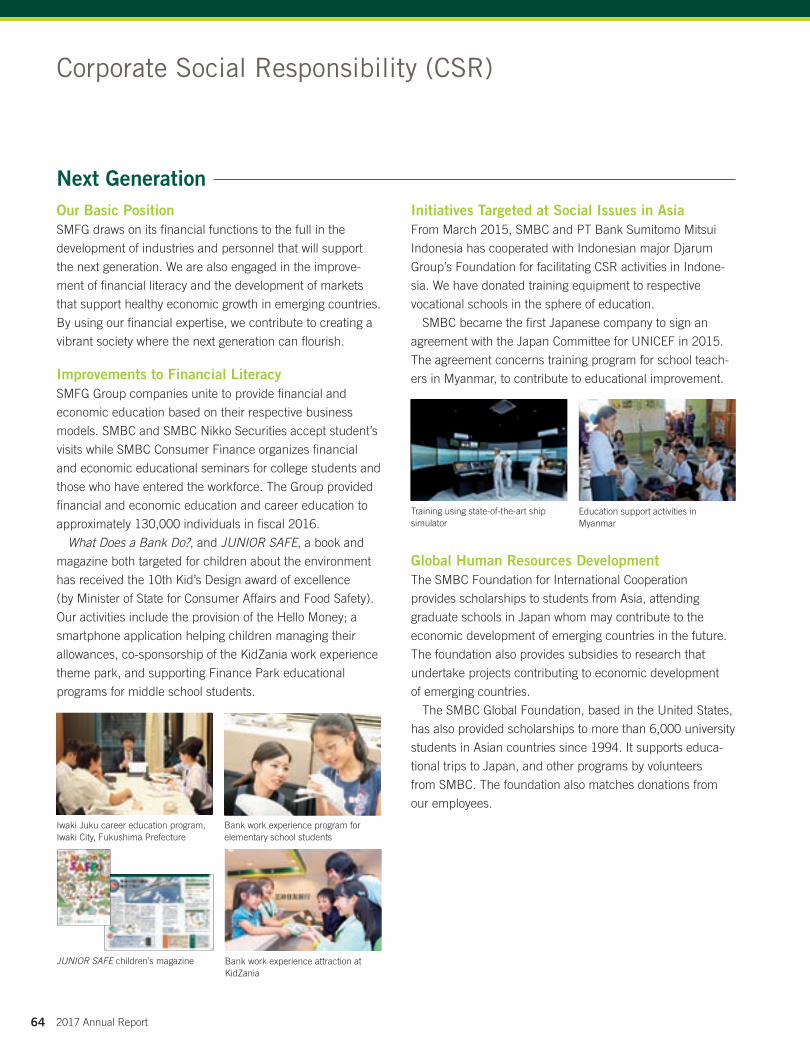
Next GenerationOur Basic PositionSMFG draws on its financial functions to the full in the
development of industries and personnel that will support
the next generation. We are also engaged in the improve-
ment of financial literacy and the development of markets
that support healthy economic growth in emerging countries.
By using our financial expertise, we contribute to creating a
vibrant society where the next generation can flourish.
Improvements to Financial LiteracySMFG Group companies unite to provide financial and
economic education based on their respective business
models. SMBC and SMBC Nikko Securities accept student’s
visits while SMBC Consumer Finance organizes financial
and economic educational seminars for college students and
those who have entered the workforce. The Group provided
financial and economic education and career education to
approximately 130,000 individuals in fiscal 2016.
What Does a Bank Do?, and JUNIOR SAFE, a book and
magazine both targeted for children about the environment
has received the 10th Kid’s Design award of excellence
(by Minister of State for Consumer Affairs and Food Safety).
Our activities include the provision of the Hello Money; a
smartphone application helping children managing their
allowances, co-sponsorship of the KidZania work experience
theme park, and supporting Finance Park educational
programs for middle school students.
Initiatives Targeted at Social Issues in AsiaFrom March 2015, SMBC and PT Bank Sumitomo Mitsui
Indonesia has cooperated with Indonesian major Djarum
Group’s Foundation for facilitating CSR activities in Indone-
sia. We have donated training equipment to respective
vocational schools in the sphere of education.
SMBC became the first Japanese company to sign an
agreement with the Japan Committee for UNICEF in 2015.
The agreement concerns training program for school teach-
ers in Myanmar, to contribute to educational improvement.
Global Human Resources DevelopmentThe SMBC Foundation for International Cooperation
provides scholarships to students from Asia, attending
graduate schools in Japan whom may contribute to the
economic development of emerging countries in the future.
The foundation also provides subsidies to research that
undertake projects contributing to economic development
of emerging countries.
The SMBC Global Foundation, based in the United States,
has also provided scholarships to more than 6,000 university
students in Asian countries since 1994. It supports educa-
tional trips to Japan, and other programs by volunteers
from SMBC. The foundation also matches donations from
our employees.
Iwaki Juku career education program, Iwaki City, Fukushima Prefecture
Bank work experience program for elementary school students
Bank work experience attraction at KidZania
JUNIOR SAFE children’s magazine
Training using state-of-the-art ship simulator
Education support activities in Myanmar
Corporate Social Responsibility (CSR)
64 2017 Annual Report
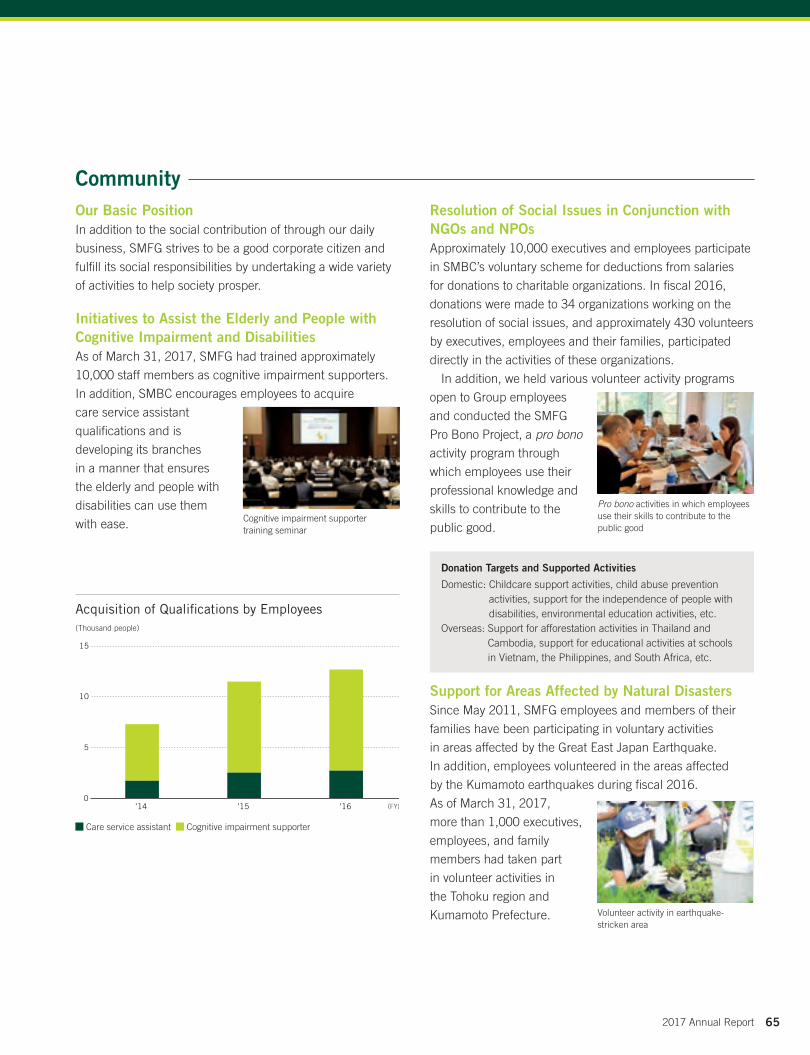
CommunityOur Basic PositionIn addition to the social contribution of through our daily
business, SMFG strives to be a good corporate citizen and
fulfill its social responsibilities by undertaking a wide variety
of activities to help society prosper.
Initiatives to Assist the Elderly and People with Cognitive Impairment and DisabilitiesAs of March 31, 2017, SMFG had trained approximately
10,000 staff members as cognitive impairment supporters.
In addition, SMBC encourages employees to acquire
care service assistant
qualifications and is
developing its branches
in a manner that ensures
the elderly and people with
disabilities can use them
with ease.
Resolution of Social Issues in Conjunction with NGOs and NPOsApproximately 10,000 executives and employees participate
in SMBC’s voluntary scheme for deductions from salaries
for donations to charitable organizations. In fiscal 2016,
donations were made to 34 organizations working on the
resolution of social issues, and approximately 430 volunteers
by executives, employees and their families, participated
directly in the activities of these organizations.
In addition, we held various volunteer activity programs
open to Group employees
and conducted the SMFG
Pro Bono Project, a pro bono
activity program through
which employees use their
professional knowledge and
skills to contribute to the
public good.
Support for Areas Affected by Natural DisastersSince May 2011, SMFG employees and members of their
families have been participating in voluntary activities
in areas affected by the Great East Japan Earthquake.
In addition, employees volunteered in the areas affected
by the Kumamoto earthquakes during fiscal 2016.
As of March 31, 2017,
more than 1,000 executives,
employees, and family
members had taken part
in volunteer activities in
the Tohoku region and
Kumamoto Prefecture. Volunteer activity in earthquake-stricken area
Pro bono activities in which employees use their skills to contribute to the public good
Cognitive impairment supporter training seminar
Donation Targets and Supported Activities
Domestic: Childcare support activities, child abuse prevention activities, support for the independence of people with disabilities, environmental education activities, etc.
Overseas: Support for afforestation activities in Thailand and Cambodia, support for educational activities at schools in Vietnam, the Philippines, and South Africa, etc.
Care service assistant Cognitive impairment supporter
Acquisition of Qualifications by Employees(Thousand people)
0
5
10
15
’14 ’16’15 (FY)
652017 Annual Report

4
3
2
1
0’12 ’13 ’14 ’15 ’16 (FY)
0.79 0.84 0.75 0.710.65
2.79
1.17
2.90
1.24
2.98
1.31
2.922.90
1.131.14
Consolidated gross profit Consolidated net business profit Profit attributable to owners of parent
Consolidated net business profitConsolidated gross profit increased by ¥16.8 billion year-on-
year to ¥2,920.7 billion. The primary reasons were an
increase in profit of SMBC Nikko Securities Inc. by regarding
as rallies in the market conditions and profit contribution of
SMFL Capital Company, Limited which has been included in
the scope of consolidation from fiscal 2016, despite of an
impact of negative interest rates.
General and administrative expenses increased by ¥87.6
billion year-on-year to ¥1,812.4 billion, due to ongoing invest-
ments to enhance top-line profit growth and the effects from
system investments in the past years, despite of strengthen-
ing of cost control in the entire group. Equity in gains (losses)
of affiliates increased by ¥60.7 billion year-on-year to ¥24.6
billion. This was mainly because an impairment loss on
goodwill was recognized for BTPN in the previous fiscal
year, which is not recognized in this fiscal year.
As a result, consolidated net business profit decreased by
¥10.1 billion year-on-year to ¥1,132.9 billion.
Credit costTotal credit cost increased by ¥61.6 billion year-on-year to
¥164.4 billion. This was mainly due to additional reserves for
possible loan losses with worsened business results of
SMBC’s obligor with large exposure.
Gains (losses) on stocksGains (losses) on stocks decreased by ¥14.0 billion year-on-
year to ¥55.0 billion.
Ordinary profitIn addition to the above items, Others increased by ¥106.2
billion, resulting in losses of ¥17.6 billion. This was mainly
due to provision for reserve for losses on interest repayment
in the previous fiscal year, which is not recognized in this
fiscal year and for other reasons. As a result, Ordinary profit
increased by ¥20.6 billion year-on-year to ¥1,005.9 billion.
Profit attributable to owners of parentProfit attributable to owners of parent increased by ¥59.8
billion year-on-year to ¥706.5 billion due to an increase in
deferred tax assets recoverable in the future with application
of the consolidated corporate-tax system from fiscal year
ending March 31, 2018 (fiscal 2017).
Operating ResultsIncome Summary (SMFG Consolidated) (Billions of yen)
Year ended March 31 2016 (A) 2017 (B)
Increase (decrease)(B) – (A)
Consolidated gross profit 2,904.0 2,920.7 16.8
G eneral and administrative expenses
(1,724.8) (1,812.4) (87.6)
E quity in gains (losses) of affiliates
(36.2) 24.6 60.7
Consolidated net business profit 1,142.9 1,132.9 (10.1)
Total credit cost (102.8) (164.4) (61.6)
Gains (losses) on stocks 69.0 55.0 (14.0)
Others (123.9) (17.6) 106.2
Ordinary profit 985.3 1,005.9 20.6
P rofit attributable to owners of parent
646.7 706.5 59.8
(Reference) Income Summary (SMBC Non-consolidated) (Billions of yen)
Year ended March 31 2016 (A) 2017 (B)
Increase (decrease)(B) – (A)
Gross banking profit 1,534.3 1,663.7 129.4
Expenses*1 (805.5) (816.9) (11.5)
Banking profit*2 728.8 846.7 117.9
Credit cost 3.2 (61.1) (64.3)
Gains (losses) on stocks 35.3 115.1 79.7
Others (19.4) (36.6) (17.2)
Ordinary profit 747.9 864.0 116.1
Net income 609.2 681.8 72.6
*1 Excluding non-recurring losses*2 Before provision for general reserve for possible loan losses
Consolidated gross profit / Consolidated net business profit / Profit attributable to owners of parent (SMFG Consolidated)
(Trillions of yen)
Financial ReviewCorporate Infrastructure
66 2017 Annual Report
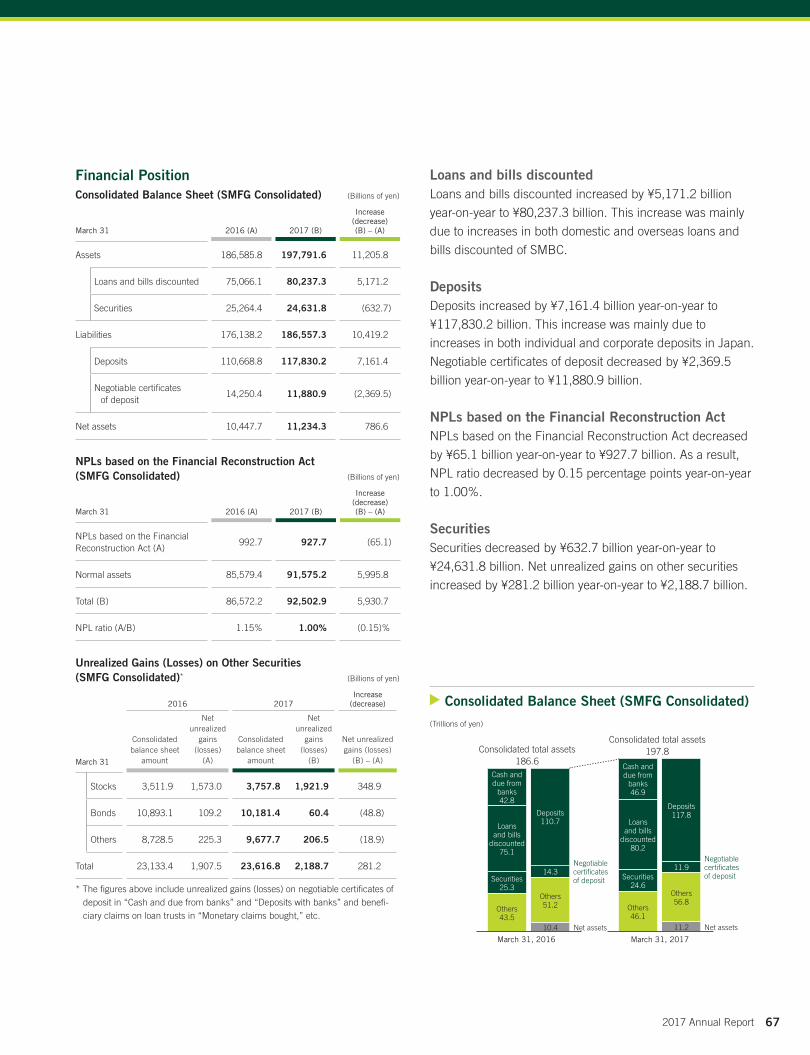
Loans and bills discountedLoans and bills discounted increased by ¥5,171.2 billion
year-on-year to ¥80,237.3 billion. This increase was mainly
due to increases in both domestic and overseas loans and
bills discounted of SMBC.
DepositsDeposits increased by ¥7,161.4 billion year-on-year to
¥117,830.2 billion. This increase was mainly due to
increases in both individual and corporate deposits in Japan.
Negotiable certificates of deposit decreased by ¥2,369.5
billion year-on-year to ¥11,880.9 billion.
NPLs based on the Financial Reconstruction ActNPLs based on the Financial Reconstruction Act decreased
by ¥65.1 billion year-on-year to ¥927.7 billion. As a result,
NPL ratio decreased by 0.15 percentage points year-on-year
to 1.00%.
SecuritiesSecurities decreased by ¥632.7 billion year-on-year to
¥24,631.8 billion. Net unrealized gains on other securities
increased by ¥281.2 billion year-on-year to ¥2,188.7 billion.
Financial PositionConsolidated Balance Sheet (SMFG Consolidated) (Billions of yen)
March 31 2016 (A) 2017 (B)
Increase (decrease)(B) – (A)
Assets 186,585.8 197,791.6 11,205.8
Loans and bills discounted 75,066.1 80,237.3 5,171.2
Securities 25,264.4 24,631.8 (632.7)
Liabilities 176,138.2 186,557.3 10,419.2
Deposits 110,668.8 117,830.2 7,161.4
N egotiable certificates of deposit
14,250.4 11,880.9 (2,369.5)
Net assets 10,447.7 11,234.3 786.6
NPLs based on the Financial Reconstruction Act (SMFG Consolidated) (Billions of yen)
March 31 2016 (A) 2017 (B)
Increase (decrease)(B) – (A)
NPLs based on the Financial Reconstruction Act (A)
992.7 927.7 (65.1)
Normal assets 85,579.4 91,575.2 5,995.8
Total (B) 86,572.2 92,502.9 5,930.7
NPL ratio (A/B) 1.15% 1.00% (0.15)%
Unrealized Gains (Losses) on Other Securities (SMFG Consolidated)* (Billions of yen)
2016 2017Increase
(decrease)
March 31
Consolidated balance sheet
amount
Net unrealized
gains (losses)
(A)
Consolidated balance sheet
amount
Net unrealized
gains (losses)
(B)
Net unrealized gains (losses)
(B) – (A)
Stocks 3,511.9 1,573.0 3,757.8 1,921.9 348.9
Bonds 10,893.1 109.2 10,181.4 60.4 (48.8)
Others 8,728.5 225.3 9,677.7 206.5 (18.9)
Total 23,133.4 1,907.5 23,616.8 2,188.7 281.2
* The figures above include unrealized gains (losses) on negotiable certificates of deposit in “Cash and due from banks” and “Deposits with banks” and benefi-ciary claims on loan trusts in “Monetary claims bought,” etc.
Consolidated Balance Sheet (SMFG Consolidated)(Trillions of yen)
672017 Annual Report
March 31, 2016 March 31, 2017
11.210.4
14.3Negotiable certificates of deposit
Net assetsNet assets
Others46.1
Others43.5
Others56.8
Others51.2
Securities24.6
Securities25.3
Loans and bills
discounted80.2
Loans and bills
discounted75.1
Deposits117.8Deposits
110.7
Cash and due from
banks46.9
Consolidated total assets 186.6
Consolidated total assets 197.8
Cash and due from
banks42.8
11.9Negotiable certificates of deposit
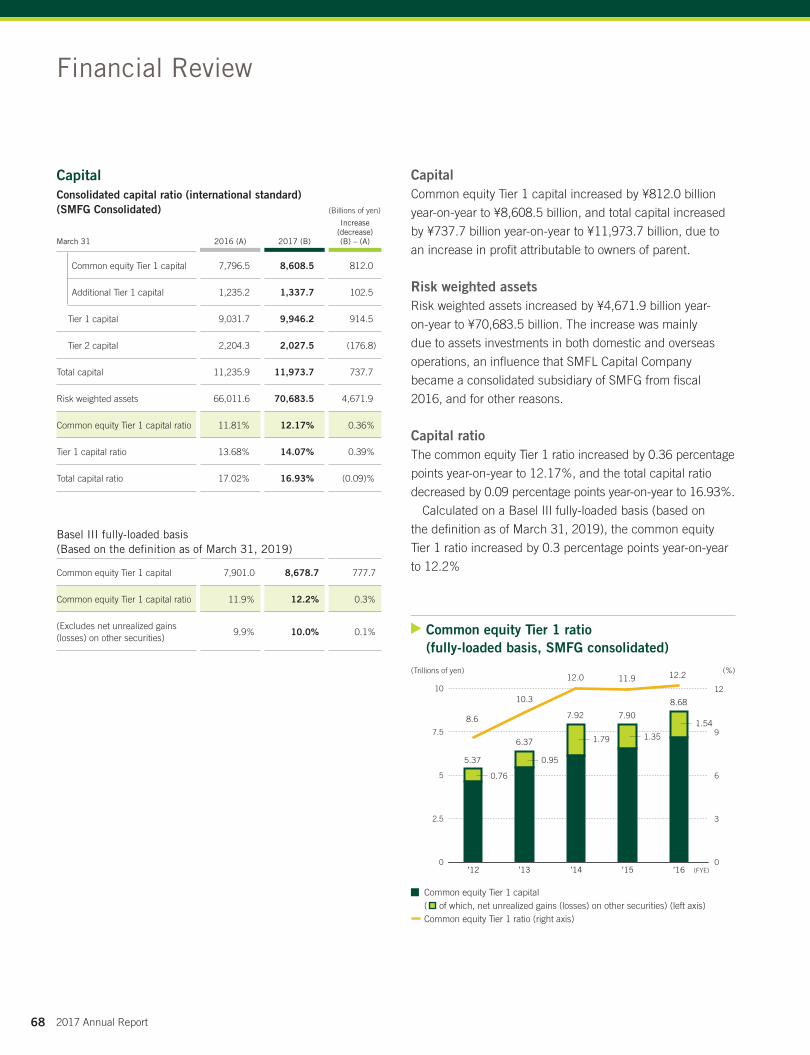
10
7.5
5
2.5
0’12 ’13 ’14 ’15 ’16
12
9
6
3
0(FYE)
Common equity Tier 1 capital ( of which, net unrealized gains (losses) on other securities) (left axis)
Common equity Tier 1 ratio (right axis)
Financial Review
CapitalCommon equity Tier 1 capital increased by ¥812.0 billion
year-on-year to ¥8,608.5 billion, and total capital increased
by ¥737.7 billion year-on-year to ¥11,973.7 billion, due to
an increase in profit attributable to owners of parent.
Risk weighted assetsRisk weighted assets increased by ¥4,671.9 billion year-
on-year to ¥70,683.5 billion. The increase was mainly
due to assets investments in both domestic and overseas
operations, an influence that SMFL Capital Company
became a consolidated subsidiary of SMFG from fiscal
2016, and for other reasons.
Capital ratioThe common equity Tier 1 ratio increased by 0.36 percentage
points year-on-year to 12.17%, and the total capital ratio
decreased by 0.09 percentage points year-on-year to 16.93%.
Calculated on a Basel III fully-loaded basis (based on
the definition as of March 31, 2019), the common equity
Tier 1 ratio increased by 0.3 percentage points year-on-year
to 12.2%
CapitalConsolidated capital ratio (international standard) (SMFG Consolidated) (Billions of yen)
March 31 2016 (A) 2017 (B)
Increase (decrease)(B) – (A)
Common equity Tier 1 capital 7,796.5 8,608.5 812.0
Additional Tier 1 capital 1,235.2 1,337.7 102.5
Tier 1 capital 9,031.7 9,946.2 914.5
Tier 2 capital 2,204.3 2,027.5 (176.8)
Total capital 11,235.9 11,973.7 737.7
Risk weighted assets 66,011.6 70,683.5 4,671.9
Common equity Tier 1 capital ratio 11.81% 12.17% 0.36%
Tier 1 capital ratio 13.68% 14.07% 0.39%
Total capital ratio 17.02% 16.93% (0.09)%
Basel III fully-loaded basis (Based on the definition as of March 31, 2019)
Common equity Tier 1 capital 7,901.0 8,678.7 777.7
Common equity Tier 1 capital ratio 11.9% 12.2% 0.3%
(Excludes net unrealized gains (losses) on other securities)
9.9% 10.0% 0.1% Common equity Tier 1 ratio (fully-loaded basis, SMFG consolidated)
(Trillions of yen) (%)
68 2017 Annual Report
6.37
10.3
7.92
12.0
7.90
11.9
8.68
12.2
0.95
1.79 1.35
1.54
0.76
8.6
5.37

200
150
100
50
0
60
45
30
15
0’12 ’13 ’14 ’15 ’16 (FY)
10
Commemorative dividend
120 120
140150150
29.9
32.7
26.2
20.321.3*
Dividend per share (left axis) Dividend payout ratio (right axis)* Dividend payout ratio including commemorative dividend (¥10 per share)
DividendOur basic policy was to achieve a sustainable increase in
shareholder value and raise dividend per share in a stable
manner by realizing higher profitability and growth through
growth investments with the focus on efficiency of our
capital while enhancing retained earnings to maintain
financial soundness.
In line with this basic policy, SMFG decided the ordinary
dividend per share on common stock was ¥150 in fiscal
2016, the same as in the previous fiscal year.
Ordinary dividend per share(Yen) (%)
692017 Annual Report

SMFG
SMBC Singapore Open
Home Page
http://www.smfg.co.jp/ (Japanese)http://www.smfg.co.jp/english/ (English)
http://www.smfg.co.jp/investor/ (Japanese)http://www.smfg.co.jp/english/investor/ (English)
http://www.smfg.co.jp/responsibility/ (Japanese)http://www.smfg.co.jp/english/responsibility/ (English)
IR Information Corporate Social Responsibility
Japan National Rugby TeamSMBC Nippon Series (Professional Baseball in Japan)
Sponsorship
Websites
SMFG sponsors various sports events.
70 2017 Annual Report
CONTENTS
Group Companies ............................................ 72
Risk Management ............................................. 77
Sumitomo Mitsui Financial Group’s Basic Policy for Customer-Orientated Business Conduct ..... 91
Employees ......................................................... 93
Main Work-Life Balance Support System .......... 96
Corporate Data ................................................. 97
Sumitomo Mitsui Financial Group, Inc.
Directors and Executive Officers .................. 97
SMFG Organization ...................................... 98
Sumitomo Mitsui Banking Corporation
Board of Directors, Corporate Auditors and Executive Officers .................................. 99
SMBC Organization .................................... 102
Principal Subsidiaries and Affiliates ................ 104
Principal Domestic Subsidiaries ................. 104
Principal Overseas Subsidiaries ................. 105
Principal Affiliates ........................................ 106
International Directory .................................... 107
Appendix I
712017 Annual Report

Group Companies (as of March 31, 2017)
The companies of the Sumitomo Mitsui Financial Group (SMFG) primarily conduct commercial banking through the following financial services: leasing, securities, con-sumer finance, system development data processing, and asset management.
Company Name: Sumitomo Mitsui Financial Group, Inc.
Business Description: 1. Management of banking subsidiaries and other
companies that can be treated as subsidiaries under the stipulations of Japan’s Banking Act as well as the performance of ancillary functions
2. Functions that can be performed by bank holding companies under the stipulations of Japan’s Banking Act
Establishment: December 2, 2002Head Office: 1-2, Marunouchi 1-chome, Chiyoda-ku,
Tokyo, JapanChairman of the Board: Koichi Miyata
(Appointed on April 1, 2017)President: Takeshi Kunibe
(Appointed as President on April 1, 2017, Appointed as President and Group Chief Executive Officer on June 29, 2017)
Capital: ¥2,337.8 billionStock Exchange Listings:Tokyo Stock Exchange (First Section)Nagoya Stock Exchange (First Section)Note: American Depositary Receipts (ADRs) are
listed on the New York Stock Exchange.
www.smfg.co.jp/english/
• We grow and prosper together with our customers, by providing services of greater value to them.
• We aim to maximize our shareholders’ value through the continuous growth of our business.
• We create a work environment that encourages and rewards diligent and highly-motivated employees.
Business Mission
Sumitomo Mitsui Banking Corporation (“SMBC”) was established in April 2001 through the merger of two leading banks of The Sakura Bank, Limited and The Sumitomo Bank, Limited. Sumitomo Mitsui Financial Group, Inc. was established in December 2002 as a bank holding company through the share transfer, and SMBC became a wholly owned subsidiary of SMFG. In March 2003, SMBC merged with The Wakashio Bank, Ltd. SMBC’s competitive advantages include its solid and extensive client base, the expedi-tious implementation of strategies, and also the service providing capability of its pre-dominant Group companies. SMBC, as a core member of SMFG, integrally work with other Group companies to provide highly sophisticated and comprehensive financial services to clients.
Company Name: Sumitomo Mitsui Banking CorporationBusiness Profile: Commercial bankingEstablishment: June 6, 1996Head Office: 1-2, Marunouchi 1-chome, Chiyoda-ku,
Tokyo, JapanPresident and CEO: Makoto Takashima
(Appointed on April 1, 2017) (Concurrent Director at Sumitomo Mitsui Financial Group)
Number of Employees: 29,283Number of branches and other business locations: In Japan: 2,094* Branches: 506 (Including 46 specialized deposit account branches) Sub-branches: 431 Banking agencies: 1 Offices handling non-banking business: 23 Automated service centers: 1,133 Overseas: 41 Branches: 18 Sub-branches: 20 Representative offices: 3* The number of domestic branches excludes ATMs
located at retail convenience stores. The number of overseas branches excludes branches to be closing and locally incorporated companies in overseas.
Credit Ratings (as of June 30, 2017)
Long-term Short-termMoody’s A1 P–1Standard & Poor’s A A–1Fitch Ratings A F1R&I AA– a–1+JCR AA J–1+
Financial Information (Consolidated basis, years ended March 31)
Billions of yen2017 2016 2015 2014
For the Year:Ordinary income ������� ¥ 3,014�4 ¥ 3,059�0 ¥ 3,199�4 ¥ 3,105�9Ordinary profit �������� 829�4 930�3 1,198�9 1,298�7Net income ������������� 543�1 680�1 736�9 785�6
At Year-End:Net assets �������������� ¥ 8,908�1 ¥ 9,446�1 ¥ 10,036�0 ¥ 8,640�7Total assets ������������ 180,946�6 180,408�6 177,559�1 155,824�1
Credit Ratings (as of June 30, 2017)
Long-term Short-termMoody’s A1 P–1Standard & Poor’s A– —Fitch Ratings A F1R&I A+ —JCR AA– —
Financial Information (Consolidated basis, years ended March 31)
Billions of yen2017 2016 2015 2014
For the Year:Ordinary income �������� ¥ 5,133�2 ¥ 4,772�1 ¥ 4,851�2 ¥ 4,641�8Ordinary profit��������� 1,005�8 985�2 1,321�1 1,432�3Profit attributable to owners of parent ����� 706�5 646�6 753�6 835�3
At Year-End:Net assets �������������� ¥ 11,234�2 ¥ 10,447�6 ¥ 10,696�2 ¥ 9,005�0Total assets ������������ 197,791�6 186,585�8 183,442�5 161,534�3
www.smbc.co.jp/global/index.htmlSUMITOMO MITSUI Banking Corporation
72 2017 Annual Report
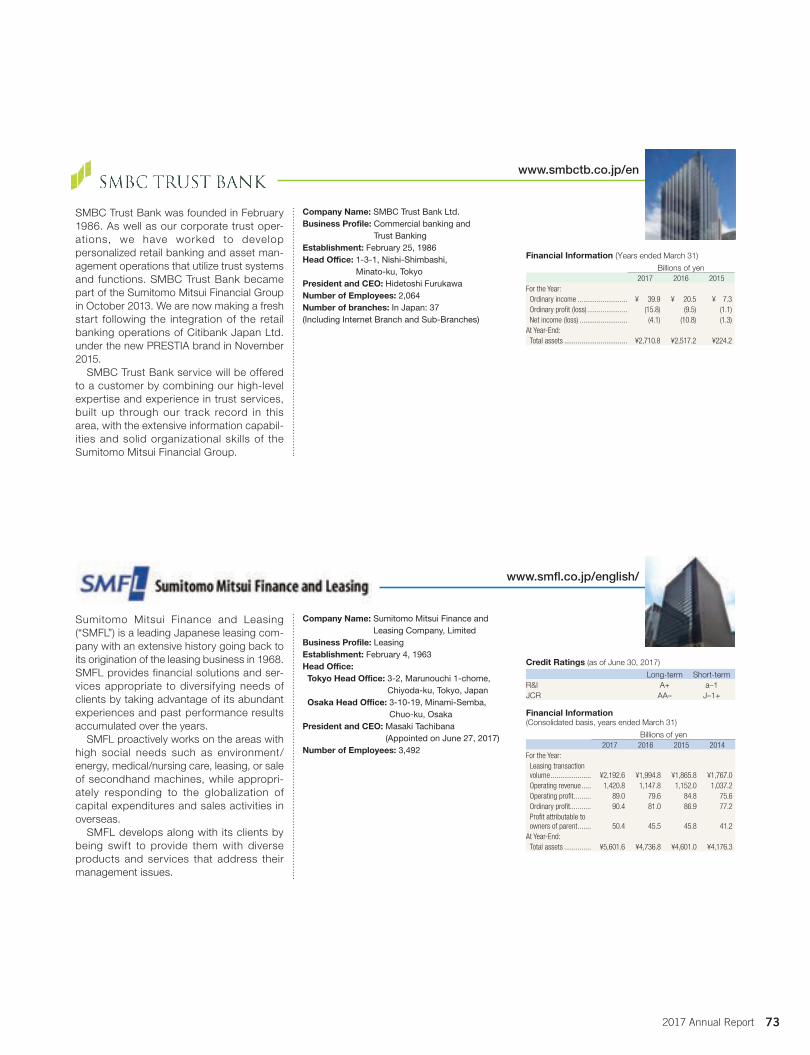
www.smfl.co.jp/english/
Sumitomo Mitsui Finance and Leasing (“SMFL”) is a leading Japanese leasing com-pany with an extensive history going back to its origination of the leasing business in 1968. SMFL provides financial solutions and ser-vices appropriate to diversifying needs of clients by taking advantage of its abundant experiences and past performance results accumulated over the years. SMFL proactively works on the areas with high social needs such as environment/energy, medical/nursing care, leasing, or sale of secondhand machines, while appropri-ately responding to the globalization of capital expenditures and sales activities in overseas. SMFL develops along with its clients by being swift to provide them with diverse products and services that address their management issues.
Company Name: Sumitomo Mitsui Finance and Leasing Company, Limited
Business Profile: LeasingEstablishment: February 4, 1963Head Office: Tokyo Head Office: 3-2, Marunouchi 1-chome,
Chiyoda-ku, Tokyo, Japan Osaka Head Office: 3-10-19, Minami-Semba,
Chuo-ku, OsakaPresident and CEO: Masaki Tachibana
(Appointed on June 27, 2017)Number of Employees: 3,492
Credit Ratings (as of June 30, 2017)
Long-term Short-termR&I A+ a–1JCR AA– J–1+
Financial Information (Consolidated basis, years ended March 31)
Billions of yen2017 2016 2015 2014
For the Year:Leasing transaction volume ��������������������� ¥2,192�6 ¥1,994�8 ¥1,865�8 ¥1,767�0Operating revenue ����� 1,420�8 1,147�8 1,152�0 1,037�2Operating profit ��������� 89�0 79�6 84�8 75�6Ordinary profit����������� 90�4 81�0 86�9 77�2Profit attributable to owners of parent ������� 50�4 45�5 45�8 41�2
At Year-End:Total assets �������������� ¥5,601�6 ¥4,736�8 ¥4,601�0 ¥4,176�3
www.smbctb.co.jp/en
SMBC Trust Bank was founded in February 1986. As well as our corporate trust oper-ations, we have worked to develop personalized retail banking and asset man-agement operations that utilize trust systems and functions. SMBC Trust Bank became part of the Sumitomo Mitsui Financial Group in October 2013. We are now making a fresh start following the integration of the retail banking operations of Citibank Japan Ltd. under the new PRESTIA brand in November 2015. SMBC Trust Bank service will be offered to a customer by combining our high-level expertise and experience in trust services, built up through our track record in this area, with the extensive information capabil-ities and solid organizational skills of the Sumitomo Mitsui Financial Group.
Company Name: SMBC Trust Bank Ltd.Business Profile: Commercial banking and
Trust BankingEstablishment: February 25, 1986Head Office: 1-3-1, Nishi-Shimbashi,
Minato-ku, TokyoPresident and CEO: Hidetoshi FurukawaNumber of Employees: 2,064Number of branches: In Japan: 37 (Including Internet Branch and Sub-Branches)
Financial Information (Years ended March 31)
Billions of yen2017 2016 2015
For the Year:Ordinary income �������������������������� ¥ 39�9 ¥ 20�5 ¥ 7�3Ordinary profit (loss) ��������������������� (15�8) (9�5) (1�1)Net income (loss) ������������������������� (4�1) (10�8) (1�3)
At Year-End:Total assets ��������������������������������� ¥2,710�8 ¥2,517�2 ¥224�2
732017 Annual Report

www.smbc-friend.co.jp
SMBC Friend Securities Co., Ltd., is a full-service securities firm with a business focused mainly on retail clients. SMBC Friend Securities provides highly efficient nation-wide network operations offering services closely tailored to the needs of its clients and communities while operating a new business model of online financial consulting services. SMBC Friend Securities will continue to develop consistently toward its goal of becoming “the securities company especially appreciated by clients,” offering high-quality products and services accommodating the needs of its clients and building trust for its clients.
Company Name: SMBC Friend Securities Co., Ltd.Business Profile: SecuritiesEstablishment: March 2, 1948Head Office: 7-12, Nihonbashi Kabuto-cho,
Chuo-ku, TokyoPresident and CEO: Koichi DannoNumber of Employees: 1,755
SMBC Nikko Securities and SMBC Friend Securities are scheduled to merge in January 2018 assuming approval is received from the relevant authorities.
Financial Information (Years ended March 31)
Billions of yen2017 2016 2015 2014
For the Year:Ordinary income ������� ¥ 42�4 ¥ 43�0 ¥ 50�0 ¥ 57�7Operating profit ��������� 4�7 4�1 9�8 15�0Ordinary profit����������� 5�7 5�2 10�4 15�3Net income ��������������� 0�7 3�2 7�4 10�0
At Year-End:Total assets �������������� ¥319�7 ¥305�6 ¥353�2 ¥338�3
www.smbcnikko.co.jp/en
SMBC Nikko Securities Inc. (formerly Nikko Cordial Securities Inc.), is approaching its centenary in 2018. During its almost 100 years in business, it has built strong relation-ships founded on trust with individual and corporate clients. Since bringing its long experience and solid customer base into the SMFG Group in October 2009, the company has pursued banking-securities collaboration with SMBC in its role as core Group member, seeking to leverage on collective strengths to provide financial services of the highest qual-ity. ‘Share the Future’ is the brand slogan as SMBC Nikko Securities strives to be a lead-ing Japanese full-line securities company capable of offering high quality financial products and services globally.
Company Name: SMBC Nikko Securities Inc.Business Profile: SecuritiesEstablishment: June 15, 2009Head Office: 3-1, Marunouchi 3-chome,
Chiyoda-ku, TokyoPresident and CEO: Yoshihiko Shimizu Number of Employees: 8,807
Credit Ratings (as of June 30, 2017)
Long-term Short-termMoody’s A1 P–1Standard & Poor’s A A–1R&I AA– a–1+JCR AA —
Financial Information (Years ended March 31)
Billions of yen2017 2016 2015 2014
For the Year:Operating revenue ����� ¥ 334�4 ¥ 297�9 ¥ 332�6 ¥ 333�4Operating income������ 69�0 46�9 89�1 96�6Ordinary profit����������� 70�5 48�3 93�2 97�1Net income ��������������� 39�4 33�1 62�5 61�4
At Year-End:Total assets �������������� ¥11,536�9 ¥10,346�2 ¥9,231�8 ¥7,125�5
(Japanese only)
74 2017 Annual Report
www.cedyna.co.jp/english/
Cedyna Financial Corporation was formed in April 2009 as a result of the merger of OMC Card, Inc., Central Finance Co., Ltd. and QUOQ Inc., consolidating their client bases, marketing capabilities and expert knowl-edge. As a member of SMFG, it strives to become “the number one credit card busi-ness entity in Japan” by closely working with Sumitomo Mitsui Card Company. Cedyna strives to become SMFG’s com-prehensive payment finance company in the consumer finance business by integrating the credit card, consumer credit and financ-ing solution core businesses, and providing individual clients with secure and convenient payment methods means for making payments.
Company Name: Cedyna Financial CorporationBusiness Profile: Credit card and installmentEstablishment: September 11, 1950Head Office: Head Office: 3-23-20, Marunouchi,
Naka-ku, Nagoya Tokyo Head Office: 2-16-4, Konan,
Minato-ku, TokyoPresident and CEO: Satoru NakanishiNumber of Employees: 3,339
Financial Information (Years ended March 31)
Billions of yen2017 2016 2015 2014
For the Year:Operating revenue ����� ¥ 152�1 ¥ 149�9 ¥ 149�8 ¥ 160�0Operating profit ��������� 7�0 0�4 1�0 10�7Ordinary profit����������� 7�1 0�4 1�1 11�2Net income ��������������� 14�2 0�2 24�4 16�3
At Year-End:Total assets �������������� ¥2,112�5 ¥2,037�8 ¥1,957�5 ¥1,977�9Number of cardholders (in thousands) ����������� 16,650 17,020 17,633 18,412
www.smbc-card.com
As the pioneer in the issuance of the Visa Card in Japan and a leader in the domestic credit card industry, Sumitomo Mitsui Card Company, Limited, enjoys the strong support of its many customers and plays a major role as one of the strategic businesses of SMFG. Leveraging its strong brand image and its excellent capabilities across a wide range of card-related services, the company provides settlement and financing services focused around providing credit services that meet customer needs. Through its credit card business operations, the company aims to actively contribute to the realization of com-fortable and affluent consumer lifestyles and make further dramatic advances as a leading brand in its industry sector.
Company Name: Sumitomo Mitsui Card Company, Limited
Business Profile: Credit cardEstablishment: December 26, 1967Head Office: Tokyo Head Office: 1-2-20, Kaigan,
Minato-ku, Tokyo Osaka Head Office: 4-5-15, Imabashi,
Chuo-ku, OsakaPresident and CEO: Ken Kubo Number of Employees: 2,460
Credit Ratings (as of June 30, 2017)
Long-term Short-termR&I AA– a–1+JCR AA– J–1+
Financial Information (Years ended March 31)
Billions of yen2017 2016 2015 2014
For the Year:Revenue from credit card operations ��������� ¥12,262�7 ¥11,360�6 ¥10,091�0 ¥9,131�5Operating revenue ����� 223�4 210�1 198�4 191�4Operating profit ��������� 34�7 40�5 41�9 43�6Ordinary profit����������� 34�5 40�5 42�0 43�7Net income ��������������� 24�4 26�6 25�9 23�4
At Year-End:Total assets �������������� ¥ 1,500�7 ¥ 1,356�3 ¥ 1,271�7 ¥1,218�4Number of cardholders (in thousands) ����������� 25,731 24,239 23,490 22,994
(Japanese only)
752017 Annual Report
www.jri.co.jp/english/
www.smam-jp.com/english/
The Japan Research Institute, Limited (JRI) is a comprehensive information services com-pany with information systems, consulting, and think-tank functions. In addition to pro-viding IT-based strategic data systems planning and development and outsourcing services, JRI offers consultation in areas such as management strategy and admin reforms. It also engages in activities ranging from economic research and analysis on Japan and other countries and policy recom-mendation to business incubation.
Company Name: The Japan Research Institute, Limited
Business Profile: System development, data pro-cessing, management consulting and economic research
Establishment: November 1, 2002Head Office: Tokyo Head Office: 2-18-1, Higashi-Gotanda,
Shinagawa-ku, Tokyo Osaka Head Office: 2-2-4, Tosabori,
Nishi-ku, OsakaPresident and CEO: Masahiro FuchizakiNumber of Employees: 2,442
Sumitomo Mitsui Asset Management Com-pany Limited (SMAM), as one of the Japanese top-tier asset managers, contrib-utes to clients’ wealth building with highest quality products and services. Since July 2016, the company has been a consolidated company of SMFG. SMAM has always placed “Customer- oriented Business Conduct” at the center of its day-to-day business activities as seen in the fact the company ahead of other Japa-nese asset managers expressed “Our Commitment to Fiduciary Duties.” For the future, SMAM will continue to fulfill its respon-sibilities by improvement of quality and speed of business process as well as development of products and services enhancing Quality of Life of our clients. Above all, it is our mission to accelerate shifts from savings to wealth build-ing with further satisfaction of our clients.
Company Name: Sumitomo Mitsui Asset Management Company, Limited
Business Profile: Investment management (discretionary/advisory) and investment trust fund management
Establishment: July 15, 1985Head Office: 2-5-1 Atago, Minato-ku, TokyoPresident and CEO: Takashi MatsushitaNumber of Employees: 642
Financial Information (Years ended March 31)
Billions of yen2017 2016 2015 2014
For the Year:Operating revenue ����� ¥132�9 ¥125�0 ¥111�1 ¥106�0Operating profit ��������� 2�2 2�2 1�7 1�7Ordinary profit����������� 2�0 1�8 1�5 1�5Net income ��������������� 1�5 1�3 0�5 0�7
At Year-End:Total assets �������������� ¥103�2 ¥101�8 ¥ 93�0 ¥ 89�5
Financial Information (Years ended March 31)
Billions of yen2017 2016 2015 2014
For the Year:Operating revenue ����� ¥39�1 ¥41�7 ¥36�1 ¥36�3Operating profit ��������� 4�5 5�5 3�7 4�7Ordinary profit����������� 4�6 5�5 3�7 4�7Net income ��������������� 3�5 4�0 1�9 3�3
At Year-End:Total assets �������������� ¥46�5 ¥45�1 ¥42�1 ¥41�0
www.smbc-cf.com/english/
Cooperation:SHOCHIKU Co., Ltd.,
Kabuki-za Co., Ltd.
Since its establishment in 1962, with the original goal of striving to be the best in offer-ing innovative f inancial services for consumers, Promise Co., Ltd., currently known as SMBC Consumer Finance Co., Ltd., has developed convenient loan prod-ucts for individuals to accommodate to the changing times and has created an appropri-ate system for offering loan consultation services and executing loan agreements. SMBC Consumer Finance strives to become the kind of global consumer finance company which “would be able to earn the utmost trust of clients” by consistently and sincerely working with clients as an expert in the consumer finance business.
Company Name: SMBC Consumer Finance Co., Ltd.Business Profile: Consumer lendingEstablishment: March 20, 1962Head Office: 4-12-15, Ginza, Chuo-ku, TokyoPresident and CEO: Ryoji YukinoNumber of Employees: 2,267
Credit Ratings (as of June 30, 2017)
Long-term Short-termR&I A —JCR A– —
Financial Information (Years ended March 31)
Billions of yen2017 2016 2015 2014
For the Year:Operating revenue ����� ¥186�2 ¥178�3 ¥168�6 ¥164�7Operating profit (loss) �� 51�6 (72�3) 3�7 15�9Ordinary profit����������� 51�8 (72�3) 3�7 15�5Net income ��������������� 100�8 (72�1) 1�5 19�0
At Year-End:Total assets �������������� ¥925�8 ¥858�5 ¥833�3 ¥821�5
76 2017 Annual Report
Risk Management
Basic ApproachAs risks in the financial services increase in diversity and complexity,
risk management—identifying, measuring, and controlling risks—
has never been more important in the management of a financial
holding company.
SMFG has established group-wide basic policies for risk man-
agement to put forth concrete directives for appropriately managing
risks on a group-wide basis. Adhering to these policies, we identify
the location and the types of risk to be managed in accordance with
strategic goals and business structures and strive to manage each
risk appropriately based on its characteristics.
1. Comprehensive Risk ManagementSMFG takes a comprehensive and systematic approach to risk
management, with risk analysis by stress testing and risk capital
management following the ascertainment of environment and risk
views, including Top Risks (see page 53).
Top RisksThe major Top Risks recognized by SMFG and examples of the
scenarios that could potentially result from these risks are listed in
the table below (see page 53 for information on methods of utilizing
Top Risks).
2. Risk Management SystemAt SMFG, top management plays an active role in the risk manage-
ment process out of recognition for the importance of risk manage-
ment. The group-wide basic policies for risk management are to be
determined by the Management Committee before being authorized
by the Board of Directors. In addition, SMFG has appointed the
Group CRO that is tasked with promoting appropriate risk manage-
ment by developing an understanding of and managing risks in an
integrated manner on a group-wide basis.
Group companies have established risk management systems
based on their business characteristics (see page 55).
Implementation of the Basel Capital AccordThe Basel III regulatory framework was established on March 31,
2013, based on the lessons learned from the global financial crisis
that spanned from 2008 to 2009. This framework consists of cap-
ital, leverage, and liquidity ratios designed to maintain sound oper-
ating standards for internationally active banks. SMFG calculates its
ratios in accordance with the standards for Japanese banks.
The Financial Stability Board (FSB) designates Global
Systematically Important Banks (G-SIBs) and arranges them into
one of five bucket categories. Banks designated as G-SIBs are obli-
gated to maintain even higher capital ratios based on their bucket
(1.0% to 3.5% higher than the standard obligation). As of March
31, 2017, SMFG was designated as a bucket 1 G-SIB and was
obligated to achieve a phased increase in its capital ratio to raise
it above the standard obligation by the lowest amount required of
G-SIBs (1.0%).
In addition, the Basel Committee on Banking Supervision is
engaged in ongoing discussions regarding the revision of risk asset
calculation methods as well as the revision of minimum capital
levels (so-called “capital floors”) and other capital ratio regulations.
Furthermore, unique financial regulations are being introduced in major
countries and regions. In light of these developments, SMFG has
identified trends in international financial regulations as one of its Top
Risks. We will thus monitor the direction of these discussions, mea-
sure the potential impact on our operations, and respond accordingly.
Appropriate revisions to regulations for financial institutions can
contribute to stability in the financial system, but excessive regu-
lation can result in constraints on the intermediary function of the
institutions, which in turn can adversely impact the real economy.
SMFG is therefore pursuing a cooperative approach with the relevant
authorities and other financial institutions, making its views known to
contribute to the development of appropriate regulatory frameworks.
Top Risks Example Risk ScenariosGlobal political and economic trends Slowdown in the global economy resulting from increased opaqueness in the U.S. or European political climates, stagnancy in
the economies of China or emerging countries, sharp resource price movements, etc. Geopolitical risks faced around the world (including terrorism)
Slowdown in the economies of specific countries resulting from the increased geopolitical risks associated with the Korean peninsula, domestic or overseas acts of terrorism, etc.
Monetary policy and economic trends in Japan Deterioration of financial institutions’ earnings resulting from further application of negative interest rate policies by the Bank of Japan; economic slowdown or increased financial instability in Japan resulting from yen appreciation, sluggish foreign demand, poor market conditions, etc.
Trends in international financial regulations Higher capital or liquidity requirements due to the institution of stricter international financial regulations; implementation and enforcement of unique or stricter regulations in principal countries
Lack of reliability in relation to foreign currency procurement
Lack of reliability or efficiency with regard to foreign currency procurement due to operating environment changes including rising foreign currency procurement costs or cash outflows at major institutions holding foreign currency deposits
Legal or compliance-related incidents Damage to reputation due to incurring government penalties, fines, other sanctions as a result of incidents stemming from misconduct, etc.
Deterioration of conditions at major borrowers Weakening of the Company’s financial base as a result of deterioration of conditions at major borrowersLack of human resources necessary for enacting strategies (lack of personnel numbers, individuals with specialized skills, etc.)
Difficulty in securing human resources to work in strategic or specialized fields or in maintaining a sufficient base of diverse employees
Ceased operation of information systems due to cyber attacks
Difficulty in maintaining business continuity due to ceased operation or destruction of information systems following cyber attacks, etc.
Changes in competitive climate due to emergence of FinTech or other new technologies
Decreased profitability due to significant erosion of the Company’s market share or necessity of incurring costs that place downward pressure on performance as a result of intensified competition following entry into the financial industry by companies from other industries
Earthquakes and other natural disasters Halting of operations of business partners as a result of supply chain disruptions, system failures, etc.Adverse impacts on the Company’s profits from store closures, system failures, etc.
Note: The above is only a portion of the risks recognized by SMFG. It is possible that the materialization of risks other than those listed above could have a significant impact on the Company’s management.
772017 Annual Report
Risk-Weighted AssetsRisk-weighted assets subject to the Basel Capital Accord totaled
¥70,683.5 billion as of March 31, 2017, up ¥4,671.9 billion from
March 31, 2016. The main factors behind the increase in risk-
weighted assets were a rise in the balance of credits to corporates
and increases in equity and fund market prices and positions (credit
risk), an increase in trading positions and a revision in the method-
ology for risk quantification to reflect recent market circumstances
such as negative interest rate in Japan (market risk).
■ Risk-Weighted Assets as of March 31, 2017 (Trillions of yen)
March 31, 2016
March 31, 2017 Increase
Credit risk 61.2 64.4 +3.2Market risk 1.5 2.8 +1.3Operational risk 3.3 3.5 +0.2Total 66.0 70.7 +4.7
Credit Risk
1. Basic Approach to Credit Risk Management(1) Definition of Credit RiskCredit risk is the possibility of a loss arising from a credit event, such
as deterioration in the financial condition of a borrower, that causes
an asset (including off-balance sheet transactions) to lose value or
become worthless.
(2) Fundamental Principles for Credit Risk ManagementAll Group companies follow the fundamental principles established
by SMFG to assess and manage credit risk on a group-wide basis
and further raise the level of accuracy and comprehensiveness of
group-wide credit risk management. Each Group company must
comprehensively manage credit risk according to the nature of its
business, and assess and manage credit risk of individual loans and
credit portfolios quantitatively and using consistent standards.
Credit risk is the most significant risk to which SMFG is
exposed. Without effective credit risk management, the impact of
the corresponding losses on operations can be overwhelming.
The purposes of credit risk management is to keep credit risk
exposure to a permissible level relative to capital, to maintain the
soundness of group-wide assets, and to ensure returns commen-
surate with risk. Doing so leads to a loan portfolio that achieves high
returns on capital and assets.
(3) Credit PolicySMFG’s Group credit policy comprises clearly stated universal and
basic operating concepts, policies, and standards for credit oper-
ations, in accordance with our business mission and rules of con-
duct.SMFG is promoting the understanding of and strict adherence
to its Group credit policy among all its managers and employees.
By fostering a culture of appropriate levels of risk-taking and pro-
viding high-value-added financial services, SMFG aims to enhance
shareholder value and play a key contributory role in the community.
2. Credit Risk Management SystemAt SMFG, the Group CRO formulates credit risk management
policies each year based on the group-wide basic policies for risk
management. Meanwhile, the Credit & Investment Planning
Department is responsible for the comprehensive management of
credit risk. This department drafts and administers credit risk regula-
tions, including the Group credit policies, manages non- performing
loans (NPLs), and performs other aspects of credit portfolio manage-
ment. The Company has also established the Credit Risk Committee
to serve as a body for deliberating on matters related to group-wide
credit portfolios.
At SMBC, the core bank of SMFG, the Credit & Investment
Planning Department within the Risk Management Unit furnishes the
credit risk management system and is thus responsible for the com-
prehensive management of credit risk. This department drafts and
administers credit policies, the internal rating system, credit authority
guidelines, and credit application guidelines, and also manages
NPLs and performs other aspects of credit portfolio management.
The department also cooperates with the Corporate Risk
Management Department in quantifying credit risk (risk capital and
risk-weighted assets) and controls the bank’s entire credit risk.
Further, the Credit Portfolio Management Department within the
Credit & Investment Planning Department has been strengthening
its active portfolio management function for stable credit portfolios
mainly through credit derivatives and the sales of loans.
The credit departments within each business unit conduct credit
risk management, along with the branches, for loans handled by
their units and manage their units’ portfolios. The credit approval
authority is determined based on the credit amount and internal
grades, while credit departments focus on the analysis and manage-
ment of customers and transactions with relatively high credit risk.
The Credit Administration Department is responsible for han-
dling NPLs of borrowers classified as potentially bankrupt or lower,
and draws up plans for their workouts, including write-offs. It works
to efficiently reduce the amount of NPLs through Group company
SMBC Servicer Co., Ltd., which engages in related services, and by
such means as the sell-off of claims.
Through industrial and sector-specific surveys and studies of
individual companies, the Corporate Research Department works to
form an accurate idea of the circumstances of borrower companies
and quickly identify those with potentially troubled credit positions
as well as promising growth companies.
78 2017 Annual Report

The Internal Audit Unit, operating independently of the business
units, audits asset quality, the accuracy of gradings and self-assess-
ment, and the state of credit risk management, and reports the results
directly to the Board of Directors and the Management Committee.
SMBC has established the Credit Risk Committee as a con-
sultative body to round out its oversight system for undertaking
flexible and efficient control of credit risks, and ensuring the overall
soundness of the bank’s loan operations.
3. Credit Risk Management Methods(1) Credit Risk Assessment and QuantificationAt SMFG, to effectively manage the risk involved in individual loans
as well as the credit portfolio as a whole, we first acknowledge that
every loan entails credit risks, assess the credit risk posed by each
borrower and loan using an internal rating system, and quantify that
risk for control purposes.
(a) Internal Rating System
There is an internal rating system for each asset control category
established according to portfolio characteristics. For example,
credits to corporates are assigned an “obligor grade,” which indi-
cates the borrower’s creditworthiness, and/or “facility grade,” which
indicates the collectibility of assets taking into account transaction
conditions, such as guarantee/collateral, credit period, and tenor.
An obligor grade is determined by first assigning a financial grade
using a financial strength grading model and data obtained from the
obligor’s financial statements. The financial grade is then adjusted
taking into account the actual state of the obligor’s balance sheet
and qualitative factors to derive the obligor grade. In the event that
the borrower is domiciled overseas, internal ratings for credit are
made after taking into consideration country rank, which represents
an assessment of the credit quality of each country, based on its
political and economic situation as well as its current account bal-
ance and external debt.
The borrower categories used in self-assessment are consistent
with the obligor grade categories. Obligor grades and facility grades
are reviewed once a year, and whenever necessary, such as when
there are changes in the credit situation. There are also grading
systems for loans to individuals and project finance and other struc-
tured finance tailored according to the risk characteristics of these
types of assets.
The Credit & Investment Planning Department centrally man-
ages the internal rating systems and properly designs, operates,
supervises, and validates the grading models.
It validates the grading models of main assets following the proce-
dures manual (including those for statistical validation) once a year
to ensure their effectiveness and suitability.
(b) Quantification of Credit Risk
Credit risk quantification refers to the process of estimating the
degree of credit risk of a portfolio or individual loan taking into
account not just the obligor’s Probability of Default (PD) but also the
concentration of risk in a specific customer or industry and the loss
impact of fluctuations in the value of collateral, such as real estate
and securities.
J1
J2
J3
J4
J5
J6
J7
J8
J9
J10
G1
G2
G3
G4
G5
G6
G7
G8
G9
G10
Domestic (C&I), etc.
Overseas (C&I), etc.
Obligor Grade
NormalAssets
Substandard Loans
DoubtfulAssets
Bankrupt andQuasi-Bankrupt
Assets
Financial Reconstruction Act Based Disclosure Category
Very high certainty of debt repayment
High certainty of debt repayment
Satisfactory certainty of debt repayment
Debt repayment is likely but this could change in cases of significant changes in economic trends or business environment
No problem with debt repayment over the short term, but not satisfactory over the mid to long term and the situation could change in cases of significant changes in economic trends or business environment
Currently no problem with debt repayment, but there are unstable business and financial factors that could lead to debt repayment problems
Close monitoring is required due to problems in meeting loan terms and conditions, sluggish/unstable business, or financial problems
(Borrowers Requiring Caution identified as Substandard Borrowers)
Currently not bankrupt, but experiencing business difficulties, making insufficient progress in restructuring, and highly likely to go bankrupt
Though not yet legally or formally bankrupt, has serious business difficulties and rehabilitation is unlikely; thus, effectively bankrupt
Legally or formally bankrupt
NormalBorrowers
Substandard Borrowers
Potentially Bankrupt Borrowers
BorrowersRequiring Caution
EffectivelyBankrupt Borrowers
BankruptBorrowers
DefinitionBorrowerCategory
J7R G7R
■SMBC’s Obligor Grading System
792017 Annual Report
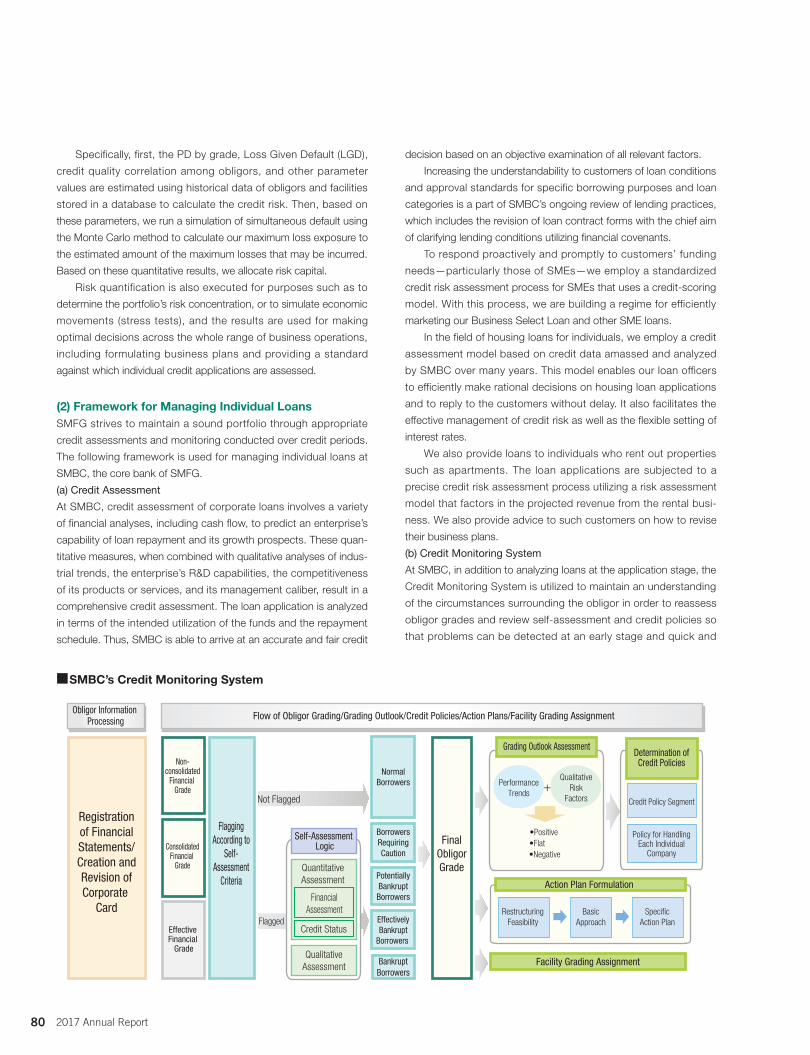
Specifically, first, the PD by grade, Loss Given Default (LGD),
credit quality correlation among obligors, and other parameter
values are estimated using historical data of obligors and facilities
stored in a database to calculate the credit risk. Then, based on
these parameters, we run a simulation of simultaneous default using
the Monte Carlo method to calculate our maximum loss exposure to
the estimated amount of the maximum losses that may be incurred.
Based on these quantitative results, we allocate risk capital.
Risk quantification is also executed for purposes such as to
determine the portfolio’s risk concentration, or to simulate economic
movements (stress tests), and the results are used for making
optimal decisions across the whole range of business operations,
including formulating business plans and providing a standard
against which individual credit applications are assessed.
(2) Framework for Managing Individual LoansSMFG strives to maintain a sound portfolio through appropriate
credit assessments and monitoring conducted over credit periods.
The following framework is used for managing individual loans at
SMBC, the core bank of SMFG.
(a) Credit Assessment
At SMBC, credit assessment of corporate loans involves a variety
of financial analyses, including cash flow, to predict an enterprise’s
capability of loan repayment and its growth prospects. These quan-
titative measures, when combined with qualitative analyses of indus-
trial trends, the enterprise’s R&D capabilities, the competitiveness
of its products or services, and its management caliber, result in a
comprehensive credit assessment. The loan application is analyzed
in terms of the intended utilization of the funds and the repayment
schedule. Thus, SMBC is able to arrive at an accurate and fair credit
decision based on an objective examination of all relevant factors.
Increasing the understandability to customers of loan conditions
and approval standards for specific borrowing purposes and loan
categories is a part of SMBC’s ongoing review of lending practices,
which includes the revision of loan contract forms with the chief aim
of clarifying lending conditions utilizing financial covenants.
To respond proactively and promptly to customers’ funding
needs—particularly those of SMEs—we employ a standardized
credit risk assessment process for SMEs that uses a credit-scoring
model. With this process, we are building a regime for efficiently
marketing our Business Select Loan and other SME loans.
In the field of housing loans for individuals, we employ a credit
assessment model based on credit data amassed and analyzed
by SMBC over many years. This model enables our loan officers
to efficiently make rational decisions on housing loan applications
and to reply to the customers without delay. It also facilitates the
effective management of credit risk as well as the flexible setting of
interest rates.
We also provide loans to individuals who rent out properties
such as apartments. The loan applications are subjected to a
precise credit risk assessment process utilizing a risk assessment
model that factors in the projected revenue from the rental busi-
ness. We also provide advice to such customers on how to revise
their business plans.
(b) Credit Monitoring System
At SMBC, in addition to analyzing loans at the application stage, the
Credit Monitoring System is utilized to maintain an understanding
of the circumstances surrounding the obligor in order to reassess
obligor grades and review self-assessment and credit policies so
that problems can be detected at an early stage and quick and
■SMBC’s Credit Monitoring System
Obligor Information Processing Flow of Obligor Grading/Grading Outlook/Credit Policies/Action Plans/Facility Grading Assignment
Not Flagged
Self-Assessment Logic
NormalBorrowers
BorrowersRequiringCaution
PotentiallyBankruptBorrowers
EffectivelyBankrupt
Borrowers
BankruptBorrowers
Grading Outlook Assessment
PerformanceTrends
QualitativeRisk
Factors
•Positive•Flat•Negative
Action Plan Formulation
Facility Grading Assignment
Determination ofCredit Policies
Policy for HandlingEach Individual
Company
Credit Policy Segment
Flagged
Registrationof FinancialStatements/Creation andRevision ofCorporate
Card
Non-consolidated
Financial Grade
ConsolidatedFinancial
Grade
Effective Financial
Grade
FlaggingAccording to
Self-Assessment
CriteriaQuantitativeAssessment
FinancialAssessment
Credit Status
QualitativeAssessment
RestructuringFeasibility
FinalObligorGrade
BasicApproach
SpecificAction Plan
+
80 2017 Annual Report
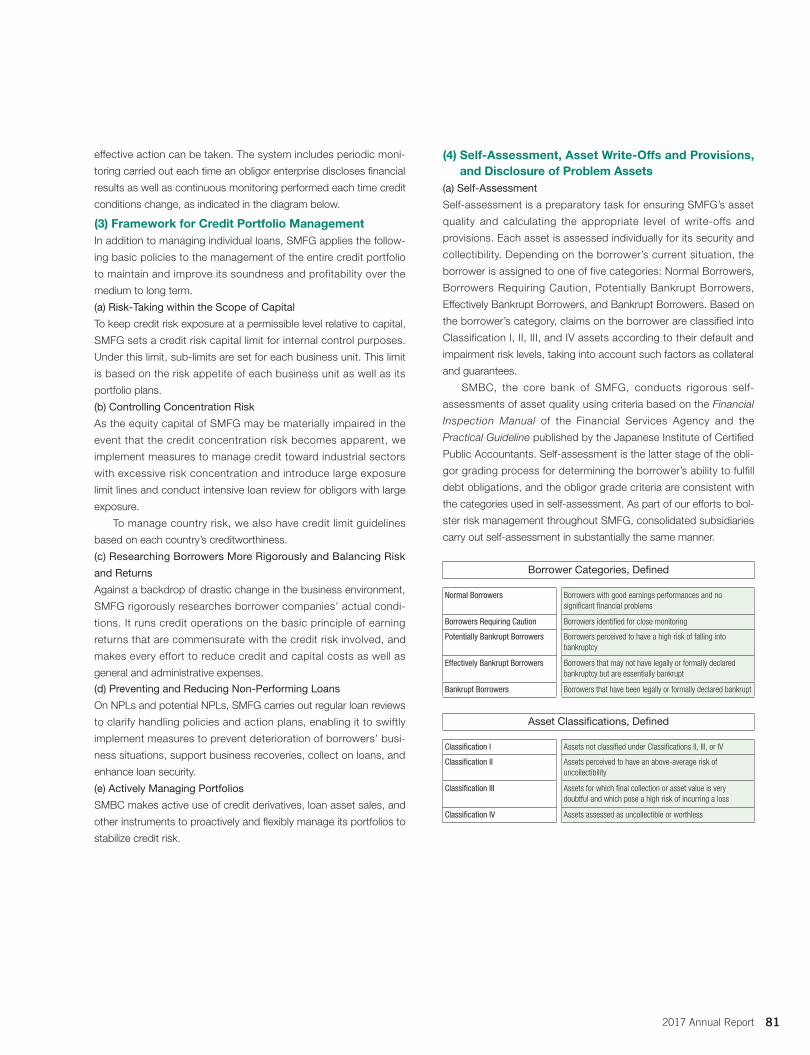
effective action can be taken. The system includes periodic moni-
toring carried out each time an obligor enterprise discloses financial
results as well as continuous monitoring performed each time credit
conditions change, as indicated in the diagram below.
(3) Framework for Credit Portfolio ManagementIn addition to managing individual loans, SMFG applies the follow-
ing basic policies to the management of the entire credit portfolio
to maintain and improve its soundness and profitability over the
medium to long term.
(a) Risk-Taking within the Scope of Capital
To keep credit risk exposure at a permissible level relative to capital,
SMFG sets a credit risk capital limit for internal control purposes.
Under this limit, sub-limits are set for each business unit. This limit
is based on the risk appetite of each business unit as well as its
portfolio plans.
(b) Controlling Concentration Risk
As the equity capital of SMFG may be materially impaired in the
event that the credit concentration risk becomes apparent, we
implement measures to manage credit toward industrial sectors
with excessive risk concentration and introduce large exposure
limit lines and conduct intensive loan review for obligors with large
exposure.
To manage country risk, we also have credit limit guidelines
based on each country’s creditworthiness.
(c) Researching Borrowers More Rigorously and Balancing Risk
and Returns
Against a backdrop of drastic change in the business environment,
SMFG rigorously researches borrower companies’ actual condi-
tions. It runs credit operations on the basic principle of earning
returns that are commensurate with the credit risk involved, and
makes every effort to reduce credit and capital costs as well as
general and administrative expenses.
(d) Preventing and Reducing Non-Performing Loans
On NPLs and potential NPLs, SMFG carries out regular loan reviews
to clarify handling policies and action plans, enabling it to swiftly
implement measures to prevent deterioration of borrowers’ busi-
ness situations, support business recoveries, collect on loans, and
enhance loan security.
(e) Actively Managing Portfolios
SMBC makes active use of credit derivatives, loan asset sales, and
other instruments to proactively and flexibly manage its portfolios to
stabilize credit risk.
(4) Self-Assessment, Asset Write-Offs and Provisions, and Disclosure of Problem Assets
(a) Self-Assessment
Self-assessment is a preparatory task for ensuring SMFG’s asset
quality and calculating the appropriate level of write-offs and
provisions. Each asset is assessed individually for its security and
collectibility. Depending on the borrower’s current situation, the
borrower is assigned to one of five categories: Normal Borrowers,
Borrowers Requiring Caution, Potentially Bankrupt Borrowers,
Effectively Bankrupt Borrowers, and Bankrupt Borrowers. Based on
the borrower’s category, claims on the borrower are classified into
Classification I, II, III, and IV assets according to their default and
impairment risk levels, taking into account such factors as collateral
and guarantees.
SMBC, the core bank of SMFG, conducts rigorous self-
assessments of asset quality using criteria based on the Financial
Inspection Manual of the Financial Services Agency and the
Practical Guideline published by the Japanese Institute of Certified
Public Accountants. Self-assessment is the latter stage of the obli-
gor grading process for determining the borrower’s ability to fulfill
debt obligations, and the obligor grade criteria are consistent with
the categories used in self-assessment. As part of our efforts to bol-
ster risk management throughout SMFG, consolidated subsidiaries
carry out self-assessment in substantially the same manner.
Borrower Categories, Defined
Normal Borrowers Borrowers with good earnings performances and no significant financial problems
Borrowers Requiring Caution Borrowers identified for close monitoring
Potentially Bankrupt Borrowers Borrowers perceived to have a high risk of falling into bankruptcy
Effectively Bankrupt Borrowers Borrowers that may not have legally or formally declared bankruptcy but are essentially bankrupt
Bankrupt Borrowers Borrowers that have been legally or formally declared bankrupt
Asset Classifications, Defined
Classification I Assets not classified under Classifications II, III, or IV
Classification II Assets perceived to have an above-average risk of uncollectibility
Classification III Assets for which final collection or asset value is very doubtful and which pose a high risk of incurring a loss
Classification IV Assets assessed as uncollectible or worthless
812017 Annual Report
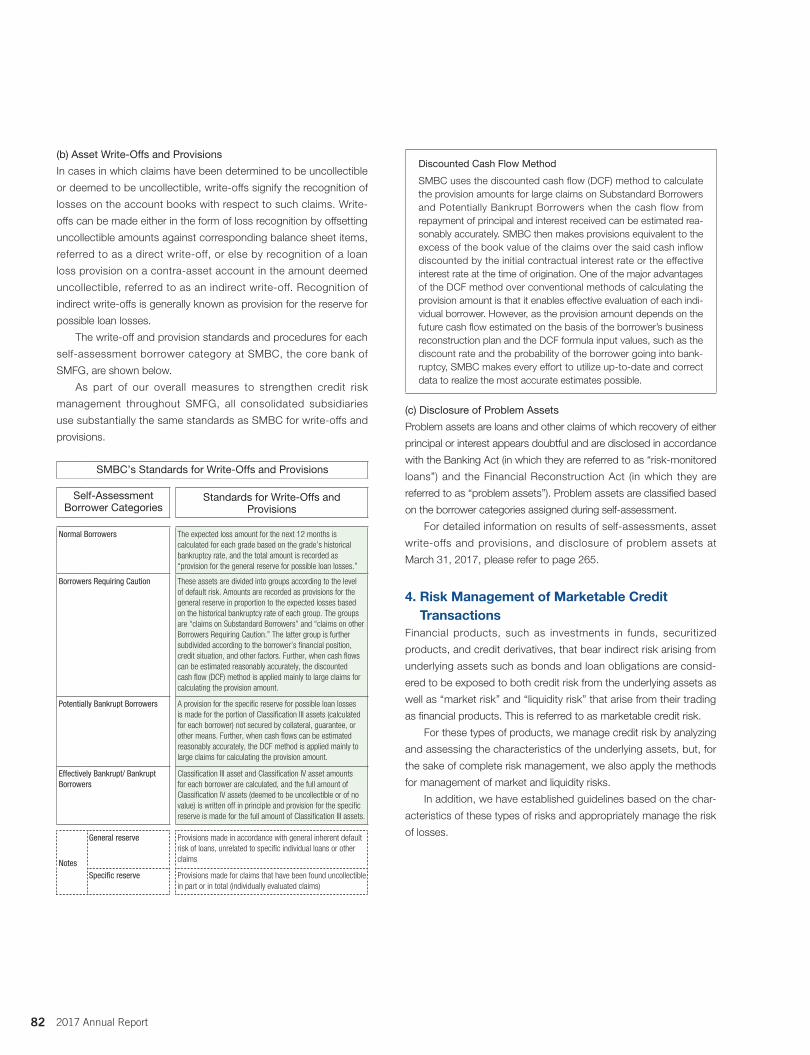
(b) Asset Write-Offs and Provisions
In cases in which claims have been determined to be uncollectible
or deemed to be uncollectible, write-offs signify the recognition of
losses on the account books with respect to such claims. Write-
offs can be made either in the form of loss recognition by offsetting
uncollectible amounts against corresponding balance sheet items,
referred to as a direct write-off, or else by recognition of a loan
loss provision on a contra-asset account in the amount deemed
uncollectible, referred to as an indirect write-off. Recognition of
indirect write-offs is generally known as provision for the reserve for
possible loan losses.
The write-off and provision standards and procedures for each
self-assessment borrower category at SMBC, the core bank of
SMFG, are shown below.
As part of our overall measures to strengthen credit risk
management throughout SMFG, all consolidated subsidiaries
use substantially the same standards as SMBC for write-offs and
provisions.
SMBC’s Standards for Write-Offs and Provisions
Self-Assessment Borrower Categories
Standards for Write-Offs and Provisions
Normal Borrowers The expected loss amount for the next 12 months is calculated for each grade based on the grade’s historical bankruptcy rate, and the total amount is recorded as “provision for the general reserve for possible loan losses�”
Borrowers Requiring Caution These assets are divided into groups according to the level of default risk� Amounts are recorded as provisions for the general reserve in proportion to the expected losses based on the historical bankruptcy rate of each group� The groups are “claims on Substandard Borrowers” and “claims on other Borrowers Requiring Caution�” The latter group is further subdivided according to the borrower’s financial position, credit situation, and other factors� Further, when cash flows can be estimated reasonably accurately, the discounted cash flow (DCF) method is applied mainly to large claims for calculating the provision amount�
Potentially Bankrupt Borrowers A provision for the specific reserve for possible loan losses is made for the portion of Classification III assets (calculated for each borrower) not secured by collateral, guarantee, or other means� Further, when cash flows can be estimated reasonably accurately, the DCF method is applied mainly to large claims for calculating the provision amount�
Effectively Bankrupt/ Bankrupt Borrowers
Classification III asset and Classification IV asset amounts for each borrower are calculated, and the full amount of Classification IV assets (deemed to be uncollectible or of no value) is written off in principle and provision for the specific reserve is made for the full amount of Classification III assets�
Notes
General reserve Provisions made in accordance with general inherent default risk of loans, unrelated to specific individual loans or other claims
Specific reserve Provisions made for claims that have been found uncollectible in part or in total (individually evaluated claims)
Discounted Cash Flow Method
SMBC uses the discounted cash flow (DCF) method to calculate the provision amounts for large claims on Substandard Borrowers and Potentially Bankrupt Borrowers when the cash flow from repayment of principal and interest received can be estimated rea-sonably accurately. SMBC then makes provisions equivalent to the excess of the book value of the claims over the said cash inflow discounted by the initial contractual interest rate or the effective interest rate at the time of origination. One of the major advantages of the DCF method over conventional methods of calculating the provision amount is that it enables effective evaluation of each indi-vidual borrower. However, as the provision amount depends on the future cash flow estimated on the basis of the borrower’s business reconstruction plan and the DCF formula input values, such as the discount rate and the probability of the borrower going into bank-ruptcy, SMBC makes every effort to utilize up-to-date and correct data to realize the most accurate estimates possible.
(c) Disclosure of Problem Assets
Problem assets are loans and other claims of which recovery of either
principal or interest appears doubtful and are disclosed in accordance
with the Banking Act (in which they are referred to as “risk-monitored
loans”) and the Financial Reconstruction Act (in which they are
referred to as “problem assets”). Problem assets are classified based
on the borrower categories assigned during self-assessment.
For detailed information on results of self-assessments, asset
write-offs and provisions, and disclosure of problem assets at
March 31, 2017, please refer to page 265.
4. Risk Management of Marketable Credit Transactions
Financial products, such as investments in funds, securitized
products, and credit derivatives, that bear indirect risk arising from
underlying assets such as bonds and loan obligations are consid-
ered to be exposed to both credit risk from the underlying assets as
well as “market risk” and “liquidity risk” that arise from their trading
as financial products. This is referred to as marketable credit risk.
For these types of products, we manage credit risk by analyzing
and assessing the characteristics of the underlying assets, but, for
the sake of complete risk management, we also apply the methods
for management of market and liquidity risks.
In addition, we have established guidelines based on the char-
acteristics of these types of risks and appropriately manage the risk
of losses.
82 2017 Annual Report
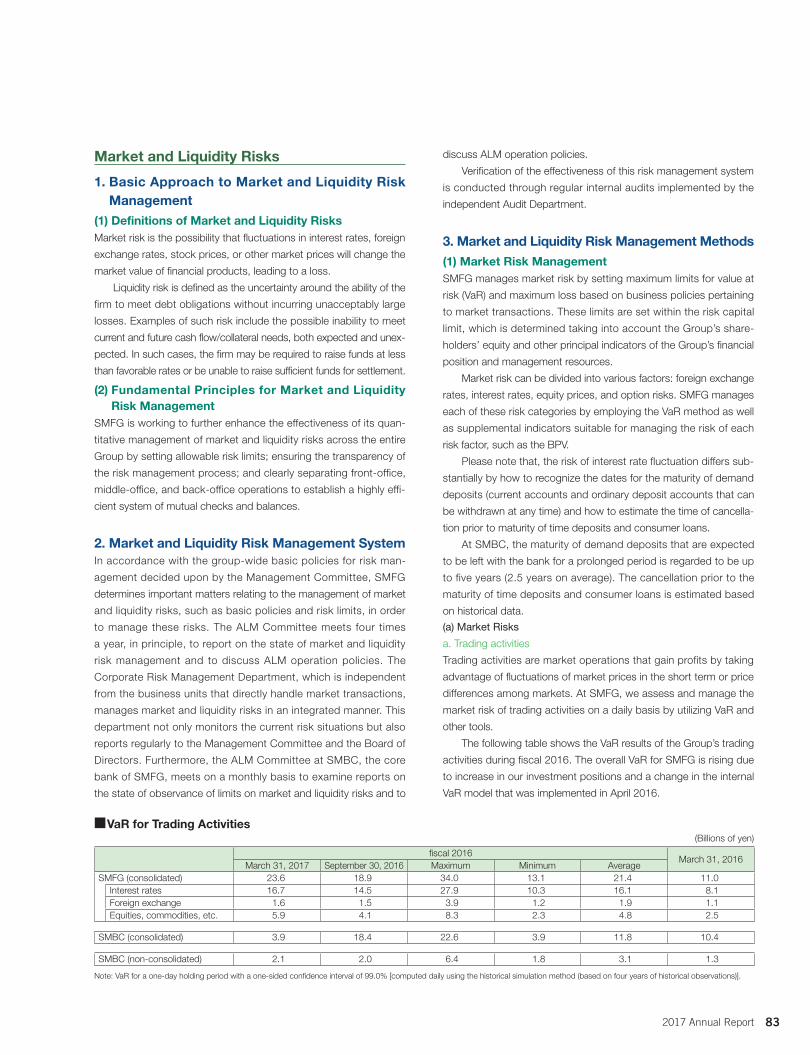
Market and Liquidity Risks
1. Basic Approach to Market and Liquidity Risk Management
(1) Definitions of Market and Liquidity RisksMarket risk is the possibility that fluctuations in interest rates, foreign
exchange rates, stock prices, or other market prices will change the
market value of financial products, leading to a loss.
Liquidity risk is defined as the uncertainty around the ability of the
firm to meet debt obligations without incurring unacceptably large
losses. Examples of such risk include the possible inability to meet
current and future cash flow/collateral needs, both expected and unex-
pected. In such cases, the firm may be required to raise funds at less
than favorable rates or be unable to raise sufficient funds for settlement.
(2) Fundamental Principles for Market and Liquidity Risk Management
SMFG is working to further enhance the effectiveness of its quan-
titative management of market and liquidity risks across the entire
Group by setting allowable risk limits; ensuring the transparency of
the risk management process; and clearly separating front-office,
middle-office, and back-office operations to establish a highly effi-
cient system of mutual checks and balances.
2. Market and Liquidity Risk Management SystemIn accordance with the group-wide basic policies for risk man-
agement decided upon by the Management Committee, SMFG
determines important matters relating to the management of market
and liquidity risks, such as basic policies and risk limits, in order
to manage these risks. The ALM Committee meets four times
a year, in principle, to report on the state of market and liquidity
risk management and to discuss ALM operation policies. The
Corporate Risk Management Department, which is independent
from the business units that directly handle market transactions,
manages market and liquidity risks in an integrated manner. This
department not only monitors the current risk situations but also
reports regularly to the Management Committee and the Board of
Directors. Furthermore, the ALM Committee at SMBC, the core
bank of SMFG, meets on a monthly basis to examine reports on
the state of observance of limits on market and liquidity risks and to
discuss ALM operation policies.
Verification of the effectiveness of this risk management system
is conducted through regular internal audits implemented by the
independent Audit Department.
3. Market and Liquidity Risk Management Methods(1) Market Risk ManagementSMFG manages market risk by setting maximum limits for value at
risk (VaR) and maximum loss based on business policies pertaining
to market transactions. These limits are set within the risk capital
limit, which is determined taking into account the Group’s share-
holders’ equity and other principal indicators of the Group’s financial
position and management resources.
Market risk can be divided into various factors: foreign exchange
rates, interest rates, equity prices, and option risks. SMFG manages
each of these risk categories by employing the VaR method as well
as supplemental indicators suitable for managing the risk of each
risk factor, such as the BPV.
Please note that, the risk of interest rate fluctuation differs sub-
stantially by how to recognize the dates for the maturity of demand
deposits (current accounts and ordinary deposit accounts that can
be withdrawn at any time) and how to estimate the time of cancella-
tion prior to maturity of time deposits and consumer loans.
At SMBC, the maturity of demand deposits that are expected
to be left with the bank for a prolonged period is regarded to be up
to five years (2.5 years on average). The cancellation prior to the
maturity of time deposits and consumer loans is estimated based
on historical data.
(a) Market Risks
a. Trading activities
Trading activities are market operations that gain profits by taking
advantage of fluctuations of market prices in the short term or price
differences among markets. At SMFG, we assess and manage the
market risk of trading activities on a daily basis by utilizing VaR and
other tools.
The following table shows the VaR results of the Group’s trading
activities during fiscal 2016. The overall VaR for SMFG is rising due
to increase in our investment positions and a change in the internal
VaR model that was implemented in April 2016.
■ VaR for Trading Activities(Billions of yen)
fiscal 2016March 31, 2016
March 31, 2017 September 30, 2016 Maximum Minimum AverageSMFG (consolidated) 23.6 18.9 34.0 13.1 21.4 11.0
Interest rates 16.7 14.5 27.9 10.3 16.1 8.1Foreign exchange 1.6 1.5 3.9 1.2 1.9 1.1Equities, commodities, etc. 5.9 4.1 8.3 2.3 4.8 2.5
SMBC (consolidated) 3.9 18.4 22.6 3.9 11.8 10.4
SMBC (non-consolidated) 2.1 2.0 6.4 1.8 3.1 1.3
Note: VaR for a one-day holding period with a one-sided confidence interval of 99.0% [computed daily using the historical simulation method (based on four years of historical observations)].
832017 Annual Report
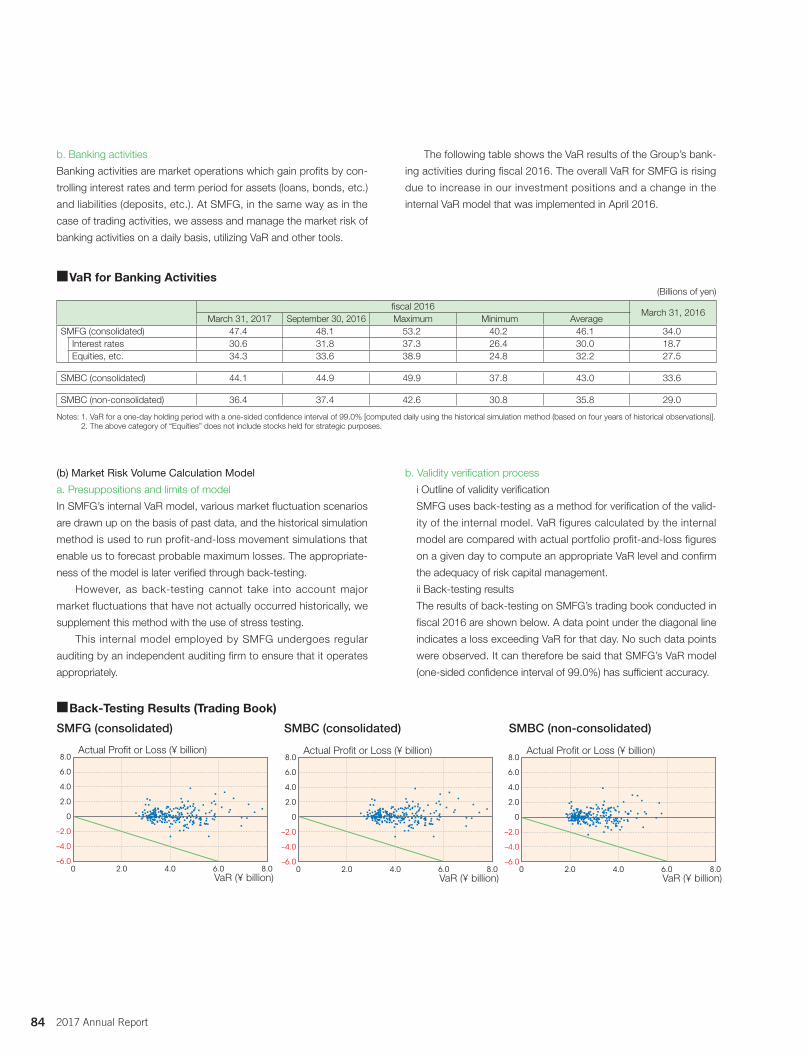
b. Banking activities
Banking activities are market operations which gain profits by con-
trolling interest rates and term period for assets (loans, bonds, etc.)
and liabilities (deposits, etc.). At SMFG, in the same way as in the
case of trading activities, we assess and manage the market risk of
banking activities on a daily basis, utilizing VaR and other tools.
The following table shows the VaR results of the Group’s bank-
ing activities during fiscal 2016. The overall VaR for SMFG is rising
due to increase in our investment positions and a change in the
internal VaR model that was implemented in April 2016.
(b) Market Risk Volume Calculation Model
a. Presuppositions and limits of model
In SMFG’s internal VaR model, various market fluctuation scenarios
are drawn up on the basis of past data, and the historical simulation
method is used to run profit-and-loss movement simulations that
enable us to forecast probable maximum losses. The appropriate-
ness of the model is later verified through back-testing.
However, as back-testing cannot take into account major
market fluctuations that have not actually occurred historically, we
supplement this method with the use of stress testing.
This internal model employed by SMFG undergoes regular
auditing by an independent auditing firm to ensure that it operates
appropriately.
b. Validity verification process
i Outline of validity verification
SMFG uses back-testing as a method for verification of the valid-
ity of the internal model. VaR figures calculated by the internal
model are compared with actual portfolio profit-and-loss figures
on a given day to compute an appropriate VaR level and confirm
the adequacy of risk capital management.
ii Back-testing results
The results of back-testing on SMFG’s trading book conducted in
fiscal 2016 are shown below. A data point under the diagonal line
indicates a loss exceeding VaR for that day. No such data points
were observed. It can therefore be said that SMFG’s VaR model
(one-sided confidence interval of 99.0%) has sufficient accuracy.
8.02.0 4.0 6.0
8.0
4.0
2.0
6.0
–6.0
–4.0
–2.0
0
0VaR (¥ billion)
Actual Profit or Loss (¥ billion)8.0
4.0
2.0
6.0
–6.0
–4.0
–2.0
0
8.02.0 4.0 6.00VaR (¥ billion)
Actual Profit or Loss (¥ billion)8.0
4.0
2.0
6.0
–6.0
–4.0
–2.0
0
8.02.0 4.0 6.00VaR (¥ billion)
Actual Profit or Loss (¥ billion)
■Back-Testing Results (Trading Book)
SMFG (consolidated) SMBC (consolidated) SMBC (non-consolidated)
■ VaR for Banking Activities(Billions of yen)
fiscal 2016March 31, 2016
March 31, 2017 September 30, 2016 Maximum Minimum AverageSMFG (consolidated) 47.4 48.1 53.2 40.2 46.1 34.0
Interest rates 30.6 31.8 37.3 26.4 30.0 18.7Equities, etc. 34.3 33.6 38.9 24.8 32.2 27.5
SMBC (consolidated) 44.1 44.9 49.9 37.8 43.0 33.6
SMBC (non-consolidated) 36.4 37.4 42.6 30.8 35.8 29.0
Notes: 1. VaR for a one-day holding period with a one-sided confidence interval of 99.0% [computed daily using the historical simulation method (based on four years of historical observations)]. 2. The above category of “Equities” does not include stocks held for strategic purposes.
84 2017 Annual Report

c. Indicators substitute for the back-testing method
SMFG employs, as a method substitute for the back-testing
method, the VaR wherein presumptions for the model, such as
observation periods, change.
d. Changes in model from fiscal 2015
Back-testing in fiscal 2015 resulted in several occasions in which
losses exceeded VaR. Moreover, the current model was deemed
unable to sufficiently reflect market fluctuations. For these reasons,
we refined the risk factors used in this model at the beginning of fis-
cal 2016. Back-testing results under the new model are improving,
as indicted in b. above.
(c) Stress Testing
The market occasionally undergoes extreme fluctuations that
exceed projections. To manage market risk, therefore, it is important
to run simulations of unforeseen situations that may occur in finan-
cial markets (stress testing). SMFG conducts stress tests regularly,
assuming various scenarios, and has measures in place for irregular
events.
(d) Outlier Framework
In the event the economic value of a bank declines by more than 20%
of total capital as a result of interest rate shocks, that bank would fall
into the category of “outlier bank,” as stipulated under Pillar 2 of the
Basel Framework.
Decline in economic value as of March 31, 2017, was around
1% of total capital, substantially below the 20% criterion.
(e) Management of Stocks Held for Strategic Purposes
SMFG establishes risk allowance limits on stocks held for strategic
purposes and monitors the observance of these limits in order to
control stock price fluctuation risk appropriately. More specifically,
VaR (1 year holding period) computed from profit-and-loss simula-
tions based on historical market fluctuation data and aggregated
fluctuation in market price from the beginning of the fiscal year are
subject to the risk capital limit management and monitored on a
daily basis.
To diminish the impact of stock price declines on capital, SMFG
has drawn up plans for reducing equity holdings from the perspec-
tive of securing the financial base necessary to sufficiently exercise
intermediary functions, even under high-stress environments that
create substantial decline in stock prices. In accordance with these
plans, SMFG is seeking to reduce its holdings*1 to a common equity
Tier1 (CET1)*2 ratio of 14% over approximately five years from
September 2015, when the level was 28%. *1: Refers to Group holdings of stocks listed in Japan*2: Based on full implementation under the Basel III framework
■ Decline in Economic Value Based on Outlier Framework
(Billions of yen)
SMBC (consolidated) SMBC (non-consolidated)
March 31, 2016 March 31, 2017 March 31, 2016 March 31, 2017
Total 208.2 150.5 186.6 118.8Impact of Yen interest rates 41.2 77.2 37.0 75.1
Impact of U�S� dollar interest rates 109.8 50.8 99.6 28.0
Impact of Euro interest rates 40.1 8.8 38.7 6.7
Percentage of total capital 2.0% 1.5% 1.8% 1.2%
Note: “Decline in economic value” is the decline of present value after interest rate shocks (1st and 99th percentile of observed interest rate changes using a 1-year holding period and 5 years of observations).
■ Composition, by Industry, of Listed Equity Portfolio
25(%)
0
5
10
15
20
(March 31, 2017)
Fisheries/Farming/Forestry
Mining
ConstructionFood ProductsTextilesPulp/Paper
Pharmaceuticals
Petroleum/Coal
Rubber ProductsGlass/M
ineralsSteelNonferrous M
etalsM
etal ProductsM
achineryElectric M
achineryTransport M
achineryPrecision M
achineryOther ProductsElectricity/Gas UtilitiesOverland TransportM
arine TransportAir TransportW
arehousing/DistributionTelecom
munications
Wholesale
RetailBankingSecurities/Com
modity/Futures Trading
InsuranceOther FinancialReal EstateServices
Chemicals
SMFG PortfolioTOPIXNikkei Average
852017 Annual Report
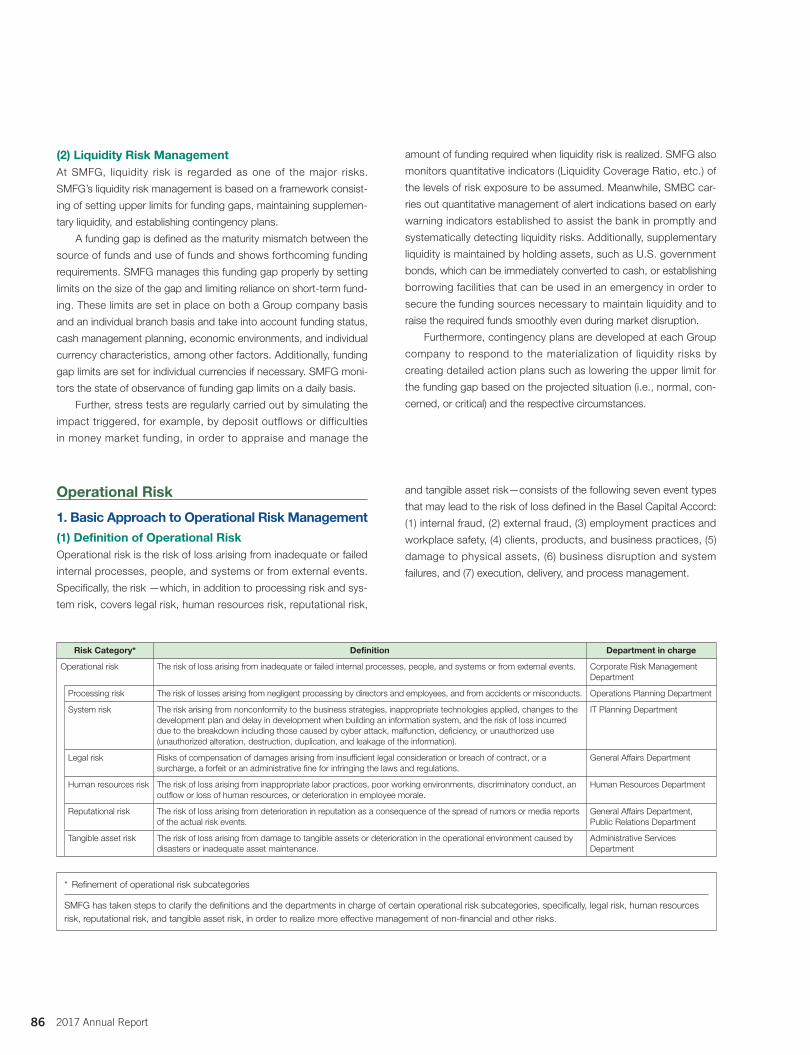
(2) Liquidity Risk ManagementAt SMFG, liquidity risk is regarded as one of the major risks.
SMFG’s liquidity risk management is based on a framework consist-
ing of setting upper limits for funding gaps, maintaining supplemen-
tary liquidity, and establishing contingency plans.
A funding gap is defined as the maturity mismatch between the
source of funds and use of funds and shows forthcoming funding
requirements. SMFG manages this funding gap properly by setting
limits on the size of the gap and limiting reliance on short-term fund-
ing. These limits are set in place on both a Group company basis
and an individual branch basis and take into account funding status,
cash management planning, economic environments, and individual
currency characteristics, among other factors. Additionally, funding
gap limits are set for individual currencies if necessary. SMFG moni-
tors the state of observance of funding gap limits on a daily basis.
Further, stress tests are regularly carried out by simulating the
impact triggered, for example, by deposit outflows or difficulties
in money market funding, in order to appraise and manage the
amount of funding required when liquidity risk is realized. SMFG also
monitors quantitative indicators (Liquidity Coverage Ratio, etc.) of
the levels of risk exposure to be assumed. Meanwhile, SMBC car-
ries out quantitative management of alert indications based on early
warning indicators established to assist the bank in promptly and
systematically detecting liquidity risks. Additionally, supplementary
liquidity is maintained by holding assets, such as U.S. government
bonds, which can be immediately converted to cash, or establishing
borrowing facilities that can be used in an emergency in order to
secure the funding sources necessary to maintain liquidity and to
raise the required funds smoothly even during market disruption.
Furthermore, contingency plans are developed at each Group
company to respond to the materialization of liquidity risks by
creating detailed action plans such as lowering the upper limit for
the funding gap based on the projected situation (i.e., normal, con-
cerned, or critical) and the respective circumstances.
Risk Category* Definition Department in charge
Operational risk The risk of loss arising from inadequate or failed internal processes, people, and systems or from external events. Corporate Risk Management Department
Processing risk The risk of losses arising from negligent processing by directors and employees, and from accidents or misconducts. Operations Planning Department
System risk The risk arising from nonconformity to the business strategies, inappropriate technologies applied, changes to the development plan and delay in development when building an information system, and the risk of loss incurred due to the breakdown including those caused by cyber attack, malfunction, deficiency, or unauthorized use (unauthorized alteration, destruction, duplication, and leakage of the information).
IT Planning Department
Legal risk Risks of compensation of damages arising from insufficient legal consideration or breach of contract, or a surcharge, a forfeit or an administrative fine for infringing the laws and regulations.
General Affairs Department
Human resources risk The risk of loss arising from inappropriate labor practices, poor working environments, discriminatory conduct, an outflow or loss of human resources, or deterioration in employee morale.
Human Resources Department
Reputational risk The risk of loss arising from deterioration in reputation as a consequence of the spread of rumors or media reports of the actual risk events.
General Affairs Department,Public Relations Department
Tangible asset risk The risk of loss arising from damage to tangible assets or deterioration in the operational environment caused by disasters or inadequate asset maintenance.
Administrative Services Department
* Refinement of operational risk subcategories
SMFG has taken steps to clarify the definitions and the departments in charge of certain operational risk subcategories, specifically, legal risk, human resources risk, reputational risk, and tangible asset risk, in order to realize more effective management of non-financial and other risks.
Operational Risk
1. Basic Approach to Operational Risk Management(1) Definition of Operational RiskOperational risk is the risk of loss arising from inadequate or failed
internal processes, people, and systems or from external events.
Specifically, the risk —which, in addition to processing risk and sys-
tem risk, covers legal risk, human resources risk, reputational risk,
and tangible asset risk—consists of the following seven event types
that may lead to the risk of loss defined in the Basel Capital Accord:
(1) internal fraud, (2) external fraud, (3) employment practices and
workplace safety, (4) clients, products, and business practices, (5)
damage to physical assets, (6) business disruption and system
failures, and (7) execution, delivery, and process management.
86 2017 Annual Report

(2) Fundamental Principles for Operational Risk ManagementSMFG has set forth the policies on Operational Risk Management
to define the basic rules to be observed in the conduct of oper-
ational risk management across the entire Group. Under these
policies, SMFG has been working to enhance the operational risk
management framework across the whole Group by establishing
an effective system for identifying, assessing, controlling, and mon-
itoring material operational risks as well as a system for addressing
risks that have materialized and implementing emergency response
measures. Based on the framework of the Basel Capital Accord,
SMFG has been continuously pursuing sophisticated quantification
of operational risks and advanced group-wide management.
2. Operational Risk Management SystemBased on the group-wide basic policies for risk management
established by SMFG, Group companies construct operational risk
management system.
At SMFG, the Management Committee makes decisions
on important matters such as basic policies for operational risk
management, and these decisions are authorized by the Board of
Directors. In addition, the Corporate Risk Management Department
oversees the overall management of operational risks and works
together with departments responsible for the subcategories such
as processing risks and system risks to establish a system for com-
prehensively managing operational risks.
As a brief overview, this system operates by collecting and
analyzing internal loss data from Group companies. In addition,
the system entails comprehensively specifying scenarios involving
operational risks based on the operational procedures of companies
that have adopted the Advanced Measurement Approach (AMA) on
a regular basis and estimating the loss amount and frequency of the
occurrence of such losses based on each scenario. Risk severities
are quantified for each scenario. For those scenarios having high
severities, risk mitigation plans will be developed and the implemen-
tation status of such risk mitigation plans will be monitored by the
Corporate Risk Management Department. Furthermore, operational
risks are quantified and quantitatively managed by utilizing the col-
lected internal loss data and scenarios.
Regular reports are issued to the Group CRO on internal loss
data, scenario risk severity information, and the status of risk
mitigation. In addition, the Risk Management Committee, a cross-
organizational committee established within SMFG, discusses
measures for mitigating risks. Through these and other efforts,
SMFG is striving to ensure effective risk management. Moreover,
SMFG’s independent Internal Audit Department conducts periodic
internal audits to verify that the Group’s operational risk manage-
ment system is functioning properly.
3. Operational Risk Management MethodologyAs previously defined, operational risks cover a wide range of
cases, including the risks of losses due to errors in operation,
system failures, and natural disasters. Also, operational risk events
can occur virtually anywhere and everywhere. Thus, it is essential
to check whether material operational risks have been overlooked,
monitor the overall status of risks, and manage and control them.
To this end, it is necessary to be able to quantify risks using a
measurement methodology that can be applied to all types of oper-
ational risks and to comprehensively and comparatively capture the
status of and changes in potential operational risks in business pro-
cesses. Also, from the viewpoint of internal control, the measure-
ment methodology used to create risk mitigation measures must be
such that the implementation of the measures quantitatively reduces
operational risks.
At the end of March 2008, SMFG adopted the AMA set forth by
the Basel Capital Accord for calculating the operational risk equiva-
lent amount. The approach has been utilized for the management of
operational risks since then.
Specifically, a model to which internal loss data and scenario anal-
ysis results are input has been introduced to calculate the operational
risk equivalent amount and risk asset amounts. In addition, steps are
taken to ensure the objectivity, accuracy, and comprehensiveness
of scenario evaluations by utilizing external loss data and Business
Environment and Internal Control Factors in verification processes.
The quantification model produces the distribution of loss
frequency and loss severity based on the internal loss data and
scenario analysis results, and it also produces the loss distribution
based on the said distribution of loss frequency (distribution of
losses in a year) and the distribution of loss severity (distribution of
loss amount per case) by making various combinations of frequen-
cies and amounts of losses according to the Monte Carlo simulation
method. In addition, the model calculates the maximum amount of
loss expected, due to operational risks, based on the assumption
of one-sided confidence interval of 99.9% and the holding period of
one year. Regarding losses on repayment of excess interest of cer-
tain subsidiaries engaged in consumer finance operations, expected
losses are deducted from the maximum amount of operational risk
loss when calculating the operational risk equivalent amount.
Operational risk equivalent amount in respect of the tangible
asset damages arising from earthquakes is measured using the
probability data of earthquake occurrence in each part of Japan and
the distribution of loss amount from those earthquake occurrences.
The measurement units are SMFG consolidated basis, SMBC
consolidated basis, and SMBC non-consolidated basis. The opera-
tional risk equivalent amount based on the AMA is calculated as the
simple aggregate of the amount of the seven event types set forth
by the Basel Capital Accord and of tangible asset damages arising
872017 Annual Report

from earthquakes. However, in the case of SMFG consolidated
basis, the risk of losses on repayment of excess interest is added
on. The measurement accuracy is ensured through a framework
of regularly conducted verifications of the quantification models
pre- and post-measurement.
Meanwhile, the operational risk equivalent amounts of other
Group companies that do not apply the AMA are calculated
according to the Basic Indicator Approach (BIA), and the oper-
ational risk equivalent amount for SMFG consolidated basis and
SMBC consolidated basis are calculated by consolidating such
amounts calculated based on the BIA with the operational risk
equivalent amount calculated based on the AMA.
4. Processing Risk ManagementProcessing risk is the risk of losses arising from negligent processing
by directors and employees, and from accidents or misconducts.
SMFG has clarified the divisions responsible for the oversight
functions for processing risk management, and we are working to
raise the level of sophistication of our management of processing risk
across the whole Group by establishing systems for managing the
processing risks faced by Group companies, ensuring in-office inspec-
tion, minimizing losses in the event of processing risk materialization
by drafting exhaustive contingency plans, and carrying out thorough
quantification of the risk under management as basic principles.
Basic policies for processing risk management and other
important matters are decided by the Management Committee and
then approved by the Board of Directors. The status of processing
risk management is reported to the Management Committee and
the Board of Directors regularly and when necessary. These and
other steps are taken to ensure that we can provide customers with
high-quality services.
Based on the group-wide basic policies for risk management,
Group companies promote appropriate operating practices by
establishing operating rules and regulations, systematizing trans-
action processing, receiving guidance from business divisions, and
inspecting conditions related to transaction processing.
■ Basic Framework of Operational Risk Measurement
0.4
0.3
0.2
0.1
0
0.30
0.25
0.20
0.15
0.10
0.05
00 2 4 6 8 10
0.20
0.15
0.10
0.05
00 5 1510 20 25 30
Business Environment and Internal Control Factors
External Loss Data
Internal Loss Data
Verifi-cation
ScenarioAnalysisResults
Datainput
Calculation of Operational Risk Equivalent Amount Using Quantification Model
Distribution of Loss Frequency
Distribution of Loss Severity
Probability of occurrence (frequency)
Probability of occurrence (frequency)
Number of incidents/year
Loss per incident
99.9%
Aggregated Loss Distribution
Frequency x Severity
Probability of occurrence (frequency)
Aggregated annual loss amount
88 2017 Annual Report
5. System Risk ManagementSystem risk is the risk arising from nonconformity to the business
strategies, inappropriate technologies applied, changes to the
development plan and delay in development when building an infor-
mation system, and the risk of loss incurred due to the breakdown
including those caused by cyber attack, malfunction, deficiency or
unauthorized use (unauthorized alteration, destruction, duplication
and leakage of the information).
SMFG has set the following as basic principles: recognizing
information systems as an essential part of management strategy
taking into account advances in IT, minimizing system risk by
drafting regulations and specific management standards, (including
a security policy) and establishing contingency plans to minimize
losses if a system risk materializes. A risk management system has
thus been put in place to ensure adequate risk management.
Taking into account the growing sophistication and diversifica-
tion of cyber attacks seen on a global scale, the increasing social
impact from the damage inflicted by such attacks, and the risk
to our reputation and external ratings, we continue to strengthen
cyber security management through deployment of governance
measures; technological measures for the identification, prevention,
and detection of attacks; and cyber attack response measures.
In addition, we actively incorporate various new technologies to
improve convenience for customers, create new businesses, boost
productivity and efficiency, improve upon management infrastruc-
ture, and otherwise promote digitalization in a wide range of fields.
Systems are in place for managing the risks projected to arise from
such activities.
SMBC operates its risk management system by conducting risk
assessments based on the Financial Services Agency’s Financial
Inspection Manual and the Security Guidelines published by the
Center for Financial Industry Information Systems (FISC) and by
enhancing safety measures based on the results of these assess-
ments. Systems troubles at banks have the potential to heavily
impact society. In addition, system risks are diversifying due to
advances in IT and the expansion of business fields. Recognizing
these facts, we have numerous measures in place for system trou-
ble prevention, including constant maintenance to ensure stable
and uninterrupted operation, duplication of various systems and
infrastructure, and a disaster-prevention system placed in computer
centers in eastern and western Japan. To maintain the confiden-
tiality of customer data and prevent leaks of information, sensitive
information is encrypted, unauthorized external access is blocked,
and all other possible measures are taken to secure data. We also
have contingency plans for unforeseen circumstances and hold
training sessions as necessary to ensure full preparedness in the
event of an emergency.
892017 Annual Report
ALMAbbreviation for Asset Liability Management Method for comprehensive management of assets and liabilities, with appropriate controls on market risk (interest rates, exchange rates, etc.).
Advanced Measurement Approach (AMA)Based on the operational risk measurement methods used in the inter-nal management of financial institutions, this is a method for obtaining the operational risk equivalent amount by calculating the maximum amount of operational risk loss expected over a period of one year, with a one-sided confidence interval of 99.9%.
Back-testingMethod of verifying the validity of models by comparing the model value and actual value. For instance, in the case of VaR, comparing and verify-ing the value of VaR and the profit or loss amount.
Basel IIIThe Basel Capital Accord, an international agreement, was amended in December 2010 for ensuring the soundness of banks (minimum capital requirements) for the purpose of enhancing the capabilities of appropri-ately responding to any financial and economic crisis and reducing risks which may have originated from financial sector to adversely affect the actual economy. It has been implemented incrementally since 2013.
Basic Indicator Approach (BIA)A calculation approach in which an average value for the most recent three years derived by multiplying gross profit for the financial institution as a whole by certain level (15%) is deemed to be the operational risk equivalent amount.
BPVAbbreviation for Basis Point Value Potential change in present value of financial product corresponding to 0.01-percentage-point increase in interest rates.
Credit costAverage losses expected to occur during the coming year.
Historical simulation methodMethod of simulating future fluctuations without the use of random num-bers, by using historical data for risk factors.
LGDAbbreviation for Loss Given DefaultPercentage of loss assumed in the event of default by obligor; ratio of uncollectible amount of the exposure owned in the event of default.
Monte Carlo simulation methodGeneral term used for a simulation method which uses random numbers.
Outlier frameworkMonitoring standard for interest rate risk in the banking book, as set forth in the Pillar 2 of the Basel Capital Accord.
Operational risk equivalent amountOperational risk capital requirements under the Basel Capital Accord.
PDAbbreviation for Probability of Default Probability of becoming default by obligor during one year.
Present valueA future amount of money that has been discounted to reflect its current value taking into account the interest rate and the extent of credit risk.
Risk appetiteThe types and levels of risk that SMFG is willing to take on or tolerate to drive earnings growth.
Risk capitalThe amount of capital required to cover the theoretical maximum potential loss arising from risks of business operations. It differs from the minimum regulatory capital requirements, and it is being used in the risk management framework voluntarily developed by financial institutions for the purpose of internal management.
Risk factorAnything which may become a factor for risk. In the case of market risk, it would be the share price or interest rate; in the case of credit risk, it would be the default rate or economic environment.
Risk-weighted assets • Credit risk
Total assets (lending exposures, including credit equivalent amount of off-balance sheet transactions, etc.) which is reevaluated according to the level of credit risk.
• Operational riskAmount derived by dividing the operational risk equivalent amount by 8%.
Underlying assetsGeneral term used for assets which serve as the source of payments for principal and interest for securitization exposures, etc.
VaRAbbreviation for Value at RiskThe maximum loss that can be expected to occur with a certain degree of probability when holding a financial asset portfolio for a given amount of time.
Glossary
90 2017 Annual Report

Sumitomo Mitsui Financial Group, Inc. (SMFG), and its Group com-
panies*1 have formulated the Basic Policy for Customer-Orientated
Business Conduct for their domestic asset management and
asset formulation businesses, based on which they are promoting
customer- orientated business conduct.
This policy informs our basic stance of emphasizing the dispers-
ing of investments over the medium to long term through which we
seek to support customers in stable asset formulation. Also based
on this policy, SMFG and its Group companies aim to contribute
to the development of capital markets that provide companies with
the funds they need to grow and to economic growth through their
asset management and asset formulation businesses.
1. SMFG’s Customer-Orientated Business ConductIn “Our Mission,” it is stated that “We grow and prosper together with
our customers, by providing services of greater value to them.” To
give form to this principle, we have defined our Five Values, a list of
five key words that represent the values and action guidelines shared
by executives and employees in Japan and overseas. “Customer
First” (always think and act based on a customer- orientated per-
spective) is at the top of this list. SMFG continues to push forward
with various initiatives in accordance with these values and action
guidelines.
SMFG is fully aware of the severity of the government penalties
imposed on Sumitomo Mitsui Banking Corporation in April 2006 in
relation to its sales practices for interest rate swaps. We are thus
committed to preventing the reoccurrence of such malpractice.
Accordingly, SMFG has adopted a customer-oriented perspective in
pursuing sustainability throughout its management, internal control,
and compliance systems. Through these and other efforts, we have
endeavored to regain trust from customers and from society as
a whole.
Furthermore, the Customer Satisfaction (CS) Improvement Sub-
committee has been set up to incorporate customer input into
management. The opinions of external experts*2 are utilized in meet-
ings of this committee as discussions on and verification of initiatives
at Group companies are carried out to promote the exercise of a
customer-oriented perspective on a group-wide basis. In addition,
the CS Improvement Committee, which is membered by officers
sitting on the Group Management Committee, convenes to hold
regular discussions on customer-orientated business conduct.
We are convinced that the ongoing quest to provide quality
products and services based on customer needs and desires will
contribute to economic growth and subsequently growth for SMFG.
Everyone at SMFG will thus carry out their duties in an earnest and
just manner while exercising a high degree of specialized knowledge
and good business ethics. The Group will never let up in its efforts to
ensure that it always thinks and acts based on a customer- oriented
perspective in the truest sense as it strives to generate the greatest
profits for its customers.
Five Values
Create new value from a forward-looking perspective
Proactive and Innovative
Exercise speed in making decisions and carrying out duties
Speed
Act as a team to create the best possible results
Team SMFG
Seek quality from all angles
Quality
Always think and act based on a customer-oriented perspective
Customer First
Sumitomo Mitsui Financial Group’s Basic Policy for Customer-Orientated Business Conduct
912017 Annual Report
2. Initiatives for Promoting Customer-Orientated Business Conduct
SMFG will implement the following initiatives to entrench the princi-
ples of customer-orientated business conduct into its activities.
(1) Provision of Products and Services Suited to the Customer
When drawing up and underwriting financial products, we will act
with an accurate understanding of customer needs, determining the
ideal target customer group based on the risks and complexity of
the products, in order properly develop and select products.
We will also help customers to find the ideal products and services.
Our first step in this process will be to learn about our customers,
inquiring into their needs and goals. We will next look at their level of
knowledge, investment experience, and asset portfolios so that we
can propose the best possible products and services for them.
If we think that a product may not be ideally suited to a customer’s
needs based on its characteristics or risks, we will discuss this
matter with the customer as necessary and refrain from proposing
such products when doing so is inappropriate.
(2) Easy-to-Understand Explanation of Important Information
The amount of information provided to customers on the charac-
teristics, risks, and fees of the products we handle as well as on
the economic climate and market trends will be enhanced to help
customers make informed decisions. Furthermore, we will strive to
explain this information in an easy-to-understand manner.
(3) Clarification of FeesSMFG receives fees from customers for the products and services
it provides out of consideration for the need to develop and improve
the quality of products and services and to supply various types
of information as well as for processing- and infrastructure-related
expenses. We will seek to provide thorough explanations of these
fees that are as easy to understand as possible.
(4) Management of Conflicts of InterestsPerforming duties in an earnest and just manner based on a
customer- oriented perspective entails managing any potential
conflicts of interests to ensure that our operations are truly customer
oriented.
Based on the Management Policy Concerning Conflicts of
Interest in SMFG, we have defined the types of conflicts of interest
requiring management as well as the types of transactions that
tend to present conflicts of interests and procedures for identifying
these transactions, methods and systems for managing conflicts
of interest, and the scope of Group companies at which conflicts of
interest should be managed. In this manner, we take steps to ensure
that conflicts of interest are properly managed and therefore do not
impede the interests of customers.
(5) Frameworks for Properly Motivating EmployeesAlways thinking and acting based on a customer-oriented per-
spective in the truest sense requires our employees to be properly
motivated so that they can remain dedicated and effective in their
work. SMFG thus develops its performance evaluation systems
from a long-term perspective with the aim of encouraging customer-
oriented sales activities. At the same time, we are expanding our
range of training programs for promoting earnest and just work
practices and higher levels of business ethics.
SMFG and its Group companies aim to facilitate the shift from sav-
ings to asset holding seen in Japan through such initiatives.
Furthermore, we will periodically disclose information on initiatives
by SMFG and its Group companies based on this policy with the
aim of facilitating understanding regarding these initiatives among
customers. In addition, the status of initiatives and their results will
be verified so that initiatives can be revised as necessary to improve
upon operating practices. Information regarding these verifications
and revisions will be disclosed.
*1: Group companies applicable under this policy: Sumitomo Mitsui Banking Corporation; SMBC Trust Bank Ltd.; SMBC Nikko Securities Inc.; SMBC Friend Securities Co., Ltd.; Sumitomo Mitsui Asset Management Company, Limited; THE MINATO BANK, LTD.; Kansai Urban Banking Corporation
*2: External experts* are invited to meetings of the CS Improvement Sub-committee to provide advice and suggestions with the aim of incorporating a wide range of perspectives into management that includes and goes beyond input and requests from customers.
* External experts (in alphabetical order)
Name Position
Professor Hideki KandaEmeritus Professor, University of Tokyo, and Professor, Gakushuin University Law School
Kumiko BandoAdvisor, Consumer Affairs Agency (former Secretary-General of the Consumer Affairs Agency)
Taku Umezawa Partner, Nagashima Ohno & Tsunematsu
92 2017 Annual Report
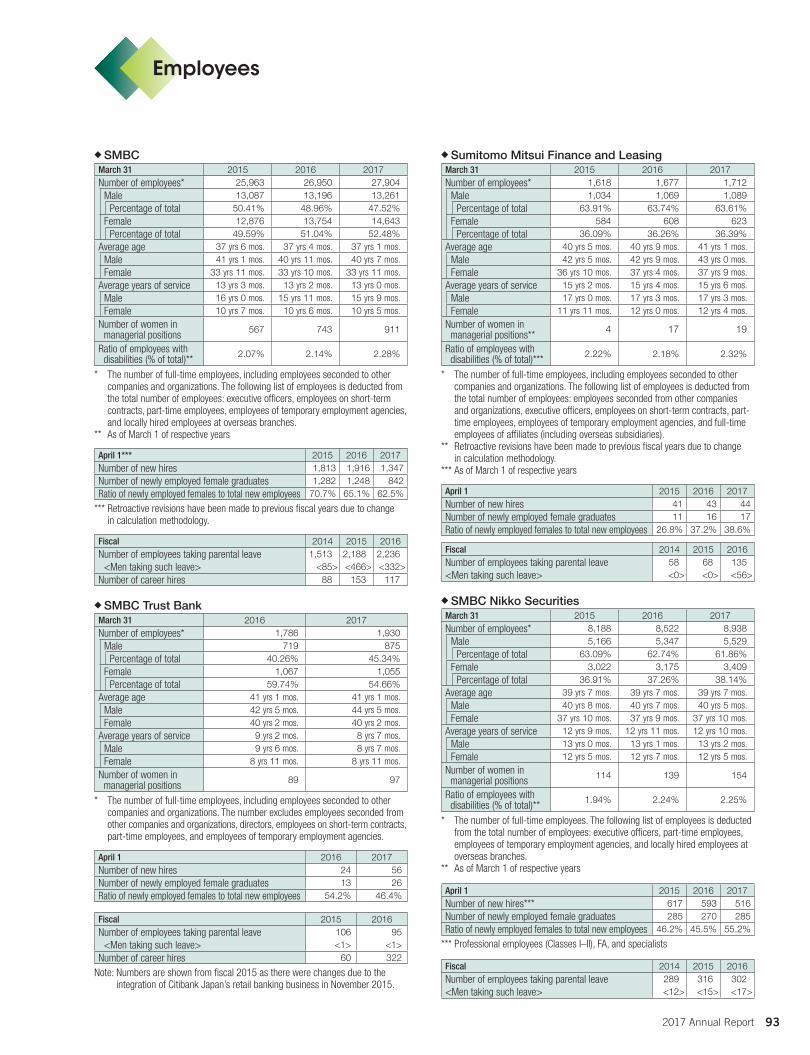
Employees
ώ SMBCMarch 31 2015 2016 2017Number of employees* 25,963 26,950 27,904
Male 13,087 13,196 13,261Percentage of total 50.41% 48.96% 47.52%
Female 12,876 13,754 14,643Percentage of total 49.59% 51.04% 52.48%
Average age 37 yrs 6 mos� 37 yrs 4 mos� 37 yrs 1 mos�
Male 41 yrs 1 mos� 40 yrs 11 mos� 40 yrs 7 mos�
Female 33 yrs 11 mos� 33 yrs 10 mos� 33 yrs 11 mos�
Average years of service 13 yrs 3 mos� 13 yrs 2 mos� 13 yrs 0 mos�
Male 16 yrs 0 mos� 15 yrs 11 mos� 15 yrs 9 mos�
Female 10 yrs 7 mos� 10 yrs 6 mos� 10 yrs 5 mos�
Number of women in managerial positions 567 743 911
Ratio of employees with disabilities (% of total)** 2.07% 2.14% 2.28%
* The number of full-time employees, including employees seconded to other companies and organizations� The following list of employees is deducted from the total number of employees: executive officers, employees on short-term contracts, part-time employees, employees of temporary employment agencies, and locally hired employees at overseas branches�
** As of March 1 of respective years
April 1*** 2015 2016 2017Number of new hires 1,813 1,916 1,347Number of newly employed female graduates 1,282 1,248 842Ratio of newly employed females to total new employees 70.7% 65.1% 62.5%
*** Retroactive revisions have been made to previous fiscal years due to change in calculation methodology�
Fiscal 2014 2015 2016Number of employees taking parental leave 1,513 2,188 2,236
<Men taking such leave> <85> <466> <332>Number of career hires 88 153 117
ώ SMBC Trust Bank March 31 2016 2017Number of employees* 1,786 1,930
Male 719 875Percentage of total 40.26% 45.34%
Female 1,067 1,055Percentage of total 59.74% 54.66%
Average age 41 yrs 1 mos� 41 yrs 1 mos�
Male 42 yrs 5 mos� 44 yrs 5 mos�
Female 40 yrs 2 mos� 40 yrs 2 mos�
Average years of service 9 yrs 2 mos� 8 yrs 7 mos�
Male 9 yrs 6 mos� 8 yrs 7 mos�
Female 8 yrs 11 mos� 8 yrs 11 mos�
Number of women in managerial positions 89 97
* The number of full-time employees, including employees seconded to other companies and organizations� The number excludes employees seconded from other companies and organizations, directors, employees on short-term contracts, part-time employees, and employees of temporary employment agencies�
April 1 2016 2017Number of new hires 24 56Number of newly employed female graduates 13 26Ratio of newly employed females to total new employees 54.2% 46.4%
Fiscal 2015 2016Number of employees taking parental leave 106 95
<Men taking such leave> <1> <1>Number of career hires 60 322
Note: Numbers are shown from fiscal 2015 as there were changes due to the integration of Citibank Japan’s retail banking business in November 2015�
ώ Sumitomo Mitsui Finance and LeasingMarch 31 2015 2016 2017Number of employees* 1,618 1,677 1,712
Male 1,034 1,069 1,089Percentage of total 63.91% 63.74% 63.61%
Female 584 608 623Percentage of total 36.09% 36.26% 36.39%
Average age 40 yrs 5 mos� 40 yrs 9 mos� 41 yrs 1 mos�
Male 42 yrs 5 mos� 42 yrs 9 mos� 43 yrs 0 mos�
Female 36 yrs 10 mos� 37 yrs 4 mos� 37 yrs 9 mos�
Average years of service 15 yrs 2 mos� 15 yrs 4 mos� 15 yrs 6 mos�
Male 17 yrs 0 mos� 17 yrs 3 mos� 17 yrs 3 mos�
Female 11 yrs 11 mos� 12 yrs 0 mos� 12 yrs 4 mos�
Number of women in managerial positions** 4 17 19
Ratio of employees with disabilities (% of total)*** 2.22% 2.18% 2.32%
* The number of full-time employees, including employees seconded to other companies and organizations� The following list of employees is deducted from the total number of employees: employees seconded from other companies and organizations, executive officers, employees on short-term contracts, part-time employees, employees of temporary employment agencies, and full-time employees of affiliates (including overseas subsidiaries)�
** Retroactive revisions have been made to previous fiscal years due to change in calculation methodology�
*** As of March 1 of respective years
April 1 2015 2016 2017Number of new hires 41 43 44Number of newly employed female graduates 11 16 17Ratio of newly employed females to total new employees 26.8% 37.2% 38.6%
Fiscal 2014 2015 2016Number of employees taking parental leave 58 68 135<Men taking such leave> <0> <0> <56>
ώ SMBC Nikko Securities March 31 2015 2016 2017Number of employees* 8,188 8,522 8,938
Male 5,166 5,347 5,529Percentage of total 63.09% 62.74% 61.86%
Female 3,022 3,175 3,409Percentage of total 36.91% 37.26% 38.14%
Average age 39 yrs 7 mos� 39 yrs 7 mos� 39 yrs 7 mos�
Male 40 yrs 8 mos� 40 yrs 7 mos� 40 yrs 5 mos�
Female 37 yrs 10 mos� 37 yrs 9 mos� 37 yrs 10 mos�
Average years of service 12 yrs 9 mos� 12 yrs 11 mos� 12 yrs 10 mos�
Male 13 yrs 0 mos� 13 yrs 1 mos� 13 yrs 2 mos�
Female 12 yrs 5 mos� 12 yrs 7 mos� 12 yrs 5 mos�
Number of women in managerial positions 114 139 154
Ratio of employees with disabilities (% of total)** 1.94% 2.24% 2.25%
* The number of full-time employees� The following list of employees is deducted from the total number of employees: executive officers, part-time employees, employees of temporary employment agencies, and locally hired employees at overseas branches�
** As of March 1 of respective years
April 1 2015 2016 2017Number of new hires*** 617 593 516Number of newly employed female graduates 285 270 285Ratio of newly employed females to total new employees 46.2% 45.5% 55.2%
*** Professional employees (Classes I–II), FA, and specialists
Fiscal 2014 2015 2016Number of employees taking parental leave 289 316 302<Men taking such leave> <12> <15> <17>
932017 Annual Report
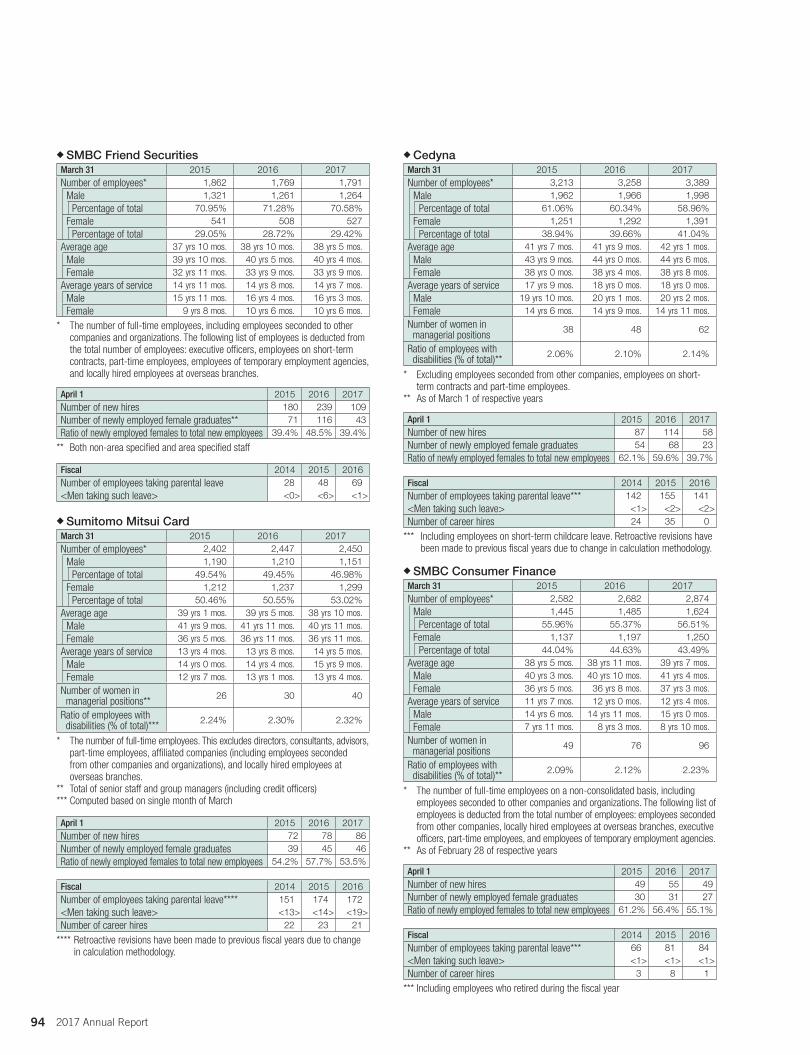
ώ SMBC Friend SecuritiesMarch 31 2015 2016 2017Number of employees* 1,862 1,769 1,791
Male 1,321 1,261 1,264Percentage of total 70.95% 71.28% 70.58%
Female 541 508 527Percentage of total 29.05% 28.72% 29.42%
Average age 37 yrs 10 mos� 38 yrs 10 mos� 38 yrs 5 mos�
Male 39 yrs 10 mos� 40 yrs 5 mos� 40 yrs 4 mos�
Female 32 yrs 11 mos� 33 yrs 9 mos� 33 yrs 9 mos�
Average years of service 14 yrs 11 mos� 14 yrs 8 mos� 14 yrs 7 mos�
Male 15 yrs 11 mos� 16 yrs 4 mos� 16 yrs 3 mos�
Female 9 yrs 8 mos� 10 yrs 6 mos� 10 yrs 6 mos�
* The number of full-time employees, including employees seconded to other companies and organizations� The following list of employees is deducted from the total number of employees: executive officers, employees on short-term contracts, part-time employees, employees of temporary employment agencies, and locally hired employees at overseas branches�
April 1 2015 2016 2017Number of new hires 180 239 109Number of newly employed female graduates** 71 116 43Ratio of newly employed females to total new employees 39.4% 48.5% 39.4%
** Both non-area specified and area specified staff
Fiscal 2014 2015 2016Number of employees taking parental leave 28 48 69<Men taking such leave> <0> <6> <1>
ώ Sumitomo Mitsui CardMarch 31 2015 2016 2017Number of employees* 2,402 2,447 2,450
Male 1,190 1,210 1,151Percentage of total 49.54% 49.45% 46.98%
Female 1,212 1,237 1,299Percentage of total 50.46% 50.55% 53.02%
Average age 39 yrs 1 mos� 39 yrs 5 mos� 38 yrs 10 mos�
Male 41 yrs 9 mos� 41 yrs 11 mos� 40 yrs 11 mos�
Female 36 yrs 5 mos� 36 yrs 11 mos� 36 yrs 11 mos�
Average years of service 13 yrs 4 mos� 13 yrs 8 mos� 14 yrs 5 mos�
Male 14 yrs 0 mos� 14 yrs 4 mos� 15 yrs 9 mos�
Female 12 yrs 7 mos� 13 yrs 1 mos� 13 yrs 4 mos�
Number of women in managerial positions** 26 30 40
Ratio of employees with disabilities (% of total)*** 2.24% 2.30% 2.32%
* The number of full-time employees� This excludes directors, consultants, advisors, part-time employees, affiliated companies (including employees seconded from other companies and organizations), and locally hired employees at overseas branches�
** Total of senior staff and group managers (including credit officers)*** Computed based on single month of March
April 1 2015 2016 2017Number of new hires 72 78 86Number of newly employed female graduates 39 45 46Ratio of newly employed females to total new employees 54.2% 57.7% 53.5%
Fiscal 2014 2015 2016Number of employees taking parental leave**** 151 174 172<Men taking such leave> <13> <14> <19>Number of career hires 22 23 21
**** Retroactive revisions have been made to previous fiscal years due to change in calculation methodology�
ώ CedynaMarch 31 2015 2016 2017Number of employees* 3,213 3,258 3,389
Male 1,962 1,966 1,998Percentage of total 61.06% 60.34% 58.96%
Female 1,251 1,292 1,391Percentage of total 38.94% 39.66% 41.04%
Average age 41 yrs 7 mos� 41 yrs 9 mos� 42 yrs 1 mos�
Male 43 yrs 9 mos� 44 yrs 0 mos� 44 yrs 6 mos�
Female 38 yrs 0 mos� 38 yrs 4 mos� 38 yrs 8 mos�
Average years of service 17 yrs 9 mos� 18 yrs 0 mos� 18 yrs 0 mos�
Male 19 yrs 10 mos� 20 yrs 1 mos� 20 yrs 2 mos�
Female 14 yrs 6 mos� 14 yrs 9 mos� 14 yrs 11 mos�
Number of women in managerial positions 38 48 62
Ratio of employees with disabilities (% of total)** 2.06% 2.10% 2.14%
* Excluding employees seconded from other companies, employees on short-term contracts and part-time employees�
** As of March 1 of respective years
April 1 2015 2016 2017Number of new hires 87 114 58Number of newly employed female graduates 54 68 23Ratio of newly employed females to total new employees 62.1% 59.6% 39.7%
Fiscal 2014 2015 2016Number of employees taking parental leave*** 142 155 141<Men taking such leave> <1> <2> <2>Number of career hires 24 35 0
*** Including employees on short-term childcare leave� Retroactive revisions have been made to previous fiscal years due to change in calculation methodology�
ώ SMBC Consumer FinanceMarch 31 2015 2016 2017Number of employees* 2,582 2,682 2,874
Male 1,445 1,485 1,624Percentage of total 55.96% 55.37% 56.51%
Female 1,137 1,197 1,250Percentage of total 44.04% 44.63% 43.49%
Average age 38 yrs 5 mos� 38 yrs 11 mos� 39 yrs 7 mos�
Male 40 yrs 3 mos� 40 yrs 10 mos� 41 yrs 4 mos�
Female 36 yrs 5 mos� 36 yrs 8 mos� 37 yrs 3 mos�
Average years of service 11 yrs 7 mos� 12 yrs 0 mos� 12 yrs 4 mos�
Male 14 yrs 6 mos� 14 yrs 11 mos� 15 yrs 0 mos�
Female 7 yrs 11 mos� 8 yrs 3 mos� 8 yrs 10 mos�
Number of women in managerial positions 49 76 96
Ratio of employees with disabilities (% of total)** 2.09% 2.12% 2.23%
* The number of full-time employees on a non-consolidated basis, including employees seconded to other companies and organizations� The following list of employees is deducted from the total number of employees: employees seconded from other companies, locally hired employees at overseas branches, executive officers, part-time employees, and employees of temporary employment agencies�
** As of February 28 of respective years
April 1 2015 2016 2017Number of new hires 49 55 49Number of newly employed female graduates 30 31 27Ratio of newly employed females to total new employees 61.2% 56.4% 55.1%
Fiscal 2014 2015 2016Number of employees taking parental leave*** 66 81 84<Men taking such leave> <1> <1> <1>Number of career hires 3 8 1
*** Including employees who retired during the fiscal year
94 2017 Annual Report

ώ Japan Research InstituteMarch 31 2015 2016 2017Number of employees* 2,288 2,397 2,464
Male 1,722 1,796 1,836Percentage of total 75.26% 74.93% 74.51%
Female 566 601 628Percentage of total 24.74% 25.07% 25.49%
Average age 40 yrs 6 mos� 40 yrs 6 mos� 40 yrs 6 mos�
Male 41 yrs 2 mos� 41 yrs 1 mos� 41 yrs 1 mos�
Female 38 yrs 7 mos� 38 yrs 10 mos� 38 yrs 9 mos�
Average years of service 11 yrs 5 mos� 11 yrs 5 mos� 11 yrs 6 mos�
Male 11 yrs 10 mos� 11 yrs 9 mos� 11 yrs 9 mos�
Female 10 yrs 4 mos� 10 yrs 6 mos� 10 yrs 8 mos�
Ratio of employees with disabilities (% of total)** 2�00% 2�14% 2�68%
* The number of full-time employees, including employees seconded to other companies and organizations� The following list of employees is deducted from the total number of employees: executive officers, employees on short-term contracts, part-time employees, employees of temporary employment agencies, and locally hired employees at overseas branches�
** As of March 31 of respective years
April 1 2015 2016 2017Number of new hires 86 118 103Number of newly employed female graduates*** 23 41 32Ratio of newly employed females to total new employees 26.7% 34.7% 31.1%
*** Including only Sogoshoku employees� Ippanshoku employees are excluded�
Fiscal 2014 2015 2016Number of employees taking parental leave 49 53 69<Men taking such leave> <12> <10> <24>
ώ Sumitomo Mitsui Asset ManagementMarch 31 2017Number of employees* 582
Male 421Percentage of total 72.34%
Female 161Percentage of total 27.66%
Average age 44 yrs 4 mos�
Male 46 yrs 2 mos�
Female 39 yrs 6 mos�
Average years of service** 7 yrs 9 mos�
Male 8 yrs 0 mos�
Female 6 yrs 11 mos�
Number of women in managerial positions 8
* The number of full-time employees� The following list of employees is deducted from the total number of employees: executive officers, employees of temporary employment agencies, and locally hired employees at overseas branches�
** New employees joining due to mergers are calculated based on the merger date
April 1 2017Number of new hires 10Number of newly employed female graduates 5Ratio of newly employed females to total new employees 50.0%
Fiscal 2016Number of employees taking parental leave 15<Men taking such leave> <0>Number of career hires 24
Note: Information for Sumitomo Mitsui Asset Management Company, Limited, is displayed from fiscal 2016 as this company became a consolidated subsidiary of SMFG in July 2016�
• The combined employment ratio for persons with disabilities for the above 10 companies was 2�21% as of March 2017�
952017 Annual Report

Parental leaveLeave for taking care of
sick childrenShorter working hours
Restrictions on overtime
Exemption from late-night work
Other principal systems
SMBC
18 months or maximum of 2 years in case of inability to place in daycare center
Until March 31 of the 6th grade (10 days per annum per child; 20 days for two or more children)
Employees can choose shorter working hours for each day or fewer days worked per week, both applicable until March 31 of the 6th grade
Until March 31 of the 6th grade
Until March 31 of the 6th grade
• Short-term childcare leave • Work relocations• Childcare subsidies• Leave for nursing care• Shorter working hours allowed for nursing care• System for rehiring former employees• Half day leave• Flexibility in the work place
SMBC Trust Bank
1 year or maximum of 18 months in case of inability to place in daycare centerUp to 26 months if other conditions are met
Until the entry into junior high school (5 days per annum per child; 10 days for two or more children)
Employees can work shortened hours equivalent to working a minimum of 6 hours per day until child’s entry into elementary school
Until the entry into elementary school
Until the entry into elementary school
• Flextime System• Flexibility in working hours• Flexibility in the work place• Paternity leave (3 days)• Leave for nursing care• Shorter working hours allowed for nursing care• Nursing care leave
Sumitomo Mitsui Finance and
Leasing
1 year or maximum of 18 months in case of inability to place in daycare center
Until the entry into elementary school (5 days per annum per child; 10 days for two or more children)*May be extended as needed
Employees can reduce daily working hours to a minimum of 5 hours 30 minutes until March 31 of the 6th grade
Until the entry into elementary school
Until the entry into elementary school
• Work relocations• System for rehiring former employees• Short-term childcare leave• Leave for nursing care• Shorter working hours allowed for nursing care
SMBC Nikko Securities
Until 3 years of age Until the entry into elementary school (5 days per annum per child; 10 days for two or more children)
Employees may reduce daily working hours in increments of 30 minutes up to 2�5 hours until March 31 of the 6th grade
Until March 31 of the 6th grade
Until March 31 of the 6th grade
• Short-term childcare leave• Discounted rates for daycare center• Nursing care leave• Special days off for nursing care• Shorter working hours allowed for nursing care• Short-term leave for nursing care• Staggered working hours (working in shifts)• Rehiring former employees
SMBC Friend Securities
18 months or maximum of 2 years in case of inability to place in daycare center
Until March 31 of the 3rd grade (5 days per annum per child; 10 days for two or more children)
Employees can reduce daily working hours to between 6 hours and 6 hours 50 minutes until March 31 of the 3rd grade
Until March 31 of the 3rd grade
Until March 31 of the 3rd grade
• Leave for nursing care• Shorter working hours allowed for nursing care• System for rehiring former employees• Childcare subsidies• Discounted rates for daycare center• Staggered working hours (working in shifts)• Work relocations• Maternity leave
Sumitomo Mitsui Card
18 months or maximum of 2 years in case of inability to place in daycare center
Until March 31 of the 6th grade (5 days per annum per child; 10 days for two or more children)
Employees can choose to reduce daily working hours by 30, 60, or 90 minutes or reduce the number of days worked a week until March 31 of child’s 3rd-grade year
Until March 31 of the 3rd grade
Until March 31 of the 3rd grade
• Work relocations• Staggered working hours• Half-day paid leave• Special leave (for spouse’s childbirth)• Childcare subsidies• Nursing care leave, days off for nursing care• Shorter working hours for nursing care• Rehiring former employees
Cedyna
Until 3 years of age Until March 31 of the 6th grade (5 days per annum per child; 10 days for two or more children)
Until March 31 of the 3rd grade (Employees can choose to work 5, 6, or 7 hours a day)�
Until the entry into elementary school
Until the entry into elementary school
• Maternity leave and work• Short-term childcare leave• Leave for nursing care• Shorter working hours allowed for nursing care• System for rehiring former employees• Maternity leave (for men)• Leave for providing nursing care or taking care
of sick children (by the hour)
SMBC Consumer Finance
1 year or maximum of 18 months in case of inability to place in daycare center
Until the entry into elementary school (5 days per annum per child; 10 days for two or more children)
Employees can choose to reduce daily working hours to a minimum of 6 hours (and a maximum of 8 hours) through the adjustment of starting or ending times by 30-minute blocks until March 31 of the 3rd-grade
Until the entry into elementary school
Until the entry into elementary school
• Personnel system being employed under the regional system of no possibility of transfers with movings
• Rehiring retirees• A grace period for job rotation• Leave for nursing care• Shorter working hours allowed for nursing care• Paid leave by the hour• Half-day paid leave• Leave before and after maternity• Childcare leave (2 days)• School-visiting day (2 days a year)• Rehiring of former employees who quit for
childcare or care-giving reasons• Husband’s maternity leave (3 days)• Rollover of unused paid vacation days to
subsequent years
Japan Research Institute
18 months or maximum of 2 years in case of inability to place in daycare center
Until March 31 of the 6th grade (5 days per annum per child; no upper limit)
Employees can choose to work 4, 5, 6 or 7 hours per day until March 31 of the 3rd grade (this system can be combined with flextime)�
Until the entry into elementary school
For employees who are pregnant or have given birth within previous 12 months
• Childcare subsidies• Telecommuting• Nursing care leave• Shorter working hours (for nursing care, etc�)• Time off and shorter working hours• Days off for nursing care• Special leave (for spouse’s childbirth)• Paid leave for initial 15 days of childcare
Sumitomo Mitsui Asset Management
1 year or maximum of 36 months in case of inability to place in daycare center
Until the entry of child into elementary school (5 days per annum per child; 10 days for two or more children)
Employees can reduce daily working hours to 5 or 6 hours or 6 hours and 30 minutes until child completes 3rd grade of elementary school
Until child completes 3rd grade of elementary school
Until child completes 3rd grade of elementary school
• Leave for childbirth by spouse• Leave for taking care of sick children• Leave for nursing care• Staggered working hours for childcare or nursing
care purposes• Special-case usage of annual leave in half-day
increments• Telecommuting
Main Work-Life Balance Support System(Employee Support Program)
96 2017 Annual Report
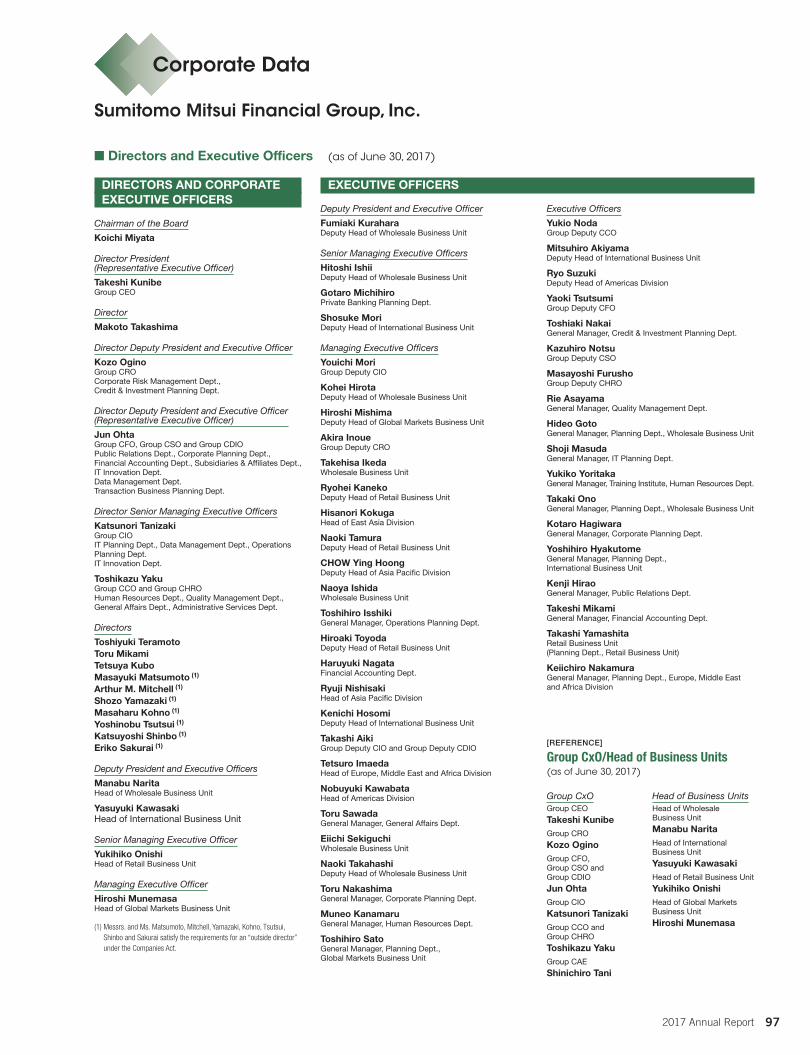
■ Directors and Executive Officers (as of June 30, 2017)
DIRECTORS AND CORPORATEEXECUTIVE OFFICERS
Chairman of the Board
Koichi Miyata
Director President (Representative Executive Officer)
Takeshi KunibeGroup CEO
Director
Makoto Takashima
Director Deputy President and Executive Officer
Kozo Ogino Group CRO Corporate Risk Management Dept., Credit & Investment Planning Dept.
Director Deputy President and Executive Officer (Representative Executive Officer)
Jun Ohta Group CFO, Group CSO and Group CDIOPublic Relations Dept., Corporate Planning Dept., Financial Accounting Dept., Subsidiaries & Affiliates Dept., IT Innovation Dept.Data Management Dept.Transaction Business Planning Dept.
Director Senior Managing Executive Officers
Katsunori TanizakiGroup CIOIT Planning Dept., Data Management Dept., Operations Planning Dept.IT Innovation Dept.
Toshikazu Yaku Group CCO and Group CHROHuman Resources Dept., Quality Management Dept., General Affairs Dept., Administrative Services Dept.
Directors
Toshiyuki TeramotoToru MikamiTetsuya KuboMasayuki Matsumoto (1)
Arthur M. Mitchell (1)
Shozo Yamazaki (1)
Masaharu Kohno (1)
Yoshinobu Tsutsui (1)
Katsuyoshi Shinbo (1)
Eriko Sakurai (1)
Deputy President and Executive Officers
Manabu Narita Head of Wholesale Business Unit
Yasuyuki Kawasaki Head of International Business Unit
Senior Managing Executive Officer
Yukihiko Onishi Head of Retail Business Unit
Managing Executive Officer
Hiroshi MunemasaHead of Global Markets Business Unit
(1) Messrs. and Ms. Matsumoto, Mitchell, Yamazaki, Kohno, Tsutsui, Shinbo and Sakurai satisfy the requirements for an “outside director” under the Companies Act.
EXECUTIVE OFFICERS
Deputy President and Executive Officer
Fumiaki KuraharaDeputy Head of Wholesale Business Unit
Senior Managing Executive Officers
Hitoshi IshiiDeputy Head of Wholesale Business Unit
Gotaro MichihiroPrivate Banking Planning Dept.
Shosuke MoriDeputy Head of International Business Unit
Managing Executive Officers
Youichi MoriGroup Deputy CIO
Kohei HirotaDeputy Head of Wholesale Business Unit
Hiroshi MishimaDeputy Head of Global Markets Business Unit
Akira InoueGroup Deputy CRO
Takehisa IkedaWholesale Business Unit
Ryohei KanekoDeputy Head of Retail Business Unit
Hisanori KokugaHead of East Asia Division
Naoki TamuraDeputy Head of Retail Business Unit
CHOW Ying HoongDeputy Head of Asia Pacific Division
Naoya IshidaWholesale Business Unit
Toshihiro IsshikiGeneral Manager, Operations Planning Dept.
Hiroaki ToyodaDeputy Head of Retail Business Unit
Haruyuki NagataFinancial Accounting Dept.
Ryuji NishisakiHead of Asia Pacific Division
Kenichi HosomiDeputy Head of International Business Unit
Takashi AikiGroup Deputy CIO and Group Deputy CDIO
Tetsuro ImaedaHead of Europe, Middle East and Africa Division
Nobuyuki KawabataHead of Americas Division
Toru SawadaGeneral Manager, General Affairs Dept.
Eiichi SekiguchiWholesale Business Unit
Naoki TakahashiDeputy Head of Wholesale Business Unit
Toru NakashimaGeneral Manager, Corporate Planning Dept.
Muneo KanamaruGeneral Manager, Human Resources Dept.
Toshihiro SatoGeneral Manager, Planning Dept., Global Markets Business Unit
Executive Officers
Yukio NodaGroup Deputy CCO
Mitsuhiro AkiyamaDeputy Head of International Business Unit
Ryo SuzukiDeputy Head of Americas Division
Yaoki TsutsumiGroup Deputy CFO
Toshiaki NakaiGeneral Manager, Credit & Investment Planning Dept.
Kazuhiro NotsuGroup Deputy CSO
Masayoshi FurushoGroup Deputy CHRO
Rie AsayamaGeneral Manager, Quality Management Dept.
Hideo GotoGeneral Manager, Planning Dept., Wholesale Business Unit
Shoji MasudaGeneral Manager, IT Planning Dept.
Yukiko YoritakaGeneral Manager, Training Institute, Human Resources Dept.
Takaki OnoGeneral Manager, Planning Dept., Wholesale Business Unit
Kotaro HagiwaraGeneral Manager, Corporate Planning Dept.
Yoshihiro HyakutomeGeneral Manager, Planning Dept., International Business Unit
Kenji HiraoGeneral Manager, Public Relations Dept.
Takeshi MikamiGeneral Manager, Financial Accounting Dept.
Takashi YamashitaRetail Business Unit (Planning Dept., Retail Business Unit)
Keiichiro NakamuraGeneral Manager, Planning Dept., Europe, Middle East and Africa Division
[REFERENCE]
Group CxO/Head of Business Units(as of June 30, 2017)
Group CxO Group CEO
Takeshi KunibeGroup CRO
Kozo OginoGroup CFO,Group CSO and Group CDIO
Jun OhtaGroup CIO
Katsunori TanizakiGroup CCO and Group CHRO
Toshikazu YakuGroup CAE
Shinichiro Tani
Head of Business UnitsHead of Wholesale Business Unit
Manabu NaritaHead of International Business Unit
Yasuyuki KawasakiHead of Retail Business Unit
Yukihiko OnishiHead of Global Markets Business Unit
Hiroshi Munemasa
Sumitomo Mitsui Financial Group, Inc.
Corporate Data
972017 Annual Report
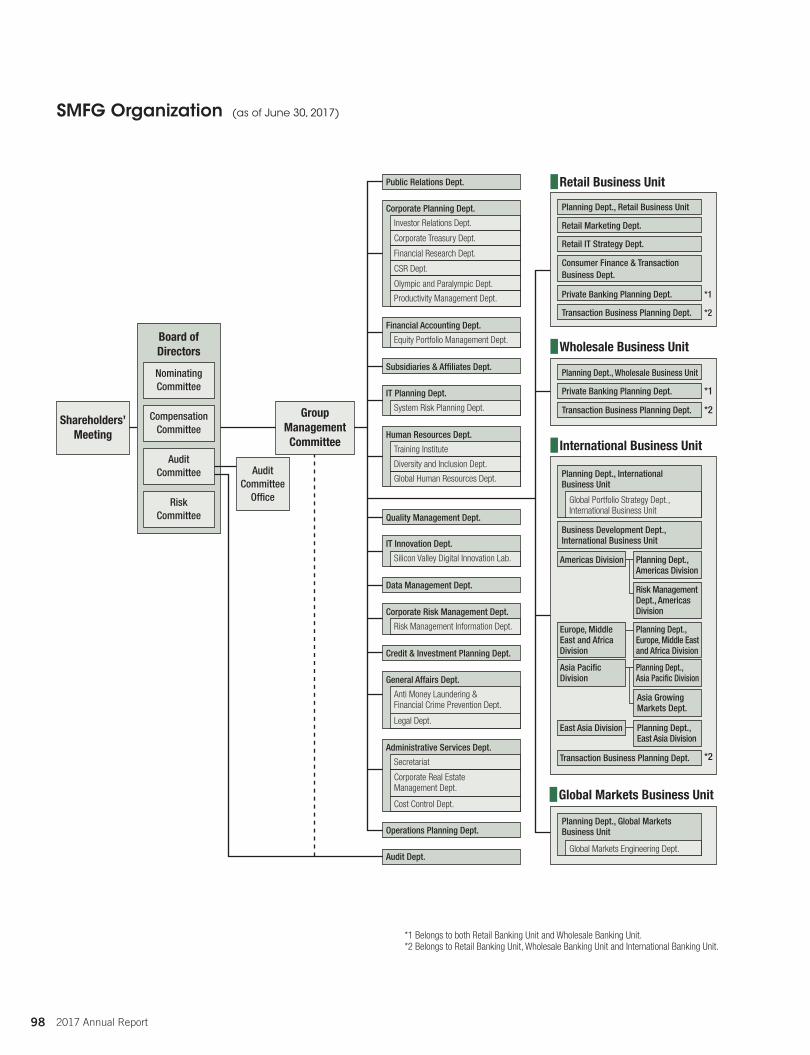
Planning Dept., Retail Business Unit
Public Relations Dept.
Corporate Planning Dept.
Retail Marketing Dept.
Retail IT Strategy Dept.
Consumer Finance & TransactionBusiness Dept.
Private Banking Planning Dept. *1
Transaction Business Planning Dept. *2
*1
*2
*2
Planning Dept., Wholesale Business Unit
Private Banking Planning Dept.
Transaction Business Planning Dept.
Business Development Dept.,International Business Unit
Transaction Business Planning Dept.
Americas Division
Europe, Middle East and Africa Division
East Asia Division
Risk Management Dept., Americas Division
Asia PacificDivision
Planning Dept., Asia Pacific Division
Asia GrowingMarkets Dept.
Planning Dept., Europe, Middle East and Africa Division
Planning Dept.,East Asia Division
Planning Dept., Global Markets Business Unit
Global Markets Engineering Dept.
Global Markets Business Unit
Planning Dept., InternationalBusiness Unit
International Business Unit
Wholesale Business UnitBoard ofDirectors
CompensationCommittee
NominatingCommittee
AuditCommittee
RiskCommittee
AuditCommittee
Office
*1 Belongs to both Retail Banking Unit and Wholesale Banking Unit.*2 Belongs to Retail Banking Unit, Wholesale Banking Unit and International Banking Unit.
GroupManagementCommittee
Shareholders’Meeting
Global Portfolio Strategy Dept.,International Business Unit
Investor Relations Dept.
Financial Accounting Dept.
Subsidiaries & Affiliates Dept.
Equity Portfolio Management Dept.
IT Planning Dept.
System Risk Planning Dept.
IT Innovation Dept.
Data Management Dept.
Credit & Investment Planning Dept.
Silicon Valley Digital Innovation Lab.
Corporate Risk Management Dept.
Risk Management Information Dept.
General Affairs Dept.
Operations Planning Dept.
Audit Dept.
Anti Money Laundering & Financial Crime Prevention Dept.
Legal Dept.
Administrative Services Dept.
Secretariat
Cost Control Dept.
Human Resources Dept.
Quality Management Dept.
Training Institute
Corporate Treasury Dept.
Financial Research Dept.
CSR Dept.
Olympic and Paralympic Dept.
Productivity Management Dept.
Diversity and Inclusion Dept.
Global Human Resources Dept.
Planning Dept., Americas Division
Corporate Real Estate Management Dept.
Retail Business Unit
SMFG Organization (as of June 30, 2017)
98 2017 Annual Report
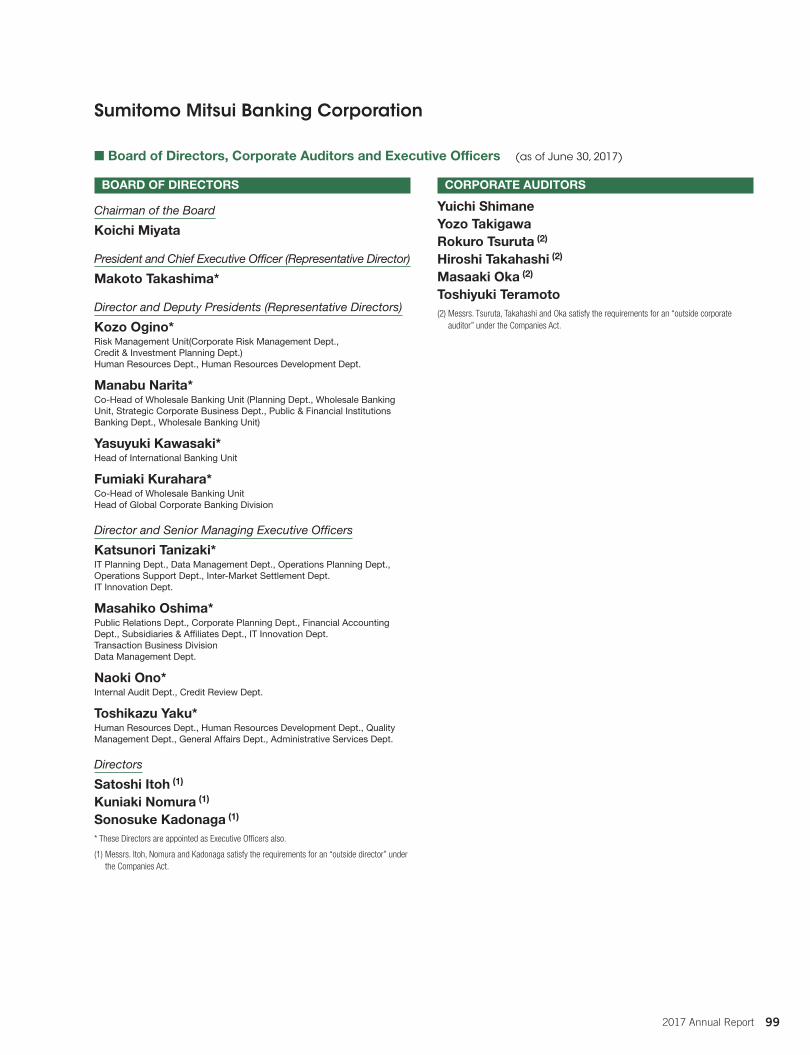
■ Board of Directors, Corporate Auditors and Executive Officers (as of June 30, 2017)
BOARD OF DIRECTORS
Chairman of the Board
Koichi Miyata
President and Chief Executive Officer (Representative Director)
Makoto Takashima*
Director and Deputy Presidents (Representative Directors)
Kozo Ogino*Risk Management Unit(Corporate Risk Management Dept., Credit & Investment Planning Dept.) Human Resources Dept., Human Resources Development Dept.
Manabu Narita*Co-Head of Wholesale Banking Unit (Planning Dept., Wholesale Banking Unit, Strategic Corporate Business Dept., Public & Financial Institutions Banking Dept., Wholesale Banking Unit)
Yasuyuki Kawasaki*Head of International Banking Unit
Fumiaki Kurahara*Co-Head of Wholesale Banking Unit Head of Global Corporate Banking Division
Director and Senior Managing Executive Officers
Katsunori Tanizaki*IT Planning Dept., Data Management Dept., Operations Planning Dept., Operations Support Dept., Inter-Market Settlement Dept. IT Innovation Dept.
Masahiko Oshima*Public Relations Dept., Corporate Planning Dept., Financial Accounting Dept., Subsidiaries & Affiliates Dept., IT Innovation Dept. Transaction Business Division Data Management Dept.
Naoki Ono*Internal Audit Dept., Credit Review Dept.
Toshikazu Yaku*Human Resources Dept., Human Resources Development Dept., Quality Management Dept., General Affairs Dept., Administrative Services Dept.
Directors
Satoshi Itoh (1)
Kuniaki Nomura (1)
Sonosuke Kadonaga (1)
* These Directors are appointed as Executive Officers also.
(1) Messrs. Itoh, Nomura and Kadonaga satisfy the requirements for an “outside director” under the Companies Act.
CORPORATE AUDITORS
Yuichi ShimaneYozo TakigawaRokuro Tsuruta (2)
Hiroshi Takahashi (2)
Masaaki Oka (2)
Toshiyuki Teramoto(2) Messrs. Tsuruta, Takahashi and Oka satisfy the requirements for an “outside corporate
auditor” under the Companies Act.
Sumitomo Mitsui Banking Corporation
992017 Annual Report
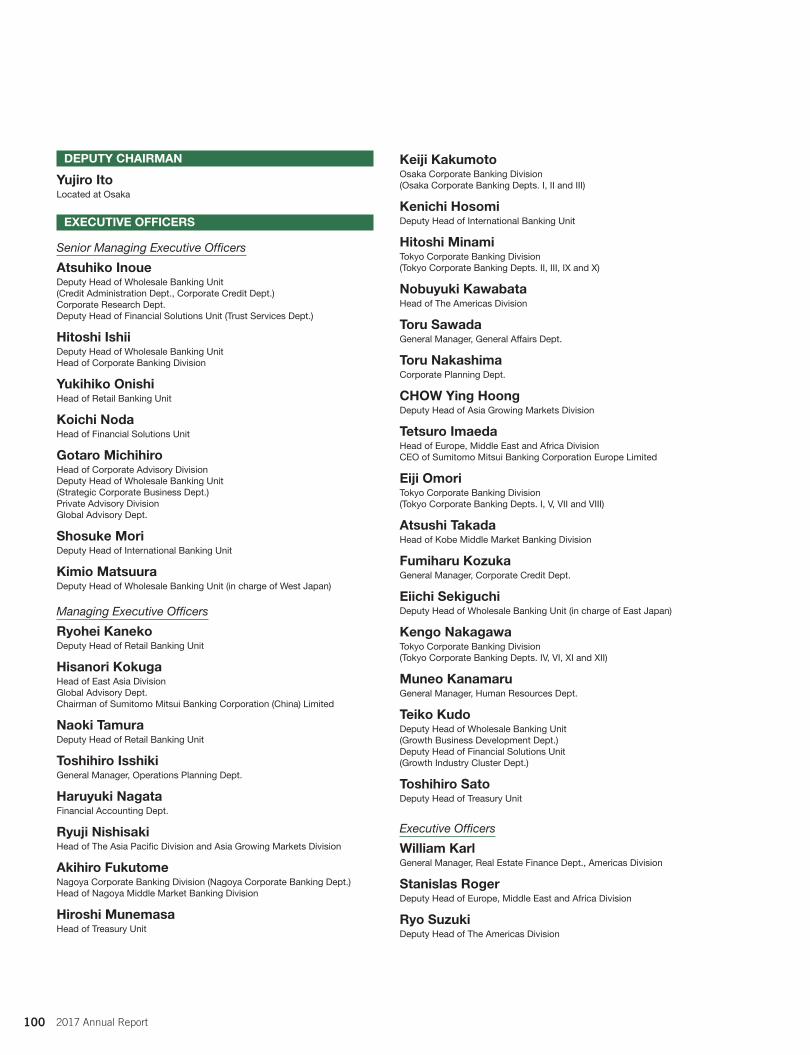
DEPUTY CHAIRMAN
Yujiro ItoLocated at Osaka
EXECUTIVE OFFICERS
Senior Managing Executive Officers
Atsuhiko InoueDeputy Head of Wholesale Banking Unit(Credit Administration Dept., Corporate Credit Dept.)Corporate Research Dept.Deputy Head of Financial Solutions Unit (Trust Services Dept.)
Hitoshi IshiiDeputy Head of Wholesale Banking UnitHead of Corporate Banking Division
Yukihiko OnishiHead of Retail Banking Unit
Koichi NodaHead of Financial Solutions Unit
Gotaro MichihiroHead of Corporate Advisory DivisionDeputy Head of Wholesale Banking Unit(Strategic Corporate Business Dept.)Private Advisory DivisionGlobal Advisory Dept.
Shosuke MoriDeputy Head of International Banking Unit
Kimio MatsuuraDeputy Head of Wholesale Banking Unit (in charge of West Japan)
Managing Executive Officers
Ryohei KanekoDeputy Head of Retail Banking Unit
Hisanori KokugaHead of East Asia DivisionGlobal Advisory Dept.Chairman of Sumitomo Mitsui Banking Corporation (China) Limited
Naoki TamuraDeputy Head of Retail Banking Unit
Toshihiro IsshikiGeneral Manager, Operations Planning Dept.
Haruyuki NagataFinancial Accounting Dept.
Ryuji NishisakiHead of The Asia Pacific Division and Asia Growing Markets Division
Akihiro FukutomeNagoya Corporate Banking Division (Nagoya Corporate Banking Dept.)Head of Nagoya Middle Market Banking Division
Hiroshi MunemasaHead of Treasury Unit
Keiji KakumotoOsaka Corporate Banking Division(Osaka Corporate Banking Depts. I, II and III)
Kenichi HosomiDeputy Head of International Banking Unit
Hitoshi MinamiTokyo Corporate Banking Division(Tokyo Corporate Banking Depts. II, III, IX and X)
Nobuyuki KawabataHead of The Americas Division
Toru SawadaGeneral Manager, General Affairs Dept.
Toru NakashimaCorporate Planning Dept.
CHOW Ying HoongDeputy Head of Asia Growing Markets Division
Tetsuro ImaedaHead of Europe, Middle East and Africa Division CEO of Sumitomo Mitsui Banking Corporation Europe Limited
Eiji OmoriTokyo Corporate Banking Division(Tokyo Corporate Banking Depts. I, V, VII and VIII)
Atsushi TakadaHead of Kobe Middle Market Banking Division
Fumiharu KozukaGeneral Manager, Corporate Credit Dept.
Eiichi SekiguchiDeputy Head of Wholesale Banking Unit (in charge of East Japan)
Kengo NakagawaTokyo Corporate Banking Division(Tokyo Corporate Banking Depts. IV, VI, XI and XII)
Muneo KanamaruGeneral Manager, Human Resources Dept.
Teiko KudoDeputy Head of Wholesale Banking Unit(Growth Business Development Dept.)Deputy Head of Financial Solutions Unit(Growth Industry Cluster Dept.)
Toshihiro SatoDeputy Head of Treasury Unit
Executive Officers
William KarlGeneral Manager, Real Estate Finance Dept., Americas Division
Stanislas RogerDeputy Head of Europe, Middle East and Africa Division
Ryo SuzukiDeputy Head of The Americas Division
100 2017 Annual Report
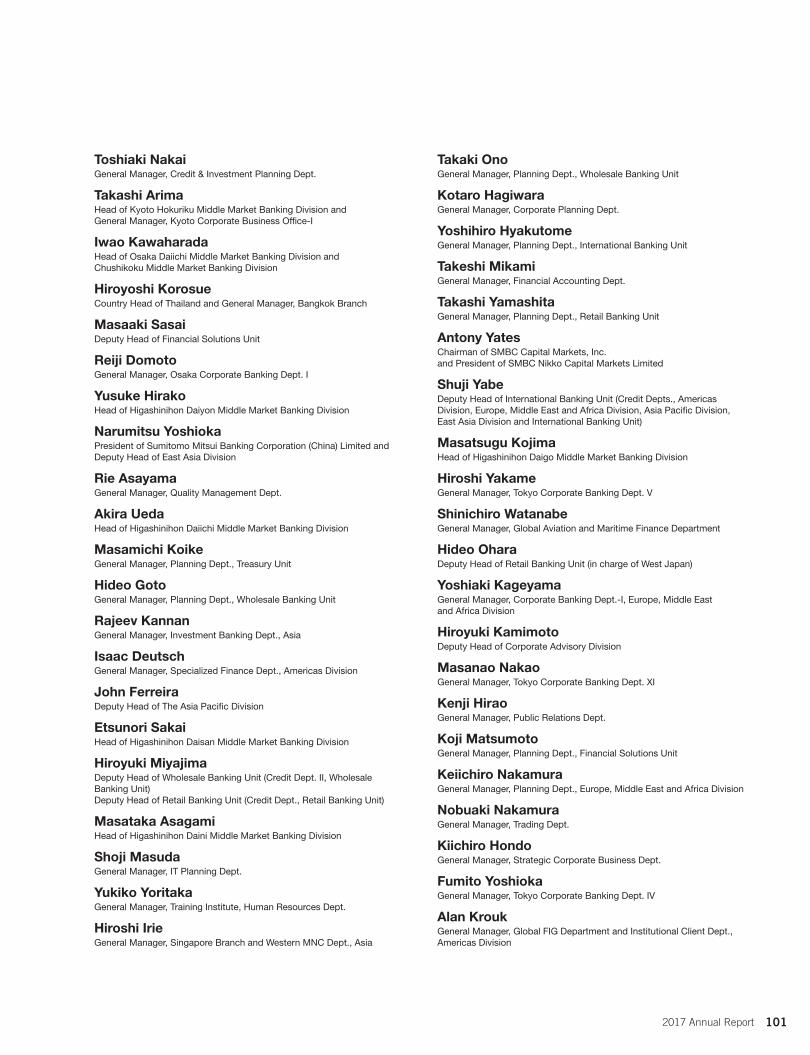
Toshiaki NakaiGeneral Manager, Credit & Investment Planning Dept.
Takashi ArimaHead of Kyoto Hokuriku Middle Market Banking Division and General Manager, Kyoto Corporate Business Office-I
Iwao KawaharadaHead of Osaka Daiichi Middle Market Banking Division and Chushikoku Middle Market Banking Division
Hiroyoshi KorosueCountry Head of Thailand and General Manager, Bangkok Branch
Masaaki SasaiDeputy Head of Financial Solutions Unit
Reiji DomotoGeneral Manager, Osaka Corporate Banking Dept. I
Yusuke HirakoHead of Higashinihon Daiyon Middle Market Banking Division
Narumitsu YoshiokaPresident of Sumitomo Mitsui Banking Corporation (China) Limited and Deputy Head of East Asia Division
Rie AsayamaGeneral Manager, Quality Management Dept.
Akira UedaHead of Higashinihon Daiichi Middle Market Banking Division
Masamichi KoikeGeneral Manager, Planning Dept., Treasury Unit
Hideo GotoGeneral Manager, Planning Dept., Wholesale Banking Unit
Rajeev KannanGeneral Manager, Investment Banking Dept., Asia
Isaac DeutschGeneral Manager, Specialized Finance Dept., Americas Division
John FerreiraDeputy Head of The Asia Pacific Division
Etsunori SakaiHead of Higashinihon Daisan Middle Market Banking Division
Hiroyuki MiyajimaDeputy Head of Wholesale Banking Unit (Credit Dept. II, Wholesale Banking Unit)Deputy Head of Retail Banking Unit (Credit Dept., Retail Banking Unit)
Masataka AsagamiHead of Higashinihon Daini Middle Market Banking Division
Shoji MasudaGeneral Manager, IT Planning Dept.
Yukiko YoritakaGeneral Manager, Training Institute, Human Resources Dept.
Hiroshi IrieGeneral Manager, Singapore Branch and Western MNC Dept., Asia
Takaki OnoGeneral Manager, Planning Dept., Wholesale Banking Unit
Kotaro HagiwaraGeneral Manager, Corporate Planning Dept.
Yoshihiro HyakutomeGeneral Manager, Planning Dept., International Banking Unit
Takeshi MikamiGeneral Manager, Financial Accounting Dept.
Takashi YamashitaGeneral Manager, Planning Dept., Retail Banking Unit
Antony YatesChairman of SMBC Capital Markets, Inc.and President of SMBC Nikko Capital Markets Limited
Shuji YabeDeputy Head of International Banking Unit (Credit Depts., AmericasDivision, Europe, Middle East and Africa Division, Asia Pacific Division, East Asia Division and International Banking Unit)
Masatsugu KojimaHead of Higashinihon Daigo Middle Market Banking Division
Hiroshi YakameGeneral Manager, Tokyo Corporate Banking Dept. V
Shinichiro WatanabeGeneral Manager, Global Aviation and Maritime Finance Department
Hideo OharaDeputy Head of Retail Banking Unit (in charge of West Japan)
Yoshiaki KageyamaGeneral Manager, Corporate Banking Dept.-I, Europe, Middle East and Africa Division
Hiroyuki KamimotoDeputy Head of Corporate Advisory Division
Masanao NakaoGeneral Manager, Tokyo Corporate Banking Dept. XI
Kenji HiraoGeneral Manager, Public Relations Dept.
Koji MatsumotoGeneral Manager, Planning Dept., Financial Solutions Unit
Keiichiro NakamuraGeneral Manager, Planning Dept., Europe, Middle East and Africa Division
Nobuaki NakamuraGeneral Manager, Trading Dept.
Kiichiro HondoGeneral Manager, Strategic Corporate Business Dept.
Fumito YoshiokaGeneral Manager, Tokyo Corporate Banking Dept. IV
Alan KroukGeneral Manager, Global FIG Department and Institutional Client Dept., Americas Division
1012017 Annual Report

Channel Strategy Dept.
Shareholders’Meeting
Board ofDirectors
Management Committee
Corporate Auditors/Board of Corporate AuditorsCorporate Auditors/Board of Corporate Auditors
Of�ce of Corporate Auditors
Retail Banking Unit
Wholesale Banking Unit
International Banking Unit
Treasury Unit
Financial Solutions Unit
Corporate Staff Unit
Compliance Unit
Risk Management Unit
Corporate Services Unit
Internal Audit Unit
Public Relations Dept.Corporate Planning Dept.
Financial Accounting Dept.
Financial Research Dept.CSR Dept.Olympic and Paralympic Dept.Productivity Management Dept.
IT Planning Dept.
IT Innovation Dept.Data Management Dept.
Quality Management Dept.Customer Relations Dept.
Human Resources Dept.
Human Resources Development Dept.
Training InstituteCounseling Dept.
System Risk Planning Dept.
Diversity and Inclusion Dept.Global Human Resources Dept.
Internal Audit Dept.Credit Review Dept.
Subsidiaries & Af�liates Dept.Equity Portfolio Management Dept.
General Affairs Dept.
Legal Dept.
Anti Money Laundering & Financial Crime Prevention Department
Corporate Risk Management Dept.Risk Management Information Dept.
Credit & Investment Planning Dept.Credit Portfolio Management Dept.
Administrative Services Dept.SecretariatCorporate Real Estate Management Dept.
Operations Planning Dept.Operations Support Dept.Inter-Market Settlement Dept.
Planning Dept., Retail Banking Unit
Strategic Corporate Business Dept. Business Promotion Of�ce
Retail Compliance Dept.Next W-ing Project Dept.
Area Support Dept.
Global Supply Chain Finance Dept.
Financial Consulting Dept., Retail Banking Unit
Area Support Dept.Retail Marketing Dept., Retail Banking Unit
Retail IT Strategy Dept.Consumer Finance & Transaction Business Dept., Retail Banking Unit.Credit Dept., Retail Banking Unit
Retail Human Resources Dept.Business Promotion Dept., Retail Banking UnitSmall and Medium Enterprises Planning Dept.
Middle Market Facilitating Financing Dept.Global Corporate Banking Dept.
Structured Finance Credit Dept.
Area Main Of�ce
Global Client Business Dept.Global Corporate Investment Dept.Global Trade Finance Dept.
Global FIG Dept.Institutional Client Dept., Asia
Global Aviation and Maritime Finance Dept.
Corporate Business Of�ceStrategic Finance Promotion Of�ceCredit Business Of�ceReal Estate Corporate Business Of�cePublic Institutions Business Of�ceGlobal Transaction Of�ce*7
E-Transaction Business Center*7
Departments of Americas Division
Global Transaction Of�ce*7
E-Transaction Business Center*7
BranchPrivate Banking Dept.*8
Consumer Loan Promotion Of�ceLoan Promotion Of�ceRemote Marketing Dept.Call CenterConsumer Finance Promotion Of�ce
Global Transaction Of�ce*7Retail Credit Business Of�ce
E-Transaction Business Center*7
Departments of Europe, Middle East and Africa Division
Tokyo Corporate Banking Division Osaka Corporate Banking DivisionNagoya Corporate Banking Division
East Asia Division Branches/Representative Of�ces in East Asia
Americas DivisionEurope, Middle East and Africa Division
Branches/Representative Of�ces in Asia Paci�c Division
Asia Paci�c Division
Real Estate Finance Dept.*1
Credit Dept. I, Wholesale Banking UnitCredit Dept. II, Wholesale Banking UnitCredit Administration Dept.Growth Business Development Dept.M&A Advisory Services Dept.
Public & Financial Institutions Banking Dept., Wholesale Banking UnitCorporate Credit Dept.
Planning Dept., East Asia Division
Planning Dept., International Banking UnitIT & Business Administration Planning Dept.Aviation & Maritime Strategy Dept.Global Portfolio Strategy Dept.
Business Development Dept., International Banking Unit
Planning Dept., Asia Paci�c Division
Credit Dept., Asia Paci�c Division Risk Management Dept., Asia Paci�c DivisionCredit Dept., East Asia Division Asia Growing Markets Division
Asia Retail Innovation Dept.
Corporate Solutions Dept., Asia*3
Information Control Dept., Americas DivisionPlanning Dept., Americas Division
Credit Dept., Americas DivisionRisk Management Dept., Americas Division
Planning Dept., Europe, Middle East and Africa Division
Credit Dept., Europe, Middle East and Africa Division
Risk Management Dept., Middle East and Africa Division
Compliance Dept., Americas Division
Planning Dept., Treasury Unit
Treasury Dept.International Treasury Dept.Trading Dept.Treasury Marketing Dept.Financial Products Dept.
Securities Direct Sales Dept.Treasury Dept., Asia Paci�c Division
Global Markets Engineering Dept.Global Credit Investment Dept.
Planning Dept., Financial Solutions Unit
Shipping Finance Dept.Structured Finance Dept.
Investment Banking Services Dept.Debt Finance Dept.
Trust Business Operations Dept.Trust Services Dept.
Real Estate Finance Dept.*1
Merchant Banking Dept.
Investment Banking Dept., AsiaCorporate Solutions Dept., Asia *3
Distribution Dept.Growth Industry Cluster Dept.*2
Branch Service Of�ceHead/Main Service Of�cePublic Institutions Operations Of�ceSouzoku-of�ce Sub-BranchOperations Service Of�ce
*1 Belongs to both Financial Solutions Unit and Wholesale Banking Unit.*2 Belongs to both Financial Solutions Unit and Wholesale Banking Unit (Corporate Advisory Division).*3 Belongs to both International Banking Unit and Financial Solutions Unit*4 • Corporate Advisory Division
• Advisory Dept. I• Advisory Dept. II• Advisory Dept. III• Corporate Research Dept.• Growth Industry Cluster Dept.*2
*5 • Private Advisory Division• Private Advisory Business Dept.
• Testamentary Trust Dept.• Private Banking Planning Dept.
• Corporate Employees Solution Dept.• De�ned Contribution Dept.
*6 • Transaction Business Division• Transaction Business Planning Dept.• Transaction Products Development Dept.• Asset Finance Dept.• Transaction Banking Dept.• Global Transaction Banking Dept.• Global Advisory Dept.• Global Business Promotion Dept.• Global Transaction Support Dept.
• Foreign Exchange Insourcing Business Dept.*7 • Belongs to Retail Banking Unit, Wholesale Banking Unit and International Banking Unit.*8 • Belongs to both Retail Banking Unit and Wholesale Banking Unit.
Planning Dept., Wholesale Banking Unit
Corporate Banking Dept.
Private Banking Dept.*8
Middle Market Banking DivisionCorporate Banking Division
Global Corporate Banking Division
Retail Facilitating Financing Dept.
Loan Business Dept.
Legal and Compliance Dept., Europe, Middle East and Africa Division
Asset Finance Credit Dept.
Legal and Compliance Dept., Asia Pacific Division
Credit Dept., International Banking UnitEnvironment Analysis Dept., International Banking Unit
Asia Pacific Training Dept.
*4
*5
*6
SMBC Organization(as of June 30, 2017)
102 2017 Annual Report
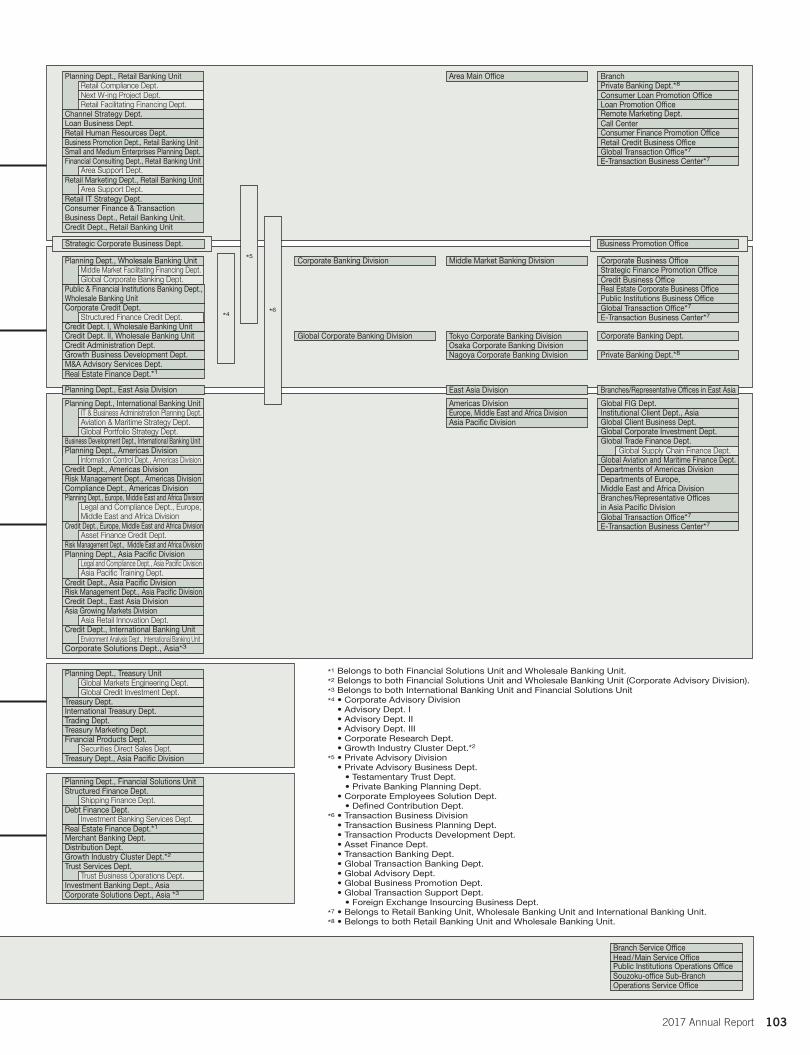
Channel Strategy Dept.
Shareholders’Meeting
Board ofDirectors
Management Committee
Corporate Auditors/Board of Corporate AuditorsCorporate Auditors/Board of Corporate Auditors
Of�ce of Corporate Auditors
Retail Banking Unit
Wholesale Banking Unit
International Banking Unit
Treasury Unit
Financial Solutions Unit
Corporate Staff Unit
Compliance Unit
Risk Management Unit
Corporate Services Unit
Internal Audit Unit
Public Relations Dept.Corporate Planning Dept.
Financial Accounting Dept.
Financial Research Dept.CSR Dept.Olympic and Paralympic Dept.Productivity Management Dept.
IT Planning Dept.
IT Innovation Dept.Data Management Dept.
Quality Management Dept.Customer Relations Dept.
Human Resources Dept.
Human Resources Development Dept.
Training InstituteCounseling Dept.
System Risk Planning Dept.
Diversity and Inclusion Dept.Global Human Resources Dept.
Internal Audit Dept.Credit Review Dept.
Subsidiaries & Af�liates Dept.Equity Portfolio Management Dept.
General Affairs Dept.
Legal Dept.
Anti Money Laundering & Financial Crime Prevention Department
Corporate Risk Management Dept.Risk Management Information Dept.
Credit & Investment Planning Dept.Credit Portfolio Management Dept.
Administrative Services Dept.SecretariatCorporate Real Estate Management Dept.
Operations Planning Dept.Operations Support Dept.Inter-Market Settlement Dept.
Planning Dept., Retail Banking Unit
Strategic Corporate Business Dept. Business Promotion Of�ce
Retail Compliance Dept.Next W-ing Project Dept.
Area Support Dept.
Global Supply Chain Finance Dept.
Financial Consulting Dept., Retail Banking Unit
Area Support Dept.Retail Marketing Dept., Retail Banking Unit
Retail IT Strategy Dept.Consumer Finance & Transaction Business Dept., Retail Banking Unit.Credit Dept., Retail Banking Unit
Retail Human Resources Dept.Business Promotion Dept., Retail Banking UnitSmall and Medium Enterprises Planning Dept.
Middle Market Facilitating Financing Dept.Global Corporate Banking Dept.
Structured Finance Credit Dept.
Area Main Of�ce
Global Client Business Dept.Global Corporate Investment Dept.Global Trade Finance Dept.
Global FIG Dept.Institutional Client Dept., Asia
Global Aviation and Maritime Finance Dept.
Corporate Business Of�ceStrategic Finance Promotion Of�ceCredit Business Of�ceReal Estate Corporate Business Of�cePublic Institutions Business Of�ceGlobal Transaction Of�ce*7
E-Transaction Business Center*7
Departments of Americas Division
Global Transaction Of�ce*7
E-Transaction Business Center*7
BranchPrivate Banking Dept.*8
Consumer Loan Promotion Of�ceLoan Promotion Of�ceRemote Marketing Dept.Call CenterConsumer Finance Promotion Of�ce
Global Transaction Of�ce*7Retail Credit Business Of�ce
E-Transaction Business Center*7
Departments of Europe, Middle East and Africa Division
Tokyo Corporate Banking Division Osaka Corporate Banking DivisionNagoya Corporate Banking Division
East Asia Division Branches/Representative Of�ces in East Asia
Americas DivisionEurope, Middle East and Africa Division
Branches/Representative Of�ces in Asia Paci�c Division
Asia Paci�c Division
Real Estate Finance Dept.*1
Credit Dept. I, Wholesale Banking UnitCredit Dept. II, Wholesale Banking UnitCredit Administration Dept.Growth Business Development Dept.M&A Advisory Services Dept.
Public & Financial Institutions Banking Dept., Wholesale Banking UnitCorporate Credit Dept.
Planning Dept., East Asia Division
Planning Dept., International Banking UnitIT & Business Administration Planning Dept.Aviation & Maritime Strategy Dept.Global Portfolio Strategy Dept.
Business Development Dept., International Banking Unit
Planning Dept., Asia Paci�c Division
Credit Dept., Asia Paci�c Division Risk Management Dept., Asia Paci�c DivisionCredit Dept., East Asia Division Asia Growing Markets Division
Asia Retail Innovation Dept.
Corporate Solutions Dept., Asia*3
Information Control Dept., Americas DivisionPlanning Dept., Americas Division
Credit Dept., Americas DivisionRisk Management Dept., Americas Division
Planning Dept., Europe, Middle East and Africa Division
Credit Dept., Europe, Middle East and Africa Division
Risk Management Dept., Middle East and Africa Division
Compliance Dept., Americas Division
Planning Dept., Treasury Unit
Treasury Dept.International Treasury Dept.Trading Dept.Treasury Marketing Dept.Financial Products Dept.
Securities Direct Sales Dept.Treasury Dept., Asia Paci�c Division
Global Markets Engineering Dept.Global Credit Investment Dept.
Planning Dept., Financial Solutions Unit
Shipping Finance Dept.Structured Finance Dept.
Investment Banking Services Dept.Debt Finance Dept.
Trust Business Operations Dept.Trust Services Dept.
Real Estate Finance Dept.*1
Merchant Banking Dept.
Investment Banking Dept., AsiaCorporate Solutions Dept., Asia *3
Distribution Dept.Growth Industry Cluster Dept.*2
Branch Service Of�ceHead/Main Service Of�cePublic Institutions Operations Of�ceSouzoku-of�ce Sub-BranchOperations Service Of�ce
*1 Belongs to both Financial Solutions Unit and Wholesale Banking Unit.*2 Belongs to both Financial Solutions Unit and Wholesale Banking Unit (Corporate Advisory Division).*3 Belongs to both International Banking Unit and Financial Solutions Unit*4 • Corporate Advisory Division
• Advisory Dept. I• Advisory Dept. II• Advisory Dept. III• Corporate Research Dept.• Growth Industry Cluster Dept.*2
*5 • Private Advisory Division• Private Advisory Business Dept.
• Testamentary Trust Dept.• Private Banking Planning Dept.
• Corporate Employees Solution Dept.• De�ned Contribution Dept.
*6 • Transaction Business Division• Transaction Business Planning Dept.• Transaction Products Development Dept.• Asset Finance Dept.• Transaction Banking Dept.• Global Transaction Banking Dept.• Global Advisory Dept.• Global Business Promotion Dept.• Global Transaction Support Dept.
• Foreign Exchange Insourcing Business Dept.*7 • Belongs to Retail Banking Unit, Wholesale Banking Unit and International Banking Unit.*8 • Belongs to both Retail Banking Unit and Wholesale Banking Unit.
Planning Dept., Wholesale Banking Unit
Corporate Banking Dept.
Private Banking Dept.*8
Middle Market Banking DivisionCorporate Banking Division
Global Corporate Banking Division
Retail Facilitating Financing Dept.
Loan Business Dept.
Legal and Compliance Dept., Europe, Middle East and Africa Division
Asset Finance Credit Dept.
Legal and Compliance Dept., Asia Pacific Division
Credit Dept., International Banking UnitEnvironment Analysis Dept., International Banking Unit
Asia Pacific Training Dept.
*4
*5
*6
1032017 Annual Report
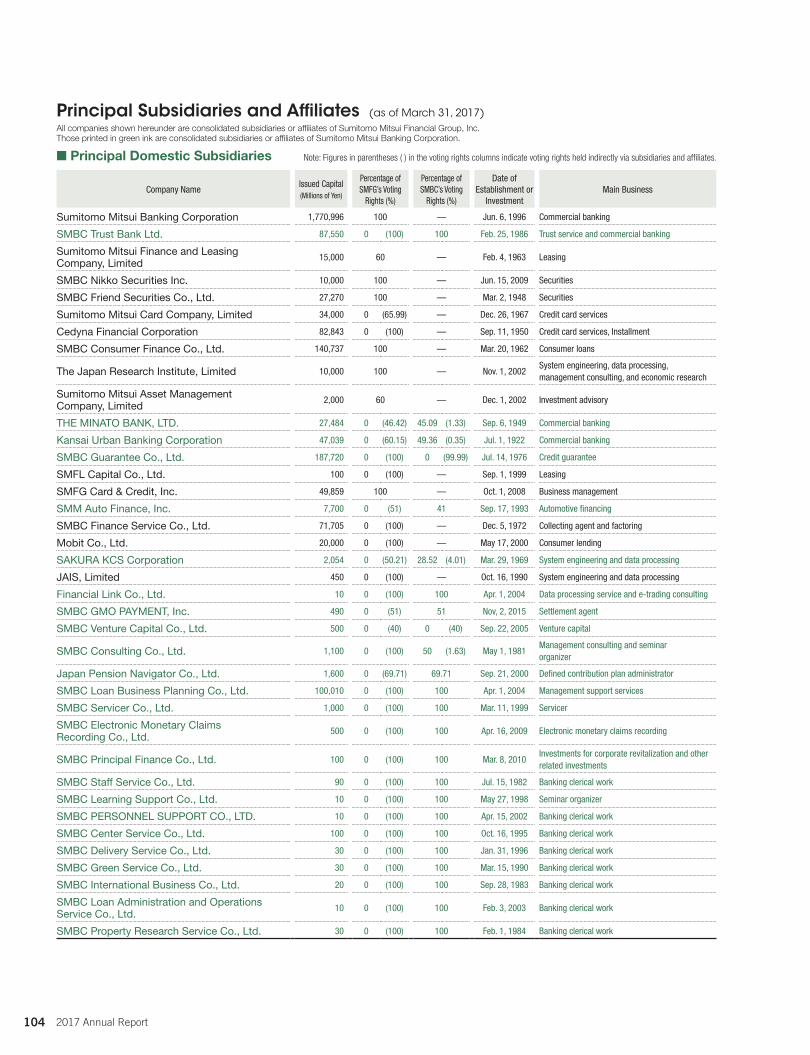
■ Principal Domestic Subsidiaries Note: Figures in parentheses ( ) in the voting rights columns indicate voting rights held indirectly via subsidiaries and affiliates.
Company NameIssued Capital(Millions of Yen)
Percentage ofSMFG’s Voting
Rights (%)
Percentage ofSMBC’s Voting
Rights (%)
Date of Establishment or
InvestmentMain Business
Sumitomo Mitsui Banking Corporation 1,770,996 100 — Jun. 6, 1996 Commercial banking
SMBC Trust Bank Ltd. 87,550 0 (100) 100 Feb. 25, 1986 Trust service and commercial banking
Sumitomo Mitsui Finance and Leasing Company, Limited
15,000 60 — Feb. 4, 1963 Leasing
SMBC Nikko Securities Inc. 10,000 100 — Jun. 15, 2009 Securities
SMBC Friend Securities Co., Ltd. 27,270 100 — Mar. 2, 1948 Securities
Sumitomo Mitsui Card Company, Limited 34,000 0 (65.99) — Dec. 26, 1967 Credit card services
Cedyna Financial Corporation 82,843 0 (100) — Sep. 11, 1950 Credit card services, Installment
SMBC Consumer Finance Co., Ltd. 140,737 100 — Mar. 20, 1962 Consumer loans
The Japan Research Institute, Limited 10,000 100 — Nov. 1, 2002System engineering, data processing, management consulting, and economic research
Sumitomo Mitsui Asset Management Company, Limited
2,000 60 — Dec. 1, 2002 Investment advisory
THE MINATO BANK, LTD. 27,484 0 (46.42) 45.09 (1.33) Sep. 6, 1949 Commercial banking
Kansai Urban Banking Corporation 47,039 0 (60.15) 49.36 (0.35) Jul. 1, 1922 Commercial banking
SMBC Guarantee Co., Ltd. 187,720 0 (100) 0 (99.99) Jul. 14, 1976 Credit guarantee
SMFL Capital Co., Ltd. 100 0 (100) — Sep. 1, 1999 Leasing
SMFG Card & Credit, Inc. 49,859 100 — Oct. 1, 2008 Business management
SMM Auto Finance, Inc. 7,700 0 (51) 41 Sep. 17, 1993 Automotive financing
SMBC Finance Service Co., Ltd. 71,705 0 (100) — Dec. 5, 1972 Collecting agent and factoring
Mobit Co., Ltd. 20,000 0 (100) — May 17, 2000 Consumer lending
SAKURA KCS Corporation 2,054 0 (50.21) 28.52 (4.01) Mar. 29, 1969 System engineering and data processing
JAIS, Limited 450 0 (100) — Oct. 16, 1990 System engineering and data processing
Financial Link Co., Ltd. 10 0 (100) 100 Apr. 1, 2004 Data processing service and e-trading consulting
SMBC GMO PAYMENT, Inc. 490 0 (51) 51 Nov, 2, 2015 Settlement agent
SMBC Venture Capital Co., Ltd. 500 0 (40) 0 (40) Sep. 22, 2005 Venture capital
SMBC Consulting Co., Ltd. 1,100 0 (100) 50 (1.63) May 1, 1981Management consulting and seminar organizer
Japan Pension Navigator Co., Ltd. 1,600 0 (69.71) 69.71 Sep. 21, 2000 Defined contribution plan administrator
SMBC Loan Business Planning Co., Ltd. 100,010 0 (100) 100 Apr. 1, 2004 Management support services
SMBC Servicer Co., Ltd. 1,000 0 (100) 100 Mar. 11, 1999 Servicer
SMBC Electronic Monetary Claims Recording Co., Ltd.
500 0 (100) 100 Apr. 16, 2009 Electronic monetary claims recording
SMBC Principal Finance Co., Ltd. 100 0 (100) 100 Mar. 8, 2010Investments for corporate revitalization and other related investments
SMBC Staff Service Co., Ltd. 90 0 (100) 100 Jul. 15, 1982 Banking clerical work
SMBC Learning Support Co., Ltd. 10 0 (100) 100 May 27, 1998 Seminar organizer
SMBC PERSONNEL SUPPORT CO., LTD. 10 0 (100) 100 Apr. 15, 2002 Banking clerical work
SMBC Center Service Co., Ltd. 100 0 (100) 100 Oct. 16, 1995 Banking clerical work
SMBC Delivery Service Co., Ltd. 30 0 (100) 100 Jan. 31, 1996 Banking clerical work
SMBC Green Service Co., Ltd. 30 0 (100) 100 Mar. 15, 1990 Banking clerical work
SMBC International Business Co., Ltd. 20 0 (100) 100 Sep. 28, 1983 Banking clerical work
SMBC Loan Administration and Operations Service Co., Ltd.
10 0 (100) 100 Feb. 3, 2003 Banking clerical work
SMBC Property Research Service Co., Ltd. 30 0 (100) 100 Feb. 1, 1984 Banking clerical work
Principal Subsidiaries and Affiliates (as of March 31, 2017)All companies shown hereunder are consolidated subsidiaries or affiliates of Sumitomo Mitsui Financial Group, Inc.Those printed in green ink are consolidated subsidiaries or affiliates of Sumitomo Mitsui Banking Corporation.
104 2017 Annual Report

■ Principal Overseas Subsidiaries
Company Name Country Issued CapitalPercentage ofSMFG’s Voting
Rights (%)
Percentage ofSMBC’s Voting
Rights (%)
Date of Establishment or
InvestmentMain Business
Sumitomo Mitsui Banking Corporation Europe Limited
U.K. US$3,200 million 0 (100) 100 Mar. 5, 2003 Commercial banking
Sumitomo Mitsui Banking Corporation (China) Limited
China CNY10.0 billion 0 (100) 100 Apr. 27, 2009 Commercial banking
Manufacturers Bank U.S.A. US$80.786 million 0 (100) 100 Jun. 26, 1962 Commercial banking
Banco Sumitomo Mitsui Brasileiro S.A.
Brazil R$758.819 million 0 (100) 100 Oct. 6, 1958 Commercial banking
JSC Sumitomo Mitsui Rus Bank Russia RUB6.4 billion 0 (100) 99 (1) May 8, 2009 Commercial banking
PT Bank Sumitomo Mitsui Indonesia Indonesia Rp2,873.9 billion 0 (98.47) 98.47 Aug. 22, 1989 Commercial banking
Sumitomo Mitsui Banking Corporation Malaysia Berhad
Malaysia MYR1,575 million 0 (100) 100 Dec. 22, 2010 Commercial banking
SMBC Leasing and Finance, Inc. U.S.A. US$4,350 0 (100) 96.19 (3.81) Nov. 9, 1990 Leasing, investments
SMBC Aviation Capital Limited Ireland US$187 million 0 (90) 30 Aug. 14, 1997 Leasing
SMBC Rail Services LLC U.S.A. US$40.911 million 0 (100) 0 (100) May 11, 2011 Leasing
SMBC Nikko Securities America, Inc. U.S.A. US$388 0 (100) 77.65 (2.35) Aug. 8, 1990 Securities, investments
SMBC Nikko Capital Markets Limited U.K. US$1,139 million 0 (100) 84.84 Mar. 13, 1990Derivatives and investments, securities services
SMBC Capital Markets, Inc. U.S.A. US$100 0 (100) 90 (10) Dec. 4, 1986 Derivatives and investments
SMBC Financial Services, Inc. U.S.A. US$300 0 (100) 100 Aug. 8, 1990Investments, investment advisor
SMBC Cayman LC Limited* Cayman Islands US$500 0 (100) 100 Feb. 7, 2003Credit guarantee, bond investment
SMBC MVI SPC Cayman Islands US$195 million 0 (100) 100 Sep. 9, 2004 Loans, buying/ selling of monetary claims
SMBC DIP Limited Cayman Islands US$8 million 0 (100) 100 Mar. 16, 2005 Loans, buying/ selling of monetary claims
SFVI Limited British Virgin Islands US$4,800 0 (100) 100 Jul. 30, 1997 Investments
SMBC, S.A.P.I. DE C.V., SOFOM, E.N.R.
Mexico MXN910 million 0 (100) 100 Sep. 18, 2014 Money lending business
SMBC International Finance N.V. Curaçao US$200,000 0 (100) 100 Jun. 25, 1990 Finance
SMFG Preferred Capital USD 1 Limited Cayman Islands US$350,000 100 — Nov. 28, 2006 Finance
SMFG Preferred Capital GBP 1 Limited Cayman Islands £100,000 100 — Nov. 28, 2006 Finance
SMFG Preferred Capital JPY 1 Limited Cayman Islands ¥135,000 million 100 — Jan. 11, 2008 Finance
SMFG Preferred Capital USD 3 Limited Cayman Islands US$1,350 million 100 — Jul. 8, 2008 Finance
SMFG Preferred Capital GBP 2 Limited Cayman Islands £250 million 100 — Oct. 25, 2007 Finance
SMFG Preferred Capital JPY 2 Limited Cayman Islands ¥286,000 million 100 — Nov. 3, 2008 Finance
SMFG Preferred Capital JPY 3 Limited Cayman Islands ¥268,400 million 100 — Aug. 12, 2009 Finance
SMBC Preferred Capital USD 1 Limited Cayman Islands US$13.506 million 0 (100) 100 Nov. 28, 2006 Finance
SMBC Preferred Capital GBP 1 Limited Cayman Islands £4.545 million 0 (100) 100 Nov. 28, 2006 Finance
SMBC Preferred Capital JPY 1 Limited Cayman Islands ¥137,000 million 0 (100) 100 Jan. 11, 2008 Finance
* SMBC Cayman LC Limited, like other subsidiaries of SMBC, is a separate corporate entity with its own separate creditors and the claims of such creditors are prior to the claims of SMBC, as the direct or indirect holder of the equity in such subsidiary.
1052017 Annual Report
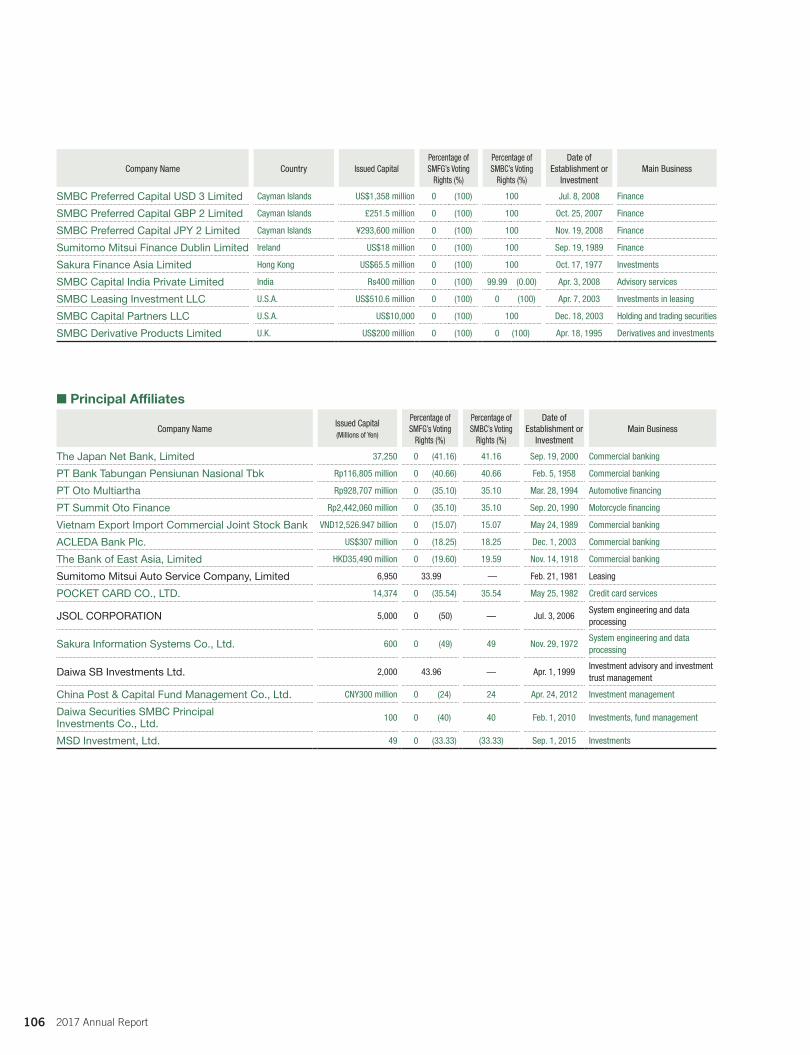
■ Principal Affiliates
Company Name Country Issued CapitalPercentage ofSMFG’s Voting
Rights (%)
Percentage ofSMBC’s Voting
Rights (%)
Date of Establishment or
InvestmentMain Business
SMBC Preferred Capital USD 3 Limited Cayman Islands US$1,358 million 0 (100) 100 Jul. 8, 2008 Finance
SMBC Preferred Capital GBP 2 Limited Cayman Islands £251.5 million 0 (100) 100 Oct. 25, 2007 Finance
SMBC Preferred Capital JPY 2 Limited Cayman Islands ¥293,600 million 0 (100) 100 Nov. 19, 2008 Finance
Sumitomo Mitsui Finance Dublin Limited Ireland US$18 million 0 (100) 100 Sep. 19, 1989 Finance
Sakura Finance Asia Limited Hong Kong US$65.5 million 0 (100) 100 Oct. 17, 1977 Investments
SMBC Capital India Private Limited India Rs400 million 0 (100) 99.99 (0.00) Apr. 3, 2008 Advisory services
SMBC Leasing Investment LLC U.S.A. US$510.6 million 0 (100) 0 (100) Apr. 7, 2003 Investments in leasing
SMBC Capital Partners LLC U.S.A. US$10,000 0 (100) 100 Dec. 18, 2003 Holding and trading securities
SMBC Derivative Products Limited U.K. US$200 million 0 (100) 0 (100) Apr. 18, 1995 Derivatives and investments
Company NameIssued Capital(Millions of Yen)
Percentage ofSMFG’s Voting
Rights (%)
Percentage ofSMBC’s Voting
Rights (%)
Date of Establishment or
InvestmentMain Business
The Japan Net Bank, Limited 37,250 0 (41.16) 41.16 Sep. 19, 2000 Commercial banking
PT Bank Tabungan Pensiunan Nasional Tbk Rp116,805 million 0 (40.66) 40.66 Feb. 5, 1958 Commercial banking
PT Oto Multiartha Rp928,707 million 0 (35.10) 35.10 Mar. 28, 1994 Automotive financing
PT Summit Oto Finance Rp2,442,060 million 0 (35.10) 35.10 Sep. 20, 1990 Motorcycle financing
Vietnam Export Import Commercial Joint Stock Bank VND12,526.947 billion 0 (15.07) 15.07 May 24, 1989 Commercial banking
ACLEDA Bank Plc. US$307 million 0 (18.25) 18.25 Dec. 1, 2003 Commercial banking
The Bank of East Asia, Limited HKD35,490 million 0 (19.60) 19.59 Nov. 14, 1918 Commercial banking
Sumitomo Mitsui Auto Service Company, Limited 6,950 33.99 — Feb. 21, 1981 Leasing
POCKET CARD CO., LTD. 14,374 0 (35.54) 35.54 May 25, 1982 Credit card services
JSOL CORPORATION 5,000 0 (50) — Jul. 3, 2006System engineering and data processing
Sakura Information Systems Co., Ltd. 600 0 (49) 49 Nov. 29, 1972System engineering and data processing
Daiwa SB Investments Ltd. 2,000 43.96 — Apr. 1, 1999Investment advisory and investment trust management
China Post & Capital Fund Management Co., Ltd. CNY300 million 0 (24) 24 Apr. 24, 2012 Investment management
Daiwa Securities SMBC Principal Investments Co., Ltd.
100 0 (40) 40 Feb. 1, 2010 Investments, fund management
MSD Investment, Ltd. 49 0 (33.33) (33.33) Sep. 1, 2015 Investments
106 2017 Annual Report

Asia and Oceania
SMBC Branches and Representative Offices
Hong Kong Branch7th & 8th Floor, One InternationalFinance Centre, 1 Harbour View Street, Central, Hong KongSpecial Administrative Region,The People’s Republic of ChinaTel: 852-2206-2000
Taipei Branch3F, Walsin Lihwa Xinyi Building,No. 1 Songzhi Road, Xinyi District,Taipei 11047, TaiwanTel: 886 (2) 2720-8100
Seoul Branch12F, Mirae Asset CENTER1 Bldg. West Tower, 26, Eulji-ro 5-gil, Jung-gu Seoul, 04539, The Republic of KoreaTel: 82 (2) 6364-7000
Singapore Branch3 Temasek Avenue #06-01,Centennial Tower, Singapore039190, Republic of SingaporeTel: 65-6882-0001
Sydney BranchLevel 35, The Chifley Tower,2 Chifley Square, Sydney, NSW 2000, AustraliaTel: 61 (2) 9376-1800
Perth BranchLevel 19, Exchange Tower, 2 The Esplanade, Perth, Western Australia 6000, AustraliaTel: 61 (8) 9492-4900
New Delhi Branch13th Floor, Hindustan Times House, 18-20, Kasturba Gandhi Marg, New Delhi 110001, IndiaTel: 91 (11) 4768-9111
Mumbai BranchUnit No. 601, 6th Floor, Platina Building, Plot No. C-59, G Block, Bandra Kurla Complex, Bandra (East), Mumbai 400051, Maharashtra, IndiaTel: 91 (22) 6229-5000
Bangkok Branch8th-10th Floor, Q.House LumpiniBuilding, 1 South Sathorn Road,Tungmahamek, Sathorn, Bangkok 10120, ThailandTel: 66 (2) 353-8000
Chonburi BranchHarbor Office 14th Floor, 4/222 Moo. 10 Sukhumvit Road, Tungsukla, Sriracha, Chonburi 20230, ThailandTel: 66 (38) 400-700
Ho Chi Minh City Branch15th Floor, Times Square Building, 22-36 Nguyen Hue Street, District 1, Ho Chi Minh City, VietnamTel: 84 (28) 3520-2525
Hanoi BranchUnit 1201, 12th Floor, Lotte Center Hanoi, 54 Lieu Giai Street, Cong Vi Ward, Ba Dinh District, Hanoi, VietnamTel: 84 (24) 3946-1100
Manila Branch21st Floor, Tower One & Exchange Plaza, Ayala Triangle, Ayala Avenue, Makati City, The Philippines 1226Tel: 63 (2) 8807100
Yangon BranchLevel #5 Strand Square, No.53 Strand Road, Pabedan Township, Yangon, MyanmarTel: 95 (1) 2307380
Yangon Branch Thilawa Front OfficeRoom No. 103, Administration Building, Corner of Thilawa Development Road and Dagon - Thilawa Road, Thilawa SEZ, Thanlyin Township, Yangon, MyanmarTel: 95 (1) 2309100
Labuan BranchLevel 12 (B&C), Main Office Tower, Financial Park Labuan,Jalan Merdeka, 87000 Labuan,Federal Territory, MalaysiaTel: 60 (87) 410955
Labuan Branch Kuala Lumpur OfficeSuite 22-03, Level 22, Integra Tower,The Intermark, 348, Jalan Tun Razak,50400 Kuala Lumpur, MalaysiaTel: 60 (3) 2176-1700
Ulaanbaatar Representative OfficeUnit 1011, 10F, Central Tower, 2 Chinggis Square, 8th Khoroo, Sukhbaatar District, Ulaanbaatar, 14200, MongoliaTel: 976-7011-8950
Phnom Penh Representative OfficePhnom Penh Tower (13 Floor) No.445, Preah Monivong Blvd corner with Street 232, Sangkat Boeung Pralit, Khan 7 Makara, Phnom Penh, CambodiaTel: 855 (23) 964-080
SMBC Principal Subsidiaries/ Affiliates SMFG Network
Sumitomo Mitsui Banking Corporation (China) Limited Head Office (Shanghai)11F, Shanghai World Financial Center, 100 Century Avenue, Pudong New Area, Shanghai 200120, The People’s Republic of ChinaTel: 86 (21) 3860-9000
Sumitomo Mitsui Banking Corporation (China) Limited Guangzhou Branch12F, International Finance Place,No.8 Huaxia Road, Tianhe District,Guangzhou 510623, The People’s Republic of ChinaTel: 86 (20) 3819-1888
Sumitomo Mitsui Banking Corporation (China) Limited Hangzhou Branch5F, Offices At Kerry Centre, 385 Yan An Road, Xia Cheng District,Hangzhou, Zhejiang Province, The People’s Republic of ChinaTel: 86 (571) 2889-1111
Sumitomo Mitsui Banking Corporation (China) Limited Chongqing BranchUnit 2, 34F, Tower1, River International, 22 Nanbin Road, Nan’an District, Chongqing 400060, The People’s Republic of ChinaTel: 86 (23) 8812-5300
Sumitomo Mitsui Banking Corporation (China) Limited Shenzhen Branch23/F, Tower Two, Kerry Plaza, 1 Zhongxinsi Road, Futian District, Shenzhen 518048, The People’s Republic of ChinaTel: 86 (755) 2383-0980
Sumitomo Mitsui Banking Corporation (China) Limited Shenyang Branch1606, 1 Building, Forum 66, No.1 Qingnian Street, Shenhe District, Shenyang, Liaoning Province, The People’s Republic of ChinaTel: 86 (24) 3128-7000
Sumitomo Mitsui Banking Corporation (China) Limited Suzhou Branch12F, SND International Commerce Tower, No.28 Shishan Road, Suzhou New District, Suzhou, Jiangsu 215011, The People’s Republic of ChinaTel: 86 (512) 6606-6500
International Directory (as of June 30, 2017)
1072017 Annual Report

Sumitomo Mitsui Banking Corporation (China) Limited Dalian BranchSenmao Building 4F-A, 147 Zhongshan Road, Xigang District, Dalian, The People’s Republic of ChinaTel: 86 (411) 3905-8500
Sumitomo Mitsui Banking Corporation (China) Limited Tianjin Branch12F, The Exchange Tower 2, 189 Nanjing Road, Heping District,Tianjin 300051, The People’s Republic of ChinaTel: 86 (22) 2330-6677
Sumitomo Mitsui Banking Corporation (China) Limited Beijing BranchUnit1601,16F, North Tower,Beijing Kerry Centre, No.1, GuangHua Road, Chao Yang District,Beijing 100020, The People’s Republic of ChinaTel: 86 (10) 5920-4500
Sumitomo Mitsui Banking Corporation (China) Limited Kunshan Sub-BranchRoom 2001-2005, Taiwan Business Association International Plaza, No. 399 Qianjin East Road, Kunshan, Jiangsu 215300, The People’s Republic of ChinaTel: 86 (512) 3687-0588
Sumitomo Mitsui Banking Corporation (China) Limited Shanghai Pilot Free Trade Zone Sub-Branch1F 7, 8 Building, No. 88, Ma Ji Road, China (Shanghai) Pilot Free Trade Zone, Shanghai 200131, The People’s Republic of ChinaTel: 86 (21) 2067-0200
Sumitomo Mitsui Banking Corporation (China) Limited Shanghai Puxi Sub-Branch1, 12, 13, 12F, Maxdo Center, 8 Xingyi Road, Changning District, Shanghai, The People’s Republic of ChinaTel: 86 (21) 2219-8000
Sumitomo Mitsui Banking Corporation (China) Limited Changshu Sub-Branch8F, Science Innovation Building (Kechuang Building), No.333 Dongnan Road, Changshu Southeast Economic Development Zone of Jiangsu, Changshu, Jiangsu, The People’s Republic of ChinaTel: 86 (512) 5235-5553
Sumitomo Mitsui Banking Corporation (China) Limited Suzhou Industrial Park Sub-Branch16F, International Building, No.2,Suzhou Avenue West, Suzhou Industrial Park, Jiangsu 215021,The People’s Republic of ChinaTel: 86 (512) 6288-5018
Sumitomo Mitsui Banking Corporation (China) Limited Tianjin Binhai Sub-Branch8F, E2B, Binhai Financial Street,No.20, Guangchang East Road,TEDA, Tianjin 300457, The People’s Republic of ChinaTel: 86 (22) 6622-6677
PT Bank Sumitomo Mitsui IndonesiaMenara BTPN, 35th-37th Floor, Jl. Dr. Ide Anak Agung Gde Agung Kav. 5.5-5.6, Jakarta 12950, IndonesiaTel: 62 (21) 8086-2500
Sumitomo Mitsui Banking Corporation Malaysia BerhadSuite 22-03, Level 22, Integra Tower,The Intermark, 348, Jalan Tun Razak,50400 Kuala Lumpur, MalaysiaTel: 60 (3) 2176-1500
SMBC Capital Markets (Asia) Limited7th Floor, One International Finance Centre, 1 Harbour View Street, Central, Hong KongSpecial Administrative Region,The People’s Republic of ChinaTel: 852-2532-8500
SMBC Nikko Capital Markets Limited (Sydney Office)Level 35, The Chifley Tower, 2 Chifley Square, Sydney, NSW 2000, AustraliaTel: 61 (2) 9376-1895
SBCS Co., Limited16th Floor, Q.House LumpiniBuilding, 1 South Sathorn Road,Tungmahamek, Sathorn,Bangkok 10120, ThailandTel: 66 (2) 677-7270~5
PT. SBCS IndonesiaSummitmas II, 19th Floor, Jl. Jend. Sudirman Kav. 61-62, Jakarta 12190, IndonesiaTel: 62 (21) 252-3711
BSL Leasing Co., Ltd.19th Floor, Sathorn City Tower,175 South Sathorn Road, Thungmahamek, Sathorn,Bangkok, 10120, ThailandTel: 66 (2) 670-4700
SMBC SSC Sdn. Bhd.Level 21, Integra Tower, The Intermark, 348, Jalan Tun Razak, 50400 Kuala Lumpur, MalaysiaTel: 60 (3) 2176-1600
SMBC Metro Investment Corporation6th Floor, Unit 600, Rufino Building, 6784 Ayala Avenue cor. V. A. Rufino Street, Legaspi Village, Makati City, The PhilippinesTel: 63 (2) 811-0845
The Bank of East Asia, Limited10 Des Voeux Road, Central, Hong KongTel: 852-3608-3608
Vietnam Export Import Commercial Joint Stock Bank8th Floor, Vincom Center Building, 72 Le Thanh Ton Street, Ben Nghe Ward, District 1, Ho Chi Minh City, VietnamTel: 84 (28) 3821-0056
PT Bank Tabungan Pensiunan Nasional TbkMenara BTPN, CBD Mega Kuningan Jl. Dr. Ide Anak Agung Gde Agung, Kav 5.5-5.6 Jakarta 12950, IndonesiaTel: 62 (21) 300-26200
PT Oto MultiarthaSummitmas II, 18th floor, Jl. Jend. Sudirman Kav. 61-62, Jakarta 12190, IndonesiaTel: 62 (21) 522-6410
PT Summit Oto FinanceSummitmas II, 8th floor, Jl. Jend. Sudirman Kav. 61-62, Jakarta 12190, IndonesiaTel: 62 (21) 252-2788
ACLEDA Bank Plc.#61, Preah Monivong Blvd., Sangkat Srah Chork, Khan Daun Penh, Phnom Penh, Kingdom of CambodiaTel: 855 (23) 998-777
The Japan Research Institute (Shanghai) Solution Co., Ltd.Unit 141, 18F, Hang Seng Bank Tower, 1000 Lujiazui Ring Road,Pudong New Area, Shanghai, 200120, The People’s Republic of ChinaTel: 86 (21) 6841-2788
108 2017 Annual Report
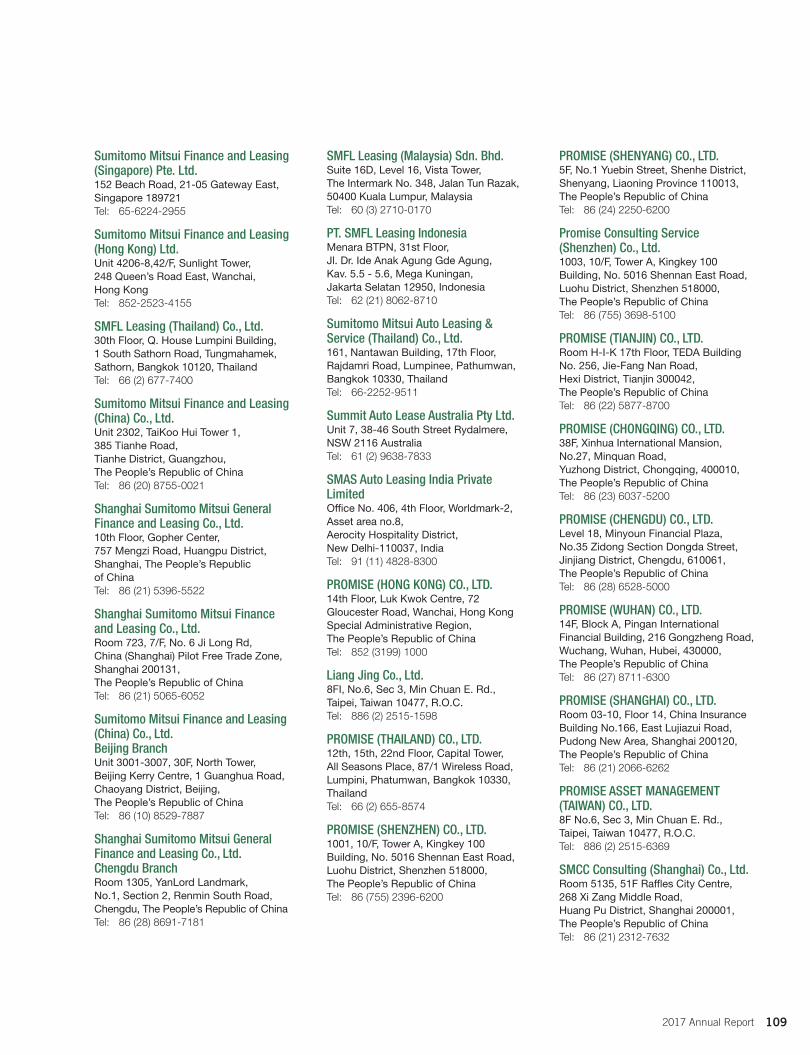
Sumitomo Mitsui Finance and Leasing (Singapore) Pte. Ltd.152 Beach Road, 21-05 Gateway East, Singapore 189721Tel: 65-6224-2955
Sumitomo Mitsui Finance and Leasing (Hong Kong) Ltd.Unit 4206-8,42/F, Sunlight Tower, 248 Queen’s Road East, Wanchai, Hong KongTel: 852-2523-4155
SMFL Leasing (Thailand) Co., Ltd.30th Floor, Q. House Lumpini Building, 1 South Sathorn Road, Tungmahamek, Sathorn, Bangkok 10120, ThailandTel: 66 (2) 677-7400
Sumitomo Mitsui Finance and Leasing (China) Co., Ltd.Unit 2302, TaiKoo Hui Tower 1, 385 Tianhe Road, Tianhe District, Guangzhou, The People’s Republic of ChinaTel: 86 (20) 8755-0021
Shanghai Sumitomo Mitsui General Finance and Leasing Co., Ltd.10th Floor, Gopher Center, 757 Mengzi Road, Huangpu District, Shanghai, The People’s Republic of ChinaTel: 86 (21) 5396-5522
Shanghai Sumitomo Mitsui Finance and Leasing Co., Ltd.Room 723, 7/F, No. 6 Ji Long Rd, China (Shanghai) Pilot Free Trade Zone, Shanghai 200131, The People’s Republic of ChinaTel: 86 (21) 5065-6052
Sumitomo Mitsui Finance and Leasing (China) Co., Ltd. Beijing BranchUnit 3001-3007, 30F, North Tower, Beijing Kerry Centre, 1 Guanghua Road, Chaoyang District, Beijing, The People’s Republic of ChinaTel: 86 (10) 8529-7887
Shanghai Sumitomo Mitsui General Finance and Leasing Co., Ltd. Chengdu BranchRoom 1305, YanLord Landmark, No.1, Section 2, Renmin South Road, Chengdu, The People’s Republic of ChinaTel: 86 (28) 8691-7181
SMFL Leasing (Malaysia) Sdn. Bhd.Suite 16D, Level 16, Vista Tower, The Intermark No. 348, Jalan Tun Razak, 50400 Kuala Lumpur, MalaysiaTel: 60 (3) 2710-0170
PT. SMFL Leasing IndonesiaMenara BTPN, 31st Floor, Jl. Dr. Ide Anak Agung Gde Agung, Kav. 5.5 - 5.6, Mega Kuningan, Jakarta Selatan 12950, IndonesiaTel: 62 (21) 8062-8710
Sumitomo Mitsui Auto Leasing & Service (Thailand) Co., Ltd.161, Nantawan Building, 17th Floor,Rajdamri Road, Lumpinee, Pathumwan, Bangkok 10330, ThailandTel: 66-2252-9511
Summit Auto Lease Australia Pty Ltd.Unit 7, 38-46 South Street Rydalmere, NSW 2116 AustraliaTel: 61 (2) 9638-7833
SMAS Auto Leasing India Private LimitedOffice No. 406, 4th Floor, Worldmark-2, Asset area no.8,Aerocity Hospitality District, New Delhi-110037, IndiaTel: 91 (11) 4828-8300
PROMISE (HONG KONG) CO., LTD.14th Floor, Luk Kwok Centre, 72 Gloucester Road, Wanchai, Hong Kong Special Administrative Region, The People’s Republic of ChinaTel: 852 (3199) 1000
Liang Jing Co., Ltd.8FI, No.6, Sec 3, Min Chuan E. Rd., Taipei, Taiwan 10477, R.O.C.Tel: 886 (2) 2515-1598
PROMISE (THAILAND) CO., LTD.12th, 15th, 22nd Floor, Capital Tower, All Seasons Place, 87/1 Wireless Road, Lumpini, Phatumwan, Bangkok 10330, ThailandTel: 66 (2) 655-8574
PROMISE (SHENZHEN) CO., LTD.1001, 10/F, Tower A, Kingkey 100 Building, No. 5016 Shennan East Road, Luohu District, Shenzhen 518000, The People’s Republic of ChinaTel: 86 (755) 2396-6200
PROMISE (SHENYANG) CO., LTD.5F, No.1 Yuebin Street, Shenhe District, Shenyang, Liaoning Province 110013, The People’s Republic of ChinaTel: 86 (24) 2250-6200
Promise Consulting Service (Shenzhen) Co., Ltd.1003, 10/F, Tower A, Kingkey 100 Building, No. 5016 Shennan East Road, Luohu District, Shenzhen 518000, The People’s Republic of ChinaTel: 86 (755) 3698-5100
PROMISE (TIANJIN) CO., LTD.Room H-I-K 17th Floor, TEDA Building No. 256, Jie-Fang Nan Road, Hexi District, Tianjin 300042, The People’s Republic of ChinaTel: 86 (22) 5877-8700
PROMISE (CHONGQING) CO., LTD.38F, Xinhua International Mansion, No.27, Minquan Road, Yuzhong District, Chongqing, 400010, The People’s Republic of ChinaTel: 86 (23) 6037-5200
PROMISE (CHENGDU) CO., LTD.Level 18, Minyoun Financial Plaza, No.35 Zidong Section Dongda Street, Jinjiang District, Chengdu, 610061, The People’s Republic of ChinaTel: 86 (28) 6528-5000
PROMISE (WUHAN) CO., LTD.14F, Block A, Pingan International Financial Building, 216 Gongzheng Road, Wuchang, Wuhan, Hubei, 430000, The People’s Republic of ChinaTel: 86 (27) 8711-6300
PROMISE (SHANGHAI) CO., LTD.Room 03-10, Floor 14, China Insurance Building No.166, East Lujiazui Road, Pudong New Area, Shanghai 200120, The People’s Republic of ChinaTel: 86 (21) 2066-6262
PROMISE ASSET MANAGEMENT (TAIWAN) CO., LTD.8F No.6, Sec 3, Min Chuan E. Rd., Taipei, Taiwan 10477, R.O.C.Tel: 886 (2) 2515-6369
SMCC Consulting (Shanghai) Co., Ltd.Room 5135, 51F Raffles City Centre, 268 Xi Zang Middle Road, Huang Pu District, Shanghai 200001, The People’s Republic of ChinaTel: 86 (21) 2312-7632
1092017 Annual Report
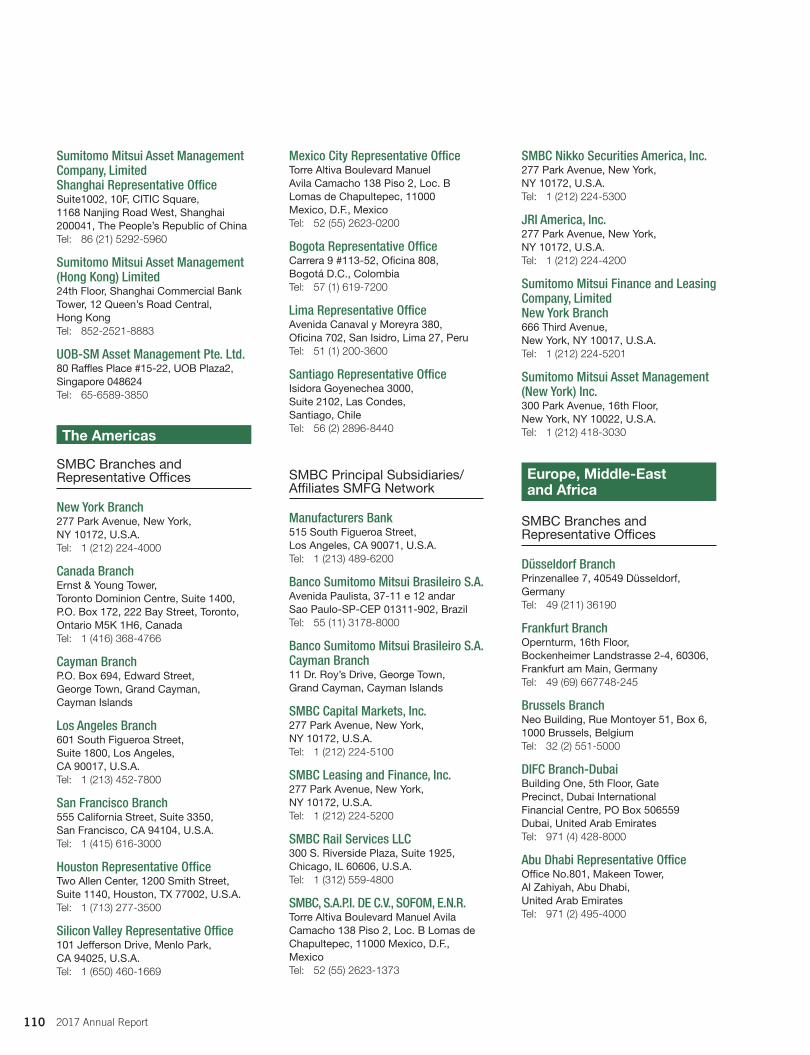
Sumitomo Mitsui Asset Management Company, Limited Shanghai Representative OfficeSuite1002, 10F, CITIC Square, 1168 Nanjing Road West, Shanghai 200041, The People’s Republic of ChinaTel: 86 (21) 5292-5960
Sumitomo Mitsui Asset Management (Hong Kong) Limited24th Floor, Shanghai Commercial Bank Tower, 12 Queen’s Road Central, Hong KongTel: 852-2521-8883
UOB-SM Asset Management Pte. Ltd.80 Raffles Place #15-22, UOB Plaza2, Singapore 048624Tel: 65-6589-3850
The Americas
SMBC Branches and Representative Offices
New York Branch277 Park Avenue, New York,NY 10172, U.S.A.Tel: 1 (212) 224-4000
Canada BranchErnst & Young Tower, Toronto Dominion Centre, Suite 1400, P.O. Box 172, 222 Bay Street, Toronto, Ontario M5K 1H6, CanadaTel: 1 (416) 368-4766
Cayman BranchP.O. Box 694, Edward Street,George Town, Grand Cayman,Cayman Islands
Los Angeles Branch601 South Figueroa Street,Suite 1800, Los Angeles,CA 90017, U.S.A.Tel: 1 (213) 452-7800
San Francisco Branch555 California Street, Suite 3350,San Francisco, CA 94104, U.S.A.Tel: 1 (415) 616-3000
Houston Representative OfficeTwo Allen Center, 1200 Smith Street, Suite 1140, Houston, TX 77002, U.S.A.Tel: 1 (713) 277-3500
Silicon Valley Representative Office101 Jefferson Drive, Menlo Park, CA 94025, U.S.A.Tel: 1 (650) 460-1669
Mexico City Representative OfficeTorre Altiva Boulevard ManuelAvila Camacho 138 Piso 2, Loc. BLomas de Chapultepec, 11000Mexico, D.F., MexicoTel: 52 (55) 2623-0200
Bogota Representative OfficeCarrera 9 #113-52, Oficina 808, Bogotá D.C., ColombiaTel: 57 (1) 619-7200
Lima Representative OfficeAvenida Canaval y Moreyra 380, Oficina 702, San Isidro, Lima 27, PeruTel: 51 (1) 200-3600
Santiago Representative OfficeIsidora Goyenechea 3000, Suite 2102, Las Condes, Santiago, ChileTel: 56 (2) 2896-8440
SMBC Principal Subsidiaries/ Affiliates SMFG Network
Manufacturers Bank515 South Figueroa Street,Los Angeles, CA 90071, U.S.A.Tel: 1 (213) 489-6200
Banco Sumitomo Mitsui Brasileiro S.A.Avenida Paulista, 37-11 e 12 andar Sao Paulo-SP-CEP 01311-902, BrazilTel: 55 (11) 3178-8000
Banco Sumitomo Mitsui Brasileiro S.A. Cayman Branch11 Dr. Roy’s Drive, George Town, Grand Cayman, Cayman Islands
SMBC Capital Markets, Inc.277 Park Avenue, New York,NY 10172, U.S.A.Tel: 1 (212) 224-5100
SMBC Leasing and Finance, Inc.277 Park Avenue, New York,NY 10172, U.S.A.Tel: 1 (212) 224-5200
SMBC Rail Services LLC300 S. Riverside Plaza, Suite 1925, Chicago, IL 60606, U.S.A.Tel: 1 (312) 559-4800
SMBC, S.A.P.I. DE C.V., SOFOM, E.N.R. Torre Altiva Boulevard Manuel Avila Camacho 138 Piso 2, Loc. B Lomas de Chapultepec, 11000 Mexico, D.F., MexicoTel: 52 (55) 2623-1373
SMBC Nikko Securities America, Inc.277 Park Avenue, New York,NY 10172, U.S.A.Tel: 1 (212) 224-5300
JRI America, Inc.277 Park Avenue, New York,NY 10172, U.S.A.Tel: 1 (212) 224-4200
Sumitomo Mitsui Finance and Leasing Company, Limited New York Branch666 Third Avenue, New York, NY 10017, U.S.A.Tel: 1 (212) 224-5201
Sumitomo Mitsui Asset Management (New York) Inc.300 Park Avenue, 16th Floor, New York, NY 10022, U.S.A.Tel: 1 (212) 418-3030
Europe, Middle-Eastand Africa
SMBC Branches and Representative Offices
Düsseldorf BranchPrinzenallee 7, 40549 Düsseldorf,GermanyTel: 49 (211) 36190
Frankfurt BranchOpernturm, 16th Floor, Bockenheimer Landstrasse 2-4, 60306, Frankfurt am Main, GermanyTel: 49 (69) 667748-245
Brussels BranchNeo Building, Rue Montoyer 51, Box 6, 1000 Brussels, BelgiumTel: 32 (2) 551-5000
DIFC Branch-DubaiBuilding One, 5th Floor, GatePrecinct, Dubai InternationalFinancial Centre, PO Box 506559Dubai, United Arab EmiratesTel: 971 (4) 428-8000
Abu Dhabi Representative OfficeOffice No.801, Makeen Tower, Al Zahiyah, Abu Dhabi, United Arab EmiratesTel: 971 (2) 495-4000
110 2017 Annual Report
Istanbul Representative OfficeMetrocity Is Merkezi, Kirgulu Sokak No:4 Kat:7/A D Blok, Esentepe Mahallesi, Sisli 34394, Istanbul, Republic of TurkeyTel: 90 (212) 371-5900
Doha QFC OfficeOffice 1901, 19th Floor, Qatar Financial Centre Tower,Diplomatic Area-West bay, Doha,Qatar, P.O.Box 23769Tel: 974-4496-7572
Bahrain Representative OfficeNo.406 & 407 (Entrance 3, 4th Floor) Manama Centre,Government Road, Manama,State of BahrainTel: 973-17223211
Johannesburg Representative OfficeBuilding Four, First Floor,Commerce Square,39 Rivonia Road, Sandhurst,Sandton 2196, South AfricaTel: 27 (11) 219-5300
Cairo Representative Office23rd Floor, Nile City Towers, North Tower, 2005C, Cornish El Nile, Ramlet Boulak, Cairo, EgyptTel: 20 (2) 2461-9566
Tehran Representative OfficeFirst Floor, No. 17, Haghani Expressway (north side), Between Modarres & Africa,Tehran 1518858117, IranTel: 98 (21) 8888-4301/4302
SMBC Principal Subsidiaries/ Affiliates SMFG Network
Sumitomo Mitsui Banking Corporation Europe Limited Head Office99 Queen Victoria Street, LondonEC4V 4EH, U.K.Tel: 44 (20) 7786-1000
Sumitomo Mitsui Banking Corporation Europe Limited Amsterdam BranchWorld Trade Center, Tower D, Level 12, Strawinskylaan 1733, 1077 XX Amsterdam, The NetherlandsTel: 31 (20) 718-3888
Sumitomo Mitsui Banking Corporation Europe Limited Dublin BranchIFSC House, IFSC, Dublin 1, IrelandTel: 353 (1) 859-9300
Sumitomo Mitsui Banking Corporation Europe Limited Paris Branch1/3/5 rue Paul Cézanne, 75008, Paris, FranceTel: 33 (1) 44 (90) 48-00
Sumitomo Mitsui Banking Corporation Europe Limited Prague BranchInternational Business Centre, Pobrezni 3 186 00 Prague 8, Czech RepublicTel: 420 (295) 565-800
Sumitomo Mitsui Banking Corporation Europe Limited Madrid BranchCalle Pedro Teixeira 8, Edificio Iberia Mart I, planta 4a., 28020 Madrid, SpainTel: 34 (91) 312-7300
Sumitomo Mitsui Banking Corporation Europe Limited Milan BranchVia della Spiga 30/ Via Senato 25,20121 Milan, ItalyTel: 39 (02) 7636-1700
JSC Sumitomo Mitsui Rus BankPresnenskaya naberezhnaya, house 10, block C, Moscow, 123112 Russian FederationTel: 7 (495) 287-8200
SMBC Nikko Capital Markets LimitedOne New Change, London EC4M 9AF, U.K.Tel: 44 (20) 3527-7000
SMBC Derivative Products LimitedOne New Change, London EC4M 9AF, U.K.Tel: 44 (20) 3527-7000
Sumitomo Mitsui Finance Dublin LimitedLa Touche House, I.F.S.C.,Custom House Docks, Dublin 1,IrelandTel: 353 (1) 670-0066
JRI Europe, Limited99 Queen Victoria Street, LondonEC4V 4EH, U.K.Tel: 44 (20) 7406-2700
Sumitomo Mitsui Asset Management (London) Limited3rd Floor, 90 Basinghall Street, London EC2V 5AY, U.K.Tel: 44 (20) 7397-3970
SMBC Aviation Capital LimitedIFSC House, IFSC, Dublin 1, IrelandTel: 353 (1) 859-9000
1112017 Annual Report
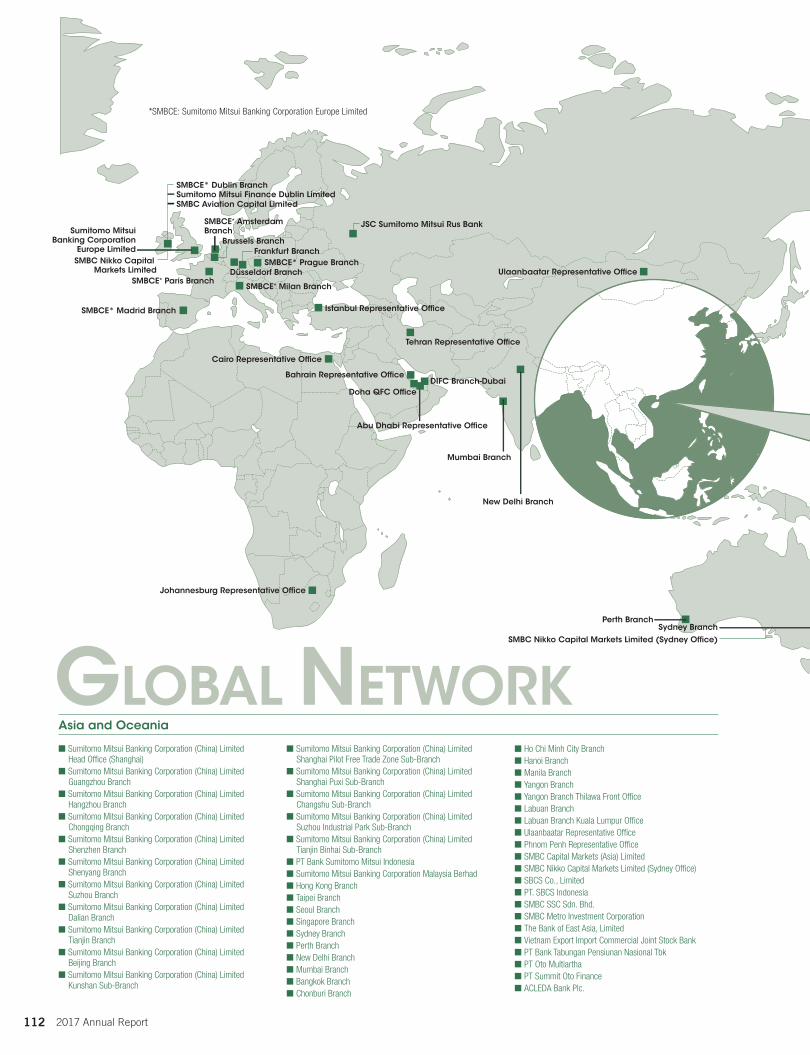
*SMBCE: Sumitomo Mitsui Banking Corporation Europe Limited
JSC Sumitomo Mitsui Rus Bank
Tianjin Binhai Sub-Branch Houston Representative Of�ce
SMBC Leasing and Finance, Inc.SMBC Nikko Securities America, Inc.
GLOBAL NETWORKEurope, Middle East and AfricaThe Americas
Overseas service network (as of June 30, 2017) Total: 75(including banking subsidiaries and their branches/sub-branches/rep. offices)Also showing principal overseas subsidiaries
Sumitomo MitsuiBanking Corporation
Europe Limited
SMBCE* Paris BranchSMBCE* Milan Branch
Istanbul Representative Office
Brussels BranchFrankfurt Branch
SMBCE* Amsterdam Branch
Düsseldorf Branch
SMBCE* Madrid Branch
SMBCE* Prague Branch
Tehran Representative Office
Ulaanbaatar Representative Office
New Delhi Branch
DIFC Branch-DubaiBahrain Representative Office
Doha QFC Office
Mumbai Branch
Abu Dhabi Representative Office
Cairo Representative Office
Johannesburg Representative Office
Sumitomo Mitsui Finance Dublin LimitedSMBCE* Dublin Branch
SMBC Aviation Capital Limited
Sydney BranchPerth Branch
SMBC Nikko Capital Markets Limited (Sydney Office)
Seoul Branch
Hong Kong Branch
GuangzhouBranch Taipei Branch
Head Office (Shanghai)Shanghai Puxi Sub-BranchShanghai Pilot Free Trade Zone Sub-Branch
HangzhouBranch
Suzhou BranchKunshan Sub-Branch
SMBC Capital Markets (Asia) Limited
Tianjin Branch
Beijing Branch
Shenyang Branch
Singapore Branch
Sumitomo Mitsui Banking Corporation Malaysia Berhad
Labuan Branch
Bangkok BranchSBCS Co., Limited
Ho Chi Minh City Branch
Phnom Penh Representative OfficeACLEDA Bank Plc.
Vietnam Export ImportCommercial Joint Stock Bank
Thilawa Front OfficeYangon Branch
Mexico City Representative OfficeSMBC, S.A.P.I. DE C.V., SOFOM, E.N.R.
Chonburi Branch
SMBC SSC Sdn. Bhd.
Chongqing Branch
DalianBranch
Hanoi Branch Shenzhen Branch
Manila BranchSMBC Metro Investment Corp.
Suzhou Industrial Park Sub-BranchChangshu Sub-Branch
New York Branch
Los Angeles Branch
San Francisco BranchSilicon Valley Representative Of�ce
Manufacturers Bank
Canada Branch
Bogota Representative Of�ce
Lima Representative Of�ce
Banco Sumitomo Mitsui Brasileiro S.A.
Santiago Representative Office
SMBC Rail Services LLC SMBC Capital Markets, Inc.
SMBC Nikko Capital Markets Limited
Kuala Lumpur Office
Asia and Oceania
PT. SBCS IndonesiaPT Bank Tabungan Pensiunan Nasional TbkPT Oto MultiarthaPT Summit Oto Finance
PT Bank Sumitomo Mitsui Indonesia
Cayman BranchBanco Sumitomo Mitsui Brasileiro S.A. Cayman Branch
Indicates branch or sub-branch of Sumitomo Mitsui Banking Corporation (China) Limited
■ Sumitomo Mitsui Banking Corporation (China) Limited Head Office (Shanghai)
■ Sumitomo Mitsui Banking Corporation (China) Limited Guangzhou Branch
■ Sumitomo Mitsui Banking Corporation (China) Limited Hangzhou Branch
■ Sumitomo Mitsui Banking Corporation (China) Limited Chongqing Branch
■ Sumitomo Mitsui Banking Corporation (China) Limited Shenzhen Branch
■ Sumitomo Mitsui Banking Corporation (China) Limited Shenyang Branch
■ Sumitomo Mitsui Banking Corporation (China) Limited Suzhou Branch
■ Sumitomo Mitsui Banking Corporation (China) Limited Dalian Branch
■ Sumitomo Mitsui Banking Corporation (China) Limited Tianjin Branch
■ Sumitomo Mitsui Banking Corporation (China) Limited Beijing Branch
■ Sumitomo Mitsui Banking Corporation (China) Limited Kunshan Sub-Branch
■ Sumitomo Mitsui Banking Corporation (China) Limited Shanghai Pilot Free Trade Zone Sub-Branch
■ Sumitomo Mitsui Banking Corporation (China) Limited Shanghai Puxi Sub-Branch
■ Sumitomo Mitsui Banking Corporation (China) Limited Changshu Sub-Branch
■ Sumitomo Mitsui Banking Corporation (China) Limited Suzhou Industrial Park Sub-Branch
■ Sumitomo Mitsui Banking Corporation (China) Limited Tianjin Binhai Sub-Branch
■ PT Bank Sumitomo Mitsui Indonesia■ Sumitomo Mitsui Banking Corporation Malaysia Berhad■ Hong Kong Branch■ Taipei Branch■ Seoul Branch■ Singapore Branch■ Sydney Branch■ Perth Branch■ New Delhi Branch■ Mumbai Branch■ Bangkok Branch■ Chonburi Branch
■ Ho Chi Minh City Branch■ Hanoi Branch■ Manila Branch■ Yangon Branch■ Yangon Branch Thilawa Front Office■ Labuan Branch■ Labuan Branch Kuala Lumpur Office■ Ulaanbaatar Representative Office■ Phnom Penh Representative Office■ SMBC Capital Markets (Asia) Limited■ SMBC Nikko Capital Markets Limited (Sydney Office)■ SBCS Co., Limited■ PT. SBCS Indonesia■ SMBC SSC Sdn. Bhd.■ SMBC Metro Investment Corporation■ The Bank of East Asia, Limited■ Vietnam Export Import Commercial Joint Stock Bank■ PT Bank Tabungan Pensiunan Nasional Tbk■ PT Oto Multiartha■ PT Summit Oto Finance■ ACLEDA Bank Plc.
■ New York Branch ■ San Francisco Branch■ Los Angeles Branch■ Canada Branch■ Cayman Branch■ Houston Representative Office■ Silicon Valley Representative Office■ Mexico City Representative Office■ Santiago Representative Office■ Bogota Representative Office■ Lima Representative Office■ Manufacturers Bank■ Banco Sumitomo Mitsui Brasileiro S.A.■ Banco Sumitomo Mitsui Brasileiro S.A.
Cayman Branch■ SMBC Capital Markets, Inc. ■ SMBC Nikko Securities America, Inc.■ SMBC Leasing and Finance, Inc. ■ SMBC Rail Services LLC■ SMBC, S.A.P.I. DE C.V., SOFOM, E.N.R.
■ Sumitomo Mitsui Banking Corporation Europe Limited Head Office
■ Sumitomo Mitsui Banking Corporation Europe Limited Amsterdam Branch
■ Sumitomo Mitsui Banking Corporation Europe Limited Dublin Branch
■ Sumitomo Mitsui Banking Corporation Europe Limited Paris Branch
■ Sumitomo Mitsui Banking Corporation Europe Limited Prague Branch
■ Sumitomo Mitsui Banking Corporation Europe Limited Madrid Branch
■ Sumitomo Mitsui Banking Corporation Europe Limited Milan Branch
■ Düsseldorf Branch■ Frankfurt Branch■ Brussels Branch
■ DIFC Branch-Dubai■ Abu Dhabi Representative Office■ Istanbul Representative Office■ Doha QFC Office■ Bahrain Representative Office■ Johannesburg Representative Office■ Cairo Representative Office■ Tehran Representative Office■ JSC Sumitomo Mitsui Rus Bank■ SMBC Nikko Capital Markets Limited■ Sumitomo Mitsui Finance Dublin Limited■ SMBC Aviation Capital Limited
The Bank of East Asia, Limited
112 2017 Annual Report
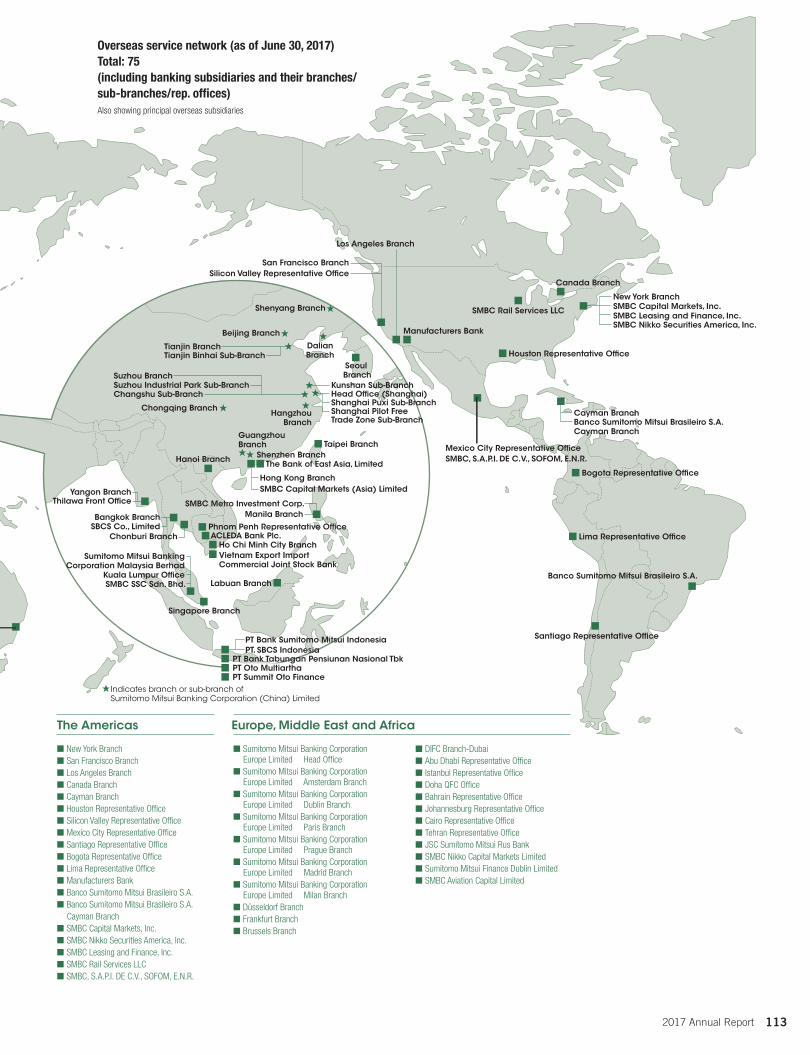
*SMBCE: Sumitomo Mitsui Banking Corporation Europe Limited
JSC Sumitomo Mitsui Rus Bank
Tianjin Binhai Sub-Branch Houston Representative Of�ce
SMBC Leasing and Finance, Inc.SMBC Nikko Securities America, Inc.
GLOBAL NETWORKEurope, Middle East and AfricaThe Americas
Overseas service network (as of June 30, 2017) Total: 75(including banking subsidiaries and their branches/sub-branches/rep. offices)Also showing principal overseas subsidiaries
Sumitomo MitsuiBanking Corporation
Europe Limited
SMBCE* Paris BranchSMBCE* Milan Branch
Istanbul Representative Office
Brussels BranchFrankfurt Branch
SMBCE* Amsterdam Branch
Düsseldorf Branch
SMBCE* Madrid Branch
SMBCE* Prague Branch
Tehran Representative Office
Ulaanbaatar Representative Office
New Delhi Branch
DIFC Branch-DubaiBahrain Representative Office
Doha QFC Office
Mumbai Branch
Abu Dhabi Representative Office
Cairo Representative Office
Johannesburg Representative Office
Sumitomo Mitsui Finance Dublin LimitedSMBCE* Dublin Branch
SMBC Aviation Capital Limited
Sydney BranchPerth Branch
SMBC Nikko Capital Markets Limited (Sydney Office)
Seoul Branch
Hong Kong Branch
GuangzhouBranch Taipei Branch
Head Office (Shanghai)Shanghai Puxi Sub-BranchShanghai Pilot Free Trade Zone Sub-Branch
HangzhouBranch
Suzhou BranchKunshan Sub-Branch
SMBC Capital Markets (Asia) Limited
Tianjin Branch
Beijing Branch
Shenyang Branch
Singapore Branch
Sumitomo Mitsui Banking Corporation Malaysia Berhad
Labuan Branch
Bangkok BranchSBCS Co., Limited
Ho Chi Minh City Branch
Phnom Penh Representative OfficeACLEDA Bank Plc.
Vietnam Export ImportCommercial Joint Stock Bank
Thilawa Front OfficeYangon Branch
Mexico City Representative OfficeSMBC, S.A.P.I. DE C.V., SOFOM, E.N.R.
Chonburi Branch
SMBC SSC Sdn. Bhd.
Chongqing Branch
DalianBranch
Hanoi Branch Shenzhen Branch
Manila BranchSMBC Metro Investment Corp.
Suzhou Industrial Park Sub-BranchChangshu Sub-Branch
New York Branch
Los Angeles Branch
San Francisco BranchSilicon Valley Representative Of�ce
Manufacturers Bank
Canada Branch
Bogota Representative Of�ce
Lima Representative Of�ce
Banco Sumitomo Mitsui Brasileiro S.A.
Santiago Representative Office
SMBC Rail Services LLC SMBC Capital Markets, Inc.
SMBC Nikko Capital Markets Limited
Kuala Lumpur Office
Asia and Oceania
PT. SBCS IndonesiaPT Bank Tabungan Pensiunan Nasional TbkPT Oto MultiarthaPT Summit Oto Finance
PT Bank Sumitomo Mitsui Indonesia
Cayman BranchBanco Sumitomo Mitsui Brasileiro S.A. Cayman Branch
Indicates branch or sub-branch of Sumitomo Mitsui Banking Corporation (China) Limited
■ Sumitomo Mitsui Banking Corporation (China) Limited Head Office (Shanghai)
■ Sumitomo Mitsui Banking Corporation (China) Limited Guangzhou Branch
■ Sumitomo Mitsui Banking Corporation (China) Limited Hangzhou Branch
■ Sumitomo Mitsui Banking Corporation (China) Limited Chongqing Branch
■ Sumitomo Mitsui Banking Corporation (China) Limited Shenzhen Branch
■ Sumitomo Mitsui Banking Corporation (China) Limited Shenyang Branch
■ Sumitomo Mitsui Banking Corporation (China) Limited Suzhou Branch
■ Sumitomo Mitsui Banking Corporation (China) Limited Dalian Branch
■ Sumitomo Mitsui Banking Corporation (China) Limited Tianjin Branch
■ Sumitomo Mitsui Banking Corporation (China) Limited Beijing Branch
■ Sumitomo Mitsui Banking Corporation (China) Limited Kunshan Sub-Branch
■ Sumitomo Mitsui Banking Corporation (China) Limited Shanghai Pilot Free Trade Zone Sub-Branch
■ Sumitomo Mitsui Banking Corporation (China) Limited Shanghai Puxi Sub-Branch
■ Sumitomo Mitsui Banking Corporation (China) Limited Changshu Sub-Branch
■ Sumitomo Mitsui Banking Corporation (China) Limited Suzhou Industrial Park Sub-Branch
■ Sumitomo Mitsui Banking Corporation (China) Limited Tianjin Binhai Sub-Branch
■ PT Bank Sumitomo Mitsui Indonesia■ Sumitomo Mitsui Banking Corporation Malaysia Berhad■ Hong Kong Branch■ Taipei Branch■ Seoul Branch■ Singapore Branch■ Sydney Branch■ Perth Branch■ New Delhi Branch■ Mumbai Branch■ Bangkok Branch■ Chonburi Branch
■ Ho Chi Minh City Branch■ Hanoi Branch■ Manila Branch■ Yangon Branch■ Yangon Branch Thilawa Front Office■ Labuan Branch■ Labuan Branch Kuala Lumpur Office■ Ulaanbaatar Representative Office■ Phnom Penh Representative Office■ SMBC Capital Markets (Asia) Limited■ SMBC Nikko Capital Markets Limited (Sydney Office)■ SBCS Co., Limited■ PT. SBCS Indonesia■ SMBC SSC Sdn. Bhd.■ SMBC Metro Investment Corporation■ The Bank of East Asia, Limited■ Vietnam Export Import Commercial Joint Stock Bank■ PT Bank Tabungan Pensiunan Nasional Tbk■ PT Oto Multiartha■ PT Summit Oto Finance■ ACLEDA Bank Plc.
■ New York Branch ■ San Francisco Branch■ Los Angeles Branch■ Canada Branch■ Cayman Branch■ Houston Representative Office■ Silicon Valley Representative Office■ Mexico City Representative Office■ Santiago Representative Office■ Bogota Representative Office■ Lima Representative Office■ Manufacturers Bank■ Banco Sumitomo Mitsui Brasileiro S.A.■ Banco Sumitomo Mitsui Brasileiro S.A.
Cayman Branch■ SMBC Capital Markets, Inc. ■ SMBC Nikko Securities America, Inc.■ SMBC Leasing and Finance, Inc. ■ SMBC Rail Services LLC■ SMBC, S.A.P.I. DE C.V., SOFOM, E.N.R.
■ Sumitomo Mitsui Banking Corporation Europe Limited Head Office
■ Sumitomo Mitsui Banking Corporation Europe Limited Amsterdam Branch
■ Sumitomo Mitsui Banking Corporation Europe Limited Dublin Branch
■ Sumitomo Mitsui Banking Corporation Europe Limited Paris Branch
■ Sumitomo Mitsui Banking Corporation Europe Limited Prague Branch
■ Sumitomo Mitsui Banking Corporation Europe Limited Madrid Branch
■ Sumitomo Mitsui Banking Corporation Europe Limited Milan Branch
■ Düsseldorf Branch■ Frankfurt Branch■ Brussels Branch
■ DIFC Branch-Dubai■ Abu Dhabi Representative Office■ Istanbul Representative Office■ Doha QFC Office■ Bahrain Representative Office■ Johannesburg Representative Office■ Cairo Representative Office■ Tehran Representative Office■ JSC Sumitomo Mitsui Rus Bank■ SMBC Nikko Capital Markets Limited■ Sumitomo Mitsui Finance Dublin Limited■ SMBC Aviation Capital Limited
The Bank of East Asia, Limited
1132017 Annual Report

114 2017 Annual Report
1152017 Annual Report
Appendix II
Financial Data
SMFGFinancial Highlights 116
Consolidated Balance Sheets 117
Consolidated Statements of Income 119
Consolidated Statements of Comprehensive Income 121
Consolidated Statements ofChanges in Net Assets 122
Consolidated Statements of Cash Flows 125
Notes to Consolidated Financial Statements 127
Independent Auditor’s Report 195
SMBCSupplemental Information 196
SMFGIncome Analysis (Consolidated) 202
Assets and Liabilities (Consolidated) 205
Capital (Non-consolidated) 208
Basel III Information
SMFGCapital Ratio Information (Consolidated) 211
Leverage Ratio Information (Consolidated) 245
Liquidity Coverage Ratio Information (Consolidated) 246
Indicators for assessing Global Systemically Important Banks (G-SIBs) 248
SMBCFinancial Highlights 249
Income Analysis (Consolidated) 250
Assets and Liabilities (Consolidated) 253
Income Analysis (Non-consolidated) 255
Deposits (Non-consolidated) 259
Loans (Non-consolidated) 261
Securities (Non-consolidated) 266
Ratios (Non-consolidated) 268
Capital (Non-consolidated) 270
Others (Non-consolidated) 271
Trust Assets and Liabilities (Non-consolidated) 273
Compensation
SMFGCompensation (Consolidated) 296
SMBCCompensation 299
CONTENTS
Basel III Information
SMBCCapital Ratio Information (Consolidated) 274
Leverage Ratio Information (Consolidated) 281
Liquidity Coverage Ratio Information (Consolidated) 282
Capital Ratio Information (Non-consolidated) 284
Liquidity Coverage Ratio Information (Non-consolidated) 292
006_0800801372908.indd 115 2017/08/02 14:19:47
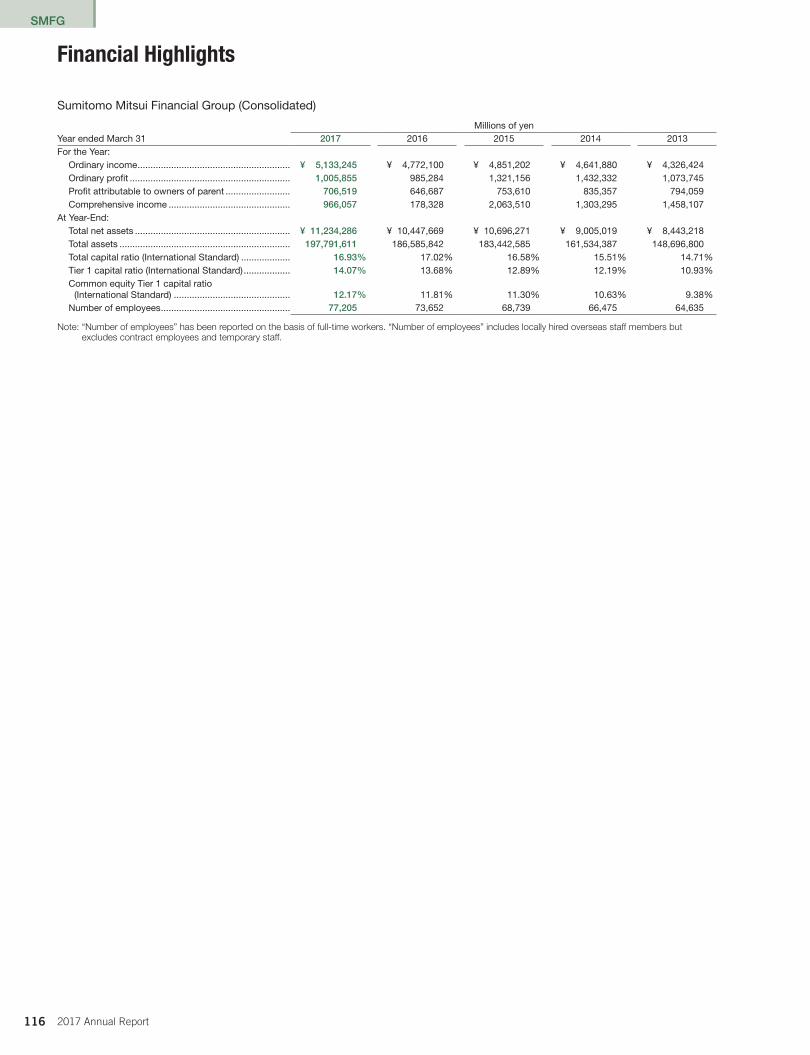
SMFG
116 2017 Annual Report
Sumitomo Mitsui Financial Group (Consolidated)
Millions of yen Year ended March 31 2017 2016 2015 2014 2013For the Year:
Ordinary income ����������������������������������������������������������� ¥ 5,133,245 ¥ 4,772,100 ¥ 4,851,202 ¥ 4,641,880 ¥ 4,326,424 Ordinary profit �������������������������������������������������������������� 1,005,855 985,284 1,321,156 1,432,332 1,073,745 Profit attributable to owners of parent ������������������������� 706,519 646,687 753,610 835,357 794,059Comprehensive income ����������������������������������������������� 966,057 178,328 2,063,510 1,303,295 1,458,107
At Year-End:Total net assets ������������������������������������������������������������ ¥ 11,234,286 ¥ 10,447,669 ¥ 10,696,271 ¥ 9,005,019 ¥ 8,443,218Total assets ������������������������������������������������������������������ 197,791,611 186,585,842 183,442,585 161,534,387 148,696,800Total capital ratio (International Standard) ������������������� 16.93% 17�02% 16�58% 15�51% 14�71%Tier 1 capital ratio (International Standard) ������������������ 14.07% 13�68% 12�89% 12�19% 10�93%Common equity Tier 1 capital ratio
(International Standard) ��������������������������������������������� 12.17% 11�81% 11�30% 10�63% 9�38%Number of employees �������������������������������������������������� 77,205 73,652 68,739 66,475 64,635
Note: “Number of employees” has been reported on the basis of full-time workers. “Number of employees” includes locally hired overseas staff members but excludes contract employees and temporary staff.
Financial Highlights
010_0800801372908.indd 116 2017/08/07 14:04:32
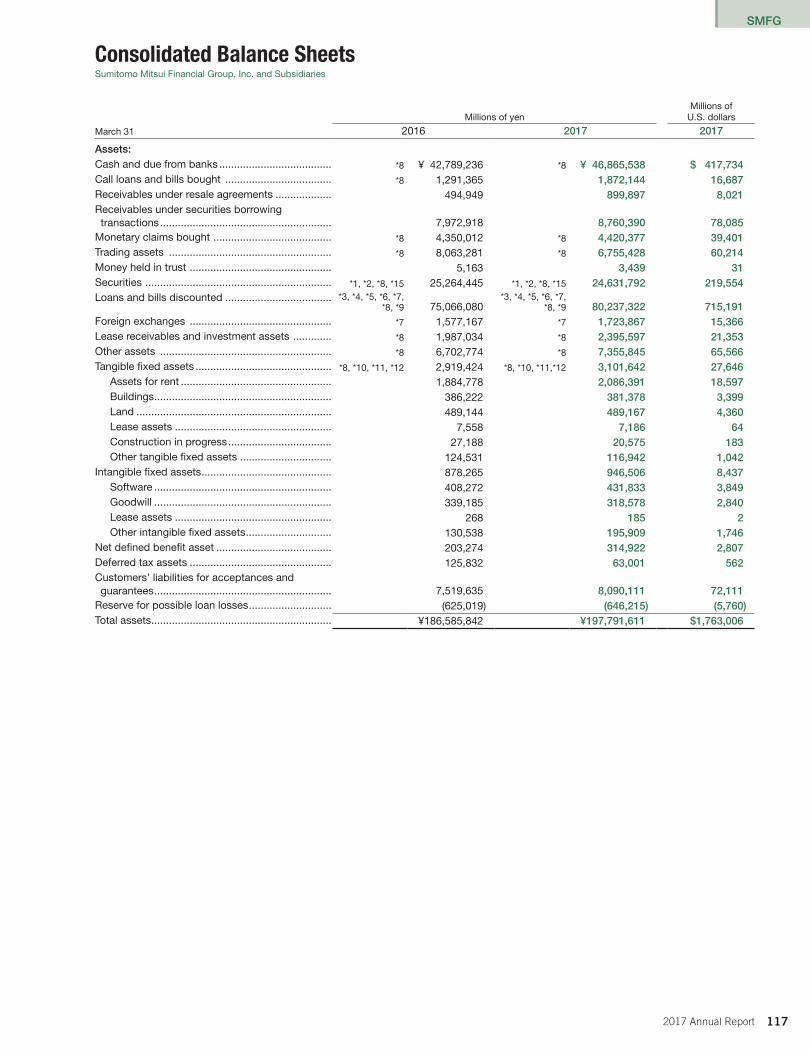
SMFG
1172017 Annual Report
Consolidated Balance SheetsSumitomo Mitsui Financial Group, Inc� and Subsidiaries
Millions of yenMillions of
U�S� dollars
March 31 2016 2017 2017
Assets:Cash and due from banks �������������������������������������� *8 ¥ 42,789,236 *8 ¥ 46,865,538 $ 417,734Call loans and bills bought ������������������������������������ *8 1,291,365 1,872,144 16,687Receivables under resale agreements ������������������� 494,949 899,897 8,021Receivables under securities borrowing transactions ���������������������������������������������������������� 7,972,918 8,760,390 78,085
Monetary claims bought ���������������������������������������� *8 4,350,012 *8 4,420,377 39,401 Trading assets ������������������������������������������������������� *8 8,063,281 *8 6,755,428 60,214 Money held in trust ������������������������������������������������ 5,163 3,439 31Securities ��������������������������������������������������������������� *1, *2, *8, *15 25,264,445 *1, *2, *8, *15 24,631,792 219,554 Loans and bills discounted ������������������������������������ *3, *4, *5, *6, *7,
*8, *9 75,066,080*3, *4, *5, *6, *7,
*8, *9 80,237,322 715,191Foreign exchanges ������������������������������������������������ *7 1,577,167 *7 1,723,867 15,366Lease receivables and investment assets ������������� *8 1,987,034 *8 2,395,597 21,353Other assets ���������������������������������������������������������� *8 6,702,774 *8 7,355,845 65,566Tangible fixed assets ���������������������������������������������� *8, *10, *11, *12 2,919,424 *8, *10, *11,*12 3,101,642 27,646
Assets for rent ��������������������������������������������������� 1,884,778 2,086,391 18,597Buildings ������������������������������������������������������������ 386,222 381,378 3,399Land ������������������������������������������������������������������ 489,144 489,167 4,360Lease assets ����������������������������������������������������� 7,558 7,186 64Construction in progress ����������������������������������� 27,188 20,575 183Other tangible fixed assets ������������������������������� 124,531 116,942 1,042
Intangible fixed assets �������������������������������������������� 878,265 946,506 8,437Software ������������������������������������������������������������ 408,272 431,833 3,849Goodwill ������������������������������������������������������������ 339,185 318,578 2,840Lease assets ����������������������������������������������������� 268 185 2Other intangible fixed assets ����������������������������� 130,538 195,909 1,746
Net defined benefit asset ��������������������������������������� 203,274 314,922 2,807Deferred tax assets ������������������������������������������������ 125,832 63,001 562Customers’ liabilities for acceptances and guarantees ������������������������������������������������������������ 7,519,635 8,090,111 72,111
Reserve for possible loan losses ���������������������������� (625,019) (646,215) (5,760)Total assets ������������������������������������������������������������� ¥186,585,842 ¥197,791,611 $1,763,006
010_0800801372908.indd 117 2017/08/07 14:04:33
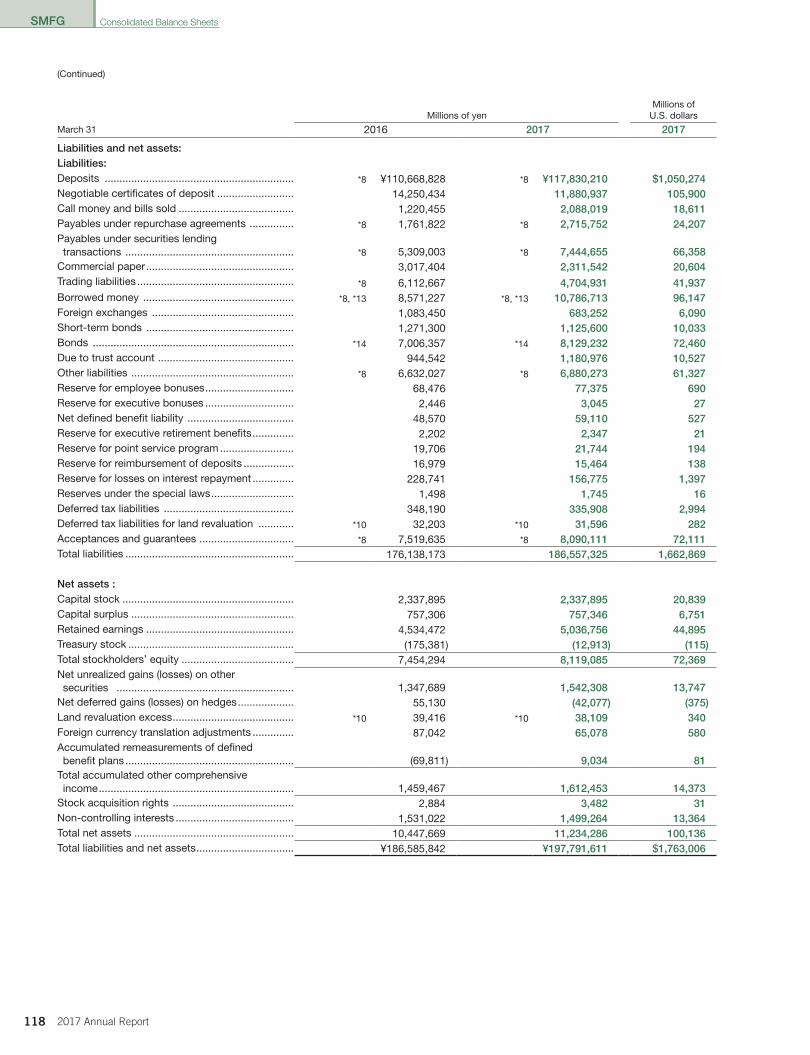
SMFG
118 2017 Annual Report
(Continued)
Millions of yenMillions of
U�S� dollars
March 31 2016 2017 2017
Liabilities and net assets:Liabilities:Deposits ���������������������������������������������������������������� *8 ¥110,668,828 *8 ¥117,830,210 $1,050,274Negotiable certificates of deposit �������������������������� 14,250,434 11,880,937 105,900Call money and bills sold ��������������������������������������� 1,220,455 2,088,019 18,611Payables under repurchase agreements ��������������� *8 1,761,822 *8 2,715,752 24,207Payables under securities lending transactions ��������������������������������������������������������� *8 5,309,003 *8 7,444,655 66,358
Commercial paper �������������������������������������������������� 3,017,404 2,311,542 20,604Trading liabilities ����������������������������������������������������� *8 6,112,667 4,704,931 41,937Borrowed money ��������������������������������������������������� *8, *13 8,571,227 *8, *13 10,786,713 96,147Foreign exchanges ������������������������������������������������ 1,083,450 683,252 6,090Short-term bonds �������������������������������������������������� 1,271,300 1,125,600 10,033Bonds �������������������������������������������������������������������� *14 7,006,357 *14 8,129,232 72,460Due to trust account ���������������������������������������������� 944,542 1,180,976 10,527Other liabilities ������������������������������������������������������� *8 6,632,027 *8 6,880,273 61,327Reserve for employee bonuses ������������������������������ 68,476 77,375 690Reserve for executive bonuses ������������������������������ 2,446 3,045 27Net defined benefit liability ������������������������������������ 48,570 59,110 527Reserve for executive retirement benefits �������������� 2,202 2,347 21Reserve for point service program ������������������������� 19,706 21,744 194Reserve for reimbursement of deposits ����������������� 16,979 15,464 138Reserve for losses on interest repayment �������������� 228,741 156,775 1,397Reserves under the special laws ���������������������������� 1,498 1,745 16Deferred tax liabilities �������������������������������������������� 348,190 335,908 2,994Deferred tax liabilities for land revaluation ������������ *10 32,203 *10 31,596 282Acceptances and guarantees �������������������������������� *8 7,519,635 *8 8,090,111 72,111Total liabilities ��������������������������������������������������������� 176,138,173 186,557,325 1,662,869 Net assets :Capital stock ���������������������������������������������������������� 2,337,895 2,337,895 20,839Capital surplus ������������������������������������������������������� 757,306 757,346 6,751Retained earnings �������������������������������������������������� 4,534,472 5,036,756 44,895Treasury stock �������������������������������������������������������� (175,381) (12,913) (115)Total stockholders’ equity �������������������������������������� 7,454,294 8,119,085 72,369Net unrealized gains (losses) on other securities ������������������������������������������������������������ 1,347,689 1,542,308 13,747
Net deferred gains (losses) on hedges ������������������� 55,130 (42,077) (375)Land revaluation excess ����������������������������������������� *10 39,416 *10 38,109 340Foreign currency translation adjustments �������������� 87,042 65,078 580Accumulated remeasurements of defined benefit plans ��������������������������������������������������������� (69,811) 9,034 81
Total accumulated other comprehensive income ������������������������������������������������������������������ 1,459,467 1,612,453 14,373
Stock acquisition rights ����������������������������������������� 2,884 3,482 31Non-controlling interests ���������������������������������������� 1,531,022 1,499,264 13,364Total net assets ������������������������������������������������������ 10,447,669 11,234,286 100,136Total liabilities and net assets ��������������������������������� ¥186,585,842 ¥197,791,611 $1,763,006
Consolidated Balance Sheets
010_0800801372908.indd 118 2017/08/07 14:04:33
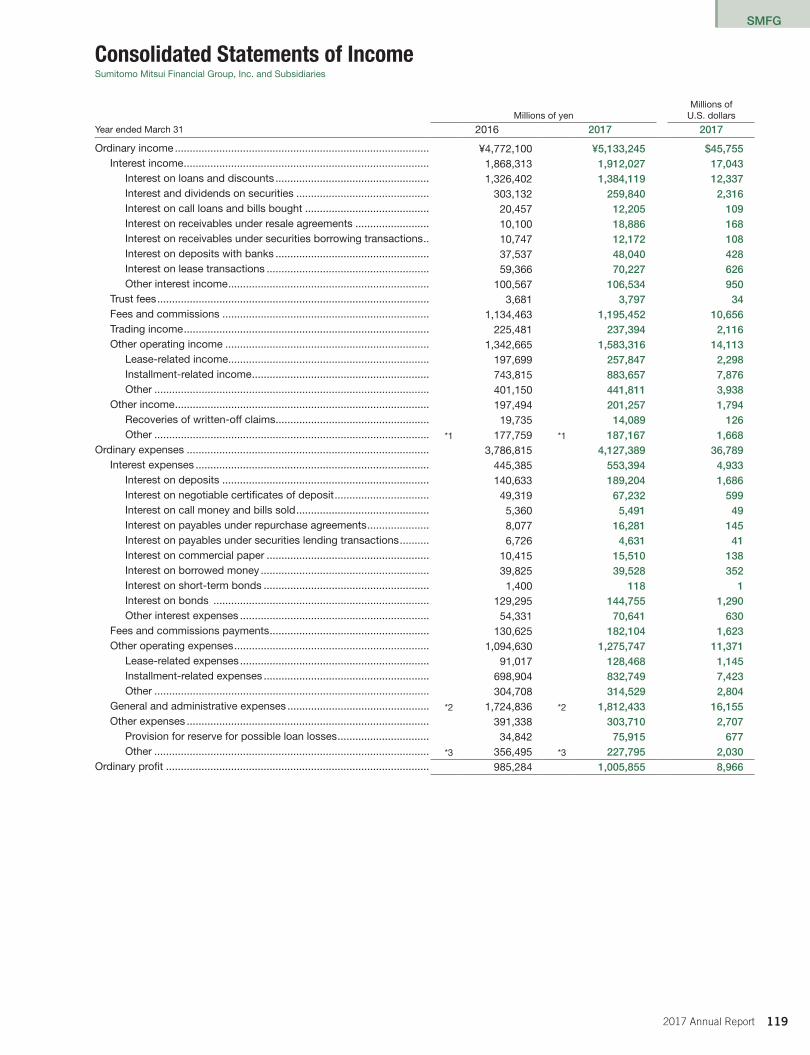
SMFG
1192017 Annual Report
Consolidated Statements of Income Sumitomo Mitsui Financial Group, Inc� and Subsidiaries
Millions of yenMillions of
U�S� dollars
Year ended March 31 2016 2017 2017
Ordinary income �������������������������������������������������������������������������������������� ¥4,772,100 ¥5,133,245 $45,755Interest income ����������������������������������������������������������������������������������� 1,868,313 1,912,027 17,043
Interest on loans and discounts ���������������������������������������������������� 1,326,402 1,384,119 12,337 Interest and dividends on securities ��������������������������������������������� 303,132 259,840 2,316 Interest on call loans and bills bought ������������������������������������������ 20,457 12,205 109 Interest on receivables under resale agreements ������������������������� 10,100 18,886 168 Interest on receivables under securities borrowing transactions �� 10,747 12,172 108 Interest on deposits with banks ���������������������������������������������������� 37,537 48,040 428 Interest on lease transactions ������������������������������������������������������� 59,366 70,227 626 Other interest income �������������������������������������������������������������������� 100,567 106,534 950
Trust fees �������������������������������������������������������������������������������������������� 3,681 3,797 34 Fees and commissions ���������������������������������������������������������������������� 1,134,463 1,195,452 10,656 Trading income ����������������������������������������������������������������������������������� 225,481 237,394 2,116 Other operating income ��������������������������������������������������������������������� 1,342,665 1,583,316 14,113
Lease-related income �������������������������������������������������������������������� 197,699 257,847 2,298 Installment-related income ������������������������������������������������������������ 743,815 883,657 7,876 Other ��������������������������������������������������������������������������������������������� 401,150 441,811 3,938
Other income �������������������������������������������������������������������������������������� 197,494 201,257 1,794 Recoveries of written-off claims ���������������������������������������������������� 19,735 14,089 126 Other ��������������������������������������������������������������������������������������������� *1 177,759 *1 187,167 1,668
Ordinary expenses ���������������������������������������������������������������������������������� 3,786,815 4,127,389 36,789 Interest expenses ������������������������������������������������������������������������������� 445,385 553,394 4,933
Interest on deposits ���������������������������������������������������������������������� 140,633 189,204 1,686 Interest on negotiable certificates of deposit �������������������������������� 49,319 67,232 599 Interest on call money and bills sold ��������������������������������������������� 5,360 5,491 49 Interest on payables under repurchase agreements ��������������������� 8,077 16,281 145 Interest on payables under securities lending transactions ���������� 6,726 4,631 41 Interest on commercial paper ������������������������������������������������������� 10,415 15,510 138 Interest on borrowed money ��������������������������������������������������������� 39,825 39,528 352 Interest on short-term bonds �������������������������������������������������������� 1,400 118 1 Interest on bonds ������������������������������������������������������������������������� 129,295 144,755 1,290 Other interest expenses ���������������������������������������������������������������� 54,331 70,641 630
Fees and commissions payments ������������������������������������������������������ 130,625 182,104 1,623 Other operating expenses ������������������������������������������������������������������ 1,094,630 1,275,747 11,371
Lease-related expenses ���������������������������������������������������������������� 91,017 128,468 1,145 Installment-related expenses �������������������������������������������������������� 698,904 832,749 7,423 Other ��������������������������������������������������������������������������������������������� 304,708 314,529 2,804
General and administrative expenses ������������������������������������������������ *2 1,724,836 *2 1,812,433 16,155 Other expenses ���������������������������������������������������������������������������������� 391,338 303,710 2,707
Provision for reserve for possible loan losses ������������������������������� 34,842 75,915 677 Other ��������������������������������������������������������������������������������������������� *3 356,495 *3 227,795 2,030
Ordinary profit ����������������������������������������������������������������������������������������� 985,284 1,005,855 8,966
010_0800801372908.indd 119 2017/08/07 14:04:33

SMFG
120 2017 Annual Report
Millions of yenMillions of
U�S� dollars
Year ended March 31 2016 2017 2017
Extraordinary gains ���������������������������������������������������������������������������������� ¥ 3,911 ¥ 30,960 $ 276Gains on disposal of fixed assets ������������������������������������������������������ 3,714 1,552 14Gains on negative goodwill ���������������������������������������������������������������� 138 — —Reversal of reserve for eventual future operating losses from financial instruments transactions ���������������������������������������������������� 0 82 1
Other extraordinary gains ������������������������������������������������������������������� 58 *4 29,325 261Extraordinary losses �������������������������������������������������������������������������������� 9,026 57,511 513
Losses on disposal of fixed assets ���������������������������������������������������� 4,289 7,720 69Losses on impairment of fixed assets ������������������������������������������������ *5 4,362 *5 49,460 441Provision for reserve for eventual future operating losses from financial instruments transactions ���������������������������������������������������� 374 329 3
Income before income taxes ������������������������������������������������������������������� 980,170 979,305 8,729Income taxes-current ������������������������������������������������������������������������������ 244,223 265,045 2,362Income taxes-deferred ���������������������������������������������������������������������������� (19,175) (94,093) (839)Income taxes ������������������������������������������������������������������������������������������� 225,047 170,951 1,524Profit �������������������������������������������������������������������������������������������������������� 755,123 808,353 7,205Profit attributable to non-controlling interests ����������������������������������������� 108,435 101,834 908Profit attributable to owners of parent ���������������������������������������������������� ¥ 646,687 ¥ 706,519 $ 6,298
(Continued)
Consolidated Statements of Income
010_0800801372908.indd 120 2017/08/07 14:04:33
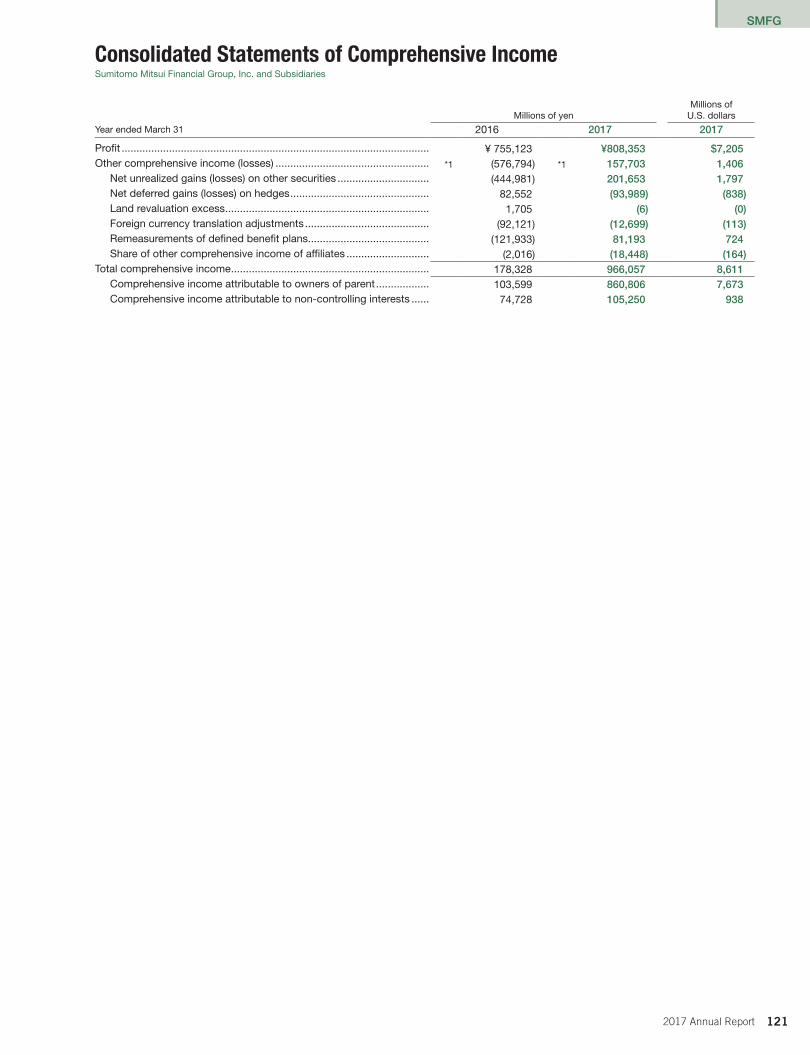
SMFG
1212017 Annual Report
Consolidated Statements of Comprehensive IncomeSumitomo Mitsui Financial Group, Inc� and Subsidiaries
Millions of yenMillions of
U�S� dollars
Year ended March 31 2016 2017 2017
Profit �������������������������������������������������������������������������������������������������������� ¥ 755,123 ¥808,353 $7,205Other comprehensive income (losses) ���������������������������������������������������� *1 (576,794) *1 157,703 1,406
Net unrealized gains (losses) on other securities ������������������������������� (444,981) 201,653 1,797Net deferred gains (losses) on hedges ����������������������������������������������� 82,552 (93,989) (838)Land revaluation excess ��������������������������������������������������������������������� 1,705 (6) (0)Foreign currency translation adjustments ������������������������������������������ (92,121) (12,699) (113)Remeasurements of defined benefit plans ����������������������������������������� (121,933) 81,193 724Share of other comprehensive income of affiliates ���������������������������� (2,016) (18,448) (164)
Total comprehensive income ������������������������������������������������������������������� 178,328 966,057 8,611Comprehensive income attributable to owners of parent ������������������ 103,599 860,806 7,673Comprehensive income attributable to non-controlling interests ������ 74,728 105,250 938
010_0800801372908.indd 121 2017/08/07 14:04:33

SMFG
122 2017 Annual Report
Millions of yen Stockholders’ equity
Year ended March 31, 2016Capitalstock
Capitalsurplus
Retainedearnings
Treasurystock Total
Balance at the beginning of the fiscal year ��������������������� ¥2,337,895 ¥757,329 ¥4,098,425 ¥(175,261) ¥7,018,389Changes in the fiscal year
Cash dividends ����������������������������������������������������������� (211,921) (211,921)Profit attributable to owners of parent ����������������������� 646,687 646,687Purchase of treasury stock����������������������������������������� (191) (191)Disposal of treasury stock ������������������������������������������ (17) 71 54Changes in shareholders’ interest due to transaction with non-controlling interests ����������������������������������� (5) (5)
Increase due to increase in subsidiaries �������������������� 50 50Increase due to decrease in subsidiaries ������������������� 3 3Decrease due to increase in subsidiaries ������������������� (16) (16)Decrease due to decrease in subsidiaries ����������������� (51) (51)Reversal of land revaluation excess ��������������������������� 1,295 1,295Net changes in items other than stockholders’ equity in the fiscal year ���������������������������������������������
Net changes in the fiscal year ����������������������������������������� — (23) 436,047 (119) 435,904Balance at the end of the fiscal year ������������������������������� ¥2,337,895 ¥757,306 ¥4,534,472 ¥(175,381) ¥7,454,294
Millions of yen Accumulated other comprehensive income
Year ended March 31, 2016
Net unrealized gains (losses)
on other securities
Net deferred gains (losses)
on hedges
Land revaluation
excess
Foreign currency
translation adjustments
Accumulated remeasurements
of defined benefit plans Total
Balance at the beginning of the fiscal year ��������������������� ¥1,791,049 ¥(30,180) ¥39,014 ¥156,309 ¥ 47,667 ¥2,003,859Changes in the fiscal year
Cash dividends �����������������������������������������������������������Profit attributable to owners of parent �����������������������Purchase of treasury stock�����������������������������������������Disposal of treasury stock ������������������������������������������Changes in shareholders’ interest due to transaction with non-controlling interests �����������������������������������
Increase due to increase in subsidiaries ��������������������Increase due to decrease in subsidiaries �������������������Decrease due to increase in subsidiaries �������������������Decrease due to decrease in subsidiaries �����������������Reversal of land revaluation excess ���������������������������Net changes in items other than stockholders’ equity in the fiscal year ��������������������������������������������� (443,359) 85,310 401 (69,266) (117,478) (544,392)
Net changes in the fiscal year ����������������������������������������� (443,359) 85,310 401 (69,266) (117,478) (544,392)Balance at the end of the fiscal year ������������������������������� ¥1,347,689 ¥ 55,130 ¥39,416 ¥ 87,042 ¥ (69,811) ¥1,459,467
Millions of yen
Year ended March 31, 2016
Stockacquisition
rights
Non-controlling interests
Totalnet assets
Balance at the beginning of the fiscal year ��������������������� ¥2,284 ¥1,671,738 ¥10,696,271Changes in the fiscal year
Cash dividends ����������������������������������������������������������� (211,921)Profit attributable to owners of parent ����������������������� 646,687Purchase of treasury stock����������������������������������������� (191)Disposal of treasury stock ������������������������������������������ 54Changes in shareholders’ interest due to transaction with non-controlling interests ����������������������������������� (5)
Increase due to increase in subsidiaries �������������������� 50Increase due to decrease in subsidiaries ������������������� 3Decrease due to increase in subsidiaries ������������������� (16)Decrease due to decrease in subsidiaries ����������������� (51)Reversal of land revaluation excess ��������������������������� 1,295Net changes in items other than stockholders’ equity in the fiscal year ��������������������������������������������� 600 (140,715) (684,507)
Net changes in the fiscal year ����������������������������������������� 600 (140,715) (248,602)Balance at the end of the fiscal year ������������������������������� ¥2,884 ¥1,531,022 ¥10,447,669
Consolidated Statements of Changes in Net AssetsSumitomo Mitsui Financial Group, Inc� and Subsidiaries
010_0800801372908.indd 122 2017/08/07 14:04:33

SMFG
1232017 Annual Report
Millions of yen Stockholders’ equity
Year ended March 31, 2017Capitalstock
Capitalsurplus
Retainedearnings
Treasurystock Total
Balance at the beginning of the fiscal year ��������������������� ¥2,337,895 ¥757,306 ¥4,534,472 ¥(175,381) ¥7,454,294Changes in the fiscal year
Cash dividends ����������������������������������������������������������� (205,083) (205,083)Profit attributable to owners of parent ����������������������� 706,519 706,519Purchase of treasury stock����������������������������������������� (100) (100)Disposal of treasury stock ������������������������������������������ (2) 162,567 162,564Changes in shareholders’ interest due to transaction with non-controlling interests ����������������������������������� 42 42
Increase due to increase in subsidiaries �������������������� 25 25Increase due to decrease in subsidiaries ������������������� 13 13Decrease due to increase in subsidiaries ������������������� (288) (288)Decrease due to decrease in subsidiaries ����������������� (4) (4)Decrease due to decrease in affiliates accounted for by the equity method ����������������������������������������������� (200) (200)
Reversal of land revaluation excess ��������������������������� 1,300 1,300Net changes in items other than stockholders’ equity in the fiscal year ���������������������������������������������
Net changes in the fiscal year ����������������������������������������� — 40 502,283 162,467 664,791Balance at the end of the fiscal year ������������������������������� ¥2,337,895 ¥757,346 ¥5,036,756 ¥ (12,913) ¥8,119,085
Millions of yen Accumulated other comprehensive income
Year ended March 31, 2017
Net unrealized gains (losses)
on other securities
Net deferred gains (losses)
on hedges
Land revaluation
excess
Foreign currency
translation adjustments
Accumulated remeasurements
of defined benefit plans Total
Balance at the beginning of the fiscal year ��������������������� ¥1,347,689 ¥ 55,130 ¥39,416 ¥ 87,042 ¥(69,811) ¥1,459,467Changes in the fiscal year
Cash dividends �����������������������������������������������������������Profit attributable to owners of parent �����������������������Purchase of treasury stock�����������������������������������������Disposal of treasury stock ������������������������������������������Changes in shareholders’ interest due to transaction with non-controlling interests �����������������������������������
Increase due to increase in subsidiaries ��������������������Increase due to decrease in subsidiaries �������������������Decrease due to increase in subsidiaries �������������������Decrease due to decrease in subsidiaries �����������������Decrease due to decrease in affiliates accounted for by the equity method �����������������������������������������������
Reversal of land revaluation excess ���������������������������Net changes in items other than stockholders’ equity in the fiscal year ��������������������������������������������� 194,619 (97,208) (1,306) (21,964) 78,845 152,985
Net changes in the fiscal year ����������������������������������������� 194,619 (97,208) (1,306) (21,964) 78,845 152,985Balance at the end of the fiscal year ������������������������������� ¥1,542,308 ¥(42,077) ¥38,109 ¥ 65,078 ¥ 9,034 ¥1,612,453
Millions of yen
Year ended March 31, 2017
Stockacquisition
rights
Non-controlling interests
Totalnet assets
Balance at the beginning of the fiscal year ��������������������� ¥2,884 ¥1,531,022 ¥10,447,669Changes in the fiscal year
Cash dividends ����������������������������������������������������������� (205,083)Profit attributable to owners of parent ����������������������� 706,519Purchase of treasury stock����������������������������������������� (100)Disposal of treasury stock ������������������������������������������ 162,564Changes in shareholders’ interest due to transaction with non-controlling interests ����������������������������������� 42
Increase due to increase in subsidiaries �������������������� 25Increase due to decrease in subsidiaries ������������������� 13Decrease due to increase in subsidiaries ������������������� (288)Decrease due to decrease in subsidiaries ����������������� (4)Decrease due to decrease in affiliates accounted for by the equity method ����������������������������������������������� (200)
Reversal of land revaluation excess ��������������������������� 1,300Net changes in items other than stockholders’ equity in the fiscal year ��������������������������������������������� 598 (31,758) 121,825
Net changes in the fiscal year ����������������������������������������� 598 (31,758) 786,616Balance at the end of the fiscal year ������������������������������� ¥3,482 ¥1,499,264 ¥11,234,286
Consolidated Statements of Changes in Net Assets
010_0800801372908.indd 123 2017/08/07 14:04:33
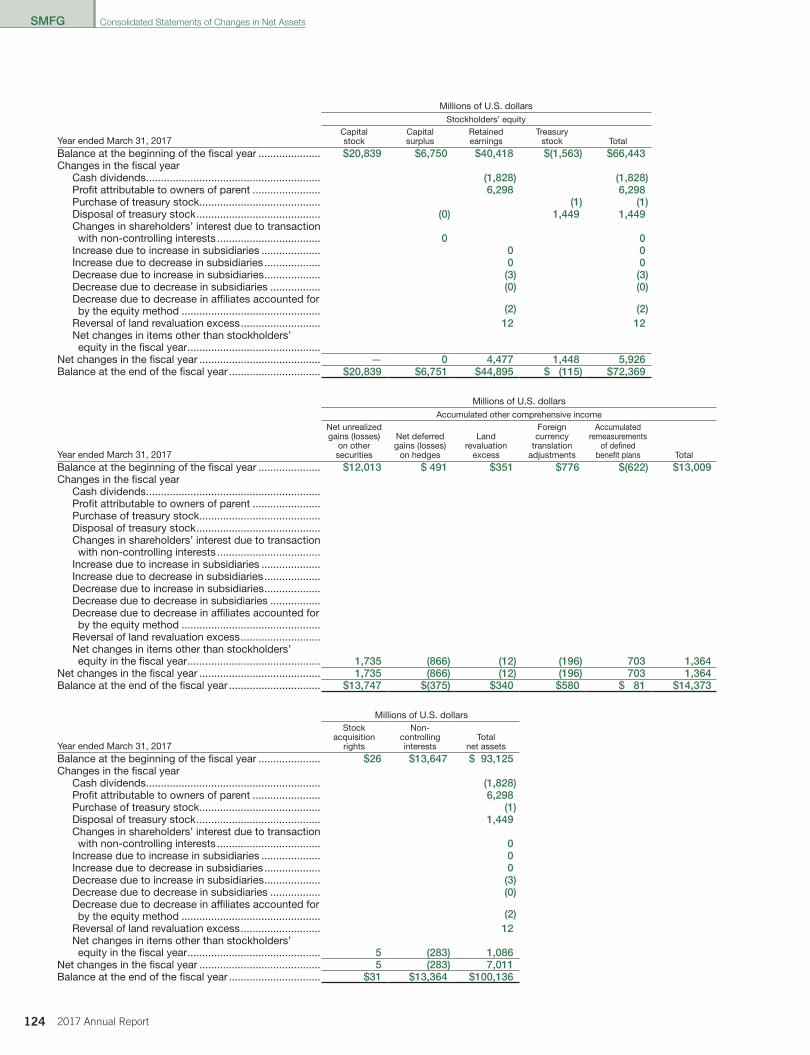
SMFG
124 2017 Annual Report
Millions of U�S� dollarsAccumulated other comprehensive income
Year ended March 31, 2017
Net unrealized gains (losses)
on other securities
Net deferred gains (losses)
on hedges
Land revaluation
excess
Foreign currency
translation adjustments
Accumulatedremeasurements
of defined benefit plans Total
Balance at the beginning of the fiscal year ��������������������� $12,013 $ 491 $351 $776 $(622) $13,009Changes in the fiscal year
Cash dividends �����������������������������������������������������������Profit attributable to owners of parent �����������������������Purchase of treasury stock�����������������������������������������Disposal of treasury stock ������������������������������������������Changes in shareholders’ interest due to transaction with non-controlling interests �����������������������������������
Increase due to increase in subsidiaries ��������������������Increase due to decrease in subsidiaries �������������������Decrease due to increase in subsidiaries �������������������Decrease due to decrease in subsidiaries �����������������Decrease due to decrease in affiliates accounted for by the equity method �����������������������������������������������
Reversal of land revaluation excess ���������������������������Net changes in items other than stockholders’ equity in the fiscal year ��������������������������������������������� 1,735 (866) (12) (196) 703 1,364
Net changes in the fiscal year ����������������������������������������� 1,735 (866) (12) (196) 703 1,364Balance at the end of the fiscal year ������������������������������� $13,747 $(375) $340 $580 $ 81 $14,373
Millions of U�S� dollars
Year ended March 31, 2017
Stockacquisition
rights
Non-controlling interests
Totalnet assets
Balance at the beginning of the fiscal year ��������������������� $26 $13,647 $ 93,125Changes in the fiscal year
Cash dividends ����������������������������������������������������������� (1,828)Profit attributable to owners of parent ����������������������� 6,298Purchase of treasury stock����������������������������������������� (1)Disposal of treasury stock ������������������������������������������ 1,449Changes in shareholders’ interest due to transaction with non-controlling interests ����������������������������������� 0
Increase due to increase in subsidiaries �������������������� 0Increase due to decrease in subsidiaries ������������������� 0Decrease due to increase in subsidiaries ������������������� (3)Decrease due to decrease in subsidiaries ����������������� (0)Decrease due to decrease in affiliates accounted for by the equity method ����������������������������������������������� (2)
Reversal of land revaluation excess ��������������������������� 12Net changes in items other than stockholders’ equity in the fiscal year ��������������������������������������������� 5 (283) 1,086
Net changes in the fiscal year ����������������������������������������� 5 (283) 7,011Balance at the end of the fiscal year ������������������������������� $31 $13,364 $100,136
Millions of U�S� dollarsStockholders’ equity
Year ended March 31, 2017Capitalstock
Capitalsurplus
Retainedearnings
Treasurystock Total
Balance at the beginning of the fiscal year ��������������������� $20,839 $6,750 $40,418 $(1,563) $66,443Changes in the fiscal year
Cash dividends ����������������������������������������������������������� (1,828) (1,828)Profit attributable to owners of parent ����������������������� 6,298 6,298Purchase of treasury stock����������������������������������������� (1) (1)Disposal of treasury stock ������������������������������������������ (0) 1,449 1,449Changes in shareholders’ interest due to transaction with non-controlling interests ����������������������������������� 0 0
Increase due to increase in subsidiaries �������������������� 0 0Increase due to decrease in subsidiaries ������������������� 0 0Decrease due to increase in subsidiaries ������������������� (3) (3)Decrease due to decrease in subsidiaries ����������������� (0) (0)Decrease due to decrease in affiliates accounted for by the equity method ����������������������������������������������� (2) (2)
Reversal of land revaluation excess ��������������������������� 12 12Net changes in items other than stockholders’ equity in the fiscal year ���������������������������������������������
Net changes in the fiscal year ����������������������������������������� — 0 4,477 1,448 5,926Balance at the end of the fiscal year ������������������������������� $20,839 $6,751 $44,895 $ (115) $72,369
Consolidated Statements of Changes in Net Assets
010_0800801372908.indd 124 2017/08/07 14:04:33

SMFG
1252017 Annual Report
Consolidated Statements of Cash FlowsSumitomo Mitsui Financial Group, Inc� and Subsidiaries
Millions of yenMillions of
U�S� dollars
Year ended March 31 2016 2017 2017
Cash flows from operating activities: .................................................... Income before income taxes �������������������������������������������������������������� ¥ 980,170 ¥ 979,305 $ 8,729Depreciation ��������������������������������������������������������������������������������������� 238,348 274,988 2,451 Losses on impairment of fixed assets ������������������������������������������������ 4,362 49,460 441 Amortization of goodwill ��������������������������������������������������������������������� 27,670 29,272 261 Gains on negative goodwill ���������������������������������������������������������������� (138) — — Gains on step acquisitions ����������������������������������������������������������������� (58) (29,325) (261)Equity in (gains) losses of affiliates ����������������������������������������������������� 36,196 (24,552) (219)Net change in reserve for possible loan losses ���������������������������������� (48,022) 21,620 193 Net change in reserve for employee bonuses ������������������������������������ (5,077) 7,765 69 Net change in reserve for executive bonuses ������������������������������������ (946) 584 5 Net change in net defined benefit asset and liability ������������������������� (23,434) (47,173) (420)Net change in reserve for executive retirement benefits �������������������� 68 145 1 Net change in reserve for point service program ������������������������������� 656 2,076 19 Net change in reserve for reimbursement of deposits ����������������������� (4,138) (1,514) (13)Net change in reserve for losses on interest repayment �������������������� 61,947 (71,789) (640)Interest income ����������������������������������������������������������������������������������� (1,868,313) (1,912,027) (17,043)Interest expenses ������������������������������������������������������������������������������� 445,385 553,394 4,933 Net (gains) losses on securities ���������������������������������������������������������� (126,398) (98,190) (875)Net (gains) losses from money held in trust ��������������������������������������� (0) (0) (0)Net exchange (gains) losses �������������������������������������������������������������� 445,713 16,280 145 Net (gains) losses from disposal of fixed assets �������������������������������� 575 6,167 55 Net change in trading assets ������������������������������������������������������������� (579,837) 1,260,408 11,235 Net change in trading liabilities ���������������������������������������������������������� 448,508 (1,364,902) (12,166)Net change in loans and bills discounted ������������������������������������������ (2,223,331) (5,197,594) (46,328)Net change in deposits ���������������������������������������������������������������������� 7,646,207 7,287,109 64,953 Net change in negotiable certificates of deposit �������������������������������� 442,445 (2,367,722) (21,105)Net change in borrowed money (excluding subordinated borrowings) ��������������������������������������������������������������������������������������� (1,119,170) 1,800,886 16,052
Net change in deposits with banks ���������������������������������������������������� 849,019 837,507 7,465 Net change in call loans and bills bought and others ������������������������ 157,822 (1,198,782) (10,685)Net change in receivables under securities borrowing transactions�� (1,495,854) (787,472) (7,019)Net change in call money and bills sold and others �������������������������� (3,838,358) 1,895,762 16,898 Net change in commercial paper ������������������������������������������������������� (346,866) (654,552) (5,834)Net change in payables under securities lending transactions ���������� (2,524,215) 2,135,651 19,036 Net change in foreign exchanges (assets) ����������������������������������������� 314,707 (144,713) (1,290)Net change in foreign exchanges (liabilities) �������������������������������������� (22,636) (400,001) (3,565)Net change in lease receivables and investment assets �������������������� (41,649) (53,854) (480)Net change in short-term bonds (liabilities) ��������������������������������������� (99,500) (145,700) (1,299)Issuance and redemption of bonds (excluding subordinated bonds) ����� 420,778 1,109,521 9,890 Net change in due to trust account ���������������������������������������������������� 226,408 236,434 2,107 Interest received ��������������������������������������������������������������������������������� 1,875,947 1,911,477 17,038 Interest paid ��������������������������������������������������������������������������������������� (438,246) (536,129) (4,779)Other, net �������������������������������������������������������������������������������������������� (649,079) (523,175) (4,663)Subtotal ���������������������������������������������������������������������������������������������� (832,332) 4,856,646 43,289 Income taxes paid ������������������������������������������������������������������������������ (294,976) (342,268) (3,051)
Net cash provided by (used in) operating activities �������������������������������� (1,127,308) 4,514,377 40,239
010_0800801372908.indd 125 2017/08/07 14:04:33
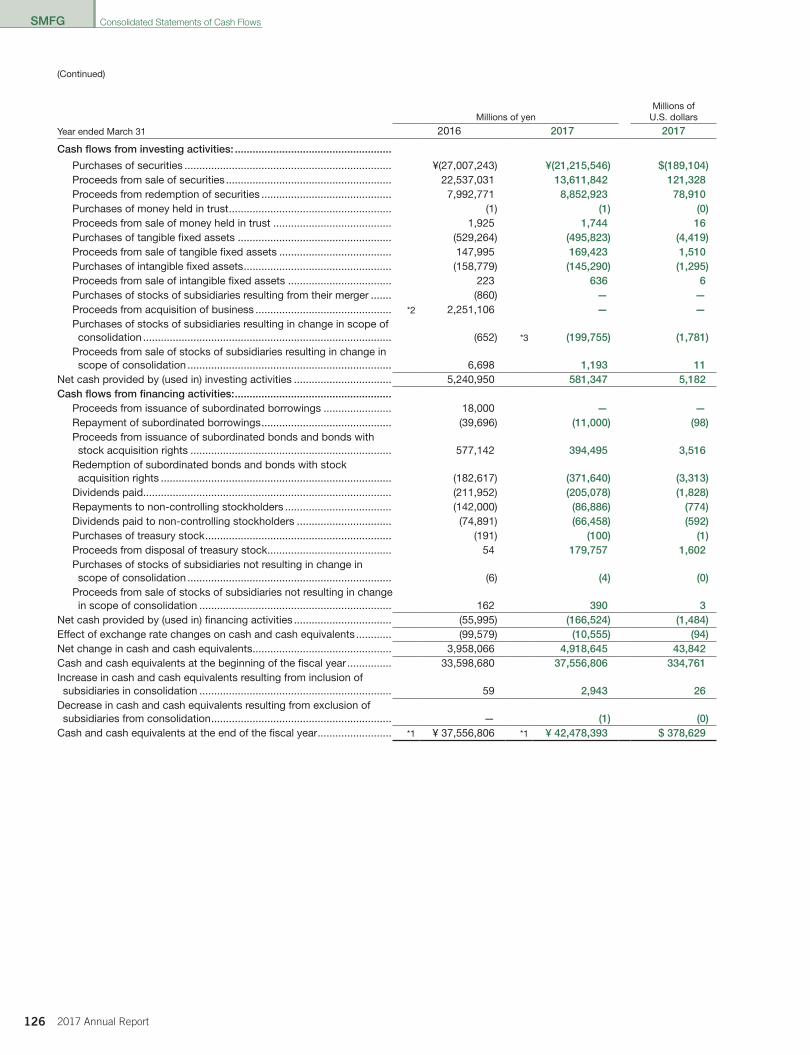
SMFG
126 2017 Annual Report
Millions of yenMillions of
U�S� dollars
Year ended March 31 2016 2017 2017
Cash flows from investing activities: ..................................................... Purchases of securities ���������������������������������������������������������������������� ¥(27,007,243) ¥(21,215,546) $(189,104)Proceeds from sale of securities �������������������������������������������������������� 22,537,031 13,611,842 121,328 Proceeds from redemption of securities �������������������������������������������� 7,992,771 8,852,923 78,910 Purchases of money held in trust ������������������������������������������������������� (1) (1) (0)Proceeds from sale of money held in trust ���������������������������������������� 1,925 1,744 16 Purchases of tangible fixed assets ���������������������������������������������������� (529,264) (495,823) (4,419)Proceeds from sale of tangible fixed assets �������������������������������������� 147,995 169,423 1,510 Purchases of intangible fixed assets �������������������������������������������������� (158,779) (145,290) (1,295)Proceeds from sale of intangible fixed assets ����������������������������������� 223 636 6 Purchases of stocks of subsidiaries resulting from their merger ������� (860) — —Proceeds from acquisition of business ���������������������������������������������� *2 2,251,106 — —Purchases of stocks of subsidiaries resulting in change in scope of consolidation ������������������������������������������������������������������������������������ (652) *3 (199,755) (1,781)
Proceeds from sale of stocks of subsidiaries resulting in change in scope of consolidation ��������������������������������������������������������������������� 6,698 1,193 11
Net cash provided by (used in) investing activities ��������������������������������� 5,240,950 581,347 5,182Cash flows from financing activities: .....................................................
Proceeds from issuance of subordinated borrowings ����������������������� 18,000 — —Repayment of subordinated borrowings �������������������������������������������� (39,696) (11,000) (98)Proceeds from issuance of subordinated bonds and bonds with stock acquisition rights �������������������������������������������������������������������� 577,142 394,495 3,516
Redemption of subordinated bonds and bonds with stock acquisition rights ������������������������������������������������������������������������������ (182,617) (371,640) (3,313)
Dividends paid������������������������������������������������������������������������������������ (211,952) (205,078) (1,828)Repayments to non-controlling stockholders ������������������������������������ (142,000) (86,886) (774)Dividends paid to non-controlling stockholders �������������������������������� (74,891) (66,458) (592)Purchases of treasury stock ��������������������������������������������������������������� (191) (100) (1)Proceeds from disposal of treasury stock ������������������������������������������ 54 179,757 1,602 Purchases of stocks of subsidiaries not resulting in change in scope of consolidation ��������������������������������������������������������������������� (6) (4) (0)
Proceeds from sale of stocks of subsidiaries not resulting in change in scope of consolidation ����������������������������������������������������������������� 162 390 3
Net cash provided by (used in) financing activities ��������������������������������� (55,995) (166,524) (1,484)Effect of exchange rate changes on cash and cash equivalents ������������ (99,579) (10,555) (94)Net change in cash and cash equivalents ����������������������������������������������� 3,958,066 4,918,645 43,842 Cash and cash equivalents at the beginning of the fiscal year ��������������� 33,598,680 37,556,806 334,761 Increase in cash and cash equivalents resulting from inclusion of subsidiaries in consolidation ����������������������������������������������������������������� 59 2,943 26
Decrease in cash and cash equivalents resulting from exclusion of subsidiaries from consolidation ������������������������������������������������������������� — (1) (0)
Cash and cash equivalents at the end of the fiscal year ������������������������� *1 ¥ 37,556,806 *1 ¥ 42,478,393 $ 378,629
(Continued)
Consolidated Statements of Cash Flows
010_0800801372908.indd 126 2017/08/07 14:04:33
SMFG
1272017 Annual Report
Notes to Consolidated Financial StatementsSumitomo Mitsui Financial Group, Inc� and Subsidiaries
Sumitomo Mitsui Financial Group, Inc. (“SMFG”) was established on December 2, 2002 as a holding company for the SMFG group through a
statutory share transfer (kabushiki iten) of all of the outstanding equity securities of Sumitomo Mitsui Banking Corporation (“SMBC”) in
exchange for SMFG’s newly issued securities. SMFG is a joint stock corporation with limited liability (Kabushiki Kaisha) incorporated under the
Companies Act of Japan. Upon formation of SMFG and completion of the statutory share transfer, SMBC became a direct wholly owned
subsidiary of SMFG.
SMFG has prepared the accompanying consolidated financial statements in accordance with the provisions set forth in the Japanese
Financial Instruments and Exchange Act and its related accounting regulations, and in conformity with accounting principles generally
accepted in Japan (“Japanese GAAP”), which are different in certain respects as to application and disclosure requirements from International
Financial Reporting Standards (“IFRS”).
The accounts of overseas subsidiaries and affiliated companies, are, in principle, integrated with those of SMFG’s accounting policies for
purposes of consolidation unless they apply different accounting principles and standards as required under U.S. GAAP or IFRS, in which case
a certain limited number of items are adjusted based on their materiality.
These consolidated financial statements are translated from the consolidated financial statements contained in the annual securities report
filed under the Financial Instrument and Exchange Act of Japan (“FIEA based financial statements”) except for the addition of the non-
consolidated financial statements and US dollar figures.
Amounts less than 1 million yen have been rounded down. As a result, the totals in Japanese yen shown in the financial statements do not
necessarily agree with the sum of the individual amounts.
The translation of the Japanese yen amounts into U.S. dollars is included solely for the convenience of readers outside Japan, using the
prevailing exchange rate at March 31, 2017 which was ¥112.19 to US$1. These translations should not be construed as representations that the
Japanese yen amounts have been, could have been, or could in the future be, converted into U.S. dollars at that rate.
(Basis of presentation)
010_0800801372908.indd 127 2017/08/07 14:04:33
SMFG
128 2017 Annual Report
As of and for the years ended March 31, 2016 and 2017
(Significant accounting policies for preparing consolidated financial statements)1. Scope of consolidation
(1) Consolidated subsidiaries The number of consolidated subsidiaries at March 31, 2017 is 354. Principal companies: Sumitomo Mitsui Banking Corporation (“SMBC”) SMBC Trust Bank Ltd. (“SMBC Trust”) Sumitomo Mitsui Finance and Leasing Company, Limited (“SMFL”) SMBC Nikko Securities Inc. (“SMBC Nikko”) SMBC Friend Securities Co., Ltd. (“SMBC Friend”) Sumitomo Mitsui Card Company, Limited (“SMCC”) Cedyna Financial Corporation (“Cedyna”) SMBC Consumer Finance Co., Ltd. (“SMBCCF”) The Japan Research Institute, Limited Sumitomo Mitsui Asset Management Company, Limited (“SMAM”) THE MINATO BANK, LTD. (“MINATO”) Kansai Urban Banking Corporation (“KUBC”) Sumitomo Mitsui Banking Corporation Europe Limited Sumitomo Mitsui Banking Corporation (China) Limited SMBC Guarantee Co., Ltd. SMBC Capital Markets, Inc.
Changes in the consolidated subsidiaries in the fiscal year ended March 31, 2017 are as follows:SMAM, SMFL Capital Company, Limited and 60 other companies were newly included in the scope of consolidation as a result of
the acquisition of stocks and for other reasons.SAKURA CARD CO., Ltd. and 48 other companies were excluded from the scope of consolidation as they ceased to be subsidiaries
due to merger and for other reasons.(2) Unconsolidated subsidiaries Principal company: SBCS Co., Ltd.
169 unconsolidated subsidiaries are operators of silent partnerships for lease transactions and their assets and profits/losses do not belong to them substantially. Therefore, they have been excluded from the scope of consolidation pursuant to Article 5 Paragraph 1 Item 2 of Ordinance on Terminology, Forms and Preparation Methods of Consolidated Financial Statements.
Other unconsolidated subsidiaries are also excluded from the scope of consolidation because their total amounts in terms of total assets, ordinary income, net income and retained earnings are immaterial, as such, they do not hinder a rational judgment of SMFG’s financial position and results of operations when excluded from the scope of consolidation.
2. Application of the equity method(1) Unconsolidated subsidiaries accounted for by the equity method The number of unconsolidated subsidiaries accounted for by the equity method at March 31, 2017 is 5.
Principal company: SBCS Co., Ltd.(2) Affiliates accounted for by the equity method The number of equity method affiliates accounted for by the equity method at March 31, 2017 is 49. Principal companies: PT Bank Tabungan Pensiunan Nasional Tbk. Sumitomo Mitsui Auto Service Company, Limited Daiwa SB Investments Ltd.
Changes in the equity method affiliates in the fiscal year ended March 31, 2017 are as follows:2 companies newly became equity method affiliates due to an increase in the percentage of their voting rights and for other reasons.SMAM and 6 other companies were excluded from the scope of equity method affiliates as they became subsidiaries due to
acquisition of stocks and for other reasons.
Notes to Consolidated Financial Statements
010_0800801372908.indd 128 2017/08/07 14:04:33

SMFG
1292017 Annual Report
(3) Unconsolidated subsidiaries that are not accounted for by the equity method 169 unconsolidated subsidiaries that are not accounted for by the equity method are operators of silent partnerships for lease transactions and their assets and profits/losses do not belong to them substantially. Therefore, they have not been accounted for by the equity method pursuant to Article 10 Paragraph 1 Item 2 of Ordinance on Terminology, Forms and Preparation Methods of Consolidated Financial Statements.
(4) Affiliates that are not accounted for by the equity methodPrincipal company: Daiwa SB Investments (USA) Ltd.Affiliates that are not accounted for by the equity method are also excluded from the scope of equity method because their total
amounts in terms of net income and retained earnings are immaterial, and as such, they do not hinder a rational judgment of SMFG’s financial position and results of operations when excluded from the scope of equity method.
3. The balance sheet dates of consolidated subsidiaries (1) The balance sheet dates of the consolidated subsidiaries at March 31, 2017 are as follows:
May 31................................... 1June 30 .................................. 9July 31 ................................... 1September 30 ......................... 7October 31 ............................. 3November 30 ......................... 3December 31 .......................... 156January 31 ............................. 16February 28 ............................ 8March 31 ............................... 150
(2) The subsidiaries with balance sheets dated May 31, June 30, July 31, September 30 and November 30 are consolidated using the financial statements as of March 31. The subsidiaries with balance sheets dated October 31 are consolidated using the financial statements as of January 31. Certain subsidiaries with balance sheets dated December 31 and January 31 are consolidated using the financial statements as of March 31. Other subsidiaries are consolidated using the financial statements as of their respective balance sheet dates.
Appropriate adjustments were made to material transactions during the periods between their respective balance sheet dates and the consolidated closing date.
4. Accounting policies(1) Standards for recognition and measurement of trading assets/liabilities and trading income/losses
Transactions for trading purposes (seeking gains arising from short-term changes in interest rates, currency exchange rates, or market prices of securities and other market related indices or from variation among markets) are included in “Trading assets” or “Trading liabilities” on the consolidated balance sheets on a trade date basis. Profits and losses on trading-purpose transactions are recognized on a trade date basis, and recorded as “Trading income” and “Trading losses” on the consolidated statements of income.
Securities and monetary claims purchased for trading purposes are stated at the fiscal year-end market value, and financial derivatives such as swaps, futures and options are stated at amounts that would be settled if the transactions were terminated at the consolidated balance sheet date.
“Trading income” and “Trading losses” include interest received or paid during the fiscal year. The year-on-year valuation differences of securities and monetary claims are also recorded in the above-mentioned accounts. As for the derivatives, assuming that the settlement will be made in cash, the year-on-year valuation differences are also recorded in the above-mentioned accounts.
(2) Standards for recognition and measurement of securities1) Debt securities that consolidated subsidiaries have the positive intent and ability to hold to maturity are classified as held-to-
maturity securities and are carried at amortized cost (straight-line method) using the moving-average method. Investments in unconsolidated subsidiaries and affiliates that are not accounted for by the equity method are carried at cost using the moving-average method. Securities other than trading purpose securities, held-to-maturity securities and investments in unconsolidated subsidiaries and affiliates are classified as “Other securities” (available-for-sale securities). Stocks (including foreign stocks) in Other securities are carried at their average market prices during the final month of the fiscal year, and bonds and others are carried at their fiscal year-end market prices (cost of securities sold is calculated using primarily the moving-average method). Other securities which are extremely difficult to determine fair value are carried at cost using the moving-average method.
Net unrealized gains (losses) on other securities, net of income taxes, are included in “Net assets.”2) Securities included in “Money held in trust” are carried in the same method as in (1) and (2), 1) above.
(3) Standards for recognition and measurement of derivative transactionsDerivative transactions, excluding those classified as trading derivatives, are carried at fair value.
Notes to Consolidated Financial Statements
010_0800801372908.indd 129 2017/08/07 14:04:33
SMFG
130 2017 Annual Report
(4) Depreciation1) Tangible fixed assets (excluding assets for rent and lease assets)
Buildings owned by SMFG and SMBC are depreciated using the straight-line method. Others are depreciated using the declining-balance method. The estimated useful lives of major items are as follows:
Buildings: 7 to 50 yearsOthers: 2 to 20 yearsOther consolidated subsidiaries depreciate tangible fixed assets primarily using the straight-line method over the estimated useful
lives of the respective assets.2) Intangible fixed assets
Intangible fixed assets are depreciated using the straight-line method. Capitalized software for internal use owned by SMFG and its consolidated domestic subsidiaries is depreciated over its estimated useful life (5 to 10 years).
3) Assets for rentAssets for rent are depreciated using the straight-line method, assuming that lease terms are, in principle, their depreciation period and the salvage is estimated disposal value when the lease period expires.
4) Lease assets Lease assets with respect to non-transfer ownership finance leases, which are recorded in “Tangible fixed assets,” are depreciated using the straight-line method, assuming that lease terms are their expected lifetime and salvage values are zero.
(5) Reserve for possible loan losses The reserve for possible loan losses of major consolidated subsidiaries is provided as detailed below in accordance with the internal standards for write-offs and provisions.
For claims on borrowers that have entered into bankruptcy, special liquidation proceedings or similar legal proceedings (“bankrupt borrowers”) or borrowers that are not legally or formally insolvent but are regarded as substantially in the same situation (“effectively bankrupt borrowers”), a reserve is provided based on the amount of claims, after the write-off stated below, net of the expected amount of recoveries from collateral and guarantees. For claims on borrowers that are not currently bankrupt but are perceived to have a high risk of falling into bankruptcy (“potentially bankrupt borrowers”), a reserve is provided in the amount deemed necessary based on an overall solvency assessment of the borrowers, net of the expected amount of recoveries from collateral and guarantees.
Discounted Cash Flows (“DCF”) method is used for claims on borrowers whose cash flows from collection of principals and interest can be rationally estimated and SMBC applies it to claims on large potentially bankrupt borrowers and claims on large borrowers requiring close monitoring that have been classified as “Past due loans (3 months or more)” or “Restructured loans,” whose total loans from SMBC exceed a certain amount. SMBC establishes a reserve for possible loan losses using the DCF method for such claims in the amount of the difference between the present value of principal and interest (calculated using the rationally estimated cash flows discounted at the initial contractual interest rate) and the book value.
For other claims, a reserve is provided based on the historical loan-loss ratio. For claims originated in specific overseas countries, an additional reserve is provided in the amount deemed necessary based on the assessment of political and economic conditions.
Branches and credit supervision departments assess all claims in accordance with the internal rules for self-assessment of assets, and the Credit Review Department, independent from these operating sections, audits their assessment.
The reserve for possible loan losses of SMFG and other consolidated subsidiaries for general claims is provided in the amount deemed necessary based on the historical loan-loss ratios, and for doubtful claims in the amount deemed uncollectible based on assessment of each claim.
For collateralized or guaranteed claims on bankrupt borrowers and effectively bankrupt borrowers, the amount exceeding the estimated value of collateral and guarantees is deemed to be uncollectible and written off against the total outstanding amount of the claims. The amount of write-off for the years ended March 31, 2016 and 2017 were ¥301,983 million and ¥288,145 million, respectively.
(6) Reserve for employee bonuses The reserve for employee bonuses is provided for payment of bonuses to employees, in the amount of estimated bonuses, which are attributable to the fiscal year.
(7) Reserve for executive bonuses The reserve for executive bonuses is provided for payment of bonuses to executives, in the amount of estimated bonuses, which are attributable to the fiscal year.
(8) Reserve for executive retirement benefits The reserve for executive retirement benefits is provided for payment of retirement benefits to directors, corporate auditors and other executive officers, in the amount deemed accrued at the fiscal year-end based on our internal regulations.
(9) Reserve for point service program The reserve for point service program is provided for the potential future redemption of points awarded to customers under the “SMBC Point Pack,” credit card points programs, and other customer points award programs. The amount is calculated by converting the outstanding points into a monetary amount, and rationally estimating and recognizing the amount that will be redeemed in the future.
Notes to Consolidated Financial Statements
010_0800801372908.indd 130 2017/08/07 14:04:33
SMFG
1312017 Annual Report
(10) Reserve for reimbursement of deposits The reserve for reimbursement of deposits which were derecognized as liabilities under certain conditions is provided for the possible losses on the future claims of withdrawal based on the historical reimbursements.
(11) Reserve for losses on interest repayment The reserve for losses on interest repayment is provided for the possible losses on future claims of repayment of interest based on historical interest repayment experience.
(12) Reserve under the special laws The reserve under the special laws is a reserve for contingent liabilities and provided for compensation for losses from securities related transactions or derivative transactions, pursuant to Article 46-5 of the Financial Instruments and Exchange Act.
(13) Employee retirement benefitsIn calculating the projected benefit obligation, mainly the benefit formula basis is used to calculate the expected benefit attributable to the respective fiscal year.
Unrecognized prior service cost is amortized on a straight-line basis, primarily over 9 years within the employees’ average remaining service period at incurrence.
Unrecognized net actuarial gain (loss) is amortized on a straight-line basis, primarily over 9 years within the employees’ average remaining service period, commencing from the next fiscal year of incurrence.
(14) Translation of foreign currency assets and liabilities Assets and liabilities of SMFG and SMBC denominated in foreign currencies and accounts of SMBC overseas branches are translated into Japanese yen mainly at the exchange rate prevailing at the consolidated balance sheet date, with the exception of stocks of subsidiaries and affiliates translated at rates prevailing at the time of acquisition.
Other consolidated subsidiaries’ assets and liabilities denominated in foreign currencies are translated into Japanese yen at the exchange rate prevailing at their respective balance sheet dates.
(15) Lease transactions 1) Recognition of income on finance leases
Interest income is allocated to each period. 2) Recognition of income on operating leases
Primarily, lease-related income is recognized on a straight-line basis over the full term of the lease, based on the contractual amount of lease fees per month.
3) Recognition of income and expenses on installment sales Primarily, installment-sales-related income and installment-sales-related expenses are recognized on a due-date basis over the full period of the installment sales.
(16) Hedge accounting 1) Hedging against interest rate changes
As for the hedge accounting method applied to hedging transactions for interest rate risk arising from financial assets and liabilities, SMBC applies deferred hedge accounting.
SMBC applies deferred hedge accounting stipulated in “Treatment for Accounting and Auditing of Application of Accounting Standard for Financial Instruments in Banking Industry” (JICPA Industry Audit Committee Report No. 24, February 13, 2002) to portfolio hedges on groups of large-volume, small-value monetary claims and debts.
As for the portfolio hedges to offset market fluctuation, SMBC assesses the effectiveness of such hedges by classifying the hedged items (such as deposits and loans) and the hedging instruments (such as interest rate swaps) by their maturity. As for the portfolio hedges to fix cash flows, SMBC assesses the effectiveness of such hedges by verifying the correlation between the hedged items and the hedging instruments.
As for the individual hedges, SMBC also assesses the effectiveness of such individual hedges. 2) Hedging against currency fluctuations
SMBC applies deferred hedge accounting stipulated in “Treatment of Accounting and Auditing Concerning Accounting for Foreign Currency Transactions in Banking Industry” (JICPA Industry Audit Committee Report No. 25, July 29, 2002) to currency swap and foreign exchange swap transactions executed for the purpose of lending or borrowing funds in different currencies.
Pursuant to JICPA Industry Audit Committee Report No. 25, SMBC assesses the effectiveness of currency swap and foreign exchange swap transactions executed for the purpose of offsetting the risk of changes in currency exchange rates by verifying that there are foreign-currency monetary claims and debts corresponding to the foreign-currency positions.
In order to hedge risk arising from volatility of exchange rates for stocks of subsidiaries and affiliates and other securities (excluding bonds) denominated in foreign currencies, SMBC applies deferred hedge accounting or fair value hedge accounting, on the conditions that the hedged securities are designated in advance and that sufficient on-balance (actual) or off-balance (forward) liability exposure exists to cover the cost of the hedged securities denominated in the same foreign currencies.
3) Hedging against share price fluctuations SMBC applies fair value hedge accounting to individual hedges offsetting the price fluctuation of the shares that are classified under Other securities, and accordingly evaluates the effectiveness of such individual hedges.
Notes to Consolidated Financial Statements
010_0800801372908.indd 131 2017/08/07 14:04:33

SMFG
132 2017 Annual Report
4) Transactions between consolidated subsidiaries As for derivative transactions between consolidated subsidiaries or internal transactions between trading accounts and other accounts (or among internal sections), SMBC manages the interest rate swaps and currency swaps that are designated as hedging instruments in accordance with the non-arbitrary and strict criteria for external transactions stipulated in JICPA Industry Audit Committee Report No. 24 and No. 25. Therefore, SMBC accounts for the gains or losses that arise from interest rate swaps and currency swaps in its earnings or defers them, rather than eliminating them.
Certain other consolidated subsidiaries apply the deferred hedge accounting, fair value hedge accounting or the special treatment for interest rate swaps.
(17) Amortization of goodwill Goodwill is amortized using the straight-line method over a period in which its benefit is expected to be realized, not to exceed 20 years. Immaterial goodwill is charged or credited to income directly when incurred.
(18) Scope of “Cash and cash equivalents” on consolidated statements of cash flowsFor the purposes of presenting the consolidated statements of cash flows, “Cash and cash equivalents” are cash on hand, non-interest earning deposits with banks and deposits with the Bank of Japan.
(19) Consumption taxes National and local consumption taxes of SMFG and its consolidated domestic subsidiaries are accounted for using the tax-excluded method.
(Changes in accounting policies)In accordance with the revision to the Corporation Tax Act, some domestic consolidated subsidiaries apply the “Practical Solution on a change in depreciation method due to Tax Reform 2016” (ASBJ Practical Issues Task Force No.32, issued on June 17, 2016) and changed the depreciation method for accompanying facilities to buildings and structures acquired on or after April 1, 2016 from the declining-balance method to the straight-line method, starting from the fiscal year ended March 31, 2017. Effects of this change to Ordinary Profit and Income before income taxes during the fiscal year ended March 31, 2017 are immaterial.
(Additional information)Recoverability of Deferred Tax AssetsSMFG applies the “Implementation Guidance on Recoverability of Deferred Tax Assets” (ASBJ Guidance No.26 issued on March 28, 2016) from the fiscal year ended March 31, 2017.
Adoption of the consolidated corporate-tax systemSMFG applies the “Practical Solution on Tentative Treatment of Tax Effect Accounting under Consolidated Taxation System (Part 1)” (ASBJ Practical Issues Task Force No.5, issued on January 16, 2015) and “Practical Solution on Tentative Treatment of Tax Effect Accounting under Consolidated Taxation System (Part 2)” (ASBJ Practical Issues Task Force No.7, issued on January 16, 2015) from fiscal year ended March 31, 2017 on the premise that SMFG file a tax return as a consolidated entity, since the Commissioner of the National Tax Agency has approved the adoption of the consolidated corporate-tax system by SMFG and some consolidated subsidiaries starting from fiscal year ended March 31, 2018.
Notes to Consolidated Financial Statements
010_0800801372908.indd 132 2017/08/07 14:04:33

SMFG
1332017 Annual Report
(Notes to consolidated balance sheets)*1 Japanese stocks and investments in unconsolidated subsidiaries and affiliates
Japanese stocks and investments in unconsolidated subsidiaries and affiliates at March 31, 2016 and 2017 were as follows:
Millions of yenMarch 31 2016 2017Japanese stocks ................................................................................................................. ¥609,830 ¥603,177Investments ...................................................................................................................... 592 1,371
Japanese stocks of jointly controlled entities were as follows: Millions of yen March 31 2016 2017Japanese stocks of jointly controlled entities ..................................................................... ¥104,779 ¥93,717
*2 Unsecured loaned securities for which borrowers have the right to sell or pledgeThe amount of unsecured loaned securities for which borrowers have the right to sell or pledge at March 31, 2016 and 2017 were as follows:
Millions of yenMarch 31 2016 2017Japanese government bonds in “Securities” ....................................................................... ¥900 ¥905
As for the unsecured borrowed securities, securities under resale agreements and securities borrowed with cash collateral with rights to sell or pledge without restrictions, those securities pledged and those securities held without being disposed at March 31, 2016 and 2017 were as follows:
Millions of yen March 31 2016 2017Securities pledged ............................................................................................................. ¥5,245,608 ¥5,977,541Securities held without being disposed ............................................................................. 3,152,831 3,112,106
*3 Bankrupt loans and non-accrual loansBankrupt loans and non-accrual loans at March 31, 2016 and 2017 were as follows:
Millions of yen March 31 2016 2017Bankrupt loans ................................................................................................................. ¥ 44,748 ¥ 34,441Non-accrual loans ............................................................................................................. 594,077 558,855
“Bankrupt loans” are loans, after write-off, to legally bankrupt borrowers as defined in Article 96-1-3 and 96-1-4 of “Order for Enforcement of the Corporation Tax Act” (Cabinet Order No. 97 of 1965) and on which accrued interest income is not recognized as there is substantial doubt about the ultimate collectability of either principal or interest because they are past due for a considerable period of time or for other reasons.
“Non-accrual loans” are loans on which accrued interest income is not recognized, excluding “Bankrupt loans” and loans on which interest payments are deferred in order to support the borrowers’ recovery from financial difficulties.
*4 Past due loans (3 months or more)Past due loans (3 months or more) at March 31, 2016 and 2017 were as follows:
Millions of yen March 31 2016 2017Past due loans (3 months or more) .................................................................................... ¥19,845 ¥22,434
“Past due loans (3 months or more)” are loans on which the principal or interest payment is past due for 3 months or more, excluding “Bankrupt loans” and “Non-accrual loans.”
*5 Restructured loansRestructured loans at March 31, 2016 and 2017 were as follows:
Millions of yen March 31 2016 2017Restructured loans ............................................................................................................ ¥266,698 ¥252,790
“Restructured loans” are loans on which terms and conditions have been amended in favor of the borrowers (e.g. reduction of the original interest rate, deferral of interest payments, extension of principal repayments or debt forgiveness) in order to support the borrowers’ recovery from financial difficulties, excluding “Bankrupt loans,” “Non-accrual loans” and “Past due loans (3 months or more).”
Notes to Consolidated Financial Statements
010_0800801372908.indd 133 2017/08/07 14:04:33
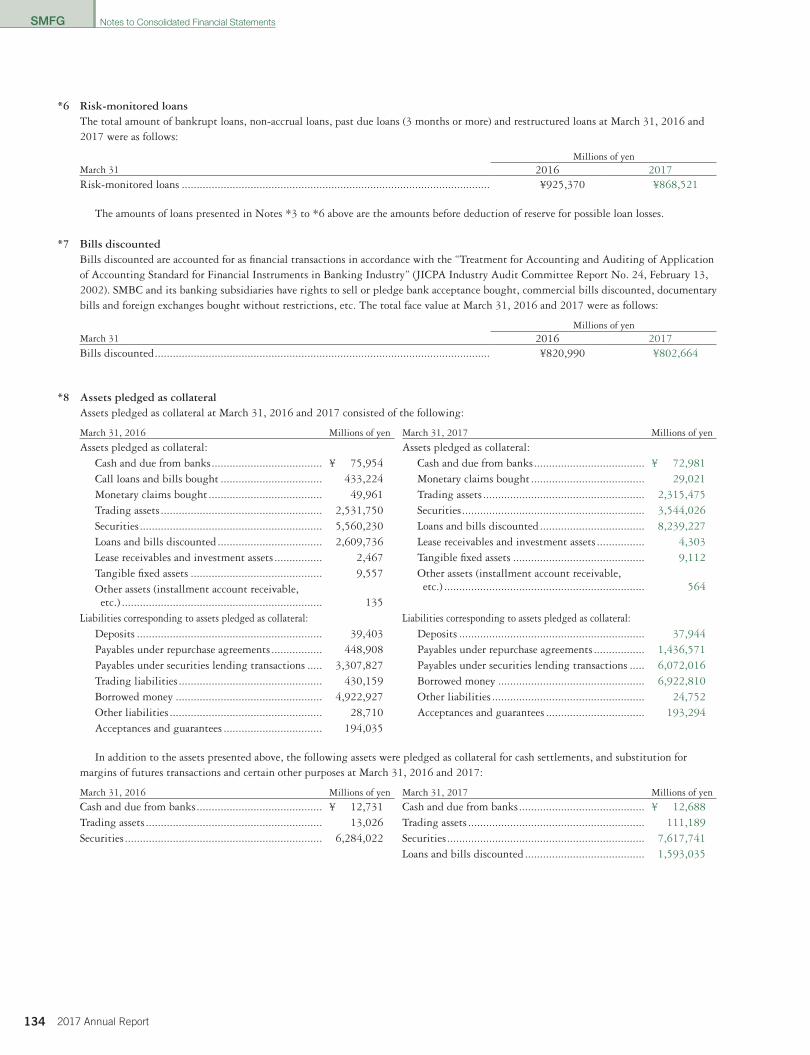
SMFG
134 2017 Annual Report
*6 Risk-monitored loansThe total amount of bankrupt loans, non-accrual loans, past due loans (3 months or more) and restructured loans at March 31, 2016 and 2017 were as follows:
Millions of yen March 31 2016 2017Risk-monitored loans ....................................................................................................... ¥925,370 ¥868,521
The amounts of loans presented in Notes *3 to *6 above are the amounts before deduction of reserve for possible loan losses.
*7 Bills discounted Bills discounted are accounted for as financial transactions in accordance with the “Treatment for Accounting and Auditing of Application of Accounting Standard for Financial Instruments in Banking Industry” (JICPA Industry Audit Committee Report No. 24, February 13, 2002). SMBC and its banking subsidiaries have rights to sell or pledge bank acceptance bought, commercial bills discounted, documentary bills and foreign exchanges bought without restrictions, etc. The total face value at March 31, 2016 and 2017 were as follows:
Millions of yen March 31 2016 2017Bills discounted ................................................................................................................ ¥820,990 ¥802,664
*8 Assets pledged as collateral Assets pledged as collateral at March 31, 2016 and 2017 consisted of the following:
March 31, 2016 Millions of yen March 31, 2017 Millions of yen
Assets pledged as collateral: Cash and due from banks ..................................... ¥ 72,981Monetary claims bought ...................................... 29,021Trading assets ...................................................... 2,315,475Securities ............................................................. 3,544,026Loans and bills discounted ................................... 8,239,227Lease receivables and investment assets ................ 4,303Tangible fixed assets ............................................ 9,112Other assets (installment account receivable, etc.) ................................................................... 564
Liabilities corresponding to assets pledged as collateral:Deposits .............................................................. 37,944Payables under repurchase agreements ................. 1,436,571Payables under securities lending transactions ..... 6,072,016Borrowed money ................................................. 6,922,810Other liabilities ................................................... 24,752Acceptances and guarantees ................................. 193,294
Assets pledged as collateral: Cash and due from banks ..................................... ¥ 75,954Call loans and bills bought .................................. 433,224Monetary claims bought ...................................... 49,961Trading assets ...................................................... 2,531,750Securities ............................................................. 5,560,230Loans and bills discounted ................................... 2,609,736Lease receivables and investment assets ................ 2,467Tangible fixed assets ............................................ 9,557Other assets (installment account receivable, etc.) ................................................................... 135
Liabilities corresponding to assets pledged as collateral:Deposits .............................................................. 39,403Payables under repurchase agreements ................. 448,908Payables under securities lending transactions ..... 3,307,827Trading liabilities ................................................ 430,159Borrowed money ................................................. 4,922,927Other liabilities ................................................... 28,710Acceptances and guarantees ................................. 194,035
In addition to the assets presented above, the following assets were pledged as collateral for cash settlements, and substitution for margins of futures transactions and certain other purposes at March 31, 2016 and 2017:
March 31, 2016 Millions of yen March 31, 2017 Millions of yen
Cash and due from banks .......................................... ¥ 12,731 Cash and due from banks .......................................... ¥ 12,688Trading assets ........................................................... 13,026 Trading assets ........................................................... 111,189Securities .................................................................. 6,284,022 Securities .................................................................. 7,617,741
Loans and bills discounted ........................................ 1,593,035
Notes to Consolidated Financial Statements
010_0800801372908.indd 134 2017/08/07 14:04:33
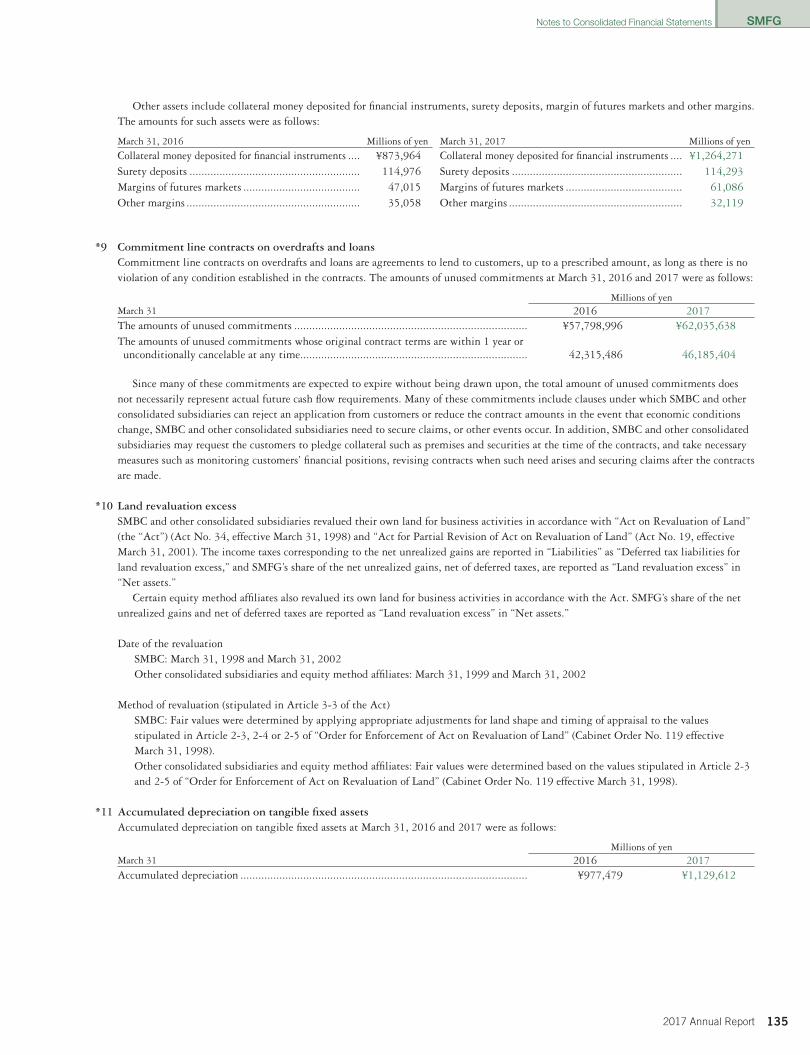
SMFG
1352017 Annual Report
Other assets include collateral money deposited for financial instruments, surety deposits, margin of futures markets and other margins. The amounts for such assets were as follows:
March 31, 2016 Millions of yen March 31, 2017 Millions of yen
Collateral money deposited for financial instruments .... ¥873,964 Collateral money deposited for financial instruments .... ¥1,264,271Surety deposits ......................................................... 114,976 Surety deposits ......................................................... 114,293Margins of futures markets ....................................... 47,015 Margins of futures markets ....................................... 61,086Other margins .......................................................... 35,058 Other margins .......................................................... 32,119
*9 Commitment line contracts on overdrafts and loansCommitment line contracts on overdrafts and loans are agreements to lend to customers, up to a prescribed amount, as long as there is no violation of any condition established in the contracts. The amounts of unused commitments at March 31, 2016 and 2017 were as follows:
Millions of yen March 31 2016 2017The amounts of unused commitments .............................................................................. ¥57,798,996 ¥62,035,638The amounts of unused commitments whose original contract terms are within 1 year or unconditionally cancelable at any time............................................................................ 42,315,486 46,185,404
Since many of these commitments are expected to expire without being drawn upon, the total amount of unused commitments does not necessarily represent actual future cash flow requirements. Many of these commitments include clauses under which SMBC and other consolidated subsidiaries can reject an application from customers or reduce the contract amounts in the event that economic conditions change, SMBC and other consolidated subsidiaries need to secure claims, or other events occur. In addition, SMBC and other consolidated subsidiaries may request the customers to pledge collateral such as premises and securities at the time of the contracts, and take necessary measures such as monitoring customers’ financial positions, revising contracts when such need arises and securing claims after the contracts are made.
*10 Land revaluation excessSMBC and other consolidated subsidiaries revalued their own land for business activities in accordance with “Act on Revaluation of Land” (the “Act”) (Act No. 34, effective March 31, 1998) and “Act for Partial Revision of Act on Revaluation of Land” (Act No. 19, effective March 31, 2001). The income taxes corresponding to the net unrealized gains are reported in “Liabilities” as “Deferred tax liabilities for land revaluation excess,” and SMFG’s share of the net unrealized gains, net of deferred taxes, are reported as “Land revaluation excess” in “Net assets.”
Certain equity method affiliates also revalued its own land for business activities in accordance with the Act. SMFG’s share of the net unrealized gains and net of deferred taxes are reported as “Land revaluation excess” in “Net assets.”
Date of the revaluation SMBC: March 31, 1998 and March 31, 2002 Other consolidated subsidiaries and equity method affiliates: March 31, 1999 and March 31, 2002
Method of revaluation (stipulated in Article 3-3 of the Act) SMBC: Fair values were determined by applying appropriate adjustments for land shape and timing of appraisal to the values stipulated in Article 2-3, 2-4 or 2-5 of “Order for Enforcement of Act on Revaluation of Land” (Cabinet Order No. 119 effective March 31, 1998). Other consolidated subsidiaries and equity method affiliates: Fair values were determined based on the values stipulated in Article 2-3 and 2-5 of “Order for Enforcement of Act on Revaluation of Land” (Cabinet Order No. 119 effective March 31, 1998).
*11 Accumulated depreciation on tangible fixed assetsAccumulated depreciation on tangible fixed assets at March 31, 2016 and 2017 were as follows:
Millions of yen March 31 2016 2017Accumulated depreciation ................................................................................................ ¥977,479 ¥1,129,612
Notes to Consolidated Financial Statements
010_0800801372908.indd 135 2017/08/07 14:04:33

SMFG
136 2017 Annual Report
*12 Deferred gain on tangible fixed assets deductible for tax purposesDeferred gain on tangible fixed assets deductible for tax purposes at March 31, 2016 and 2017 were as follows:
Millions of yen March 31 2016 2017Deferred gain on tangible fixed assets deductible for tax purposes ..................................... ¥62,665 ¥63,213
[The consolidated fiscal year concerned] ....................................................................... [—] [1,813]
*13 Subordinated borrowingsThe balance of subordinated borrowings with the special clause specifying that the repayment order of the borrowing subordinate to other borrowings included in “Borrowed money” at March 31, 2016 and 2017 were as follows:
Millions of yen March 31 2016 2017Subordinated borrowings .................................................................................................. ¥295,199 ¥284,200
*14 Subordinated bonds The balance of subordinated bonds included in “Bonds” at March 31, 2016 and 2017 were as follows:
Millions of yen March 31 2016 2017Subordinated bonds .......................................................................................................... ¥2,142,286 ¥2,158,167
*15 Guaranteed amount to privately-placed bonds The amount guaranteed by SMBC and its banking subsidiaries to privately-placed bonds (stipulated by Article 2-3 of the Financial Instruments and Exchange Act) in “Securities” at March 31, 2016 and 2017 were as follows:
Millions of yen March 31 2016 2017Guaranteed amount to privately-placed bonds .................................................................. ¥2,004,096 ¥1,974,118
Notes to Consolidated Financial Statements
010_0800801372908.indd 136 2017/08/07 14:04:33
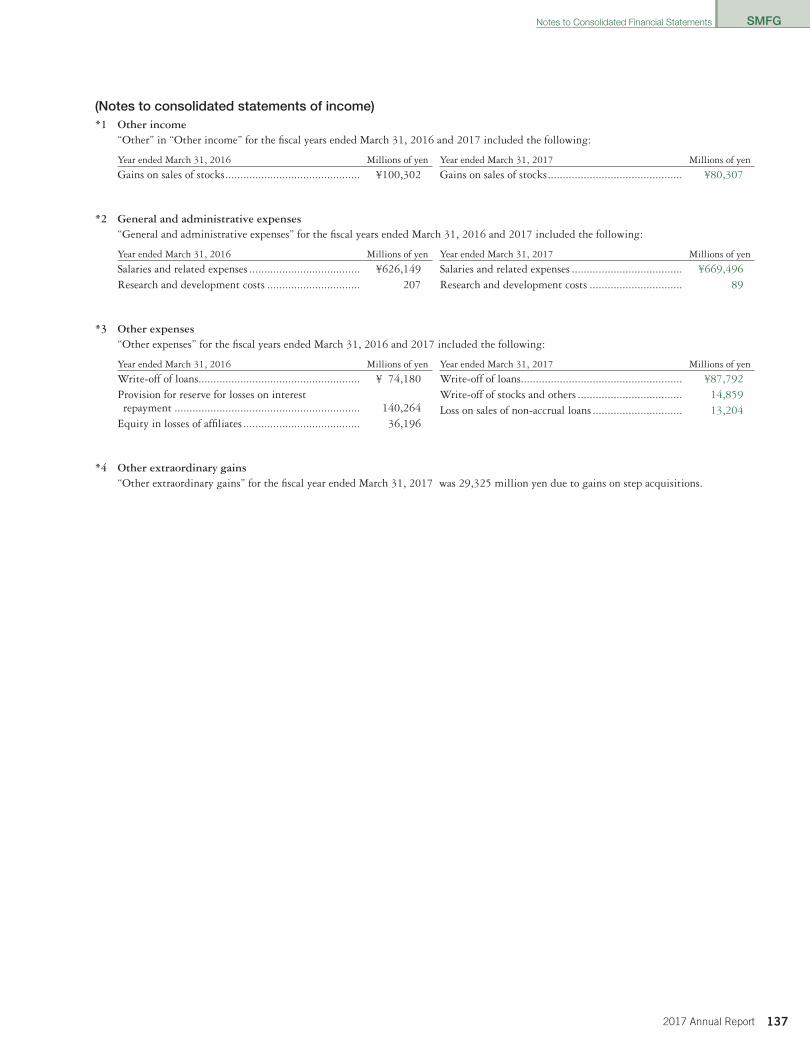
SMFG
1372017 Annual Report
(Notes to consolidated statements of income)*1 Other income
“Other” in “Other income” for the fiscal years ended March 31, 2016 and 2017 included the following:
Year ended March 31, 2016 Millions of yen Year ended March 31, 2017 Millions of yen
Gains on sales of stocks ............................................. ¥100,302 Gains on sales of stocks ............................................. ¥80,307
*2 General and administrative expenses“General and administrative expenses” for the fiscal years ended March 31, 2016 and 2017 included the following:
Year ended March 31, 2016 Millions of yen Year ended March 31, 2017 Millions of yen
Salaries and related expenses ..................................... ¥626,149 Salaries and related expenses ..................................... ¥669,496Research and development costs ............................... 207 Research and development costs ............................... 89
*3 Other expenses“Other expenses” for the fiscal years ended March 31, 2016 and 2017 included the following:
Year ended March 31, 2016 Millions of yen Year ended March 31, 2017 Millions of yen
Write-off of loans...................................................... ¥87,792Write-off of stocks and others ................................... 14,859Loss on sales of non-accrual loans .............................. 13,204
Write-off of loans...................................................... ¥ 74,180Provision for reserve for losses on interest repayment .............................................................. 140,264
Equity in losses of affiliates ....................................... 36,196
*4 Other extraordinary gains“Other extraordinary gains” for the fiscal year ended March 31, 2017 was 29,325 million yen due to gains on step acquisitions.
Notes to Consolidated Financial Statements
010_0800801372908.indd 137 2017/08/07 14:04:33
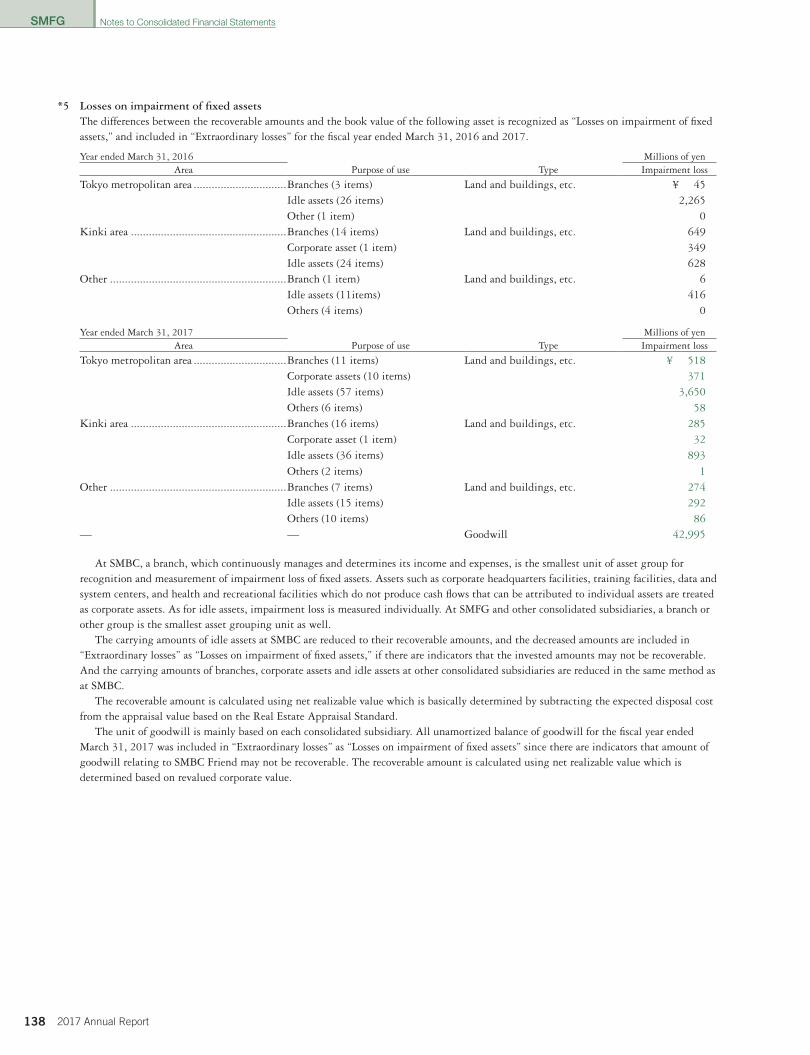
SMFG
138 2017 Annual Report
*5 Losses on impairment of fixed assetsThe differences between the recoverable amounts and the book value of the following asset is recognized as “Losses on impairment of fixed assets,” and included in “Extraordinary losses” for the fiscal year ended March 31, 2016 and 2017.
Year ended March 31, 2016 Millions of yenArea Purpose of use Type Impairment loss
Tokyo metropolitan area ...............................Branches (3 items) Land and buildings, etc. ¥ 45 Idle assets (26 items) 2,265
Other (1 item) 0Kinki area ....................................................Branches (14 items) Land and buildings, etc. 649
Corporate asset (1 item) 349Idle assets (24 items) 628
Other ...........................................................Branch (1 item) Land and buildings, etc. 6 Idle assets (11items) 416 Others (4 items) 0
Year ended March 31, 2017 Millions of yenArea Purpose of use Type Impairment loss
Tokyo metropolitan area ...............................Branches (11 items) Land and buildings, etc. ¥ 518Corporate assets (10 items) 371Idle assets (57 items) 3,650Others (6 items) 58
Kinki area ....................................................Branches (16 items) Land and buildings, etc. 285Corporate asset (1 item) 32Idle assets (36 items) 893Others (2 items) 1
Other ...........................................................Branches (7 items) Land and buildings, etc. 274Idle assets (15 items) 292Others (10 items) 86
— — Goodwill 42,995
At SMBC, a branch, which continuously manages and determines its income and expenses, is the smallest unit of asset group for recognition and measurement of impairment loss of fixed assets. Assets such as corporate headquarters facilities, training facilities, data and system centers, and health and recreational facilities which do not produce cash flows that can be attributed to individual assets are treated as corporate assets. As for idle assets, impairment loss is measured individually. At SMFG and other consolidated subsidiaries, a branch or other group is the smallest asset grouping unit as well.
The carrying amounts of idle assets at SMBC are reduced to their recoverable amounts, and the decreased amounts are included in “Extraordinary losses” as “Losses on impairment of fixed assets,” if there are indicators that the invested amounts may not be recoverable. And the carrying amounts of branches, corporate assets and idle assets at other consolidated subsidiaries are reduced in the same method as at SMBC.
The recoverable amount is calculated using net realizable value which is basically determined by subtracting the expected disposal cost from the appraisal value based on the Real Estate Appraisal Standard.
The unit of goodwill is mainly based on each consolidated subsidiary. All unamortized balance of goodwill for the fiscal year ended March 31, 2017 was included in “Extraordinary losses” as “Losses on impairment of fixed assets” since there are indicators that amount of goodwill relating to SMBC Friend may not be recoverable. The recoverable amount is calculated using net realizable value which is determined based on revalued corporate value.
Notes to Consolidated Financial Statements
010_0800801372908.indd 138 2017/08/07 14:04:33
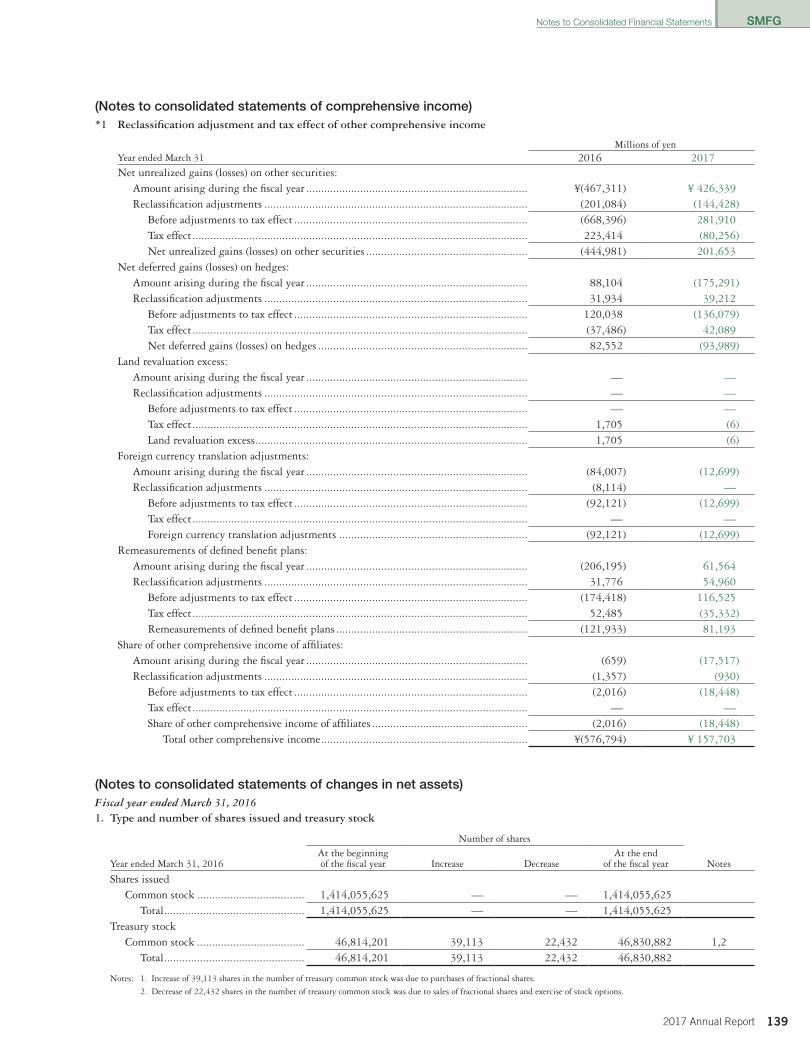
SMFG
1392017 Annual Report
(Notes to consolidated statements of comprehensive income)*1 Reclassification adjustment and tax effect of other comprehensive income
Millions of yenYear ended March 31 2016 2017Net unrealized gains (losses) on other securities:
Amount arising during the fiscal year .......................................................................... ¥(467,311) ¥ 426,339Reclassification adjustments ........................................................................................ (201,084) (144,428)
Before adjustments to tax effect .............................................................................. (668,396) 281,910Tax effect ................................................................................................................ 223,414 (80,256)Net unrealized gains (losses) on other securities ...................................................... (444,981) 201,653
Net deferred gains (losses) on hedges:Amount arising during the fiscal year .......................................................................... 88,104 (175,291)Reclassification adjustments ........................................................................................ 31,934 39,212
Before adjustments to tax effect .............................................................................. 120,038 (136,079)Tax effect ................................................................................................................ (37,486) 42,089Net deferred gains (losses) on hedges ...................................................................... 82,552 (93,989)
Land revaluation excess:Amount arising during the fiscal year .......................................................................... — —Reclassification adjustments ........................................................................................ — —
Before adjustments to tax effect .............................................................................. — —Tax effect ................................................................................................................ 1,705 (6)Land revaluation excess ........................................................................................... 1,705 (6)
Foreign currency translation adjustments:Amount arising during the fiscal year .......................................................................... (84,007) (12,699)Reclassification adjustments ........................................................................................ (8,114) —
Before adjustments to tax effect .............................................................................. (92,121) (12,699)Tax effect ................................................................................................................ — —Foreign currency translation adjustments ............................................................... (92,121) (12,699)
Remeasurements of defined benefit plans:Amount arising during the fiscal year .......................................................................... (206,195) 61,564Reclassification adjustments ........................................................................................ 31,776 54,960
Before adjustments to tax effect .............................................................................. (174,418) 116,525Tax effect ................................................................................................................ 52,485 (35,332)Remeasurements of defined benefit plans ................................................................ (121,933) 81,193
Share of other comprehensive income of affiliates:Amount arising during the fiscal year .......................................................................... (659) (17,517)Reclassification adjustments ........................................................................................ (1,357) (930)
Before adjustments to tax effect .............................................................................. (2,016) (18,448)Tax effect ................................................................................................................ — —Share of other comprehensive income of affiliates .................................................... (2,016) (18,448)
Total other comprehensive income ..................................................................... ¥(576,794) ¥ 157,703
(Notes to consolidated statements of changes in net assets)Fiscal year ended March 31, 2016 1. Type and number of shares issued and treasury stock
Number of shares
Year ended March 31, 2016At the beginningof the fiscal year Increase Decrease
At the endof the fiscal year Notes
Shares issued Common stock .................................... 1,414,055,625 — — 1,414,055,625
Total ............................................... 1,414,055,625 — — 1,414,055,625Treasury stock
Common stock .................................... 46,814,201 39,113 22,432 46,830,882 1,2Total ............................................... 46,814,201 39,113 22,432 46,830,882
Notes: 1. Increase of 39,113 shares in the number of treasury common stock was due to purchases of fractional shares.
2. Decrease of 22,432 shares in the number of treasury common stock was due to sales of fractional shares and exercise of stock options.
Notes to Consolidated Financial Statements
010_0800801372908.indd 139 2017/08/07 14:04:34
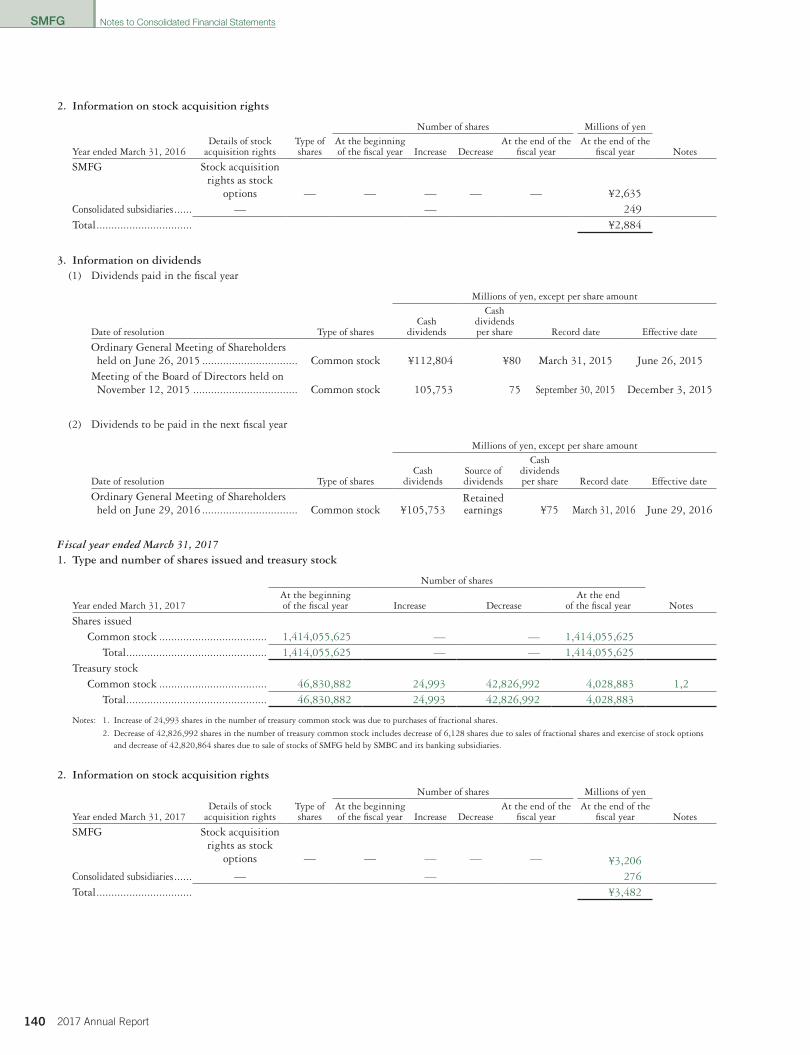
SMFG
140 2017 Annual Report
2. Information on stock acquisition rights
Number of shares Millions of yen
Year ended March 31, 2016Details of stock
acquisition rightsType ofshares
At the beginning of the fiscal year Increase Decrease
At the end of the fiscal year
At the end of the fiscal year Notes
SMFG Stock acquisition rights as stock
options — — — — — ¥2,635Consolidated subsidiaries ...... — — 249Total ................................ ¥2,884
3. Information on dividends (1) Dividends paid in the fiscal year
Date of resolution Type of shares
Millions of yen, except per share amount
Cash dividends
Cash dividendsper share Record date Effective date
Ordinary General Meeting of Shareholders held on June 26, 2015 ................................ Common stock ¥112,804 ¥80 March 31, 2015 June 26, 2015
Meeting of the Board of Directors held on November 12, 2015 ................................... Common stock 105,753 75 September 30, 2015 December 3, 2015
(2) Dividends to be paid in the next fiscal year
Millions of yen, except per share amount
Date of resolution Type of sharesCash
dividendsSource ofdividends
Cash dividendsper share Record date Effective date
Ordinary General Meeting of Shareholders held on June 29, 2016 ................................ Common stock ¥105,753
Retainedearnings ¥75 March 31, 2016 June 29, 2016
Fiscal year ended March 31, 20171. Type and number of shares issued and treasury stock
Number of shares
Year ended March 31, 2017At the beginningof the fiscal year Increase Decrease
At the endof the fiscal year Notes
Shares issued Common stock .................................... 1,414,055,625 — — 1,414,055,625
Total ............................................... 1,414,055,625 — — 1,414,055,625Treasury stock
Common stock .................................... 46,830,882 24,993 42,826,992 4,028,883 1,2Total ............................................... 46,830,882 24,993 42,826,992 4,028,883
Notes: 1. Increase of 24,993 shares in the number of treasury common stock was due to purchases of fractional shares.
2. Decrease of 42,826,992 shares in the number of treasury common stock includes decrease of 6,128 shares due to sales of fractional shares and exercise of stock options and decrease of 42,820,864 shares due to sale of stocks of SMFG held by SMBC and its banking subsidiaries.
2. Information on stock acquisition rightsNumber of shares Millions of yen
Year ended March 31, 2017Details of stock
acquisition rightsType ofshares
At the beginning of the fiscal year Increase Decrease
At the end of the fiscal year
At the end of the fiscal year Notes
SMFG Stock acquisition rights as stock
options — — — — — ¥3,206Consolidated subsidiaries ...... — — 276Total ................................ ¥3,482
Notes to Consolidated Financial Statements
010_0800801372908.indd 140 2017/08/07 14:04:34

SMFG
1412017 Annual Report
3. Information on dividends (1) Dividends paid in the fiscal year
Date of resolution Type of shares
Millions of yen, except per share amount
Cash dividends
Cash dividendsper share Record date Effective date
Ordinary General Meeting of Shareholders held on June 29, 2016 ................................ Common stock ¥105,753 ¥75 March 31, 2016 June 29, 2016
Meeting of the Board of Directors held on November 11, 2016 ................................... Common stock 105,752 75 September 30, 2016 December 2, 2016
(2) Dividends to be paid in the next fiscal year
Millions of yen, except per share amount
Date of resolution Type of sharesCash
dividendsSource ofdividends
Cash dividendsper share Record date Effective date
Ordinary General Meeting of Shareholders held on June 29, 2017 ................................ Common stock ¥105,752
Retainedearnings ¥75 March 31, 2017 June 30, 2017
(Notes to consolidated statements of cash flows)*1 The relation between the amounts of accounts listed on the consolidated financial statements and “Cash and cash equivalents”
Millions of yen
Year ended March 31 2016 2017Cash and due from banks .................................................................................................. ¥42,789,236 ¥46,865,538Interest earning deposits with banks (excluding the deposit with the Bank of Japan) ........ (5,232,430) (4,387,144)Cash and cash equivalents ................................................................................................. ¥37,556,806 ¥42,478,393
*2 The major components of increased assets and liabilities by successionThe major components of increased assets and liabilities due to the integration of the retail banking business of Citibank Japan Ltd. by SMBC Trust and the relation between the acquisition cost of the acquired business and net gains from acquisition of business were as follows;
Year ended March 31, 2016 Millions of yen
Assets ............................................................................................................................... ¥ 2,407,085Cash and due from banks ............................................................................................. 2,296,106
Liabilities ......................................................................................................................... (2,376,561)Deposits ...................................................................................................................... (2,361,907)
Goodwill .......................................................................................................................... 14,476Acquisition cost ................................................................................................................ 45,000Cash and cash equivalents included in acquired asset ........................................................ (2,296,106)Proceeds from acquisition of business ............................................................................... ¥ 2,251,106
*3 The major components of assets and liabilities for entities newly consolidated by stock acquisition and for other reasons The major components of assets and liabilities at the commencement of consolidation due to stock acquisition of SMFL Capital Company, Limited (former name: GE Japan LLC) and 5 other companies by SMFL’s stock acquisition and the relation between the acquisition cost of shares and expenditure to acquire were as follows;
Year ended March 31, 2017 Millions of yen
Assets ............................................................................................................................... ¥ 669,763Lease receivables and investment assets ........................................................................ 394,459
Liabilities ......................................................................................................................... (502,042)Borrowed money ......................................................................................................... (436,526)
Non-controlling interests ................................................................................................. (393)Goodwill .......................................................................................................................... 13,632Acquisition cost of 6 companies ........................................................................................ 180,959Cash and cash equivalents included in acquired assets of 6 companies ............................... (1,015)Expenditure for acquisition of 6 companies ....................................................................... ¥ 179,944
Notes to Consolidated Financial Statements
010_0800801372908.indd 141 2017/08/07 14:04:34

SMFG
142 2017 Annual Report
The major components of assets and liabilities at the commencement of consolidation due to consolidating SMAM and 7 other companies by SMBC’s stock acquisition and the relation between the acquisition cost of shares and expenditure to acquire were as follows;
Year ended March 31, 2017 Millions of yen
Assets ............................................................................................................................... ¥ 50,524Securities ..................................................................................................................... 13,466
Liabilities ......................................................................................................................... (12,516)Non-controlling interests ................................................................................................. (15,203)Goodwill .......................................................................................................................... 38,053Acquisition cost of 8 companies ........................................................................................ 60,858Cash and cash equivalents included in acquired assets of 8 companies ............................... (474)Fair value of SMAM’s common stocks immediately prior to the business combination ...... (40,572)Expenditure for acquisition of 8 companies ....................................................................... ¥ 19,811
(Notes to lease transactions)1. Finance leases
(1) Lessee side 1) Lease assets
(a) Tangible fixed assets Tangible fixed assets mainly consisted of branches and equipment.
(b) Intangible fixed assetsIntangible fixed assets are software.
2) Depreciation method of lease assetsDepreciation method of lease assets is reported in 4. Accounting policies (4) Depreciation.
(2) Lessor side1) Breakdown of lease investment assets
Millions of yen
March 31 2016 2017Lease receivables ...................................................................................................... ¥1,239,009 ¥1,575,535Residual value ......................................................................................................... 120,223 141,815Unearned interest income ........................................................................................ (215,850) (219,854)Total ........................................................................................................................ ¥1,143,383 ¥1,497,496
2) The scheduled collections of lease payments receivable related to lease receivables and investment assets are as follows:
Millions of yen
2016 2017
March 31Lease payments receivable related to lease receivables
Lease payments receivable related to investment
assetsLease payments receivable related to lease receivables
Lease payments receivable related to investment
assets
Within 1 year .............................. ¥297,221 ¥ 320,674 ¥ 307,509 ¥ 423,147More than 1 year to 2 years .......... 209,762 253,931 218,544 342,384More than 2 years to 3 years ........ 149,792 198,762 153,983 272,786More than 3 years to 4 years ........ 91,901 143,147 111,720 190,488More than 4 years to 5 years ........ 65,764 93,905 55,302 116,975More than 5 years ........................ 145,560 228,588 186,669 229,752Total ............................................ ¥960,003 ¥1,239,009 ¥1,033,730 ¥1,575,535
3) Non-transfer ownership finance leases, which commenced in fiscal years beginning before April 1, 2008, are valued at their appropriate book value, net of accumulated depreciation, as of March 31, 2008, and recorded as the beginning balance of “Lease receivables and investment assets.”
Moreover, interest on such non-transfer ownership finance leases during the remaining term of the leases is allocated over the lease term using the straight-line method.
As a result of this accounting treatment, “Income before income taxes” for the fiscal years ended March 31, 2016 and 2017 were ¥1,759 million and ¥1,688 million, respectively, more than it would have been if such transactions had been treated in a similar way to sales of the underlying assets.
Notes to Consolidated Financial Statements
010_0800801372908.indd 142 2017/08/07 14:04:34
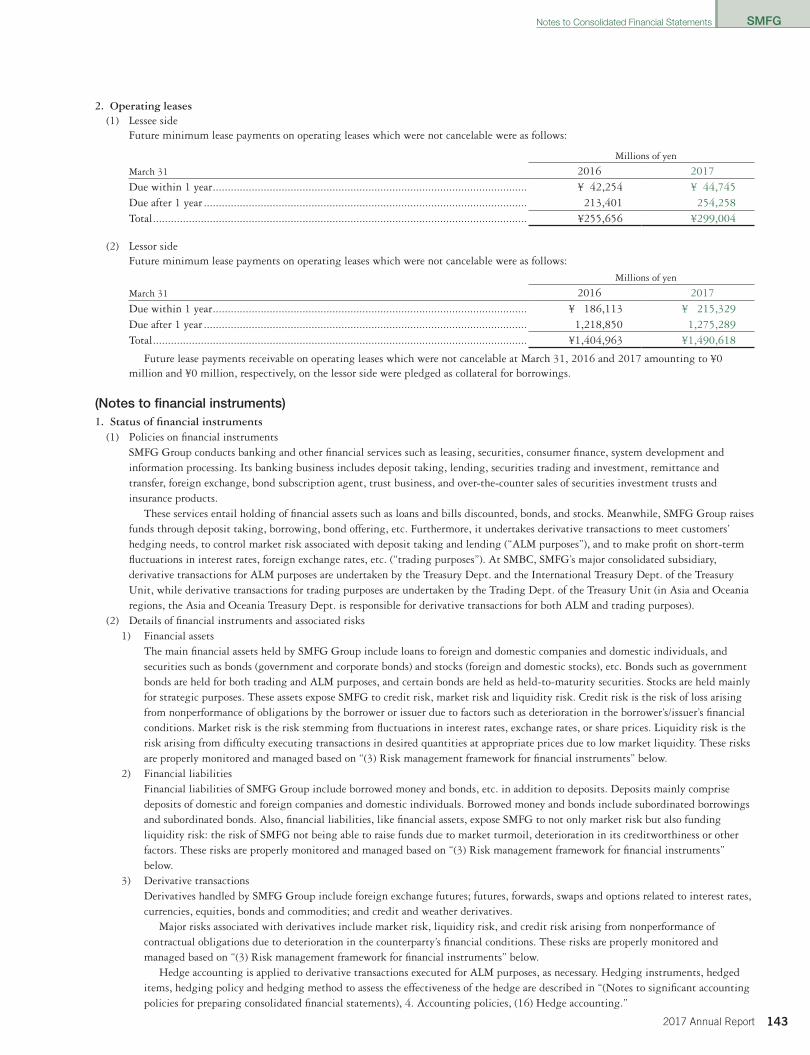
SMFG
1432017 Annual Report
2. Operating leases (1) Lessee side
Future minimum lease payments on operating leases which were not cancelable were as follows:
Millions of yen
March 31 2016 2017Due within 1 year ......................................................................................................... ¥ 42,254 ¥ 44,745Due after 1 year ............................................................................................................ 213,401 254,258Total ............................................................................................................................. ¥255,656 ¥299,004
(2) Lessor sideFuture minimum lease payments on operating leases which were not cancelable were as follows:
Millions of yen
March 31 2016 2017Due within 1 year ......................................................................................................... ¥ 186,113 ¥ 215,329Due after 1 year ............................................................................................................ 1,218,850 1,275,289Total ............................................................................................................................. ¥1,404,963 ¥1,490,618
Future lease payments receivable on operating leases which were not cancelable at March 31, 2016 and 2017 amounting to ¥0 million and ¥0 million, respectively, on the lessor side were pledged as collateral for borrowings.
(Notes to financial instruments) 1. Status of financial instruments
(1) Policies on financial instruments SMFG Group conducts banking and other financial services such as leasing, securities, consumer finance, system development and information processing. Its banking business includes deposit taking, lending, securities trading and investment, remittance and transfer, foreign exchange, bond subscription agent, trust business, and over-the-counter sales of securities investment trusts and insurance products.
These services entail holding of financial assets such as loans and bills discounted, bonds, and stocks. Meanwhile, SMFG Group raises funds through deposit taking, borrowing, bond offering, etc. Furthermore, it undertakes derivative transactions to meet customers’ hedging needs, to control market risk associated with deposit taking and lending (“ALM purposes”), and to make profit on short-term fluctuations in interest rates, foreign exchange rates, etc. (“trading purposes”). At SMBC, SMFG’s major consolidated subsidiary, derivative transactions for ALM purposes are undertaken by the Treasury Dept. and the International Treasury Dept. of the Treasury Unit, while derivative transactions for trading purposes are undertaken by the Trading Dept. of the Treasury Unit (in Asia and Oceania regions, the Asia and Oceania Treasury Dept. is responsible for derivative transactions for both ALM and trading purposes).
(2) Details of financial instruments and associated risks 1) Financial assets
The main financial assets held by SMFG Group include loans to foreign and domestic companies and domestic individuals, and securities such as bonds (government and corporate bonds) and stocks (foreign and domestic stocks), etc. Bonds such as government bonds are held for both trading and ALM purposes, and certain bonds are held as held-to-maturity securities. Stocks are held mainly for strategic purposes. These assets expose SMFG to credit risk, market risk and liquidity risk. Credit risk is the risk of loss arising from nonperformance of obligations by the borrower or issuer due to factors such as deterioration in the borrower’s/issuer’s financial conditions. Market risk is the risk stemming from fluctuations in interest rates, exchange rates, or share prices. Liquidity risk is the risk arising from difficulty executing transactions in desired quantities at appropriate prices due to low market liquidity. These risks are properly monitored and managed based on “(3) Risk management framework for financial instruments” below.
2) Financial liabilities Financial liabilities of SMFG Group include borrowed money and bonds, etc. in addition to deposits. Deposits mainly comprise deposits of domestic and foreign companies and domestic individuals. Borrowed money and bonds include subordinated borrowings and subordinated bonds. Also, financial liabilities, like financial assets, expose SMFG to not only market risk but also funding liquidity risk: the risk of SMFG not being able to raise funds due to market turmoil, deterioration in its creditworthiness or other factors. These risks are properly monitored and managed based on “(3) Risk management framework for financial instruments” below.
3) Derivative transactions Derivatives handled by SMFG Group include foreign exchange futures; futures, forwards, swaps and options related to interest rates, currencies, equities, bonds and commodities; and credit and weather derivatives.
Major risks associated with derivatives include market risk, liquidity risk, and credit risk arising from nonperformance of contractual obligations due to deterioration in the counterparty’s financial conditions. These risks are properly monitored and managed based on “(3) Risk management framework for financial instruments” below.
Hedge accounting is applied to derivative transactions executed for ALM purposes, as necessary. Hedging instruments, hedged items, hedging policy and hedging method to assess the effectiveness of the hedge are described in “(Notes to significant accounting policies for preparing consolidated financial statements), 4. Accounting policies, (16) Hedge accounting.”
Notes to Consolidated Financial Statements
010_0800801372908.indd 143 2017/08/07 14:04:34
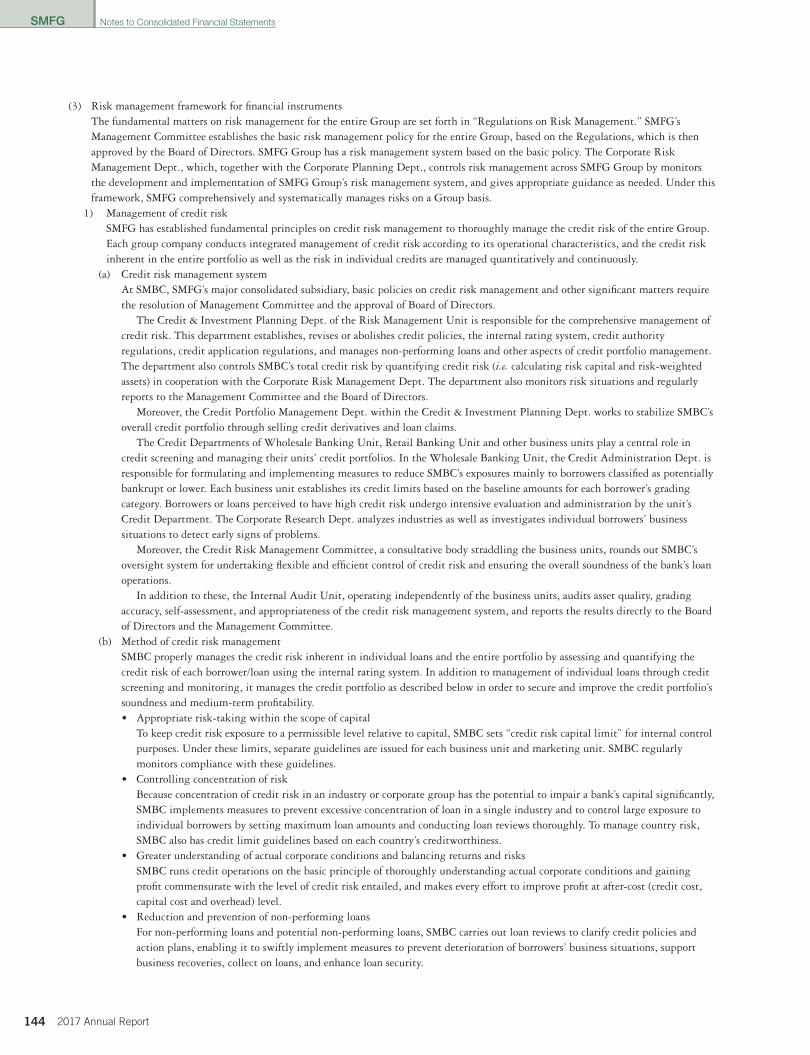
SMFG
144 2017 Annual Report
(3) Risk management framework for financial instrumentsThe fundamental matters on risk management for the entire Group are set forth in “Regulations on Risk Management.” SMFG’s Management Committee establishes the basic risk management policy for the entire Group, based on the Regulations, which is then approved by the Board of Directors. SMFG Group has a risk management system based on the basic policy. The Corporate Risk Management Dept., which, together with the Corporate Planning Dept., controls risk management across SMFG Group by monitors the development and implementation of SMFG Group’s risk management system, and gives appropriate guidance as needed. Under this framework, SMFG comprehensively and systematically manages risks on a Group basis.
1) Management of credit risk SMFG has established fundamental principles on credit risk management to thoroughly manage the credit risk of the entire Group. Each group company conducts integrated management of credit risk according to its operational characteristics, and the credit risk inherent in the entire portfolio as well as the risk in individual credits are managed quantitatively and continuously.
(a) Credit risk management system At SMBC, SMFG’s major consolidated subsidiary, basic policies on credit risk management and other significant matters require the resolution of Management Committee and the approval of Board of Directors.
The Credit & Investment Planning Dept. of the Risk Management Unit is responsible for the comprehensive management of credit risk. This department establishes, revises or abolishes credit policies, the internal rating system, credit authority regulations, credit application regulations, and manages non-performing loans and other aspects of credit portfolio management. The department also controls SMBC’s total credit risk by quantifying credit risk (i.e. calculating risk capital and risk-weighted assets) in cooperation with the Corporate Risk Management Dept. The department also monitors risk situations and regularly reports to the Management Committee and the Board of Directors.
Moreover, the Credit Portfolio Management Dept. within the Credit & Investment Planning Dept. works to stabilize SMBC’s overall credit portfolio through selling credit derivatives and loan claims.
The Credit Departments of Wholesale Banking Unit, Retail Banking Unit and other business units play a central role in credit screening and managing their units’ credit portfolios. In the Wholesale Banking Unit, the Credit Administration Dept. is responsible for formulating and implementing measures to reduce SMBC’s exposures mainly to borrowers classified as potentially bankrupt or lower. Each business unit establishes its credit limits based on the baseline amounts for each borrower’s grading category. Borrowers or loans perceived to have high credit risk undergo intensive evaluation and administration by the unit’s Credit Department. The Corporate Research Dept. analyzes industries as well as investigates individual borrowers’ business situations to detect early signs of problems.
Moreover, the Credit Risk Management Committee, a consultative body straddling the business units, rounds out SMBC’s oversight system for undertaking flexible and efficient control of credit risk and ensuring the overall soundness of the bank’s loan operations.
In addition to these, the Internal Audit Unit, operating independently of the business units, audits asset quality, grading accuracy, self-assessment, and appropriateness of the credit risk management system, and reports the results directly to the Board of Directors and the Management Committee.
(b) Method of credit risk management SMBC properly manages the credit risk inherent in individual loans and the entire portfolio by assessing and quantifying the credit risk of each borrower/loan using the internal rating system. In addition to management of individual loans through credit screening and monitoring, it manages the credit portfolio as described below in order to secure and improve the credit portfolio’s soundness and medium-term profitability. • Appropriate risk-taking within the scope of capital
To keep credit risk exposure to a permissible level relative to capital, SMBC sets “credit risk capital limit” for internal control purposes. Under these limits, separate guidelines are issued for each business unit and marketing unit. SMBC regularly monitors compliance with these guidelines.
• Controlling concentration of risk Because concentration of credit risk in an industry or corporate group has the potential to impair a bank’s capital significantly, SMBC implements measures to prevent excessive concentration of loan in a single industry and to control large exposure to individual borrowers by setting maximum loan amounts and conducting loan reviews thoroughly. To manage country risk, SMBC also has credit limit guidelines based on each country’s creditworthiness.
• Greater understanding of actual corporate conditions and balancing returns and risks SMBC runs credit operations on the basic principle of thoroughly understanding actual corporate conditions and gaining profit commensurate with the level of credit risk entailed, and makes every effort to improve profit at after-cost (credit cost, capital cost and overhead) level.
• Reduction and prevention of non-performing loansFor non-performing loans and potential non-performing loans, SMBC carries out loan reviews to clarify credit policies and action plans, enabling it to swiftly implement measures to prevent deterioration of borrowers’ business situations, support business recoveries, collect on loans, and enhance loan security.
Notes to Consolidated Financial Statements
010_0800801372908.indd 144 2017/08/07 14:04:34

SMFG
1452017 Annual Report
In regards to financial instruments such as investments in certain funds, securitized products and credit derivatives that indirectly retain risks related to assets such as corporate bonds and loan claims (underlying assets), such instruments entail market and liquidity risks in addition to credit risk, since such instruments are traded on the market. Credit risk management for these instruments involving detailed analysis and evaluation of characteristics of underlying assets is performed while market risk is comprehensively managed within the framework for managing market and liquidity risks. Moreover, guidelines have been established based on the characteristics of each type of risk to appropriately manage risks of incurring losses.
In regards to credit risk of derivative transactions, the potential exposure based on the market price is regularly calculated and properly managed. When the counterparty is a financial institution with whom SMBC frequently conducts derivative transactions, measures such as a close-out netting provision, which provide that offsetting credit exposures between the two parties will be combined into a single net payment from one party to the other in case of bankruptcy or other default event, are implemented to reduce credit risk.
2) Management of market and liquidity risks SMFG manages market and liquidity risks across the entire Group by setting allowable risk limits; ensuring the transparency of the risk management process; and clearly separating front-office, middle-office, and back-office operations for a highly efficient system of mutual checks and balances.
(a) Market and liquidity risk management systemsAt SMBC, important matters such as basic policies for managing market and liquidity risks and risk management framework are determined by the Management Committee and then approved by the Board of Directors.
The aforementioned Corporate Risk Management Dept., which is independent of the business units that directly handle business transactions and manages market and liquidity risks in an integrated manner. The department also monitors market and liquidity risk situations and regularly reports to the Management Committee and the Board of Directors.
Furthermore, its cross-departmental “ALM Committee” reports on the state of observance of SMBC’s market and liquidity risk capital limits, and deliberates on administration of ALM policies. It also has a system whereby front-office departments, middle-office departments and back-office departments check each other’s work in order to prevent clerical errors, unauthorized transactions, etc.
In addition, its Internal Audit Unit, which is independent of other departments, periodically performs comprehensive internal audits to verify that the risk management framework is properly functioning and reports the audit results to the Management Committee, the Board of Directors and other concerned committees and departments.
(b) Market and liquidity risk management methodology• Market risk management
SMBC manages market risk by setting maximum loss and VaR (value at risk: maximum potential loss that may be incurred to a specific financial instrument for a given probability) within the market risk capital limit, which is set taking into account stockholders’ equity and other factors in accordance with the market transaction policies.
SMBC uses the historical simulation method (a method for estimating the maximum loss by running simulations of changes in profit and loss on market fluctuations scenarios based on historical data) to measure VaR. Regarding banking activities (activities for generating profit through management of interest rates, terms, and other aspects of such as loans and bonds in assets, deposits in liabilities) and trading activities (activities for generating profit by taking advantage of short-term fluctuations in market values and differences in value among markets), SMBC calculates the maximum loss that may occur as a result of market fluctuations in 1 day with a probability of 1% based on 4 years of historical observation. With regard to the holding of shares (such as listed shares) for the purpose of strategic investment, SMBC calculates the maximum loss that may occur as a result of market fluctuations in 1 year with a probability of 1% based on 10 years of historical observation.
Regarding risks associated with foreign exchange rates, interest rates, equity risk, option prices and other market risk factors, SMBC manages such risks by setting a maximum limit on the indicator suited for each market risk factor such as BPV (basis point value: denotes the change in value of a financial instrument resulting from a 0.01 percentage-point change in the yield).
• Quantitative information on market risks As of March 31, 2017, total VaR of SMBC and its major consolidated subsidiaries was ¥47.4 billion for the banking activities, ¥23.6 billion for the trading activities and ¥1,544.5 billion for the holding of shares (such as listed shares) for the purpose of strategic investment.
However, it should be noted that these figures are statistical figures that change according to changes in assumptions and calculation methods, and may not cover the risk of future market conditions fluctuating drastically compared to market fluctuations of the past.
• Liquidity risk management At SMBC, funding liquidity risk is managed based on a framework consisting of setting funding gap limits, establishing contingency plans, and maintaining a system of highly liquid supplementary funding sources. A funding gap is the amount of funds needed in the future to cover duration mismatch between required investments and funding resources. SMBC tries to avoid excessive reliance on short-term funds by managing funding gap limits and has established a contingency plan covering emergency action plans such as reducing funding gap limits. In addition, to ensure smooth fulfillment of transactions in face of market turmoil, it holds assets such as U.S. treasuries that can be sold immediately and emergency committed lines as supplemental liquidity.
Notes to Consolidated Financial Statements
010_0800801372908.indd 145 2017/08/07 14:04:34
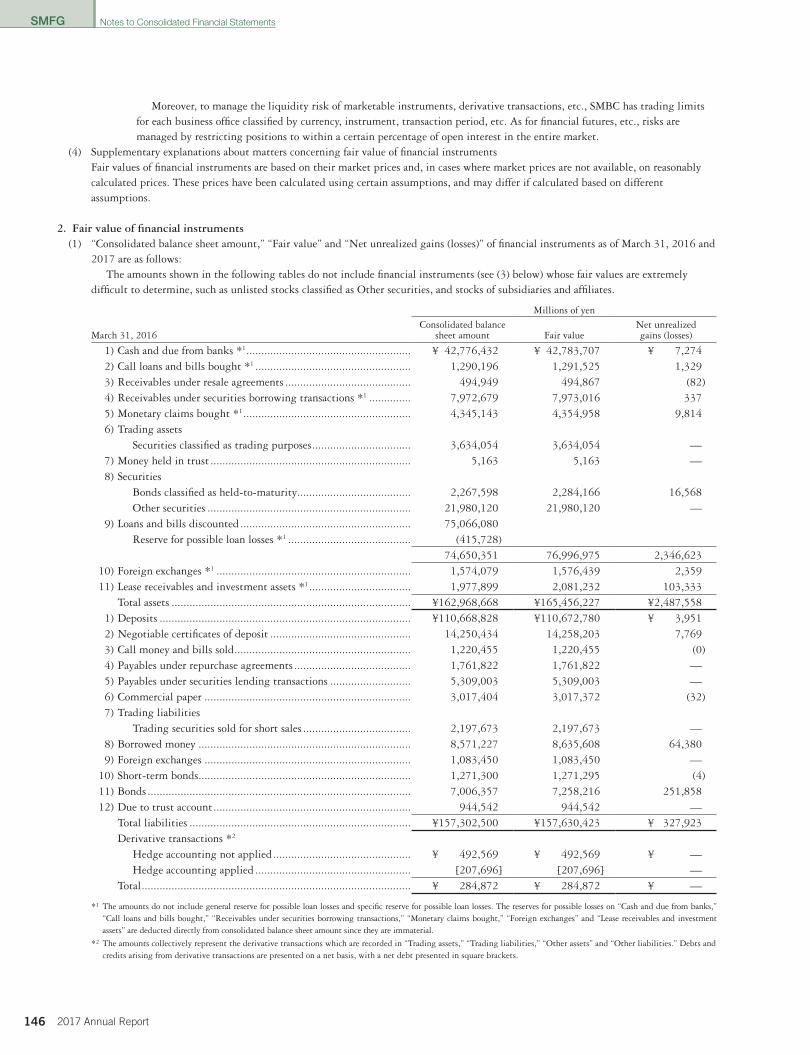
SMFG
146 2017 Annual Report
Moreover, to manage the liquidity risk of marketable instruments, derivative transactions, etc., SMBC has trading limits for each business office classified by currency, instrument, transaction period, etc. As for financial futures, etc., risks are managed by restricting positions to within a certain percentage of open interest in the entire market.
(4) Supplementary explanations about matters concerning fair value of financial instruments Fair values of financial instruments are based on their market prices and, in cases where market prices are not available, on reasonably calculated prices. These prices have been calculated using certain assumptions, and may differ if calculated based on different assumptions.
2. Fair value of financial instruments (1) “Consolidated balance sheet amount,” “Fair value” and “Net unrealized gains (losses)” of financial instruments as of March 31, 2016 and
2017 are as follows:The amounts shown in the following tables do not include financial instruments (see (3) below) whose fair values are extremely
difficult to determine, such as unlisted stocks classified as Other securities, and stocks of subsidiaries and affiliates.
Millions of yen
March 31, 2016Consolidated balance
sheet amount Fair valueNet unrealizedgains (losses)
1) Cash and due from banks *1 ....................................................... ¥ 42,776,432 ¥ 42,783,707 ¥ 7,2742) Call loans and bills bought *1 .................................................... 1,290,196 1,291,525 1,3293) Receivables under resale agreements .......................................... 494,949 494,867 (82)4) Receivables under securities borrowing transactions *1 .............. 7,972,679 7,973,016 3375) Monetary claims bought *1 ........................................................ 4,345,143 4,354,958 9,8146) Trading assets
Securities classified as trading purposes ................................. 3,634,054 3,634,054 —7) Money held in trust ................................................................... 5,163 5,163 —8) Securities
Bonds classified as held-to-maturity...................................... 2,267,598 2,284,166 16,568Other securities .................................................................... 21,980,120 21,980,120 —
9) Loans and bills discounted ......................................................... 75,066,080Reserve for possible loan losses *1 ......................................... (415,728)
74,650,351 76,996,975 2,346,62310) Foreign exchanges *1 ................................................................. 1,574,079 1,576,439 2,35911) Lease receivables and investment assets *1 .................................. 1,977,899 2,081,232 103,333
Total assets ................................................................................ ¥162,968,668 ¥165,456,227 ¥2,487,5581) Deposits .................................................................................... ¥110,668,828 ¥110,672,780 ¥ 3,9512) Negotiable certificates of deposit ............................................... 14,250,434 14,258,203 7,7693) Call money and bills sold ........................................................... 1,220,455 1,220,455 (0)4) Payables under repurchase agreements ....................................... 1,761,822 1,761,822 —5) Payables under securities lending transactions ........................... 5,309,003 5,309,003 —6) Commercial paper ..................................................................... 3,017,404 3,017,372 (32)7) Trading liabilities
Trading securities sold for short sales .................................... 2,197,673 2,197,673 —8) Borrowed money ....................................................................... 8,571,227 8,635,608 64,3809) Foreign exchanges ..................................................................... 1,083,450 1,083,450 —
10) Short-term bonds ....................................................................... 1,271,300 1,271,295 (4)11) Bonds ........................................................................................ 7,006,357 7,258,216 251,85812) Due to trust account .................................................................. 944,542 944,542 —
Total liabilities .......................................................................... ¥157,302,500 ¥157,630,423 ¥ 327,923Derivative transactions *2
Hedge accounting not applied .............................................. ¥ 492,569 ¥ 492,569 ¥ —Hedge accounting applied .................................................... [207,696] [207,696] —
Total .......................................................................................... ¥ 284,872 ¥ 284,872 ¥ —
*1 The amounts do not include general reserve for possible loan losses and specific reserve for possible loan losses. The reserves for possible losses on “Cash and due from banks,” “Call loans and bills bought,” “Receivables under securities borrowing transactions,” “Monetary claims bought,” “Foreign exchanges” and “Lease receivables and investment assets” are deducted directly from consolidated balance sheet amount since they are immaterial.
*2 The amounts collectively represent the derivative transactions which are recorded in “Trading assets,” “Trading liabilities,” “Other assets” and “Other liabilities.” Debts and credits arising from derivative transactions are presented on a net basis, with a net debt presented in square brackets.
Notes to Consolidated Financial Statements
010_0800801372908.indd 146 2017/08/07 14:04:34
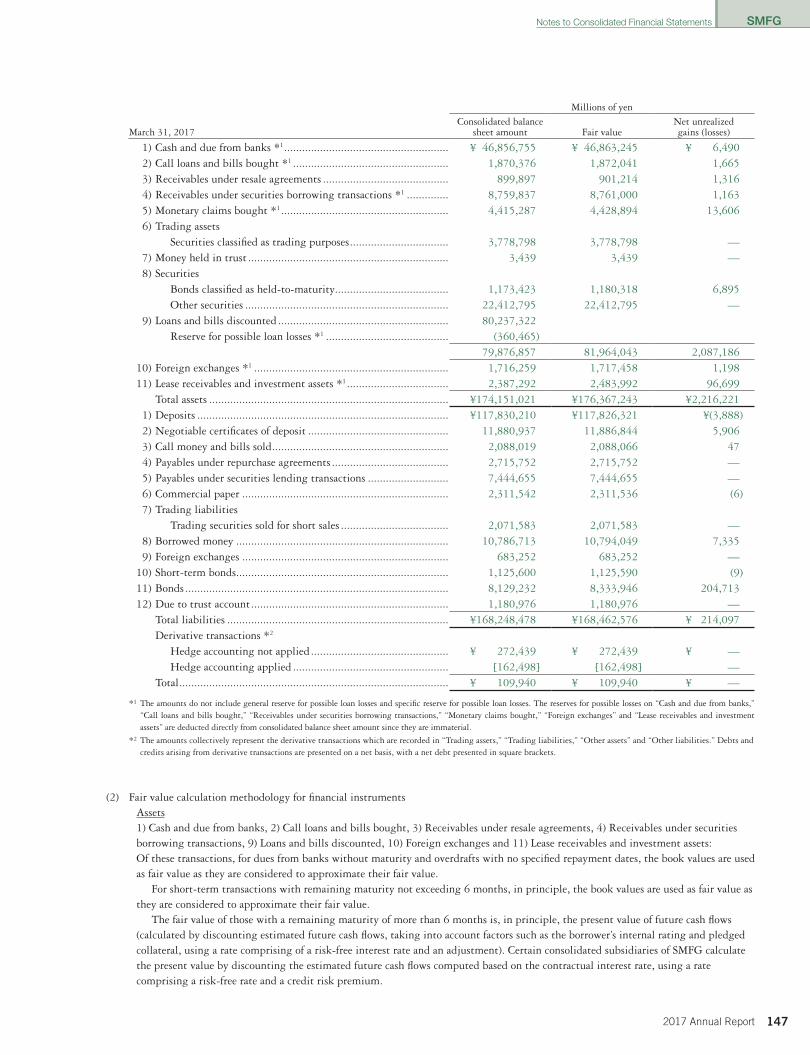
SMFG
1472017 Annual Report
Millions of yen
March 31, 2017Consolidated balance
sheet amount Fair valueNet unrealizedgains (losses)
1) Cash and due from banks *1 ....................................................... ¥ 46,856,755 ¥ 46,863,245 ¥ 6,4902) Call loans and bills bought *1 .................................................... 1,870,376 1,872,041 1,6653) Receivables under resale agreements .......................................... 899,897 901,214 1,3164) Receivables under securities borrowing transactions *1 .............. 8,759,837 8,761,000 1,1635) Monetary claims bought *1 ........................................................ 4,415,287 4,428,894 13,6066) Trading assets
Securities classified as trading purposes ................................. 3,778,798 3,778,798 —7) Money held in trust ................................................................... 3,439 3,439 —8) Securities
Bonds classified as held-to-maturity...................................... 1,173,423 1,180,318 6,895Other securities .................................................................... 22,412,795 22,412,795 —
9) Loans and bills discounted ......................................................... 80,237,322Reserve for possible loan losses *1 ......................................... (360,465)
79,876,857 81,964,043 2,087,18610) Foreign exchanges *1 ................................................................. 1,716,259 1,717,458 1,19811) Lease receivables and investment assets *1 .................................. 2,387,292 2,483,992 96,699
Total assets ................................................................................ ¥174,151,021 ¥176,367,243 ¥2,216,2211) Deposits .................................................................................... ¥117,830,210 ¥117,826,321 ¥(3,888)2) Negotiable certificates of deposit ............................................... 11,880,937 11,886,844 5,9063) Call money and bills sold ........................................................... 2,088,019 2,088,066 474) Payables under repurchase agreements ....................................... 2,715,752 2,715,752 —5) Payables under securities lending transactions ........................... 7,444,655 7,444,655 —6) Commercial paper ..................................................................... 2,311,542 2,311,536 (6)7) Trading liabilities
Trading securities sold for short sales .................................... 2,071,583 2,071,583 —8) Borrowed money ....................................................................... 10,786,713 10,794,049 7,3359) Foreign exchanges ..................................................................... 683,252 683,252 —
10) Short-term bonds ....................................................................... 1,125,600 1,125,590 (9)11) Bonds ........................................................................................ 8,129,232 8,333,946 204,71312) Due to trust account .................................................................. 1,180,976 1,180,976 —
Total liabilities .......................................................................... ¥168,248,478 ¥168,462,576 ¥ 214,097Derivative transactions *2
Hedge accounting not applied .............................................. ¥ 272,439 ¥ 272,439 ¥ —Hedge accounting applied .................................................... [162,498] [162,498] —
Total .......................................................................................... ¥ 109,940 ¥ 109,940 ¥ —
*1 The amounts do not include general reserve for possible loan losses and specific reserve for possible loan losses. The reserves for possible losses on “Cash and due from banks,” “Call loans and bills bought,” “Receivables under securities borrowing transactions,” “Monetary claims bought,” “Foreign exchanges” and “Lease receivables and investment assets” are deducted directly from consolidated balance sheet amount since they are immaterial.
*2 The amounts collectively represent the derivative transactions which are recorded in “Trading assets,” “Trading liabilities,” “Other assets” and “Other liabilities.” Debts and credits arising from derivative transactions are presented on a net basis, with a net debt presented in square brackets.
(2) Fair value calculation methodology for financial instrumentsAssets1) Cash and due from banks, 2) Call loans and bills bought, 3) Receivables under resale agreements, 4) Receivables under securities borrowing transactions, 9) Loans and bills discounted, 10) Foreign exchanges and 11) Lease receivables and investment assets: Of these transactions, for dues from banks without maturity and overdrafts with no specified repayment dates, the book values are used as fair value as they are considered to approximate their fair value.
For short-term transactions with remaining maturity not exceeding 6 months, in principle, the book values are used as fair value as they are considered to approximate their fair value.
The fair value of those with a remaining maturity of more than 6 months is, in principle, the present value of future cash flows (calculated by discounting estimated future cash flows, taking into account factors such as the borrower’s internal rating and pledged collateral, using a rate comprising of a risk-free interest rate and an adjustment). Certain consolidated subsidiaries of SMFG calculate the present value by discounting the estimated future cash flows computed based on the contractual interest rate, using a rate comprising a risk-free rate and a credit risk premium.
Notes to Consolidated Financial Statements
010_0800801372908.indd 147 2017/08/07 14:04:34

SMFG
148 2017 Annual Report
Regarding claims on bankrupt borrowers, effectively bankrupt borrowers and potentially bankrupt borrowers, expected losses on such claims are calculated based on either the expected recoverable amount from disposal of collateral or guarantees, or the present value of expected future cash flows. Since the claims’ balance sheet amounts minus the expected amount of loan losses approximate their fair values, such amounts are considered to be their fair values. 5) Monetary claims bought: The fair values of monetary claims bought, such as subordinated trust beneficiary interests related to securitized housing loans, are based on the assessed value of underlying housing loans securitized through the trust scheme minus the assessed value of senior beneficial interests, etc. The fair values of other transactions are, in principle, based on prices calculated using methods similar to the methods applied to 9) Loans and bills discounted. 6) Trading assets: The fair values of bonds and other securities held for trading purposes are, in principle, based on their market price at the end of the fiscal year. 7) Money held in trust: The fair values of money held in trust are, in principle, based on the market prices of securities held in trust calculated using methods similar to the methods applied to 8) Securities. 8) Securities: In principle, the fair values of stocks (including foreign stocks) are based on the average market price during 1 month before the end of the fiscal year. The fair values of bonds and securities with market prices other than stocks are prices calculated based on their market prices as of the end of the fiscal year.
In light of the “Practical Solution on Measurement of Fair Value for Financial Assets” (ASBJ Practical Issue Task Force No. 25), the fair values of floating rate government bonds are based on the present value of future cash flows (the government bond yield is used to discount and estimate future cash flows). Bond yield and yield volatility are the main price parameters. The fair values of those without market prices, such as private placement bonds, are based on the present value of future cash flows calculated by discounting estimated future cash flows taking into account the borrower’s internal rating and pledged collateral by a rate comprising a risk-free interest rate and an adjustment. However, the fair values of bonds, such as private placement bonds issued by bankrupt borrowers, effectively bankrupt borrowers and potentially bankrupt borrowers are based on the bond’s book value after the deduction of the expected amount of a loss on the bond computed by using the same method applied to the estimation of a loan loss. Meanwhile, the fair values of publicly offered investment trusts are calculated based on the published net asset value (NAV) per share, while those of private placement investment trusts are calculated based on the NAV published by securities firms and other financial institutions.
Liabilities 1) Deposits, 2) Negotiable certificates of deposit and 12) Due to trust account: The fair values of demand deposits and deposits without maturity are based on their book values. The fair values of short-term transactions with remaining maturity not exceeding 6 months are also based on their book values, as their book values are regarded to approximate their market values. The fair values of transactions with a remaining maturity of more than 6 months are, in principle, based on the present value of estimated future cash flows calculated using the rate applied to the same type of deposits that are newly accepted until the end of the remaining maturity. 3) Call money and bills sold, 4) Payables under repurchase agreements, 5) Payables under securities lending transactions, 6) Commercial paper, 8) Borrowed money, 10) Short-term bonds and 11) Bonds: The fair values of short-term transactions with remaining maturity not exceeding 6 months are based on their book values, as their book values are considered to approximate their fair values. For transactions with a remaining maturity of more than 6 months, their fair values are, in principle, based on the present value of estimated future cash flows calculated using the refinancing rate applied to the same type of instruments for the remaining maturity. The fair values of bonds are based on the present value of future cash flows calculated using the rate derived from the data on the yields of benchmark bonds and publicly-offered subordinated bonds published by securities firms. 7) Trading liabilities: The fair values of bonds sold for short sales and other securities for trading purposes are, in principle, based on their market prices as of the end of the fiscal year. 9) Foreign exchanges: The fair values of foreign currency-denominated deposits without maturity received from other banks are based on their book values.
The fair values of foreign exchange related short-term borrowings are based on their book values, as their book values are regarded to approximate their fair values.
Derivatives transactions The fair values of exchange-traded derivatives are based on their closing prices. With regard to OTC transactions, the fair values of interest rate, currency, stock, bond and credit derivatives are based on their prices calculated based on the present value of the future cash flows, option valuation models, etc. The fair values of commodity derivatives transactions are based on their prices calculated based on the derivative instrument’s components, including price and contract term.
Notes to Consolidated Financial Statements
010_0800801372908.indd 148 2017/08/07 14:04:34

SMFG
1492017 Annual Report
(3) Consolidated balance sheet amount of financial instruments whose fair values are extremely difficult to determine are as follows:
Millions of yen
March 31 2016 2017Monetary claims bought:
Monetary claims bought without market prices *1 ................................................... ¥ 2,460 ¥ 2,460Securities:
Unlisted stocks, etc. *2 *4 ........................................................................................ 157,382 176,818Investments in partnership, etc. *3 *4 ...................................................................... 248,921 264,205
Total ............................................................................................................................. ¥408,764 ¥443,485
*1 They are beneficiary claims on loan trusts (a) that behave more like equity than debt, (b) that do not have market prices, and (c) for which it is difficult to rationally estimate their fair values.
*2 They are not included in the scope of fair value disclosure since there are no market prices and it is extremely difficult to determine their fair values.
*3 They are capital contributions with no market prices. The above-stated amount includes the book value amount of investments in the partnership of which SMFG records net changes in their balance sheets and statements of income.
*4 Unlisted stocks and investments in partnership totaling ¥7,618 million and ¥9,869 million were written-off in the fiscal year ended March 31, 2016 and 2017, respectively.
(4) Redemption schedule of monetary claims and securities with maturities
Millions of yen
March 31, 2016 Within 1 yearAfter 1 year
through 5 yearsAfter 5 years
through 10 years After 10 years
Deposits with banks ................................................... ¥41,764,849 ¥ 33,628 ¥ 24,213 ¥ 1,329Call loans and bills bought ......................................... 1,235,295 50,706 5,363 —Receivables under resale agreements ........................... 427,377 67,572 — —Receivables under securities borrowing transactions ... 7,961,878 11,040 — —Monetary claims bought*1 .......................................... 3,349,198 678,150 43,207 235,211Securities*1 ................................................................ 5,125,770 10,864,943 2,047,674 1,712,001
Bonds classified as held-to-maturity....................... 1,093,340 1,172,636 — —Japanese government bonds .............................. 1,080,000 1,160,000 — —Japanese local government bonds ...................... 13,340 7,426 — —Japanese corporate bonds .................................. — 5,210 — —Other ............................................................... — — — —
Other securities with maturity............................... 4,032,430 9,692,306 2,047,674 1,712,001Japanese government bonds .............................. 1,548,400 6,172,500 11,000 239,400Japanese local government bonds ...................... 12,838 14,197 3,855 33Japanese corporate bonds .................................. 476,283 1,558,803 555,748 96,278Other ............................................................... 1,994,907 1,946,805 1,477,070 1,376,289
Loans and bills discounted*1 *2 ................................... 16,340,462 31,637,487 11,694,402 9,085,329Foreign exchanges*1 ................................................... 1,572,622 2,557 — —Lease receivables and investment assets*1 .................... 531,712 1,039,875 155,118 102,003Total ........................................................................... ¥78,309,168 ¥44,385,961 ¥13,969,979 ¥11,135,875
*1 The amounts shown in the table above do not include amounts for claims on bankrupt borrowers, effectively bankrupt borrowers and potentially bankrupt borrowers and other claims for which redemption is unlikely. The amounts for such claims are Monetary claims bought: ¥0 million, Securities: ¥33,496 million, Loans and bills discounted: ¥608,928 million, Foreign exchanges: ¥1,987 million, Lease receivables and investment assets: ¥18,510 million.
*2 “Loans and bills discounted” without the maturity dates are not included. Such amount is totaled to ¥5,697,958 million at March 31, 2016.
Notes to Consolidated Financial Statements
010_0800801372908.indd 149 2017/08/07 14:04:34

SMFG
150 2017 Annual Report
Millions of yen
March 31, 2017 Within 1 yearAfter 1 year
through 5 yearsAfter 5 years
through 10 years After 10 years
Deposits with banks ................................................... ¥45,684,741 ¥ 34,913 ¥ 21,577 ¥ 1,136Call loans and bills bought ......................................... 1,824,664 46,118 1,360 —Receivables under resale agreements ........................... 832,583 67,314 — —Receivables under securities borrowing transactions ... 8,754,840 5,550 — —Monetary claims bought*1 .......................................... 3,456,614 599,502 59,428 266,599Securities*1 ................................................................ 3,530,979 11,390,925 2,658,678 1,353,291
Bonds classified as held-to-maturity....................... 791,800 380,836 — —Japanese government bonds .............................. 790,000 370,000 — —Japanese local government bonds ...................... 1,800 5,626 — —Japanese corporate bonds .................................. — 5,210 — —Other ............................................................... — — — —
Other securities with maturity............................... 2,739,178 11,010,089 2,658,678 1,353,291Japanese government bonds .............................. 79,000 6,789,300 220,400 147,000Japanese local government bonds ...................... 4,822 28,545 49,538 26Japanese corporate bonds .................................. 515,524 1,493,515 609,414 145,798Other ............................................................... 2,139,831 2,698,728 1,779,326 1,060,466
Loans and bills discounted*1 *2 ................................... 18,502,646 33,099,462 12,842,320 8,943,328Foreign exchanges*1 ................................................... 1,704,057 12,397 — —Lease receivables and investment assets*1 .................... 660,683 1,272,477 171,960 117,548Total ........................................................................... ¥84,951,811 ¥46,528,660 ¥15,755,326 ¥10,681,905
*1 The amounts shown in the table above do not include amounts for claims on bankrupt borrowers, effectively bankrupt borrowers and potentially bankrupt borrowers and other claims for which redemption is unlikely. The amounts for such claims are Monetary claims bought: ¥2 million, Securities: ¥7,340 million, Loans and bills discounted: ¥542,240 million, Foreign exchanges: ¥7,413 million, Lease receivables and investment assets: ¥31,113 million.
*2 “Loans and bills discounted” without the maturity dates are not included. Such amount is totaled to ¥6,306,217 million at March 31, 2017.
(5) Redemption schedule of bonds, borrowed money and other interest-bearing debts
Millions of yen
March 31, 2016 Within 1 yearAfter 1 year
through 5 yearsAfter 5 years
through 10 years After 10 years
Deposits * .................................................................. ¥105,655,087 ¥4,098,017 ¥ 468,420 ¥ 447,303Negotiable certificates of deposit ................................ 13,740,528 506,777 3,125 1Call money and bills sold ............................................ 1,219,196 1,259 — —Payables under repurchase agreements ........................ 1,761,822 — — —Payables under securities lending transactions ............ 5,309,003 — — —Commercial paper ...................................................... 3,017,404 — — —Borrowed money ........................................................ 5,790,740 1,292,699 1,018,602 469,186Foreign exchanges ...................................................... 1,083,450 — — —Short-term bonds ........................................................ 1,271,300 — — —Bonds ......................................................................... 985,979 3,213,584 2,094,283 716,106Due to trust account ................................................... 944,542 — — —Total ........................................................................... ¥140,779,055 ¥9,112,338 ¥3,584,431 ¥1,632,598
* Demand deposits are included in “Within 1 year.” Deposits include current deposits.
Notes to Consolidated Financial Statements
010_0800801372908.indd 150 2017/08/07 14:04:34
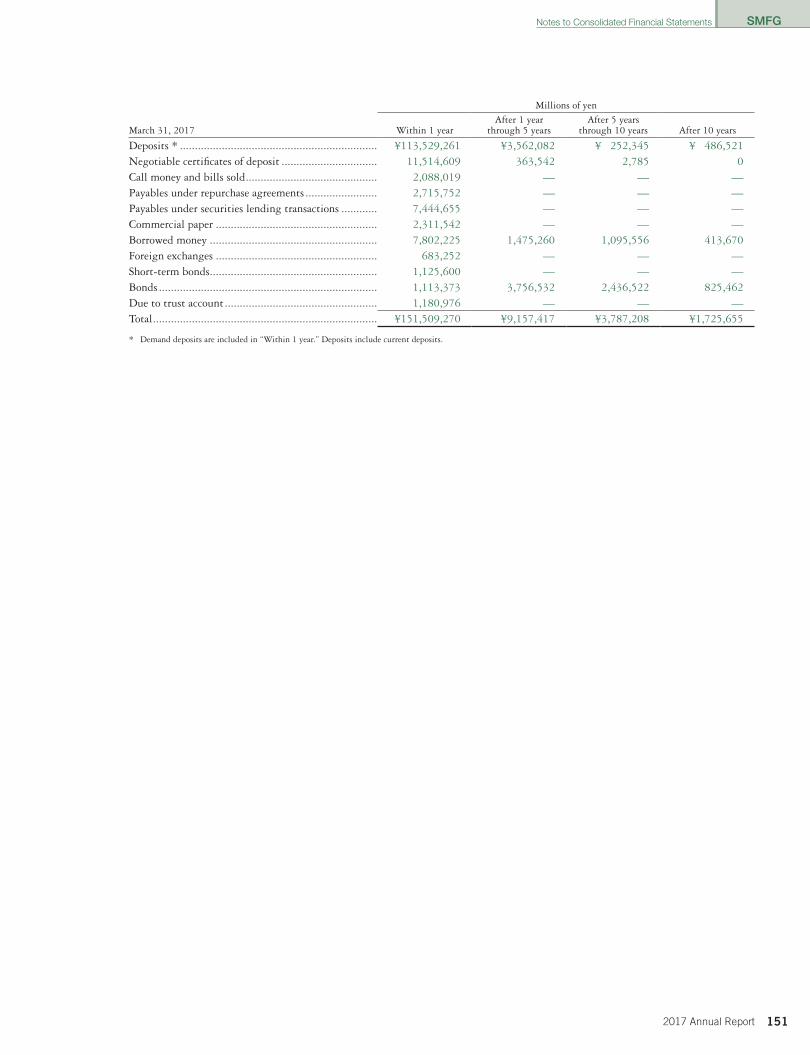
SMFG
1512017 Annual Report
Millions of yen
March 31, 2017 Within 1 yearAfter 1 year
through 5 yearsAfter 5 years
through 10 years After 10 years
Deposits * .................................................................. ¥113,529,261 ¥3,562,082 ¥ 252,345 ¥ 486,521Negotiable certificates of deposit ................................ 11,514,609 363,542 2,785 0Call money and bills sold ............................................ 2,088,019 — — —Payables under repurchase agreements ........................ 2,715,752 — — —Payables under securities lending transactions ............ 7,444,655 — — —Commercial paper ...................................................... 2,311,542 — — —Borrowed money ........................................................ 7,802,225 1,475,260 1,095,556 413,670Foreign exchanges ...................................................... 683,252 — — —Short-term bonds ........................................................ 1,125,600 — — —Bonds ......................................................................... 1,113,373 3,756,532 2,436,522 825,462Due to trust account ................................................... 1,180,976 — — —Total ........................................................................... ¥151,509,270 ¥9,157,417 ¥3,787,208 ¥1,725,655
* Demand deposits are included in “Within 1 year.” Deposits include current deposits.
Notes to Consolidated Financial Statements
010_0800801372908.indd 151 2017/08/07 14:04:34
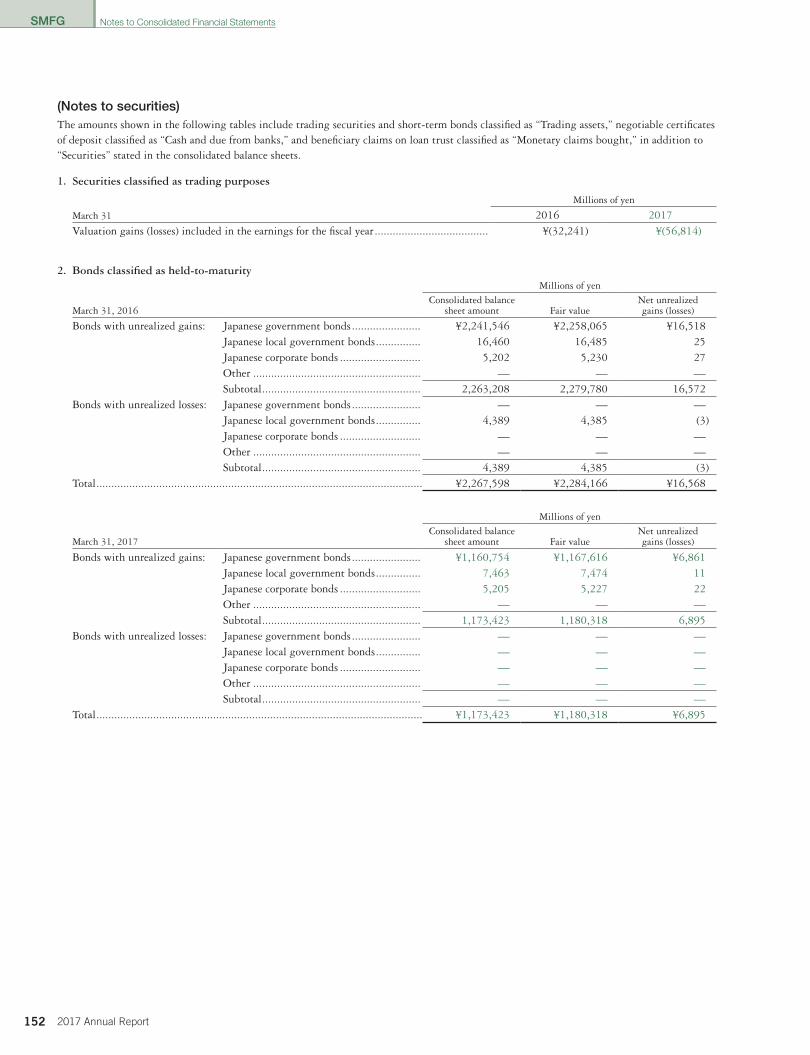
SMFG
152 2017 Annual Report
(Notes to securities)The amounts shown in the following tables include trading securities and short-term bonds classified as “Trading assets,” negotiable certificates of deposit classified as “Cash and due from banks,” and beneficiary claims on loan trust classified as “Monetary claims bought,” in addition to “Securities” stated in the consolidated balance sheets.
1. Securities classified as trading purposes
Millions of yen
March 31 2016 2017Valuation gains (losses) included in the earnings for the fiscal year ...................................... ¥(32,241) ¥(56,814)
2. Bonds classified as held-to-maturity
March 31, 2016
Millions of yen Consolidated balance
sheet amount Fair value Net unrealizedgains (losses)
Bonds with unrealized gains: Japanese government bonds ....................... ¥2,241,546 ¥2,258,065 ¥16,518Japanese local government bonds ............... 16,460 16,485 25Japanese corporate bonds ........................... 5,202 5,230 27Other ........................................................ — — —Subtotal ..................................................... 2,263,208 2,279,780 16,572
Bonds with unrealized losses: Japanese government bonds ....................... — — —Japanese local government bonds ............... 4,389 4,385 (3)Japanese corporate bonds ........................... — — —Other ........................................................ — — —Subtotal ..................................................... 4,389 4,385 (3)
Total ............................................................................................................. ¥2,267,598 ¥2,284,166 ¥16,568
March 31, 2017
Millions of yen Consolidated balance
sheet amount Fair value Net unrealizedgains (losses)
Bonds with unrealized gains: Japanese government bonds ....................... ¥1,160,754 ¥1,167,616 ¥6,861Japanese local government bonds ............... 7,463 7,474 11Japanese corporate bonds ........................... 5,205 5,227 22Other ........................................................ — — —Subtotal ..................................................... 1,173,423 1,180,318 6,895
Bonds with unrealized losses: Japanese government bonds ....................... — — —Japanese local government bonds ............... — — —Japanese corporate bonds ........................... — — —Other ........................................................ — — —Subtotal ..................................................... — — —
Total ............................................................................................................. ¥1,173,423 ¥1,180,318 ¥6,895
Notes to Consolidated Financial Statements
010_0800801372908.indd 152 2017/08/07 14:04:34
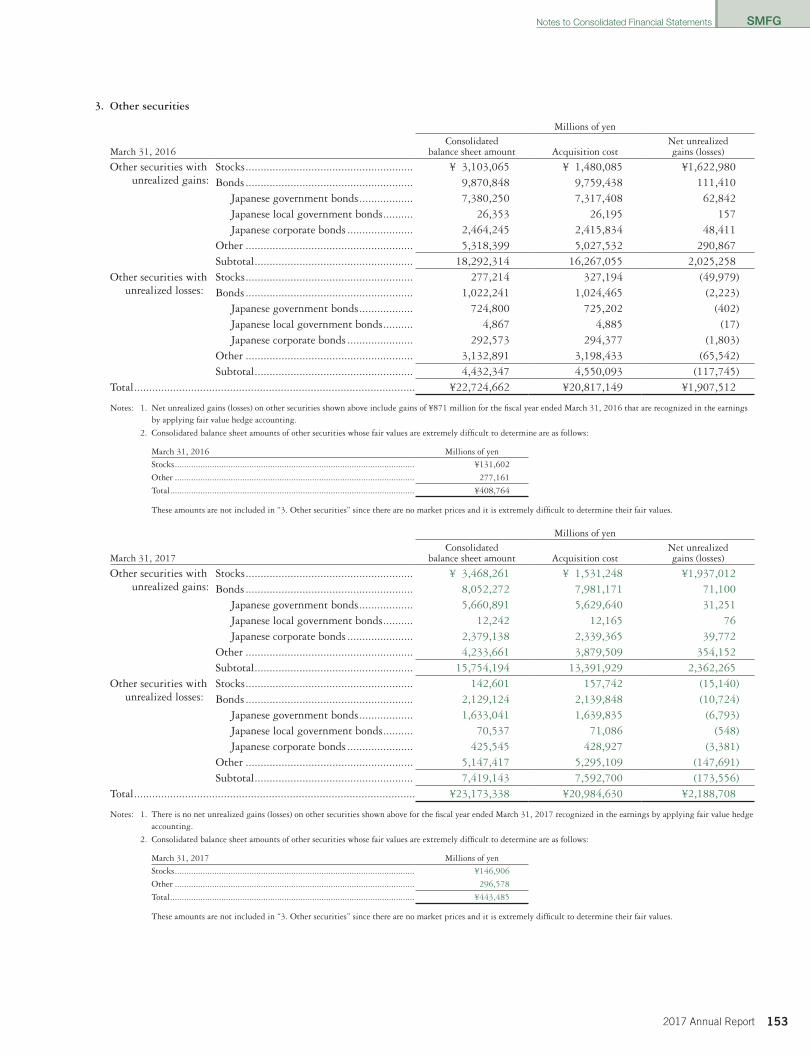
SMFG
1532017 Annual Report
3. Other securities
March 31, 2016
Millions of yen Consolidated
balance sheet amount Acquisition costNet unrealizedgains (losses)
Other securities with unrealized gains:
Stocks ........................................................ ¥ 3,103,065 ¥ 1,480,085 ¥1,622,980Bonds ........................................................ 9,870,848 9,759,438 111,410
Japanese government bonds .................. 7,380,250 7,317,408 62,842Japanese local government bonds .......... 26,353 26,195 157Japanese corporate bonds ...................... 2,464,245 2,415,834 48,411
Other ........................................................ 5,318,399 5,027,532 290,867Subtotal ..................................................... 18,292,314 16,267,055 2,025,258
Other securities with unrealized losses:
Stocks ........................................................ 277,214 327,194 (49,979)Bonds ........................................................ 1,022,241 1,024,465 (2,223)
Japanese government bonds .................. 724,800 725,202 (402)Japanese local government bonds .......... 4,867 4,885 (17)Japanese corporate bonds ...................... 292,573 294,377 (1,803)
Other ........................................................ 3,132,891 3,198,433 (65,542)Subtotal ..................................................... 4,432,347 4,550,093 (117,745)
Total .............................................................................................. ¥22,724,662 ¥20,817,149 ¥1,907,512
Notes: 1. Net unrealized gains (losses) on other securities shown above include gains of ¥871 million for the fiscal year ended March 31, 2016 that are recognized in the earnings by applying fair value hedge accounting.
2. Consolidated balance sheet amounts of other securities whose fair values are extremely difficult to determine are as follows:
March 31, 2016 Millions of yen
Stocks ....................................................................................................... ¥131,602
Other ....................................................................................................... 277,161
Total ......................................................................................................... ¥408,764
These amounts are not included in “3. Other securities” since there are no market prices and it is extremely difficult to determine their fair values.
March 31, 2017
Millions of yen Consolidated
balance sheet amount Acquisition costNet unrealizedgains (losses)
Other securities with unrealized gains:
Stocks ........................................................ ¥ 3,468,261 ¥ 1,531,248 ¥1,937,012Bonds ........................................................ 8,052,272 7,981,171 71,100
Japanese government bonds .................. 5,660,891 5,629,640 31,251Japanese local government bonds .......... 12,242 12,165 76Japanese corporate bonds ...................... 2,379,138 2,339,365 39,772
Other ........................................................ 4,233,661 3,879,509 354,152Subtotal ..................................................... 15,754,194 13,391,929 2,362,265
Other securities with unrealized losses:
Stocks ........................................................ 142,601 157,742 (15,140)Bonds ........................................................ 2,129,124 2,139,848 (10,724)
Japanese government bonds .................. 1,633,041 1,639,835 (6,793)Japanese local government bonds .......... 70,537 71,086 (548)Japanese corporate bonds ...................... 425,545 428,927 (3,381)
Other ........................................................ 5,147,417 5,295,109 (147,691)Subtotal ..................................................... 7,419,143 7,592,700 (173,556)
Total .............................................................................................. ¥23,173,338 ¥20,984,630 ¥2,188,708
Notes: 1. There is no net unrealized gains (losses) on other securities shown above for the fiscal year ended March 31, 2017 recognized in the earnings by applying fair value hedge accounting.
2. Consolidated balance sheet amounts of other securities whose fair values are extremely difficult to determine are as follows:
March 31, 2017 Millions of yen
Stocks ....................................................................................................... ¥146,906
Other ....................................................................................................... 296,578
Total ......................................................................................................... ¥443,485
These amounts are not included in “3. Other securities” since there are no market prices and it is extremely difficult to determine their fair values.
Notes to Consolidated Financial Statements
010_0800801372908.indd 153 2017/08/07 14:04:34
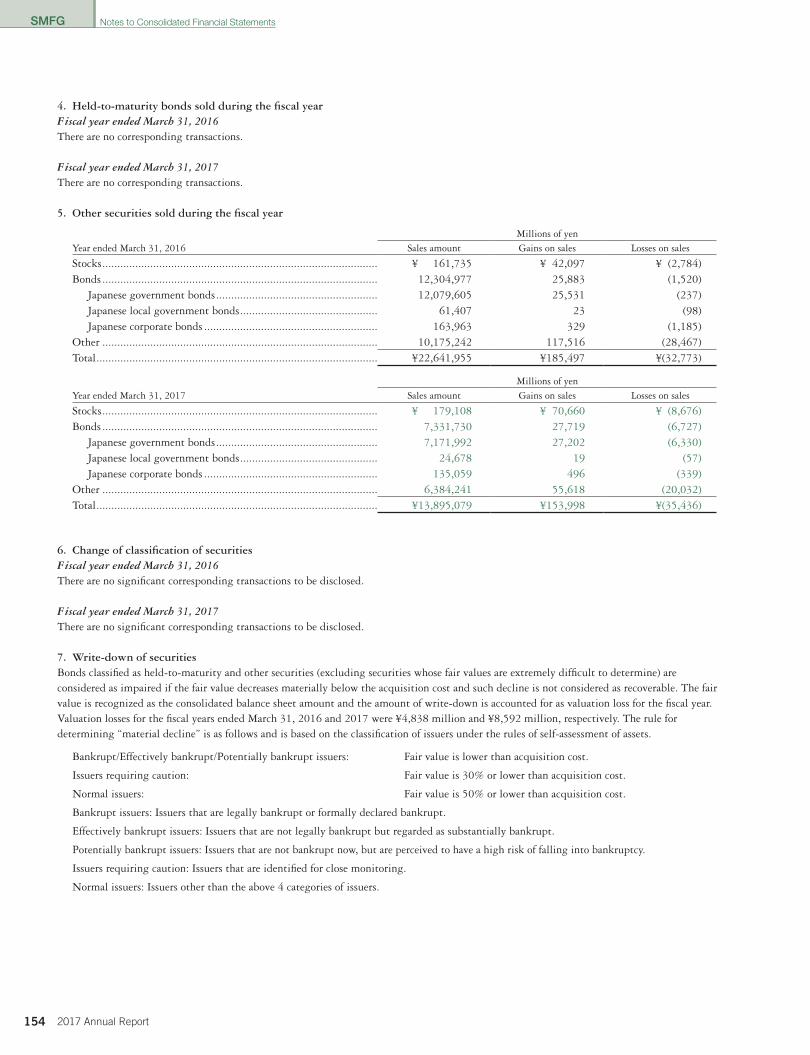
SMFG
154 2017 Annual Report
4. Held-to-maturity bonds sold during the fiscal yearFiscal year ended March 31, 2016 There are no corresponding transactions.
Fiscal year ended March 31, 2017There are no corresponding transactions.
5. Other securities sold during the fiscal year
Millions of yenYear ended March 31, 2016 Sales amount Gains on sales Losses on sales
Stocks ............................................................................................ ¥ 161,735 ¥ 42,097 ¥ (2,784)Bonds ............................................................................................ 12,304,977 25,883 (1,520)
Japanese government bonds ...................................................... 12,079,605 25,531 (237)Japanese local government bonds .............................................. 61,407 23 (98)Japanese corporate bonds .......................................................... 163,963 329 (1,185)
Other ............................................................................................ 10,175,242 117,516 (28,467)Total .............................................................................................. ¥22,641,955 ¥185,497 ¥(32,773)
Millions of yenYear ended March 31, 2017 Sales amount Gains on sales Losses on sales
Stocks ............................................................................................ ¥ 179,108 ¥ 70,660 ¥ (8,676)Bonds ............................................................................................ 7,331,730 27,719 (6,727)
Japanese government bonds ...................................................... 7,171,992 27,202 (6,330)Japanese local government bonds .............................................. 24,678 19 (57)Japanese corporate bonds .......................................................... 135,059 496 (339)
Other ............................................................................................ 6,384,241 55,618 (20,032)Total .............................................................................................. ¥13,895,079 ¥153,998 ¥(35,436)
6. Change of classification of securitiesFiscal year ended March 31, 2016 There are no significant corresponding transactions to be disclosed.
Fiscal year ended March 31, 2017There are no significant corresponding transactions to be disclosed.
7. Write-down of securitiesBonds classified as held-to-maturity and other securities (excluding securities whose fair values are extremely difficult to determine) are considered as impaired if the fair value decreases materially below the acquisition cost and such decline is not considered as recoverable. The fair value is recognized as the consolidated balance sheet amount and the amount of write-down is accounted for as valuation loss for the fiscal year. Valuation losses for the fiscal years ended March 31, 2016 and 2017 were ¥4,838 million and ¥8,592 million, respectively. The rule for determining “material decline” is as follows and is based on the classification of issuers under the rules of self-assessment of assets.
Bankrupt/Effectively bankrupt/Potentially bankrupt issuers: Fair value is lower than acquisition cost.
Issuers requiring caution: Fair value is 30% or lower than acquisition cost.
Normal issuers: Fair value is 50% or lower than acquisition cost.
Bankrupt issuers: Issuers that are legally bankrupt or formally declared bankrupt.
Effectively bankrupt issuers: Issuers that are not legally bankrupt but regarded as substantially bankrupt.
Potentially bankrupt issuers: Issuers that are not bankrupt now, but are perceived to have a high risk of falling into bankruptcy.
Issuers requiring caution: Issuers that are identified for close monitoring.
Normal issuers: Issuers other than the above 4 categories of issuers.
Notes to Consolidated Financial Statements
010_0800801372908.indd 154 2017/08/07 14:04:34
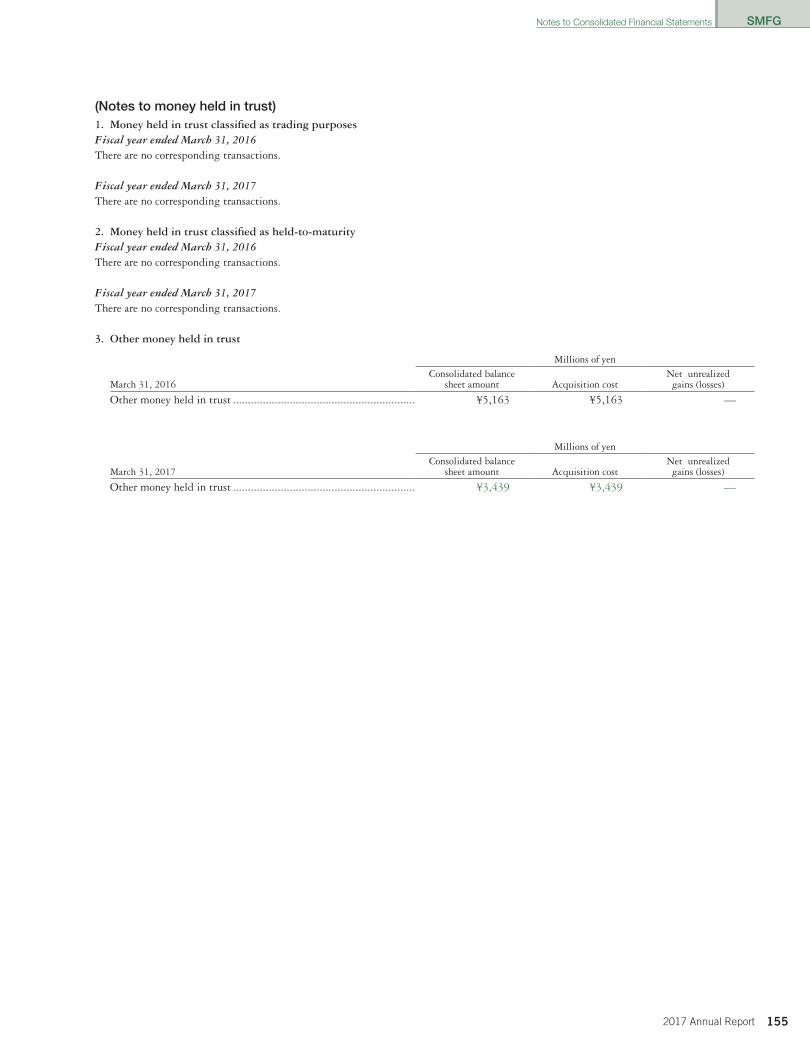
SMFG
1552017 Annual Report
(Notes to money held in trust) 1. Money held in trust classified as trading purposesFiscal year ended March 31, 2016 There are no corresponding transactions.
Fiscal year ended March 31, 2017There are no corresponding transactions.
2. Money held in trust classified as held-to-maturity Fiscal year ended March 31, 2016 There are no corresponding transactions.
Fiscal year ended March 31, 2017There are no corresponding transactions.
3. Other money held in trust
Millions of yen
March 31, 2016Consolidated balance
sheet amount Acquisition costNet unrealized
gains (losses)
Other money held in trust ............................................................. ¥5,163 ¥5,163 —
Millions of yen
March 31, 2017Consolidated balance
sheet amount Acquisition costNet unrealized
gains (losses)
Other money held in trust ............................................................. ¥3,439 ¥3,439 —
Notes to Consolidated Financial Statements
010_0800801372908.indd 155 2017/08/07 14:04:34
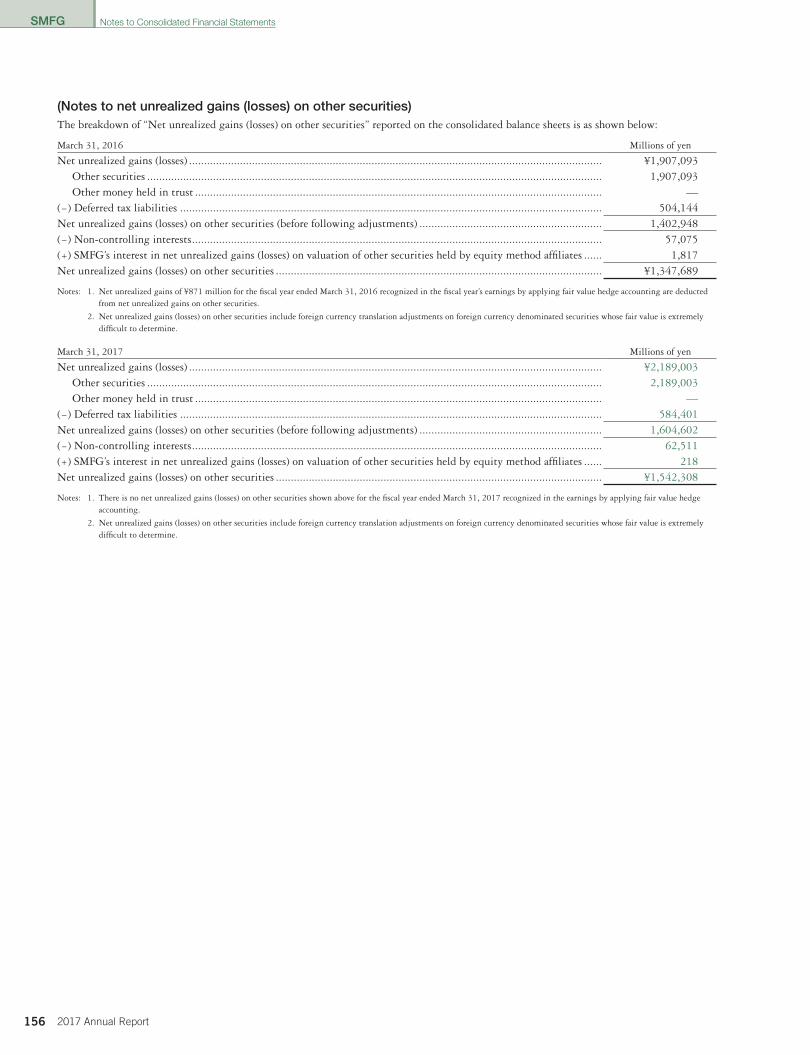
SMFG
156 2017 Annual Report
(Notes to net unrealized gains (losses) on other securities)The breakdown of “Net unrealized gains (losses) on other securities” reported on the consolidated balance sheets is as shown below:
March 31, 2016 Millions of yen
Net unrealized gains (losses) .......................................................................................................................................... ¥1,907,093Other securities ........................................................................................................................................................ 1,907,093Other money held in trust ........................................................................................................................................ —
(−) Deferred tax liabilities ............................................................................................................................................. 504,144Net unrealized gains (losses) on other securities (before following adjustments) ............................................................. 1,402,948(−) Non-controlling interests ......................................................................................................................................... 57,075(+) SMFG’s interest in net unrealized gains (losses) on valuation of other securities held by equity method affiliates ...... 1,817Net unrealized gains (losses) on other securities ............................................................................................................. ¥1,347,689
Notes: 1. Net unrealized gains of ¥871 million for the fiscal year ended March 31, 2016 recognized in the fiscal year’s earnings by applying fair value hedge accounting are deducted from net unrealized gains on other securities.
2. Net unrealized gains (losses) on other securities include foreign currency translation adjustments on foreign currency denominated securities whose fair value is extremely difficult to determine.
March 31, 2017 Millions of yen
Net unrealized gains (losses) .......................................................................................................................................... ¥2,189,003Other securities ........................................................................................................................................................ 2,189,003Other money held in trust ........................................................................................................................................ —
(−) Deferred tax liabilities ............................................................................................................................................. 584,401Net unrealized gains (losses) on other securities (before following adjustments) ............................................................. 1,604,602(−) Non-controlling interests ......................................................................................................................................... 62,511(+) SMFG’s interest in net unrealized gains (losses) on valuation of other securities held by equity method affiliates ...... 218Net unrealized gains (losses) on other securities ............................................................................................................. ¥1,542,308
Notes: 1. There is no net unrealized gains (losses) on other securities shown above for the fiscal year ended March 31, 2017 recognized in the earnings by applying fair value hedge accounting.
2. Net unrealized gains (losses) on other securities include foreign currency translation adjustments on foreign currency denominated securities whose fair value is extremely difficult to determine.
Notes to Consolidated Financial Statements
010_0800801372908.indd 156 2017/08/07 14:04:34
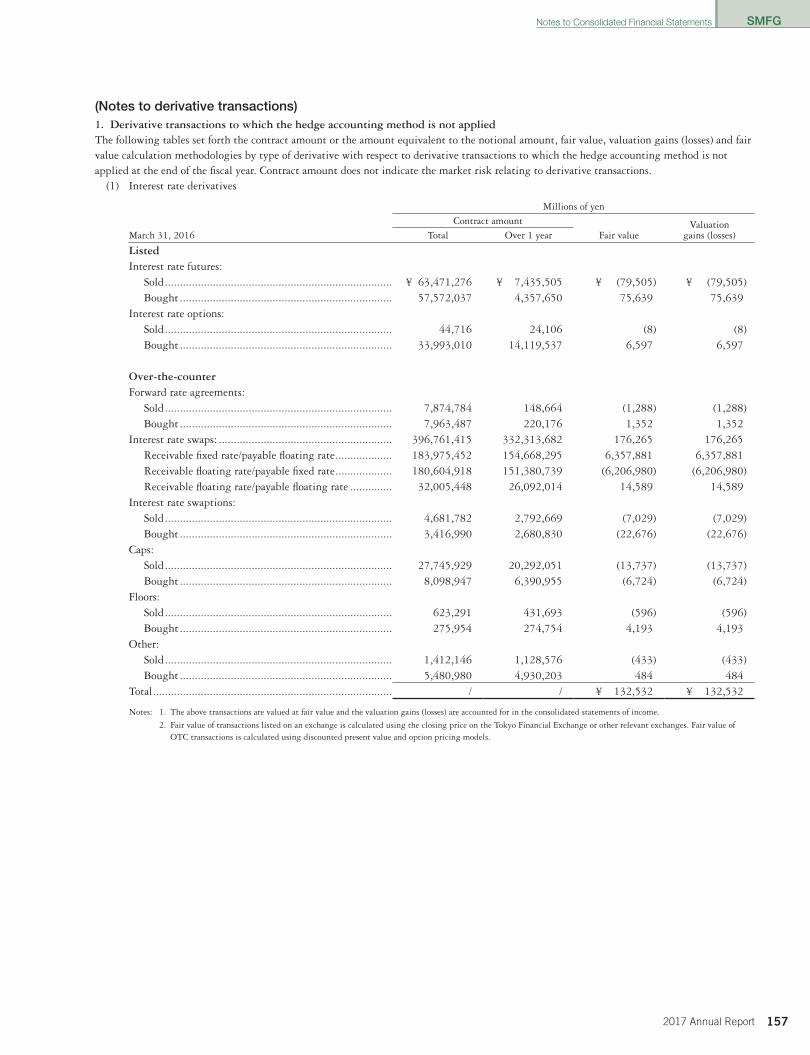
SMFG
1572017 Annual Report
(Notes to derivative transactions)1. Derivative transactions to which the hedge accounting method is not applied The following tables set forth the contract amount or the amount equivalent to the notional amount, fair value, valuation gains (losses) and fair value calculation methodologies by type of derivative with respect to derivative transactions to which the hedge accounting method is not applied at the end of the fiscal year. Contract amount does not indicate the market risk relating to derivative transactions.
(1) Interest rate derivatives
Millions of yen Contract amount Valuation
gains (losses)March 31, 2016 Total Over 1 year Fair value
Listed Interest rate futures:
Sold ............................................................................ ¥ 63,471,276 ¥ 7,435,505 ¥ (79,505) ¥ (79,505)Bought ....................................................................... 57,572,037 4,357,650 75,639 75,639
Interest rate options:Sold ............................................................................ 44,716 24,106 (8) (8)Bought ....................................................................... 33,993,010 14,119,537 6,597 6,597
Over-the-counterForward rate agreements:
Sold ............................................................................ 7,874,784 148,664 (1,288) (1,288)Bought ....................................................................... 7,963,487 220,176 1,352 1,352
Interest rate swaps: .......................................................... 396,761,415 332,313,682 176,265 176,265Receivable fixed rate/payable floating rate ................... 183,975,452 154,668,295 6,357,881 6,357,881Receivable floating rate/payable fixed rate ................... 180,604,918 151,380,739 (6,206,980) (6,206,980)Receivable floating rate/payable floating rate .............. 32,005,448 26,092,014 14,589 14,589
Interest rate swaptions:Sold ............................................................................ 4,681,782 2,792,669 (7,029) (7,029)Bought ....................................................................... 3,416,990 2,680,830 (22,676) (22,676)
Caps:Sold ............................................................................ 27,745,929 20,292,051 (13,737) (13,737)Bought ....................................................................... 8,098,947 6,390,955 (6,724) (6,724)
Floors:Sold ............................................................................ 623,291 431,693 (596) (596)Bought ....................................................................... 275,954 274,754 4,193 4,193
Other:Sold ............................................................................ 1,412,146 1,128,576 (433) (433)Bought ....................................................................... 5,480,980 4,930,203 484 484
Total ................................................................................ / / ¥ 132,532 ¥ 132,532
Notes: 1. The above transactions are valued at fair value and the valuation gains (losses) are accounted for in the consolidated statements of income.
2. Fair value of transactions listed on an exchange is calculated using the closing price on the Tokyo Financial Exchange or other relevant exchanges. Fair value of OTC transactions is calculated using discounted present value and option pricing models.
Notes to Consolidated Financial Statements
010_0800801372908.indd 157 2017/08/07 14:04:34
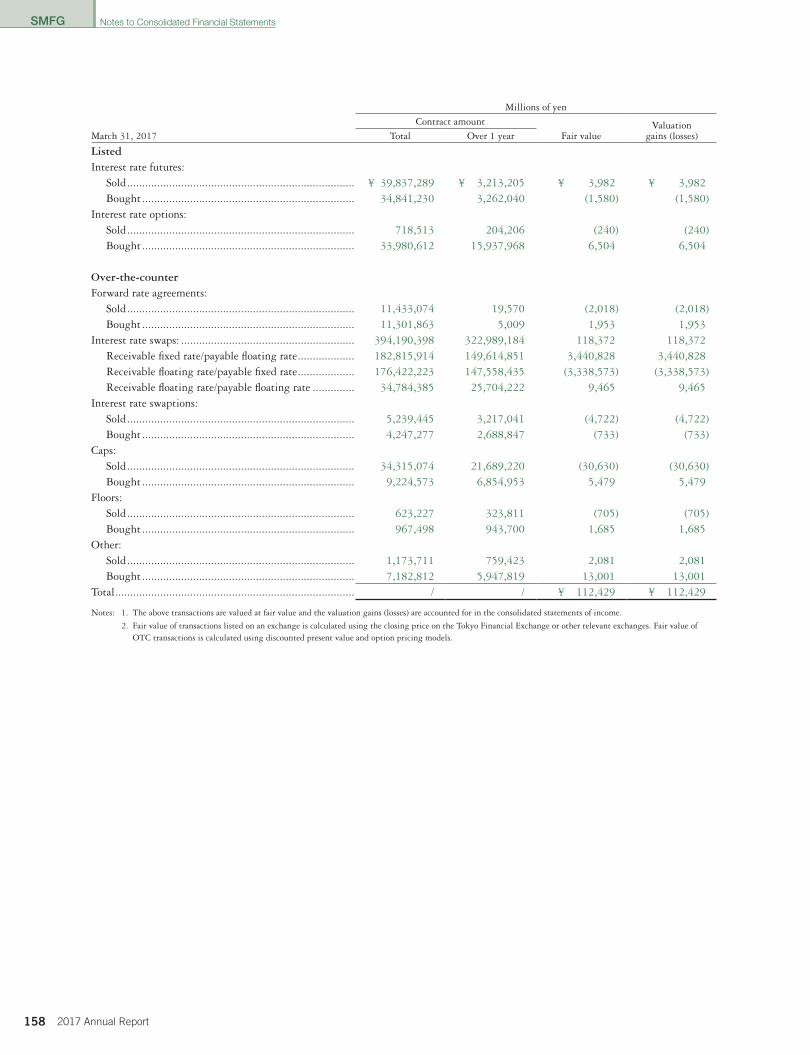
SMFG
158 2017 Annual Report
Millions of yen Contract amount Valuation
gains (losses)March 31, 2017 Total Over 1 year Fair value
Listed Interest rate futures:
Sold ............................................................................ ¥ 39,837,289 ¥ 3,213,205 ¥ 3,982 ¥ 3,982Bought ....................................................................... 34,841,230 3,262,040 (1,580) (1,580)
Interest rate options:Sold ............................................................................ 718,513 204,206 (240) (240)Bought ....................................................................... 33,980,612 15,937,968 6,504 6,504
Over-the-counterForward rate agreements:
Sold ............................................................................ 11,433,074 19,570 (2,018) (2,018)Bought ....................................................................... 11,301,863 5,009 1,953 1,953
Interest rate swaps: .......................................................... 394,190,398 322,989,184 118,372 118,372Receivable fixed rate/payable floating rate ................... 182,815,914 149,614,851 3,440,828 3,440,828Receivable floating rate/payable fixed rate ................... 176,422,223 147,558,435 (3,338,573) (3,338,573)Receivable floating rate/payable floating rate .............. 34,784,385 25,704,222 9,465 9,465
Interest rate swaptions:Sold ............................................................................ 5,239,445 3,217,041 (4,722) (4,722)Bought ....................................................................... 4,247,277 2,688,847 (733) (733)
Caps:Sold ............................................................................ 34,315,074 21,689,220 (30,630) (30,630)Bought ....................................................................... 9,224,573 6,854,953 5,479 5,479
Floors:Sold ............................................................................ 623,227 323,811 (705) (705)Bought ....................................................................... 967,498 943,700 1,685 1,685
Other:Sold ............................................................................ 1,173,711 759,423 2,081 2,081Bought ....................................................................... 7,182,812 5,947,819 13,001 13,001
Total ................................................................................ / / ¥ 112,429 ¥ 112,429
Notes: 1. The above transactions are valued at fair value and the valuation gains (losses) are accounted for in the consolidated statements of income.
2. Fair value of transactions listed on an exchange is calculated using the closing price on the Tokyo Financial Exchange or other relevant exchanges. Fair value of OTC transactions is calculated using discounted present value and option pricing models.
Notes to Consolidated Financial Statements
010_0800801372908.indd 158 2017/08/07 14:04:34

SMFG
1592017 Annual Report
(2) Currency derivatives
Millions of yen Contract amount
Fair valueValuation
gains (losses)March 31, 2016 Total Over 1 year
Listed Currency futures:
Sold ............................................................................ ¥ 658 ¥ — ¥ 17 ¥ 17Bought ....................................................................... 32 — 0 0
Over-the-counterCurrency swaps ................................................................ 33,811,276 24,295,023 387,527 15,992Currency swaptions:
Sold ............................................................................ 621,538 576,940 (5,697) (5,697)Bought ....................................................................... 785,064 735,396 5,823 5,823
Forward foreign exchange ................................................ 56,831,766 7,266,262 7,441 7,441Currency options:
Sold ............................................................................ 2,692,132 1,560,230 (138,718) (138,718)Bought ....................................................................... 2,558,291 1,381,862 112,318 112,318
Total ................................................................................ / / ¥ 368,712 ¥ (2,822)
Notes: 1. The above transactions are valued at fair value and the valuation gains (losses) are accounted for in the consolidated statements of income.
2. Fair value of transactions listed on exchange is calculated using the closing price on the Tokyo Financial Exchange or other relevant exchanges. Fair value of OTC transactions is calculated using discounted present value, option pricing models and other methodologies.
Millions of yen Contract amount
Fair valueValuation
gains (losses)March 31, 2017 Total Over 1 year
Listed Currency futures:
Sold ............................................................................ ¥ 1,559 ¥ — ¥ (18) ¥ (18)Bought ....................................................................... 701 — 0 0
Over-the-counterCurrency swaps ................................................................ 36,267,949 27,100,479 246,213 32,616Currency swaptions:
Sold ............................................................................ 669,791 636,245 (3,328) (3,328)Bought ....................................................................... 793,518 751,472 3,594 3,594
Forward foreign exchange ................................................ 74,917,450 7,537,097 (77,907) (77,907)Currency options:
Sold ............................................................................ 2,478,270 1,404,036 (87,132) (86,625)Bought ....................................................................... 2,289,036 1,280,452 79,065 78,559
Total ................................................................................ / / ¥160,485 ¥(53,110)
Notes: 1. The above transactions are valued at fair value and the valuation gains (losses) are accounted for in the consolidated statements of income.
2. Fair value of transactions listed on exchange is calculated using the closing price on the Tokyo Financial Exchange or other relevant exchanges. Fair value of OTC transactions is calculated using discounted present value, option pricing models and other methodologies.
Notes to Consolidated Financial Statements
010_0800801372908.indd 159 2017/08/07 14:04:34
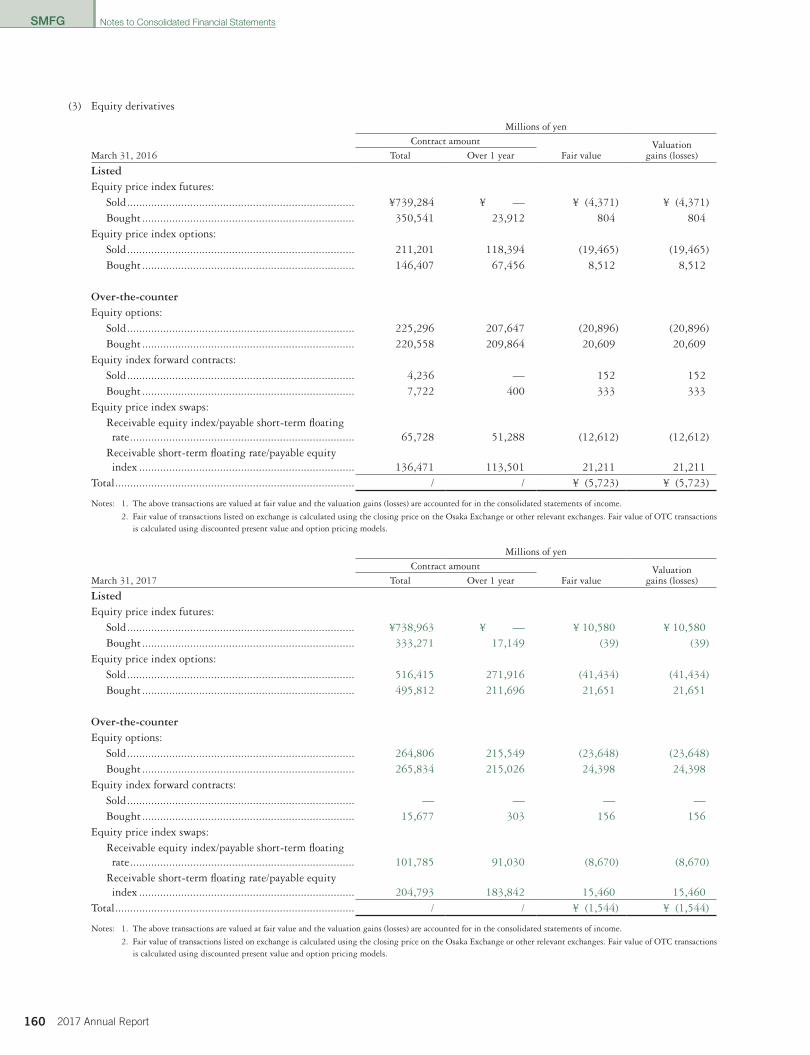
SMFG
160 2017 Annual Report
(3) Equity derivatives
Millions of yen Contract amount
Fair value Valuation
gains (losses)March 31, 2016 Total Over 1 year
Listed Equity price index futures:
Sold ............................................................................ ¥739,284 ¥ — ¥ (4,371) ¥ (4,371)Bought ....................................................................... 350,541 23,912 804 804
Equity price index options:Sold ............................................................................ 211,201 118,394 (19,465) (19,465)Bought ....................................................................... 146,407 67,456 8,512 8,512
Over-the-counterEquity options:
Sold ............................................................................ 225,296 207,647 (20,896) (20,896)Bought ....................................................................... 220,558 209,864 20,609 20,609
Equity index forward contracts:Sold ............................................................................ 4,236 — 152 152Bought ....................................................................... 7,722 400 333 333
Equity price index swaps:Receivable equity index/payable short-term floating rate ........................................................................... 65,728 51,288 (12,612) (12,612)
Receivable short-term floating rate/payable equity index ........................................................................ 136,471 113,501 21,211 21,211
Total ................................................................................ / / ¥ (5,723) ¥ (5,723)
Notes: 1. The above transactions are valued at fair value and the valuation gains (losses) are accounted for in the consolidated statements of income.
2. Fair value of transactions listed on exchange is calculated using the closing price on the Osaka Exchange or other relevant exchanges. Fair value of OTC transactions is calculated using discounted present value and option pricing models.
Millions of yen Contract amount
Fair value Valuation
gains (losses)March 31, 2017 Total Over 1 year
Listed Equity price index futures:
Sold ............................................................................ ¥738,963 ¥ — ¥ 10,580 ¥ 10,580Bought ....................................................................... 333,271 17,149 (39) (39)
Equity price index options:Sold ............................................................................ 516,415 271,916 (41,434) (41,434)Bought ....................................................................... 495,812 211,696 21,651 21,651
Over-the-counterEquity options:
Sold ............................................................................ 264,806 215,549 (23,648) (23,648)Bought ....................................................................... 265,834 215,026 24,398 24,398
Equity index forward contracts:Sold ............................................................................ — — — —Bought ....................................................................... 15,677 303 156 156
Equity price index swaps:Receivable equity index/payable short-term floating rate ........................................................................... 101,785 91,030 (8,670) (8,670)
Receivable short-term floating rate/payable equity index ........................................................................ 204,793 183,842 15,460 15,460
Total ................................................................................ / / ¥ (1,544) ¥ (1,544)
Notes: 1. The above transactions are valued at fair value and the valuation gains (losses) are accounted for in the consolidated statements of income.
2. Fair value of transactions listed on exchange is calculated using the closing price on the Osaka Exchange or other relevant exchanges. Fair value of OTC transactions is calculated using discounted present value and option pricing models.
Notes to Consolidated Financial Statements
010_0800801372908.indd 160 2017/08/07 14:04:34

SMFG
1612017 Annual Report
(4) Bond derivatives
Millions of yen Contract amount
Fair valueValuation
gains (losses)March 31, 2016 Total Over 1 year
Listed Bond futures:
Sold ............................................................................ ¥2,881,937 ¥ — ¥(11,472) ¥(11,472)Bought ....................................................................... 2,533,396 — 10,038 10,038
Bond futures options:Sold ............................................................................ 158,794 — (362) (362)Bought ....................................................................... 31,426 — 26 26
Over-the-counterBond options:
Sold ............................................................................ 455,731 — (11) (11)Bought ....................................................................... 382,507 119,292 737 737
Total ................................................................................ / / ¥ (1,043) ¥ (1,043)
Notes: 1. The above transactions are valued at fair value and the valuation gains (losses) are accounted for in the consolidated statements of income.
2. Fair value of transactions listed on exchange is calculated using the closing price on the Osaka Exchange or other relevant exchanges. Fair value of OTC transactions is calculated using option pricing models.
Millions of yen Contract amount
Fair valueValuation
gains (losses)March 31, 2017 Total Over 1 year
Listed Bond futures:
Sold ............................................................................ ¥2,201,646 ¥ — ¥(5,334) ¥(5,334)Bought ....................................................................... 1,665,948 — 6,633 6,633
Bond futures options:Sold ............................................................................ 283,595 — (124) (124)Bought ....................................................................... 29,100 — 24 24
Over-the-counterBond forward contract:
Sold ............................................................................ 2,051 — 25 25Bought ....................................................................... — — — —
Bond options:Sold ............................................................................ 212,475 — (341) (341)Bought ....................................................................... 320,867 104,888 774 774
Total ................................................................................ / / ¥ 1,657 ¥ 1,657
Notes: 1. The above transactions are valued at fair value and the valuation gains (losses) are accounted for in the consolidated statements of income.
2. Fair value of transactions listed on exchange is calculated using the closing price on the Osaka Exchange or other relevant exchanges. Fair value of OTC transactions is calculated using option pricing models.
Notes to Consolidated Financial Statements
010_0800801372908.indd 161 2017/08/07 14:04:34

SMFG
162 2017 Annual Report
(5) Commodity derivatives
Millions of yen Contract amount
Fair value Valuation
gains (losses) March 31, 2016 Total Over 1 year
Listed Commodity futures:
Sold ............................................................................ ¥ 7,458 ¥ — ¥ 377 ¥ 377Bought ....................................................................... 7,841 — (590) (590)
Over-the-counterCommodity swaps:
Receivable fixed price/payable floating price ............... 82,658 54,945 21,539 21,539Receivable floating price/payable fixed price ............... 80,511 52,227 (19,680) (19,680)Receivable floating price/payable floating price ........... 3,141 3,061 299 299
Commodity options:Sold ............................................................................ 19,191 16,972 (967) (967)Bought ....................................................................... 15,141 13,044 (1) (1)
Total ................................................................................ / / ¥ 975 ¥ 975
Notes: 1. The above transactions are valued at fair value and the valuation gains (losses) are accounted for in the consolidated statements of income.
2. Fair value of transactions listed on exchange is calculated using the closing price on the New York Mercantile Exchange or other relevant exchanges. Fair value of OTC transactions is calculated based on factors such as price of the relevant commodity and contract term.
3. Underlying assets of commodity derivatives are fuels and metals.
Millions of yen Contract amount
Fair value Valuation
gains (losses) March 31, 2017 Total Over 1 year
Listed Commodity futures:
Sold ............................................................................ ¥13,929 ¥ — ¥ 75 ¥ 75Bought ....................................................................... 14,638 — (100) (100)
Over-the-counterCommodity swaps:
Receivable fixed price/payable floating price ............... 57,683 27,606 8,191 8,191Receivable floating price/payable fixed price ............... 56,396 25,795 (6,551) (6,551)Receivable floating price/payable floating price ........... 2,444 2,116 (40) (40)
Commodity options:Sold ............................................................................ 15,401 14,168 (726) (726)Bought ....................................................................... 12,477 12,039 70 70
Total ................................................................................ / / ¥ 920 ¥ 920
Notes: 1. The above transactions are valued at fair value and the valuation gains (losses) are accounted for in the consolidated statements of income.
2. Fair value of transactions listed on exchange is calculated using the closing price on the New York Mercantile Exchange or other relevant exchanges. Fair value of OTC transactions is calculated based on factors such as price of the relevant commodity and contract term.
3. Underlying assets of commodity derivatives are fuels and metals.
Notes to Consolidated Financial Statements
010_0800801372908.indd 162 2017/08/07 14:04:35
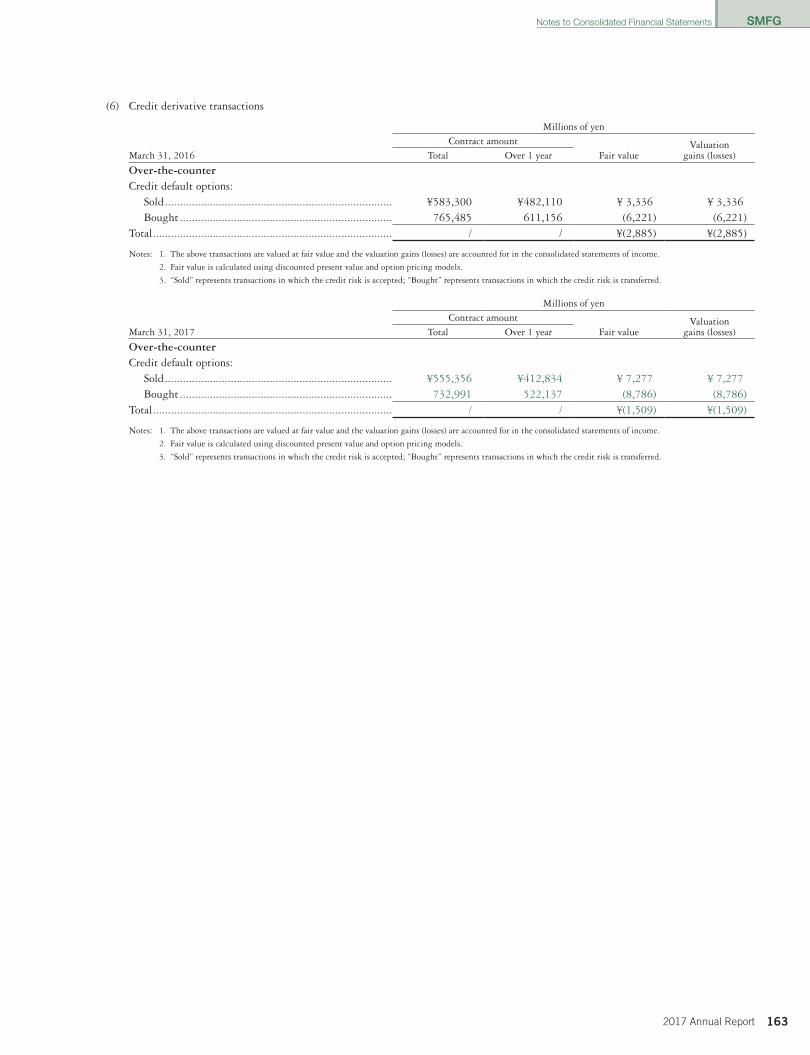
SMFG
1632017 Annual Report
(6) Credit derivative transactions
Millions of yenContract amount
Fair value Valuation
gains (losses)March 31, 2016 Total Over 1 year
Over-the-counter Credit default options:
Sold ............................................................................ ¥583,300 ¥482,110 ¥ 3,336 ¥ 3,336Bought ....................................................................... 765,485 611,156 (6,221) (6,221)
Total ................................................................................ / / ¥(2,885) ¥(2,885)
Notes: 1. The above transactions are valued at fair value and the valuation gains (losses) are accounted for in the consolidated statements of income.
2. Fair value is calculated using discounted present value and option pricing models.
3. “Sold” represents transactions in which the credit risk is accepted; “Bought” represents transactions in which the credit risk is transferred.
Millions of yenContract amount
Fair value Valuation
gains (losses)March 31, 2017 Total Over 1 year
Over-the-counter Credit default options:
Sold ............................................................................ ¥555,356 ¥412,834 ¥ 7,277 ¥ 7,277Bought ....................................................................... 732,991 522,137 (8,786) (8,786)
Total ................................................................................ / / ¥(1,509) ¥(1,509)
Notes: 1. The above transactions are valued at fair value and the valuation gains (losses) are accounted for in the consolidated statements of income.
2. Fair value is calculated using discounted present value and option pricing models.
3. “Sold” represents transactions in which the credit risk is accepted; “Bought” represents transactions in which the credit risk is transferred.
Notes to Consolidated Financial Statements
010_0800801372908.indd 163 2017/08/07 14:04:35
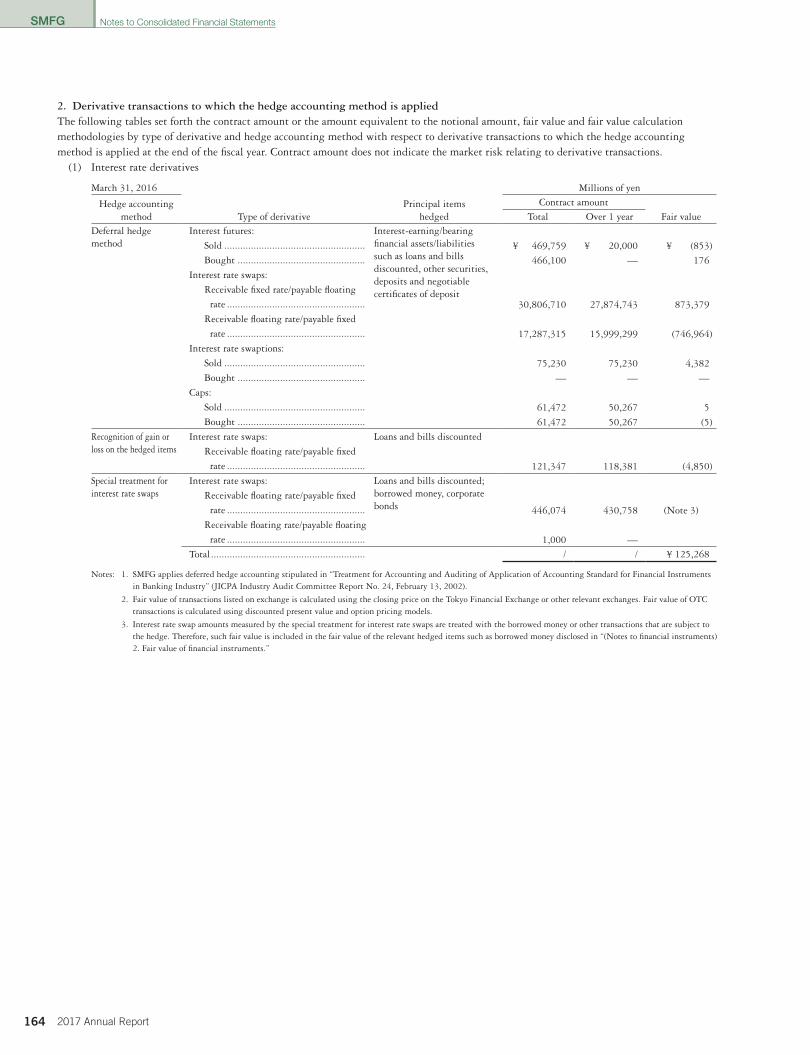
SMFG
164 2017 Annual Report
2. Derivative transactions to which the hedge accounting method is applied The following tables set forth the contract amount or the amount equivalent to the notional amount, fair value and fair value calculation methodologies by type of derivative and hedge accounting method with respect to derivative transactions to which the hedge accounting method is applied at the end of the fiscal year. Contract amount does not indicate the market risk relating to derivative transactions.
(1) Interest rate derivatives
March 31, 2016 Millions of yen
Hedge accountingmethod Type of derivative
Principal itemshedged
Contract amount Fair value Total Over 1 year
Deferral hedge method
Interest futures: Interest-earning/bearing financial assets/liabilitiessuch as loans and bills discounted, other securities, deposits and negotiable certificates of deposit
Sold ..................................................... ¥ 469,759 ¥ 20,000 ¥ (853)
Bought ................................................ 466,100 — 176 Interest rate swaps:
Receivable fixed rate/payable floating
rate .................................................... 30,806,710 27,874,743 873,379 Receivable floating rate/payable fixed
rate .................................................... 17,287,315 15,999,299 (746,964) Interest rate swaptions:
Sold ..................................................... 75,230 75,230 4,382 Bought ................................................ — — — Caps:
Sold ..................................................... 61,472 50,267 5 Bought ................................................ 61,472 50,267 (5)Recognition of gain or loss on the hedged items
Interest rate swaps: Loans and bills discounted
Receivable floating rate/payable fixed
rate .................................................... 121,347 118,381 (4,850)Special treatment for interest rate swaps
Interest rate swaps: Loans and bills discounted; borrowed money, corporate bonds (Note 3)
Receivable floating rate/payable fixed
rate .................................................... 446,074 430,758Receivable floating rate/payable floating
rate .................................................... 1,000 — Total .......................................................... / / ¥ 125,268
Notes: 1. SMFG applies deferred hedge accounting stipulated in “Treatment for Accounting and Auditing of Application of Accounting Standard for Financial Instruments in Banking Industry” (JICPA Industry Audit Committee Report No. 24, February 13, 2002).
2. Fair value of transactions listed on exchange is calculated using the closing price on the Tokyo Financial Exchange or other relevant exchanges. Fair value of OTC transactions is calculated using discounted present value and option pricing models.
3. Interest rate swap amounts measured by the special treatment for interest rate swaps are treated with the borrowed money or other transactions that are subject to the hedge. Therefore, such fair value is included in the fair value of the relevant hedged items such as borrowed money disclosed in “(Notes to financial instruments) 2. Fair value of financial instruments.”
Notes to Consolidated Financial Statements
010_0800801372908.indd 164 2017/08/07 14:04:35
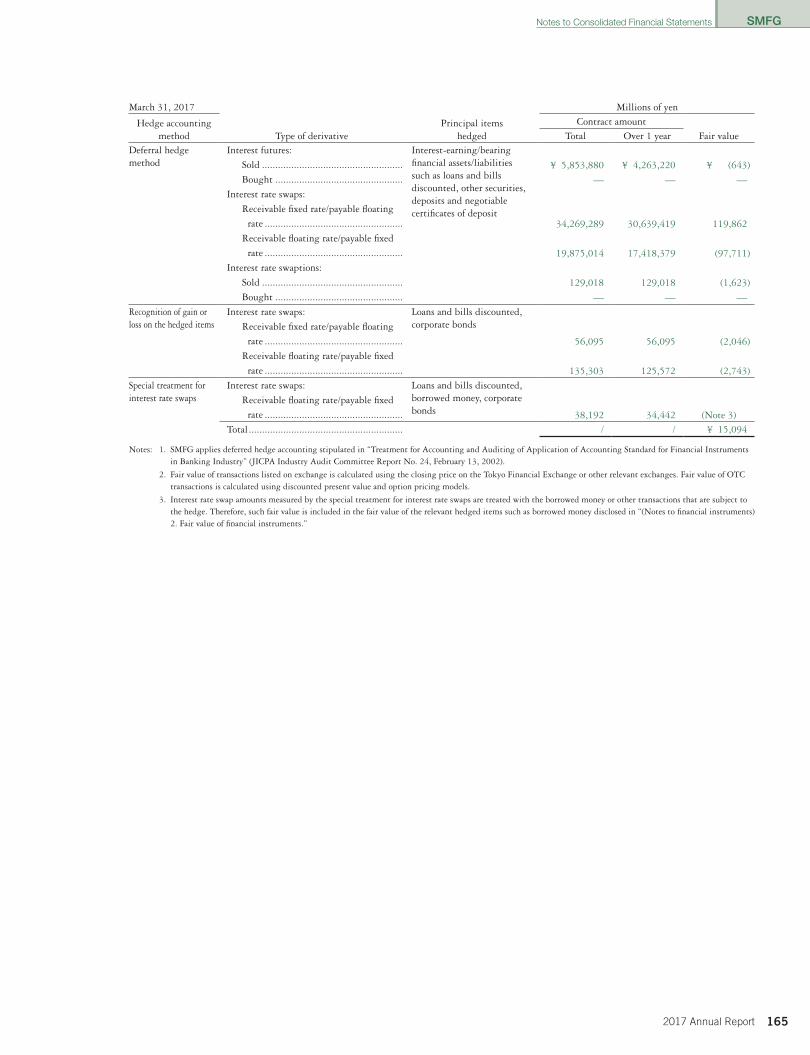
SMFG
1652017 Annual Report
March 31, 2017 Millions of yen
Hedge accountingmethod Type of derivative
Principal itemshedged
Contract amount Fair value Total Over 1 year
Deferral hedge method
Interest futures: Interest-earning/bearing financial assets/liabilitiessuch as loans and bills discounted, other securities, deposits and negotiable certificates of deposit
Sold ..................................................... ¥ 5,853,880 ¥ 4,263,220 ¥ (643)
Bought ................................................ — — — Interest rate swaps:
Receivable fixed rate/payable floating
rate .................................................... 34,269,289 30,639,419 119,862 Receivable floating rate/payable fixed
rate .................................................... 19,875,014 17,418,379 (97,711) Interest rate swaptions:
Sold ..................................................... 129,018 129,018 (1,623) Bought ................................................ — — —Recognition of gain or loss on the hedged items
Interest rate swaps: Loans and bills discounted, corporate bondsReceivable fixed rate/payable floating
rate .................................................... 56,095 56,095 (2,046)Receivable floating rate/payable fixed
rate .................................................... 135,303 125,572 (2,743)Special treatment for interest rate swaps
Interest rate swaps: Loans and bills discounted, borrowed money, corporate bonds (Note 3)
Receivable floating rate/payable fixed
rate .................................................... 38,192 34,442 Total .......................................................... / / ¥ 15,094
Notes: 1. SMFG applies deferred hedge accounting stipulated in “Treatment for Accounting and Auditing of Application of Accounting Standard for Financial Instruments in Banking Industry” (JICPA Industry Audit Committee Report No. 24, February 13, 2002).
2. Fair value of transactions listed on exchange is calculated using the closing price on the Tokyo Financial Exchange or other relevant exchanges. Fair value of OTC transactions is calculated using discounted present value and option pricing models.
3. Interest rate swap amounts measured by the special treatment for interest rate swaps are treated with the borrowed money or other transactions that are subject to the hedge. Therefore, such fair value is included in the fair value of the relevant hedged items such as borrowed money disclosed in “(Notes to financial instruments) 2. Fair value of financial instruments.”
Notes to Consolidated Financial Statements
010_0800801372908.indd 165 2017/08/07 14:04:35
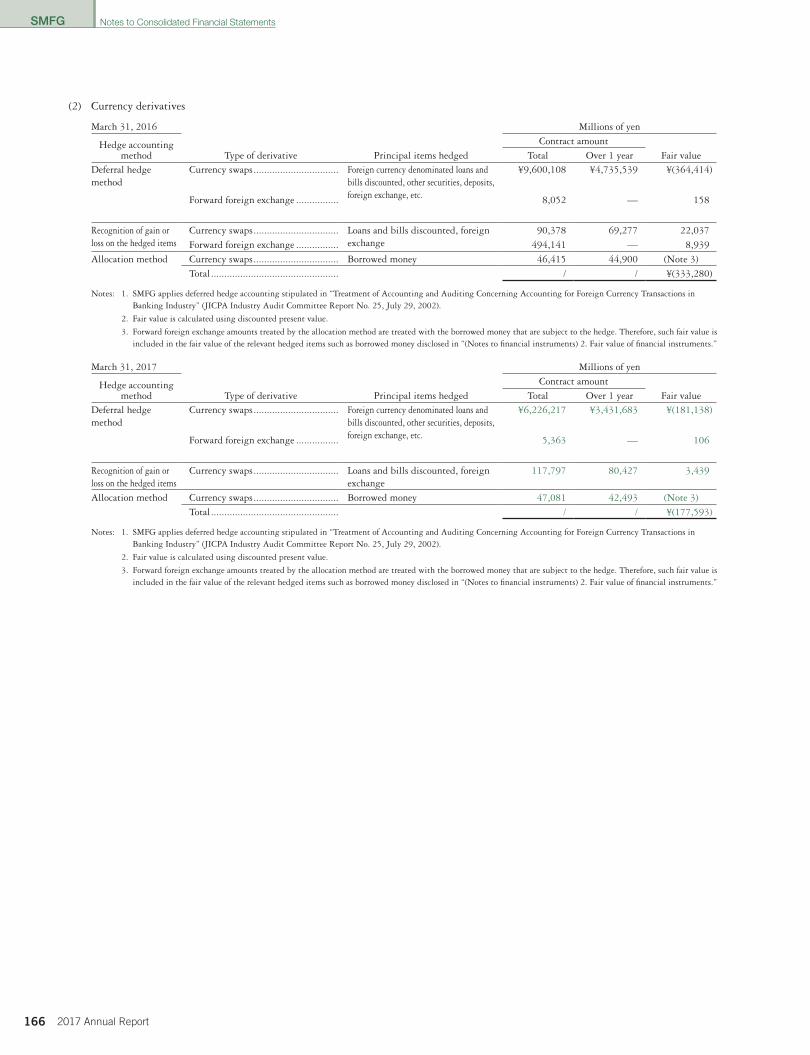
SMFG
166 2017 Annual Report
(2) Currency derivatives
March 31, 2016 Millions of yen
Hedge accountingmethod
Type of derivative
Principal items hedged
Contract amount Total Over 1 year Fair value
Deferral hedge method
Currency swaps ................................ Foreign currency denominated loans and bills discounted, other securities, deposits, foreign exchange, etc.
¥9,600,108 ¥4,735,539 ¥(364,414)
Forward foreign exchange ................ 8,052 — 158
Recognition of gain or loss on the hedged items
Currency swaps ................................ Loans and bills discounted, foreign exchange
90,378 69,277 22,037Forward foreign exchange ................ 494,141 — 8,939
Allocation method Currency swaps ................................ Borrowed money 46,415 44,900 (Note 3) Total ................................................ / / ¥(333,280)
Notes: 1. SMFG applies deferred hedge accounting stipulated in “Treatment of Accounting and Auditing Concerning Accounting for Foreign Currency Transactions in Banking Industry” (JICPA Industry Audit Committee Report No. 25, July 29, 2002).
2. Fair value is calculated using discounted present value.
3. Forward foreign exchange amounts treated by the allocation method are treated with the borrowed money that are subject to the hedge. Therefore, such fair value is included in the fair value of the relevant hedged items such as borrowed money disclosed in “(Notes to financial instruments) 2. Fair value of financial instruments.”
March 31, 2017 Millions of yen
Hedge accountingmethod
Type of derivative
Principal items hedged
Contract amount Total Over 1 year Fair value
Deferral hedge method
Currency swaps ................................ Foreign currency denominated loans and bills discounted, other securities, deposits, foreign exchange, etc.
¥6,226,217 ¥3,431,683 ¥(181,138)
Forward foreign exchange ................ 5,363 — 106
Recognition of gain or loss on the hedged items
Currency swaps ................................ Loans and bills discounted, foreign exchange
117,797 80,427 3,439
Allocation method Currency swaps ................................ Borrowed money 47,081 42,493 (Note 3) Total ................................................ / / ¥(177,593)
Notes: 1. SMFG applies deferred hedge accounting stipulated in “Treatment of Accounting and Auditing Concerning Accounting for Foreign Currency Transactions in Banking Industry” (JICPA Industry Audit Committee Report No. 25, July 29, 2002).
2. Fair value is calculated using discounted present value.
3. Forward foreign exchange amounts treated by the allocation method are treated with the borrowed money that are subject to the hedge. Therefore, such fair value is included in the fair value of the relevant hedged items such as borrowed money disclosed in “(Notes to financial instruments) 2. Fair value of financial instruments.”
Notes to Consolidated Financial Statements
010_0800801372908.indd 166 2017/08/07 14:04:35
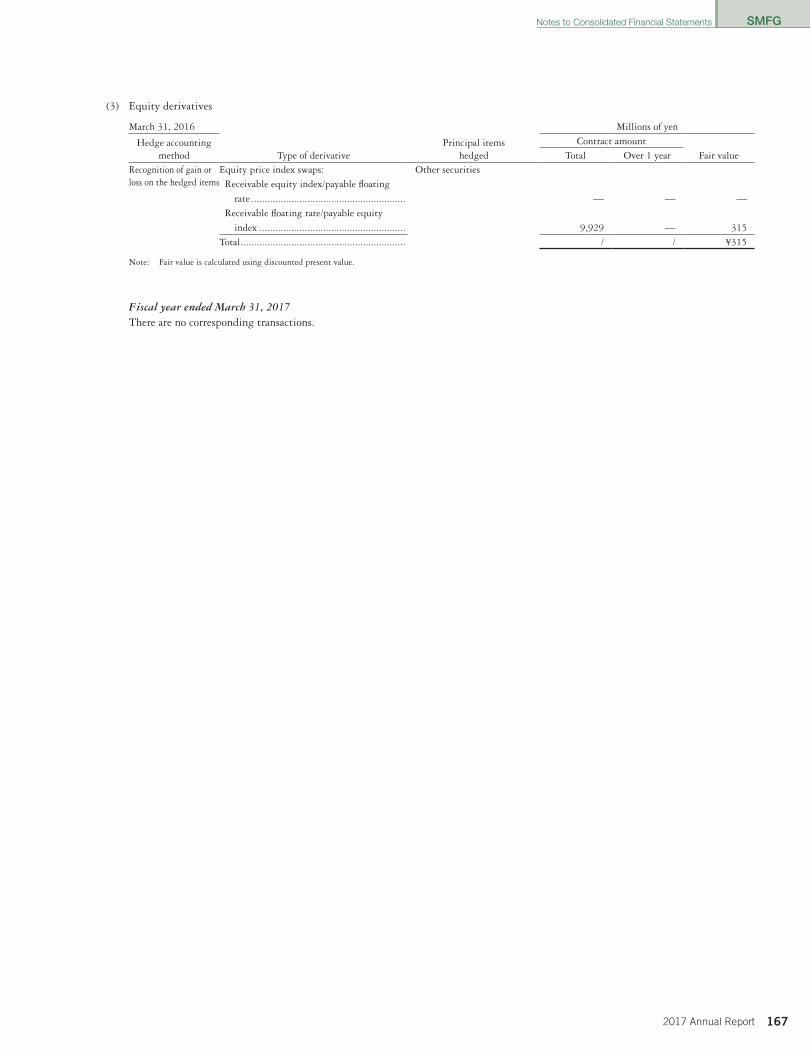
SMFG
1672017 Annual Report
(3) Equity derivatives
March 31, 2016 Millions of yen
Hedge accountingmethod Type of derivative
Principal itemshedged
Contract amount Total Over 1 year Fair value
Recognition of gain or loss on the hedged items
Equity price index swaps: Other securities Receivable equity index/payable floating
rate .......................................................... — — — Receivable floating rate/payable equity
index .......................................................
9,929 — 315 Total .............................................................. / / ¥315
Note: Fair value is calculated using discounted present value.
Fiscal year ended March 31, 2017There are no corresponding transactions.
Notes to Consolidated Financial Statements
010_0800801372908.indd 167 2017/08/07 14:04:35
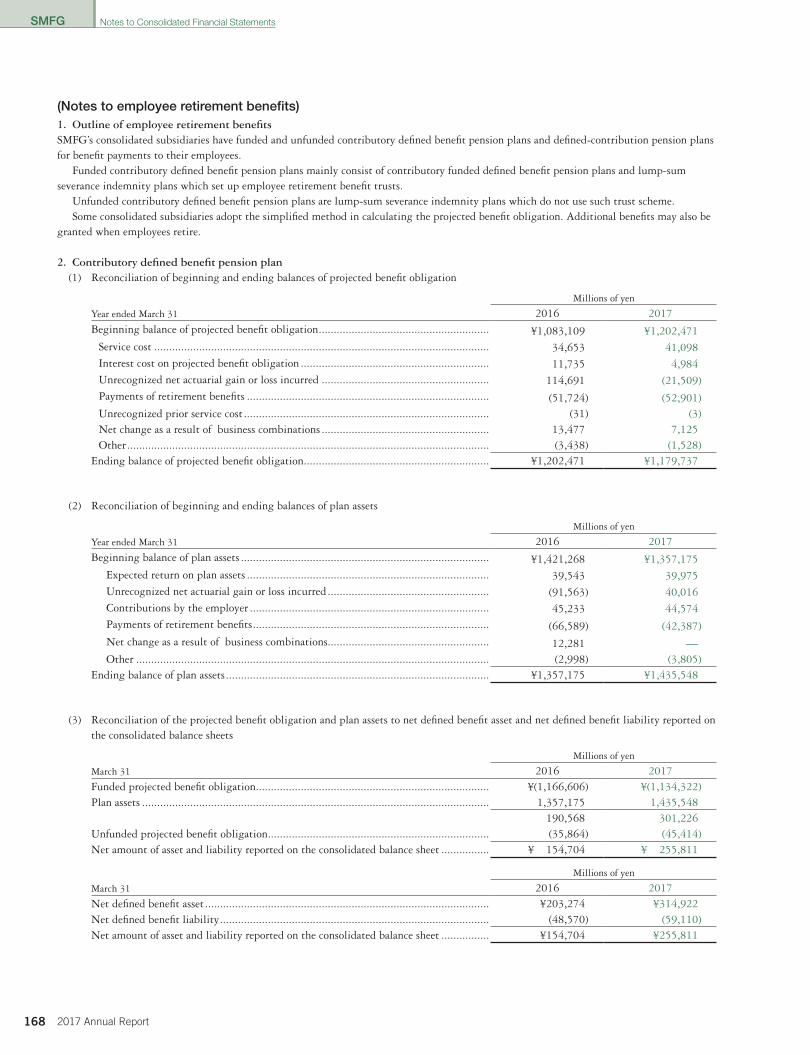
SMFG
168 2017 Annual Report
(Notes to employee retirement benefits)1. Outline of employee retirement benefits SMFG’s consolidated subsidiaries have funded and unfunded contributory defined benefit pension plans and defined-contribution pension plans for benefit payments to their employees.
Funded contributory defined benefit pension plans mainly consist of contributory funded defined benefit pension plans and lump-sum severance indemnity plans which set up employee retirement benefit trusts.
Unfunded contributory defined benefit pension plans are lump-sum severance indemnity plans which do not use such trust scheme.Some consolidated subsidiaries adopt the simplified method in calculating the projected benefit obligation. Additional benefits may also be
granted when employees retire.
2. Contributory defined benefit pension plan(1) Reconciliation of beginning and ending balances of projected benefit obligation
Millions of yen
Year ended March 31 2016 2017Beginning balance of projected benefit obligation ......................................................... ¥1,083,109 ¥1,202,471
Service cost ................................................................................................................ 34,653 41,098Interest cost on projected benefit obligation ............................................................... 11,735 4,984Unrecognized net actuarial gain or loss incurred ........................................................ 114,691 (21,509)Payments of retirement benefits ................................................................................. (51,724) (52,901)Unrecognized prior service cost .................................................................................. (31) (3)Net change as a result of business combinations ........................................................ 13,477 7,125Other ......................................................................................................................... (3,438) (1,528)
Ending balance of projected benefit obligation .............................................................. ¥1,202,471 ¥1,179,737
(2) Reconciliation of beginning and ending balances of plan assets
Millions of yen
Year ended March 31 2016 2017Beginning balance of plan assets ................................................................................... ¥1,421,268 ¥1,357,175
Expected return on plan assets ................................................................................. 39,543 39,975Unrecognized net actuarial gain or loss incurred ...................................................... (91,563) 40,016Contributions by the employer ................................................................................ 45,233 44,574Payments of retirement benefits ............................................................................... (66,589) (42,387)Net change as a result of business combinations...................................................... 12,281 —Other ...................................................................................................................... (2,998) (3,805)
Ending balance of plan assets ........................................................................................ ¥1,357,175 ¥1,435,548
(3) Reconciliation of the projected benefit obligation and plan assets to net defined benefit asset and net defined benefit liability reported on the consolidated balance sheets
Millions of yen
March 31 2016 2017Funded projected benefit obligation .............................................................................. ¥(1,166,606) ¥(1,134,322)Plan assets .................................................................................................................... 1,357,175 1,435,548
190,568 301,226Unfunded projected benefit obligation .......................................................................... (35,864) (45,414)Net amount of asset and liability reported on the consolidated balance sheet ................ ¥ 154,704 ¥ 255,811
Millions of yen
March 31 2016 2017Net defined benefit asset ............................................................................................... ¥203,274 ¥314,922Net defined benefit liability .......................................................................................... (48,570) (59,110)Net amount of asset and liability reported on the consolidated balance sheet ................ ¥154,704 ¥255,811
Notes to Consolidated Financial Statements
010_0800801372908.indd 168 2017/08/07 14:04:35
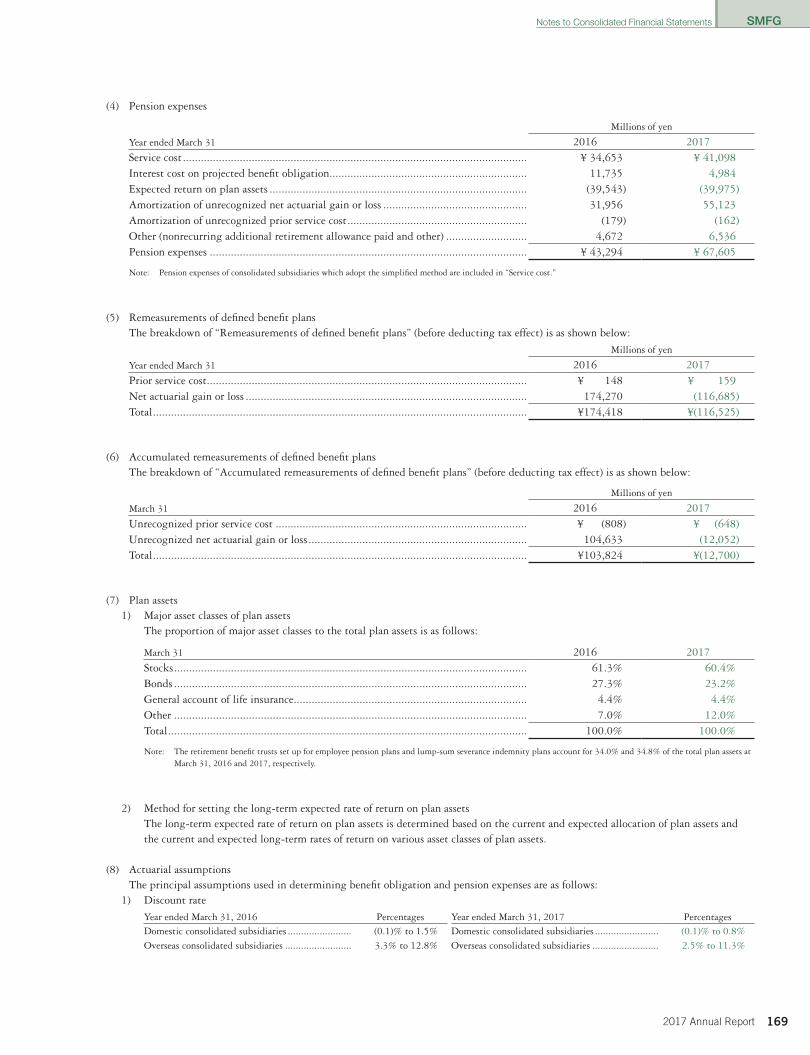
SMFG
1692017 Annual Report
(4) Pension expenses
Millions of yen
Year ended March 31 2016 2017Service cost ................................................................................................................... ¥ 34,653 ¥ 41,098Interest cost on projected benefit obligation .................................................................. 11,735 4,984Expected return on plan assets ...................................................................................... (39,543) (39,975)Amortization of unrecognized net actuarial gain or loss ................................................ 31,956 55,123Amortization of unrecognized prior service cost ............................................................ (179) (162)Other (nonrecurring additional retirement allowance paid and other) ........................... 4,672 6,536Pension expenses .......................................................................................................... ¥ 43,294 ¥ 67,605
Note: Pension expenses of consolidated subsidiaries which adopt the simplified method are included in “Service cost.”
(5) Remeasurements of defined benefit plansThe breakdown of “Remeasurements of defined benefit plans” (before deducting tax effect) is as shown below:
Millions of yen
Year ended March 31 2016 2017Prior service cost ........................................................................................................... ¥ 148 ¥ 159Net actuarial gain or loss .............................................................................................. 174,270 (116,685)Total ............................................................................................................................. ¥174,418 ¥(116,525)
(6) Accumulated remeasurements of defined benefit plansThe breakdown of “Accumulated remeasurements of defined benefit plans” (before deducting tax effect) is as shown below:
Millions of yen
March 31 2016 2017Unrecognized prior service cost .................................................................................... ¥ (808) ¥ (648)Unrecognized net actuarial gain or loss ......................................................................... 104,633 (12,052)Total ............................................................................................................................. ¥103,824 ¥(12,700)
(7) Plan assets1) Major asset classes of plan assets
The proportion of major asset classes to the total plan assets is as follows:
March 31 2016 2017Stocks ...................................................................................................................... 61.3% 60.4%Bonds ...................................................................................................................... 27.3% 23.2%General account of life insurance .............................................................................. 4.4% 4.4%Other ...................................................................................................................... 7.0% 12.0%Total ........................................................................................................................ 100.0% 100.0%
Note: The retirement benefit trusts set up for employee pension plans and lump-sum severance indemnity plans account for 34.0% and 34.8% of the total plan assets at March 31, 2016 and 2017, respectively.
2) Method for setting the long-term expected rate of return on plan assetsThe long-term expected rate of return on plan assets is determined based on the current and expected allocation of plan assets and the current and expected long-term rates of return on various asset classes of plan assets.
(8) Actuarial assumptions The principal assumptions used in determining benefit obligation and pension expenses are as follows:
1) Discount rate
Year ended March 31, 2016 Percentages Year ended March 31, 2017 PercentagesDomestic consolidated subsidiaries ........................ (0.1)% to 1.5% Domestic consolidated subsidiaries ........................ (0.1)% to 0.8%Overseas consolidated subsidiaries ......................... 3.3% to 12.8% Overseas consolidated subsidiaries ......................... 2.5% to 11.3%
Notes to Consolidated Financial Statements
010_0800801372908.indd 169 2017/08/07 14:04:35
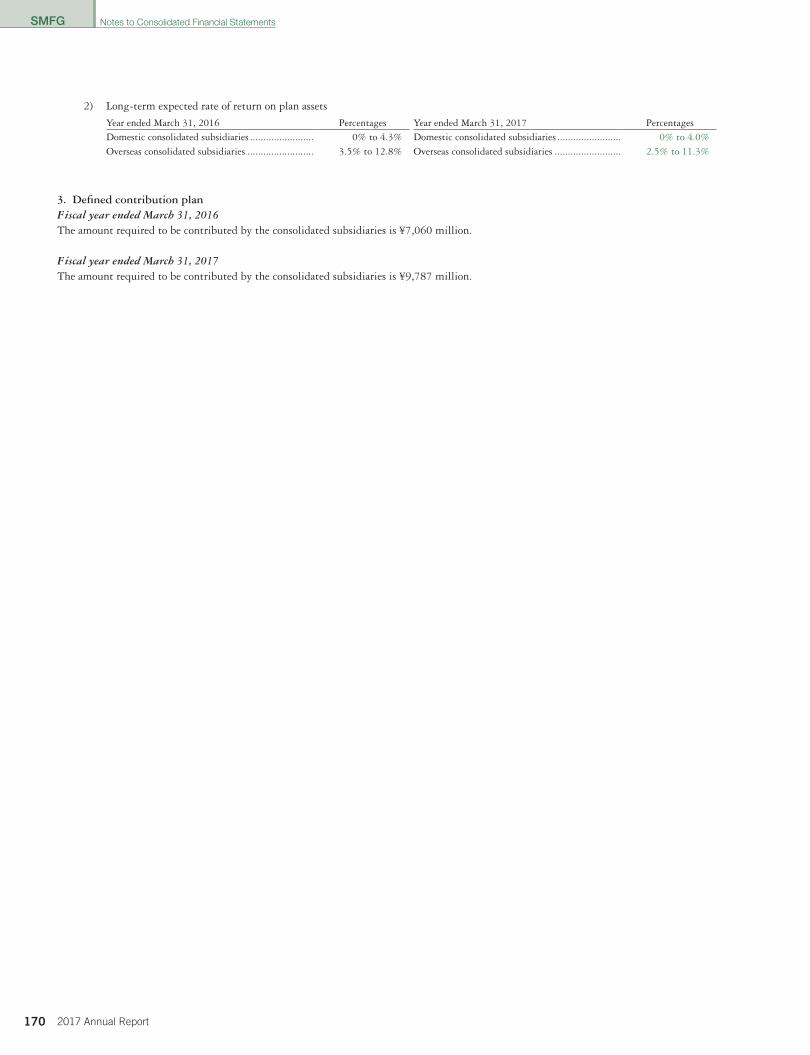
SMFG
170 2017 Annual Report
2) Long-term expected rate of return on plan assets
Year ended March 31, 2016 Percentages Year ended March 31, 2017 PercentagesDomestic consolidated subsidiaries ........................ 0% to 4.3% Domestic consolidated subsidiaries ........................ 0% to 4.0%Overseas consolidated subsidiaries ......................... 3.5% to 12.8% Overseas consolidated subsidiaries ......................... 2.5% to 11.3%
3. Defined contribution planFiscal year ended March 31, 2016The amount required to be contributed by the consolidated subsidiaries is ¥7,060 million.
Fiscal year ended March 31, 2017The amount required to be contributed by the consolidated subsidiaries is ¥9,787 million.
Notes to Consolidated Financial Statements
010_0800801372908.indd 170 2017/08/07 14:04:35
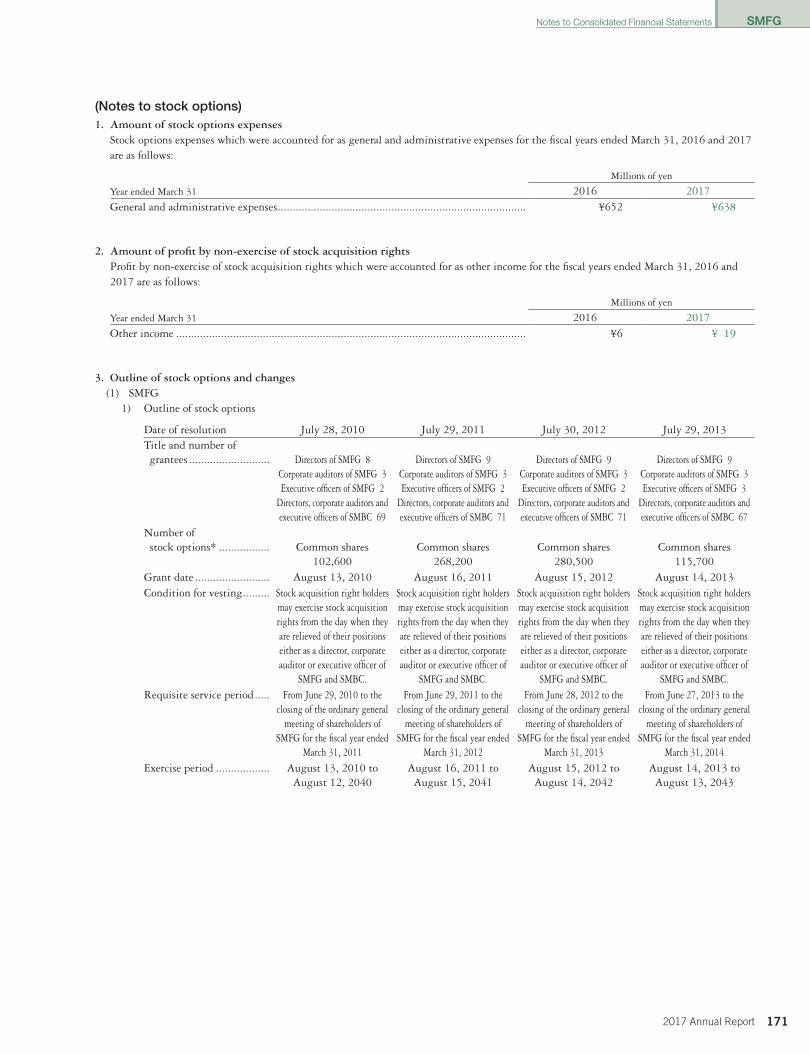
SMFG
1712017 Annual Report
(Notes to stock options) 1. Amount of stock options expenses
Stock options expenses which were accounted for as general and administrative expenses for the fiscal years ended March 31, 2016 and 2017 are as follows:
Millions of yen
Year ended March 31 2016 2017General and administrative expenses ................................................................................... ¥652 ¥638
2. Amount of profit by non-exercise of stock acquisition rightsProfit by non-exercise of stock acquisition rights which were accounted for as other income for the fiscal years ended March 31, 2016 and 2017 are as follows:
Millions of yen
Year ended March 31 2016 2017Other income ..................................................................................................................... ¥6 ¥ 19
3. Outline of stock options and changes (1) SMFG
1) Outline of stock options
Date of resolution July 28, 2010 July 29, 2011 July 30, 2012 July 29, 2013Title and number of grantees ........................... Directors of SMFG 8
Corporate auditors of SMFG 3Executive officers of SMFG 2
Directors, corporate auditors and executive officers of SMBC 69
Directors of SMFG 9Corporate auditors of SMFG 3Executive officers of SMFG 2
Directors, corporate auditors and executive officers of SMBC 71
Directors of SMFG 9Corporate auditors of SMFG 3Executive officers of SMFG 2
Directors, corporate auditors and executive officers of SMBC 71
Directors of SMFG 9Corporate auditors of SMFG 3Executive officers of SMFG 3
Directors, corporate auditors and executive officers of SMBC 67
Number of stock options* ................. Common shares
102,600Common shares
268,200Common shares
280,500Common shares
115,700Grant date ......................... August 13, 2010 August 16, 2011 August 15, 2012 August 14, 2013Condition for vesting ......... Stock acquisition right holders
may exercise stock acquisition rights from the day when they are relieved of their positions either as a director, corporate auditor or executive officer of
SMFG and SMBC.
Stock acquisition right holders may exercise stock acquisition rights from the day when they are relieved of their positions either as a director, corporate auditor or executive officer of
SMFG and SMBC.
Stock acquisition right holders may exercise stock acquisition rights from the day when they are relieved of their positions either as a director, corporate auditor or executive officer of
SMFG and SMBC.
Stock acquisition right holders may exercise stock acquisition rights from the day when they are relieved of their positions either as a director, corporate auditor or executive officer of
SMFG and SMBC.Requisite service period ..... From June 29, 2010 to the
closing of the ordinary general meeting of shareholders of
SMFG for the fiscal year ended March 31, 2011
From June 29, 2011 to the closing of the ordinary general
meeting of shareholders of SMFG for the fiscal year ended
March 31, 2012
From June 28, 2012 to the closing of the ordinary general
meeting of shareholders of SMFG for the fiscal year ended
March 31, 2013
From June 27, 2013 to the closing of the ordinary general
meeting of shareholders of SMFG for the fiscal year ended
March 31, 2014Exercise period .................. August 13, 2010 to
August 12, 2040August 16, 2011 to
August 15, 2041August 15, 2012 to
August 14, 2042August 14, 2013 to
August 13, 2043
Notes to Consolidated Financial Statements
010_0800801372908.indd 171 2017/08/07 14:04:35
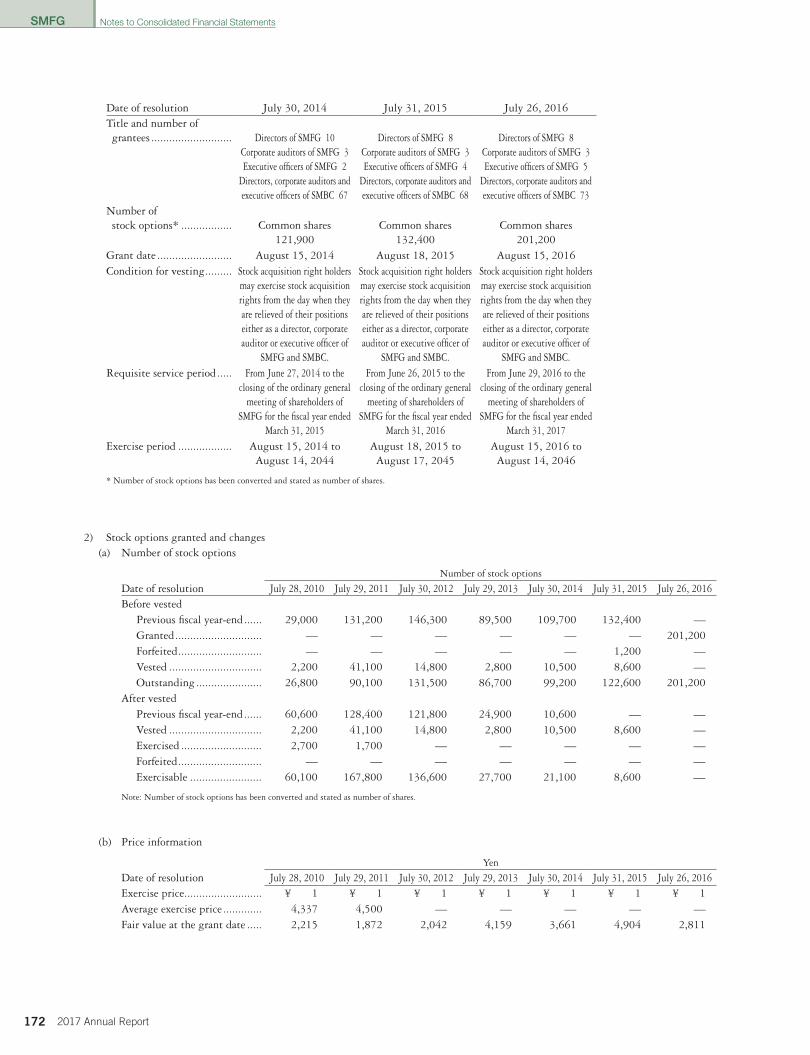
SMFG
172 2017 Annual Report
Date of resolution July 30, 2014 July 31, 2015 July 26, 2016Title and number of grantees ........................... Directors of SMFG 10
Corporate auditors of SMFG 3Executive officers of SMFG 2
Directors, corporate auditors and executive officers of SMBC 67
Directors of SMFG 8Corporate auditors of SMFG 3Executive officers of SMFG 4
Directors, corporate auditors and executive officers of SMBC 68
Directors of SMFG 8 Corporate auditors of SMFG 3Executive officers of SMFG 5
Directors, corporate auditors and executive officers of SMBC 73
Number of stock options* ................. Common shares
121,900Common shares
132,400Common shares
201,200Grant date ......................... August 15, 2014 August 18, 2015 August 15, 2016Condition for vesting ......... Stock acquisition right holders
may exercise stock acquisition rights from the day when they are relieved of their positions either as a director, corporate auditor or executive officer of
SMFG and SMBC.
Stock acquisition right holders may exercise stock acquisition rights from the day when they are relieved of their positions either as a director, corporate auditor or executive officer of
SMFG and SMBC.
Stock acquisition right holders may exercise stock acquisition rights from the day when they are relieved of their positions either as a director, corporate auditor or executive officer of
SMFG and SMBC.Requisite service period ..... From June 27, 2014 to the
closing of the ordinary general meeting of shareholders of
SMFG for the fiscal year ended March 31, 2015
From June 26, 2015 to the closing of the ordinary general
meeting of shareholders of SMFG for the fiscal year ended
March 31, 2016
From June 29, 2016 to the closing of the ordinary general
meeting of shareholders of SMFG for the fiscal year ended
March 31, 2017Exercise period .................. August 15, 2014 to
August 14, 2044August 18, 2015 to
August 17, 2045August 15, 2016 to
August 14, 2046
* Number of stock options has been converted and stated as number of shares.
2) Stock options granted and changes(a) Number of stock options
Number of stock options
Date of resolution July 28, 2010 July 29, 2011 July 30, 2012 July 29, 2013 July 30, 2014 July 31, 2015 July 26, 2016Before vested
Previous fiscal year-end ...... 29,000 131,200 146,300 89,500 109,700 132,400 —Granted ............................. — — — — — — 201,200Forfeited ............................ — — — — — 1,200 —Vested ............................... 2,200 41,100 14,800 2,800 10,500 8,600 —Outstanding ...................... 26,800 90,100 131,500 86,700 99,200 122,600 201,200
After vestedPrevious fiscal year-end ...... 60,600 128,400 121,800 24,900 10,600 — —Vested ............................... 2,200 41,100 14,800 2,800 10,500 8,600 —Exercised ........................... 2,700 1,700 — — — — —Forfeited ............................ — — — — — — —Exercisable ........................ 60,100 167,800 136,600 27,700 21,100 8,600 —
Note: Number of stock options has been converted and stated as number of shares.
(b) Price information
Yen
Date of resolution July 28, 2010 July 29, 2011 July 30, 2012 July 29, 2013 July 30, 2014 July 31, 2015 July 26, 2016Exercise price .......................... ¥ 1 ¥ 1 ¥ 1 ¥ 1 ¥ 1 ¥ 1 ¥ 1Average exercise price ............. 4,337 4,500 — — — — —Fair value at the grant date ..... 2,215 1,872 2,042 4,159 3,661 4,904 2,811
Notes to Consolidated Financial Statements
010_0800801372908.indd 172 2017/08/07 14:04:35
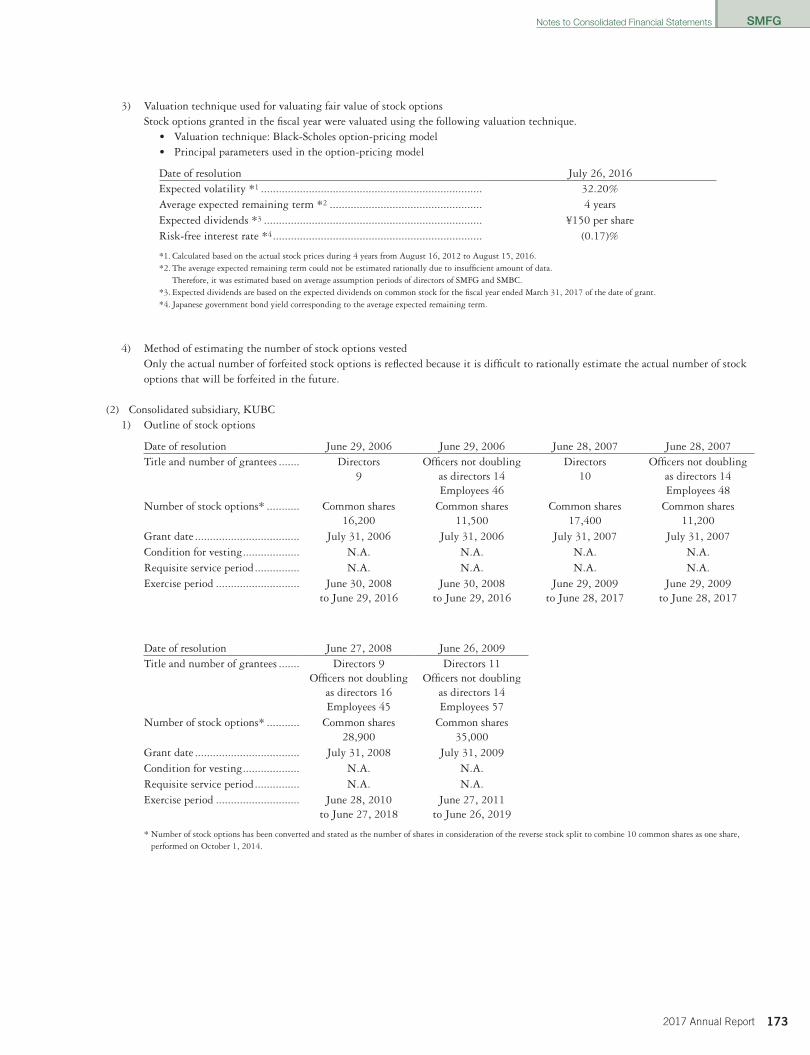
SMFG
1732017 Annual Report
3) Valuation technique used for valuating fair value of stock optionsStock options granted in the fiscal year were valuated using the following valuation technique.
• Valuation technique: Black-Scholes option-pricing model• Principal parameters used in the option-pricing model
Date of resolution July 26, 2016Expected volatility *1 .......................................................................... 32.20%Average expected remaining term *2 ................................................... 4 yearsExpected dividends *3 ......................................................................... ¥150 per shareRisk-free interest rate *4 ...................................................................... (0.17)%
*1. Calculated based on the actual stock prices during 4 years from August 16, 2012 to August 15, 2016.*2. The average expected remaining term could not be estimated rationally due to insufficient amount of data.
Therefore, it was estimated based on average assumption periods of directors of SMFG and SMBC.*3. Expected dividends are based on the expected dividends on common stock for the fiscal year ended March 31, 2017 of the date of grant. *4. Japanese government bond yield corresponding to the average expected remaining term.
4) Method of estimating the number of stock options vestedOnly the actual number of forfeited stock options is reflected because it is difficult to rationally estimate the actual number of stock options that will be forfeited in the future.
(2) Consolidated subsidiary, KUBC 1) Outline of stock options
Date of resolution June 29, 2006 June 29, 2006 June 28, 2007 June 28, 2007Title and number of grantees ....... Directors
9Officers not doubling
as directors 14Employees 46
Directors10
Officers not doubling as directors 14Employees 48
Number of stock options* ........... Common shares16,200
Common shares11,500
Common shares17,400
Common shares11,200
Grant date ................................... July 31, 2006 July 31, 2006 July 31, 2007 July 31, 2007Condition for vesting ................... N.A. N.A. N.A. N.A.Requisite service period ............... N.A. N.A. N.A. N.A.Exercise period ............................ June 30, 2008
to June 29, 2016June 30, 2008
to June 29, 2016June 29, 2009
to June 28, 2017June 29, 2009
to June 28, 2017
Date of resolution June 27, 2008 June 26, 2009Title and number of grantees ....... Directors 9
Officers not doubling as directors 16Employees 45
Directors 11Officers not doubling
as directors 14Employees 57
Number of stock options* ........... Common shares28,900
Common shares35,000
Grant date ................................... July 31, 2008 July 31, 2009Condition for vesting ................... N.A. N.A.Requisite service period ............... N.A. N.A.Exercise period ............................ June 28, 2010
to June 27, 2018June 27, 2011
to June 26, 2019
* Number of stock options has been converted and stated as the number of shares in consideration of the reverse stock split to combine 10 common shares as one share, performed on October 1, 2014.
Notes to Consolidated Financial Statements
010_0800801372908.indd 173 2017/08/07 14:04:35
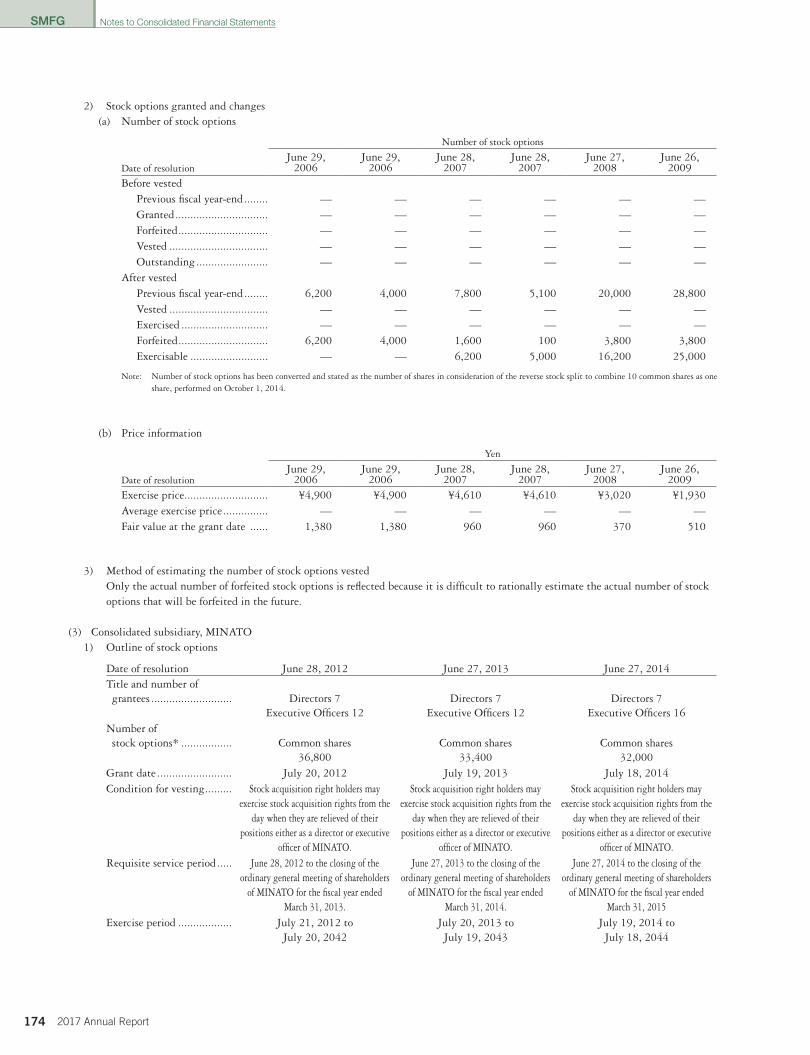
SMFG
174 2017 Annual Report
2) Stock options granted and changes(a) Number of stock options
Number of stock options
Date of resolutionJune 29,
2006June 29,
2006June 28,
2007June 28,
2007June 27,
2008June 26,
2009Before vested
Previous fiscal year-end ........ — — — — — —Granted ............................... — — — — — —Forfeited .............................. — — — — — —Vested ................................. — — — — — —Outstanding ........................ — — — — — —
After vested Previous fiscal year-end ........ 6,200 4,000 7,800 5,100 20,000 28,800Vested ................................. — — — — — —Exercised ............................. — — — — — —Forfeited .............................. 6,200 4,000 1,600 100 3,800 3,800Exercisable .......................... — — 6,200 5,000 16,200 25,000
Note: Number of stock options has been converted and stated as the number of shares in consideration of the reverse stock split to combine 10 common shares as one share, performed on October 1, 2014.
(b) Price information
Yen
Date of resolutionJune 29,
2006June 29,
2006June 28,
2007June 28,
2007June 27,
2008June 26,
2009Exercise price ............................ ¥4,900 ¥4,900 ¥4,610 ¥4,610 ¥3,020 ¥1,930 Average exercise price ............... — — — — — —Fair value at the grant date ...... 1,380 1,380 960 960 370 510
3) Method of estimating the number of stock options vested Only the actual number of forfeited stock options is reflected because it is difficult to rationally estimate the actual number of stock options that will be forfeited in the future.
(3) Consolidated subsidiary, MINATO1) Outline of stock options
Date of resolution June 28, 2012 June 27, 2013 June 27, 2014Title and number of grantees ........................... Directors 7
Executive Officers 12Directors 7
Executive Officers 12Directors 7
Executive Officers 16Number of stock options* ................. Common shares
36,800Common shares
33,400Common shares
32,000Grant date ......................... July 20, 2012 July 19, 2013 July 18, 2014Condition for vesting ......... Stock acquisition right holders may
exercise stock acquisition rights from the day when they are relieved of their
positions either as a director or executive officer of MINATO.
Stock acquisition right holders may exercise stock acquisition rights from the
day when they are relieved of their positions either as a director or executive
officer of MINATO.
Stock acquisition right holders may exercise stock acquisition rights from the
day when they are relieved of their positions either as a director or executive
officer of MINATO.Requisite service period ..... June 28, 2012 to the closing of the
ordinary general meeting of shareholders of MINATO for the fiscal year ended
March 31, 2013.
June 27, 2013 to the closing of the ordinary general meeting of shareholders
of MINATO for the fiscal year ended March 31, 2014.
June 27, 2014 to the closing of the ordinary general meeting of shareholders
of MINATO for the fiscal year ended March 31, 2015
Exercise period .................. July 21, 2012 to July 20, 2042
July 20, 2013 to July 19, 2043
July 19, 2014 to July 18, 2044
Notes to Consolidated Financial Statements
010_0800801372908.indd 174 2017/08/07 14:04:35
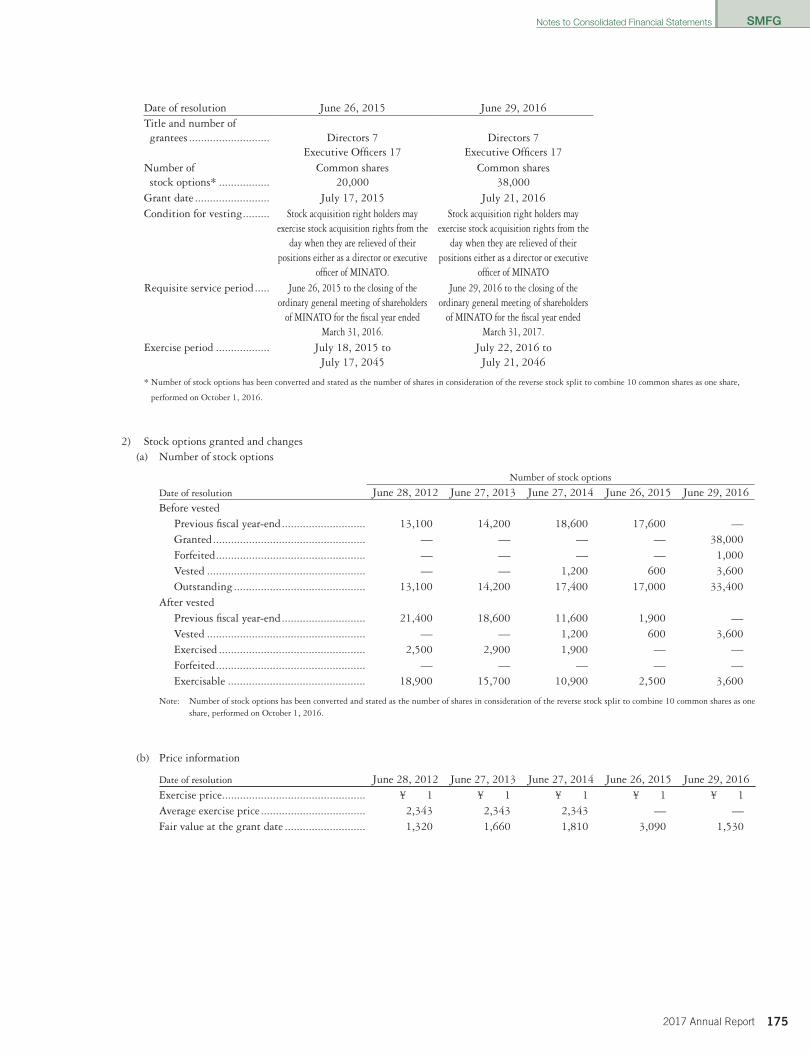
SMFG
1752017 Annual Report
Date of resolution June 26, 2015 June 29, 2016Title and number of grantees ........................... Directors 7
Executive Officers 17Directors 7
Executive Officers 17Number of stock options* .................
Common shares 20,000
Common shares 38,000
Grant date ......................... July 17, 2015 July 21, 2016Condition for vesting ......... Stock acquisition right holders may
exercise stock acquisition rights from the day when they are relieved of their
positions either as a director or executive officer of MINATO.
Stock acquisition right holders may exercise stock acquisition rights from the
day when they are relieved of their positions either as a director or executive
officer of MINATORequisite service period ..... June 26, 2015 to the closing of the
ordinary general meeting of shareholders of MINATO for the fiscal year ended
March 31, 2016.
June 29, 2016 to the closing of the ordinary general meeting of shareholders
of MINATO for the fiscal year ended March 31, 2017.
Exercise period .................. July 18, 2015 to July 17, 2045
July 22, 2016 to July 21, 2046
* Number of stock options has been converted and stated as the number of shares in consideration of the reverse stock split to combine 10 common shares as one share,
performed on October 1, 2016.
2) Stock options granted and changes(a) Number of stock options
Number of stock options
Date of resolution June 28, 2012 June 27, 2013 June 27, 2014 June 26, 2015 June 29, 2016Before vested
Previous fiscal year-end ............................ 13,100 14,200 18,600 17,600 —Granted ................................................... — — — — 38,000Forfeited .................................................. — — — — 1,000Vested ..................................................... — — 1,200 600 3,600Outstanding ............................................ 13,100 14,200 17,400 17,000 33,400
After vestedPrevious fiscal year-end ............................ 21,400 18,600 11,600 1,900 —Vested ..................................................... — — 1,200 600 3,600Exercised ................................................. 2,500 2,900 1,900 — —Forfeited .................................................. — — — — —Exercisable .............................................. 18,900 15,700 10,900 2,500 3,600
Note: Number of stock options has been converted and stated as the number of shares in consideration of the reverse stock split to combine 10 common shares as one share, performed on October 1, 2016.
(b) Price information
Date of resolution June 28, 2012 June 27, 2013 June 27, 2014 June 26, 2015 June 29, 2016Exercise price ................................................ ¥ 1 ¥ 1 ¥ 1 ¥ 1 ¥ 1Average exercise price ................................... 2,343 2,343 2,343 — —Fair value at the grant date ........................... 1,320 1,660 1,810 3,090 1,530
Notes to Consolidated Financial Statements
010_0800801372908.indd 175 2017/08/07 14:04:35
SMFG
176 2017 Annual Report
3) Valuation technique used for valuating fair value of stock optionsStock options granted in the fiscal year were valuated using the following valuation technique.
• Valuation technique: Black-Scholes option-pricing model• Principal parameters used in the option-pricing model
Date of resolution June 29, 2016Expected volatility*1 ........................................................................... 33.31%Average expected remaining term*2 .................................................... 2 yearsExpected dividends*3 .......................................................................... ¥5 per shareRisk-free interest rate*4 ....................................................................... (0.33)%
*1 Calculated based on the actual stock prices during 2 years from July 22, 2014 to July 21, 2016.*2 The average expected remaining term could not be estimated rationally due to insufficient amount of data. Therefore, it was estimated based on average assumption
periods of directors of MINATO.*3 Expected dividends are based on the actual dividends on common stock for the fiscal year ended March 31, 2016.*4 Japanese government bond yield corresponding to the average expected remaining term.
4) Method of estimating the number of stock options vestedOnly the actual number of forfeited stock options is reflected because it is difficult to rationally estimate the actual number of stock options that will be forfeited in the future.
Notes to Consolidated Financial Statements
010_0800801372908.indd 176 2017/08/07 14:04:35
SMFG
1772017 Annual Report
(Notes to deferred tax assets and liabilities)1. Significant components of deferred tax assets and liabilities
March 31, 2016 Millions of yen March 31, 2017 Millions of yen
Deferred tax assets: Net operating loss carryforwards ............................ ¥ 450,959Reserve for possible loan losses and write-off of loans .................................................................... 249,877
Write-off of securities ............................................ 59,304Reserve for losses on interest repayment................. 48,170Net defined benefit liability ................................... 39,755Other .................................................................... 208,634Subtotal ................................................................. 1,056,702Valuation allowance ............................................... (493,247)
Total deferred tax assets .............................................. 563,454Deferred tax liabilities:
Net unrealized gains on other securities ................. (586,254)Gains on securities contributed to employee retirement benefits trust ...................................... (33,130)
Undistributed earnings of subsidiaries ................... (21,084)Other .................................................................... (195,892)
Total deferred tax liabilities ........................................ (836,361)Net deferred tax assets (liabilities) .............................. ¥ (272,906)
Deferred tax assets: Net operating loss carryforwards ............................ ¥ 319,801Reserve for possible loan losses and write-off of loans .................................................................... 246,676
Write-off of securities ............................................ 115,451Reserve for losses on interest repayment................. 70,267Net defined benefit liability ................................... 33,116Other .................................................................... 223,969Subtotal ................................................................. 1,009,283Valuation allowance ............................................... (517,459)
Total deferred tax assets .............................................. 491,823Deferred tax liabilities:
Net unrealized gains on other securities ................. (498,610)Gains on securities contributed to employee retirement benefits trust ...................................... (33,593)
Undistributed earnings of subsidiaries ................... (19,284)Other .................................................................... (162,694)
Total deferred tax liabilities ........................................ (714,182)Net deferred tax assets (liabilities) .............................. ¥ (222,358)
As a result of applying the accounting treatments based on the adoption of the consolidated corporate-tax system applying from the fiscal year ending March 31, 2018 by SMFG and some consolidated subsidiaries, total deferred tax assets increased by ¥115,147 million mainly due to decreasing of valuation allowance.
2. Significant components of difference between the statutory tax rate used by SMFG and the effective income tax rate
March 31, 2016 Percentages March 31, 2017 Percentages
Statutory tax rate ........................................................ 33.06%Valuation allowance ............................................... (8.06)Difference between SMFG and overseas consolidated subsidiaries ...................................... (2.42)
Difference of the scope of taxable income between corporate income tax and enterprise income tax ... (1.08)
Dividends exempted for income tax purposes......... (0.61)Effects of changes in the corporate income tax rate . 1.34Equity in losses of affiliates .................................... 1.22Other .................................................................... (0.49)
Effective income tax rate ............................................. 22.96%
Statutory tax rate ........................................................ 30.86%Valuation allowance ............................................... (12.80)Difference between SMFG and overseas consolidated subsidiaries ...................................... (2.29)
Difference of gains on step acquisition ................... (0.92)Dividends exempted for income tax purposes......... (0.87)Impairment losses of goodwill .............................. 1.35Foreign tax ........................................................... 1.15Other .................................................................... 0.98
Effective income tax rate ............................................. 17.46%
(Notes to asset retirement obligations)Fiscal year ended March 31, 2016 There is no significant information to be disclosed.
Fiscal year ended March 31, 2017 There is no significant information to be disclosed.
(Notes to real estate for rent)Fiscal year ended March 31, 2016 There is no significant information to be disclosed.
Fiscal year ended March 31, 2017 There is no significant information to be disclosed.
Notes to Consolidated Financial Statements
010_0800801372908.indd 177 2017/08/07 14:04:35
SMFG
178 2017 Annual Report
(Notes to segment and other related information)[Segment information]1. Summary of reportable segment SMFG Group’s reportable segment is defined as an operating segment for which discrete financial information is available and reviewed by the Board of Directors and SMFG’s Management Committee regularly in order to make decisions about resources to be allocated to the segment and assess its performance.
Besides commercial banking, SMFG Group companies conduct businesses such as leasing, securities, consumer finance, system development and data processing. The primary businesses, “Commercial banking,” “Leasing,” “Securities” and “Consumer Finance,” are separate reportable segments, and other businesses are aggregated as “Other business.”
SMBC assesses business performance by classifying “Commercial banking” into the following 4 business units: “Wholesale banking unit,” “Retail banking unit” and “International banking unit” that are based on the client segment, and “Treasury unit” that is based on the financial markets.
2. Method of calculating profit and loss amount by reportable segment Accounting methods applied to the reported business segment are the same as those described in “(Notes to significant accounting policies for preparing consolidated financial statements).”
SMFG does not assess assets by business segments.
Notes to Consolidated Financial Statements
010_0800801372908.indd 178 2017/08/07 14:04:35

SMFG
1792017 Annual Report
3. Information on profit and loss amount by reportable segment
Millions of yen Commercial banking SMBC
Year ended March 31, 2016SMBC
Sub-total
WholesaleBanking
Unit
RetailBanking
Unit
InternationalBanking
UnitTreasury
UnitHead office
account Others Total
Gross profit ......................... ¥1,534,271 ¥ 545,350 ¥ 372,811 ¥ 355,994 ¥293,570 ¥ (33,453) ¥ 302,987 ¥ 1,837,258Interest income ............... 1,023,576 300,125 302,025 225,437 168,190 27,799 174,431 1,198,007Non-interest income ....... 510,694 245,225 70,786 130,557 125,380 (61,253) 128,555 639,250
Expenses, etc. ...................... (805,483) (205,095) (354,116) (116,484) (29,074) (100,714) (218,991) (1,024,475)Depreciation .................. (92,376) (23,592) (35,577) (10,934) (5,473) (16,800) (11,597) (103,974)
Consolidated net business profit .................... ¥ 728,787 ¥ 340,255 ¥ 18,695 ¥ 239,510 ¥264,496 ¥(134,168) ¥ 83,995 ¥ 812,783
Millions of yen Leasing SecuritiesYear ended March 31, 2016 SMFL Others Total SMBC Nikko SMBC Friend Others Total
Gross profit ......................... ¥142,813 ¥19,740 ¥162,553 ¥ 316,329 ¥ 43,771 ¥ (2,971) ¥ 357,130Interest income ............... 17,847 5,053 22,900 1,605 1,499 1,531 4,636Non-interest income ....... 124,965 14,686 139,652 314,724 42,271 (4,502) 352,493
Expenses, etc. ...................... (62,140) (4,944) (67,084) (255,820) (38,797) (12,652) (307,270)Depreciation ................... (3,170) (5,487) (8,658) (2,895) (1,291) (755) (4,942)
Consolidated net business profit .................... ¥ 80,673 ¥14,795 ¥ 95,468 ¥ 60,509 ¥ 4,974 ¥(15,624) ¥ 49,859
Millions of yen Consumer Finance Other
BusinessGrandTotalYear ended March 31, 2016 SMCC Cedyna SMBCCF Others Total
Gross profit ......................... ¥ 208,514 ¥ 165,143 ¥ 233,388 ¥ 4,467 ¥ 611,512 ¥(64,490) ¥ 2,903,964Interest income ............... 13,579 23,685 156,985 (5,382) 188,867 8,515 1,422,928Non-interest income ....... 194,934 141,458 76,402 9,849 422,645 (73,005) 1,481,036
Expenses, etc. ...................... (157,112) (124,151) (104,843) (11,118) (397,225) 35,023 (1,761,032)Depreciation ................... (12,865) (7,896) (7,028) (824) (28,615) (12,373) (158,564)
Consolidated net business profit .................... ¥ 51,402 ¥ 40,991 ¥ 128,544 ¥ (6,651) ¥ 214,287 ¥(29,467) ¥ 1,142,931
Notes: 1. Figures shown in the parenthesis represent the loss.
2. “SMFL” and “SMBCCF” represent consolidated figures of respective companies.“SMBC Nikko” represents non-consolidated figures of SMBC Nikko plus figures of the overseas incorporated securities companies.“Cedyna” represents consolidated figures of Cedyna excluding figures of the immaterial subsidiaries.
3. “Other business” includes profit or loss to be eliminated as inter-segment transactions.
Notes to Consolidated Financial Statements
010_0800801372908.indd 179 2017/08/07 14:04:35
SMFG
180 2017 Annual Report
Millions of yen Commercial banking SMBC
Year ended March 31, 2017SMBC
Sub-total
WholesaleBanking
Unit
RetailBanking
Unit
InternationalBanking
UnitTreasury
UnitHead office
account Others Total
Gross profit ......................... ¥1,663,654 ¥ 528,376 ¥ 355,288 ¥ 327,529 ¥272,419 ¥ 180,042 ¥ 296,137 ¥ 1,959,791Interest income ............... 1,138,939 271,137 294,799 194,655 144,201 234,147 184,390 1,323,330Non-interest income ....... 524,715 257,239 60,489 132,874 128,218 (54,104) 111,746 636,461
Expenses, etc. ...................... (816,942) (199,080) (350,888) (128,834) (27,375) (110,765) (246,994) (1,063,936)Depreciation .................. (100,552) (26,042) (37,227) (12,494) (5,141) (19,648) (11,940) (112,493)
Consolidated net business profit .................... ¥ 846,711 ¥ 329,296 ¥ 4,400 ¥ 198,695 ¥245,044 ¥ 69,276 ¥ 49,142 ¥ 895,854
Millions of yen Leasing SecuritiesYear ended March 31, 2017 SMFL Others Total SMBC Nikko SMBC Friend Others Total
Gross profit ......................... ¥178,845 ¥17,587 ¥196,433 ¥ 351,220 ¥ 43,334 ¥ (5,767) ¥ 388,788Interest income ............... 25,003 4,189 29,192 4,588 1,581 1,441 7,611Non-interest income ....... 153,842 13,398 167,240 346,632 41,753 (7,208) 381,177
Expenses, etc. ...................... (82,620) (6,815) (89,435) (268,854) (37,458) (9,920) (316,233)Depreciation ................... (3,719) (6,266) (9,985) (2,989) (1,399) (853) (5,242)
Consolidated net business profit .................... ¥ 96,225 ¥10,772 ¥106,997 ¥ 82,366 ¥ 5,876 ¥(15,687) ¥ 72,554
Millions of yen Consumer Finance Other
BusinessGrandTotalYear ended March 31, 2017 SMCC Cedyna SMBCCF Others Total
Gross profit ......................... ¥222,068 ¥168,365 ¥246,288 ¥ 3,737 ¥ 640,459 ¥(264,731) ¥ 2,920,742Interest income ............... 14,501 23,569 162,466 (1,244) 199,292 (200,794) 1,358,632Non-interest income ....... 207,566 144,796 83,822 4,981 441,167 (63,936) 1,562,109
Expenses, etc. ...................... (172,977) (126,952) (104,836) (10,606) (415,372) 97,097 (1,787,881)Depreciation ................... (16,974) (7,181) (6,981) (187) (31,324) (14,504) (173,550)
Consolidated net business profit ...................... ¥ 49,091 ¥ 41,413 ¥141,452 ¥ (6,869) ¥ 225,086 ¥(167,633) ¥ 1,132,860
Notes: 1. Figures shown in the parenthesis represent the loss.
2. Interest income in Commercial banking includes dividends income of ¥200,000 million from SMBC Nikko.
3. “SMFL” and “SMBCCF” represent consolidated figures of respective companies.“SMBC Nikko” represents non-consolidated figures of SMBC Nikko plus figures of the overseas incorporated securities companies.“Cedyna” represents consolidated figures of Cedyna excluding figures of the immaterial subsidiaries.
4. “Other business” includes profit or loss to be eliminated as inter-segment transactions.
4. Difference between total amount of consolidated net business profit by reportable segment and ordinary profit on consolidated statements of income (adjustment of difference)
Year ended March 31, 2016 Millions of yen
Consolidated net business profit ................................................................................................................................ ¥1,142,931Other ordinary income ............................................................................................................................................. 197,494Other ordinary expenses (excluding equity in losses of affiliates) ............................................................................... (355,141)Ordinary profit on consolidated statements of income ............................................................................................... ¥ 985,284
Note: Figures shown in the parenthesis represent losses.
Year ended March 31, 2017 Millions of yen
Consolidated net business profit ................................................................................................................................ ¥1,132,860Other ordinary income (excluding equity in gains of affiliates) .................................................................................. 176,704Other ordinary expenses ........................................................................................................................................... (303,710)Ordinary profit on consolidated statements of income ............................................................................................... ¥1,005,855
Note: Figures shown in the parenthesis represent losses.
Notes to Consolidated Financial Statements
010_0800801372908.indd 180 2017/08/07 14:04:35
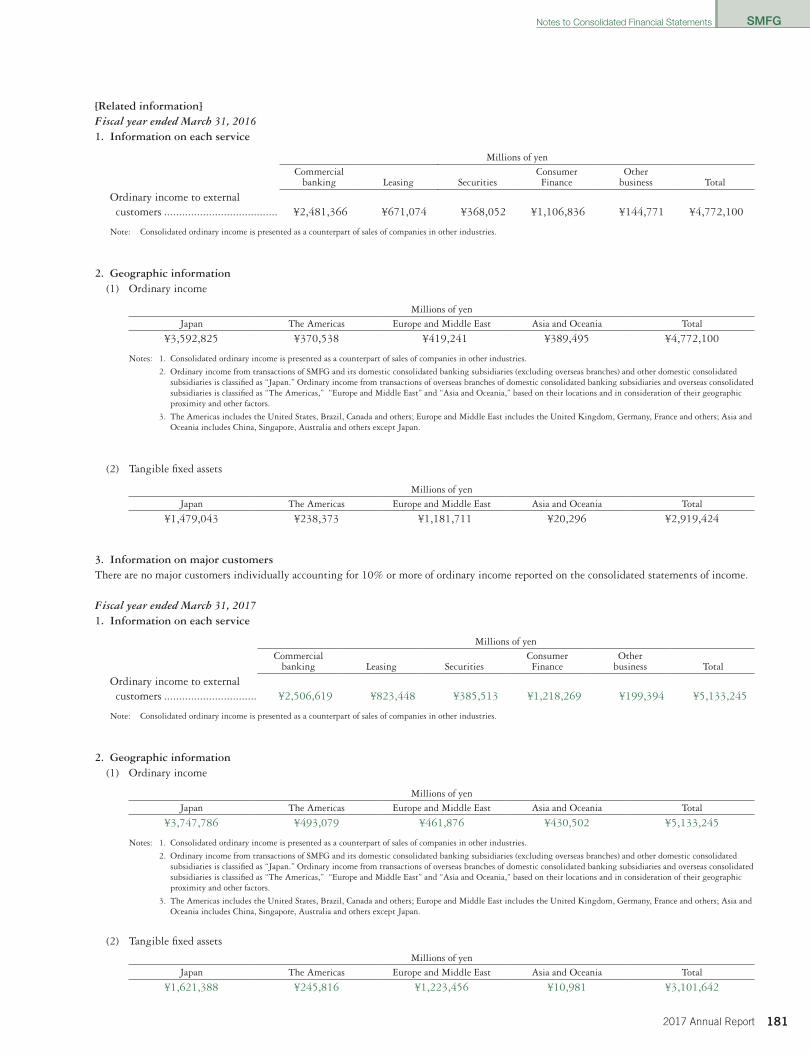
SMFG
1812017 Annual Report
[Related information]Fiscal year ended March 31, 20161. Information on each service
Millions of yen
Commercial
banking Leasing SecuritiesConsumerFinance
Otherbusiness Total
Ordinary income to external customers ...................................... ¥2,481,366 ¥671,074 ¥368,052 ¥1,106,836 ¥144,771 ¥4,772,100
Note: Consolidated ordinary income is presented as a counterpart of sales of companies in other industries.
2. Geographic information (1) Ordinary income
Millions of yenJapan The Americas Europe and Middle East Asia and Oceania Total
¥3,592,825 ¥370,538 ¥419,241 ¥389,495 ¥4,772,100
Notes: 1. Consolidated ordinary income is presented as a counterpart of sales of companies in other industries.
2. Ordinary income from transactions of SMFG and its domestic consolidated banking subsidiaries (excluding overseas branches) and other domestic consolidated subsidiaries is classified as “Japan.” Ordinary income from transactions of overseas branches of domestic consolidated banking subsidiaries and overseas consolidated subsidiaries is classified as “The Americas,” “Europe and Middle East” and “Asia and Oceania,” based on their locations and in consideration of their geographic proximity and other factors.
3. The Americas includes the United States, Brazil, Canada and others; Europe and Middle East includes the United Kingdom, Germany, France and others; Asia and Oceania includes China, Singapore, Australia and others except Japan.
(2) Tangible fixed assets
Millions of yenJapan The Americas Europe and Middle East Asia and Oceania Total
¥1,479,043 ¥238,373 ¥1,181,711 ¥20,296 ¥2,919,424
3. Information on major customers There are no major customers individually accounting for 10% or more of ordinary income reported on the consolidated statements of income.
Fiscal year ended March 31, 20171. Information on each service
Millions of yen
Commercial
banking Leasing SecuritiesConsumerFinance
Otherbusiness Total
Ordinary income to external customers ............................... ¥2,506,619 ¥823,448 ¥385,513 ¥1,218,269 ¥199,394 ¥5,133,245
Note: Consolidated ordinary income is presented as a counterpart of sales of companies in other industries.
2. Geographic information (1) Ordinary income
Millions of yenJapan The Americas Europe and Middle East Asia and Oceania Total
¥3,747,786 ¥493,079 ¥461,876 ¥430,502 ¥5,133,245
Notes: 1. Consolidated ordinary income is presented as a counterpart of sales of companies in other industries.
2. Ordinary income from transactions of SMFG and its domestic consolidated banking subsidiaries (excluding overseas branches) and other domestic consolidated subsidiaries is classified as “Japan.” Ordinary income from transactions of overseas branches of domestic consolidated banking subsidiaries and overseas consolidated subsidiaries is classified as “The Americas,” “Europe and Middle East” and “Asia and Oceania,” based on their locations and in consideration of their geographic proximity and other factors.
3. The Americas includes the United States, Brazil, Canada and others; Europe and Middle East includes the United Kingdom, Germany, France and others; Asia and Oceania includes China, Singapore, Australia and others except Japan.
(2) Tangible fixed assets
Millions of yenJapan The Americas Europe and Middle East Asia and Oceania Total
¥1,621,388 ¥245,816 ¥1,223,456 ¥10,981 ¥3,101,642
Notes to Consolidated Financial Statements
010_0800801372908.indd 181 2017/08/07 14:04:35

SMFG
182 2017 Annual Report
3. Information on major customers There are no major customers individually accounting for 10% or more of ordinary income reported on the consolidated statements of income.
[Information on impairment loss for fixed assets by reportable segment]
Millions of yen
Year ended March 31,2016Commercial
Banking Leasing Securities Consumer finance Other business Total
Impairment loss ............................. ¥4,076 ¥— ¥241 ¥0 ¥43 ¥4,362
Millions of yen
Year ended March 31,2017Commercial
Banking Leasing Securities Consumer finance Other business Total
Impairment loss ............................. ¥4,838 ¥— ¥44,491 ¥130 ¥— ¥49,460
Note: Impairment loss of goodwill of ¥42,995 million relating to SMBC Friend is included in “Securities.”
[Information on amortization of goodwill and unamortized balance by reportable segment]
Millions of yen
Year ended March 31, 2016Commercial
Banking Leasing Securities Consumer finance Other business Total
Amortization of goodwill .............. ¥ 3,237 ¥ 6,375 ¥ 14,013 ¥ 4,019 ¥23 ¥ 27,670Unamortized balance ..................... 34,262 68,526 174,188 62,160 47 339,185
Millions of yen
Year ended March 31, 2017Commercial
Banking Leasing Securities Consumer finance Other business Total
Amortization of goodwill .............. ¥ 2,734 ¥ 7,053 ¥ 14,013 ¥ 4,019 ¥ 1,450 ¥ 29,272Unamortized balance ..................... 31,527 75,081 117,179 58,140 36,649 318,578
[Information on gains on negative goodwill by reportable segment]Fiscal year ended March 31, 2016There is no significant information to be disclosed.
Fiscal year ended March 31, 2017There are no corresponding transactions.
[Information on total credit cost by reportable segment]
Millions of yen
Year ended March 31, 2016Commercial
banking Leasing SecuritiesConsumer
finance Other business Total
Total credit cost ............................. ¥10,333 ¥(1,491) ¥(197) ¥91,425 ¥2,750 ¥102,820
Notes: 1. Total credit cost = Provision for reserve for possible loan losses + Write-off loans + Losses on sales of delinquent loans – Recoveries of written-off claims.
2. “Other business” includes profit or loss to be eliminated as inter-segment transactions.
3. Figures shown in the parenthesis represent the reversal of total credit cost.
Millions of yen
Year ended March 31, 2017Commercial
banking Leasing SecuritiesConsumer
finance Other business Total
Total credit cost ............................. ¥58,968 ¥3,705 ¥(97) ¥98,630 ¥3,164 ¥164,371
Notes: 1. Total credit cost = Provision for reserve for possible loan losses + Write-off loans + Losses on sales of delinquent loans – Recoveries of written-off claims.
2. “Other business” includes profit or loss to be eliminated as inter-segment transactions.
3. Figures shown in the parenthesis represent the reversal of total credit cost.
Notes to Consolidated Financial Statements
010_0800801372908.indd 182 2017/08/07 14:04:35
SMFG
1832017 Annual Report
[Information on related parties]Fiscal year ended March 31, 2016There is no significant corresponding information to be disclosed.
Fiscal year ended March 31, 2017There is no significant corresponding information to be disclosed.
(Business Combination)<Business Combination through acquisition>GE Japan GK became a consolidated subsidiary of SMFL
On April 1, 2016, SMFL, a consolidated subsidiary of SMFG, acquired all shares of GE Japan GK (“GE Japan”) under the contract agreed with General Electric Company on December 15, 2015. As a result, GE Japan and its 5 leasing subsidiaries became consolidated subsidiaries of SMFG. The outline of the business combination through acquisition is as described below.
On September 5, 2016, GE Japan changed its form to a joint stock corporation with limited liability (Kabushiki Kaisha) and its name to SMFL Capital Company, Limited.
1. Outline of the business combination(1) Name of the acquired company and details of its business
GE Japan GK (Leasing business)(2) Main reasons for the business combination
SMFG aims at achieving further improvement in corporate value of SMFG and strengthening its top-class position in the domestic leasing market, by leveraging business knowledge and resources from both SMFL and GE Japan.
(3) Date of the business combinationApril 1, 2016
(4) Legal form of the business combinationAcquisition of shares
(5) Name of the entity after the business combinationSumitomo Mitsui Financial Group, Inc.
(6) The ratio of acquired voting rights100%
(7) Grounds for deciding on the acquirerSMFL acquired all shares of GE Capital by cash.
2. Period of the acquired company’s financial result included in the consolidated financial statements of SMFGFrom April 1, 2016 to March 31, 2017
3. Acquisition cost and consideration of the acquired company
Consideration Cash 180,959 million yenAcquisition cost 180,959 million yen
4. Major acquisition-related costsAdvisory fees, etc. 751 million yen
5. Amount of goodwill, reason for recognizing goodwill, amortization method and the period (1) Amount of goodwill
13,632 million yen(2) Reason for recognizing goodwill
SMFG accounted for the difference between the acquisition cost and fair value of the acquired net assets on the date of the business combination as goodwill.
(3) Amortization method and the periodStraight-line method over 20 years
6. Amounts of assets acquired and liabilities assumed on the date of the business combination(1) Assets
Total assets: 669,763 million yenLease receivables and investment assets: 394,459 million yen
Notes to Consolidated Financial Statements
010_0800801372908.indd 183 2017/08/07 14:04:35
SMFG
184 2017 Annual Report
(2) Liabilities
Total liabilities: 502,042 million yenBorrowed money: 436,526 million yen
7. Amounts allocated to intangible fixed assets other than goodwill, breakdown by component and the weighted average amortization period by component
Intangible fixed assets other than goodwill 76,027 million yen (11 years)Assets related to customers 76,027 million yen (11 years)
8. Approximate amount and their calculation method of impact on the consolidated statements of income for the fiscal year ended March 31, 2017, assuming that the business combination had been completed at the beginning of the fiscal year
There are no corresponding amounts since the date of business combination was at the beginning of the period.
<Business combination through acquisition>SMAM became a consolidated subsidiary of SMBC
On July 29, 2016, SMBC, a consolidated subsidiary of SMFG, acquired the common stocks of SMAM under the contract agreed with Sumitomo Life Insurance Company, Mitsui Sumitomo Insurance Company, Limited and Mitsui Life Insurance Company Limited on May 12, 2016. As a result, SMAM and its 7 subsidiaries became consolidated subsidiaries of SMBC.
On October 1, 2016, SMFG received a dividend of the common stocks of SMAM from SMBC. As a result, SMAM became a directly owned subsidiary of SMFG.
The outline of the business combination through acquisition is as follows:
1. Outline of the business combination(1) Name of the acquired company and its business
Sumitomo Mitsui Asset Management Company, Limited (Investment management business, Investment advisory and agency business)(2) Main reasons for the business combination
As the asset management industry is expanding year by year, SMFG included SMAM in the scope of consolidation in order to encourage the growth of SMAM by utilizing the management resource of SMFG Group, thereby strengthening the domestic asset management business base at SMFG Group.
(3) Date of the business combinationJuly 29, 2016
(4) Legal form of the business combinationAcquisition of stocks
(5) Name of the entity after the business combinationSumitomo Mitsui Financial Group, Inc.
(6) The ratio of acquired voting rights
Ratio of voting rights owned by SMBC immediately prior to the business combination 40%Ratio of voting rights acquired additionally by SMBC on the date of business combination 20%Ratio of voting rights after the acquisition 60%
(7) Grounds for deciding on the acquirerSMBC acquired a majority of the voting rights of SMAM, resulting in SMAM becoming a consolidated subsidiary of SMBC.
2. Period of the acquired company’s financial result included in the consolidated financial statements of SMFGFrom April 1, 2016 to March 31, 2017
Profit and losses related to SMAM arising from April 1, 2016 to June 30, 2016 were recorded as equity in gains (losses) of affiliates in the consolidated statements of income since the deemed acquisition date is on July 1, 2016.
3. Acquisition cost and consideration of the acquired business
Fair value of common stocks of SMAM on the date of business combination owned by SMBC immediately prior to the business combination 40,572 million yenConsideration of common stocks of SMAM acquired additionally by SMBC on the date of the business combination (cash) 20,286 million yenAcquisition cost 60,858 million yen
Notes to Consolidated Financial Statements
010_0800801372908.indd 184 2017/08/07 14:04:35
SMFG
1852017 Annual Report
4. Difference between acquisition cost and total amount of acquisition cost of each transaction
Acquisition cost 60,858 million yenSum of acquisition costs of each transaction resulting in the acquisition 31,532 million yenDifference (gains on step acquisitions) 29,325 million yen
5. Major acquisition-related costsAdvisory fees, etc. 8 million yen
6. Amount of goodwill, reason for recognizing goodwill, amortization method and the period (1) Amount of goodwill
38,053 million yen(2) Reason for recognizing goodwill
SMFG accounted for the difference between the acquisition cost and fair value of the acquired net assets on the date of the business combination as goodwill.
(3) Amortization method and periodStraight-line method over 20 years
7. Amounts of assets acquired and liabilities assumed on the date of the business combination(1) Assets
Total assets: 50,524 million yenSecurities: 13,466 million yen
(2) Liabilities
Total liabilities: 12,516 million yen
8. Amounts allocated to intangible fixed assets other than goodwill, breakdown by component and the weighted average amortization period by component
Intangible fixed assets other than goodwill 13,908 million yen (14 years)Assets related to market 4,288 million yen (20 years)Assets related to customers 9,620 million yen (11 years)
9. Approximate amounts and their calculation method of impact on the consolidated statements of income for the fiscal year ended March 31, 2017, assuming that the business combination had been completed at the beginning of the fiscal year
The approximate amounts have not been disclosed since they are immaterial.
Notes to Consolidated Financial Statements
010_0800801372908.indd 185 2017/08/07 14:04:35
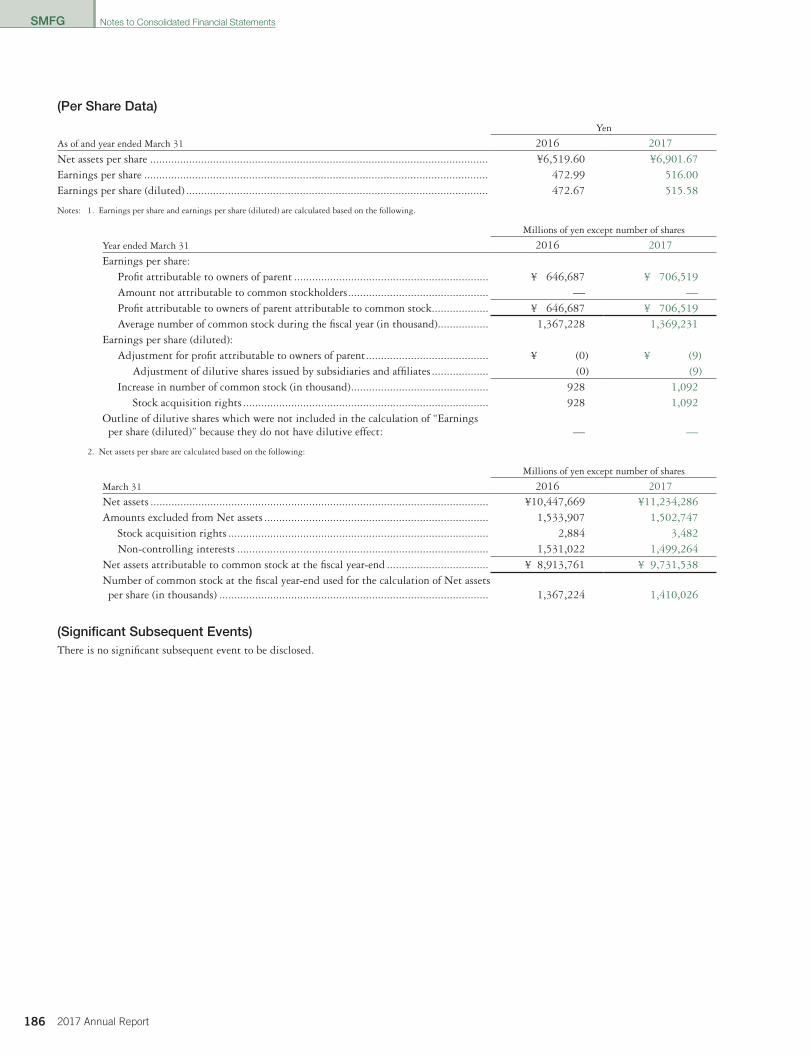
SMFG
186 2017 Annual Report
(Per Share Data)
Yen
As of and year ended March 31 2016 2017Net assets per share ................................................................................................................. ¥6,519.60 ¥6,901.67Earnings per share ................................................................................................................... 472.99 516.00Earnings per share (diluted) ..................................................................................................... 472.67 515.58
Notes: 1. Earnings per share and earnings per share (diluted) are calculated based on the following.
Millions of yen except number of shares
Year ended March 31 2016 2017Earnings per share:
Profit attributable to owners of parent ................................................................. ¥ 646,687 ¥ 706,519Amount not attributable to common stockholders ............................................... — —Profit attributable to owners of parent attributable to common stock................... ¥ 646,687 ¥ 706,519Average number of common stock during the fiscal year (in thousand) ................. 1,367,228 1,369,231
Earnings per share (diluted): Adjustment for profit attributable to owners of parent ......................................... ¥ (0) ¥ (9)
Adjustment of dilutive shares issued by subsidiaries and affiliates ................... (0) (9)Increase in number of common stock (in thousand) .............................................. 928 1,092
Stock acquisition rights .................................................................................. 928 1,092Outline of dilutive shares which were not included in the calculation of “Earnings per share (diluted)” because they do not have dilutive effect: — —
2. Net assets per share are calculated based on the following:
Millions of yen except number of shares
March 31 2016 2017Net assets ................................................................................................................. ¥10,447,669 ¥11,234,286Amounts excluded from Net assets ........................................................................... 1,533,907 1,502,747
Stock acquisition rights ....................................................................................... 2,884 3,482Non-controlling interests .................................................................................... 1,531,022 1,499,264
Net assets attributable to common stock at the fiscal year-end .................................. ¥ 8,913,761 ¥ 9,731,538Number of common stock at the fiscal year-end used for the calculation of Net assets per share (in thousands) .......................................................................................... 1,367,224 1,410,026
(Significant Subsequent Events)There is no significant subsequent event to be disclosed.
Notes to Consolidated Financial Statements
010_0800801372908.indd 186 2017/08/07 14:04:35

SMFG
1872017 Annual Report
[Consolidated supplementary financial schedules][Schedule of bonds]
Millions of yen Percentages
Company Type of bondsDate of issuance
At the beginning of the fiscal year
At the end of the fiscal year
Interestrate (Note 1) Collateral
Date ofmaturity
SMFG Straight bonds, payable in U.S. dollars (Note 3) ...........................................
Mar.2016 ~ Mar.2017
450,480($4,000,000 thousand)
1,651,436($14,720,000 thousand)
1.9879 ~4.3 None
Mar. 2021 ~ Mar. 2047
Straight bonds, payable in Euro (Note 3) ...........................................
Jun. 2016 ~ Jan. 2017 —
239,680(€2,000,000 thousand)
0.606 ~1.546 None
Jan. 2022 ~ Jun. 2026
Straight bonds, payable in Australian dollars (Note 3) ................................
Sep. 2016 ~ Mar. 2017 —
93,961(A$1,095,000 thousand)
3.065 ~3.662 None
Mar. 2022 ~ Sep. 2026
Subordinated bonds, payable in Yen ...Sep. 2014 ~Sep. 2016 255,815 366,335
0.469 ~1.328 None
Sep. 2024 ~ May. 2030
Subordinated bonds, payable in Yen ...Sep. 2014 ~Sep. 2016 153,531 287,878
0.3~0.61 None
Sep. 2024~Sep. 2026
Perpetual subordinated bonds, payable in Yen ..............................................
Jul. 2015~Jan. 2017 300,000 449,897
1.39~2.88 None Perpetual
Subordinated bonds, payable in U.S. dollars (Note 3) Apr.2, 2014
196,717($1,746,753 thousand)
195,697($1,744,337 thousand) 4.436 None Apr. 2, 2024
SMBC Straight bonds, payable in Yen (Note 4) ...........................................
Aug. 2004 ~ Sep. 2004
35,000[35,000] — — — —
Straight bonds, payable in Yen (Note 4) ...........................................
Apr. 2011 ~ Apr. 2014
359,992[200,000]
159,998[60,000]
0.254 ~0.33 None
Oct. 2017 ~Apr. 2019
Straight bonds, payable in U.S. dollars (Notes 3 and 4) ................................
Jul. 2011~Jan. 2017
2,538,524($22,540,617 thousand)
[439,218]
2,344,158($20,894,544 thousand)
[608,069]1.21~4.13 None
Jun. 2017~Mar. 2030
Subordinated bonds, payable in U.S. dollars (Note 3) ................................
May. 28, 2015
73,766($655,000 thousand)
73,484($655,000 thousand) 4.3 None May. 30,2045
Straight bonds, payable in Euro (Notes 3 and 4) ................................
Jul. 2013 ~Nov. 2015
445,008(€3,491,084 thousand)
418,561(€3,492,666 thousand)
[179,760]0~
2.75 NoneSep. 2017 ~
Jul. 2023
Straight bonds, payable in Australian dollars (Notes 3 and 4) .....................
Jun. 2012 ~Aug. 2015
131,958(A$1,529,597 thousand)
[53,487]
78,063(A$909,720 thousand)
[11,155]2.97 ~4.13 None
Jun. 2017 ~Mar. 2025
Straight bonds, payable in Hong Kong dollars (Note 3) ................................
Mar. 2015 ~Apr. 2015
34,348(HK$2,364,000 thousand)
34,136(HK$2,364,000 thousand)
2.09 ~2.92 None
Apr. 2020 ~Apr. 2025
Straight bonds, payable in Thai Baht (Note 3) ...........................................
Nov. 2, 2016 —
11,410(THB3,500,000 thousand) 2.09 None Nov. 4, 2019
Subordinated bonds, payable in Yen (Note 4) ...........................................
Feb. 2007 ~ Dec. 2011
534,055[70,000]
463,982[79,900]
1.43 ~2.8 None
Dec. 2017 ~Dec.2026
Subordinated bonds, payable in Yen ...Nov. 2011 ~
Jan. 2013 354,651 99,724 0.87 None Feb, 28, 2023Subordinated bonds, payable in
Euroyen ...........................................Jun. 16,
2008 2,000 2,000 2.564 None Jun. 16, 2023Perpetual subordinated bonds, payable
in U.S. dollars (Note 3) ....................Mar.1, 2012
168,794($1,498,795 thousand)
168,221($1,499,434 thousand) 4.85 None Mar. 1, 2022
Subordinated bonds, payable in Euro (Note 3) ...........................................
Nov. 9, 2010
94,421(€740,733 thousand)
89,429(€746,242 thousand) 4 None Nov. 9, 2020
(*1) Consolidated subsidiaries, straight bonds, payable in Yen (Notes 2 and 4) ................................
Feb. 2011 ~ Mar. 2017
746,465[139,660]
786,802[160,804]
0.01 ~20 None
Apr. 2017 ~Mar. 2047
(*2) Consolidated subsidiaries, straight bonds, payable in U.S. dollars (Notes 2,3 and 4) ............................
Apr. 2014 ~ Mar. 2017
3,294($32,530 thousand)
[886]
15,028($135,510 thousand)
[4,996]0.01 ~
8 NoneApr. 2017 ~
Jan. 2037(*3) Consolidated subsidiaries, straight
bonds, payable in Australian dollars (Notes 2 and 3) ...............................
Mar. 2016~Mar. 2017
89(A$1,040 thousand)
1,654(A$19,280 thousand)
0.01~3 None
Jan. 2019~Aug. 2031
(*4) Consolidated subsidiaries, straight bonds, payable in U.S. dollars (Notes 2 and 3) ...............................
Jul. 15, 2016 —
54,000($481,333 thousand) 2.65 None Jul. 15, 2021
(*5) Consolidated subsidiaries, straight bonds, payable in Renminbi (Notes 2,3 and 4) .............................
May. 2014~Mar. 2016
36,365(RMB2,093,569 thousand)
[36,365] — — — —(*6) Consolidated subsidiaries, straight
bonds, payable in Indonesia rupiah (Notes 2,3 and 4) .............................
Feb. 3, 2015
8,778(IDR997,500,994 thousand)
8,688(IDR998,631,966 thousand)
[8,688] 9.85 None Feb. 3, 2018(*7) Consolidated subsidiaries,
subordinated bonds, payable in Yen (Notes 2 and 4) ................................
Mar. 1996~Dec. 2012
82,300[11,250] 35,000
2.31 ~4.15 None
Aug. 2019 ~Jan. 2028
(*8) Consolidated subsidiaries, short-term bonds, payable in Yen (Notes 2 and 4) ................................
Apr. 2015 ~ Mar. 2017
1,271,300[1,271,300]
1,125,600[1,125,600]
0.00001 ~0.065 None
Apr. 2017 ~Jun. 2017
Total ............................................................................. — ¥ 8,277,657 ¥ 9,254,832 — — —
Notes to Consolidated Financial Statements
010_0800801372908.indd 187 2017/08/07 14:04:36
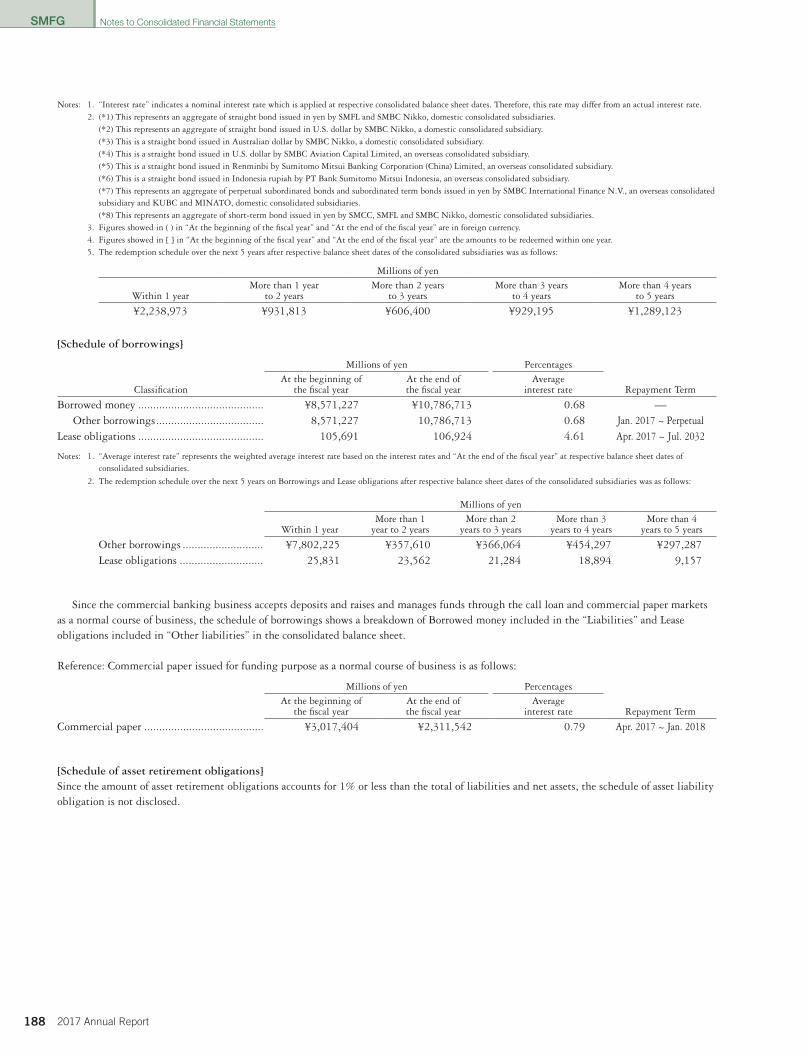
SMFG
188 2017 Annual Report
Notes: 1. “Interest rate” indicates a nominal interest rate which is applied at respective consolidated balance sheet dates. Therefore, this rate may differ from an actual interest rate.2. (*1) This represents an aggregate of straight bond issued in yen by SMFL and SMBC Nikko, domestic consolidated subsidiaries.
(*2) This represents an aggregate of straight bond issued in U.S. dollar by SMBC Nikko, a domestic consolidated subsidiary.(*3) This is a straight bond issued in Australian dollar by SMBC Nikko, a domestic consolidated subsidiary.(*4) This is a straight bond issued in U.S. dollar by SMBC Aviation Capital Limited, an overseas consolidated subsidiary.(*5) This is a straight bond issued in Renminbi by Sumitomo Mitsui Banking Corporation (China) Limited, an overseas consolidated subsidiary.(*6) This is a straight bond issued in Indonesia rupiah by PT Bank Sumitomo Mitsui Indonesia, an overseas consolidated subsidiary.(*7) This represents an aggregate of perpetual subordinated bonds and subordinated term bonds issued in yen by SMBC International Finance N.V., an overseas consolidated subsidiary and KUBC and MINATO, domestic consolidated subsidiaries.(*8) This represents an aggregate of short-term bond issued in yen by SMCC, SMFL and SMBC Nikko, domestic consolidated subsidiaries.
3. Figures showed in ( ) in “At the beginning of the fiscal year” and “At the end of the fiscal year” are in foreign currency. 4. Figures showed in [ ] in “At the beginning of the fiscal year” and “At the end of the fiscal year” are the amounts to be redeemed within one year.5. The redemption schedule over the next 5 years after respective balance sheet dates of the consolidated subsidiaries was as follows:
Millions of yen
Within 1 yearMore than 1 year
to 2 yearsMore than 2 years
to 3 yearsMore than 3 years
to 4 yearsMore than 4 years
to 5 years
¥2,238,973 ¥931,813 ¥606,400 ¥929,195 ¥1,289,123
[Schedule of borrowings]
Millions of yen Percentages
ClassificationAt the beginning of
the fiscal yearAt the end of the fiscal year
Average interest rate Repayment Term
Borrowed money .......................................... ¥8,571,227 ¥10,786,713 0.68 —Other borrowings .................................... 8,571,227 10,786,713 0.68 Jan. 2017 ~ Perpetual
Lease obligations .......................................... 105,691 106,924 4.61 Apr. 2017 ~ Jul. 2032
Notes: 1. “Average interest rate” represents the weighted average interest rate based on the interest rates and “At the end of the fiscal year” at respective balance sheet dates of consolidated subsidiaries.
2. The redemption schedule over the next 5 years on Borrowings and Lease obligations after respective balance sheet dates of the consolidated subsidiaries was as follows:
Millions of yen
Within 1 yearMore than 1
year to 2 yearsMore than 2
years to 3 yearsMore than 3
years to 4 yearsMore than 4
years to 5 years
Other borrowings ........................... ¥7,802,225 ¥357,610 ¥366,064 ¥454,297 ¥297,287Lease obligations ............................ 25,831 23,562 21,284 18,894 9,157
Since the commercial banking business accepts deposits and raises and manages funds through the call loan and commercial paper markets as a normal course of business, the schedule of borrowings shows a breakdown of Borrowed money included in the “Liabilities” and Lease obligations included in “Other liabilities” in the consolidated balance sheet.
Reference: Commercial paper issued for funding purpose as a normal course of business is as follows:
Millions of yen PercentagesAt the beginning of
the fiscal yearAt the end of the fiscal year
Average interest rate Repayment Term
Commercial paper ........................................ ¥3,017,404 ¥2,311,542 0.79 Apr. 2017 ~ Jan. 2018
[Schedule of asset retirement obligations]Since the amount of asset retirement obligations accounts for 1% or less than the total of liabilities and net assets, the schedule of asset liability obligation is not disclosed.
Notes to Consolidated Financial Statements
010_0800801372908.indd 188 2017/08/07 14:04:36
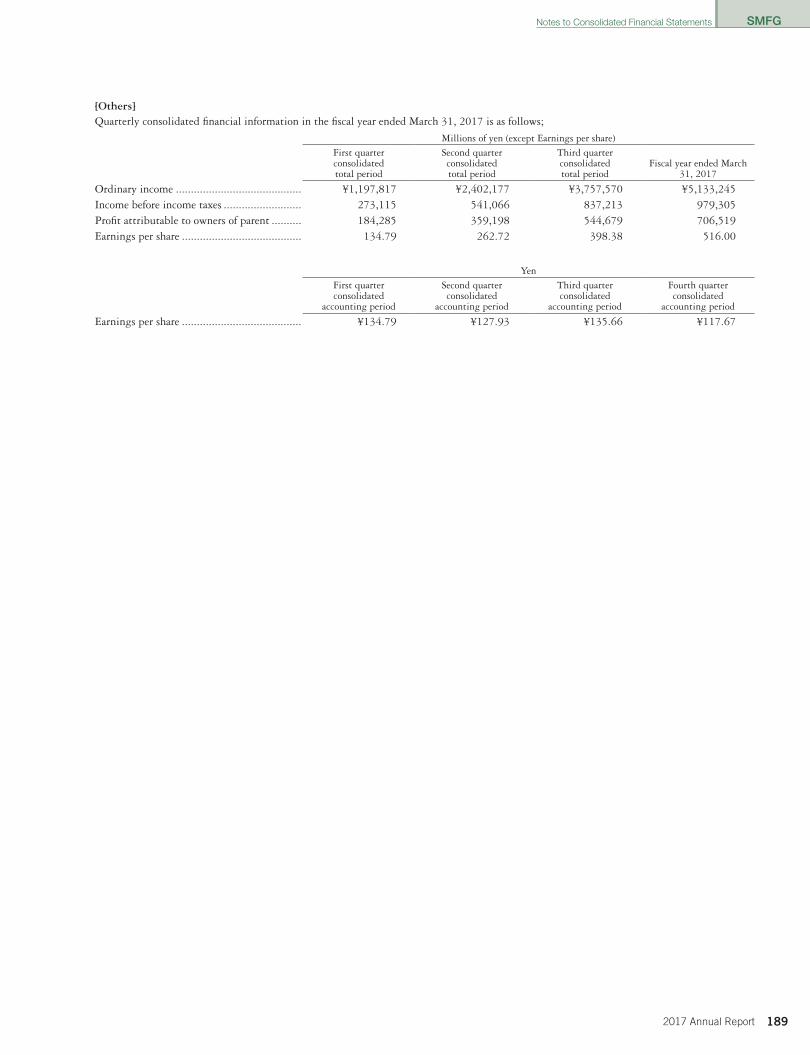
SMFG
1892017 Annual Report
[Others]Quarterly consolidated financial information in the fiscal year ended March 31, 2017 is as follows;
Millions of yen (except Earnings per share)First quarter consolidatedtotal period
Second quarter consolidatedtotal period
Third quarter consolidatedtotal period
Fiscal year ended March 31, 2017
Ordinary income .......................................... ¥1,197,817 ¥2,402,177 ¥3,757,570 ¥5,133,245Income before income taxes .......................... 273,115 541,066 837,213 979,305Profit attributable to owners of parent .......... 184,285 359,198 544,679 706,519Earnings per share ........................................ 134.79 262.72 398.38 516.00
YenFirst quarter consolidated
accounting period
Second quarter consolidated
accounting period
Third quarter consolidated
accounting period
Fourth quarter consolidated
accounting period
Earnings per share ........................................ ¥134.79 ¥127.93 ¥135.66 ¥117.67
Notes to Consolidated Financial Statements
010_0800801372908.indd 189 2017/08/07 14:04:36
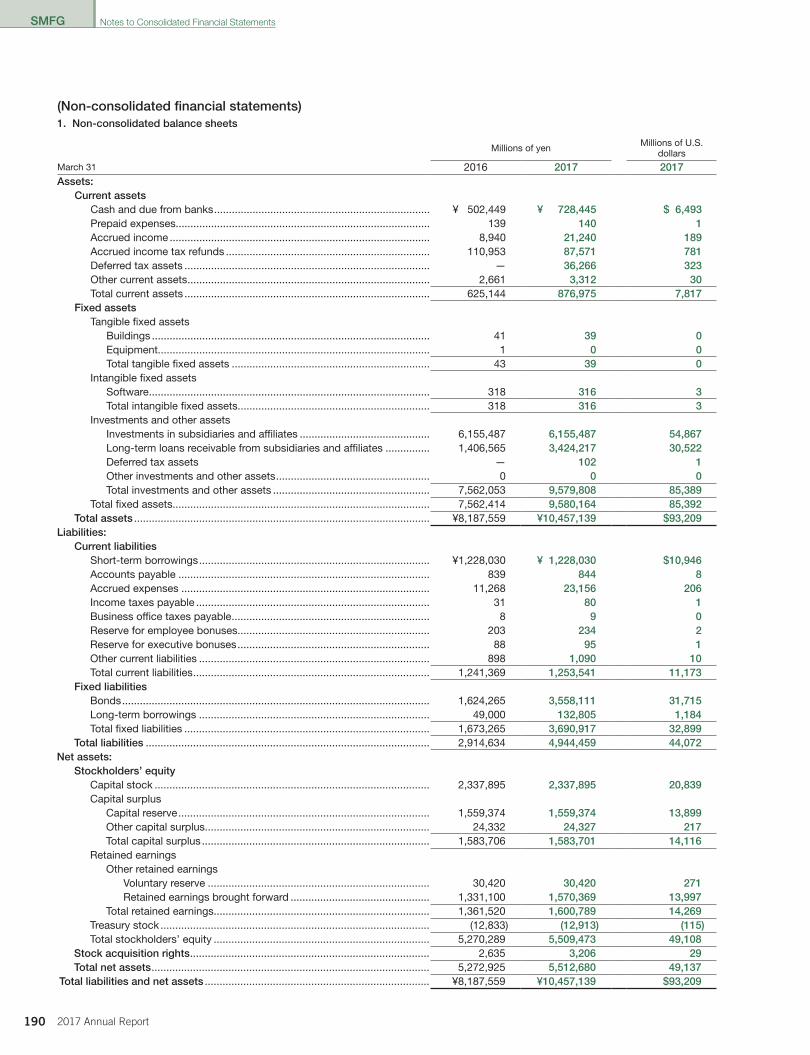
SMFG
190 2017 Annual Report
(Non-consolidated financial statements)1. Non-consolidated balance sheets
Millions of yen Millions of U�S� dollars
March 31 2016 2017 2017Assets:
Current assetsCash and due from banks ������������������������������������������������������������������������� ¥ 502,449 ¥ 728,445 $ 6,493Prepaid expenses�������������������������������������������������������������������������������������� 139 140 1 Accrued income ���������������������������������������������������������������������������������������� 8,940 21,240 189 Accrued income tax refunds ��������������������������������������������������������������������� 110,953 87,571 781 Deferred tax assets ����������������������������������������������������������������������������������� — 36,266 323Other current assets ���������������������������������������������������������������������������������� 2,661 3,312 30 Total current assets ����������������������������������������������������������������������������������� 625,144 876,975 7,817
Fixed assetsTangible fixed assets
Buildings ���������������������������������������������������������������������������������������������� 41 39 0Equipment�������������������������������������������������������������������������������������������� 1 0 0Total tangible fixed assets ������������������������������������������������������������������� 43 39 0
Intangible fixed assetsSoftware ����������������������������������������������������������������������������������������������� 318 316 3Total intangible fixed assets����������������������������������������������������������������� 318 316 3
Investments and other assetsInvestments in subsidiaries and affiliates �������������������������������������������� 6,155,487 6,155,487 54,867Long-term loans receivable from subsidiaries and affiliates ��������������� 1,406,565 3,424,217 30,522Deferred tax assets — 102 1Other investments and other assets ���������������������������������������������������� 0 0 0Total investments and other assets ����������������������������������������������������� 7,562,053 9,579,808 85,389
Total fixed assets��������������������������������������������������������������������������������������� 7,562,414 9,580,164 85,392Total assets ���������������������������������������������������������������������������������������������������� ¥8,187,559 ¥10,457,139 $93,209
Liabilities:Current liabilities
Short-term borrowings ������������������������������������������������������������������������������ ¥1,228,030 ¥ 1,228,030 $10,946Accounts payable ������������������������������������������������������������������������������������� 839 844 8 Accrued expenses ������������������������������������������������������������������������������������ 11,268 23,156 206 Income taxes payable ������������������������������������������������������������������������������� 31 80 1 Business office taxes payable ������������������������������������������������������������������� 8 9 0 Reserve for employee bonuses����������������������������������������������������������������� 203 234 2 Reserve for executive bonuses ����������������������������������������������������������������� 88 95 1 Other current liabilities ������������������������������������������������������������������������������ 898 1,090 10 Total current liabilities �������������������������������������������������������������������������������� 1,241,369 1,253,541 11,173
Fixed liabilitiesBonds �������������������������������������������������������������������������������������������������������� 1,624,265 3,558,111 31,715 Long-term borrowings ������������������������������������������������������������������������������ 49,000 132,805 1,184 Total fixed liabilities ����������������������������������������������������������������������������������� 1,673,265 3,690,917 32,899
Total liabilities ������������������������������������������������������������������������������������������������ 2,914,634 4,944,459 44,072 Net assets:
Stockholders’ equityCapital stock ��������������������������������������������������������������������������������������������� 2,337,895 2,337,895 20,839Capital surplus
Capital reserve ������������������������������������������������������������������������������������� 1,559,374 1,559,374 13,899 Other capital surplus���������������������������������������������������������������������������� 24,332 24,327 217 Total capital surplus ����������������������������������������������������������������������������� 1,583,706 1,583,701 14,116
Retained earningsOther retained earnings
Voluntary reserve ��������������������������������������������������������������������������� 30,420 30,420 271 Retained earnings brought forward ����������������������������������������������� 1,331,100 1,570,369 13,997
Total retained earnings������������������������������������������������������������������������� 1,361,520 1,600,789 14,269 Treasury stock ������������������������������������������������������������������������������������������� (12,833) (12,913) (115)Total stockholders’ equity ������������������������������������������������������������������������� 5,270,289 5,509,473 49,108
Stock acquisition rights ��������������������������������������������������������������������������������� 2,635 3,206 29 Total net assets ���������������������������������������������������������������������������������������������� 5,272,925 5,512,680 49,137
Total liabilities and net assets ���������������������������������������������������������������������������� ¥8,187,559 ¥10,457,139 $93,209
Notes to Consolidated Financial Statements
010_0800801372908.indd 190 2017/08/07 14:04:36
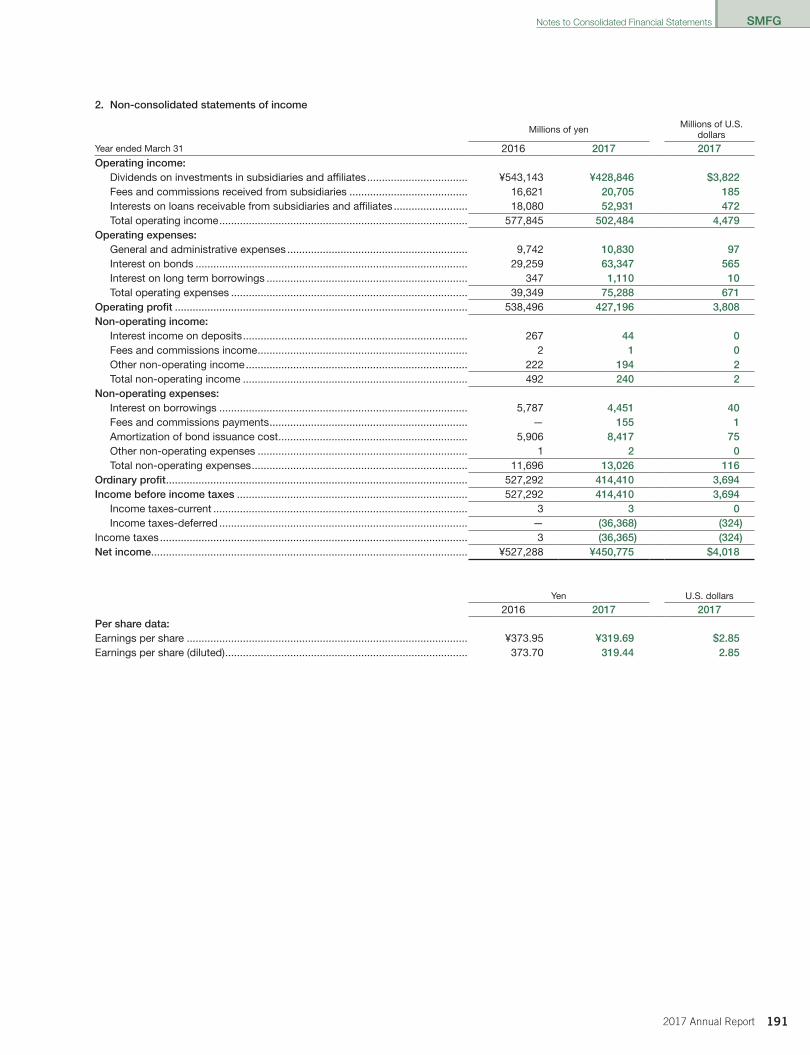
SMFG
1912017 Annual Report
2. Non-consolidated statements of income
Millions of yen Millions of U�S� dollars
Year ended March 31 2016 2017 2017Operating income:
Dividends on investments in subsidiaries and affiliates ���������������������������������� ¥543,143 ¥428,846 $3,822Fees and commissions received from subsidiaries ���������������������������������������� 16,621 20,705 185 Interests on loans receivable from subsidiaries and affiliates ������������������������� 18,080 52,931 472 Total operating income ������������������������������������������������������������������������������������ 577,845 502,484 4,479
Operating expenses:General and administrative expenses ������������������������������������������������������������� 9,742 10,830 97 Interest on bonds �������������������������������������������������������������������������������������������� 29,259 63,347 565 Interest on long term borrowings �������������������������������������������������������������������� 347 1,110 10 Total operating expenses �������������������������������������������������������������������������������� 39,349 75,288 671
Operating profit ��������������������������������������������������������������������������������������������������� 538,496 427,196 3,808 Non-operating income:
Interest income on deposits ���������������������������������������������������������������������������� 267 44 0 Fees and commissions income ����������������������������������������������������������������������� 2 1 0 Other non-operating income ��������������������������������������������������������������������������� 222 194 2 Total non-operating income ���������������������������������������������������������������������������� 492 240 2
Non-operating expenses:Interest on borrowings ������������������������������������������������������������������������������������ 5,787 4,451 40 Fees and commissions payments ������������������������������������������������������������������� — 155 1 Amortization of bond issuance cost ���������������������������������������������������������������� 5,906 8,417 75 Other non-operating expenses ����������������������������������������������������������������������� 1 2 0 Total non-operating expenses ������������������������������������������������������������������������� 11,696 13,026 116
Ordinary profit ������������������������������������������������������������������������������������������������������ 527,292 414,410 3,694 Income before income taxes ������������������������������������������������������������������������������ 527,292 414,410 3,694
Income taxes-current �������������������������������������������������������������������������������������� 3 3 0 Income taxes-deferred ������������������������������������������������������������������������������������ — (36,368) (324)
Income taxes �������������������������������������������������������������������������������������������������������� 3 (36,365) (324)Net income ����������������������������������������������������������������������������������������������������������� ¥527,288 ¥450,775 $4,018
Yen U�S� dollars
2016 2017 2017Per share data: Earnings per share ����������������������������������������������������������������������������������������������� ¥373�95 ¥319.69 $2.85Earnings per share (diluted) ���������������������������������������������������������������������������������� 373�70 319.44 2.85
Notes to Consolidated Financial Statements
010_0800801372908.indd 191 2017/08/07 14:04:36
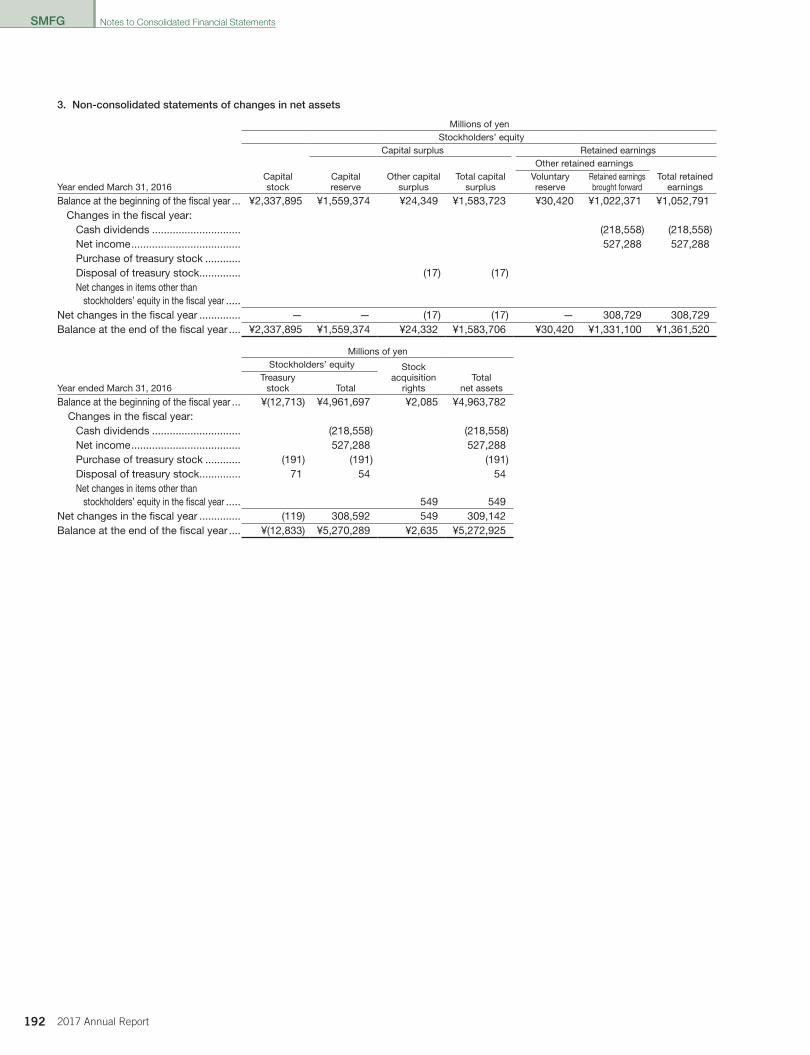
SMFG
192 2017 Annual Report
3. Non-consolidated statements of changes in net assets
Millions of yenStockholders’ equity
Capital surplus Retained earnings
Year ended March 31, 2016Capitalstock
Capitalreserve
Other capitalsurplus
Total capitalsurplus
Other retained earningsTotal retained
earningsVoluntaryreserve
Retained earnings brought forward
Balance at the beginning of the fiscal year ��� ¥2,337,895 ¥1,559,374 ¥24,349 ¥1,583,723 ¥30,420 ¥1,022,371 ¥1,052,791Changes in the fiscal year:
Cash dividends ������������������������������ (218,558) (218,558)Net income ������������������������������������� 527,288 527,288Purchase of treasury stock ������������Disposal of treasury stock �������������� (17) (17)Net changes in items other than
stockholders’ equity in the fiscal year �����Net changes in the fiscal year �������������� — — (17) (17) — 308,729 308,729Balance at the end of the fiscal year ���� ¥2,337,895 ¥1,559,374 ¥24,332 ¥1,583,706 ¥30,420 ¥1,331,100 ¥1,361,520
Millions of yenStockholders’ equity Stock
acquisitionrights
Total net assetsYear ended March 31, 2016
Treasurystock Total
Balance at the beginning of the fiscal year ��� ¥(12,713) ¥4,961,697 ¥2,085 ¥4,963,782Changes in the fiscal year:
Cash dividends ������������������������������ (218,558) (218,558)Net income ������������������������������������� 527,288 527,288Purchase of treasury stock ������������ (191) (191) (191)Disposal of treasury stock �������������� 71 54 54Net changes in items other than
stockholders’ equity in the fiscal year ����� 549 549Net changes in the fiscal year �������������� (119) 308,592 549 309,142Balance at the end of the fiscal year ���� ¥(12,833) ¥5,270,289 ¥2,635 ¥5,272,925
Notes to Consolidated Financial Statements
010_0800801372908.indd 192 2017/08/07 14:04:36
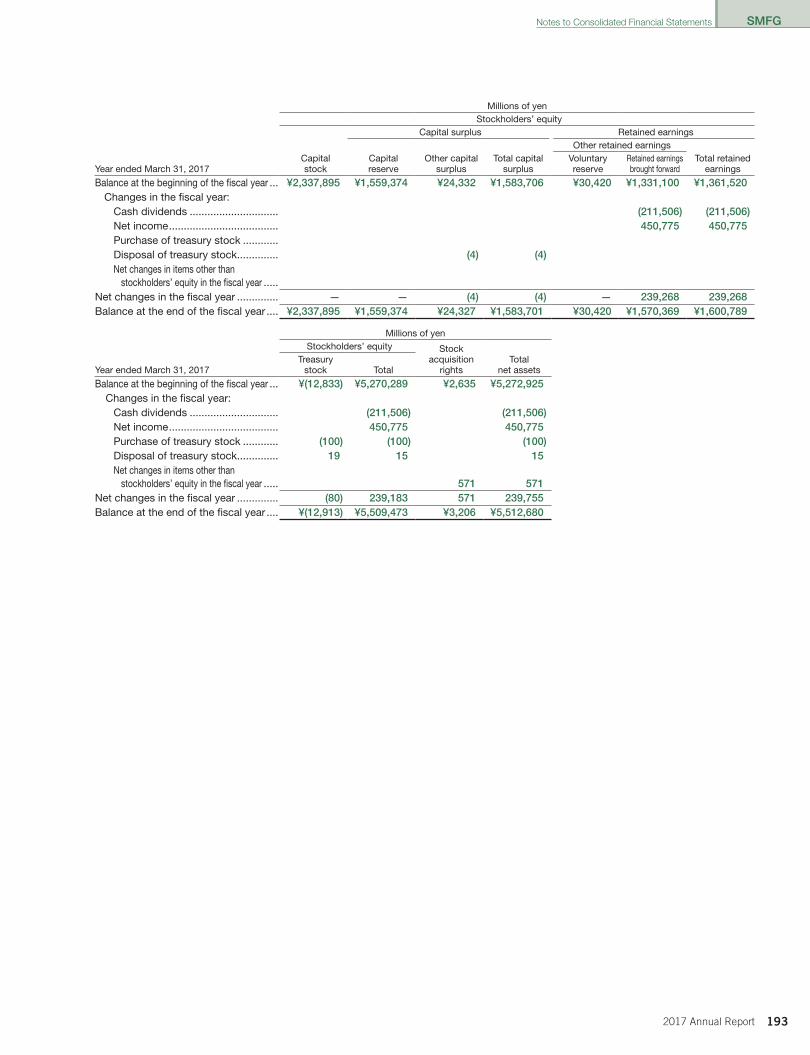
SMFG
1932017 Annual Report
Millions of yenStockholders’ equity
Capital surplus Retained earnings
Year ended March 31, 2017Capitalstock
Capitalreserve
Other capitalsurplus
Total capitalsurplus
Other retained earningsTotal retained
earningsVoluntaryreserve
Retained earnings brought forward
Balance at the beginning of the fiscal year ��� ¥2,337,895 ¥1,559,374 ¥24,332 ¥1,583,706 ¥30,420 ¥1,331,100 ¥1,361,520Changes in the fiscal year:
Cash dividends ������������������������������ (211,506) (211,506)Net income ������������������������������������� 450,775 450,775Purchase of treasury stock ������������Disposal of treasury stock �������������� (4) (4)Net changes in items other than
stockholders’ equity in the fiscal year �����Net changes in the fiscal year �������������� — — (4) (4) — 239,268 239,268Balance at the end of the fiscal year ���� ¥2,337,895 ¥1,559,374 ¥24,327 ¥1,583,701 ¥30,420 ¥1,570,369 ¥1,600,789
Millions of yenStockholders’ equity Stock
acquisitionrights
Total net assetsYear ended March 31, 2017
Treasurystock Total
Balance at the beginning of the fiscal year ��� ¥(12,833) ¥5,270,289 ¥2,635 ¥5,272,925Changes in the fiscal year:
Cash dividends ������������������������������ (211,506) (211,506)Net income ������������������������������������� 450,775 450,775Purchase of treasury stock ������������ (100) (100) (100)Disposal of treasury stock �������������� 19 15 15Net changes in items other than
stockholders’ equity in the fiscal year ����� 571 571Net changes in the fiscal year �������������� (80) 239,183 571 239,755Balance at the end of the fiscal year ���� ¥(12,913) ¥5,509,473 ¥3,206 ¥5,512,680
Notes to Consolidated Financial Statements
010_0800801372908.indd 193 2017/08/07 14:04:36
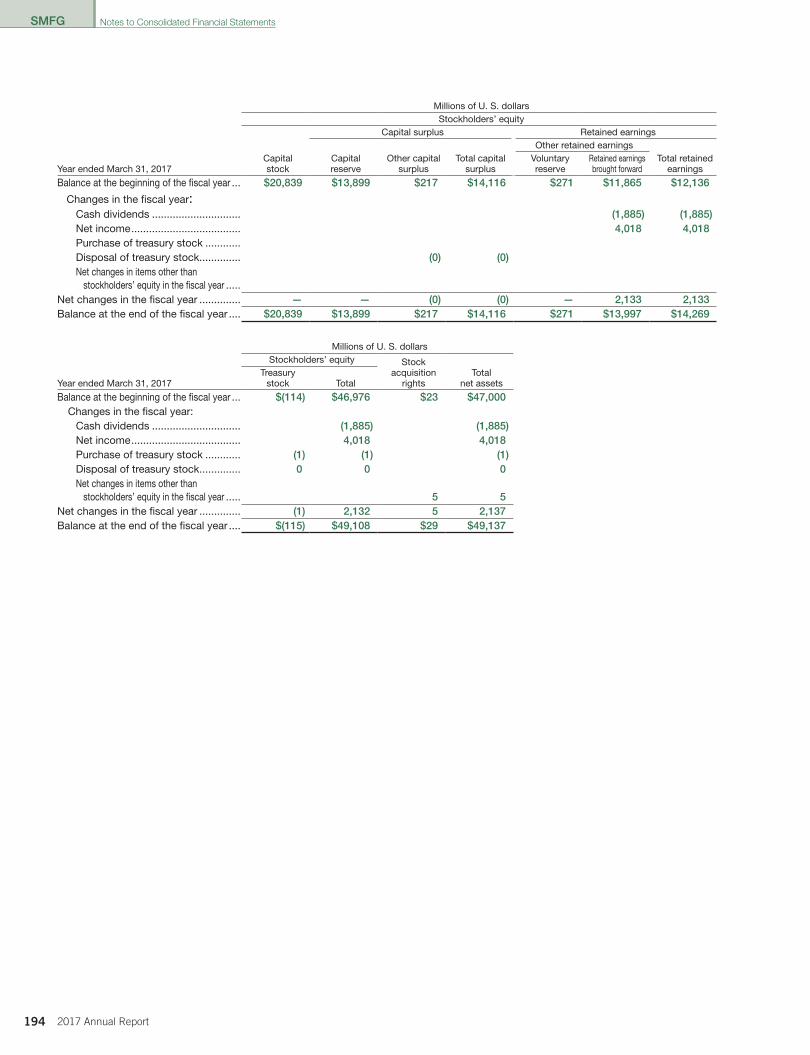
SMFG
194 2017 Annual Report
Millions of U� S� dollarsStockholders’ equity
Capital surplus Retained earnings
Year ended March 31, 2017Capitalstock
Capitalreserve
Other capitalsurplus
Total capitalsurplus
Other retained earningsTotal retained
earningsVoluntaryreserve
Retained earnings brought forward
Balance at the beginning of the fiscal year ��� $20,839 $13,899 $217 $14,116 $271 $11,865 $12,136
Changes in the fiscal year:Cash dividends ������������������������������ (1,885) (1,885)Net income ������������������������������������� 4,018 4,018Purchase of treasury stock ������������Disposal of treasury stock �������������� (0) (0)Net changes in items other than
stockholders’ equity in the fiscal year �����Net changes in the fiscal year �������������� — — (0) (0) — 2,133 2,133Balance at the end of the fiscal year ���� $20,839 $13,899 $217 $14,116 $271 $13,997 $14,269
Millions of U� S� dollarsStockholders’ equity Stock
acquisitionrights
Total net assetsYear ended March 31, 2017
Treasurystock Total
Balance at the beginning of the fiscal year ��� $(114) $46,976 $23 $47,000Changes in the fiscal year:
Cash dividends ������������������������������ (1,885) (1,885)Net income ������������������������������������� 4,018 4,018Purchase of treasury stock ������������ (1) (1) (1)Disposal of treasury stock �������������� 0 0 0Net changes in items other than
stockholders’ equity in the fiscal year ����� 5 5Net changes in the fiscal year �������������� (1) 2,132 5 2,137Balance at the end of the fiscal year ���� $(115) $49,108 $29 $49,137
Notes to Consolidated Financial Statements
010_0800801372908.indd 194 2017/08/07 14:04:36
SMFG
1952017 Annual Report
Independent Auditor’s Report
To the Board of Directors ofSumitomo Mitsui Financial Group, Inc.:
We have audited the accompanying consolidated financial statements of Sumitomo Mitsui Financial Group, Inc. (“SMFG”) and subsidiaries, which comprise the consolidated balance sheets as at March 31, 2017 and 2016, and the consolidated statements of income, comprehensive income, changes in net assets and cash flows for the years then ended, and basis of presentation, significant accounting policies and other explanatory information.
Management’s Responsibility for the Consolidated Financial Statements
Management is responsible for the preparation and fair presentation of these consolidated financial statements in accordance with accounting principles generally accepted in Japan, and for such internal control as management determines is necessary to enable the preparation of consolidated financial statements that are free from material misstatements, whether due to fraud or error.
Auditor’s Responsibility
Our responsibility is to express an opinion on these consolidated financial statements based on our audits. We conducted our audits in accordance with auditing standards generally accepted in Japan. Those standards require that we comply with ethical requirements and plan and perform the audit to obtain reasonable assurance about whether the consolidated financial statements are free from material misstatement.
An audit involves performing procedures to obtain audit evidence about the amounts and disclosures in the consolidated financial statements. The procedures selected depend on our judgement, including the assessment of the risks of material misstatement of the consolidated financial statements, whether due to fraud or error. In making those risk assessments, we consider internal control relevant to the entity’s preparation and fair presentation of the consolidated financial statements in order to design audit procedures that are appropriate in the circumstances, while the objective of the financial statement audit is not for the purpose of expressing an opinion on the effectiveness of the entity’s internal control. An audit also includes evaluating the appropriateness of accounting policies used and the reasonableness of accounting estimates made by management, as well as evaluating the overall presentation of the consolidated financial statements.
We believe that the audit evidence we have obtained is sufficient and appropriate to provide a basis for our audit opinion.
Opinion
In our opinion, the consolidated financial statements present fairly, in all material respects, the financial position of SMFG and subsidiaries as at March 31, 2017 and 2016, and their financial performance and cash flows for the years then ended in accordance with accounting principles generally accepted in Japan.
Convenience Translation
The U.S. dollar amounts in the accompanying consolidated financial statements with respect to the year ended March 31, 2017 are presented solely for convenience. Our audit also included the translation of yen amounts into U.S. dollar amounts and, in our opinion, such translation has been made on the basis described in basis of presentation.
June 28, 2017Tokyo, Japan
010_0800801372908.indd 195 2017/08/07 14:04:36
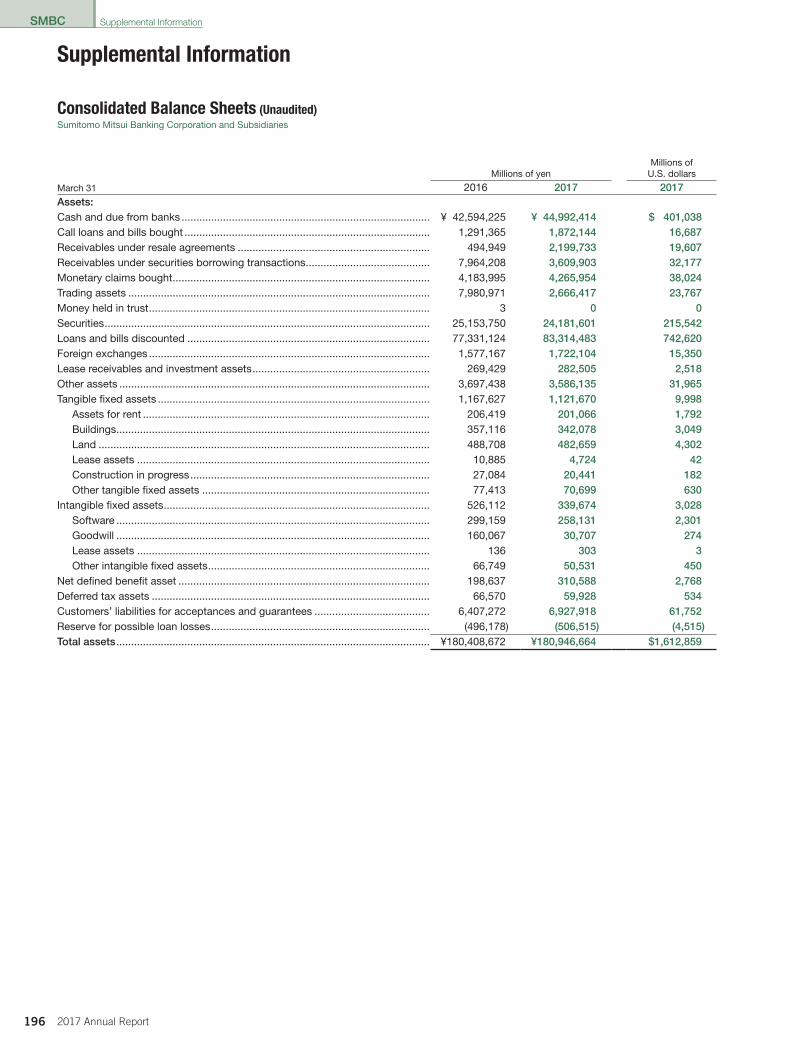
196 2017 Annual Report
SMBC
Supplemental Information
Consolidated Balance Sheets (Unaudited)Sumitomo Mitsui Banking Corporation and Subsidiaries
Millions of yenMillions of
U�S� dollars
March 31 2016 2017 2017Assets:Cash and due from banks ������������������������������������������������������������������������������������ ¥ 42,594,225 ¥ 44,992,414 $ 401,038Call loans and bills bought ����������������������������������������������������������������������������������� 1,291,365 1,872,144 16,687Receivables under resale agreements ����������������������������������������������������������������� 494,949 2,199,733 19,607Receivables under securities borrowing transactions ������������������������������������������ 7,964,208 3,609,903 32,177Monetary claims bought ��������������������������������������������������������������������������������������� 4,183,995 4,265,954 38,024Trading assets ������������������������������������������������������������������������������������������������������ 7,980,971 2,666,417 23,767Money held in trust ����������������������������������������������������������������������������������������������� 3 0 0Securities �������������������������������������������������������������������������������������������������������������� 25,153,750 24,181,601 215,542Loans and bills discounted ���������������������������������������������������������������������������������� 77,331,124 83,314,483 742,620Foreign exchanges ����������������������������������������������������������������������������������������������� 1,577,167 1,722,104 15,350Lease receivables and investment assets ������������������������������������������������������������ 269,429 282,505 2,518Other assets ��������������������������������������������������������������������������������������������������������� 3,697,438 3,586,135 31,965Tangible fixed assets �������������������������������������������������������������������������������������������� 1,167,627 1,121,670 9,998
Assets for rent ������������������������������������������������������������������������������������������������� 206,419 201,066 1,792Buildings ���������������������������������������������������������������������������������������������������������� 357,116 342,078 3,049Land ���������������������������������������������������������������������������������������������������������������� 488,708 482,659 4,302Lease assets ��������������������������������������������������������������������������������������������������� 10,885 4,724 42Construction in progress ��������������������������������������������������������������������������������� 27,084 20,441 182Other tangible fixed assets ����������������������������������������������������������������������������� 77,413 70,699 630
Intangible fixed assets ������������������������������������������������������������������������������������������ 526,112 339,674 3,028Software ���������������������������������������������������������������������������������������������������������� 299,159 258,131 2,301Goodwill ���������������������������������������������������������������������������������������������������������� 160,067 30,707 274Lease assets ��������������������������������������������������������������������������������������������������� 136 303 3Other intangible fixed assets ��������������������������������������������������������������������������� 66,749 50,531 450
Net defined benefit asset ������������������������������������������������������������������������������������� 198,637 310,588 2,768Deferred tax assets ���������������������������������������������������������������������������������������������� 66,570 59,928 534Customers’ liabilities for acceptances and guarantees ��������������������������������������� 6,407,272 6,927,918 61,752Reserve for possible loan losses �������������������������������������������������������������������������� (496,178) (506,515) (4,515)Total assets ���������������������������������������������������������������������������������������������������������� ¥180,408,672 ¥180,946,664 $1,612,859
Supplemental Information
010_0800801372908.indd 196 2017/08/07 14:04:36
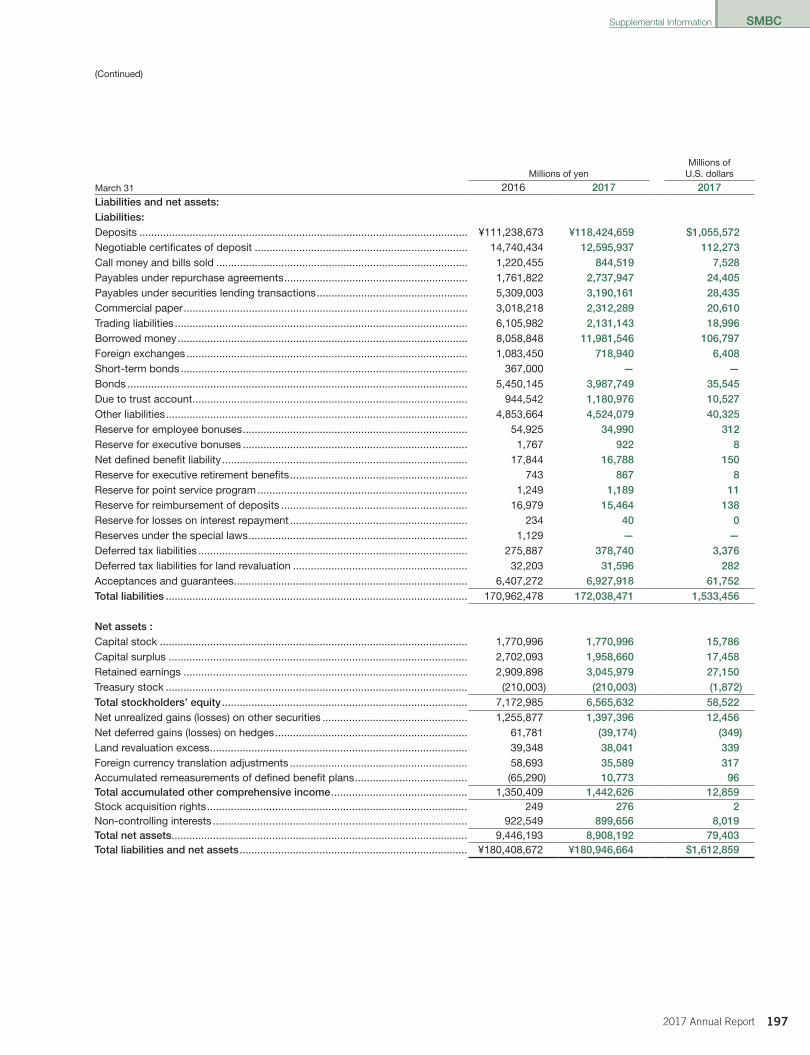
1972017 Annual Report
SMBC
(Continued)
Millions of yenMillions of
U�S� dollars
March 31 2016 2017 2017Liabilities and net assets:Liabilities:Deposits ��������������������������������������������������������������������������������������������������������������� ¥111,238,673 ¥118,424,659 $1,055,572Negotiable certificates of deposit ������������������������������������������������������������������������ 14,740,434 12,595,937 112,273Call money and bills sold ������������������������������������������������������������������������������������� 1,220,455 844,519 7,528Payables under repurchase agreements �������������������������������������������������������������� 1,761,822 2,737,947 24,405Payables under securities lending transactions ��������������������������������������������������� 5,309,003 3,190,161 28,435Commercial paper ������������������������������������������������������������������������������������������������ 3,018,218 2,312,289 20,610Trading liabilities ��������������������������������������������������������������������������������������������������� 6,105,982 2,131,143 18,996Borrowed money �������������������������������������������������������������������������������������������������� 8,058,848 11,981,546 106,797Foreign exchanges ����������������������������������������������������������������������������������������������� 1,083,450 718,940 6,408Short-term bonds ������������������������������������������������������������������������������������������������� 367,000 — —Bonds ������������������������������������������������������������������������������������������������������������������� 5,450,145 3,987,749 35,545Due to trust account ��������������������������������������������������������������������������������������������� 944,542 1,180,976 10,527Other liabilities ������������������������������������������������������������������������������������������������������ 4,853,664 4,524,079 40,325Reserve for employee bonuses ���������������������������������������������������������������������������� 54,925 34,990 312Reserve for executive bonuses ���������������������������������������������������������������������������� 1,767 922 8Net defined benefit liability ����������������������������������������������������������������������������������� 17,844 16,788 150Reserve for executive retirement benefits ������������������������������������������������������������ 743 867 8Reserve for point service program ����������������������������������������������������������������������� 1,249 1,189 11Reserve for reimbursement of deposits ��������������������������������������������������������������� 16,979 15,464 138Reserve for losses on interest repayment ������������������������������������������������������������ 234 40 0Reserves under the special laws �������������������������������������������������������������������������� 1,129 — —Deferred tax liabilities ������������������������������������������������������������������������������������������� 275,887 378,740 3,376Deferred tax liabilities for land revaluation ����������������������������������������������������������� 32,203 31,596 282Acceptances and guarantees ������������������������������������������������������������������������������� 6,407,272 6,927,918 61,752Total liabilities ������������������������������������������������������������������������������������������������������ 170,962,478 172,038,471 1,533,456 Net assets :Capital stock �������������������������������������������������������������������������������������������������������� 1,770,996 1,770,996 15,786Capital surplus ����������������������������������������������������������������������������������������������������� 2,702,093 1,958,660 17,458Retained earnings ������������������������������������������������������������������������������������������������ 2,909,898 3,045,979 27,150Treasury stock ������������������������������������������������������������������������������������������������������ (210,003) (210,003) (1,872)Total stockholders’ equity ����������������������������������������������������������������������������������� 7,172,985 6,565,632 58,522Net unrealized gains (losses) on other securities ������������������������������������������������� 1,255,877 1,397,396 12,456Net deferred gains (losses) on hedges ����������������������������������������������������������������� 61,781 (39,174) (349)Land revaluation excess ��������������������������������������������������������������������������������������� 39,348 38,041 339Foreign currency translation adjustments ������������������������������������������������������������ 58,693 35,589 317Accumulated remeasurements of defined benefit plans �������������������������������������� (65,290) 10,773 96Total accumulated other comprehensive income ���������������������������������������������� 1,350,409 1,442,626 12,859Stock acquisition rights ���������������������������������������������������������������������������������������� 249 276 2Non-controlling interests �������������������������������������������������������������������������������������� 922,549 899,656 8,019Total net assets ���������������������������������������������������������������������������������������������������� 9,446,193 8,908,192 79,403Total liabilities and net assets ����������������������������������������������������������������������������� ¥180,408,672 ¥180,946,664 $1,612,859
Supplemental Information
010_0800801372908.indd 197 2017/08/07 14:04:36
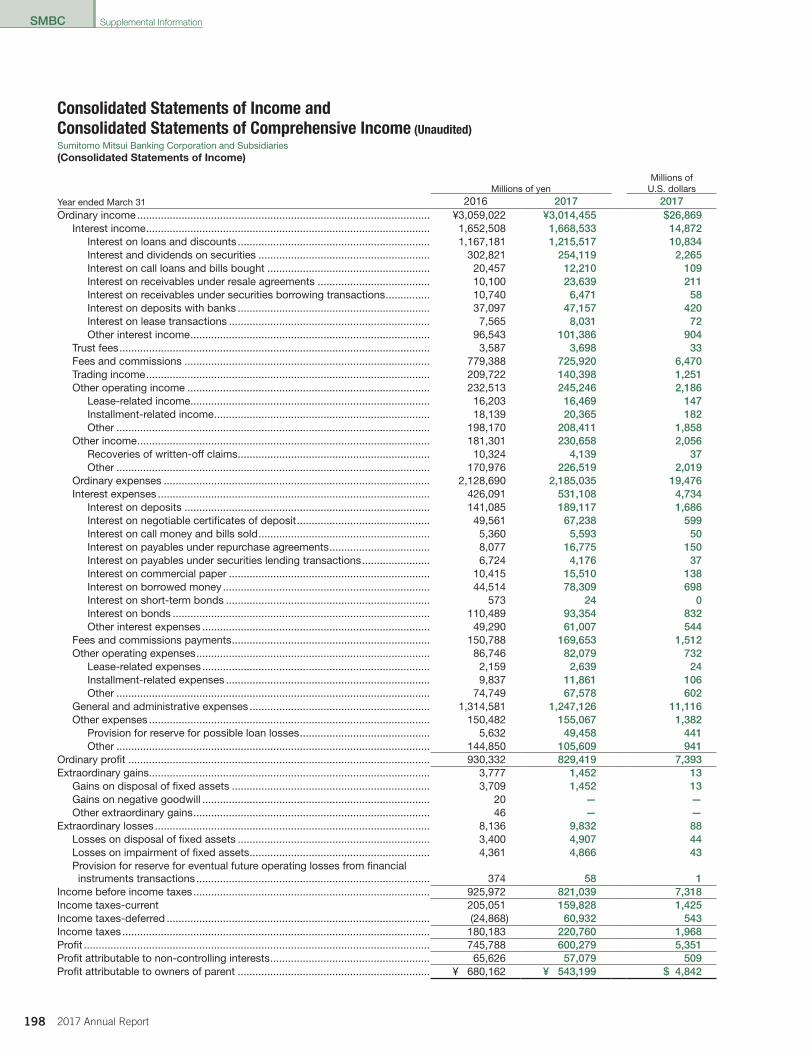
198 2017 Annual Report
SMBC
Millions of yenMillions of
U�S� dollarsYear ended March 31 2016 2017 2017Ordinary income ��������������������������������������������������������������������������������������������������� ¥3,059,022 ¥3,014,455 $26,869
Interest income ������������������������������������������������������������������������������������������������ 1,652,508 1,668,533 14,872Interest on loans and discounts ����������������������������������������������������������������� 1,167,181 1,215,517 10,834Interest and dividends on securities ���������������������������������������������������������� 302,821 254,119 2,265Interest on call loans and bills bought ������������������������������������������������������� 20,457 12,210 109Interest on receivables under resale agreements �������������������������������������� 10,100 23,639 211Interest on receivables under securities borrowing transactions ��������������� 10,740 6,471 58Interest on deposits with banks ����������������������������������������������������������������� 37,097 47,157 420Interest on lease transactions �������������������������������������������������������������������� 7,565 8,031 72Other interest income ��������������������������������������������������������������������������������� 96,543 101,386 904
Trust fees ��������������������������������������������������������������������������������������������������������� 3,587 3,698 33Fees and commissions ����������������������������������������������������������������������������������� 779,388 725,920 6,470Trading income ������������������������������������������������������������������������������������������������ 209,722 140,398 1,251Other operating income ���������������������������������������������������������������������������������� 232,513 245,246 2,186
Lease-related income ��������������������������������������������������������������������������������� 16,203 16,469 147Installment-related income ������������������������������������������������������������������������� 18,139 20,365 182Other ���������������������������������������������������������������������������������������������������������� 198,170 208,411 1,858
Other income ��������������������������������������������������������������������������������������������������� 181,301 230,658 2,056Recoveries of written-off claims ����������������������������������������������������������������� 10,324 4,139 37Other ���������������������������������������������������������������������������������������������������������� 170,976 226,519 2,019
Ordinary expenses ������������������������������������������������������������������������������������������ 2,128,690 2,185,035 19,476Interest expenses �������������������������������������������������������������������������������������������� 426,091 531,108 4,734
Interest on deposits ����������������������������������������������������������������������������������� 141,085 189,117 1,686Interest on negotiable certificates of deposit ��������������������������������������������� 49,561 67,238 599Interest on call money and bills sold ���������������������������������������������������������� 5,360 5,593 50Interest on payables under repurchase agreements ���������������������������������� 8,077 16,775 150Interest on payables under securities lending transactions ����������������������� 6,724 4,176 37Interest on commercial paper �������������������������������������������������������������������� 10,415 15,510 138Interest on borrowed money ���������������������������������������������������������������������� 44,514 78,309 698Interest on short-term bonds ��������������������������������������������������������������������� 573 24 0Interest on bonds ��������������������������������������������������������������������������������������� 110,489 93,354 832Other interest expenses ����������������������������������������������������������������������������� 49,290 61,007 544
Fees and commissions payments ������������������������������������������������������������������� 150,788 169,653 1,512Other operating expenses ������������������������������������������������������������������������������� 86,746 82,079 732
Lease-related expenses ����������������������������������������������������������������������������� 2,159 2,639 24Installment-related expenses ��������������������������������������������������������������������� 9,837 11,861 106Other ���������������������������������������������������������������������������������������������������������� 74,749 67,578 602
General and administrative expenses ������������������������������������������������������������� 1,314,581 1,247,126 11,116Other expenses ����������������������������������������������������������������������������������������������� 150,482 155,067 1,382
Provision for reserve for possible loan losses �������������������������������������������� 5,632 49,458 441Other ���������������������������������������������������������������������������������������������������������� 144,850 105,609 941
Ordinary profit ������������������������������������������������������������������������������������������������������ 930,332 829,419 7,393Extraordinary gains ����������������������������������������������������������������������������������������������� 3,777 1,452 13
Gains on disposal of fixed assets ������������������������������������������������������������������� 3,709 1,452 13Gains on negative goodwill ����������������������������������������������������������������������������� 20 — —Other extraordinary gains �������������������������������������������������������������������������������� 46 — —
Extraordinary losses ��������������������������������������������������������������������������������������������� 8,136 9,832 88Losses on disposal of fixed assets ����������������������������������������������������������������� 3,400 4,907 44Losses on impairment of fixed assets ������������������������������������������������������������� 4,361 4,866 43Provision for reserve for eventual future operating losses from financial instruments transactions ������������������������������������������������������������������������������� 374 58 1
Income before income taxes �������������������������������������������������������������������������������� 925,972 821,039 7,318Income taxes-current 205,051 159,828 1,425Income taxes-deferred ����������������������������������������������������������������������������������������� (24,868) 60,932 543Income taxes �������������������������������������������������������������������������������������������������������� 180,183 220,760 1,968Profit ��������������������������������������������������������������������������������������������������������������������� 745,788 600,279 5,351Profit attributable to non-controlling interests ������������������������������������������������������ 65,626 57,079 509Profit attributable to owners of parent ����������������������������������������������������������������� ¥ 680,162 ¥ 543,199 $ 4,842
Consolidated Statements of Income andConsolidated Statements of Comprehensive Income (Unaudited)Sumitomo Mitsui Banking Corporation and Subsidiaries(Consolidated Statements of Income)
Supplemental Information
010_0800801372908.indd 198 2017/08/07 14:04:36
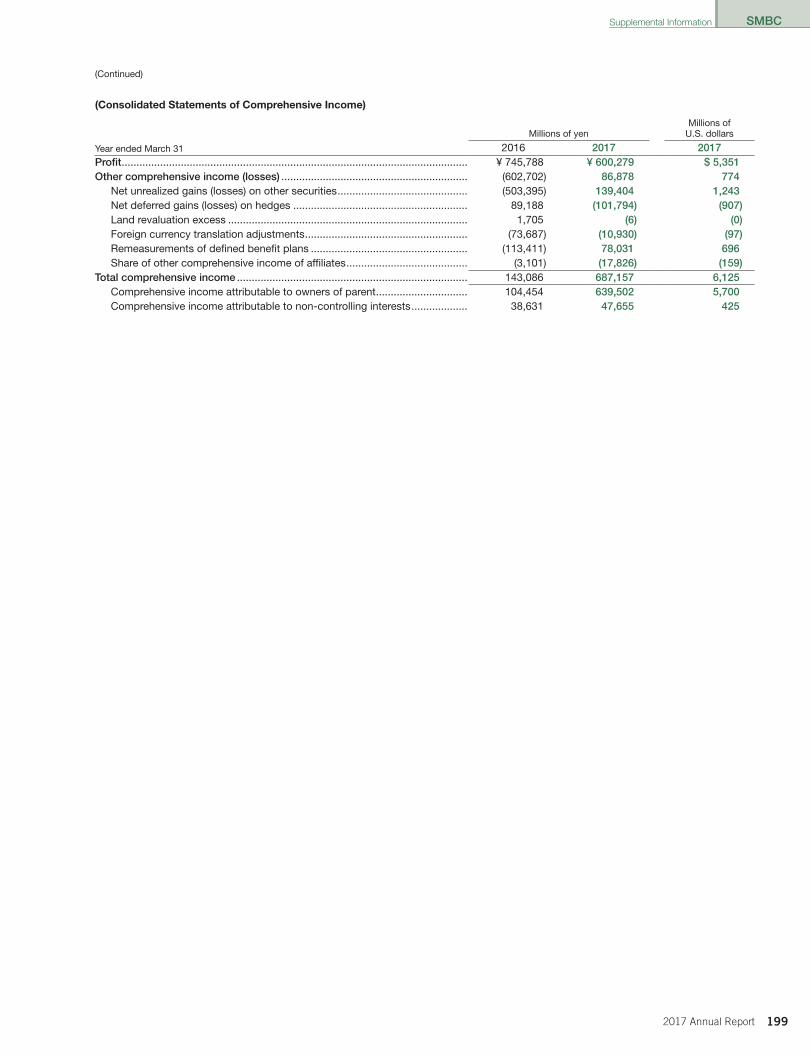
1992017 Annual Report
SMBC
(Consolidated Statements of Comprehensive Income)
Millions of yenMillions of
U�S� dollars
Year ended March 31 2016 2017 2017Profit ��������������������������������������������������������������������������������������������������������������������� ¥ 745,788 ¥ 600,279 $ 5,351Other comprehensive income (losses) ��������������������������������������������������������������� (602,702) 86,878 774
Net unrealized gains (losses) on other securities �������������������������������������������� (503,395) 139,404 1,243Net deferred gains (losses) on hedges ����������������������������������������������������������� 89,188 (101,794) (907)Land revaluation excess ��������������������������������������������������������������������������������� 1,705 (6) (0)Foreign currency translation adjustments ������������������������������������������������������� (73,687) (10,930) (97)Remeasurements of defined benefit plans ����������������������������������������������������� (113,411) 78,031 696Share of other comprehensive income of affiliates ����������������������������������������� (3,101) (17,826) (159)
Total comprehensive income ������������������������������������������������������������������������������ 143,086 687,157 6,125Comprehensive income attributable to owners of parent ������������������������������� 104,454 639,502 5,700Comprehensive income attributable to non-controlling interests ������������������� 38,631 47,655 425
(Continued)
Supplemental Information
010_0800801372908.indd 199 2017/08/07 14:04:36
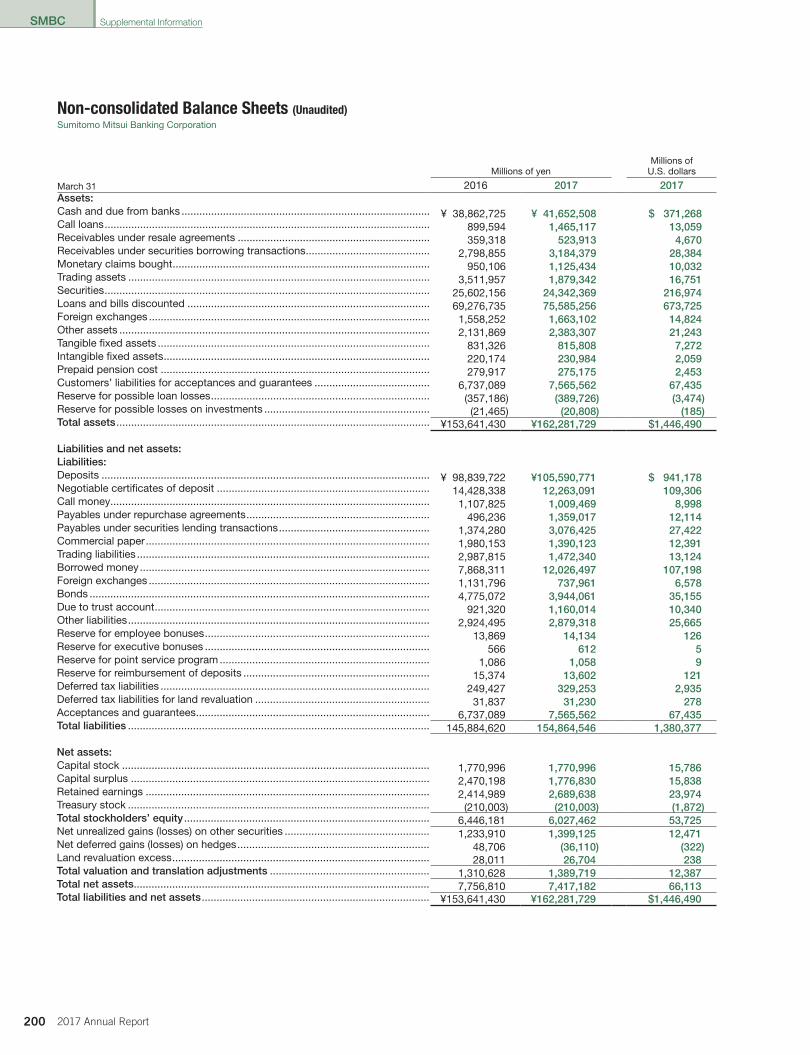
200 2017 Annual Report
SMBC
Non-consolidated Balance Sheets (Unaudited)Sumitomo Mitsui Banking Corporation
Millions of yen Millions of
U�S� dollars
March 31 2016 2017 2017Assets:Cash and due from banks ������������������������������������������������������������������������������������ ¥ 38,862,725 ¥ 41,652,508 $ 371,268Call loans �������������������������������������������������������������������������������������������������������������� 899,594 1,465,117 13,059Receivables under resale agreements ����������������������������������������������������������������� 359,318 523,913 4,670Receivables under securities borrowing transactions ������������������������������������������ 2,798,855 3,184,379 28,384Monetary claims bought ��������������������������������������������������������������������������������������� 950,106 1,125,434 10,032Trading assets ������������������������������������������������������������������������������������������������������ 3,511,957 1,879,342 16,751Securities �������������������������������������������������������������������������������������������������������������� 25,602,156 24,342,369 216,974Loans and bills discounted ���������������������������������������������������������������������������������� 69,276,735 75,585,256 673,725Foreign exchanges ����������������������������������������������������������������������������������������������� 1,558,252 1,663,102 14,824Other assets ��������������������������������������������������������������������������������������������������������� 2,131,869 2,383,307 21,243Tangible fixed assets �������������������������������������������������������������������������������������������� 831,326 815,808 7,272Intangible fixed assets ������������������������������������������������������������������������������������������ 220,174 230,984 2,059Prepaid pension cost ������������������������������������������������������������������������������������������� 279,917 275,175 2,453Customers’ liabilities for acceptances and guarantees ��������������������������������������� 6,737,089 7,565,562 67,435Reserve for possible loan losses �������������������������������������������������������������������������� (357,186) (389,726) (3,474)Reserve for possible losses on investments �������������������������������������������������������� (21,465) (20,808) (185)Total assets ���������������������������������������������������������������������������������������������������������� ¥153,641,430 ¥162,281,729 $1,446,490 Liabilities and net assets:Liabilities:Deposits ��������������������������������������������������������������������������������������������������������������� ¥ 98,839,722 ¥105,590,771 $ 941,178Negotiable certificates of deposit ������������������������������������������������������������������������ 14,428,338 12,263,091 109,306Call money ������������������������������������������������������������������������������������������������������������ 1,107,825 1,009,469 8,998Payables under repurchase agreements �������������������������������������������������������������� 496,236 1,359,017 12,114Payables under securities lending transactions ��������������������������������������������������� 1,374,280 3,076,425 27,422Commercial paper ������������������������������������������������������������������������������������������������ 1,980,153 1,390,123 12,391Trading liabilities ��������������������������������������������������������������������������������������������������� 2,987,815 1,472,340 13,124Borrowed money �������������������������������������������������������������������������������������������������� 7,868,311 12,026,497 107,198Foreign exchanges ����������������������������������������������������������������������������������������������� 1,131,796 737,961 6,578Bonds ������������������������������������������������������������������������������������������������������������������� 4,775,072 3,944,061 35,155Due to trust account ��������������������������������������������������������������������������������������������� 921,320 1,160,014 10,340Other liabilities ������������������������������������������������������������������������������������������������������ 2,924,495 2,879,318 25,665Reserve for employee bonuses ���������������������������������������������������������������������������� 13,869 14,134 126Reserve for executive bonuses ���������������������������������������������������������������������������� 566 612 5Reserve for point service program ����������������������������������������������������������������������� 1,086 1,058 9Reserve for reimbursement of deposits ��������������������������������������������������������������� 15,374 13,602 121Deferred tax liabilities ������������������������������������������������������������������������������������������� 249,427 329,253 2,935Deferred tax liabilities for land revaluation ����������������������������������������������������������� 31,837 31,230 278Acceptances and guarantees ������������������������������������������������������������������������������� 6,737,089 7,565,562 67,435Total liabilities ������������������������������������������������������������������������������������������������������ 145,884,620 154,864,546 1,380,377 Net assets:Capital stock �������������������������������������������������������������������������������������������������������� 1,770,996 1,770,996 15,786Capital surplus ����������������������������������������������������������������������������������������������������� 2,470,198 1,776,830 15,838Retained earnings ������������������������������������������������������������������������������������������������ 2,414,989 2,689,638 23,974Treasury stock ������������������������������������������������������������������������������������������������������ (210,003) (210,003) (1,872)Total stockholders’ equity ����������������������������������������������������������������������������������� 6,446,181 6,027,462 53,725Net unrealized gains (losses) on other securities ������������������������������������������������� 1,233,910 1,399,125 12,471Net deferred gains (losses) on hedges ����������������������������������������������������������������� 48,706 (36,110) (322)Land revaluation excess ��������������������������������������������������������������������������������������� 28,011 26,704 238Total valuation and translation adjustments ������������������������������������������������������ 1,310,628 1,389,719 12,387Total net assets ���������������������������������������������������������������������������������������������������� 7,756,810 7,417,182 66,113Total liabilities and net assets ����������������������������������������������������������������������������� ¥153,641,430 ¥162,281,729 $1,446,490
Supplemental Information
010_0800801372908.indd 200 2017/08/07 14:04:36
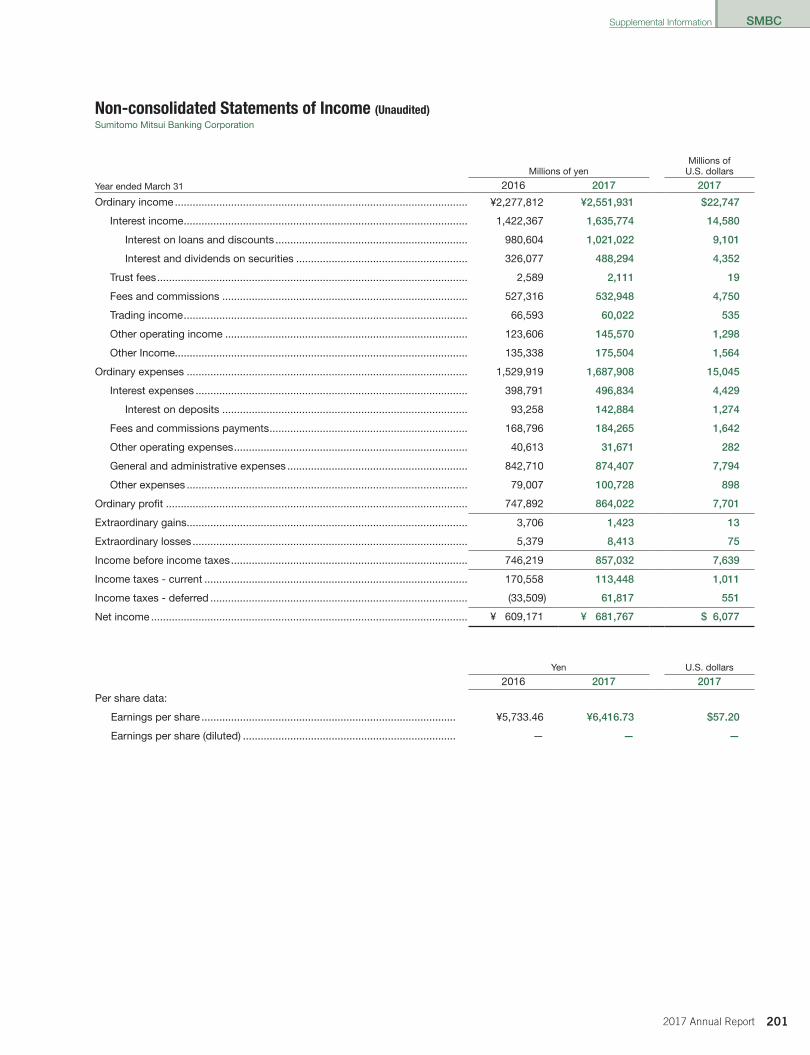
2012017 Annual Report
SMBC
Non-consolidated Statements of Income (Unaudited)Sumitomo Mitsui Banking Corporation
Millions of yen Millions of
U�S� dollars
Year ended March 31 2016 2017 2017
Ordinary income ��������������������������������������������������������������������������������������������������� ¥2,277,812 ¥2,551,931 $22,747
Interest income ������������������������������������������������������������������������������������������������ 1,422,367 1,635,774 14,580
Interest on loans and discounts ����������������������������������������������������������������� 980,604 1,021,022 9,101
Interest and dividends on securities ���������������������������������������������������������� 326,077 488,294 4,352
Trust fees ��������������������������������������������������������������������������������������������������������� 2,589 2,111 19
Fees and commissions ����������������������������������������������������������������������������������� 527,316 532,948 4,750
Trading income ������������������������������������������������������������������������������������������������ 66,593 60,022 535
Other operating income ���������������������������������������������������������������������������������� 123,606 145,570 1,298
Other Income��������������������������������������������������������������������������������������������������� 135,338 175,504 1,564
Ordinary expenses ����������������������������������������������������������������������������������������������� 1,529,919 1,687,908 15,045
Interest expenses �������������������������������������������������������������������������������������������� 398,791 496,834 4,429
Interest on deposits ����������������������������������������������������������������������������������� 93,258 142,884 1,274
Fees and commissions payments ������������������������������������������������������������������� 168,796 184,265 1,642
Other operating expenses ������������������������������������������������������������������������������� 40,613 31,671 282
General and administrative expenses ������������������������������������������������������������� 842,710 874,407 7,794
Other expenses ����������������������������������������������������������������������������������������������� 79,007 100,728 898
Ordinary profit ������������������������������������������������������������������������������������������������������ 747,892 864,022 7,701
Extraordinary gains ����������������������������������������������������������������������������������������������� 3,706 1,423 13
Extraordinary losses ��������������������������������������������������������������������������������������������� 5,379 8,413 75
Income before income taxes �������������������������������������������������������������������������������� 746,219 857,032 7,639
Income taxes - current ����������������������������������������������������������������������������������������� 170,558 113,448 1,011
Income taxes - deferred ��������������������������������������������������������������������������������������� (33,509) 61,817 551
Net income ����������������������������������������������������������������������������������������������������������� ¥ 609,171 ¥ 681,767 $ 6,077
Yen U�S� dollars
2016 2017 2017
Per share data:
Earnings per share �������������������������������������������������������������������������������������� ¥5,733�46 ¥6,416.73 $57.20
Earnings per share (diluted) ������������������������������������������������������������������������ — — —
Supplemental Information
010_0800801372908.indd 201 2017/08/07 14:04:36

SMFG
202 2017 Annual Report
Operating Income, Classified by Domestic and Overseas Operations
Millions of yen 2017 2016
Year ended March 31Domesticoperations
Overseasoperations Elimination Total
Domesticoperations
Overseasoperations Elimination Total
Interest income ����������������������������������������������������� ¥1,169,655 ¥827,003 ¥(84,631) ¥1,912,027 ¥1,241,523 ¥699,307 ¥(72,518) ¥1,868,313Interest expenses �������������������������������������������������� 246,060 319,440 (12,106) 553,394 268,976 228,429 (52,020) 445,385
Net interest income ��������������������������������������������������� 923,594 507,563 (72,524) 1,358,632 972,546 470,878 (20,497) 1,422,928Trust fees ������������������������������������������������������������������� 3,797 — — 3,797 3,681 — — 3,681
Fees and commissions ����������������������������������������� 983,977 224,712 (13,237) 1,195,452 946,124 202,621 (14,282) 1,134,463Fees and commissions payments ������������������������ 144,470 40,224 (2,590) 182,104 97,907 37,190 (4,472) 130,625
Net fees and commissions ���������������������������������������� 839,506 184,488 (10,646) 1,013,348 848,216 165,431 (9,809) 1,003,838Trading income������������������������������������������������������ 221,610 42,858 (27,073) 237,394 221,701 37,330 (33,549) 225,481Trading losses ������������������������������������������������������� 9,465 17,607 (27,073) — 5,655 27,894 (33,549) —
Net trading income ���������������������������������������������������� 212,144 25,250 — 237,394 216,045 9,436 — 225,481Other operating income ���������������������������������������� 1,256,723 327,406 (814) 1,583,316 1,059,947 283,600 (882) 1,342,665Other operating expenses������������������������������������� 1,077,307 199,409 (970) 1,275,747 939,328 156,041 (738) 1,094,630
Net other operating income��������������������������������������� 179,415 127,997 155 307,568 120,619 127,559 (144) 248,034
Notes: 1. Domestic operations comprise the operations of SMFG, its domestic consolidated banking subsidiaries (excluding overseas branches) and other domesticconsolidated subsidiaries. Overseas operations comprise the operations of the overseas branches of domestic consolidated banking subsidiaries andoverseas consolidated subsidiaries.
2. Inter-segment transactions are reported in the “Elimination” column.
Average Balance, Interest and Average Rate of Interest-Earning Assets and Interest-Bearing Liabilities
Domestic OperationsMillions of yen
2017 2016Year ended March 31 Average balance Interest Average rate Average balance Interest Average rateInterest-earning assets ���������������������������������������������� ¥ 87,746,070 ¥1,169,655 1.33% ¥ 87,513,636 ¥1,241,523 1�42%
Loans and bills discounted ����������������������������������� 55,634,086 826,571 1.49 52,187,299 846,804 1�62Securities �������������������������������������������������������������� 17,693,281 212,691 1.20 22,510,229 267,665 1�19Call loans and bills bought ������������������������������������ 76,166 467 0.61 147,992 861 0�58Receivables under resale agreements ������������������ 36,530 (10) (0.03) 32,450 15 0�05Receivables under securities
borrowing transactions ��������������������������������������� 7,827,996 12,172 0.16 6,722,143 10,747 0�16Deposits with banks ���������������������������������������������� 984,203 6,306 0.64 826,050 5,088 0�62Lease receivables and investment assets ������������ 1,801,420 51,237 2.84 1,480,695 40,742 2�75
Interest-bearing liabilities ������������������������������������������ ¥123,658,898 ¥ 246,060 0.20% ¥120,395,742 ¥ 268,976 0�22%Deposits ��������������������������������������������������������������� 92,978,393 33,592 0.04 84,632,369 40,303 0�05Negotiable certificates of deposit ������������������������� 6,064,857 1,081 0.02 7,027,344 5,466 0�08Call money and bills sold �������������������������������������� 603,065 91 0.02 2,295,334 1,523 0�07Payables under repurchase agreements �������������� 1,325,978 7,854 0.59 1,281,321 3,714 0�29Payables under securities lending transactions ��� 7,374,658 4,631 0.06 6,795,925 6,726 0�10Commercial paper������������������������������������������������� 138,698 59 0.04 145,053 203 0�14Borrowed money ��������������������������������������������������� 7,621,066 67,559 0.89 9,777,958 77,974 0�80Short-term bonds �������������������������������������������������� 1,183,878 118 0.01 1,451,156 1,400 0�10Bonds �������������������������������������������������������������������� 5,358,345 102,926 1.92 6,177,841 119,326 1�93
Notes: 1. Domestic operations comprise the operations of SMFG, its domestic consolidated banking subsidiaries (excluding overseas branches) and other domestic consolidated subsidiaries.
2. In principle, average balances are calculated by using daily balances. However, some consolidated subsidiaries use weekly, monthly or quarterly balancesinstead.
3. “Interest-earning assets” are shown after deduction of the average balance of noninterest-earning deposits (2017, ¥33,983,080 million; 2016, ¥28,376,025 million).
Income Analysis (Consolidated)Sumitomo Mitsui Financial Group, Inc� and Subsidiaries
011_0800804262908.indd 202 2017/08/07 14:36:30

SMFG
2032017 Annual Report
Overseas OperationsMillions of yen
2017 2016Year ended March 31 Average balance Interest Average rate Average balance Interest Average rateInterest-earning assets ���������������������������������������������� ¥40,533,726 ¥827,003 2.04% ¥37,621,327 ¥699,307 1�86%
Loans and bills discounted ����������������������������������� 23,868,315 599,614 2.51 22,365,670 528,869 2�36Securities �������������������������������������������������������������� 4,014,209 79,703 1.99 3,154,767 49,677 1�57Call loans and bills bought ������������������������������������ 1,319,676 11,738 0.89 918,358 19,596 2�13Receivables under resale agreements ������������������ 2,198,666 26,255 1.19 1,521,170 11,934 0�78Receivables under securities
borrowing transactions ��������������������������������������� — — — — — —Deposits with banks ���������������������������������������������� 4,888,341 44,092 0.90 5,678,537 32,833 0�58Lease receivables and investment assets ������������ 497,302 18,990 3.82 444,069 18,624 4�19
Interest-bearing liabilities ������������������������������������������ ¥32,659,822 ¥319,440 0.98% ¥28,979,734 ¥228,429 0�79%Deposits ��������������������������������������������������������������� 18,867,692 157,977 0.84 15,827,172 100,722 0�64Negotiable certificates of deposit ������������������������� 6,461,498 66,151 1.02 6,502,114 43,853 0�67Call money and bills sold �������������������������������������� 645,301 5,399 0.84 525,808 3,836 0�73Payables under repurchase agreements �������������� 3,241,888 15,784 0.49 1,934,523 6,212 0�32Payables under securities lending transactions ��� — — — — — —Commercial paper������������������������������������������������� 2,206,493 15,450 0.70 2,807,578 10,211 0�36Borrowed money ��������������������������������������������������� 830,387 13,805 1.66 752,364 10,861 1�44Short-term bonds �������������������������������������������������� — — — — — —Bonds �������������������������������������������������������������������� 107,166 4,153 3.88 77,162 3,934 5�10
Notes: 1. Overseas operations comprise the operations of the overseas branches of domestic consolidated banking subsidiaries and overseas consolidated subsidiaries.
2. In principle, average balances are calculated by using daily balances. However, some consolidated subsidiaries use weekly, monthly or quarterly balances instead.
3. “Interest-earning assets” are shown after deduction of the average balance of noninterest-earning deposits (2017, ¥2,134,415 million; 2016, ¥1,732,890 million).
Total of Domestic and Overseas OperationsMillions of yen
2017 2016Year ended March 31 Average balance Interest Average rate Average balance Interest Average rateInterest-earning assets ���������������������������������������������� ¥125,630,472 ¥1,912,027 1.52% ¥123,153,560 ¥1,868,313 1�52%
Loans and bills discounted ����������������������������������� 78,679,693 1,384,119 1.76 73,713,490 1,326,402 1�80Securities �������������������������������������������������������������� 21,494,609 259,840 1.21 25,450,418 303,132 1�19Call loans and bills bought ������������������������������������ 1,395,842 12,205 0.87 1,066,351 20,457 1�92Receivables under resale agreements ������������������ 1,096,826 18,886 1.72 727,468 10,100 1�39Receivables under securities
borrowing transactions ��������������������������������������� 7,827,996 12,172 0.16 6,722,143 10,747 0�16Deposits with banks ���������������������������������������������� 5,430,503 48,040 0.88 6,421,181 37,537 0�58Lease receivables and investment assets ������������ 2,298,722 70,227 3.06 1,924,764 59,366 3�08
Interest-bearing liabilities ������������������������������������������ ¥155,870,100 ¥ 553,394 0.36% ¥148,078,275 ¥ 445,385 0�30%Deposits ��������������������������������������������������������������� 111,384,184 189,204 0.17 100,364,107 140,633 0�14Negotiable certificates of deposit ������������������������� 12,526,355 67,232 0.54 13,529,459 49,319 0�36Call money and bills sold �������������������������������������� 1,248,366 5,491 0.44 2,821,143 5,360 0�19Payables under repurchase agreements �������������� 3,429,496 16,281 0.47 2,389,693 8,077 0�34Payables under securities lending transactions ��� 7,374,658 4,631 0.06 6,795,925 6,726 0�10Commercial paper������������������������������������������������� 2,345,192 15,510 0.66 2,952,632 10,415 0�35Borrowed money ��������������������������������������������������� 7,654,498 39,528 0.52 9,731,272 39,825 0�41Short-term bonds �������������������������������������������������� 1,183,878 118 0.01 1,451,156 1,400 0�10Bonds �������������������������������������������������������������������� 7,451,001 144,755 1.94 6,698,959 129,295 1�93
Notes: 1. The figures above comprise totals for domestic and overseas operations after inter-segment eliminations.2. In principle, average balances are calculated by using daily balances. However, some consolidated subsidiaries use weekly, monthly or quarterly balances
instead.3. “Interest-earning assets” are shown after deduction of the average balance of noninterest-earning deposits (2017, ¥36,098,076 million; 2016, ¥30,098,341
million).
Income Analysis (Consolidated)
011_0800804262908.indd 203 2017/08/07 14:36:30
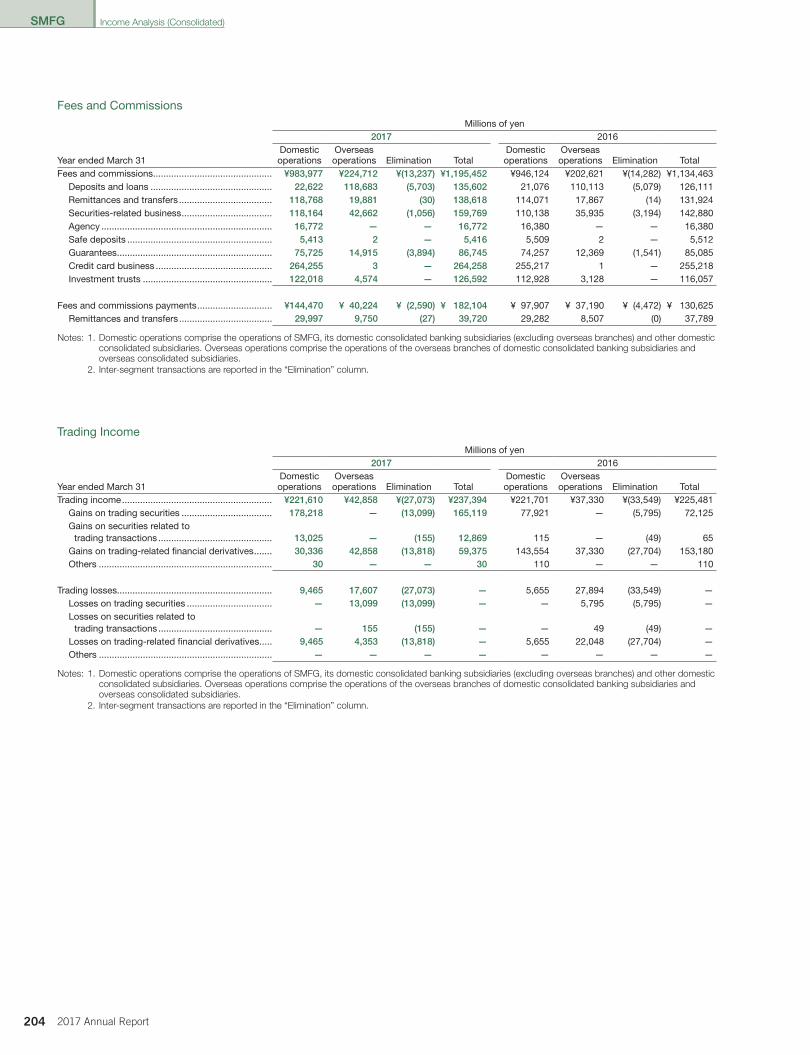
SMFG
204 2017 Annual Report
Fees and CommissionsMillions of yen
2017 2016
Year ended March 31Domesticoperations
Overseasoperations Elimination Total
Domesticoperations
Overseasoperations Elimination Total
Fees and commissions ���������������������������������������������� ¥983,977 ¥224,712 ¥(13,237) ¥1,195,452 ¥946,124 ¥202,621 ¥(14,282) ¥1,134,463Deposits and loans ����������������������������������������������� 22,622 118,683 (5,703) 135,602 21,076 110,113 (5,079) 126,111Remittances and transfers ������������������������������������ 118,768 19,881 (30) 138,618 114,071 17,867 (14) 131,924Securities-related business ����������������������������������� 118,164 42,662 (1,056) 159,769 110,138 35,935 (3,194) 142,880Agency ������������������������������������������������������������������ 16,772 — — 16,772 16,380 — — 16,380Safe deposits �������������������������������������������������������� 5,413 2 — 5,416 5,509 2 — 5,512Guarantees ������������������������������������������������������������ 75,725 14,915 (3,894) 86,745 74,257 12,369 (1,541) 85,085Credit card business ��������������������������������������������� 264,255 3 — 264,258 255,217 1 — 255,218Investment trusts �������������������������������������������������� 122,018 4,574 — 126,592 112,928 3,128 — 116,057
Fees and commissions payments ����������������������������� ¥144,470 ¥ 40,224 ¥ (2,590) ¥ 182,104 ¥ 97,907 ¥ 37,190 ¥ (4,472) ¥ 130,625Remittances and transfers ������������������������������������ 29,997 9,750 (27) 39,720 29,282 8,507 (0) 37,789
Notes: 1. Domestic operations comprise the operations of SMFG, its domestic consolidated banking subsidiaries (excluding overseas branches) and other domesticconsolidated subsidiaries. Overseas operations comprise the operations of the overseas branches of domestic consolidated banking subsidiaries andoverseas consolidated subsidiaries.
2. Inter-segment transactions are reported in the “Elimination” column.
Trading IncomeMillions of yen
2017 2016
Year ended March 31Domesticoperations
Overseasoperations Elimination Total
Domesticoperations
Overseasoperations Elimination Total
Trading income ���������������������������������������������������������� ¥221,610 ¥42,858 ¥(27,073) ¥237,394 ¥221,701 ¥37,330 ¥(33,549) ¥225,481Gains on trading securities ����������������������������������� 178,218 — (13,099) 165,119 77,921 — (5,795) 72,125Gains on securities related to
trading transactions �������������������������������������������� 13,025 — (155) 12,869 115 — (49) 65Gains on trading-related financial derivatives ������� 30,336 42,858 (13,818) 59,375 143,554 37,330 (27,704) 153,180Others ������������������������������������������������������������������� 30 — — 30 110 — — 110
Trading losses������������������������������������������������������������ 9,465 17,607 (27,073) — 5,655 27,894 (33,549) —Losses on trading securities ��������������������������������� — 13,099 (13,099) — — 5,795 (5,795) —Losses on securities related to
trading transactions �������������������������������������������� — 155 (155) — — 49 (49) —Losses on trading-related financial derivatives ����� 9,465 4,353 (13,818) — 5,655 22,048 (27,704) —Others ������������������������������������������������������������������� — — — — — — — —
Notes: 1. Domestic operations comprise the operations of SMFG, its domestic consolidated banking subsidiaries (excluding overseas branches) and other domesticconsolidated subsidiaries. Overseas operations comprise the operations of the overseas branches of domestic consolidated banking subsidiaries andoverseas consolidated subsidiaries.
2. Inter-segment transactions are reported in the “Elimination” column.
Income Analysis (Consolidated)
011_0800804262908.indd 204 2017/08/07 14:36:30
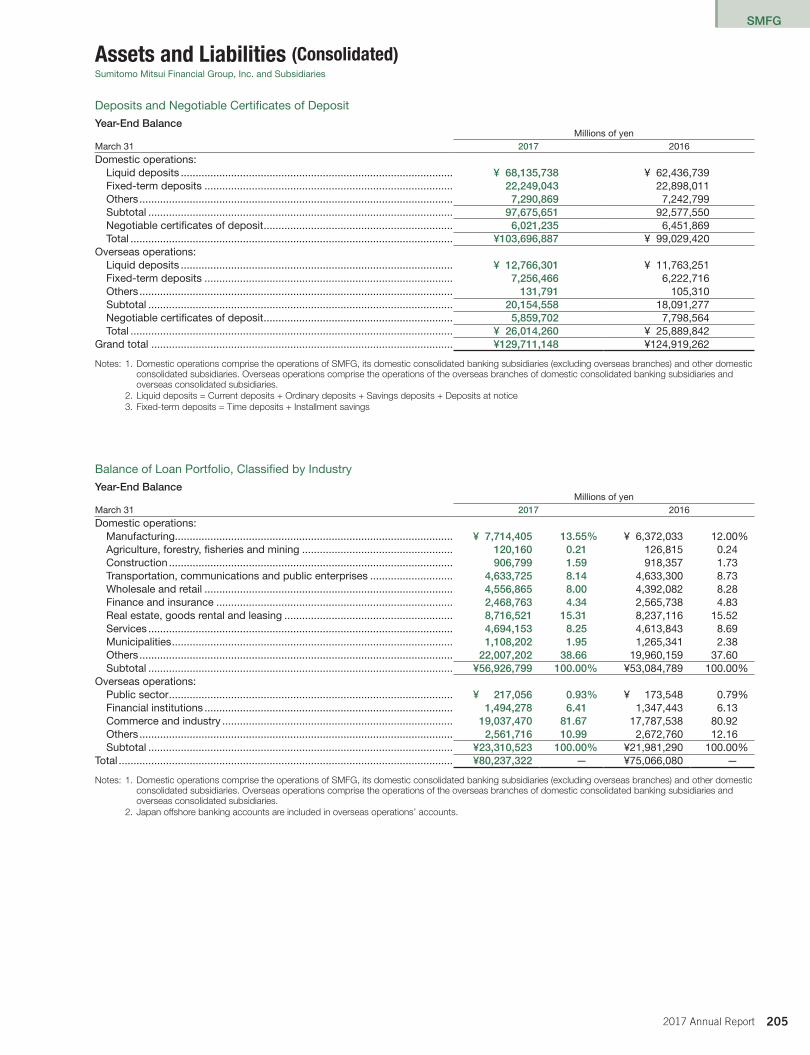
SMFG
2052017 Annual Report
Assets and Liabilities (Consolidated)Sumitomo Mitsui Financial Group, Inc� and Subsidiaries
Deposits and Negotiable Certificates of Deposit
Year-End BalanceMillions of yen
March 31 2017 2016Domestic operations:
Liquid deposits �������������������������������������������������������������������������������������������� ¥ 68,135,738 ¥ 62,436,739Fixed-term deposits ������������������������������������������������������������������������������������ 22,249,043 22,898,011Others ���������������������������������������������������������������������������������������������������������� 7,290,869 7,242,799Subtotal ������������������������������������������������������������������������������������������������������� 97,675,651 92,577,550Negotiable certificates of deposit ���������������������������������������������������������������� 6,021,235 6,451,869Total ������������������������������������������������������������������������������������������������������������� ¥103,696,887 ¥ 99,029,420
Overseas operations:Liquid deposits �������������������������������������������������������������������������������������������� ¥ 12,766,301 ¥ 11,763,251Fixed-term deposits ������������������������������������������������������������������������������������ 7,256,466 6,222,716Others ���������������������������������������������������������������������������������������������������������� 131,791 105,310Subtotal ������������������������������������������������������������������������������������������������������� 20,154,558 18,091,277Negotiable certificates of deposit ���������������������������������������������������������������� 5,859,702 7,798,564Total ������������������������������������������������������������������������������������������������������������� ¥ 26,014,260 ¥ 25,889,842
Grand total ������������������������������������������������������������������������������������������������������ ¥129,711,148 ¥124,919,262
Notes: 1. Domestic operations comprise the operations of SMFG, its domestic consolidated banking subsidiaries (excluding overseas branches) and other domestic consolidated subsidiaries. Overseas operations comprise the operations of the overseas branches of domestic consolidated banking subsidiaries and overseas consolidated subsidiaries.
2. Liquid deposits = Current deposits + Ordinary deposits + Savings deposits + Deposits at notice3. Fixed-term deposits = Time deposits + Installment savings
Balance of Loan Portfolio, Classified by Industry
Year-End BalanceMillions of yen
March 31 2017 2016Domestic operations:
Manufacturing���������������������������������������������������������������������������������������������� ¥ 7,714,405 13.55% ¥ 6,372,033 12�00%Agriculture, forestry, fisheries and mining ��������������������������������������������������� 120,160 0.21 126,815 0�24Construction ������������������������������������������������������������������������������������������������ 906,799 1.59 918,357 1�73Transportation, communications and public enterprises ���������������������������� 4,633,725 8.14 4,633,300 8�73Wholesale and retail ������������������������������������������������������������������������������������ 4,556,865 8.00 4,392,082 8�28Finance and insurance �������������������������������������������������������������������������������� 2,468,763 4.34 2,565,738 4�83Real estate, goods rental and leasing ��������������������������������������������������������� 8,716,521 15.31 8,237,116 15�52Services ������������������������������������������������������������������������������������������������������� 4,694,153 8.25 4,613,843 8�69Municipalities ����������������������������������������������������������������������������������������������� 1,108,202 1.95 1,265,341 2�38Others ���������������������������������������������������������������������������������������������������������� 22,007,202 38.66 19,960,159 37�60Subtotal ������������������������������������������������������������������������������������������������������� ¥56,926,799 100.00% ¥53,084,789 100�00%
Overseas operations:Public sector ������������������������������������������������������������������������������������������������ ¥ 217,056 0.93% ¥ 173,548 0�79%Financial institutions ������������������������������������������������������������������������������������ 1,494,278 6.41 1,347,443 6�13Commerce and industry ������������������������������������������������������������������������������ 19,037,470 81.67 17,787,538 80�92Others ���������������������������������������������������������������������������������������������������������� 2,561,716 10.99 2,672,760 12�16Subtotal ������������������������������������������������������������������������������������������������������� ¥23,310,523 100.00% ¥21,981,290 100�00%
Total ����������������������������������������������������������������������������������������������������������������� ¥80,237,322 — ¥75,066,080 —
Notes: 1. Domestic operations comprise the operations of SMFG, its domestic consolidated banking subsidiaries (excluding overseas branches) and other domestic consolidated subsidiaries. Overseas operations comprise the operations of the overseas branches of domestic consolidated banking subsidiaries and overseas consolidated subsidiaries.
2. Japan offshore banking accounts are included in overseas operations’ accounts.
011_0800804262908.indd 205 2017/08/07 14:36:30
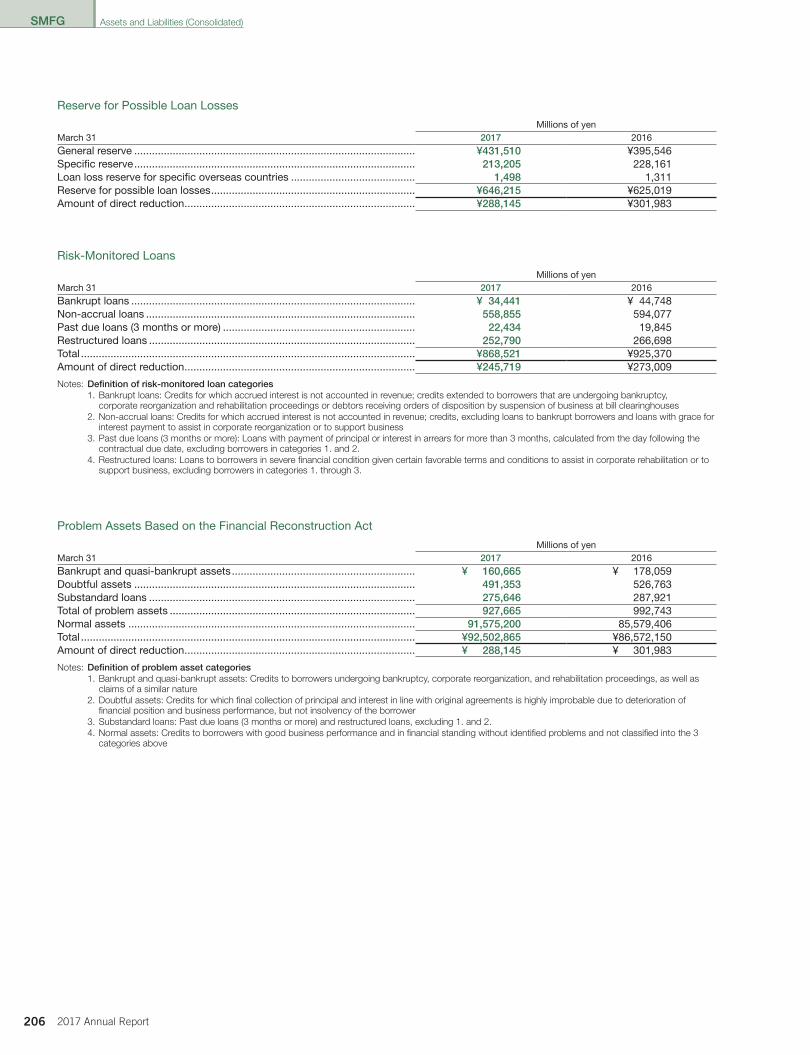
SMFG
206 2017 Annual Report
Reserve for Possible Loan Losses
Millions of yen March 31 2017 2016General reserve ����������������������������������������������������������������������������������������������� ¥431,510 ¥395,546 Specific reserve ����������������������������������������������������������������������������������������������� 213,205 228,161Loan loss reserve for specific overseas countries ������������������������������������������ 1,498 1,311Reserve for possible loan losses ��������������������������������������������������������������������� ¥646,215 ¥625,019Amount of direct reduction ������������������������������������������������������������������������������ ¥288,145 ¥301,983
Risk-Monitored Loans
Millions of yen March 31 2017 2016Bankrupt loans ������������������������������������������������������������������������������������������������ ¥ 34,441 ¥ 44,748Non-accrual loans ������������������������������������������������������������������������������������������� 558,855 594,077Past due loans (3 months or more) ����������������������������������������������������������������� 22,434 19,845Restructured loans ������������������������������������������������������������������������������������������ 252,790 266,698Total ����������������������������������������������������������������������������������������������������������������� ¥868,521 ¥925,370Amount of direct reduction ������������������������������������������������������������������������������ ¥245,719 ¥273,009
Notes: Definition of risk-monitored loan categories1. Bankrupt loans: Credits for which accrued interest is not accounted in revenue; credits extended to borrowers that are undergoing bankruptcy,
corporate reorganization and rehabilitation proceedings or debtors receiving orders of disposition by suspension of business at bill clearinghouses2. Non-accrual loans: Credits for which accrued interest is not accounted in revenue; credits, excluding loans to bankrupt borrowers and loans with grace for
interest payment to assist in corporate reorganization or to support business3. Past due loans (3 months or more): Loans with payment of principal or interest in arrears for more than 3 months, calculated from the day following the
contractual due date, excluding borrowers in categories 1. and 2.4. Restructured loans: Loans to borrowers in severe financial condition given certain favorable terms and conditions to assist in corporate rehabilitation or to
support business, excluding borrowers in categories 1. through 3.
Problem Assets Based on the Financial Reconstruction Act
Millions of yen March 31 2017 2016Bankrupt and quasi-bankrupt assets �������������������������������������������������������������� ¥ 160,665 ¥ 178,059Doubtful assets ����������������������������������������������������������������������������������������������� 491,353 526,763Substandard loans ������������������������������������������������������������������������������������������ 275,646 287,921Total of problem assets ����������������������������������������������������������������������������������� 927,665 992,743Normal assets ������������������������������������������������������������������������������������������������� 91,575,200 85,579,406Total ����������������������������������������������������������������������������������������������������������������� ¥92,502,865 ¥86,572,150Amount of direct reduction ������������������������������������������������������������������������������ ¥ 288,145 ¥ 301,983
Notes: Definition of problem asset categories1. Bankrupt and quasi-bankrupt assets: Credits to borrowers undergoing bankruptcy, corporate reorganization, and rehabilitation proceedings, as well as
claims of a similar nature2. Doubtful assets: Credits for which final collection of principal and interest in line with original agreements is highly improbable due to deterioration of
financial position and business performance, but not insolvency of the borrower3. Substandard loans: Past due loans (3 months or more) and restructured loans, excluding 1. and 2.4. Normal assets: Credits to borrowers with good business performance and in financial standing without identified problems and not classified into the 3
categories above
Assets and Liabilities (Consolidated)
011_0800804262908.indd 206 2017/08/07 14:36:30

SMFG
2072017 Annual Report
Securities
Year-End BalanceMillions of yen
March 31 2017 2016Domestic operations:
Japanese government bonds ���������������������������������������������������������������������� ¥ 8,454,687 ¥10,346,596Japanese local government bonds ������������������������������������������������������������� 90,243 52,070Japanese corporate bonds ������������������������������������������������������������������������� 2,731,856 2,679,706Japanese stocks ������������������������������������������������������������������������������������������ 3,925,112 3,698,605Others ���������������������������������������������������������������������������������������������������������� 5,297,701 5,087,628Subtotal ������������������������������������������������������������������������������������������������������� ¥20,499,601 ¥21,864,608
Overseas operations:Japanese government bonds ���������������������������������������������������������������������� ¥ — ¥ —Japanese local government bonds ������������������������������������������������������������� — —Japanese corporate bonds ������������������������������������������������������������������������� 78,031 82,314Japanese stocks ������������������������������������������������������������������������������������������ — —Others ���������������������������������������������������������������������������������������������������������� 3,998,504 3,263,832Subtotal ������������������������������������������������������������������������������������������������������� ¥ 4,076,536 ¥ 3,346,147
Unallocated corporate assets:Japanese government bonds ���������������������������������������������������������������������� ¥ — ¥ —Japanese local government bonds ������������������������������������������������������������� — —Japanese corporate bonds ������������������������������������������������������������������������� — —Japanese stocks ������������������������������������������������������������������������������������������ 55,654 53,689Others ���������������������������������������������������������������������������������������������������������� — —Subtotal ������������������������������������������������������������������������������������������������������� ¥ 55,654 ¥ 53,689
Total ����������������������������������������������������������������������������������������������������������������� ¥24,631,792 ¥25,264,445
Notes: 1. Domestic operations comprise the operations of SMFG, its domestic consolidated banking subsidiaries (excluding overseas branches) and other domestic consolidated subsidiaries. Overseas operations comprise the operations of the overseas branches of domestic consolidated banking subsidiaries and overseas consolidated subsidiaries.
2. “Others” include foreign bonds and foreign stocks.
Trading Assets and LiabilitiesMillions of yen
2017 2016
March 31Domesticoperations
Overseasoperations Elimination Total
Domesticoperations
Overseasoperations Elimination Total
Trading assets ����������������������������������������������������������� ¥5,882,221 ¥906,906 ¥(33,700) ¥6,755,428 ¥7,176,926 ¥942,823 ¥(56,468) ¥8,063,281Trading securities �������������������������������������������������� 3,543,982 136,723 — 3,680,705 3,431,314 138,744 — 3,570,058Derivatives of trading securities ���������������������������� 56,901 — — 56,901 13,581 — — 13,581Securities related to trading transactions ������������� — — — — — — — —Derivatives of securities related to
trading transactions �������������������������������������������� 10,586 97 — 10,684 18,098 120 — 18,218Trading-related financial derivatives ��������������������� 2,172,657 770,086 (33,700) 2,909,043 3,649,936 803,958 (56,468) 4,397,427Other trading assets���������������������������������������������� 98,093 — — 98,093 63,995 — — 63,995
Trading liabilities �������������������������������������������������������� ¥3,904,067 ¥834,564 ¥(33,700) ¥4,704,931 ¥5,361,628 ¥807,507 ¥(56,468) ¥6,112,667Trading securities sold for short sales ������������������ 2,013,249 58,334 — 2,071,583 2,153,965 43,707 — 2,197,673Derivatives of trading securities ���������������������������� 58,961 — — 58,961 29,724 — — 29,724Securities related to trading transactions
sold for short sales ��������������������������������������������� — — — — — — — —Derivatives of securities related to
trading transactions �������������������������������������������� 8,633 91 — 8,724 17,275 80 — 17,356Trading-related financial derivatives ��������������������� 1,823,223 776,138 (33,700) 2,565,661 3,160,662 763,719 (56,468) 3,867,913Other trading liabilities ������������������������������������������ — — — — — — — —
Notes: 1. Domestic operations comprise the operations of SMFG, its domestic consolidated banking subsidiaries (excluding overseas branches) and other domestic consolidated subsidiaries. Overseas operations comprise the operations of the overseas branches of domestic consolidated banking subsidiaries and overseas consolidated subsidiaries.
2. Inter-segment transactions are reported in the “Elimination” column.
Assets and Liabilities (Consolidated)
011_0800804262908.indd 207 2017/08/07 14:36:30
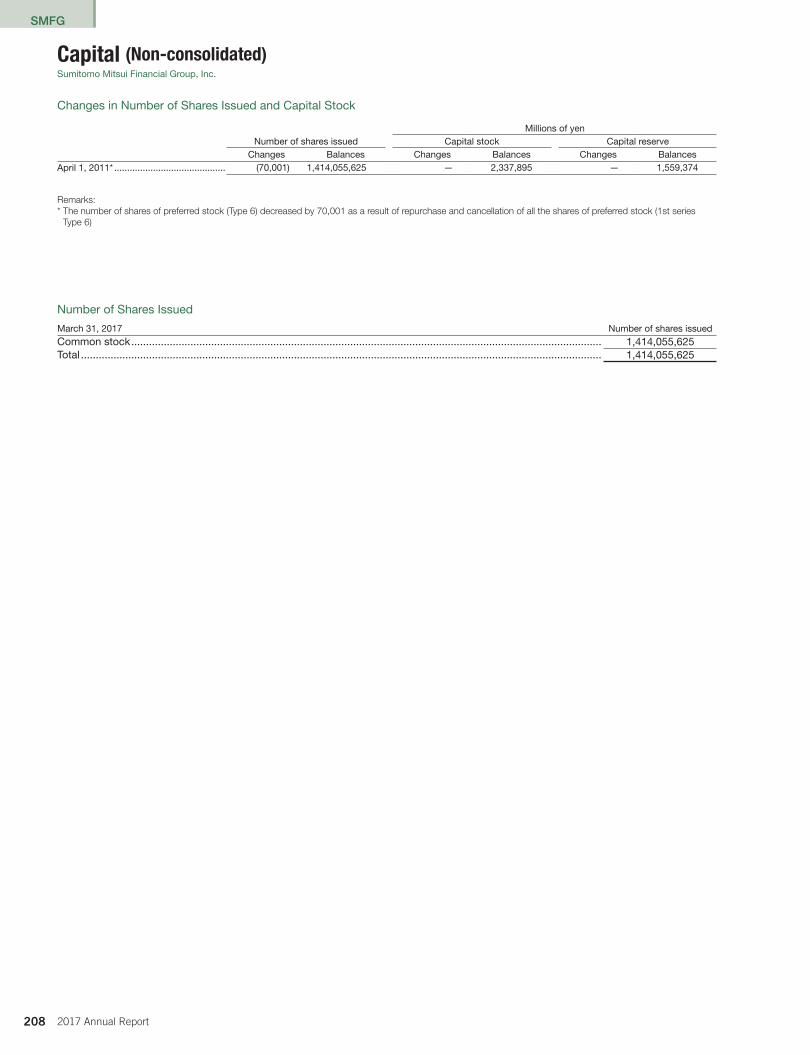
SMFG
208 2017 Annual Report
Capital (Non-consolidated)Sumitomo Mitsui Financial Group, Inc�
Changes in Number of Shares Issued and Capital Stock
Millions of yen Number of shares issued Capital stock Capital reserve
Changes Balances Changes Balances Changes BalancesApril 1, 2011* ������������������������������������������� (70,001) 1,414,055,625 — 2,337,895 — 1,559,374
Remarks:* The number of shares of preferred stock (Type 6) decreased by 70,001 as a result of repurchase and cancellation of all the shares of preferred stock (1st series Type 6)
Number of Shares Issued
March 31, 2017 Number of shares issuedCommon stock ��������������������������������������������������������������������������������������������������������������������������������������������������������������� 1,414,055,625Total �������������������������������������������������������������������������������������������������������������������������������������������������������������������������������� 1,414,055,625
011_0800804262908.indd 208 2017/08/07 14:36:30

SMFG
2092017 Annual Report
Stock Exchange ListingsTokyo Stock Exchange (First Section)Nagoya Stock Exchange (First Section)New York Stock Exchange** SMFG listed its ADRs on the New York Stock Exchange.
Number of Common Shares, Classified by Type of Shareholders
March 31, 2017Number of
shareholdersNumber of
unitsPercentage of
total
Japanese government and local government ������������������������������������������������������������������ 7 4,774 0�03%Financial institutions ��������������������������������������������������������������������������������������������������������� 362 3,830,262 27�13Securities companies ������������������������������������������������������������������������������������������������������� 79 749,815 5�31Other institutions �������������������������������������������������������������������������������������������������������������� 7,983 1,382,303 9�79Foreign institutions ����������������������������������������������������������������������������������������������������������� 1,161 6,259,012 44�33Foreign individuals ����������������������������������������������������������������������������������������������������������� 356 4,707 0�03Individuals and others ������������������������������������������������������������������������������������������������������ 297,524 1,889,554 13�38Total ���������������������������������������������������������������������������������������������������������������������������������� 307,472 14,120,427 100�00%Fractional shares (shares) ������������������������������������������������������������������������������������������������� — 2,012,925 —
Notes: 1. Of 4,028,883 shares in treasury stock, 40,288 units are included in “Individuals and others” and the remaining 83 shares are included in “Fractional shares.”2. “Other institutions” and “Fractional shares” includes 29 units and 48 shares, held at Japan Securities Depository Center, Incorporated.3. In the row “Fractional shares,” title in the Register of Shareholders is in the name of Sumitomo Mitsui Banking Corporation, but 60 of the shares listed are
not substantially in the ownership of the bank.
Principal Shareholders
March 31, 2017Number of
sharesPercentage of
shares outstanding
Japan Trustee Services Bank, Ltd� (Trust Account) ������������������������������������������������������������������������������������� 77,865,200 5�50%The Master Trust Bank of Japan, Ltd� (Trust Account) �������������������������������������������������������������������������������� 63,818,600 4�51Japan Trustee Services Bank, Ltd� (Trust Account 5) ���������������������������������������������������������������������������������� 29,034,200 2�05Japan Trustee Services Bank, Ltd� (Trust Account 9) ���������������������������������������������������������������������������������� 26,246,700 1�85STATE STREET BANK AND TRUST COMPANY 505223* ��������������������������������������������������������������������������� 24,825,763 1�75Japan Trustee Services Bank, Ltd� (Trust Account 1) ���������������������������������������������������������������������������������� 21,554,900 1�52Japan Trustee Services Bank, Ltd� (Trust Account 2) ���������������������������������������������������������������������������������� 21,282,200 1�50NATSCUMCO** ������������������������������������������������������������������������������������������������������������������������������������������� 19,858,605 1�40Japan Trustee Services Bank, Ltd� (Trust Account 7) ���������������������������������������������������������������������������������� 19,285,300 1�36STATE STREET BANK WEST CLIENT - TREATY 505234*** ����������������������������������������������������������������������� 19,048,976 1�34Total ������������������������������������������������������������������������������������������������������������������������������������������������������������� 322,820,444 22�82%
* Standing agent: Mizuho Bank, Ltd. Settlement Service Department** Standing agent: Sumitomo Mitsui Banking Corporation*** Standing agent: Mizuho Bank, Ltd. Settlement Service DepartmentNotes: 1. Sumitomo Mitsui Trust Bank, Limited has submitted a Report of Possession of Large Volume regarding its shareholding as of September 6, 2016. It stated
that Sumitomo Mitsui Trust Bank, Limited and two other shareholders held the following common shares in SMFG as of August 31, 2016. But, these three are not included in the above Principal Shareholders because SMFG was unable to confirm the number of shares owned by them at the end of the fiscal year under review.The Report of Possession of Large Volume is detailed as follows: Principal Shareholder: Sumitomo Mitsui Trust Bank, Limited (and two other joint holders) Number of share held: 71,542,000 shares (including joint ownership) Shareholding ratio: 5.06%
2. Mizuho Securities Co., Ltd. has submitted a Report of Possession of Large Volume regarding its shareholding as of October 21, 2016. It stated that Mizuho Securities Co., Ltd. and another shareholder held the following common shares in SMFG as of October 14, 2016. But, these two are not included in the above Principal Shareholders because SMFG was unable to confirm the number of shares owned by them at the end of the fiscal year under review.The Report of Possession of Large Volume is detailed as follows: Principal Shareholder: Mizuho Securities Co., Ltd. (and another joint holder) Number of share held: 72,802,582 shares (including joint ownership) Shareholding ratio: 5.15%
3. BlackRock Japan Co., Ltd. has submitted a Change Report of Possession of Large Volume regarding its shareholding as of March 22, 2017. It stated that BlackRock Japan Co., Ltd. and nine other shareholders held the following common shares in SMFG as of March 15, 2017. But, these ten are not included in the above Principal Shareholders because SMFG was unable to confirm the number of shares owned by them at the end of the fiscal year under review.The Change Report of Possession of Large Volume is detailed as follows: Principal Shareholder: BlackRock Japan Co., Ltd. (and nine other joint holders) Number of share held: 90,686,690 shares (including joint ownership) Shareholding ratio: 6.41%
Capital (Non-consolidated)
011_0800804262908.indd 209 2017/08/07 14:36:30
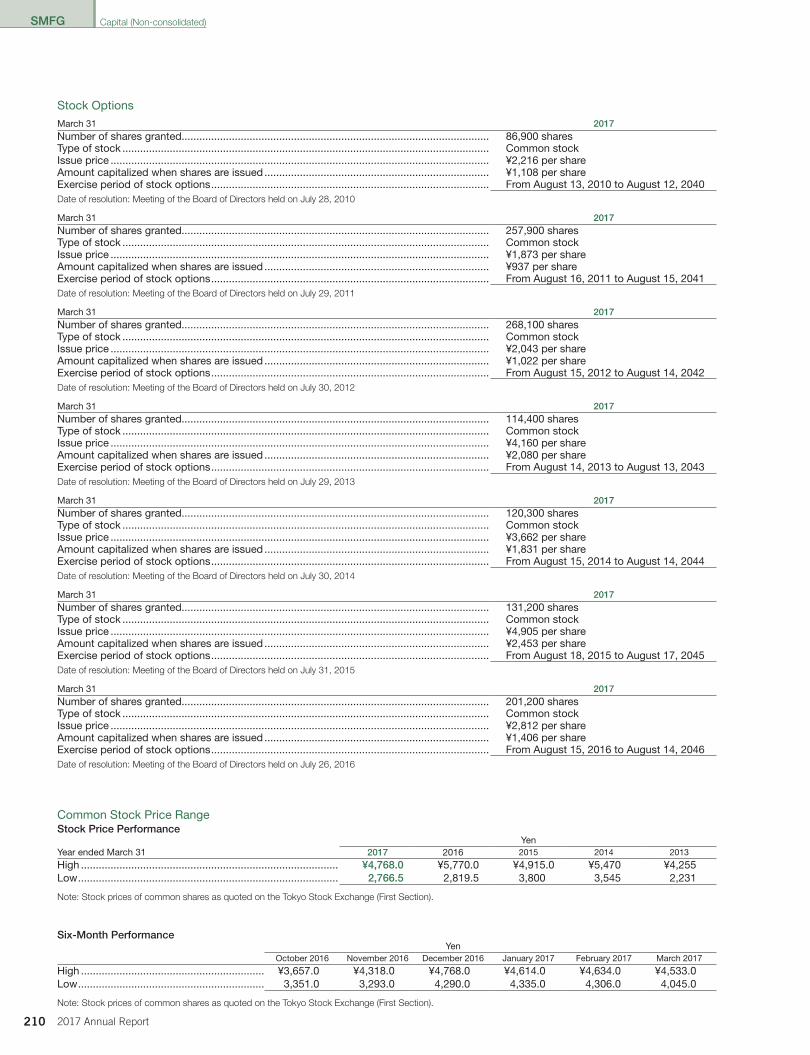
SMFG
210 2017 Annual Report
Stock OptionsMarch 31 2017Number of shares granted�������������������������������������������������������������������������������������������������������� 86,900 sharesType of stock ���������������������������������������������������������������������������������������������������������������������������� Common stockIssue price �������������������������������������������������������������������������������������������������������������������������������� ¥2,216 per shareAmount capitalized when shares are issued ���������������������������������������������������������������������������� ¥1,108 per shareExercise period of stock options ���������������������������������������������������������������������������������������������� From August 13, 2010 to August 12, 2040Date of resolution: Meeting of the Board of Directors held on July 28, 2010
March 31 2017Number of shares granted�������������������������������������������������������������������������������������������������������� 257,900 sharesType of stock ���������������������������������������������������������������������������������������������������������������������������� Common stockIssue price �������������������������������������������������������������������������������������������������������������������������������� ¥1,873 per shareAmount capitalized when shares are issued ���������������������������������������������������������������������������� ¥937 per shareExercise period of stock options ���������������������������������������������������������������������������������������������� From August 16, 2011 to August 15, 2041Date of resolution: Meeting of the Board of Directors held on July 29, 2011
March 31 2017Number of shares granted�������������������������������������������������������������������������������������������������������� 268,100 sharesType of stock ���������������������������������������������������������������������������������������������������������������������������� Common stockIssue price �������������������������������������������������������������������������������������������������������������������������������� ¥2,043 per shareAmount capitalized when shares are issued ���������������������������������������������������������������������������� ¥1,022 per shareExercise period of stock options ���������������������������������������������������������������������������������������������� From August 15, 2012 to August 14, 2042Date of resolution: Meeting of the Board of Directors held on July 30, 2012
March 31 2017Number of shares granted�������������������������������������������������������������������������������������������������������� 114,400 sharesType of stock ���������������������������������������������������������������������������������������������������������������������������� Common stockIssue price �������������������������������������������������������������������������������������������������������������������������������� ¥4,160 per shareAmount capitalized when shares are issued ���������������������������������������������������������������������������� ¥2,080 per shareExercise period of stock options ���������������������������������������������������������������������������������������������� From August 14, 2013 to August 13, 2043Date of resolution: Meeting of the Board of Directors held on July 29, 2013
March 31 2017Number of shares granted�������������������������������������������������������������������������������������������������������� 120,300 sharesType of stock ���������������������������������������������������������������������������������������������������������������������������� Common stockIssue price �������������������������������������������������������������������������������������������������������������������������������� ¥3,662 per shareAmount capitalized when shares are issued ���������������������������������������������������������������������������� ¥1,831 per shareExercise period of stock options ���������������������������������������������������������������������������������������������� From August 15, 2014 to August 14, 2044Date of resolution: Meeting of the Board of Directors held on July 30, 2014
March 31 2017Number of shares granted�������������������������������������������������������������������������������������������������������� 131,200 sharesType of stock ���������������������������������������������������������������������������������������������������������������������������� Common stockIssue price �������������������������������������������������������������������������������������������������������������������������������� ¥4,905 per shareAmount capitalized when shares are issued ���������������������������������������������������������������������������� ¥2,453 per shareExercise period of stock options ���������������������������������������������������������������������������������������������� From August 18, 2015 to August 17, 2045Date of resolution: Meeting of the Board of Directors held on July 31, 2015
March 31 2017Number of shares granted�������������������������������������������������������������������������������������������������������� 201,200 sharesType of stock ���������������������������������������������������������������������������������������������������������������������������� Common stockIssue price �������������������������������������������������������������������������������������������������������������������������������� ¥2,812 per shareAmount capitalized when shares are issued ���������������������������������������������������������������������������� ¥1,406 per shareExercise period of stock options ���������������������������������������������������������������������������������������������� From August 15, 2016 to August 14, 2046Date of resolution: Meeting of the Board of Directors held on July 26, 2016
Common Stock Price RangeStock Price Performance
YenYear ended March 31 2017 2016 2015 2014 2013
High ��������������������������������������������������������������������������������������� ¥4,768.0 ¥5,770�0 ¥4,915�0 ¥5,470 ¥4,255Low ���������������������������������������������������������������������������������������� 2,766.5 2,819�5 3,800 3,545 2,231
Note: Stock prices of common shares as quoted on the Tokyo Stock Exchange (First Section).
Six-Month PerformanceYen
October 2016 November 2016 December 2016 January 2017 February 2017 March 2017
High �������������������������������������������������������������� ¥3,657�0 ¥4,318�0 ¥4,768�0 ¥4,614�0 ¥4,634�0 ¥4,533�0Low ��������������������������������������������������������������� 3,351�0 3,293�0 4,290�0 4,335�0 4,306�0 4,045�0
Note: Stock prices of common shares as quoted on the Tokyo Stock Exchange (First Section).
Capital (Non-consolidated)
011_0800804262908.indd 210 2017/08/07 14:36:30
SMFG
2112017 Annual Report
Basel III Information
The consolidated capital ratio is calculated using the method stipulated in “Standards for Bank Holding Company to Examine the Adequacy of Its Capital Based on Assets, Etc. Held by It and Its Subsidiaries Pursuant to Article 52-25 of the Banking Act” (Notification No. 20 issued by the Japanese Financial Services Agency in 2006; hereinafter referred to as “the Notification”).In addition to the method stipulated in the Notification to calculate the consolidated capital ratio (referred to as “International Standard” in the Notification), SMFG has adopted the Advanced Internal Ratings-Based (AIRB) approach for calculating credit risk-weighted asset amounts and the Advanced Measurement Approach (AMA) for calculating the operational risk equivalent amount.“Consolidated Capital Ratio Information” was prepared principally based on the Notification, and the terms and details in the section may differ from those in other sections of this report.
■ Scope of Consolidation1. Consolidated Capital Ratio Calculation
• Number of consolidated subsidiaries: 354 Please refer to “Principal Subsidiaries and Affiliates” on page 104 for their names and business outline.• Scope of consolidated subsidiaries for calculation of the consolidated capital ratio is based on the scope of consolidated subsidiaries for preparing consolidated financial statements.• There are no affiliates to which the proportionate consolidation method is applied.
2. Restrictions on Movement of Funds and Capital within Holding Company Group There are no special restrictions on movement of funds and capital among SMFG and its group companies.
3. Names of companies among subsidiaries of bank-holding companies (other financial institutions), with the Basel Capital Accord required amount, and total shortfall amount
Not applicable.
■ Capital Structure Information (Consolidated Capital Ratio (International Standard))Regarding the calculation of the capital ratio, certain procedures were performed by KPMG AZSA LLC pursuant to “Treatment of Inspectionof the Capital Ratio Calculation Framework Based on Agreed-Upon Procedures” (JICPA Industry Committee Practical Guideline No. 30).The certain procedures performed by the external auditor are not part of the audit of consolidated financial statements. The certain proceduresperformed on our internal control framework for calculating the capital ratio are based on procedures agreed upon by SMFG and the externalauditor and are not a validation of appropriateness of the capital ratio itself or opinion on the internal controls related to the capital ratiocalculation.
Capital Ratio Information (Consolidated)Sumitomo Mitsui Financial Group, Inc. and Subsidiaries
012_0800885852907.indd 211 2017/08/10 20:49:15
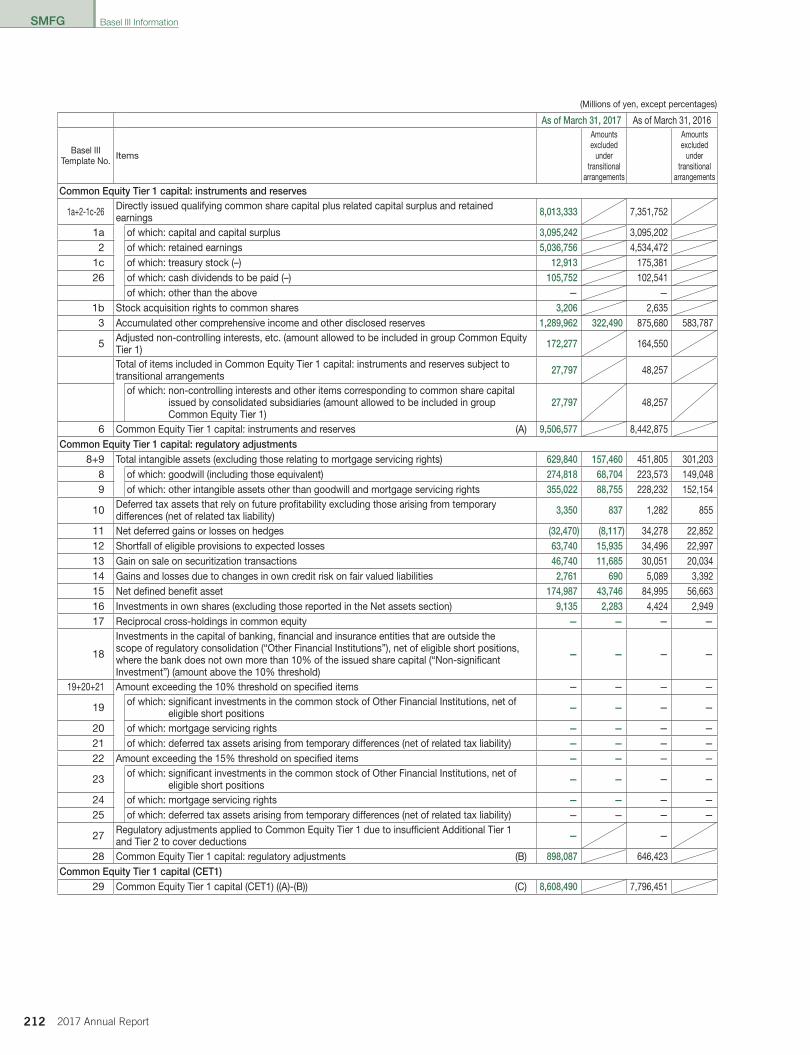
SMFG
212 2017 Annual Report
(Millions of yen, except percentages)
As of March 31, 2017 As of March 31, 2016
Basel IIITemplate No. Items
Amounts excluded
under transitional
arrangements
Amounts excluded
under transitional
arrangements
Common Equity Tier 1 capital: instruments and reserves
1a+2-1c-26 Directly issued qualifying common share capital plus related capital surplus and retainedearnings 8,013,333 7,351,752
1a of which: capital and capital surplus 3,095,242 3,095,2022 of which: retained earnings 5,036,756 4,534,472
1c of which: treasury stock (–) 12,913 175,38126 of which: cash dividends to be paid (–) 105,752 102,541
of which: other than the above — —1b Stock acquisition rights to common shares 3,206 2,635
3 Accumulated other comprehensive income and other disclosed reserves 1,289,962 322,490 875,680 583,787
5 Adjusted non-controlling interests, etc. (amount allowed to be included in group Common Equity Tier 1) 172,277 164,550
Total of items included in Common Equity Tier 1 capital: instruments and reserves subject totransitional arrangements 27,797 48,257
of which: non-controlling interests and other items corresponding to common share capital issued by consolidated subsidiaries (amount allowed to be included in group Common Equity Tier 1)
27,797 48,257
6 Common Equity Tier 1 capital: instruments and reserves (A) 9,506,577 8,442,875Common Equity Tier 1 capital: regulatory adjustments
8+9 Total intangible assets (excluding those relating to mortgage servicing rights) 629,840 157,460 451,805 301,2038 of which: goodwill (including those equivalent) 274,818 68,704 223,573 149,0489 of which: other intangible assets other than goodwill and mortgage servicing rights 355,022 88,755 228,232 152,154
10 Deferred tax assets that rely on future profitability excluding those arising from temporarydifferences (net of related tax liability) 3,350 837 1,282 855
11 Net deferred gains or losses on hedges (32,470) (8,117) 34,278 22,85212 Shortfall of eligible provisions to expected losses 63,740 15,935 34,496 22,99713 Gain on sale on securitization transactions 46,740 11,685 30,051 20,03414 Gains and losses due to changes in own credit risk on fair valued liabilities 2,761 690 5,089 3,39215 Net defined benefit asset 174,987 43,746 84,995 56,66316 Investments in own shares (excluding those reported in the Net assets section) 9,135 2,283 4,424 2,94917 Reciprocal cross-holdings in common equity — — — —
18
Investments in the capital of banking, financial and insurance entities that are outside thescope of regulatory consolidation (“Other Financial Institutions”), net of eligible short positions,where the bank does not own more than 10% of the issued share capital (“Non-significantInvestment”) (amount above the 10% threshold)
— — — —
19+20+21 Amount exceeding the 10% threshold on specified items — — — —
19 of which: significant investments in the common stock of Other Financial Institutions, net of eligible short positions — — — —
20 of which: mortgage servicing rights — — — —21 of which: deferred tax assets arising from temporary differences (net of related tax liability) — — — —22 Amount exceeding the 15% threshold on specified items — — — —
23 of which: significant investments in the common stock of Other Financial Institutions, net of eligible short positions — — — —
24 of which: mortgage servicing rights — — — —25 of which: deferred tax assets arising from temporary differences (net of related tax liability) — — — —
27 Regulatory adjustments applied to Common Equity Tier 1 due to insufficient Additional Tier 1and Tier 2 to cover deductions — —
28 Common Equity Tier 1 capital: regulatory adjustments (B) 898,087 646,423Common Equity Tier 1 capital (CET1)
29 Common Equity Tier 1 capital (CET1) ((A)-(B)) (C) 8,608,490 7,796,451
Basel III Information
012_0800885852907.indd 212 2017/08/10 20:49:15

SMFG
2132017 Annual Report
(Millions of yen, except percentages)
As of March 31, 2017 As of March 31, 2016
Basel IIITemplate No. Items
Amounts excluded
under transitional
arrangements
Amounts excluded
under transitional
arrangements
Additional Tier 1 capital: instruments
30
31a Directly issued qualifying Additional Tier 1 instruments plus related capital surplus of which:classified as equity under applicable accounting standards and the breakdown — —
31b Stock acquisition rights to Additional Tier 1 instruments — —
32 Directly issued qualifying Additional Tier 1 instruments plus related capital surplus of which:classified as liabilities under applicable accounting standards 449,897 300,000
Qualifying Additional Tier 1 instruments plus related capital surplus issued by special purposevehicles and other equivalent entities — —
34-35 Adjusted non-controlling interests, etc. (amount allowed to be included in group Additional Tier 1) 234,697 183,267
33+35 Eligible Tier 1 capital instruments subject to transitional arrangements included in AdditionalTier 1 capital: instruments 812,928 961,997
33 of which: instruments issued by bank holding companies and their special purpose vehicles 812,928 961,997
35 of which: instruments issued by subsidiaries (excluding bank holding companies’ special purpose vehicles) — —
Total of items included in Additional Tier 1 capital: items subject to transitional arrangements 13,015 34,817of which: foreign currency translation adjustments 13,015 34,817
36 Additional Tier 1 capital: instruments (D) 1,510,539 1,480,082Additional Tier 1 capital: regulatory adjustments
37 Investments in own Additional Tier 1 instruments — — — —38 Reciprocal cross-holdings in Additional Tier 1 instruments — — — —
39 Non-significant Investments in the Additional Tier 1 capital of Other Financial Institutions, net ofeligible short positions (amount above 10% threshold) — — — —
40 Significant investments in the Additional Tier 1 capital of Other Financial Institutions (net ofeligible short positions) 64,035 16,008 48,032 32,021
Total of items included in Additional Tier 1 capital: regulatory adjustments subject to transitionalarrangements 108,814 196,827
of which: goodwill and others 89,162 165,294of which: gain on sale on securitization transactions 11,685 20,034of which: amount equivalent to 50% of shortfall of eligible provisions to expected losses 7,967 11,498
42 Regulatory adjustments applied to Additional Tier 1 due to insufficient Tier 2 to coverdeductions — —
43 Additional Tier 1 capital: regulatory adjustments (E) 172,850 244,860Additional Tier 1 capital (AT1)
44 Additional Tier 1 capital ((D)-(E)) (F) 1,337,689 1,235,221Tier 1 capital (T1 = CET1 + AT1)
45 Tier 1 capital (T1 = CET1 + AT1) ((C)+(F)) (G) 9,946,179 9,031,672Tier 2 capital: instruments and provisions
46
Directly issued qualifying Tier 2 instruments plus related capital surplus of which: classified asequity under applicable accounting standards and its breakdown — —
Stock acquisition rights to Tier 2 instruments — —Directly issued qualifying Tier 2 instruments plus related capital surplus of which: classified asliabilities under applicable accounting standards 898,911 655,064
Qualifying Tier 2 instruments plus related capital surplus issued by special purpose vehiclesand other equivalent entities — —
48-49 Adjusted non-controlling interests, etc. (amount allowed to be included in group Tier 2) 54,539 42,036
47+49 Eligible Tier 2 capital instruments subject to transitional arrangements included in Tier 2:instruments and provisions 873,116 1,220,569
47 of which: instruments issued by bank holding companies and their special purpose vehicles — —
49 of which: instruments issued by subsidiaries (excluding bank holding companies’ special purpose vehicles) 873,116 1,220,569
50 Total of general reserve for possible loan losses and eligible provisions included in Tier 2 74,104 78,01750a of which: general reserve for possible loan losses 74,104 78,01750b of which: eligible provisions — —
Total of items included in Tier 2 capital: instruments and provisions subject to transitionalarrangements 197,384 345,673
of which: unrealized gains on other securities after 55% discount 191,125 332,809of which: land revaluation excess after 55% discount 6,259 12,863
51 Tier 2 capital: instruments and provisions (H) 2,098,057 2,341,360
Basel III Information
012_0800885852907.indd 213 2017/08/10 20:49:15

SMFG
214 2017 Annual Report
(Millions of yen, except percentages)
As of March 31, 2017 As of March 31, 2016
Basel IIITemplate No. Items
Amounts excluded
under transitional
arrangements
Amounts excluded
under transitional
arrangements
Tier 2 capital: regulatory adjustments52 Investments in own Tier 2 instruments — — — —53 Reciprocal cross-holdings in Tier 2 instruments — — — —
54 Non-significant Investments in the Tier 2 capital of Other Financial Institutions, net of eligibleshort positions (amount above the 10% threshold) — — — —
55 Significant investments in the Tier 2 capital of Other Financial Institutions (net of eligible shortpositions) 40,000 10,000 75,000 50,000
Total of items included in Tier 2 capital: regulatory adjustments subject to transitionalarrangements 30,569 62,109
of which: Tier 2 and deductions under Basel II 30,569 62,10957 Tier 2 capital: regulatory adjustments (I) 70,569 137,109
Tier 2 capital (T2)58 Tier 2 capital (T2) ((H)-(I)) (J) 2,027,488 2,204,250
Total capital (TC = T1 + T2)59 Total capital (TC = T1 + T2) ((G) + (J)) (K) 11,973,667 11,235,923
Risk weighted assetsTotal of items included in risk weighted assets subject to transitional arrangements 38,835 68,865
of which: intangible assets (excluding those relating to mortgage servicing rights) 16,711 31,824of which: net defined benefit asset 12,010 16,093of which: significant investments in Tier 2 capital of Other Financial Institutions
(net of eligible short positions) 7,709 16,156
60 Risk weighted assets (L) 70,683,540 66,011,621Capital ratio (consolidated)
61 Common Equity Tier 1 risk-weighted capital ratio (consolidated) ((C)/(L)) 12.17% 11.81%62 Tier 1 risk-weighted capital ratio (consolidated) ((G)/(L)) 14.07% 13.68%63 Total risk-weighted capital ratio (consolidated) ((K)/(L)) 16.93% 17.02%
Regulatory adjustments
72 Non-significant Investments in the capital of Other Financial Institutions that are below thethresholds for deduction (before risk weighting) 729,452 620,209
73 Significant investments in the common stock of Other Financial Institutions that are below thethresholds for deduction (before risk weighting) 542,985 522,466
74 Mortgage servicing rights that are below the thresholds for deduction (before risk weighting) — —
75Deferred tax assets arising from temporary differences that are below the thresholds fordeduction (before risk weighting)
24,339 9,700
Provisions included in Tier 2 capital: instruments and provisions76 Provisions (general reserve for possible loan losses) 74,104 78,01777 Cap on inclusion of provisions (general reserve for possible loan losses) 84,683 88,359
78 Provisions eligible for inclusion in Tier 2 in respect of exposures subject to internalratings-based approach (prior to application of cap) — —
79 Cap for inclusion of provisions in Tier 2 under internal ratings-based approach 331,220 309,031Capital instruments subject to transitional arrangements
82 Current cap on Additional Tier 1 instruments subject to transitional arrangements 812,928 975,514
83 Amount excluded from Additional Tier 1 due to cap (excess over cap after redemptions andmaturities) 58,050 —
84 Current cap on Tier 2 instruments subject to transitional arrangements 1,017,141 1,220,56985 Amount excluded from Tier 2 due to cap (excess over cap after redemptions and maturities) — 30,203
(Millions of yen)
Items As of March 31, 2017 As of March 31, 2016Required capital ((L) ✕ 8%) 5,654,683 5,280,929
Basel III Information
012_0800885852907.indd 214 2017/08/10 20:49:15
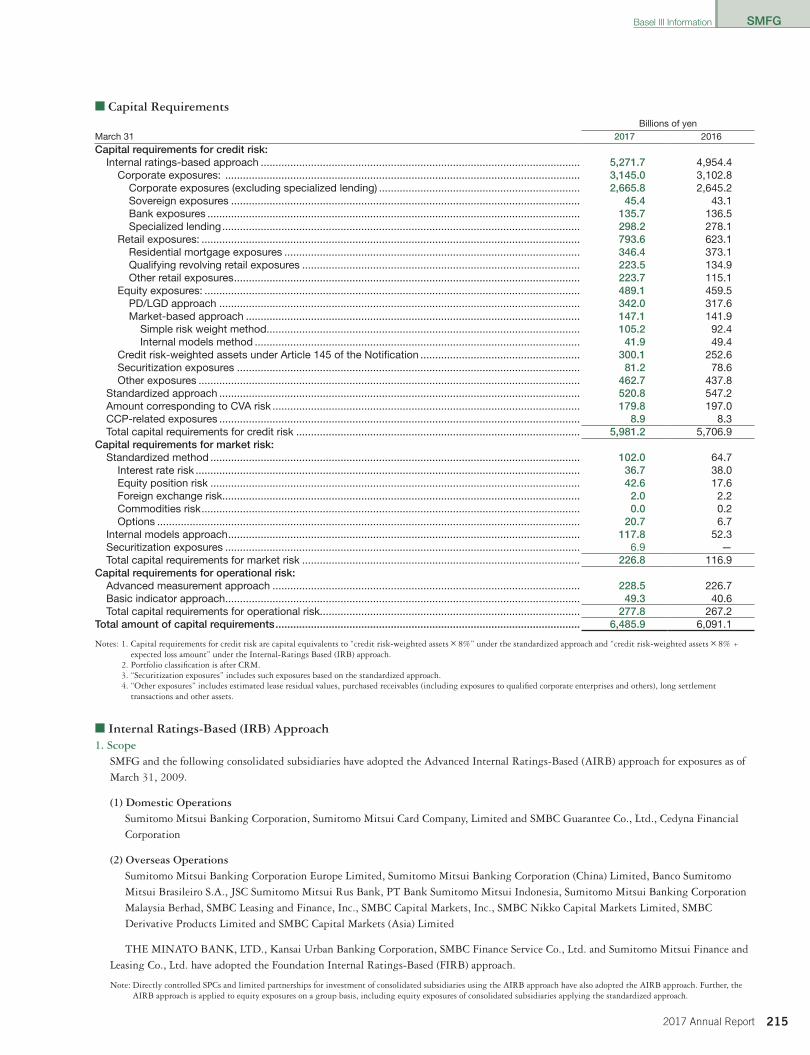
SMFG
2152017 Annual Report
■ Capital RequirementsBillions of yen
March 31 2017 2016Capital requirements for credit risk:
Internal ratings-based approach ............................................................................................................ 5,271.7 4,954.4 Corporate exposures: ........................................................................................................................ 3,145.0 3,102.8
Corporate exposures (excluding specialized lending) .................................................................... 2,665.8 2,645.2 Sovereign exposures ...................................................................................................................... 45.4 43.1 Bank exposures .............................................................................................................................. 135.7 136.5 Specialized lending ......................................................................................................................... 298.2 278.1
Retail exposures: ................................................................................................................................ 793.6 623.1 Residential mortgage exposures .................................................................................................... 346.4 373.1 Qualifying revolving retail exposures .............................................................................................. 223.5 134.9 Other retail exposures ..................................................................................................................... 223.7 115.1
Equity exposures: ............................................................................................................................... 489.1 459.5 PD/LGD approach .......................................................................................................................... 342.0 317.6 Market-based approach ................................................................................................................. 147.1 141.9
Simple risk weight method.......................................................................................................... 105.2 92.4 Internal models method .............................................................................................................. 41.9 49.4
Credit risk-weighted assets under Article 145 of the Notification ...................................................... 300.1 252.6 Securitization exposures .................................................................................................................... 81.2 78.6 Other exposures ................................................................................................................................. 462.7 437.8
Standardized approach .......................................................................................................................... 520.8 547.2 Amount corresponding to CVA risk ........................................................................................................ 179.8 197.0 CCP-related exposures .......................................................................................................................... 8.9 8.3 Total capital requirements for credit risk ................................................................................................ 5,981.2 5,706.9
Capital requirements for market risk:Standardized method ............................................................................................................................. 102.0 64.7
Interest rate risk .................................................................................................................................. 36.7 38.0 Equity position risk ............................................................................................................................. 42.6 17.6 Foreign exchange risk......................................................................................................................... 2.0 2.2 Commodities risk ................................................................................................................................ 0.0 0.2 Options ............................................................................................................................................... 20.7 6.7
Internal models approach ....................................................................................................................... 117.8 52.3 Securitization exposures ........................................................................................................................ 6.9 —Total capital requirements for market risk .............................................................................................. 226.8 116.9
Capital requirements for operational risk:Advanced measurement approach ........................................................................................................ 228.5 226.7 Basic indicator approach ........................................................................................................................ 49.3 40.6 Total capital requirements for operational risk........................................................................................ 277.8 267.2
Total amount of capital requirements ....................................................................................................... 6,485.9 6,091.1
Notes: 1. Capital requirements for credit risk are capital equivalents to “credit risk-weighted assets ✕ 8%” under the standardized approach and “credit risk-weighted assets ✕ 8% +expected loss amount” under the Internal-Ratings Based (IRB) approach.
2. Portfolio classification is after CRM.3. “Securitization exposures” includes such exposures based on the standardized approach.4. “Other exposures” includes estimated lease residual values, purchased receivables (including exposures to qualified corporate enterprises and others), long settlement
transactions and other assets.
■ Internal Ratings-Based (IRB) Approach1. Scope
SMFG and the following consolidated subsidiaries have adopted the Advanced Internal Ratings-Based (AIRB) approach for exposures as of March 31, 2009.
(1) Domestic OperationsSumitomo Mitsui Banking Corporation, Sumitomo Mitsui Card Company, Limited and SMBC Guarantee Co., Ltd., Cedyna Financial Corporation
(2) Overseas OperationsSumitomo Mitsui Banking Corporation Europe Limited, Sumitomo Mitsui Banking Corporation (China) Limited, Banco Sumitomo Mitsui Brasileiro S.A., JSC Sumitomo Mitsui Rus Bank, PT Bank Sumitomo Mitsui Indonesia, Sumitomo Mitsui Banking Corporation Malaysia Berhad, SMBC Leasing and Finance, Inc., SMBC Capital Markets, Inc., SMBC Nikko Capital Markets Limited, SMBC Derivative Products Limited and SMBC Capital Markets (Asia) Limited
THE MINATO BANK, LTD., Kansai Urban Banking Corporation, SMBC Finance Service Co., Ltd. and Sumitomo Mitsui Finance and Leasing Co., Ltd. have adopted the Foundation Internal Ratings-Based (FIRB) approach.
Note: Directly controlled SPCs and limited partnerships for investment of consolidated subsidiaries using the AIRB approach have also adopted the AIRB approach. Further, theAIRB approach is applied to equity exposures on a group basis, including equity exposures of consolidated subsidiaries applying the standardized approach.
Basel III Information
012_0800885852907.indd 215 2017/08/10 20:49:15
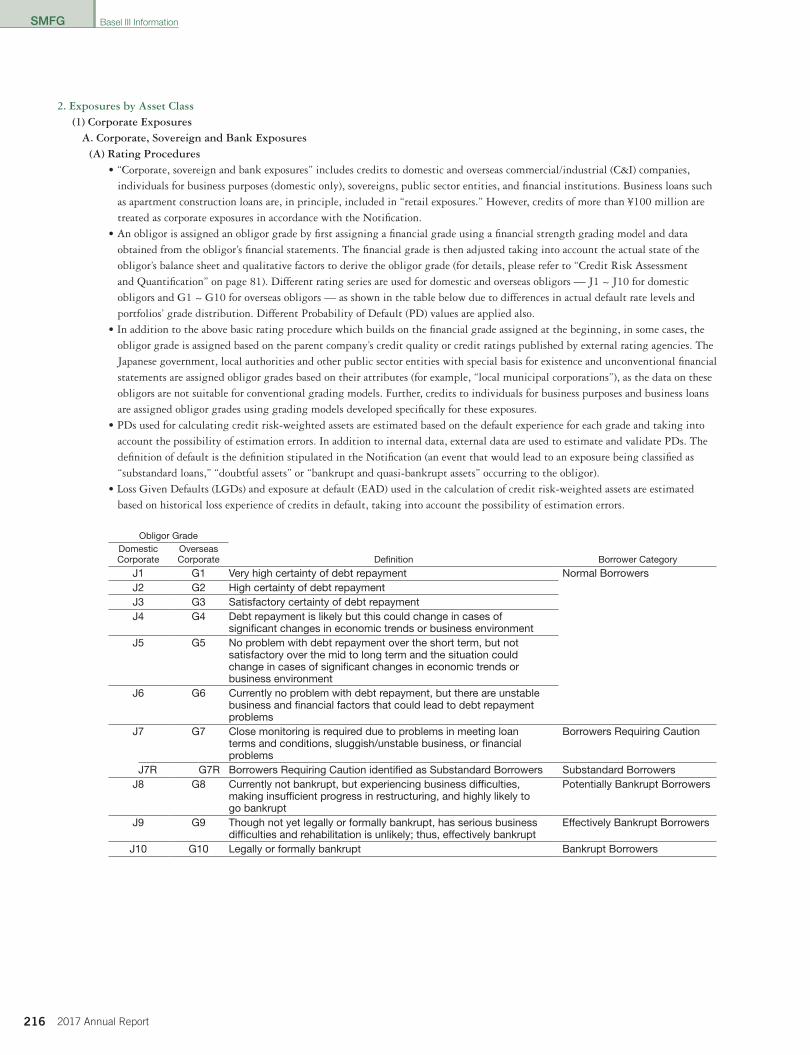
SMFG
216 2017 Annual Report
2. Exposures by Asset Class(1) Corporate Exposures
A. Corporate, Sovereign and Bank Exposures(A) Rating Procedures
• “Corporate, sovereign and bank exposures” includes credits to domestic and overseas commercial/industrial (C&I) companies, individuals for business purposes (domestic only), sovereigns, public sector entities, and financial institutions. Business loans such as apartment construction loans are, in principle, included in “retail exposures.” However, credits of more than ¥100 million are treated as corporate exposures in accordance with the Notification.
• An obligor is assigned an obligor grade by first assigning a financial grade using a financial strength grading model and data obtained from the obligor’s financial statements. The financial grade is then adjusted taking into account the actual state of the obligor’s balance sheet and qualitative factors to derive the obligor grade (for details, please refer to “Credit Risk Assessment and Quantification” on page 81). Different rating series are used for domestic and overseas obligors — J1 ~ J10 for domestic obligors and G1 ~ G10 for overseas obligors — as shown in the table below due to differences in actual default rate levels and portfolios’ grade distribution. Different Probability of Default (PD) values are applied also.
• In addition to the above basic rating procedure which builds on the financial grade assigned at the beginning, in some cases, the obligor grade is assigned based on the parent company’s credit quality or credit ratings published by external rating agencies. The Japanese government, local authorities and other public sector entities with special basis for existence and unconventional financial statements are assigned obligor grades based on their attributes (for example, “local municipal corporations”), as the data on these obligors are not suitable for conventional grading models. Further, credits to individuals for business purposes and business loans are assigned obligor grades using grading models developed specifically for these exposures.
• PDs used for calculating credit risk-weighted assets are estimated based on the default experience for each grade and taking into account the possibility of estimation errors. In addition to internal data, external data are used to estimate and validate PDs. The definition of default is the definition stipulated in the Notification (an event that would lead to an exposure being classified as “substandard loans,” “doubtful assets” or “bankrupt and quasi-bankrupt assets” occurring to the obligor).
• Loss Given Defaults (LGDs) and exposure at default (EAD) used in the calculation of credit risk-weighted assets are estimated based on historical loss experience of credits in default, taking into account the possibility of estimation errors.
Obligor GradeDomesticCorporate
OverseasCorporate Definition Borrower Category
J1 G1 Very high certainty of debt repayment Normal BorrowersJ2 G2 High certainty of debt repaymentJ3 G3 Satisfactory certainty of debt repaymentJ4 G4 Debt repayment is likely but this could change in cases of
significant changes in economic trends or business environmentJ5 G5 No problem with debt repayment over the short term, but not
satisfactory over the mid to long term and the situation couldchange in cases of significant changes in economic trends orbusiness environment
J6 G6 Currently no problem with debt repayment, but there are unstablebusiness and financial factors that could lead to debt repaymentproblems
J7 G7 Close monitoring is required due to problems in meeting loanterms and conditions, sluggish/unstable business, or financialproblems
Borrowers Requiring Caution
J7R G7R Borrowers Requiring Caution identified as Substandard Borrowers Substandard BorrowersJ8 G8 Currently not bankrupt, but experiencing business difficulties,
making insufficient progress in restructuring, and highly likely togo bankrupt
Potentially Bankrupt Borrowers
J9 G9 Though not yet legally or formally bankrupt, has serious businessdifficulties and rehabilitation is unlikely; thus, effectively bankrupt
Effectively Bankrupt Borrowers
J10 G10 Legally or formally bankrupt Bankrupt Borrowers
Basel III Information
012_0800885852907.indd 216 2017/08/10 20:49:15
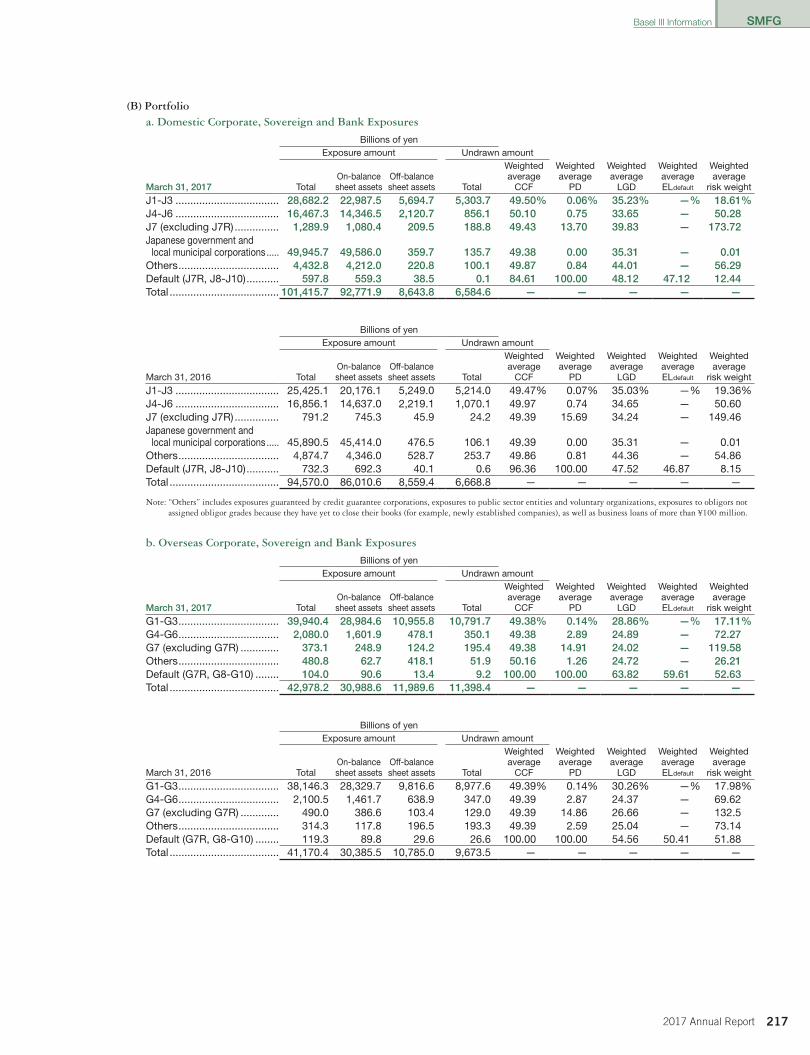
SMFG
2172017 Annual Report
(B) Portfolioa. Domestic Corporate, Sovereign and Bank Exposures
Billions of yenExposure amount Undrawn amount
March 31, 2017 TotalOn-balancesheet assets
Off-balancesheet assets Total
Weightedaverage
CCF
Weightedaverage
PD
Weightedaverage
LGD
WeightedaverageEL default
Weightedaverage
risk weight
J1-J3 ................................... 28,682.2 22,987.5 5,694.7 5,303.7 49.50% 0.06% 35.23% —% 18.61%J4-J6 ................................... 16,467.3 14,346.5 2,120.7 856.1 50.10 0.75 33.65 — 50.28J7 (excluding J7R) ............... 1,289.9 1,080.4 209.5 188.8 49.43 13.70 39.83 — 173.72Japanese government and
local municipal corporations ..... 49,945.7 49,586.0 359.7 135.7 49.38 0.00 35.31 — 0.01Others .................................. 4,432.8 4,212.0 220.8 100.1 49.87 0.84 44.01 — 56.29Default (J7R, J8-J10) ........... 597.8 559.3 38.5 0.1 84.61 100.00 48.12 47.12 12.44Total ..................................... 101,415.7 92,771.9 8,643.8 6,584.6 — — — — —
Billions of yenExposure amount Undrawn amount
March 31, 2016 TotalOn-balancesheet assets
Off-balancesheet assets Total
Weightedaverage
CCF
Weightedaverage
PD
Weightedaverage
LGD
WeightedaverageEL default
Weightedaverage
risk weight
J1-J3 ................................... 25,425.1 20,176.1 5,249.0 5,214.0 49.47% 0.07% 35.03% —% 19.36%J4-J6 ................................... 16,856.1 14,637.0 2,219.1 1,070.1 49.97 0.74 34.65 — 50.60J7 (excluding J7R) ............... 791.2 745.3 45.9 24.2 49.39 15.69 34.24 — 149.46Japanese government and
local municipal corporations ..... 45,890.5 45,414.0 476.5 106.1 49.39 0.00 35.31 — 0.01Others .................................. 4,874.7 4,346.0 528.7 253.7 49.86 0.81 44.36 — 54.86Default (J7R, J8-J10) ........... 732.3 692.3 40.1 0.6 96.36 100.00 47.52 46.87 8.15Total ..................................... 94,570.0 86,010.6 8,559.4 6,668.8 — — — — —
Note: “Others” includes exposures guaranteed by credit guarantee corporations, exposures to public sector entities and voluntary organizations, exposures to obligors not assigned obligor grades because they have yet to close their books (for example, newly established companies), as well as business loans of more than ¥100 million.
b. Overseas Corporate, Sovereign and Bank Exposures
Billions of yenExposure amount Undrawn amount
March 31, 2017 TotalOn-balancesheet assets
Off-balancesheet assets Total
Weightedaverage
CCF
Weightedaverage
PD
Weightedaverage
LGD
WeightedaverageEL default
Weightedaverage
risk weight
G1-G3 .................................. 39,940.4 28,984.6 10,955.8 10,791.7 49.38% 0.14% 28.86% —% 17.11%G4-G6 .................................. 2,080.0 1,601.9 478.1 350.1 49.38 2.89 24.89 — 72.27G7 (excluding G7R) ............. 373.1 248.9 124.2 195.4 49.38 14.91 24.02 — 119.58Others .................................. 480.8 62.7 418.1 51.9 50.16 1.26 24.72 — 26.21Default (G7R, G8-G10) ........ 104.0 90.6 13.4 9.2 100.00 100.00 63.82 59.61 52.63Total ..................................... 42,978.2 30,988.6 11,989.6 11,398.4 — — — — —
Billions of yenExposure amount Undrawn amount
March 31, 2016 TotalOn-balancesheet assets
Off-balancesheet assets Total
Weightedaverage
CCF
Weightedaverage
PD
Weightedaverage
LGD
WeightedaverageEL default
Weightedaverage
risk weight
G1-G3 .................................. 38,146.3 28,329.7 9,816.6 8,977.6 49.39% 0.14% 30.26% —% 17.98%G4-G6 .................................. 2,100.5 1,461.7 638.9 347.0 49.39 2.87 24.37 — 69.62G7 (excluding G7R) ............. 490.0 386.6 103.4 129.0 49.39 14.86 26.66 — 132.5Others .................................. 314.3 117.8 196.5 193.3 49.39 2.59 25.04 — 73.14Default (G7R, G8-G10) ........ 119.3 89.8 29.6 26.6 100.00 100.00 54.56 50.41 51.88Total ..................................... 41,170.4 30,385.5 10,785.0 9,673.5 — — — — —
Basel III Information
012_0800885852907.indd 217 2017/08/10 20:49:15
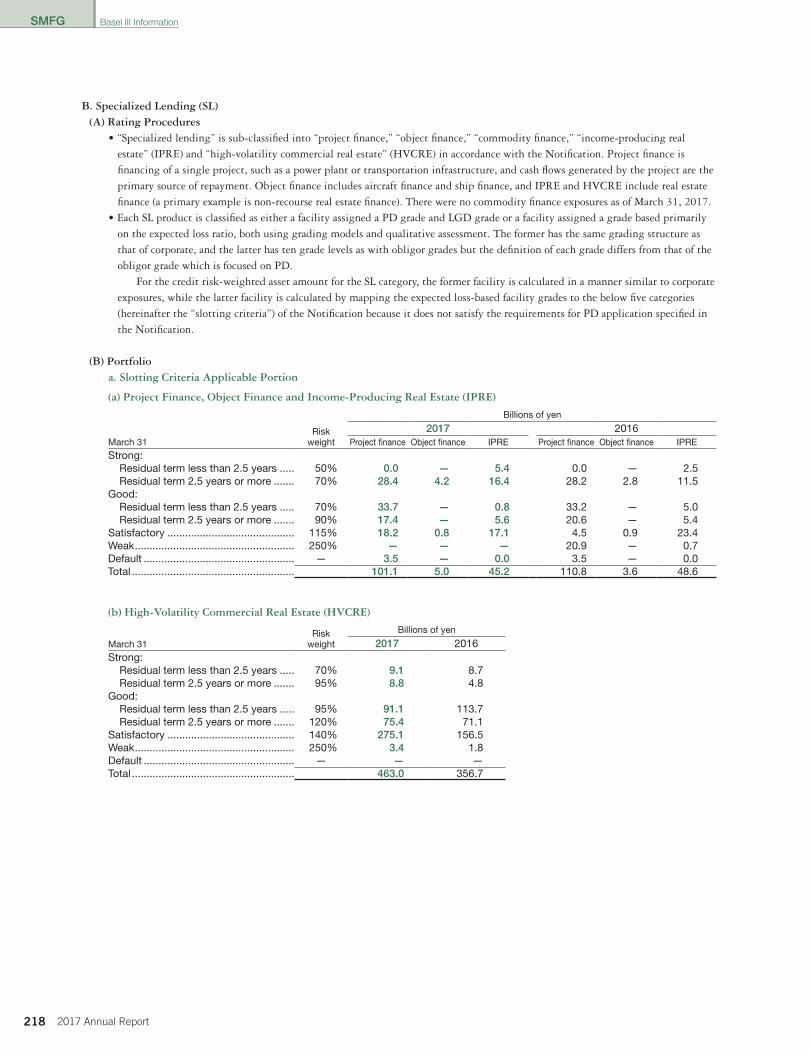
SMFG
218 2017 Annual Report
B. Specialized Lending (SL)(A) Rating Procedures
• “Specialized lending” is sub-classified into “project finance,” “object finance,” “commodity finance,” “income-producing real estate” (IPRE) and “high-volatility commercial real estate” (HVCRE) in accordance with the Notification. Project finance is financing of a single project, such as a power plant or transportation infrastructure, and cash flows generated by the project are the primary source of repayment. Object finance includes aircraft finance and ship finance, and IPRE and HVCRE include real estate finance (a primary example is non-recourse real estate finance). There were no commodity finance exposures as of March 31, 2017.
• Each SL product is classified as either a facility assigned a PD grade and LGD grade or a facility assigned a grade based primarily on the expected loss ratio, both using grading models and qualitative assessment. The former has the same grading structure as that of corporate, and the latter has ten grade levels as with obligor grades but the definition of each grade differs from that of the obligor grade which is focused on PD.
For the credit risk-weighted asset amount for the SL category, the former facility is calculated in a manner similar to corporate exposures, while the latter facility is calculated by mapping the expected loss-based facility grades to the below five categories (hereinafter the “slotting criteria”) of the Notification because it does not satisfy the requirements for PD application specified in the Notification.
(B) Portfolioa. Slotting Criteria Applicable Portion
(a) Project Finance, Object Finance and Income-Producing Real Estate (IPRE)
Billions of yen
Riskweight
2017 2016March 31 Project finance Object finance IPRE Project finance Object finance IPRE
Strong:Residual term less than 2.5 years ..... 50% 0.0 — 5.4 0.0 — 2.5Residual term 2.5 years or more ....... 70% 28.4 4.2 16.4 28.2 2.8 11.5
Good:Residual term less than 2.5 years ..... 70% 33.7 — 0.8 33.2 — 5.0Residual term 2.5 years or more ....... 90% 17.4 — 5.6 20.6 — 5.4
Satisfactory ........................................... 115% 18.2 0.8 17.1 4.5 0.9 23.4Weak ...................................................... 250% — — — 20.9 — 0.7Default ................................................... — 3.5 — 0.0 3.5 — 0.0Total ....................................................... 101.1 5.0 45.2 110.8 3.6 48.6
(b) High-Volatility Commercial Real Estate (HVCRE)
Riskweight
Billions of yen
March 31 2017 2016Strong:
Residual term less than 2.5 years ..... 70% 9.1 8.7Residual term 2.5 years or more ....... 95% 8.8 4.8
Good:Residual term less than 2.5 years ..... 95% 91.1 113.7Residual term 2.5 years or more ....... 120% 75.4 71.1
Satisfactory ........................................... 140% 275.1 156.5Weak ...................................................... 250% 3.4 1.8Default ................................................... — — —Total ....................................................... 463.0 356.7
Basel III Information
012_0800885852907.indd 218 2017/08/10 20:49:16
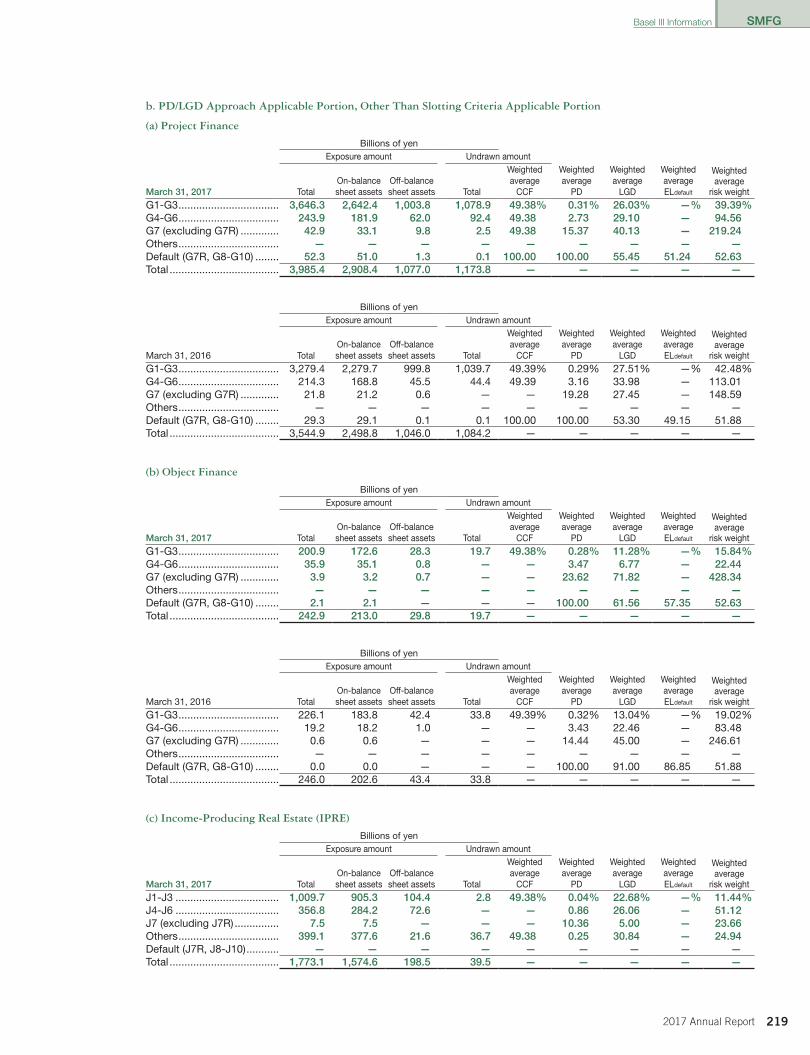
SMFG
2192017 Annual Report
b. PD/LGD Approach Applicable Portion, Other Than Slotting Criteria Applicable Portion
(a) Project Finance
Billions of yenExposure amount Undrawn amount
March 31, 2017 TotalOn-balancesheet assets
Off-balancesheet assets Total
Weightedaverage
CCF
Weightedaverage
PD
Weightedaverage
LGD
WeightedaverageEL default
Weightedaverage
risk weight
G1-G3 .................................. 3,646.3 2,642.4 1,003.8 1,078.9 49.38% 0.31% 26.03% —% 39.39%G4-G6 .................................. 243.9 181.9 62.0 92.4 49.38 2.73 29.10 — 94.56G7 (excluding G7R) ............. 42.9 33.1 9.8 2.5 49.38 15.37 40.13 — 219.24Others .................................. — — — — — — — — —Default (G7R, G8-G10) ........ 52.3 51.0 1.3 0.1 100.00 100.00 55.45 51.24 52.63Total ..................................... 3,985.4 2,908.4 1,077.0 1,173.8 — — — — —
Billions of yenExposure amount Undrawn amount
March 31, 2016 TotalOn-balancesheet assets
Off-balancesheet assets Total
Weightedaverage
CCF
Weightedaverage
PD
Weightedaverage
LGD
WeightedaverageEL default
Weightedaverage
risk weight
G1-G3 .................................. 3,279.4 2,279.7 999.8 1,039.7 49.39% 0.29% 27.51% —% 42.48%G4-G6 .................................. 214.3 168.8 45.5 44.4 49.39 3.16 33.98 — 113.01G7 (excluding G7R) ............. 21.8 21.2 0.6 — — 19.28 27.45 — 148.59Others .................................. — — — — — — — — —Default (G7R, G8-G10) ........ 29.3 29.1 0.1 0.1 100.00 100.00 53.30 49.15 51.88Total ..................................... 3,544.9 2,498.8 1,046.0 1,084.2 — — — — —
(b) Object Finance
Billions of yenExposure amount Undrawn amount
March 31, 2017 TotalOn-balancesheet assets
Off-balancesheet assets Total
Weightedaverage
CCF
Weightedaverage
PD
Weightedaverage
LGD
WeightedaverageEL default
Weightedaverage
risk weight
G1-G3 .................................. 200.9 172.6 28.3 19.7 49.38% 0.28% 11.28% —% 15.84%G4-G6 .................................. 35.9 35.1 0.8 — — 3.47 6.77 — 22.44G7 (excluding G7R) ............. 3.9 3.2 0.7 — — 23.62 71.82 — 428.34Others .................................. — — — — — — — — —Default (G7R, G8-G10) ........ 2.1 2.1 — — — 100.00 61.56 57.35 52.63Total ..................................... 242.9 213.0 29.8 19.7 — — — — —
Billions of yenExposure amount Undrawn amount
March 31, 2016 TotalOn-balancesheet assets
Off-balancesheet assets Total
Weightedaverage
CCF
Weightedaverage
PD
Weightedaverage
LGD
WeightedaverageEL default
Weightedaverage
risk weight
G1-G3 .................................. 226.1 183.8 42.4 33.8 49.39% 0.32% 13.04% —% 19.02%G4-G6 .................................. 19.2 18.2 1.0 — — 3.43 22.46 — 83.48G7 (excluding G7R) ............. 0.6 0.6 — — — 14.44 45.00 — 246.61Others .................................. — — — — — — — — —Default (G7R, G8-G10) ........ 0.0 0.0 — — — 100.00 91.00 86.85 51.88Total ..................................... 246.0 202.6 43.4 33.8 — — — — —
(c) Income-Producing Real Estate (IPRE)
Billions of yenExposure amount Undrawn amount
March 31, 2017 TotalOn-balancesheet assets
Off-balancesheet assets Total
Weightedaverage
CCF
Weightedaverage
PD
Weightedaverage
LGD
WeightedaverageEL default
Weightedaverage
risk weight
J1-J3 ................................... 1,009.7 905.3 104.4 2.8 49.38% 0.04% 22.68% —% 11.44%J4-J6 ................................... 356.8 284.2 72.6 — — 0.86 26.06 — 51.12J7 (excluding J7R) ............... 7.5 7.5 — — — 10.36 5.00 — 23.66Others .................................. 399.1 377.6 21.6 36.7 49.38 0.25 30.84 — 24.94Default (J7R, J8-J10) ........... — — — — — — — — —Total ..................................... 1,773.1 1,574.6 198.5 39.5 — — — — —
Basel III Information
012_0800885852907.indd 219 2017/08/10 20:49:16
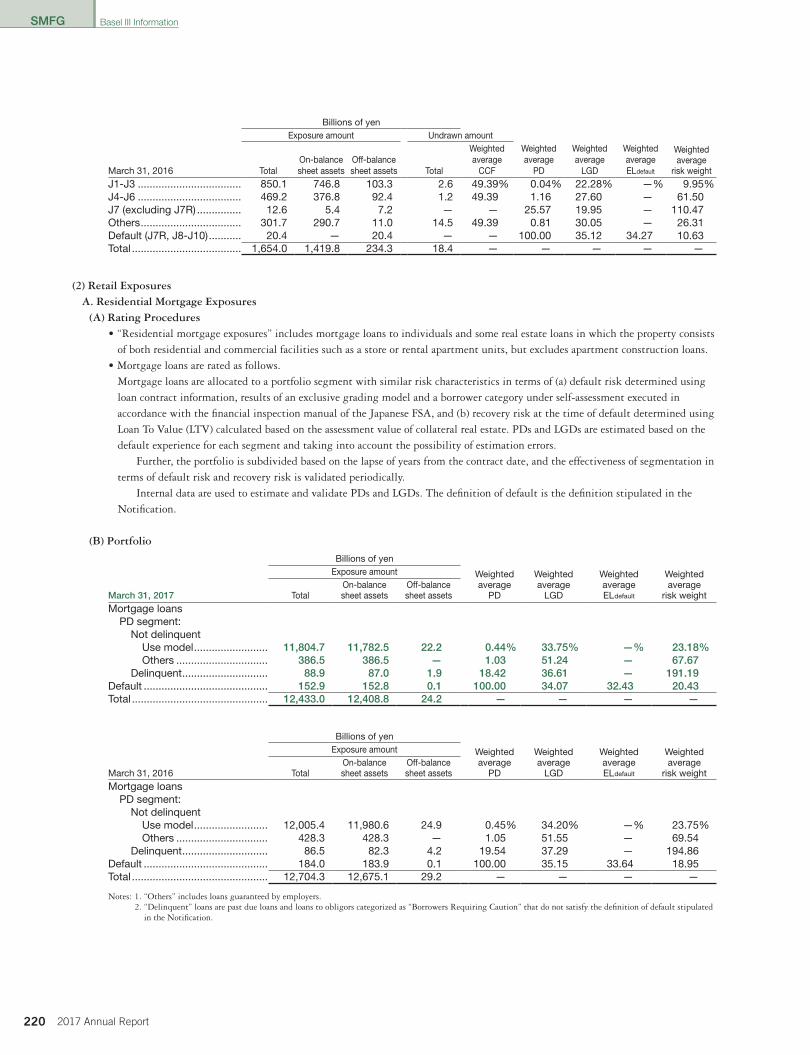
SMFG
220 2017 Annual Report
Billions of yenExposure amount Undrawn amount
March 31, 2016 TotalOn-balancesheet assets
Off-balancesheet assets Total
Weightedaverage
CCF
Weightedaverage
PD
Weightedaverage
LGD
WeightedaverageEL default
Weightedaverage
risk weight
J1-J3 ................................... 850.1 746.8 103.3 2.6 49.39% 0.04% 22.28% —% 9.95%J4-J6 ................................... 469.2 376.8 92.4 1.2 49.39 1.16 27.60 — 61.50J7 (excluding J7R) ............... 12.6 5.4 7.2 — — 25.57 19.95 — 110.47Others .................................. 301.7 290.7 11.0 14.5 49.39 0.81 30.05 — 26.31Default (J7R, J8-J10) ........... 20.4 — 20.4 — — 100.00 35.12 34.27 10.63Total ..................................... 1,654.0 1,419.8 234.3 18.4 — — — — —
(2) Retail ExposuresA. Residential Mortgage Exposures
(A) Rating Procedures• “Residential mortgage exposures” includes mortgage loans to individuals and some real estate loans in which the property consists
of both residential and commercial facilities such as a store or rental apartment units, but excludes apartment construction loans.• Mortgage loans are rated as follows. Mortgage loans are allocated to a portfolio segment with similar risk characteristics in terms of (a) default risk determined using
loan contract information, results of an exclusive grading model and a borrower category under self-assessment executed in accordance with the financial inspection manual of the Japanese FSA, and (b) recovery risk at the time of default determined using Loan To Value (LTV) calculated based on the assessment value of collateral real estate. PDs and LGDs are estimated based on the default experience for each segment and taking into account the possibility of estimation errors.
Further, the portfolio is subdivided based on the lapse of years from the contract date, and the effectiveness of segmentation in terms of default risk and recovery risk is validated periodically.
Internal data are used to estimate and validate PDs and LGDs. The definition of default is the definition stipulated in the Notification.
(B) Portfolio
Billions of yenExposure amount Weighted
averagePD
Weightedaverage
LGD
WeightedaverageEL default
Weightedaverage
risk weightMarch 31, 2017 TotalOn-balancesheet assets
Off-balancesheet assets
Mortgage loansPD segment:
Not delinquentUse model ......................... 11,804.7 11,782.5 22.2 0.44% 33.75% —% 23.18%Others ............................... 386.5 386.5 — 1.03 51.24 — 67.67
Delinquent ............................. 88.9 87.0 1.9 18.42 36.61 — 191.19Default .......................................... 152.9 152.8 0.1 100.00 34.07 32.43 20.43Total .............................................. 12,433.0 12,408.8 24.2 — — — —
Billions of yenExposure amount Weighted
averagePD
Weightedaverage
LGD
WeightedaverageEL default
Weightedaverage
risk weightMarch 31, 2016 TotalOn-balancesheet assets
Off-balancesheet assets
Mortgage loansPD segment:
Not delinquentUse model ......................... 12,005.4 11,980.6 24.9 0.45% 34.20% —% 23.75%Others ............................... 428.3 428.3 — 1.05 51.55 — 69.54
Delinquent ............................. 86.5 82.3 4.2 19.54 37.29 — 194.86Default .......................................... 184.0 183.9 0.1 100.00 35.15 33.64 18.95Total .............................................. 12,704.3 12,675.1 29.2 — — — —
Notes: 1. “Others” includes loans guaranteed by employers.2. “Delinquent” loans are past due loans and loans to obligors categorized as “Borrowers Requiring Caution” that do not satisfy the definition of default stipulated
in the Notification.
Basel III Information
012_0800885852907.indd 220 2017/08/10 20:49:16
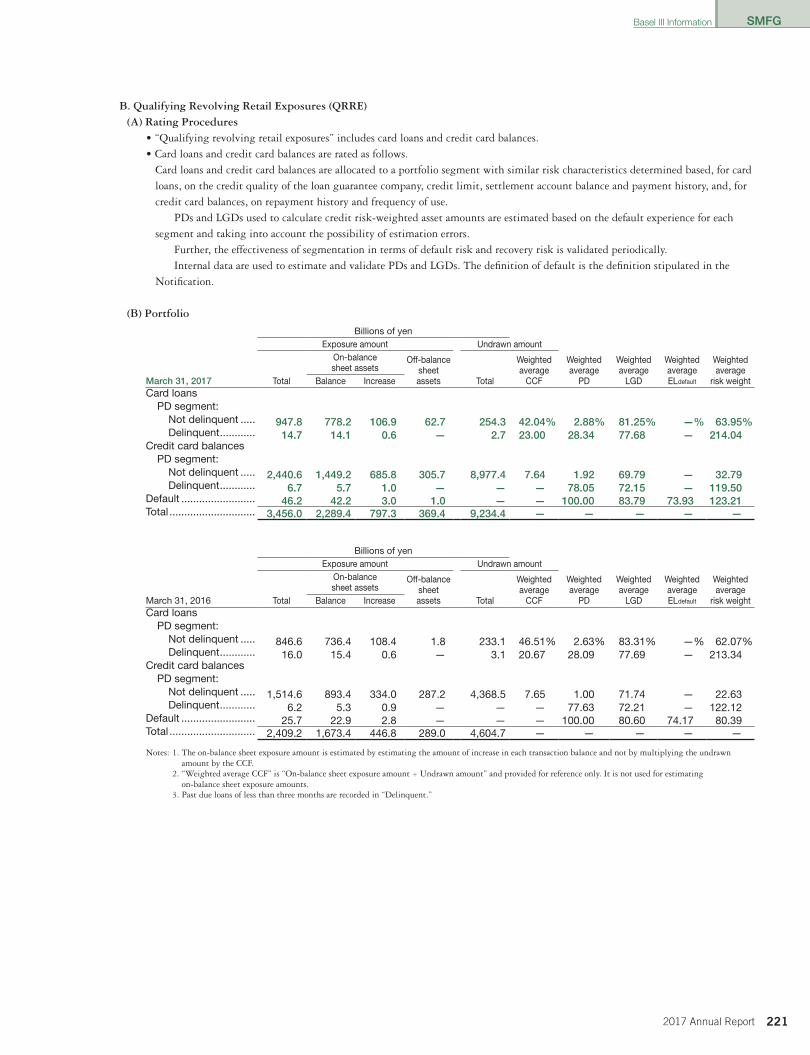
SMFG
2212017 Annual Report
B. Qualifying Revolving Retail Exposures (QRRE)(A) Rating Procedures
• “Qualifying revolving retail exposures” includes card loans and credit card balances.• Card loans and credit card balances are rated as follows. Card loans and credit card balances are allocated to a portfolio segment with similar risk characteristics determined based, for card
loans, on the credit quality of the loan guarantee company, credit limit, settlement account balance and payment history, and, for credit card balances, on repayment history and frequency of use.
PDs and LGDs used to calculate credit risk-weighted asset amounts are estimated based on the default experience for each segment and taking into account the possibility of estimation errors.
Further, the effectiveness of segmentation in terms of default risk and recovery risk is validated periodically. Internal data are used to estimate and validate PDs and LGDs. The definition of default is the definition stipulated in the
Notification.
(B) Portfolio
Billions of yenExposure amount Undrawn amount
Weightedaverage
PDTotal
On-balancesheet assets
Off-balancesheetassets Total
Weightedaverage
CCF
Weightedaverage
LGD
WeightedaverageEL default
Weightedaverage
risk weightMarch 31, 2017 Balance IncreaseCard loans
PD segment:Not delinquent ..... 947.8 778.2 106.9 62.7 254.3 42.04% 2.88% 81.25% —% 63.95%Delinquent ............ 14.7 14.1 0.6 — 2.7 23.00 28.34 77.68 — 214.04
Credit card balancesPD segment:
Not delinquent ..... 2,440.6 1,449.2 685.8 305.7 8,977.4 7.64 1.92 69.79 — 32.79Delinquent ............ 6.7 5.7 1.0 — — — 78.05 72.15 — 119.50
Default ......................... 46.2 42.2 3.0 1.0 — — 100.00 83.79 73.93 123.21Total ............................. 3,456.0 2,289.4 797.3 369.4 9,234.4 — — — — —
Billions of yenExposure amount Undrawn amount
Weightedaverage
PDTotal
On-balancesheet assets
Off-balancesheetassets Total
Weightedaverage
CCF
Weightedaverage
LGD
WeightedaverageEL default
Weightedaverage
risk weightMarch 31, 2016 Balance IncreaseCard loans
PD segment:Not delinquent ..... 846.6 736.4 108.4 1.8 233.1 46.51% 2.63% 83.31% —% 62.07%Delinquent ............ 16.0 15.4 0.6 — 3.1 20.67 28.09 77.69 — 213.34
Credit card balancesPD segment:
Not delinquent ..... 1,514.6 893.4 334.0 287.2 4,368.5 7.65 1.00 71.74 — 22.63Delinquent ............ 6.2 5.3 0.9 — — — 77.63 72.21 — 122.12
Default ......................... 25.7 22.9 2.8 — — — 100.00 80.60 74.17 80.39Total ............................. 2,409.2 1,673.4 446.8 289.0 4,604.7 — — — — —
Notes: 1. The on-balance sheet exposure amount is estimated by estimating the amount of increase in each transaction balance and not by multiplying the undrawnamount by the CCF.
2. “Weighted average CCF” is “On-balance sheet exposure amount ÷ Undrawn amount” and provided for reference only. It is not used for estimatingon-balance sheet exposure amounts.
3. Past due loans of less than three months are recorded in “Delinquent.”
Basel III Information
012_0800885852907.indd 221 2017/08/10 20:49:16
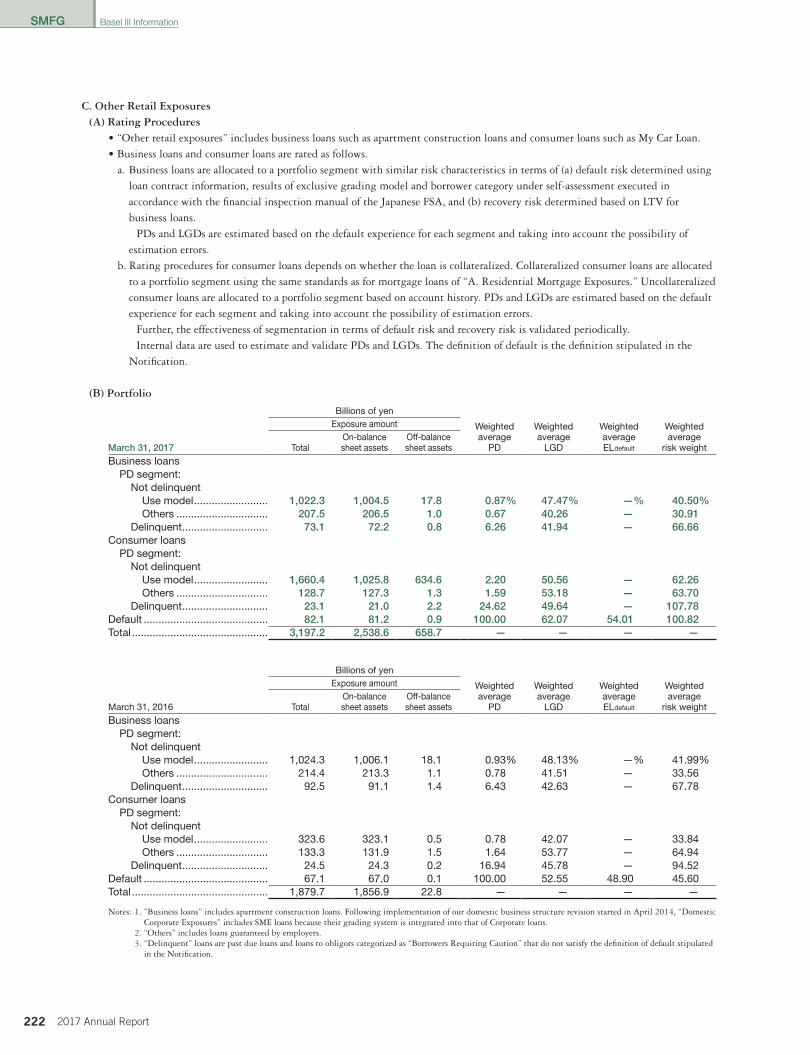
SMFG
222 2017 Annual Report
C. Other Retail Exposures(A) Rating Procedures
• “Other retail exposures” includes business loans such as apartment construction loans and consumer loans such as My Car Loan.• Business loans and consumer loans are rated as follows. a. Business loans are allocated to a portfolio segment with similar risk characteristics in terms of (a) default risk determined using
loan contract information, results of exclusive grading model and borrower category under self-assessment executed in accordance with the financial inspection manual of the Japanese FSA, and (b) recovery risk determined based on LTV for business loans.
PDs and LGDs are estimated based on the default experience for each segment and taking into account the possibility of estimation errors.
b. Rating procedures for consumer loans depends on whether the loan is collateralized. Collateralized consumer loans are allocated to a portfolio segment using the same standards as for mortgage loans of “A. Residential Mortgage Exposures.” Uncollateralized consumer loans are allocated to a portfolio segment based on account history. PDs and LGDs are estimated based on the default experience for each segment and taking into account the possibility of estimation errors.
Further, the effectiveness of segmentation in terms of default risk and recovery risk is validated periodically. Internal data are used to estimate and validate PDs and LGDs. The definition of default is the definition stipulated in the
Notification.
(B) Portfolio
Billions of yenExposure amount Weighted
averagePD
Weightedaverage
LGD
WeightedaverageEL default
Weightedaverage
risk weightMarch 31, 2017 TotalOn-balancesheet assets
Off-balancesheet assets
Business loansPD segment:
Not delinquentUse model ......................... 1,022.3 1,004.5 17.8 0.87% 47.47% —% 40.50%Others ............................... 207.5 206.5 1.0 0.67 40.26 — 30.91
Delinquent ............................. 73.1 72.2 0.8 6.26 41.94 — 66.66Consumer loans
PD segment:Not delinquent
Use model ......................... 1,660.4 1,025.8 634.6 2.20 50.56 — 62.26Others ............................... 128.7 127.3 1.3 1.59 53.18 — 63.70
Delinquent ............................. 23.1 21.0 2.2 24.62 49.64 — 107.78Default .......................................... 82.1 81.2 0.9 100.00 62.07 54.01 100.82Total .............................................. 3,197.2 2,538.6 658.7 — — — —
Billions of yenExposure amount Weighted
averagePD
Weightedaverage
LGD
WeightedaverageEL default
Weightedaverage
risk weightMarch 31, 2016 TotalOn-balancesheet assets
Off-balancesheet assets
Business loansPD segment:
Not delinquentUse model ......................... 1,024.3 1,006.1 18.1 0.93% 48.13% —% 41.99%Others ............................... 214.4 213.3 1.1 0.78 41.51 — 33.56
Delinquent ............................. 92.5 91.1 1.4 6.43 42.63 — 67.78Consumer loans
PD segment:Not delinquent
Use model ......................... 323.6 323.1 0.5 0.78 42.07 — 33.84Others ............................... 133.3 131.9 1.5 1.64 53.77 — 64.94
Delinquent ............................. 24.5 24.3 0.2 16.94 45.78 — 94.52Default .......................................... 67.1 67.0 0.1 100.00 52.55 48.90 45.60Total .............................................. 1,879.7 1,856.9 22.8 — — — —
Notes: 1. “Business loans” includes apartment construction loans. Following implementation of our domestic business structure revision started in April 2014, “Domestic Corporate Exposures” includes SME loans because their grading system is integrated into that of Corporate loans.
2. “Others” includes loans guaranteed by employers.3. “Delinquent” loans are past due loans and loans to obligors categorized as “Borrowers Requiring Caution” that do not satisfy the definition of default stipulated
in the Notification.
Basel III Information
012_0800885852907.indd 222 2017/08/10 20:49:16
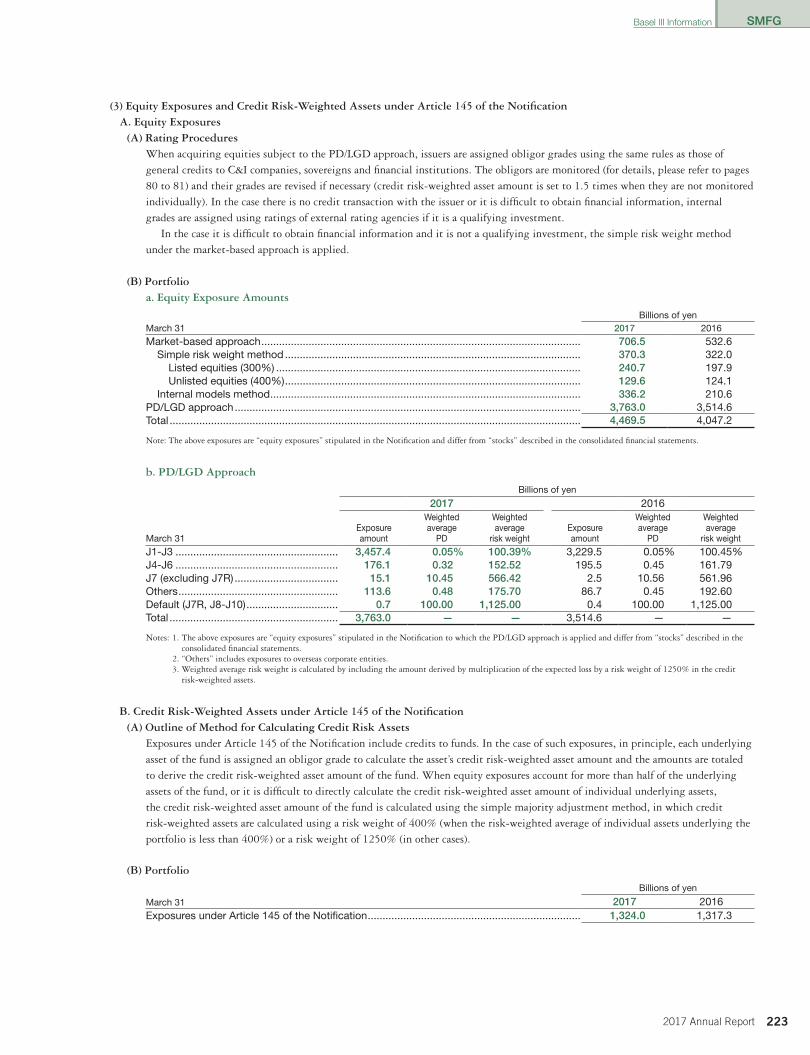
SMFG
2232017 Annual Report
(3) Equity Exposures and Credit Risk-Weighted Assets under Article 145 of the NotificationA. Equity Exposures
(A) Rating ProceduresWhen acquiring equities subject to the PD/LGD approach, issuers are assigned obligor grades using the same rules as those of general credits to C&I companies, sovereigns and financial institutions. The obligors are monitored (for details, please refer to pages 80 to 81) and their grades are revised if necessary (credit risk-weighted asset amount is set to 1.5 times when they are not monitored individually). In the case there is no credit transaction with the issuer or it is difficult to obtain financial information, internal grades are assigned using ratings of external rating agencies if it is a qualifying investment.
In the case it is difficult to obtain financial information and it is not a qualifying investment, the simple risk weight method under the market-based approach is applied.
(B) Portfolioa. Equity Exposure Amounts
Billions of yenMarch 31 2017 2016
Market-based approach ............................................................................................................ 706.5 532.6Simple risk weight method .................................................................................................... 370.3 322.0
Listed equities (300%) ....................................................................................................... 240.7 197.9Unlisted equities (400%) .................................................................................................... 129.6 124.1
Internal models method ......................................................................................................... 336.2 210.6PD/LGD approach ..................................................................................................................... 3,763.0 3,514.6Total ........................................................................................................................................... 4,469.5 4,047.2
Note: The above exposures are “equity exposures” stipulated in the Notification and differ from “stocks” described in the consolidated financial statements.
b. PD/LGD Approach
Billions of yen
2017 2016
March 31Exposureamount
Weightedaverage
PD
Weightedaverage
risk weightExposureamount
Weightedaverage
PD
Weightedaverage
risk weight
J1-J3 ....................................................... 3,457.4 0.05% 100.39% 3,229.5 0.05% 100.45%J4-J6 ....................................................... 176.1 0.32 152.52 195.5 0.45 161.79J7 (excluding J7R) ................................... 15.1 10.45 566.42 2.5 10.56 561.96Others ...................................................... 113.6 0.48 175.70 86.7 0.45 192.60Default (J7R, J8-J10) ............................... 0.7 100.00 1,125.00 0.4 100.00 1,125.00Total ......................................................... 3,763.0 — — 3,514.6 — —
Notes: 1. The above exposures are “equity exposures” stipulated in the Notification to which the PD/LGD approach is applied and differ from “stocks” described in theconsolidated financial statements.
2. “Others” includes exposures to overseas corporate entities.3. Weighted average risk weight is calculated by including the amount derived by multiplication of the expected loss by a risk weight of 1250% in the credit
risk-weighted assets.
B. Credit Risk-Weighted Assets under Article 145 of the Notification(A) Outline of Method for Calculating Credit Risk Assets
Exposures under Article 145 of the Notification include credits to funds. In the case of such exposures, in principle, each underlying asset of the fund is assigned an obligor grade to calculate the asset’s credit risk-weighted asset amount and the amounts are totaled to derive the credit risk-weighted asset amount of the fund. When equity exposures account for more than half of the underlying assets of the fund, or it is difficult to directly calculate the credit risk-weighted asset amount of individual underlying assets, the credit risk-weighted asset amount of the fund is calculated using the simple majority adjustment method, in which credit risk-weighted assets are calculated using a risk weight of 400% (when the risk-weighted average of individual assets underlying the portfolio is less than 400%) or a risk weight of 1250% (in other cases).
(B) Portfolio
Billions of yen
March 31 2017 2016Exposures under Article 145 of the Notification ........................................................................ 1,324.0 1,317.3
Basel III Information
012_0800885852907.indd 223 2017/08/10 20:49:16

SMFG
224 2017 Annual Report
(4) Analysis of Actual LossesA. Year-on-Year Comparison of Actual Losses
SMFG recorded an increase of ¥61.6 billion in total credit costs (the total of the general reserve, non-performing loan write-offs and gains on collection of written-off claims) compared to the previous fiscal year, amounting to ¥164.4 billion on a consolidated basis for fiscal year 2016.
SMBC recorded an increase of ¥64.3 billion in total credit costs compared to the previous fiscal year, which resulted in an expense of ¥61.1 billion on a non-consolidated basis in fiscal year 2016, due to the recognition of costs derived from a downturn in the business of obligors with large exposure.
Total Credit CostsBillions of yen
Fiscal 2016 (A) Fiscal 2015 (B) Fiscal 2014Increase
(decrease)(A) – (B)
SMFG (consolidated) total ..................................................... 164.4 102.8 7.8 61.6 SMBC (consolidated) total .................................................... 63.3 13.9 (65.4) 49.4 SMBC (non-consolidated) total ............................................. 61.1 (3.2) (80.1) 64.3
Corporate exposures ......................................................... 64.0 0.1 (40.6) 63.9 Sovereign exposures ......................................................... (0.1) (1.7) (6.0) 1.6 Bank exposures ................................................................. (0.3) (0.1) (0.7) (0.3)Residential mortgage exposures ....................................... (0.1) 0.0 (0.3) (0.2)QRRE ................................................................................. (0.0) 0.0 (0.1) (0.1)Other retail exposures ....................................................... (0.3) (1.8) (2.6) 1.5
Notes: 1. The above amounts do not include gains/losses on “equity exposures,” “exposures on capital market-driven transactions (such as bonds)” and “exposures under Article145 of the Notification” that were recognized as gains/losses on bonds and stocks in the statements of income.
2. Exposure category amounts do not include general reserve for Normal Borrowers.3. Bracketed fiscal year amounts indicate gains generated by the reversal of reserve, etc.4. Credit costs for “Residential mortgage exposures” and “QRRE” guaranteed by consolidated subsidiaries are not included in the total credit costs of SMBC
(non-consolidated).
Basel III Information
012_0800885852907.indd 224 2017/08/10 20:49:16
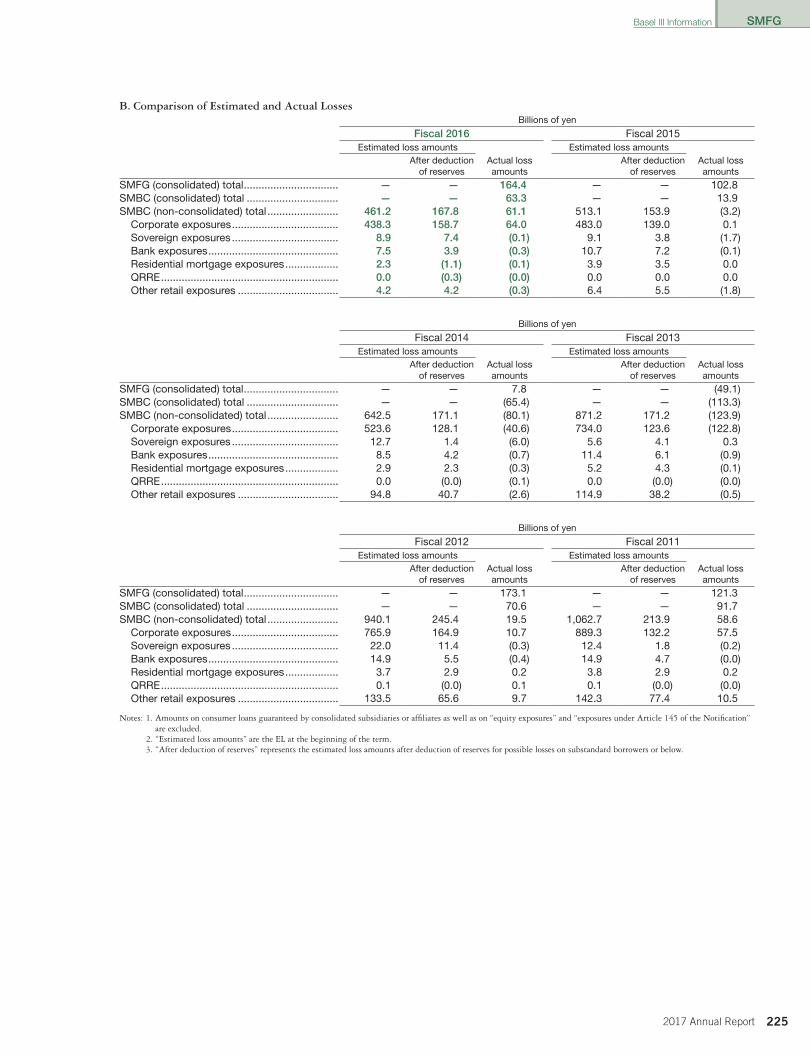
SMFG
2252017 Annual Report
B. Comparison of Estimated and Actual Losses Billions of yen
Fiscal 2016 Fiscal 2015Estimated loss amounts Estimated loss amounts
After deductionof reserves
Actual lossamounts
After deductionof reserves
Actual lossamounts
SMFG (consolidated) total ................................ — — 164.4 — — 102.8SMBC (consolidated) total ............................... — — 63.3 — — 13.9SMBC (non-consolidated) total ........................ 461.2 167.8 61.1 513.1 153.9 (3.2)
Corporate exposures .................................... 438.3 158.7 64.0 483.0 139.0 0.1Sovereign exposures .................................... 8.9 7.4 (0.1) 9.1 3.8 (1.7)Bank exposures ............................................ 7.5 3.9 (0.3) 10.7 7.2 (0.1)Residential mortgage exposures .................. 2.3 (1.1) (0.1) 3.9 3.5 0.0QRRE ............................................................ 0.0 (0.3) (0.0) 0.0 0.0 0.0Other retail exposures .................................. 4.2 4.2 (0.3) 6.4 5.5 (1.8)
Billions of yen
Fiscal 2014 Fiscal 2013Estimated loss amounts Estimated loss amounts
After deductionof reserves
Actual lossamounts
After deductionof reserves
Actual lossamounts
SMFG (consolidated) total ................................ — — 7.8 — — (49.1)SMBC (consolidated) total ............................... — — (65.4) — — (113.3)SMBC (non-consolidated) total ........................ 642.5 171.1 (80.1) 871.2 171.2 (123.9)
Corporate exposures .................................... 523.6 128.1 (40.6) 734.0 123.6 (122.8)Sovereign exposures .................................... 12.7 1.4 (6.0) 5.6 4.1 0.3Bank exposures ............................................ 8.5 4.2 (0.7) 11.4 6.1 (0.9)Residential mortgage exposures .................. 2.9 2.3 (0.3) 5.2 4.3 (0.1)QRRE ............................................................ 0.0 (0.0) (0.1) 0.0 (0.0) (0.0)Other retail exposures .................................. 94.8 40.7 (2.6) 114.9 38.2 (0.5)
Billions of yen
Fiscal 2012 Fiscal 2011Estimated loss amounts Estimated loss amounts
After deductionof reserves
Actual lossamounts
After deductionof reserves
Actual lossamounts
SMFG (consolidated) total ................................ — — 173.1 — — 121.3SMBC (consolidated) total ............................... — — 70.6 — — 91.7SMBC (non-consolidated) total ........................ 940.1 245.4 19.5 1,062.7 213.9 58.6
Corporate exposures .................................... 765.9 164.9 10.7 889.3 132.2 57.5Sovereign exposures .................................... 22.0 11.4 (0.3) 12.4 1.8 (0.2)Bank exposures ............................................ 14.9 5.5 (0.4) 14.9 4.7 (0.0)Residential mortgage exposures .................. 3.7 2.9 0.2 3.8 2.9 0.2QRRE ............................................................ 0.1 (0.0) 0.1 0.1 (0.0) (0.0)Other retail exposures .................................. 133.5 65.6 9.7 142.3 77.4 10.5
Notes: 1. Amounts on consumer loans guaranteed by consolidated subsidiaries or affiliates as well as on “equity exposures” and “exposures under Article 145 of the Notification”are excluded.
2. “Estimated loss amounts” are the EL at the beginning of the term.3. “After deduction of reserves” represents the estimated loss amounts after deduction of reserves for possible losses on substandard borrowers or below.
Basel III Information
012_0800885852907.indd 225 2017/08/10 20:49:16
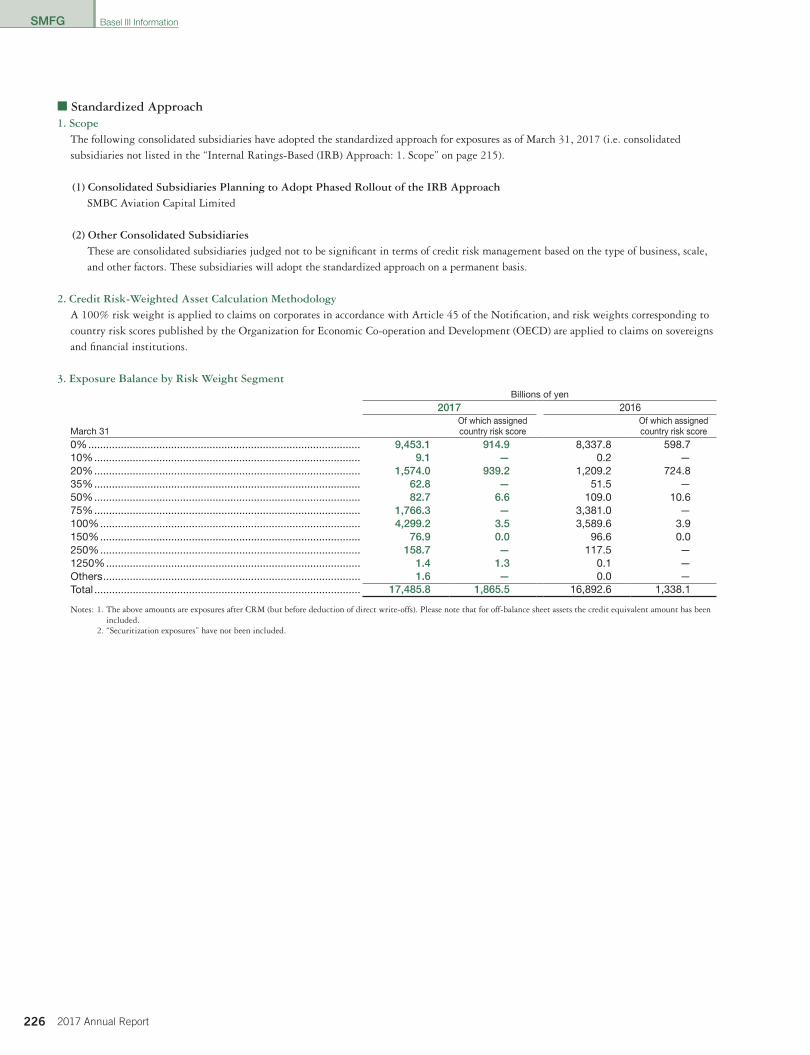
SMFG
226 2017 Annual Report
■ Standardized Approach1. Scope
The following consolidated subsidiaries have adopted the standardized approach for exposures as of March 31, 2017 (i.e. consolidatedsubsidiaries not listed in the “Internal Ratings-Based (IRB) Approach: 1. Scope” on page 215).
(1) Consolidated Subsidiaries Planning to Adopt Phased Rollout of the IRB ApproachSMBC Aviation Capital Limited
(2) Other Consolidated SubsidiariesThese are consolidated subsidiaries judged not to be significant in terms of credit risk management based on the type of business, scale, and other factors. These subsidiaries will adopt the standardized approach on a permanent basis.
2. Credit Risk-Weighted Asset Calculation MethodologyA 100% risk weight is applied to claims on corporates in accordance with Article 45 of the Notification, and risk weights corresponding tocountry risk scores published by the Organization for Economic Co-operation and Development (OECD) are applied to claims on sovereignsand financial institutions.
3. Exposure Balance by Risk Weight SegmentBillions of yen
2017 2016
March 31Of which assignedcountry risk score
Of which assignedcountry risk score
0% ............................................................................................ 9,453.1 914.9 8,337.8 598.710% .......................................................................................... 9.1 — 0.2 —20% .......................................................................................... 1,574.0 939.2 1,209.2 724.835% .......................................................................................... 62.8 — 51.5 —50% .......................................................................................... 82.7 6.6 109.0 10.675% .......................................................................................... 1,766.3 — 3,381.0 —100% ........................................................................................ 4,299.2 3.5 3,589.6 3.9150% ........................................................................................ 76.9 0.0 96.6 0.0250% ........................................................................................ 158.7 — 117.5 —1250% ...................................................................................... 1.4 1.3 0.1 —Others ....................................................................................... 1.6 — 0.0 —Total .......................................................................................... 17,485.8 1,865.5 16,892.6 1,338.1
Notes: 1. The above amounts are exposures after CRM (but before deduction of direct write-offs). Please note that for off-balance sheet assets the credit equivalent amount has beenincluded.
2. “Securitization exposures” have not been included.
Basel III Information
012_0800885852907.indd 226 2017/08/10 20:49:16
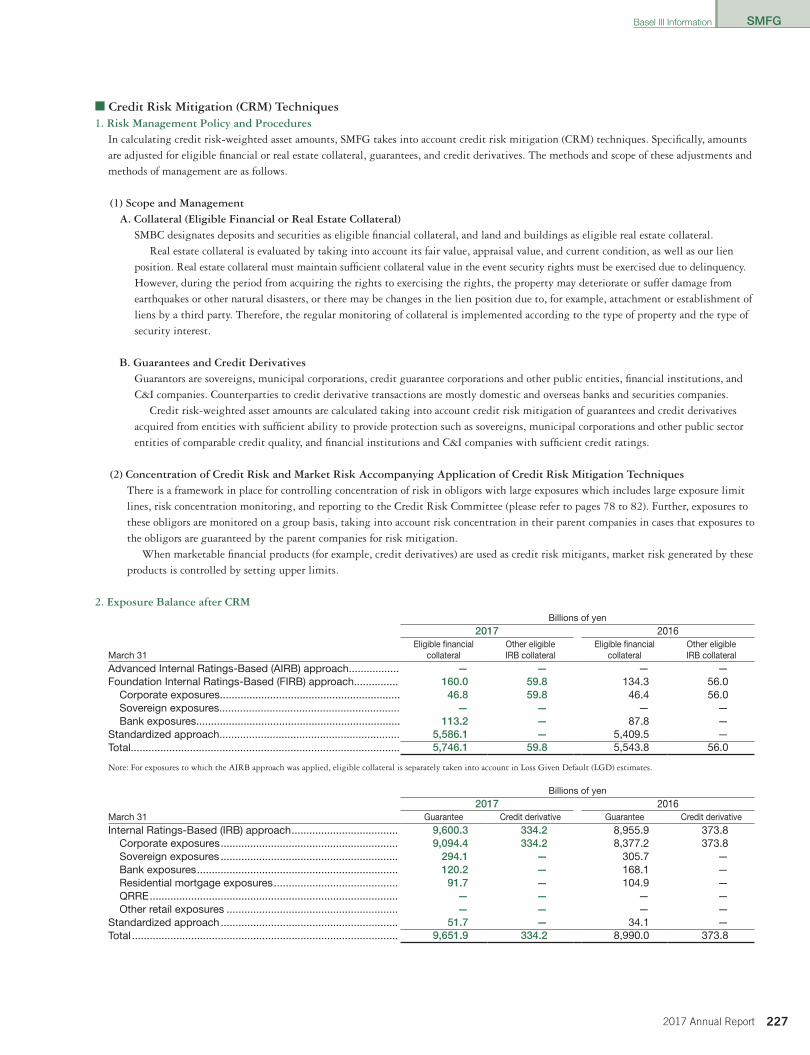
SMFG
2272017 Annual Report
■ Credit Risk Mitigation (CRM) Techniques1. Risk Management Policy and Procedures
In calculating credit risk-weighted asset amounts, SMFG takes into account credit risk mitigation (CRM) techniques. Specifically, amountsare adjusted for eligible financial or real estate collateral, guarantees, and credit derivatives. The methods and scope of these adjustments andmethods of management are as follows.
(1) Scope and ManagementA. Collateral (Eligible Financial or Real Estate Collateral)
SMBC designates deposits and securities as eligible financial collateral, and land and buildings as eligible real estate collateral.Real estate collateral is evaluated by taking into account its fair value, appraisal value, and current condition, as well as our lien
position. Real estate collateral must maintain sufficient collateral value in the event security rights must be exercised due to delinquency. However, during the period from acquiring the rights to exercising the rights, the property may deteriorate or suffer damage from earthquakes or other natural disasters, or there may be changes in the lien position due to, for example, attachment or establishment of liens by a third party. Therefore, the regular monitoring of collateral is implemented according to the type of property and the type of security interest.
B. Guarantees and Credit DerivativesGuarantors are sovereigns, municipal corporations, credit guarantee corporations and other public entities, financial institutions, and C&I companies. Counterparties to credit derivative transactions are mostly domestic and overseas banks and securities companies.
Credit risk-weighted asset amounts are calculated taking into account credit risk mitigation of guarantees and credit derivatives acquired from entities with sufficient ability to provide protection such as sovereigns, municipal corporations and other public sector entities of comparable credit quality, and financial institutions and C&I companies with sufficient credit ratings.
(2) Concentration of Credit Risk and Market Risk Accompanying Application of Credit Risk Mitigation TechniquesThere is a framework in place for controlling concentration of risk in obligors with large exposures which includes large exposure limit lines, risk concentration monitoring, and reporting to the Credit Risk Committee (please refer to pages 78 to 82). Further, exposures to these obligors are monitored on a group basis, taking into account risk concentration in their parent companies in cases that exposures to the obligors are guaranteed by the parent companies for risk mitigation.
When marketable financial products (for example, credit derivatives) are used as credit risk mitigants, market risk generated by these products is controlled by setting upper limits.
2. Exposure Balance after CRMBillions of yen
2017 2016
March 31Eligible financial
collateralOther eligibleIRB collateral
Eligible financialcollateral
Other eligibleIRB collateral
Advanced Internal Ratings-Based (AIRB) approach................. — — — —Foundation Internal Ratings-Based (FIRB) approach............... 160.0 59.8 134.3 56.0
Corporate exposures............................................................. 46.8 59.8 46.4 56.0Sovereign exposures............................................................. — — — —Bank exposures..................................................................... 113.2 — 87.8 —
Standardized approach............................................................. 5,586.1 — 5,409.5 —Total........................................................................................... 5,746.1 59.8 5,543.8 56.0
Note: For exposures to which the AIRB approach was applied, eligible collateral is separately taken into account in Loss Given Default (LGD) estimates.
Billions of yen
2017 2016March 31 Guarantee Credit derivative Guarantee Credit derivative
Internal Ratings-Based (IRB) approach .................................... 9,600.3 334.2 8,955.9 373.8Corporate exposures ............................................................ 9,094.4 334.2 8,377.2 373.8Sovereign exposures ............................................................ 294.1 — 305.7 —Bank exposures .................................................................... 120.2 — 168.1 —Residential mortgage exposures .......................................... 91.7 — 104.9 —QRRE .................................................................................... — — — —Other retail exposures .......................................................... — — — —
Standardized approach ............................................................ 51.7 — 34.1 —Total .......................................................................................... 9,651.9 334.2 8,990.0 373.8
Basel III Information
012_0800885852907.indd 227 2017/08/10 20:49:16
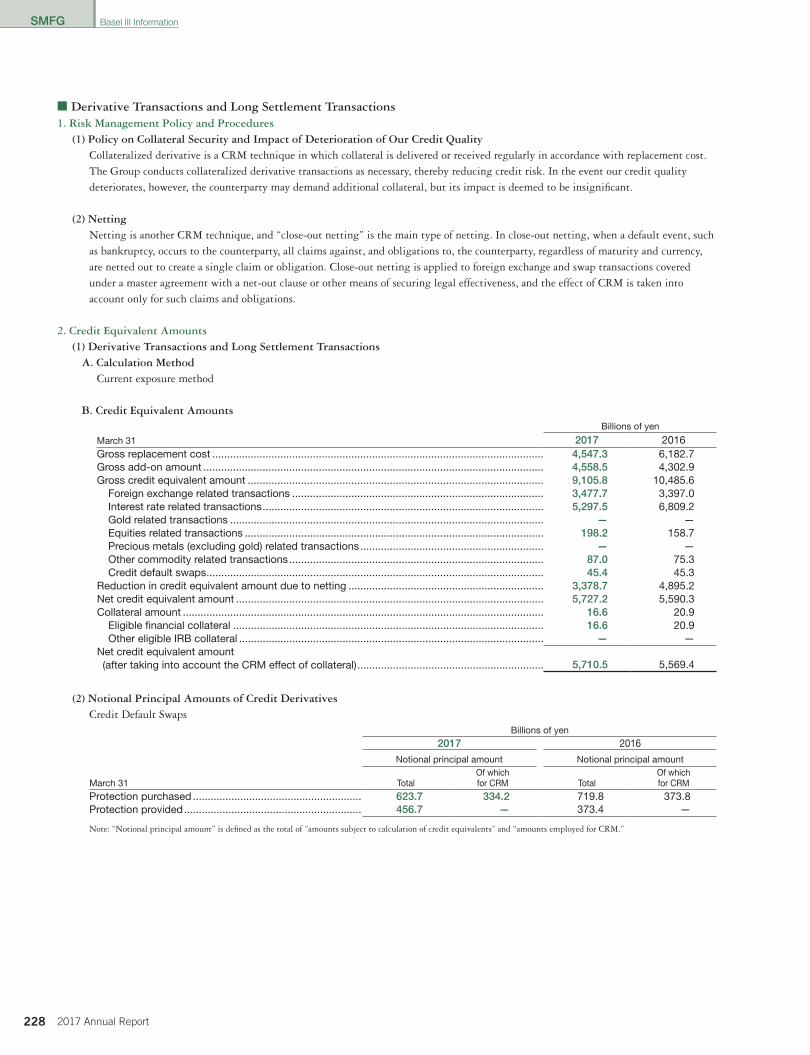
SMFG
228 2017 Annual Report
■ Derivative Transactions and Long Settlement Transactions1. Risk Management Policy and Procedures
(1) Policy on Collateral Security and Impact of Deterioration of Our Credit QualityCollateralized derivative is a CRM technique in which collateral is delivered or received regularly in accordance with replacement cost.The Group conducts collateralized derivative transactions as necessary, thereby reducing credit risk. In the event our credit qualitydeteriorates, however, the counterparty may demand additional collateral, but its impact is deemed to be insignificant.
(2) NettingNetting is another CRM technique, and “close-out netting” is the main type of netting. In close-out netting, when a default event, suchas bankruptcy, occurs to the counterparty, all claims against, and obligations to, the counterparty, regardless of maturity and currency,are netted out to create a single claim or obligation. Close-out netting is applied to foreign exchange and swap transactions coveredunder a master agreement with a net-out clause or other means of securing legal effectiveness, and the effect of CRM is taken intoaccount only for such claims and obligations.
2. Credit Equivalent Amounts(1) Derivative Transactions and Long Settlement Transactions
A. Calculation MethodCurrent exposure method
B. Credit Equivalent AmountsBillions of yen
March 31 2017 2016Gross replacement cost ................................................................................................................ 4,547.3 6,182.7Gross add-on amount ................................................................................................................... 4,558.5 4,302.9Gross credit equivalent amount .................................................................................................... 9,105.8 10,485.6
Foreign exchange related transactions ..................................................................................... 3,477.7 3,397.0Interest rate related transactions ............................................................................................... 5,297.5 6,809.2Gold related transactions .......................................................................................................... — —Equities related transactions ..................................................................................................... 198.2 158.7Precious metals (excluding gold) related transactions .............................................................. — —Other commodity related transactions ...................................................................................... 87.0 75.3Credit default swaps .................................................................................................................. 45.4 45.3
Reduction in credit equivalent amount due to netting .................................................................. 3,378.7 4,895.2Net credit equivalent amount ........................................................................................................ 5,727.2 5,590.3Collateral amount .......................................................................................................................... 16.6 20.9
Eligible financial collateral ......................................................................................................... 16.6 20.9Other eligible IRB collateral ....................................................................................................... — —
Net credit equivalent amount (after taking into account the CRM effect of collateral) ............................................................... 5,710.5 5,569.4
(2) Notional Principal Amounts of Credit DerivativesCredit Default Swaps
Billions of yen
2017 2016
Notional principal amount Notional principal amount
March 31 TotalOf whichfor CRM Total
Of whichfor CRM
Protection purchased ......................................................... 623.7 334.2 719.8 373.8Protection provided ............................................................ 456.7 — 373.4 —
Note: “Notional principal amount” is defined as the total of “amounts subject to calculation of credit equivalents” and “amounts employed for CRM.”
Basel III Information
012_0800885852907.indd 228 2017/08/10 20:49:16

SMFG
2292017 Annual Report
■ Securitization Exposures 1. Risk Management Policy
Definition of securitization exposure has been clarified in order to properly identify, measure, evaluate and report risks, and a risk management department, independent of business units, has been established to centrally manage risks from recognizing securitization exposures to measuring, evaluating and reporting risks.
Securitization transactions are subject to the following policies.• Undertake those which allow separate assessment of underlying short-term assets by making credit decisions on individual underlying
assets.• Undertake those which cover short-term receivables, etc., by creating a framework mainly to estimate the default rate of the underlying
assets based on the historical loan-loss ratio and ensure that they have sufficient subordination.• Undertake others such as those requiring special management by implementing additional management, such as an analysis of the market
environment. Particularly, with respect to securitization transactions backed by retail loans whose creditworthiness is relatively inferior, such as subprime loans in the U.S., the Group deals only with transactions that are sufficiently structured by taking into account not only the above policies, but others such as the underlying asset selection criteria of the originator and the average life. The Group shall basically not conduct resecuritization transactions. Its policy is to conduct securitization transactions by verifying effectiveness in mitigating credit risk through the use of the asset transfer
type or synthetic type securitization transactions covering domestic and foreign exposures and using them as underlying exposures if securitization transactions are used as an approach for credit risk mitigation.
The Group takes one of the following positions for securitization transactions.• Originator (a direct or indirect originator of underlying assets or a sponsor of an ABCP conduit or a similar program that acquires
exposures from third-party entities)• Investor• Others (for example, provider of swap for preventing a mismatch between the dividend on trust beneficiary rights and cash flows
generated by underlying assets on which the rights are issued)
2. Overview of Risk CharacteristicsSecuritization exposures have, in addition to credit risk and market risk, the following intrinsic risks, which are properly managed based on the nature of each risk.(1) Dilution Risk
Means the risk of a decrease in purchased receivables due to cancellation or termination of the original contract for the purchased receiv-ables, or netting of debts between the original obligor and the original obligee.
(2) Servicer RiskA. Commingling Risk
Means the risk of uncollectible funds, which should be collected from the underlying assets, due to the bankruptcy of the servicer before the delivery of the funds collected from the obligor of the receivables.
B. Performance RiskMeans the risk of difficulty in maintenance and collection due to the servicer’s failure to properly and accurately perform its clerical duties and procedures.
(3) Liquidity RiskMeans the risk that cash flows related to the underlying assets may be insufficient for paying the principal and interest of the securitiza-tion exposure due to a timing mismatch between the securitization conduit’s receipt of the cash flows related to the underlying assets and payment of the securitization exposure of the principal and interest, etc.
(4) Fraud RiskMeans the risk of a decrease in or complete loss of the receivables subject to collection due to a fraud, prejudicial or other malicious act by a customer or a third-party obligor.
Basel III Information
012_0800885852907.indd 229 2017/08/10 20:49:16
SMFG
230 2017 Annual Report
3. Calculation Methodology for Credit Risk-Weighted Assets and Market Risk Equivalent AmountThere are three methods of calculating the credit risk-weighted asset amount of securitization exposures subject to the IRB approach: the ratings-based approach, the supervisory formula, and the internal assessment approach. The methods are used as follows.• First, securitization exposures are examined and the ratings-based approach is applied to qualifying exposures.• The remaining exposures are examined and the supervisory formula is applied to qualifying exposures.• In cases where neither the ratings-based approach nor the supervisory formula can be applied, a risk weight of 1250% is applied.
Note that the application of the ratings-based approach is subject to monitoring in accordance with the “Regulations Concerning the Distribution, etc. of Securitized Products” and the “Standardized Information Reporting Package (SIRP)” published by the Japan Securities Dealers Association. The same applies to resecuritized products.
The credit risk-weighted asset amount for securitization exposures subject to the standardized approach is calculated mostly using ratings published by qualifying rating agencies or based on weighted average risk weights of underlying assets as stipulated in the Notification.
In order to determine market risk equivalent amounts of “securitization exposures,” general market risk is subject to the standardized measurement method while specific risk is based on the risk weights corresponding to the ratings published by qualifying rating agencies pursuant to the regulations set forth in the Notification.
4. Type of Securitization Conduit Used in Securitization Transactions Associated with Third Party Assets and Status of Holdings of Securitization Exposures Related to Such TransactionsIn order to undertake securitization transactions related to third-party assets, the Group mainly uses a special purpose company (SPC) as a securitization conduit.
If such transactions are undertaken, the following securitization exposures result.• Backup line to the ABCP issued by the securitization conduit (off-balance sheet assets)• ABL to the securitization conduit (on-balance sheet assets), etc.
5. Names of Subsidiaries and Affiliated Companies Holding Securitization Exposures Related to Securitization Transactions Conducted by Holding Company GroupExcluding consolidated subsidiaries, subsidiaries or affiliated companies holding securitization exposures related to the security transactions conducted by the Holding Company Group are as follows:• NEC Capital Solutions Limited
6. Accounting Policy on Securitization TransactionsThe recognition of the generation and extinguishment of financial assets and financial liabilities associated with securitization transactions and the valuation and accounting treatment thereof are mainly governed by the “Accounting Standard for Financial Instruments” (ASBJ Statement No. 10).
7. Qualifying External Ratings AgenciesIn order to apply the rating-based approach under the IRB approach or standardized approach or to calculate an amount of market risk asso-ciated with specific risk, the risk weights are determined by mapping the ratings of qualifying rating agencies to the risk weights stipulated in the Notification. The qualifying rating agencies are Rating and Investment Information, Inc. (R&I), Japan Credit Rating Agency, Ltd. (JCR), Moody’s Investors Service, Inc. (Moody’s), S&P Global Ratings (S&P), and Fitch Ratings Ltd. (Fitch).
When more than one rating is available for an exposure, the second smallest risk weight is used, in accordance with the Notification.
Basel III Information
012_0800885852907.indd 230 2017/08/10 20:49:16
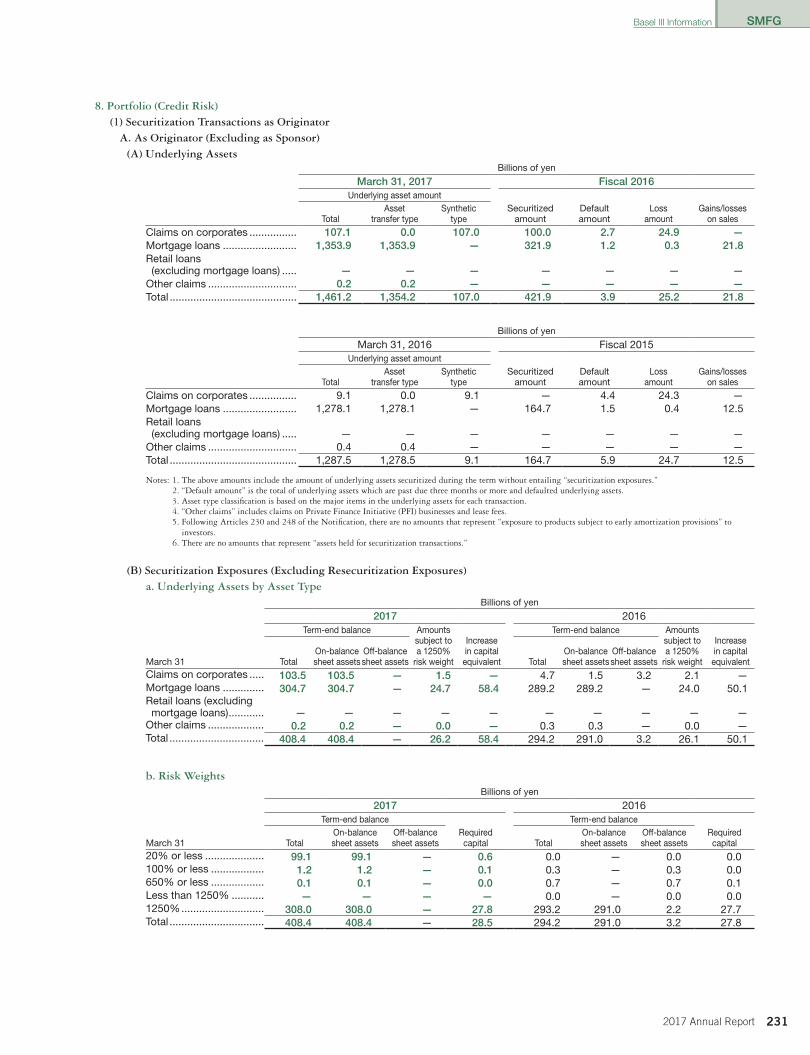
SMFG
2312017 Annual Report
8. Portfolio (Credit Risk)(1) Securitization Transactions as Originator
A. As Originator (Excluding as Sponsor)(A) Underlying Assets
Billions of yen
March 31, 2017 Fiscal 2016Underlying asset amount
Securitizedamount
DefaultamountTotal
Assettransfer type
Synthetictype
Lossamount
Gains/losseson sales
Claims on corporates ................ 107.1 0.0 107.0 100.0 2.7 24.9 —Mortgage loans ......................... 1,353.9 1,353.9 — 321.9 1.2 0.3 21.8 Retail loans (excluding mortgage loans) ..... — — — — — — —
Other claims .............................. 0.2 0.2 — — — — —Total ........................................... 1,461.2 1,354.2 107.0 421.9 3.9 25.2 21.8
Billions of yen
March 31, 2016 Fiscal 2015Underlying asset amount
Securitizedamount
DefaultamountTotal
Assettransfer type
Synthetictype
Lossamount
Gains/losseson sales
Claims on corporates ................ 9.1 0.0 9.1 — 4.4 24.3 —Mortgage loans ......................... 1,278.1 1,278.1 — 164.7 1.5 0.4 12.5Retail loans (excluding mortgage loans) ..... — — — — — — —
Other claims .............................. 0.4 0.4 — — — — —Total ........................................... 1,287.5 1,278.5 9.1 164.7 5.9 24.7 12.5
Notes: 1. The above amounts include the amount of underlying assets securitized during the term without entailing “securitization exposures.”2. “Default amount” is the total of underlying assets which are past due three months or more and defaulted underlying assets.3. Asset type classification is based on the major items in the underlying assets for each transaction.4. “Other claims” includes claims on Private Finance Initiative (PFI) businesses and lease fees.5. Following Articles 230 and 248 of the Notification, there are no amounts that represent “exposure to products subject to early amortization provisions” to
investors.6. There are no amounts that represent “assets held for securitization transactions.”
(B) Securitization Exposures (Excluding Resecuritization Exposures)a. Underlying Assets by Asset Type
Billions of yen
2017 2016Term-end balance Amounts
subject toa 1250%
risk weight
Increasein capital
equivalent
Term-end balance Amountssubject toa 1250%
risk weight
Increasein capital
equivalentMarch 31 TotalOn-balancesheet assets
Off-balancesheet assets Total
On-balancesheet assets
Off-balancesheet assets
Claims on corporates ..... 103.5 103.5 — 1.5 — 4.7 1.5 3.2 2.1 —Mortgage loans .............. 304.7 304.7 — 24.7 58.4 289.2 289.2 — 24.0 50.1Retail loans (excluding mortgage loans) ............ — — — — — — — — — —
Other claims ................... 0.2 0.2 — 0.0 — 0.3 0.3 — 0.0 —Total ................................ 408.4 408.4 — 26.2 58.4 294.2 291.0 3.2 26.1 50.1
b. Risk WeightsBillions of yen
2017 2016Term-end balance
Requiredcapital
Term-end balanceRequiredcapitalMarch 31 Total
On-balancesheet assets
Off-balancesheet assets Total
On-balancesheet assets
Off-balancesheet assets
20% or less .................... 99.1 99.1 — 0.6 0.0 — 0.0 0.0100% or less .................. 1.2 1.2 — 0.1 0.3 — 0.3 0.0650% or less .................. 0.1 0.1 — 0.0 0.7 — 0.7 0.1Less than 1250% ........... — — — — 0.0 — 0.0 0.01250% ............................ 308.0 308.0 — 27.8 293.2 291.0 2.2 27.7Total ................................ 408.4 408.4 — 28.5 294.2 291.0 3.2 27.8
Basel III Information
012_0800885852907.indd 231 2017/08/10 20:49:16
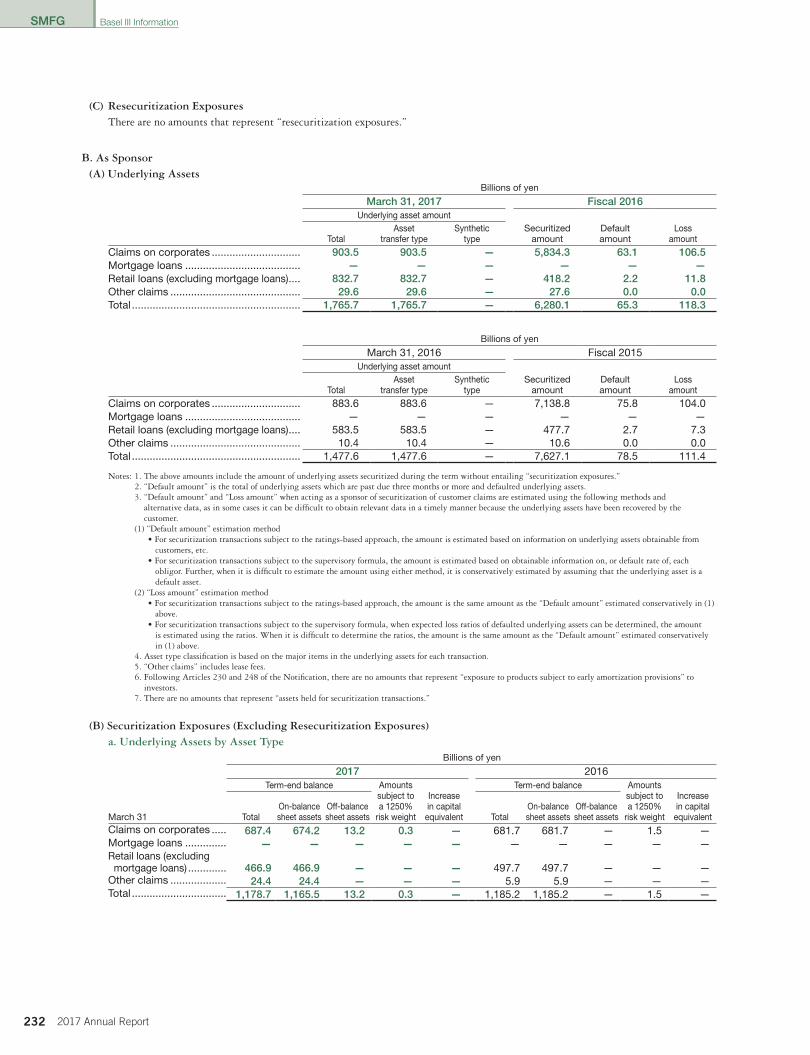
SMFG
232 2017 Annual Report
(C) Resecuritization ExposuresThere are no amounts that represent “resecuritization exposures.”
B. As Sponsor(A) Underlying Assets
Billions of yen
March 31, 2017 Fiscal 2016Underlying asset amount
Securitizedamount
Defaultamount
LossamountTotal
Assettransfer type
Synthetictype
Claims on corporates .............................. 903.5 903.5 — 5,834.3 63.1 106.5 Mortgage loans ....................................... — — — — — —Retail loans (excluding mortgage loans) .... 832.7 832.7 — 418.2 2.2 11.8 Other claims ............................................ 29.6 29.6 — 27.6 0.0 0.0 Total ......................................................... 1,765.7 1,765.7 — 6,280.1 65.3 118.3
Billions of yen
March 31, 2016 Fiscal 2015Underlying asset amount
Securitizedamount
Defaultamount
LossamountTotal
Assettransfer type
Synthetictype
Claims on corporates .............................. 883.6 883.6 — 7,138.8 75.8 104.0Mortgage loans ....................................... — — — — — —Retail loans (excluding mortgage loans) .... 583.5 583.5 — 477.7 2.7 7.3Other claims ............................................ 10.4 10.4 — 10.6 0.0 0.0Total ......................................................... 1,477.6 1,477.6 — 7,627.1 78.5 111.4
Notes: 1. The above amounts include the amount of underlying assets securitized during the term without entailing “securitization exposures.”2. “Default amount” is the total of underlying assets which are past due three months or more and defaulted underlying assets.3. “Default amount” and “Loss amount” when acting as a sponsor of securitization of customer claims are estimated using the following methods and
alternative data, as in some cases it can be difficult to obtain relevant data in a timely manner because the underlying assets have been recovered by thecustomer.
(1) “Default amount” estimation method• For securitization transactions subject to the ratings-based approach, the amount is estimated based on information on underlying assets obtainable from
customers, etc.• For securitization transactions subject to the supervisory formula, the amount is estimated based on obtainable information on, or default rate of, each
obligor. Further, when it is difficult to estimate the amount using either method, it is conservatively estimated by assuming that the underlying asset is a default asset.
(2) “Loss amount” estimation method• For securitization transactions subject to the ratings-based approach, the amount is the same amount as the “Default amount” estimated conservatively in (1)
above.• For securitization transactions subject to the supervisory formula, when expected loss ratios of defaulted underlying assets can be determined, the amount
is estimated using the ratios. When it is difficult to determine the ratios, the amount is the same amount as the “Default amount” estimated conservatively in (1) above.
4. Asset type classification is based on the major items in the underlying assets for each transaction.5. “Other claims” includes lease fees.6. Following Articles 230 and 248 of the Notification, there are no amounts that represent “exposure to products subject to early amortization provisions” to
investors.7. There are no amounts that represent “assets held for securitization transactions.”
(B) Securitization Exposures (Excluding Resecuritization Exposures)a. Underlying Assets by Asset Type
Billions of yen
2017 2016Term-end balance Amounts
subject toa 1250%
risk weight
Increasein capital
equivalent
Term-end balance Amountssubject toa 1250%
risk weight
Increasein capital
equivalentMarch 31 TotalOn-balancesheet assets
Off-balancesheet assets Total
On-balancesheet assets
Off-balancesheet assets
Claims on corporates ..... 687.4 674.2 13.2 0.3 — 681.7 681.7 — 1.5 —Mortgage loans .............. — — — — — — — — — —Retail loans (excluding
mortgage loans) ............. 466.9 466.9 — — — 497.7 497.7 — — —Other claims ................... 24.4 24.4 — — — 5.9 5.9 — — —Total ................................ 1,178.7 1,165.5 13.2 0.3 — 1,185.2 1,185.2 — 1.5 —
Basel III Information
012_0800885852907.indd 232 2017/08/10 20:49:16
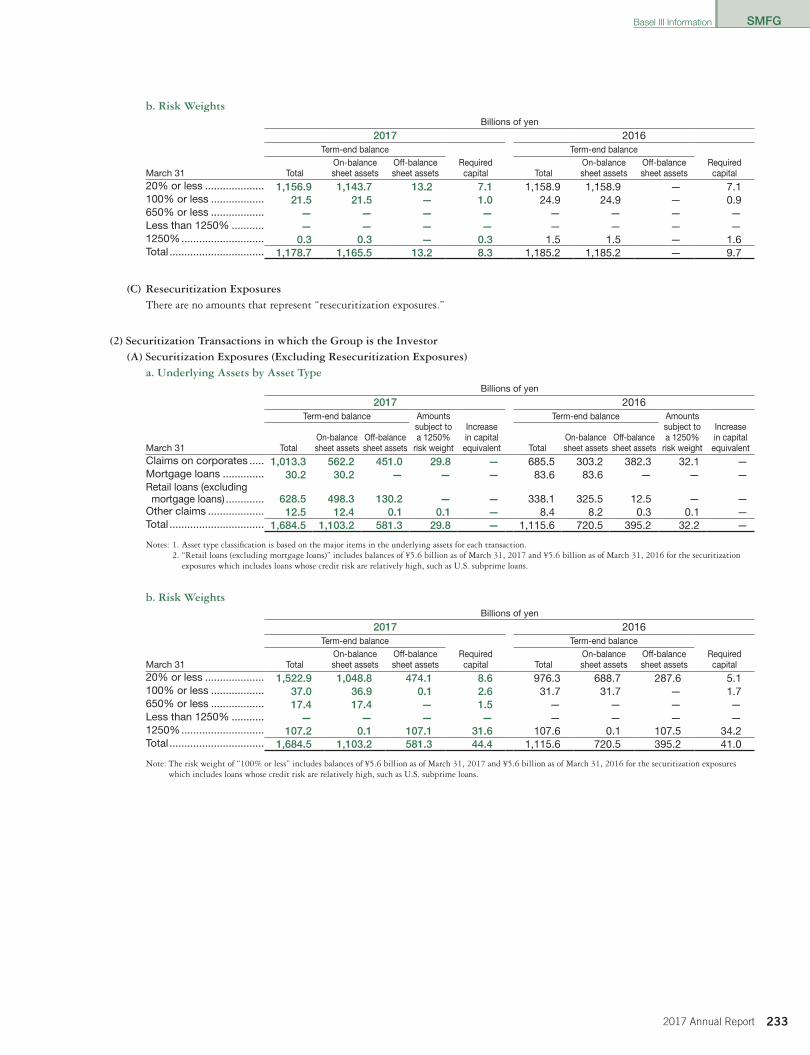
SMFG
2332017 Annual Report
b. Risk WeightsBillions of yen
2017 2016Term-end balance
Requiredcapital
Term-end balanceRequiredcapitalMarch 31 Total
On-balancesheet assets
Off-balancesheet assets Total
On-balancesheet assets
Off-balancesheet assets
20% or less .................... 1,156.9 1,143.7 13.2 7.1 1,158.9 1,158.9 — 7.1100% or less .................. 21.5 21.5 — 1.0 24.9 24.9 — 0.9650% or less .................. — — — — — — — —Less than 1250% ........... — — — — — — — —1250% ............................ 0.3 0.3 — 0.3 1.5 1.5 — 1.6Total ................................ 1,178.7 1,165.5 13.2 8.3 1,185.2 1,185.2 — 9.7
(C) Resecuritization ExposuresThere are no amounts that represent “resecuritization exposures.”
(2) Securitization Transactions in which the Group is the Investor(A) Securitization Exposures (Excluding Resecuritization Exposures)
a. Underlying Assets by Asset TypeBillions of yen
2017 2016Term-end balance Amounts
subject toa 1250%
risk weight
Increasein capital
equivalent
Term-end balance Amountssubject toa 1250%
risk weight
Increasein capital
equivalentMarch 31 TotalOn-balancesheet assets
Off-balancesheet assets Total
On-balancesheet assets
Off-balancesheet assets
Claims on corporates ..... 1,013.3 562.2 451.0 29.8 — 685.5 303.2 382.3 32.1 —Mortgage loans .............. 30.2 30.2 — — — 83.6 83.6 — — —Retail loans (excluding
mortgage loans) ............. 628.5 498.3 130.2 — — 338.1 325.5 12.5 — —Other claims ................... 12.5 12.4 0.1 0.1 — 8.4 8.2 0.3 0.1 —Total ................................ 1,684.5 1,103.2 581.3 29.8 — 1,115.6 720.5 395.2 32.2 —
Notes: 1. Asset type classification is based on the major items in the underlying assets for each transaction.2. “Retail loans (excluding mortgage loans)” includes balances of ¥5.6 billion as of March 31, 2017 and ¥5.6 billion as of March 31, 2016 for the securitization
exposures which includes loans whose credit risk are relatively high, such as U.S. subprime loans.
b. Risk WeightsBillions of yen
2017 2016Term-end balance
Requiredcapital
Term-end balanceRequiredcapitalMarch 31 Total
On-balancesheet assets
Off-balancesheet assets Total
On-balancesheet assets
Off-balancesheet assets
20% or less .................... 1,522.9 1,048.8 474.1 8.6 976.3 688.7 287.6 5.1100% or less .................. 37.0 36.9 0.1 2.6 31.7 31.7 — 1.7650% or less .................. 17.4 17.4 — 1.5 — — — —Less than 1250% ........... — — — — — — — —1250% ............................ 107.2 0.1 107.1 31.6 107.6 0.1 107.5 34.2Total ................................ 1,684.5 1,103.2 581.3 44.4 1,115.6 720.5 395.2 41.0
Note: The risk weight of “100% or less” includes balances of ¥5.6 billion as of March 31, 2017 and ¥5.6 billion as of March 31, 2016 for the securitization exposureswhich includes loans whose credit risk are relatively high, such as U.S. subprime loans.
Basel III Information
012_0800885852907.indd 233 2017/08/10 20:49:17
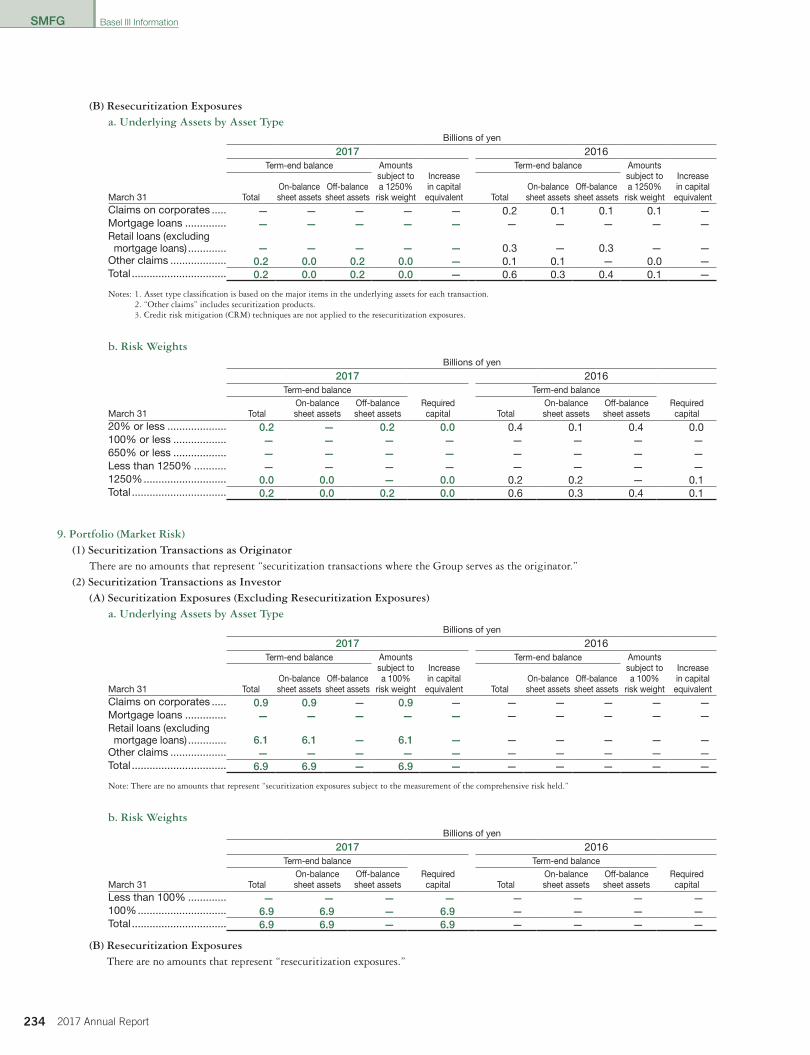
SMFG
234 2017 Annual Report
(B) Resecuritization Exposuresa. Underlying Assets by Asset Type
Billions of yen
2017 2016Term-end balance Amounts
subject toa 1250%
risk weight
Increasein capital
equivalent
Term-end balance Amountssubject toa 1250%
risk weight
Increasein capital
equivalentMarch 31 TotalOn-balancesheet assets
Off-balancesheet assets Total
On-balancesheet assets
Off-balancesheet assets
Claims on corporates ..... — — — — — 0.2 0.1 0.1 0.1 —Mortgage loans .............. — — — — — — — — — —Retail loans (excluding
mortgage loans) ............. — — — — — 0.3 — 0.3 — —Other claims ................... 0.2 0.0 0.2 0.0 — 0.1 0.1 — 0.0 —Total ................................ 0.2 0.0 0.2 0.0 — 0.6 0.3 0.4 0.1 —
Notes: 1. Asset type classification is based on the major items in the underlying assets for each transaction.2. “Other claims” includes securitization products.3. Credit risk mitigation (CRM) techniques are not applied to the resecuritization exposures.
b. Risk WeightsBillions of yen
2017 2016Term-end balance
Requiredcapital
Term-end balanceRequiredcapitalMarch 31 Total
On-balancesheet assets
Off-balancesheet assets Total
On-balancesheet assets
Off-balancesheet assets
20% or less .................... 0.2 — 0.2 0.0 0.4 0.1 0.4 0.0100% or less .................. — — — — — — — —650% or less .................. — — — — — — — —Less than 1250% ........... — — — — — — — —1250% ............................ 0.0 0.0 — 0.0 0.2 0.2 — 0.1Total ................................ 0.2 0.0 0.2 0.0 0.6 0.3 0.4 0.1
9. Portfolio (Market Risk)(1) Securitization Transactions as Originator
There are no amounts that represent “securitization transactions where the Group serves as the originator.”(2) Securitization Transactions as Investor
(A) Securitization Exposures (Excluding Resecuritization Exposures)a. Underlying Assets by Asset Type
Billions of yen
2017 2016Term-end balance Amounts
subject toa 100%
risk weight
Increasein capital
equivalent
Term-end balance Amountssubject toa 100%
risk weight
Increasein capital
equivalentMarch 31 TotalOn-balancesheet assets
Off-balancesheet assets Total
On-balancesheet assets
Off-balancesheet assets
Claims on corporates ..... 0.9 0.9 — 0.9 — — — — — —Mortgage loans .............. — — — — — — — — — —Retail loans (excluding
mortgage loans) ............. 6.1 6.1 — 6.1 — — — — — —Other claims ................... — — — — — — — — — —Total ................................ 6.9 6.9 — 6.9 — — — — — —
Note: There are no amounts that represent “securitization exposures subject to the measurement of the comprehensive risk held.”
b. Risk WeightsBillions of yen
2017 2016Term-end balance
Requiredcapital
Term-end balanceRequiredcapitalMarch 31 Total
On-balancesheet assets
Off-balancesheet assets Total
On-balancesheet assets
Off-balancesheet assets
Less than 100% ............. — — — — — — — —100% .............................. 6.9 6.9 — 6.9 — — — —Total ................................ 6.9 6.9 — 6.9 — — — —
(B) Resecuritization ExposuresThere are no amounts that represent “resecuritization exposures.”
Basel III Information
012_0800885852907.indd 234 2017/08/10 20:49:17
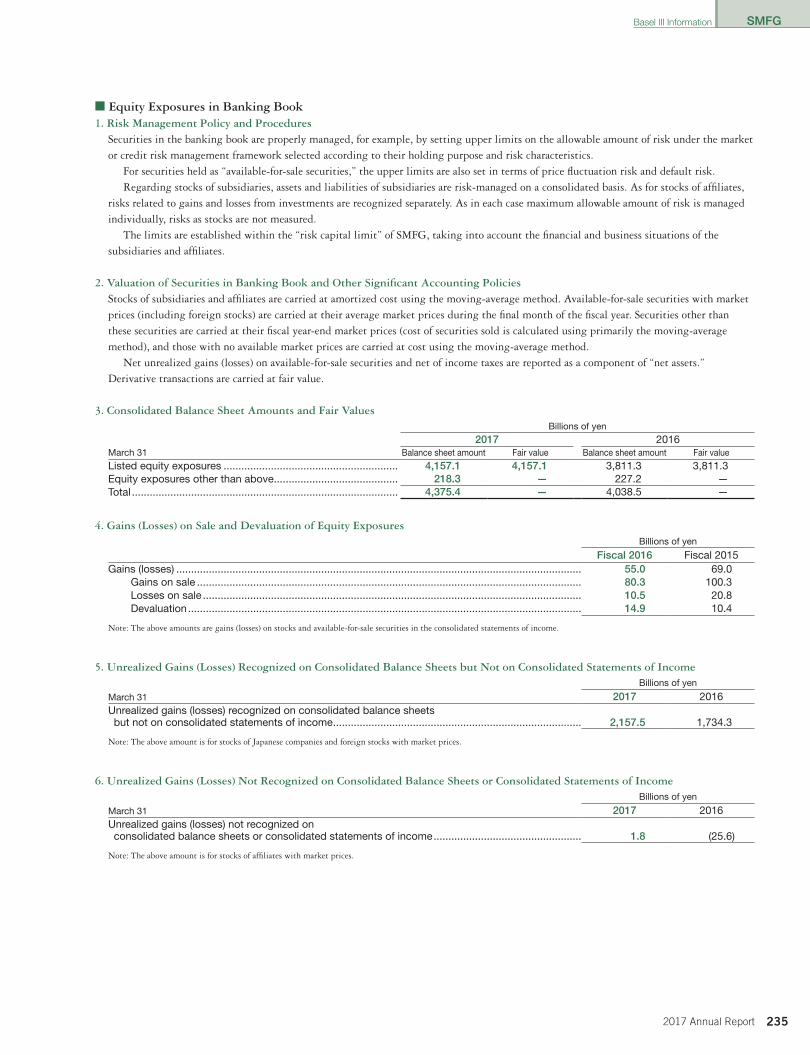
SMFG
2352017 Annual Report
■ Equity Exposures in Banking Book1. Risk Management Policy and Procedures
Securities in the banking book are properly managed, for example, by setting upper limits on the allowable amount of risk under the market or credit risk management framework selected according to their holding purpose and risk characteristics.
For securities held as “available-for-sale securities,” the upper limits are also set in terms of price fluctuation risk and default risk.Regarding stocks of subsidiaries, assets and liabilities of subsidiaries are risk-managed on a consolidated basis. As for stocks of affiliates,
risks related to gains and losses from investments are recognized separately. As in each case maximum allowable amount of risk is managed individually, risks as stocks are not measured.
The limits are established within the “risk capital limit” of SMFG, taking into account the financial and business situations of the subsidiaries and affiliates.
2. Valuation of Securities in Banking Book and Other Significant Accounting PoliciesStocks of subsidiaries and affiliates are carried at amortized cost using the moving-average method. Available-for-sale securities with market prices (including foreign stocks) are carried at their average market prices during the final month of the fiscal year. Securities other than these securities are carried at their fiscal year-end market prices (cost of securities sold is calculated using primarily the moving-average method), and those with no available market prices are carried at cost using the moving-average method.
Net unrealized gains (losses) on available-for-sale securities and net of income taxes are reported as a component of “net assets.” Derivative transactions are carried at fair value.
3. Consolidated Balance Sheet Amounts and Fair ValuesBillions of yen
2017 2016March 31 Balance sheet amount Fair value Balance sheet amount Fair value
Listed equity exposures ........................................................... 4,157.1 4,157.1 3,811.3 3,811.3Equity exposures other than above .......................................... 218.3 — 227.2 —Total .......................................................................................... 4,375.4 — 4,038.5 —
4. Gains (Losses) on Sale and Devaluation of Equity ExposuresBillions of yen
Fiscal 2016 Fiscal 2015Gains (losses) ......................................................................................................................................... 55.0 69.0
Gains on sale .................................................................................................................................. 80.3 100.3Losses on sale ................................................................................................................................ 10.5 20.8Devaluation ..................................................................................................................................... 14.9 10.4
Note: The above amounts are gains (losses) on stocks and available-for-sale securities in the consolidated statements of income.
5. Unrealized Gains (Losses) Recognized on Consolidated Balance Sheets but Not on Consolidated Statements of IncomeBillions of yen
March 31 2017 2016Unrealized gains (losses) recognized on consolidated balance sheets but not on consolidated statements of income .................................................................................... 2,157.5 1,734.3
Note: The above amount is for stocks of Japanese companies and foreign stocks with market prices.
6. Unrealized Gains (Losses) Not Recognized on Consolidated Balance Sheets or Consolidated Statements of IncomeBillions of yen
March 31 2017 2016Unrealized gains (losses) not recognized on consolidated balance sheets or consolidated statements of income .................................................. 1.8 (25.6)
Note: The above amount is for stocks of affiliates with market prices.
Basel III Information
012_0800885852907.indd 235 2017/08/10 20:49:17
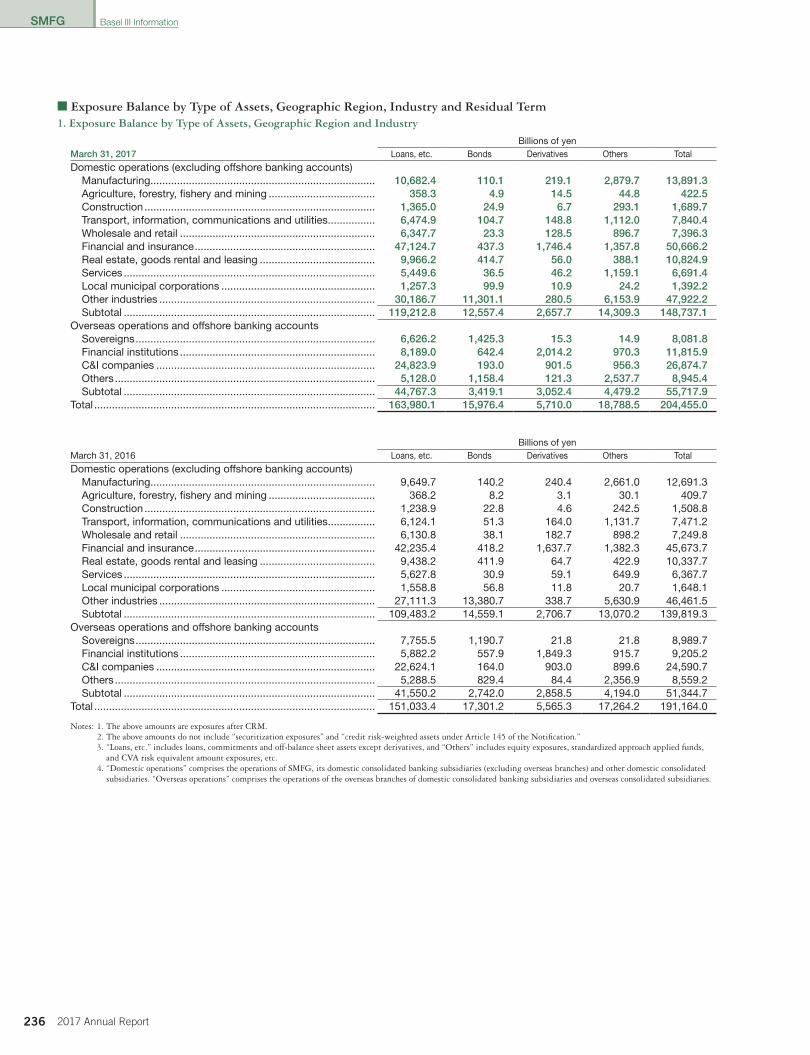
SMFG
236 2017 Annual Report
■ Exposure Balance by Type of Assets, Geographic Region, Industry and Residual Term1. Exposure Balance by Type of Assets, Geographic Region and Industry
Billions of yenMarch 31, 2017 Loans, etc. Bonds Derivatives Others Total
Domestic operations (excluding offshore banking accounts)Manufacturing............................................................................ 10,682.4 110.1 219.1 2,879.7 13,891.3 Agriculture, forestry, fishery and mining .................................... 358.3 4.9 14.5 44.8 422.5 Construction .............................................................................. 1,365.0 24.9 6.7 293.1 1,689.7 Transport, information, communications and utilities ................ 6,474.9 104.7 148.8 1,112.0 7,840.4 Wholesale and retail .................................................................. 6,347.7 23.3 128.5 896.7 7,396.3 Financial and insurance ............................................................. 47,124.7 437.3 1,746.4 1,357.8 50,666.2 Real estate, goods rental and leasing ....................................... 9,966.2 414.7 56.0 388.1 10,824.9 Services ..................................................................................... 5,449.6 36.5 46.2 1,159.1 6,691.4 Local municipal corporations .................................................... 1,257.3 99.9 10.9 24.2 1,392.2 Other industries ......................................................................... 30,186.7 11,301.1 280.5 6,153.9 47,922.2 Subtotal ..................................................................................... 119,212.8 12,557.4 2,657.7 14,309.3 148,737.1
Overseas operations and offshore banking accountsSovereigns ................................................................................. 6,626.2 1,425.3 15.3 14.9 8,081.8 Financial institutions .................................................................. 8,189.0 642.4 2,014.2 970.3 11,815.9 C&I companies .......................................................................... 24,823.9 193.0 901.5 956.3 26,874.7 Others ........................................................................................ 5,128.0 1,158.4 121.3 2,537.7 8,945.4 Subtotal ..................................................................................... 44,767.3 3,419.1 3,052.4 4,479.2 55,717.9
Total ............................................................................................... 163,980.1 15,976.4 5,710.0 18,788.5 204,455.0
Billions of yenMarch 31, 2016 Loans, etc. Bonds Derivatives Others Total
Domestic operations (excluding offshore banking accounts)Manufacturing............................................................................ 9,649.7 140.2 240.4 2,661.0 12,691.3Agriculture, forestry, fishery and mining .................................... 368.2 8.2 3.1 30.1 409.7Construction .............................................................................. 1,238.9 22.8 4.6 242.5 1,508.8Transport, information, communications and utilities ................ 6,124.1 51.3 164.0 1,131.7 7,471.2Wholesale and retail .................................................................. 6,130.8 38.1 182.7 898.2 7,249.8Financial and insurance ............................................................. 42,235.4 418.2 1,637.7 1,382.3 45,673.7Real estate, goods rental and leasing ....................................... 9,438.2 411.9 64.7 422.9 10,337.7Services ..................................................................................... 5,627.8 30.9 59.1 649.9 6,367.7Local municipal corporations .................................................... 1,558.8 56.8 11.8 20.7 1,648.1Other industries ......................................................................... 27,111.3 13,380.7 338.7 5,630.9 46,461.5Subtotal ..................................................................................... 109,483.2 14,559.1 2,706.7 13,070.2 139,819.3
Overseas operations and offshore banking accountsSovereigns ................................................................................. 7,755.5 1,190.7 21.8 21.8 8,989.7Financial institutions .................................................................. 5,882.2 557.9 1,849.3 915.7 9,205.2C&I companies .......................................................................... 22,624.1 164.0 903.0 899.6 24,590.7Others ........................................................................................ 5,288.5 829.4 84.4 2,356.9 8,559.2Subtotal ..................................................................................... 41,550.2 2,742.0 2,858.5 4,194.0 51,344.7
Total ............................................................................................... 151,033.4 17,301.2 5,565.3 17,264.2 191,164.0
Notes: 1. The above amounts are exposures after CRM.2. The above amounts do not include “securitization exposures” and “credit risk-weighted assets under Article 145 of the Notification.”3. “Loans, etc.” includes loans, commitments and off-balance sheet assets except derivatives, and “Others” includes equity exposures, standardized approach applied funds,
and CVA risk equivalent amount exposures, etc.4. “Domestic operations” comprises the operations of SMFG, its domestic consolidated banking subsidiaries (excluding overseas branches) and other domestic consolidated
subsidiaries. “Overseas operations” comprises the operations of the overseas branches of domestic consolidated banking subsidiaries and overseas consolidated subsidiaries.
Basel III Information
012_0800885852907.indd 236 2017/08/10 20:49:17
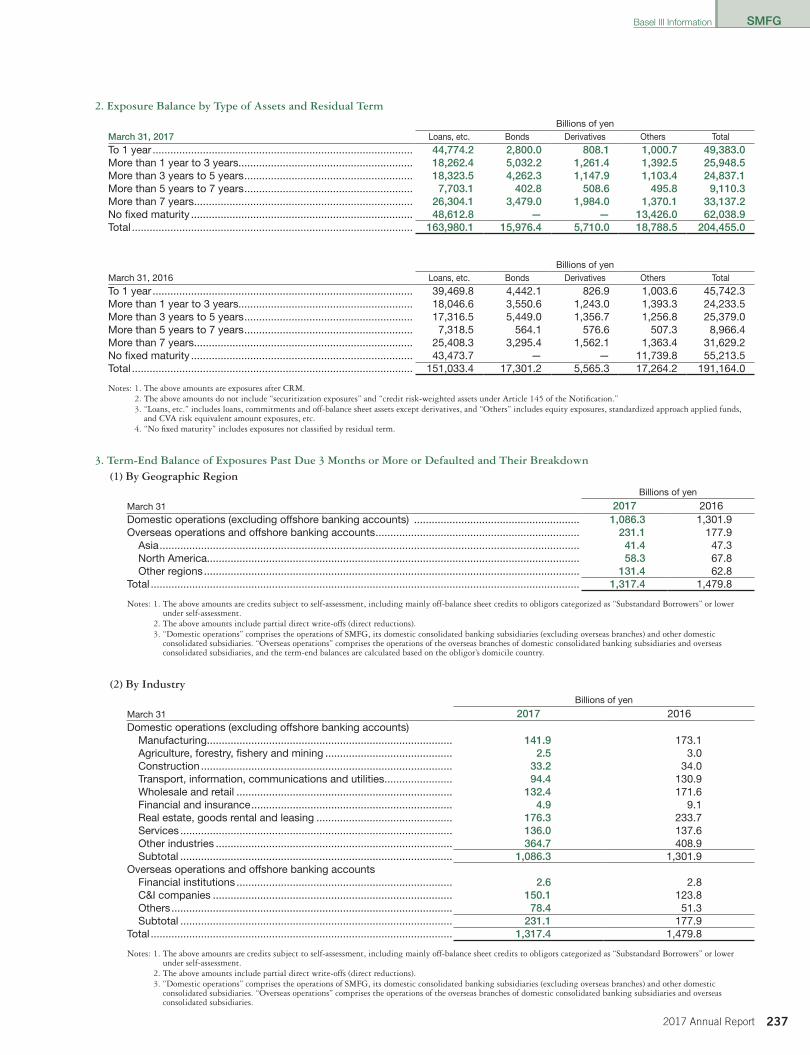
SMFG
2372017 Annual Report
2. Exposure Balance by Type of Assets and Residual Term
Billions of yenMarch 31, 2017 Loans, etc. Bonds Derivatives Others Total
To 1 year ........................................................................................ 44,774.2 2,800.0 808.1 1,000.7 49,383.0 More than 1 year to 3 years........................................................... 18,262.4 5,032.2 1,261.4 1,392.5 25,948.5 More than 3 years to 5 years ......................................................... 18,323.5 4,262.3 1,147.9 1,103.4 24,837.1 More than 5 years to 7 years ......................................................... 7,703.1 402.8 508.6 495.8 9,110.3 More than 7 years .......................................................................... 26,304.1 3,479.0 1,984.0 1,370.1 33,137.2 No fixed maturity ........................................................................... 48,612.8 — — 13,426.0 62,038.9 Total ............................................................................................... 163,980.1 15,976.4 5,710.0 18,788.5 204,455.0
Billions of yenMarch 31, 2016 Loans, etc. Bonds Derivatives Others Total
To 1 year ........................................................................................ 39,469.8 4,442.1 826.9 1,003.6 45,742.3More than 1 year to 3 years........................................................... 18,046.6 3,550.6 1,243.0 1,393.3 24,233.5More than 3 years to 5 years ......................................................... 17,316.5 5,449.0 1,356.7 1,256.8 25,379.0More than 5 years to 7 years ......................................................... 7,318.5 564.1 576.6 507.3 8,966.4More than 7 years .......................................................................... 25,408.3 3,295.4 1,562.1 1,363.4 31,629.2No fixed maturity ........................................................................... 43,473.7 — — 11,739.8 55,213.5Total ............................................................................................... 151,033.4 17,301.2 5,565.3 17,264.2 191,164.0
Notes: 1. The above amounts are exposures after CRM.2. The above amounts do not include “securitization exposures” and “credit risk-weighted assets under Article 145 of the Notification.”3. “Loans, etc.” includes loans, commitments and off-balance sheet assets except derivatives, and “Others” includes equity exposures, standardized approach applied funds,
and CVA risk equivalent amount exposures, etc.4. “No fixed maturity” includes exposures not classified by residual term.
3. Term-End Balance of Exposures Past Due 3 Months or More or Defaulted and Their Breakdown(1) By Geographic Region
Billions of yen
March 31 2017 2016Domestic operations (excluding offshore banking accounts) ........................................................ 1,086.3 1,301.9Overseas operations and offshore banking accounts ..................................................................... 231.1 177.9
Asia .............................................................................................................................................. 41.4 47.3North America.............................................................................................................................. 58.3 67.8Other regions ............................................................................................................................... 131.4 62.8
Total ................................................................................................................................................. 1,317.4 1,479.8
Notes: 1. The above amounts are credits subject to self-assessment, including mainly off-balance sheet credits to obligors categorized as “Substandard Borrowers” or lowerunder self-assessment.
2. The above amounts include partial direct write-offs (direct reductions).3. “Domestic operations” comprises the operations of SMFG, its domestic consolidated banking subsidiaries (excluding overseas branches) and other domestic
consolidated subsidiaries. “Overseas operations” comprises the operations of the overseas branches of domestic consolidated banking subsidiaries and overseasconsolidated subsidiaries, and the term-end balances are calculated based on the obligor’s domicile country.
(2) By IndustryBillions of yen
March 31 2017 2016Domestic operations (excluding offshore banking accounts)
Manufacturing................................................................................... 141.9 173.1Agriculture, forestry, fishery and mining ........................................... 2.5 3.0Construction ..................................................................................... 33.2 34.0Transport, information, communications and utilities ....................... 94.4 130.9Wholesale and retail ......................................................................... 132.4 171.6Financial and insurance .................................................................... 4.9 9.1Real estate, goods rental and leasing .............................................. 176.3 233.7Services ............................................................................................ 136.0 137.6Other industries ................................................................................ 364.7 408.9Subtotal ............................................................................................ 1,086.3 1,301.9
Overseas operations and offshore banking accounts Financial institutions ......................................................................... 2.6 2.8C&I companies ................................................................................. 150.1 123.8Others ............................................................................................... 78.4 51.3Subtotal ............................................................................................ 231.1 177.9
Total ...................................................................................................... 1,317.4 1,479.8
Notes: 1. The above amounts are credits subject to self-assessment, including mainly off-balance sheet credits to obligors categorized as “Substandard Borrowers” or lowerunder self-assessment.
2. The above amounts include partial direct write-offs (direct reductions).3. “Domestic operations” comprises the operations of SMFG, its domestic consolidated banking subsidiaries (excluding overseas branches) and other domestic
consolidated subsidiaries. “Overseas operations” comprises the operations of the overseas branches of domestic consolidated banking subsidiaries and overseasconsolidated subsidiaries.
Basel III Information
012_0800885852907.indd 237 2017/08/10 20:49:17
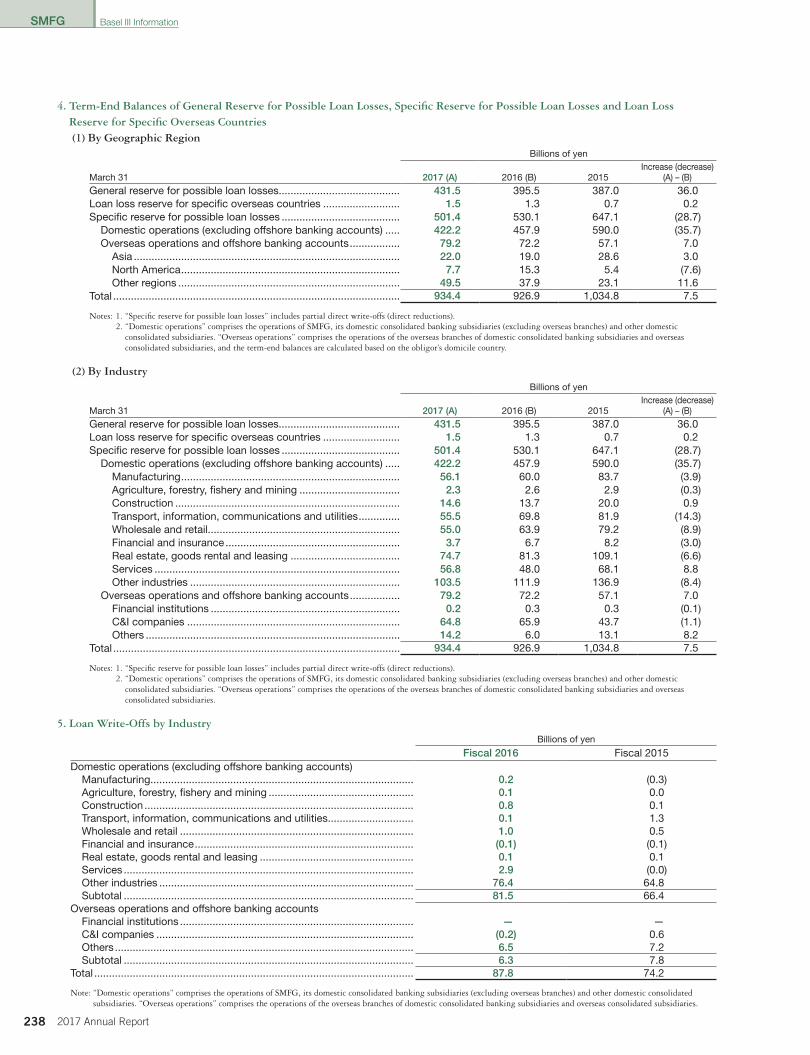
SMFG
238 2017 Annual Report
4. Term-End Balances of General Reserve for Possible Loan Losses, Specific Reserve for Possible Loan Losses and Loan Loss Reserve for Specific Overseas Countries(1) By Geographic Region
Billions of yen
March 31 2017 (A) 2016 (B) 2015Increase (decrease)
(A) – (B)
General reserve for possible loan losses......................................... 431.5 395.5 387.0 36.0 Loan loss reserve for specific overseas countries .......................... 1.5 1.3 0.7 0.2 Specific reserve for possible loan losses ........................................ 501.4 530.1 647.1 (28.7)
Domestic operations (excluding offshore banking accounts) ..... 422.2 457.9 590.0 (35.7)Overseas operations and offshore banking accounts ................. 79.2 72.2 57.1 7.0
Asia .......................................................................................... 22.0 19.0 28.6 3.0 North America .......................................................................... 7.7 15.3 5.4 (7.6)Other regions ........................................................................... 49.5 37.9 23.1 11.6
Total ................................................................................................. 934.4 926.9 1,034.8 7.5
Notes: 1. “Specific reserve for possible loan losses” includes partial direct write-offs (direct reductions).2. “Domestic operations” comprises the operations of SMFG, its domestic consolidated banking subsidiaries (excluding overseas branches) and other domestic
consolidated subsidiaries. “Overseas operations” comprises the operations of the overseas branches of domestic consolidated banking subsidiaries and overseasconsolidated subsidiaries, and the term-end balances are calculated based on the obligor’s domicile country.
(2) By IndustryBillions of yen
March 31 2017 (A) 2016 (B) 2015Increase (decrease)
(A) – (B)
General reserve for possible loan losses......................................... 431.5 395.5 387.0 36.0 Loan loss reserve for specific overseas countries .......................... 1.5 1.3 0.7 0.2 Specific reserve for possible loan losses ........................................ 501.4 530.1 647.1 (28.7)
Domestic operations (excluding offshore banking accounts) ..... 422.2 457.9 590.0 (35.7)Manufacturing .......................................................................... 56.1 60.0 83.7 (3.9)Agriculture, forestry, fishery and mining .................................. 2.3 2.6 2.9 (0.3)Construction ............................................................................ 14.6 13.7 20.0 0.9 Transport, information, communications and utilities .............. 55.5 69.8 81.9 (14.3)Wholesale and retail................................................................. 55.0 63.9 79.2 (8.9)Financial and insurance ........................................................... 3.7 6.7 8.2 (3.0)Real estate, goods rental and leasing ..................................... 74.7 81.3 109.1 (6.6)Services ................................................................................... 56.8 48.0 68.1 8.8 Other industries ....................................................................... 103.5 111.9 136.9 (8.4)
Overseas operations and offshore banking accounts ................. 79.2 72.2 57.1 7.0 Financial institutions ................................................................ 0.2 0.3 0.3 (0.1)C&I companies ........................................................................ 64.8 65.9 43.7 (1.1)Others ...................................................................................... 14.2 6.0 13.1 8.2
Total ................................................................................................. 934.4 926.9 1,034.8 7.5
Notes: 1. “Specific reserve for possible loan losses” includes partial direct write-offs (direct reductions).2. “Domestic operations” comprises the operations of SMFG, its domestic consolidated banking subsidiaries (excluding overseas branches) and other domestic
consolidated subsidiaries. “Overseas operations” comprises the operations of the overseas branches of domestic consolidated banking subsidiaries and overseasconsolidated subsidiaries.
5. Loan Write-Offs by IndustryBillions of yen
Fiscal 2016 Fiscal 2015Domestic operations (excluding offshore banking accounts)
Manufacturing......................................................................................... 0.2 (0.3)Agriculture, forestry, fishery and mining ................................................. 0.1 0.0Construction ........................................................................................... 0.8 0.1Transport, information, communications and utilities ............................. 0.1 1.3Wholesale and retail ............................................................................... 1.0 0.5Financial and insurance .......................................................................... (0.1) (0.1)Real estate, goods rental and leasing .................................................... 0.1 0.1Services .................................................................................................. 2.9 (0.0)Other industries ...................................................................................... 76.4 64.8Subtotal .................................................................................................. 81.5 66.4
Overseas operations and offshore banking accountsFinancial institutions ............................................................................... — —C&I companies ....................................................................................... (0.2) 0.6Others ..................................................................................................... 6.5 7.2Subtotal .................................................................................................. 6.3 7.8
Total ............................................................................................................ 87.8 74.2
Note: “Domestic operations” comprises the operations of SMFG, its domestic consolidated banking subsidiaries (excluding overseas branches) and other domestic consolidatedsubsidiaries. “Overseas operations” comprises the operations of the overseas branches of domestic consolidated banking subsidiaries and overseas consolidated subsidiaries.
Basel III Information
012_0800885852907.indd 238 2017/08/10 20:49:17
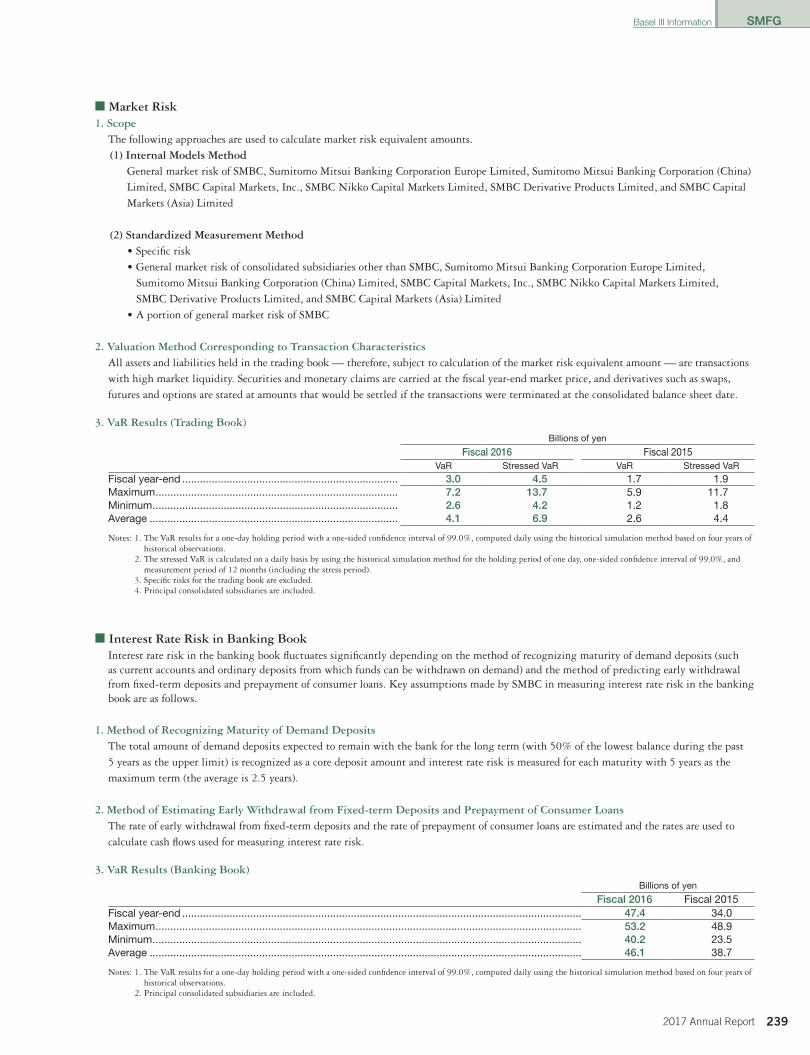
SMFG
2392017 Annual Report
■ Market Risk1. Scope
The following approaches are used to calculate market risk equivalent amounts.(1) Internal Models Method
General market risk of SMBC, Sumitomo Mitsui Banking Corporation Europe Limited, Sumitomo Mitsui Banking Corporation (China) Limited, SMBC Capital Markets, Inc., SMBC Nikko Capital Markets Limited, SMBC Derivative Products Limited, and SMBC Capital Markets (Asia) Limited
(2) Standardized Measurement Method• Specific risk• General market risk of consolidated subsidiaries other than SMBC, Sumitomo Mitsui Banking Corporation Europe Limited,
Sumitomo Mitsui Banking Corporation (China) Limited, SMBC Capital Markets, Inc., SMBC Nikko Capital Markets Limited, SMBC Derivative Products Limited, and SMBC Capital Markets (Asia) Limited
• A portion of general market risk of SMBC
2. Valuation Method Corresponding to Transaction CharacteristicsAll assets and liabilities held in the trading book — therefore, subject to calculation of the market risk equivalent amount — are transactionswith high market liquidity. Securities and monetary claims are carried at the fiscal year-end market price, and derivatives such as swaps,futures and options are stated at amounts that would be settled if the transactions were terminated at the consolidated balance sheet date.
3. VaR Results (Trading Book)Billions of yen
Fiscal 2016 Fiscal 2015VaR Stressed VaR VaR Stressed VaR
Fiscal year-end ......................................................................... 3.0 4.5 1.7 1.9Maximum .................................................................................. 7.2 13.7 5.9 11.7Minimum ................................................................................... 2.6 4.2 1.2 1.8Average .................................................................................... 4.1 6.9 2.6 4.4
Notes: 1. The VaR results for a one-day holding period with a one-sided confidence interval of 99.0%, computed daily using the historical simulation method based on four years ofhistorical observations.
2. The stressed VaR is calculated on a daily basis by using the historical simulation method for the holding period of one day, one-sided confidence interval of 99.0%, andmeasurement period of 12 months (including the stress period).
3. Specific risks for the trading book are excluded.4. Principal consolidated subsidiaries are included.
■ Interest Rate Risk in Banking BookInterest rate risk in the banking book fluctuates significantly depending on the method of recognizing maturity of demand deposits (suchas current accounts and ordinary deposits from which funds can be withdrawn on demand) and the method of predicting early withdrawalfrom fixed-term deposits and prepayment of consumer loans. Key assumptions made by SMBC in measuring interest rate risk in the bankingbook are as follows.
1. Method of Recognizing Maturity of Demand DepositsThe total amount of demand deposits expected to remain with the bank for the long term (with 50% of the lowest balance during the past5 years as the upper limit) is recognized as a core deposit amount and interest rate risk is measured for each maturity with 5 years as themaximum term (the average is 2.5 years).
2. Method of Estimating Early Withdrawal from Fixed-term Deposits and Prepayment of Consumer LoansThe rate of early withdrawal from fixed-term deposits and the rate of prepayment of consumer loans are estimated and the rates are used tocalculate cash flows used for measuring interest rate risk.
3. VaR Results (Banking Book)Billions of yen
Fiscal 2016 Fiscal 2015Fiscal year-end ....................................................................................................................................... 47.4 34.0Maximum ................................................................................................................................................ 53.2 48.9Minimum ................................................................................................................................................. 40.2 23.5Average .................................................................................................................................................. 46.1 38.7
Notes: 1. The VaR results for a one-day holding period with a one-sided confidence interval of 99.0%, computed daily using the historical simulation method based on four years ofhistorical observations.
2. Principal consolidated subsidiaries are included.
Basel III Information
012_0800885852907.indd 239 2017/08/10 20:49:17
SMFG
240 2017 Annual Report
■ Operational Risk1. Operational Risk Equivalent Amount Calculation Methodology
SMFG adopted the Advanced Measurement Approach (AMA) for exposures as of March 31, 2008. The following consolidated subsidiarieshave also adopted the AMA, and the remaining consolidated subsidiaries have adopted the Basic Indicator Approach (BIA).
Sumitomo Mitsui Banking Corporation, Sumitomo Mitsui Card Company, Limited, The Japan Research Institute, Limited, SMBC Friend Securities Co., Ltd., Sumitomo Mitsui Finance and Leasing Co., Ltd., SMBC Finance Service Co., Ltd., Kansai Urban Banking Corporation, SMBC Guarantee Co., Ltd., THE MINATO BANK, LTD., SMBC Center Service Co., Ltd., SMBC Delivery Service Co., Ltd., SMBC Green Service Co., Ltd., SMBC International Business Co., Ltd., SMBC Loan Administration and Operations Service Co., Ltd., Sumitomo Mitsui Banking Corporation Europe Limited, Sumitomo Mitsui Banking Corporation (China) Limited, SMBC Nikko Securities Inc., Cedyna Financial Corporation and SMBC Consumer Finance Co., Ltd.
2. Outline of the AMAFor the “Outline of the AMA,” please refer to pages 86 to 88.
3. Usage of Insurance to Mitigate RiskSMFG had not taken measures to mitigate operational risk through insurance coverage for exposures.
Basel III Information
012_0800885852907.indd 240 2017/08/10 20:49:17
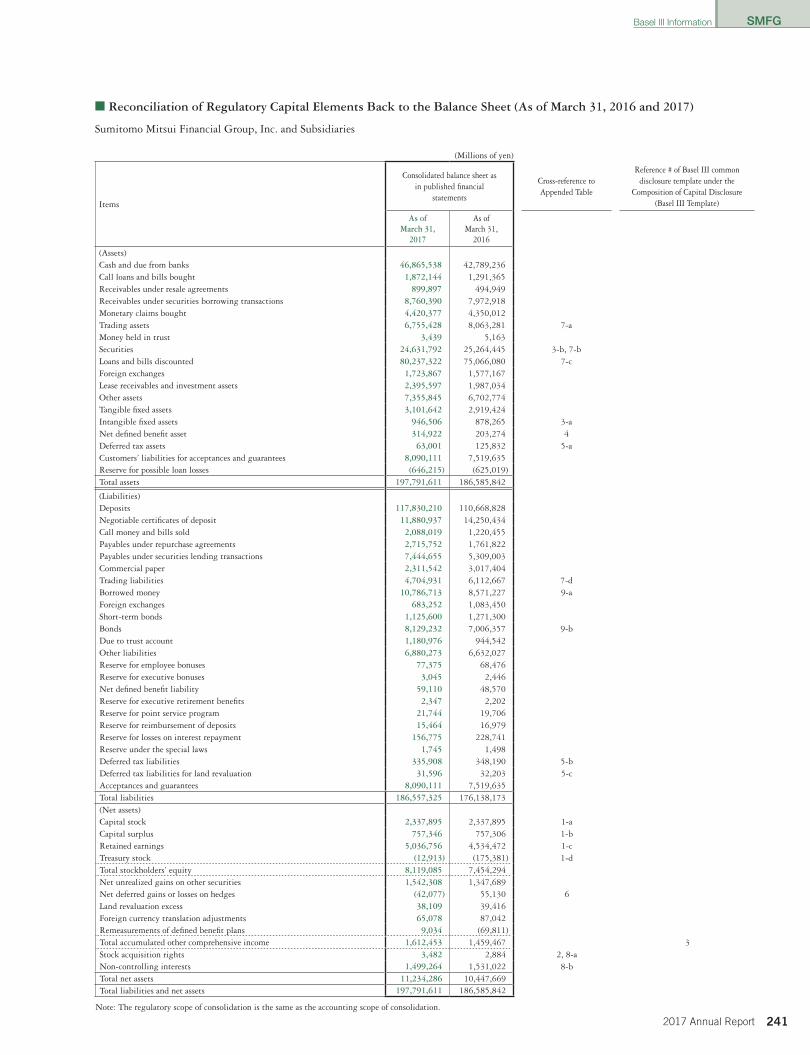
SMFG
2412017 Annual Report
■ Reconciliation of Regulatory Capital Elements Back to the Balance Sheet (As of March 31, 2016 and 2017)
Sumitomo Mitsui Financial Group, Inc. and Subsidiaries
(Millions of yen)
Items
Consolidated balance sheet as in published financial
statements
Cross-reference toAppended Table
Reference # of Basel III commondisclosure template under the
Composition of Capital Disclosure(Basel III Template)
As of March 31,
2017
As of March 31,
2016
(Assets)Cash and due from banks 46,865,538 42,789,236Call loans and bills bought 1,872,144 1,291,365Receivables under resale agreements 899,897 494,949Receivables under securities borrowing transactions 8,760,390 7,972,918Monetary claims bought 4,420,377 4,350,012Trading assets 6,755,428 8,063,281 7-aMoney held in trust 3,439 5,163Securities 24,631,792 25,264,445 3-b, 7-bLoans and bills discounted 80,237,322 75,066,080 7-cForeign exchanges 1,723,867 1,577,167Lease receivables and investment assets 2,395,597 1,987,034Other assets 7,355,845 6,702,774Tangible fixed assets 3,101,642 2,919,424Intangible fixed assets 946,506 878,265 3-aNet defined benefit asset 314,922 203,274 4Deferred tax assets 63,001 125,832 5-aCustomers’ liabilities for acceptances and guarantees 8,090,111 7,519,635Reserve for possible loan losses (646,215) (625,019)Total assets 197,791,611 186,585,842
(Liabilities)Deposits 117,830,210 110,668,828Negotiable certificates of deposit 11,880,937 14,250,434Call money and bills sold 2,088,019 1,220,455Payables under repurchase agreements 2,715,752 1,761,822Payables under securities lending transactions 7,444,655 5,309,003Commercial paper 2,311,542 3,017,404Trading liabilities 4,704,931 6,112,667 7-dBorrowed money 10,786,713 8,571,227 9-aForeign exchanges 683,252 1,083,450Short-term bonds 1,125,600 1,271,300Bonds 8,129,232 7,006,357 9-bDue to trust account 1,180,976 944,542Other liabilities 6,880,273 6,632,027Reserve for employee bonuses 77,375 68,476Reserve for executive bonuses 3,045 2,446Net defined benefit liability 59,110 48,570Reserve for executive retirement benefits 2,347 2,202Reserve for point service program 21,744 19,706Reserve for reimbursement of deposits 15,464 16,979Reserve for losses on interest repayment 156,775 228,741Reserve under the special laws 1,745 1,498Deferred tax liabilities 335,908 348,190 5-bDeferred tax liabilities for land revaluation 31,596 32,203 5-cAcceptances and guarantees 8,090,111 7,519,635Total liabilities 186,557,325 176,138,173(Net assets)Capital stock 2,337,895 2,337,895 1-aCapital surplus 757,346 757,306 1-bRetained earnings 5,036,756 4,534,472 1-cTreasury stock (12,913) (175,381) 1-dTotal stockholders’ equity 8,119,085 7,454,294Net unrealized gains on other securities 1,542,308 1,347,689Net deferred gains or losses on hedges (42,077) 55,130 6Land revaluation excess 38,109 39,416Foreign currency translation adjustments 65,078 87,042Remeasurements of defined benefit plans 9,034 (69,811)Total accumulated other comprehensive income 1,612,453 1,459,467 3Stock acquisition rights 3,482 2,884 2, 8-aNon-controlling interests 1,499,264 1,531,022 8-bTotal net assets 11,234,286 10,447,669Total liabilities and net assets 197,791,611 186,585,842
Note: The regulatory scope of consolidation is the same as the accounting scope of consolidation.
Basel III Information
012_0800885852907.indd 241 2017/08/10 20:49:17

SMFG
242 2017 Annual Report
(Appended Table)1. Stockholders’ equity(1) Consolidated balance sheet (Millions of yen)
Consolidated balance sheet items As of March31, 2017
As of March31, 2016 Remarks Ref. No.
Capital stock 2,337,895 2,337,895 1-a
Capital surplus 757,346 757,306 1-b
Retained earnings 5,036,756 4,534,472 1-c
Treasury stock (12,913) (175,381) 1-d
Total stockholders’ equity 8,119,085 7,454,294
(2) Composition of capital (Millions of yen)
Composition of capital disclosure As of March31, 2017
As of March31, 2016 Remarks
Basel III TemplateNo.
Directly issued qualifying common share capital plus related capital surplus and retained earnings
8,119,085 7,454,294Stockholders’ equity attributable to common shares (before adjusting national specific regulatory adjustments (earnings to be distributed))
of which: capital and capital surplus 3,095,242 3,095,202 1a
of which: retained earnings 5,036,756 4,534,472 2
of which: treasury stock (–) 12,913 175,381 1c
of which: other than the above — —
Directly issued qualifying Additional Tier 1 instruments plus related capital surplus of which: classified as equity under applicable accounting standards and the breakdown
— —Stockholders’ equity attributable to preferred shares with a loss absorbency clause upon entering into effectively bankruptcy
31a
2. Stock acquisition rights(1) Consolidated balance sheet (Millions of yen)
Consolidated balance sheet items As of March31, 2017
As of March31, 2016 Remarks Ref. No.
Stock acquisition rights 3,482 2,884 2
of which: Stock acquisition rights issued by bank holding company
3,206 2,635
(2) Composition of capital (Millions of yen)
Composition of capital disclosure As of March31, 2017
As of March31, 2016 Remarks
Basel III TemplateNo.
Stock acquisition rights to common shares 3,206 2,635 1b
Stock acquisition rights to Additional Tier 1 instruments — — 31b
Stock acquisition rights to Tier 2 instruments — — 46
3. Intangible assets(1) Consolidated balance sheet (Millions of yen)
Consolidated balance sheet items As of March31, 2017
As of March31, 2016 Remarks Ref. No.
Intangible fixed assets 946,506 878,265 3-a
Securities 24,631,792 25,264,445 3-b
of which: goodwill attributable to equity-method investees 33,029 46,540
Income taxes related to above 192,234 171,796
(2) Composition of capital (Millions of yen)
Composition of capital disclosure As of March31, 2017
As of March31, 2016 Remarks
Basel III TemplateNo.
Goodwill (including those equivalent) 343,523 372,622 8
Other intangible assets other than goodwill and mortgage servicing rights 443,777 380,386 Software and other 9
Mortgage servicing rights — —
Amount exceeding the 10% threshold on specified items — — 20
Amount exceeding the 15% threshold on specified items — — 24
Mortgage servicing rights that are below the thresholds for deduction (before risk weighting)
— — 74
4. Net defined benefit asset(1) Consolidated balance sheet (Millions of yen)
Consolidated balance sheet items As of March31, 2017
As of March31, 2016 Remarks Ref. No.
Net defined benefit asset 314,922 203,274 4
Income taxes related to above 96,187 61,615
Basel III Information
012_0800885852907.indd 242 2017/08/10 20:49:17

SMFG
2432017 Annual Report
(2) Composition of capital (Millions of yen)
Composition of capital disclosure As of March31, 2017
As of March31, 2016 Remarks
Basel III TemplateNo.
Net defined benefit asset 218,734 141,659 15
5. Deferred tax assets(1) Consolidated balance sheet (Millions of yen)
Consolidated balance sheet items As of March31, 2017
As of March31, 2016 Remarks Ref. No.
Deferred tax assets 63,001 125,832 5-a
Deferred tax liabilities 335,908 348,190 5-b
Deferred tax liabilities for land revaluation 31,596 32,203 5-c
Tax effects on other intangible assets 192,234 171,796
Tax effects on net defined benefit asset 96,187 61,615
(2) Composition of capital (Millions of yen)
Composition of capital disclosure As of March31, 2017
As of March31, 2016 Remarks
Basel III TemplateNo.
Deferred tax assets that rely on future profitability excluding those arising from temporary differences (net of related tax liability)
4,188 2,137This item does not agree with the amount reported on the consolidated balance sheet due to offsetting of assets and liabilities.
10
Deferred tax assets arising from temporary differences (net of related tax liability)
24,339 9,700This item does not agree with the amount reported on the consolidated balance sheet due to offsetting of assets and liabilities.
Amount exceeding the 10% threshold on specified items — — 21
Amount exceeding the 15% threshold on specified items — — 25
Deferred tax assets arising from temporary differences that are below the thresholds for deduction (before risk weighting)
24,339 9,700 75
6. Deferred gains or losses on derivatives under hedge accounting(1) Consolidated balance sheet (Millions of yen)
Consolidated balance sheet items As of March31, 2017
As of March31, 2016 Remarks Ref. No.
Net deferred gains or losses on hedges (42,077) 55,130 6
(2) Composition of capital (Millions of yen)
Composition of capital disclosure As of March31, 2017
As of March31, 2016 Remarks
Basel III TemplateNo.
Net deferred gains or losses on hedges (40,588) 57,131Excluding those items whose valuation differences arising from hedged items are recognized as “Accumulated other comprehensive income”
11
7. Items associated with investments in the capital of financial institutions(1) Consolidated balance sheet (Millions of yen)
Consolidated balance sheet items As of March31, 2017
As of March31, 2016 Remarks Ref. No.
Trading assets 6,755,428 8,063,281Including trading account securities and derivatives for trading assets
7-a
Securities 24,631,792 25,264,445 7-b
Loans and bills discounted 80,237,322 75,066,080 Including subordinated loans 7-c
Trading liabilities 4,704,931 6,112,667Including trading account securities sold and derivatives for trading liabilities
7-d
Basel III Information
012_0800885852907.indd 243 2017/08/10 20:49:17
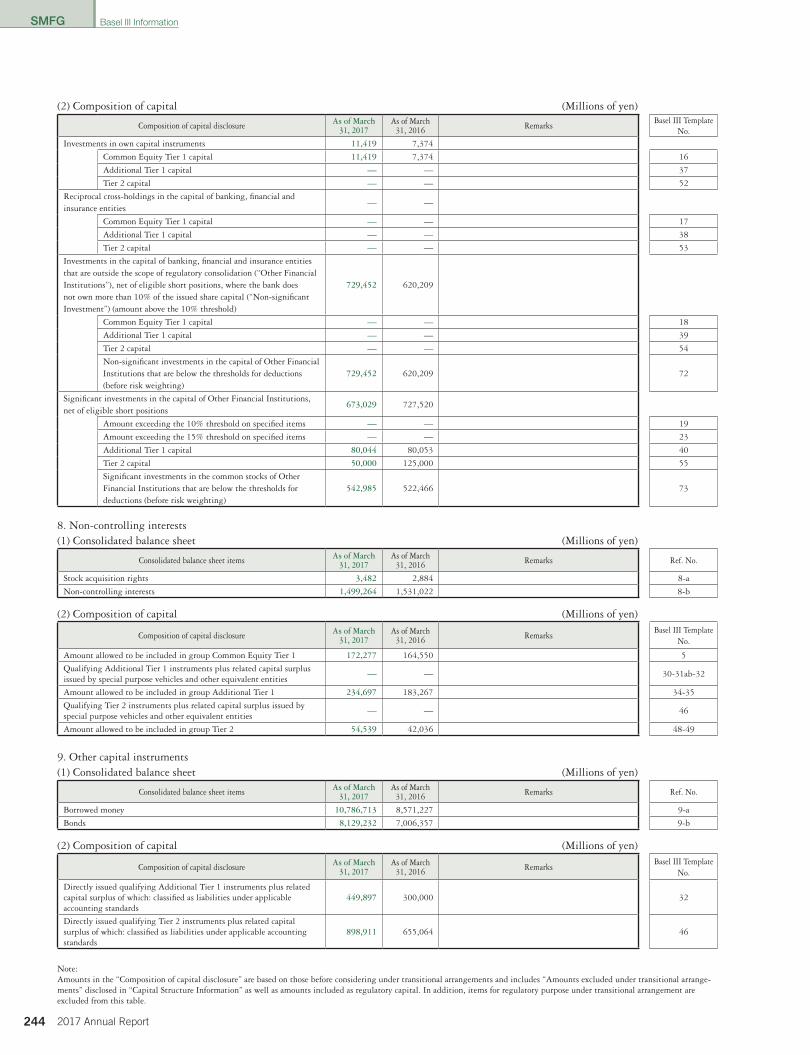
SMFG
244 2017 Annual Report
(2) Composition of capital (Millions of yen)
Composition of capital disclosure As of March31, 2017
As of March31, 2016 Remarks
Basel III TemplateNo.
Investments in own capital instruments 11,419 7,374
Common Equity Tier 1 capital 11,419 7,374 16
Additional Tier 1 capital — — 37
Tier 2 capital — — 52
Reciprocal cross-holdings in the capital of banking, financial and insurance entities
— —
Common Equity Tier 1 capital — — 17
Additional Tier 1 capital — — 38
Tier 2 capital — — 53
Investments in the capital of banking, financial and insurance entities that are outside the scope of regulatory consolidation (“Other Financial Institutions”), net of eligible short positions, where the bank does not own more than 10% of the issued share capital (“Non-significant Investment”) (amount above the 10% threshold)
729,452 620,209
Common Equity Tier 1 capital — — 18
Additional Tier 1 capital — — 39
Tier 2 capital — — 54
Non-significant investments in the capital of Other Financial Institutions that are below the thresholds for deductions (before risk weighting)
729,452 620,209 72
Significant investments in the capital of Other Financial Institutions, net of eligible short positions
673,029 727,520
Amount exceeding the 10% threshold on specified items — — 19
Amount exceeding the 15% threshold on specified items — — 23
Additional Tier 1 capital 80,044 80,053 40
Tier 2 capital 50,000 125,000 55
Significant investments in the common stocks of Other Financial Institutions that are below the thresholds for deductions (before risk weighting)
542,985 522,466 73
8. Non-controlling interests(1) Consolidated balance sheet (Millions of yen)
Consolidated balance sheet items As of March31, 2017
As of March31, 2016 Remarks Ref. No.
Stock acquisition rights 3,482 2,884 8-a
Non-controlling interests 1,499,264 1,531,022 8-b
(2) Composition of capital (Millions of yen)
Composition of capital disclosure As of March31, 2017
As of March31, 2016 Remarks
Basel III TemplateNo.
Amount allowed to be included in group Common Equity Tier 1 172,277 164,550 5
Qualifying Additional Tier 1 instruments plus related capital surplus issued by special purpose vehicles and other equivalent entities
— — 30-31ab-32
Amount allowed to be included in group Additional Tier 1 234,697 183,267 34-35
Qualifying Tier 2 instruments plus related capital surplus issued by special purpose vehicles and other equivalent entities
— — 46
Amount allowed to be included in group Tier 2 54,539 42,036 48-49
9. Other capital instruments(1) Consolidated balance sheet (Millions of yen)
Consolidated balance sheet items As of March31, 2017
As of March31, 2016 Remarks Ref. No.
Borrowed money 10,786,713 8,571,227 9-a
Bonds 8,129,232 7,006,357 9-b
(2) Composition of capital (Millions of yen)
Composition of capital disclosure As of March31, 2017
As of March31, 2016 Remarks
Basel III TemplateNo.
Directly issued qualifying Additional Tier 1 instruments plus related capital surplus of which: classified as liabilities under applicable accounting standards
449,897 300,000 32
Directly issued qualifying Tier 2 instruments plus related capital surplus of which: classified as liabilities under applicable accounting standards
898,911 655,064 46
Note:Amounts in the “Composition of capital disclosure” are based on those before considering under transitional arrangements and includes “Amounts excluded under transitional arrange-ments” disclosed in “Capital Structure Information” as well as amounts included as regulatory capital. In addition, items for regulatory purpose under transitional arrangement are excluded from this table.
Basel III Information
012_0800885852907.indd 244 2017/08/10 20:49:17
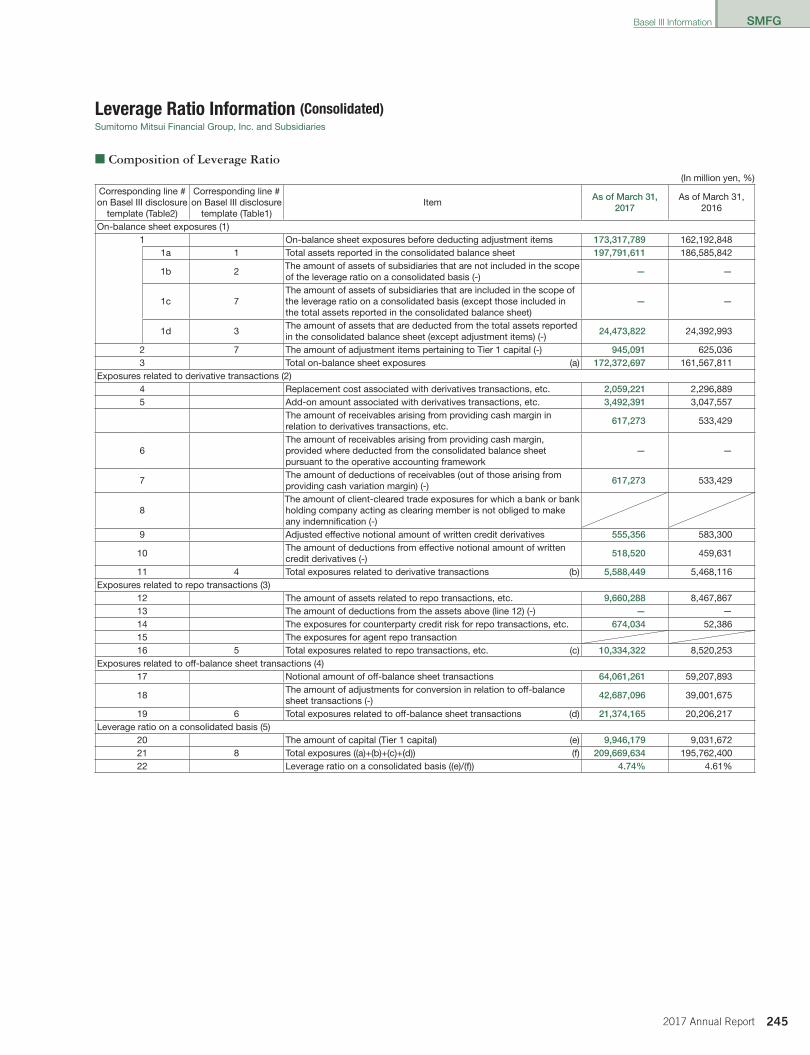
SMFG
2452017 Annual Report
■ Composition of Leverage Ratio(In million yen, %)
Corresponding line # on Basel III disclosure
template (Table2)
Corresponding line # on Basel III disclosure
template (Table1)Item
As of March 31,2017
As of March 31,2016
On-balance sheet exposures (1)1 On-balance sheet exposures before deducting adjustment items 173,317,789 162,192,848
1a 1 Total assets reported in the consolidated balance sheet 197,791,611 186,585,842
1b 2The amount of assets of subsidiaries that are not included in the scope of the leverage ratio on a consolidated basis (-)
— —
1c 7The amount of assets of subsidiaries that are included in the scope of the leverage ratio on a consolidated basis (except those included in the total assets reported in the consolidated balance sheet)
— —
1d 3The amount of assets that are deducted from the total assets reported in the consolidated balance sheet (except adjustment items) (-)
24,473,822 24,392,993
2 7 The amount of adjustment items pertaining to Tier 1 capital (-) 945,091 625,0363 Total on-balance sheet exposures (a) 172,372,697 161,567,811
Exposures related to derivative transactions (2)4 Replacement cost associated with derivatives transactions, etc. 2,059,221 2,296,8895 Add-on amount associated with derivatives transactions, etc. 3,492,391 3,047,557
The amount of receivables arising from providing cash margin in relation to derivatives transactions, etc.
617,273 533,429
6The amount of receivables arising from providing cash margin, provided where deducted from the consolidated balance sheet pursuant to the operative accounting framework
— —
7The amount of deductions of receivables (out of those arising from providing cash variation margin) (-)
617,273 533,429
8The amount of client-cleared trade exposures for which a bank or bank holding company acting as clearing member is not obliged to make any indemnification (-)
9 Adjusted effective notional amount of written credit derivatives 555,356 583,300
10The amount of deductions from effective notional amount of written credit derivatives (-)
518,520 459,631
11 4 Total exposures related to derivative transactions (b) 5,588,449 5,468,116Exposures related to repo transactions (3)
12 The amount of assets related to repo transactions, etc. 9,660,288 8,467,86713 The amount of deductions from the assets above (line 12) (-) — —14 The exposures for counterparty credit risk for repo transactions, etc. 674,034 52,38615 The exposures for agent repo transaction16 5 Total exposures related to repo transactions, etc. (c) 10,334,322 8,520,253
Exposures related to off-balance sheet transactions (4)17 Notional amount of off-balance sheet transactions 64,061,261 59,207,893
18The amount of adjustments for conversion in relation to off-balance sheet transactions (-)
42,687,096 39,001,675
19 6 Total exposures related to off-balance sheet transactions (d) 21,374,165 20,206,217Leverage ratio on a consolidated basis (5)
20 The amount of capital (Tier 1 capital) (e) 9,946,179 9,031,67221 8 Total exposures ((a)+(b)+(c)+(d)) (f) 209,669,634 195,762,40022 Leverage ratio on a consolidated basis ((e)/(f)) 4.74% 4.61%
Leverage Ratio Information (Consolidated)Sumitomo Mitsui Financial Group, Inc. and Subsidiaries
Basel III Information
012_0800885852907.indd 245 2017/08/10 20:49:17
SMFG
246 2017 Annual Report
Liquidity Coverage Ratio Information (Consolidated)
Since March 31, 2015, the “Liquidity Coverage Ratio” (hereinafter referred to as “LCR”), the liquidity regulation under the Basel III, has been introduced in Japan. In addition to the application of uniform international standards, SMFG calculates its consolidated LCR using the calculation formula stipulated in the “Criteria for Evaluating the Soundness of Liquidity Status Set Forth by a Bank Holding Company as a Benchmark for Judging the Soundness of Management of Itself and its Subsidiaries, etc., Based on the Provision of Article 52-25 of the Banking Act, and Which Are Also the Criteria to be Referred to for Judging the Soundness of Management in Banks” (Notification No. 62 issued by the Japanese Financial Services Agency in 2014; hereinafter referred to as the “LCR Notification”).
■ Disclosure of Qualitative Information about Liquidity Coverage Ratio1. Intra-period Changes in Consolidated LCR As described in the following page, the LCR has remained stable with no significant fluctuation since the introduction of the liquidity
regulation on March 31, 2015.
2. Assessment of Consolidated LCR The LCR Notification stipulates that the minimum requirement of LCR for 2017 is set at 80.0% and from 2018 onwards, the minimum
requirement of LCR is raised in increments of 10.0% in stages, reaching 100.0% in and after 2019 (see table below).
2015 2016 2017 2018 2019 onwards
The minimum requirement of LCR .............................................. 60.0% 70.0% 80.0% 90.0% 100.0%
LCR of consolidated SMFG exceeds the minimum requirements of LCR for 2017 (80.0%) and for 2019 onwards (100.0%), having no cause for concern. SMFG does not expect that the future LCR forecasts will differ significantly from the announced ratios. In addition, the actual LCR does not differ significantly from the initial forecast.
3. Composition of High-Quality Liquid Assets The high-quality liquid assets held by consolidated SMFG that are allowed to be included in the calculation of LCR include deposits with
central banks, highly-rated bonds and cash. As described in the following page, the amount of such high-quality liquid assets exceed the amount of net cash outflows. Meanwhile, currency denominations, categories and location, etc. of the high-quality liquid assets allowed to be included in the calculation have not shown any significant changes. In addition, in respect of major currencies (those of which the aggregate amount of liabilities denominated in a certain currency accounts for 5.0 % or more of SMFG’s total liabilities on the consolidated basis), there is no significant mismatch in currency denomination between the total amount of the high-quality liquid assets allowed to be included in the calculation and the amount of net cash outflows.
4. Other Information Concerning Consolidated LCR SMFG has not applied “special provisions concerning qualifying operational deposits” prescribed in Article 28 of the LCR Notification and
“increased liquidity needs related to market valuation changes on derivative or other transactions simulated through Scenario Approach” prescribed in Article 37 of the same Notification. Meanwhile, SMFG records “cash outflows related to small-sized consolidated subsidiaries,” etc. under “cash outflows based on other contracts” prescribed in Article 59 of the same Notification.
Sumitomo Mitsui Financial Group, Inc. and Subsidiaries
Basel III Information
012_0800885852907.indd 246 2017/08/10 20:49:17

SMFG
2472017 Annual Report
■ Disclosure of Quantitative Information about Liquidity Coverage Ratio (Consolidated) (In million yen, %, the number of data)
ItemCurrent Quarter(From 2017/1/1 To 2017/3/31)
Prior Quarter(From 2016/10/1 To 2016/12/31)
High-Quality Liquid Assets (1)1 Total high-quality liquid assets (HQLA) 52,634,794 50,521,312
Cash Outflows (2)TOTAL
UNWEIGHTEDVALUE
TOTALWEIGHTED
VALUE
TOTALUNWEIGHTED
VALUE
TOTALWEIGHTED
VALUE
2 Cash outflows related to unsecured retail funding 51,081,510 3,960,053 50,713,432 3,917,6993 of which, Stable deposits 16,411,266 492,520 16,496,462 495,0724 of which, Less stable deposits 34,670,244 3,467,533 34,216,969 3,422,6275 Cash outflows related to unsecured wholesale funding 59,937,087 30,901,940 58,105,137 30,204,6676 of which, Qualifying operational deposits — — — —
7 of which, Cash outflows related to unsecured wholesale funding other than qualifying operational deposits and debt securities 54,047,613 25,012,466 52,699,714 24,799,244
8 of which, Debt securities 5,889,474 5,889,474 5,405,423 5,405,4239 Cash outflows related to secured funding, etc. 87,369 103,995
10 Cash outflows related to derivative transactions, etc. funding programs, credit and liquidity facilities 20,450,871 7,000,844 19,619,913 6,411,493
11 of which, Cash outflows related to derivative transactions, etc. 1,400,265 1,400,265 1,283,472 1,283,47212 of which, Cash outflows related to funding programs 523,593 523,593 463,399 463,39913 of which, Cash outflows related to credit and liquidity facilities 18,527,013 5,076,986 17,873,042 4,664,62214 Cash outflows related to contractual funding obligations, etc. 9,203,530 6,535,976 8,147,945 5,432,36615 Cash outflows related to contingencies 68,466,084 1,236,892 67,480,804 1,225,83416 Total cash outflows 49,723,073 47,296,054
Cash Inflows (3)TOTAL
UNWEIGHTEDVALUE
TOTALWEIGHTED
VALUE
TOTALUNWEIGHTED
VALUE
TOTALWEIGHTED
VALUE
17 Cash inflows related to secured lending, etc. 5,583,352 420,934 4,570,709 297,61018 Cash inflows related to collection of loans, etc. 4,850,618 3,140,446 4,063,964 2,587,71319 Other cash inflows 3,743,563 2,013,511 4,060,759 2,143,18620 Total cash inflows 14,177,533 5,574,891 12,695,432 5,028,509
Consolidated Liquidity Coverage Ratio (4)21 Total HQLA allowed to be included in the calculation 52,634,794 50,521,31222 Net cash outflows 44,148,182 42,267,54523 Consolidated liquidity coverage ratio (LCR) 119.2% 119.5%24 The number of data used to calculate the average value 61 3
Notes: 1. The data after the introduction of the liquidity regulation on March 31, 2015 is available on SMFG’s website.(http://www.smfg.co.jp/english/investor/financial/basel_3.html)
2. For the current quarter (from January 1, 2017 to March 31, 2017), the average values are calculated based on daily data in accordance with Notification No. 7 issued by the Japanese Financial Services Agency in 2015. For attribute information on customers and some data on consolidated subsidiaries, etc., monthly or quarterly data is used.
■ Breakdown of High-Quality Liquid Assets (In million yen)
ItemCurrent Quarter(From 2017/1/1To 2017/3/31)
Prior Quarter(From 2016/10/1To 2016/12/31)
1 Cash and due from banks 44,521,425 41,140,9032 Securities 8,113,369 9,380,409
3 of which, government bonds, etc. 5,992,859 7,281,907
4 of which, municipal bonds, etc. 163,076 153,649
5 of which, other bonds 295,595 329,650
6 of which, stocks 1,661,839 1,615,203
7 Total high-quality liquid assets (HQLA) 52,634,794 50,521,312
Note: The above amounts are the amounts of high-quality liquid assets in accordance with the liquidity regulation under the Basel III and do not correspond to the financial amounts.The amounts stated are the amounts after multiplying factor in the liquidity regulation under the Basel III.
Basel III Information
012_0800885852907.indd 247 2017/08/10 20:49:17
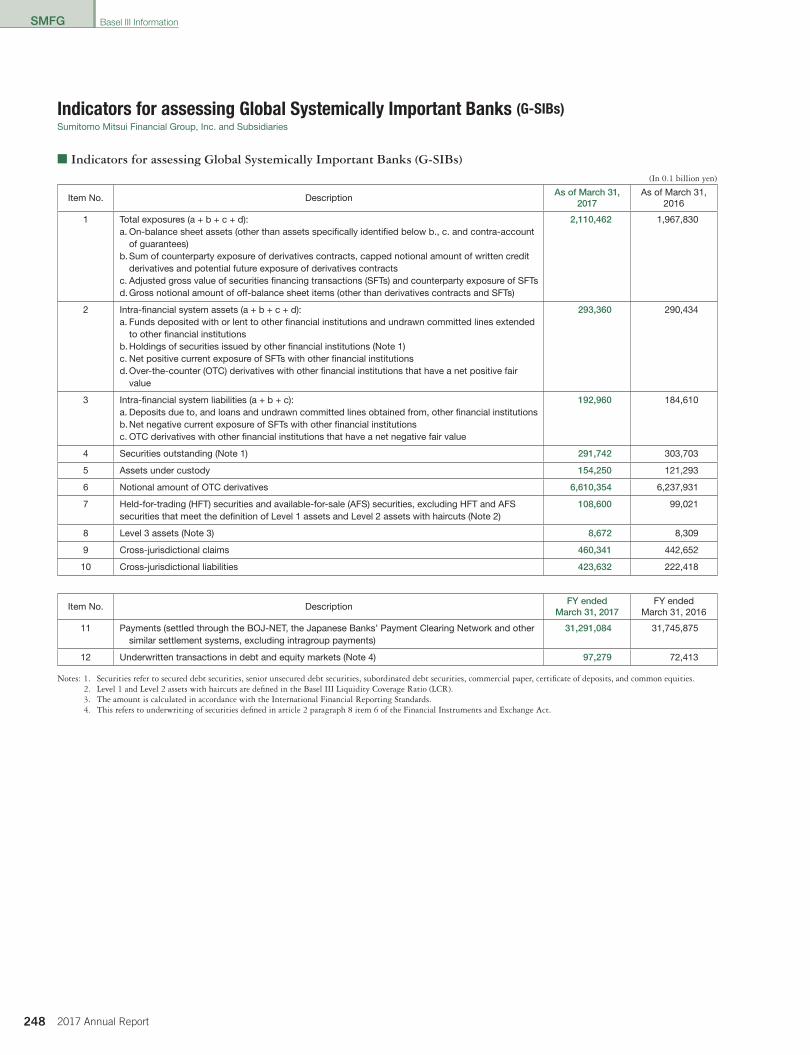
SMFG
248 2017 Annual Report
■ Indicators for assessing Global Systemically Important Banks (G-SIBs)(In 0.1 billion yen)
Item No. DescriptionAs of March 31,
2017As of March 31,
2016
1 Total exposures (a + b + c + d):a. On-balance sheet assets (other than assets specifically identified below b., c. and contra-account
of guarantees)b. Sum of counterparty exposure of derivatives contracts, capped notional amount of written credit
derivatives and potential future exposure of derivatives contractsc. Adjusted gross value of securities financing transactions (SFTs) and counterparty exposure of SFTsd. Gross notional amount of off-balance sheet items (other than derivatives contracts and SFTs)
2,110,462 1,967,830
2 Intra-financial system assets (a + b + c + d):a. Funds deposited with or lent to other financial institutions and undrawn committed lines extended
to other financial institutionsb. Holdings of securities issued by other financial institutions (Note 1)c. Net positive current exposure of SFTs with other financial institutionsd. Over-the-counter (OTC) derivatives with other financial institutions that have a net positive fair
value
293,360 290,434
3 Intra-financial system liabilities (a + b + c):a. Deposits due to, and loans and undrawn committed lines obtained from, other financial institutionsb. Net negative current exposure of SFTs with other financial institutionsc. OTC derivatives with other financial institutions that have a net negative fair value
192,960 184,610
4 Securities outstanding (Note 1) 291,742 303,703
5 Assets under custody 154,250 121,293
6 Notional amount of OTC derivatives 6,610,354 6,237,931
7 Held-for-trading (HFT) securities and available-for-sale (AFS) securities, excluding HFT and AFS securities that meet the definition of Level 1 assets and Level 2 assets with haircuts (Note 2)
108,600 99,021
8 Level 3 assets (Note 3) 8,672 8,309
9 Cross-jurisdictional claims 460,341 442,652
10 Cross-jurisdictional liabilities 423,632 222,418
Item No. DescriptionFY ended
March 31, 2017FY ended
March 31, 2016
11 Payments (settled through the BOJ-NET, the Japanese Banks’ Payment Clearing Network and other similar settlement systems, excluding intragroup payments)
31,291,084 31,745,875
12 Underwritten transactions in debt and equity markets (Note 4) 97,279 72,413
Notes: 1. Securities refer to secured debt securities, senior unsecured debt securities, subordinated debt securities, commercial paper, certificate of deposits, and common equities.2. Level 1 and Level 2 assets with haircuts are defined in the Basel III Liquidity Coverage Ratio (LCR).3. The amount is calculated in accordance with the International Financial Reporting Standards.4. This refers to underwriting of securities defined in article 2 paragraph 8 item 6 of the Financial Instruments and Exchange Act.
Indicators for assessing Global Systemically Important Banks (G-SIBs)Sumitomo Mitsui Financial Group, Inc. and Subsidiaries
Basel III Information
012_0800885852907.indd 248 2017/08/10 20:49:18

SMBC
2492017 Annual Report
Financial Highlights
Sumitomo Mitsui Banking Corporation
Consolidated
Millions of yen Year ended March 31 2017 2016 2015 2014 2013For the Year:
Ordinary income ����������������������������������������������������������� ¥ 3,014,455 ¥ 3,059,022 ¥ 3,199,409 ¥ 3,105,992 ¥ 2,810,681Ordinary profit �������������������������������������������������������������� 829,419 930,332 1,198,955 1,298,738 928,713Profit attributable to owners of parent ������������������������� 543,199 680,162 736,904 785,687 734,514Comprehensive income ����������������������������������������������� 687,157 143,086 1,937,374 1,174,292 1,373,623
At Year-End: Total net assets ������������������������������������������������������������ ¥ 8,908,192 ¥ 9,446,193 ¥ 10,036,003 ¥ 8,640,763 ¥ 8,257,091Total assets ������������������������������������������������������������������ 180,946,664 180,408,672 177,559,197 155,824,141 143,203,127Total capital ratio (International standard) �������������������� 17.77% 18�19% 17�93% 17�08% 16�84%Tier 1 capital ratio (International standard) ������������������ 14.61% 14�58% 13�91% 13�43% 12�69%Common equity Tier 1 capital ratio
(International standard) ���������������������������������������������� 12.89% 13�04% 12�61% 12�27% 11�26%Number of employees �������������������������������������������������� 45,963 54,192 50,249 48,824 47,852
Note: “Number of employees” has been reported on the basis of full-time workers. “Number of employees” includes locally hired overseas staff members but excludes contract employees and temporary staff.
Non-consolidated
Millions of yen Year ended March 31 2017 2016 2015 2014 2013For the Year:
Ordinary income ����������������������������������������������������������� ¥ 2,551,931 ¥ 2,277,812 ¥ 2,370,998 ¥ 2,342,582 ¥ 2,121,369Trust fees ����������������������������������������������������������������� 2,111 2,589 1,872 1,972 1,823
Gross banking profit (A) ����������������������������������������������� 1,663,654 1,534,271 1,634,284 1,558,184 1,540,095Expenses (excluding nonrecurring losses) (B) ������������� 816,942 805,483 791,211 745,745 727,736Overhead ratio (B) / (A) ������������������������������������������������� 49.1% 52�5% 48�4% 47�9% 47�3%Banking profit ��������������������������������������������������������������� 809,052 728,787 843,073 812,438 812,358Banking profit (before provision for general
reserve for possible loan losses) ����������������������������� 846,711 728,787 843,073 812,438 812,358Ordinary profit �������������������������������������������������������������� 864,022 747,892 955,992 952,516 670,852Net income ������������������������������������������������������������������� 681,767 609,171 643,015 605,255 617,791
At Year-End:Total net assets ������������������������������������������������������������ ¥ 7,417,182 ¥ 7,756,810 ¥ 7,998,715 ¥ 7,077,360 ¥ 6,554,446Total assets ������������������������������������������������������������������ 162,281,729 153,641,430 154,724,079 135,966,434 125,910,020Deposits ����������������������������������������������������������������������� 105,590,771 98,839,722 91,337,714 84,137,339 80,006,438Loans and bills discounted ������������������������������������������ 75,585,256 69,276,735 68,274,308 63,370,678 59,770,763Securities ��������������������������������������������������������������������� 24,342,369 25,602,156 29,985,267 27,317,549 41,347,000Trust assets and liabilities �������������������������������������������� 6,881,408 3,394,170 3,542,957 3,108,012 2,693,092
Loans and bills discounted �������������������������������������� 635,206 537,839 373,230 143,469 131,913Securities ����������������������������������������������������������������� 4,156,409 1,305,284 1,451,206 1,420,372 1,076,225
Capital stock ���������������������������������������������������������������� 1,770,996 1,770,996 1,770,996 1,770,996 1,770,996Number of shares issued (in thousands)
Common stock ���������������������������������������������������� 106,248 106,248 106,248 106,248 106,248Preferred stock ���������������������������������������������������� 70 70 70 70 70
Dividend payout ratio ��������������������������������������������������� 32.61% 67�02% 77�18% 75�92% 29�04%Total capital ratio (International standard) ������������������� 18.61% 19�47% 18�89% 18�30% 18�62%Tier 1 capital ratio (International standard) ������������������ 15.05% 15�29% 14�26% 14�02% 13�92%Common equity Tier 1 capital ratio
(International standard) �������������������������������������������� 13.15% 13�44% 12�80% 12�47% 11�75%Number of employees �������������������������������������������������� 29,283 28,002 26,416 22,915 22,569
Note: “Number of employees” has been reported on the basis of full-time workers. “Number of employees” includes locally hired overseas staff members but excludes contract employees, temporary staff, and executive officers who are not also Board members.
013_0800804262908.indd 249 2017/08/08 14:56:19
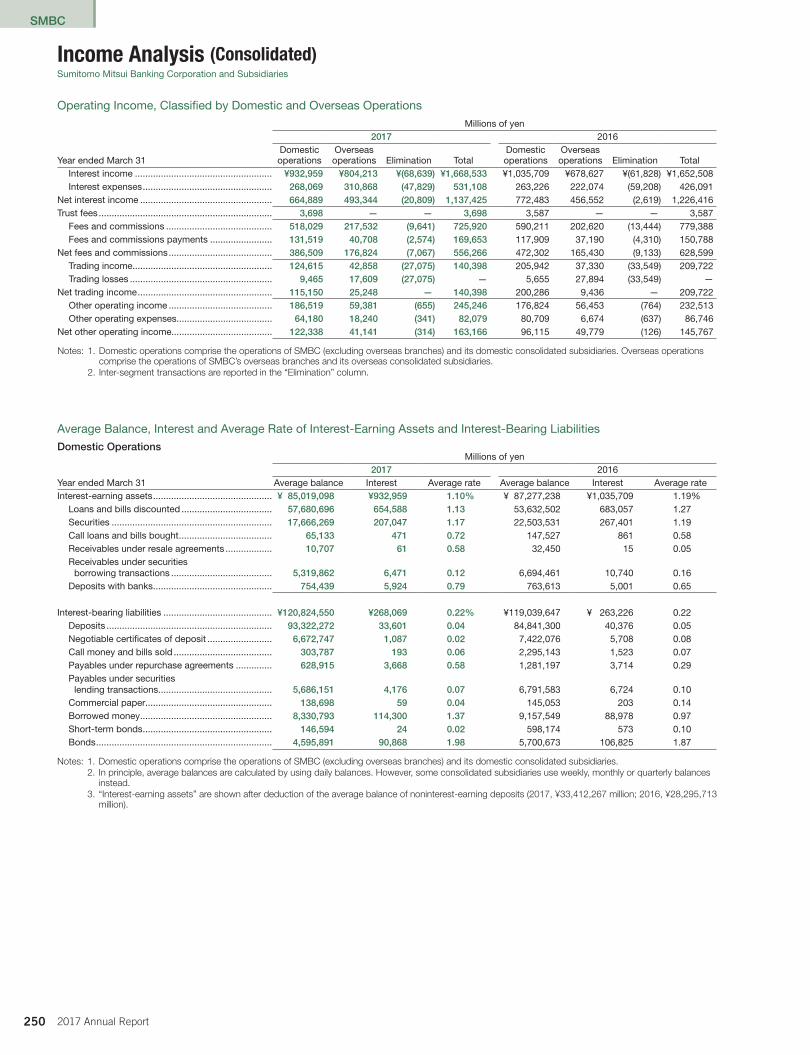
SMBC
250 2017 Annual Report
Income Analysis (Consolidated) Sumitomo Mitsui Banking Corporation and Subsidiaries
Operating Income, Classified by Domestic and Overseas OperationsMillions of yen
2017 2016
Year ended March 31Domesticoperations
Overseasoperations Elimination Total
Domesticoperations
Overseasoperations Elimination Total
Interest income ����������������������������������������������������� ¥932,959 ¥804,213 ¥(68,639) ¥1,668,533 ¥1,035,709 ¥678,627 ¥(61,828) ¥1,652,508Interest expenses �������������������������������������������������� 268,069 310,868 (47,829) 531,108 263,226 222,074 (59,208) 426,091
Net interest income ��������������������������������������������������� 664,889 493,344 (20,809) 1,137,425 772,483 456,552 (2,619) 1,226,416Trust fees ������������������������������������������������������������������� 3,698 — — 3,698 3,587 — — 3,587
Fees and commissions ����������������������������������������� 518,029 217,532 (9,641) 725,920 590,211 202,620 (13,444) 779,388Fees and commissions payments ������������������������ 131,519 40,708 (2,574) 169,653 117,909 37,190 (4,310) 150,788
Net fees and commissions ���������������������������������������� 386,509 176,824 (7,067) 556,266 472,302 165,430 (9,133) 628,599Trading income������������������������������������������������������ 124,615 42,858 (27,075) 140,398 205,942 37,330 (33,549) 209,722Trading losses ������������������������������������������������������� 9,465 17,609 (27,075) — 5,655 27,894 (33,549) —
Net trading income ���������������������������������������������������� 115,150 25,248 — 140,398 200,286 9,436 — 209,722Other operating income ���������������������������������������� 186,519 59,381 (655) 245,246 176,824 56,453 (764) 232,513Other operating expenses������������������������������������� 64,180 18,240 (341) 82,079 80,709 6,674 (637) 86,746
Net other operating income��������������������������������������� 122,338 41,141 (314) 163,166 96,115 49,779 (126) 145,767
Notes: 1. Domestic operations comprise the operations of SMBC (excluding overseas branches) and its domestic consolidated subsidiaries. Overseas operations comprise the operations of SMBC’s overseas branches and its overseas consolidated subsidiaries.
2. Inter-segment transactions are reported in the “Elimination” column.
Average Balance, Interest and Average Rate of Interest-Earning Assets and Interest-Bearing Liabilities
Domestic OperationsMillions of yen
2017 2016Year ended March 31 Average balance Interest Average rate Average balance Interest Average rateInterest-earning assets ���������������������������������������������� ¥ 85,019,098 ¥932,959 1.10% ¥ 87,277,238 ¥1,035,709 1�19%
Loans and bills discounted ����������������������������������� 57,680,696 654,588 1.13 53,632,502 683,057 1�27Securities �������������������������������������������������������������� 17,666,269 207,047 1.17 22,503,531 267,401 1�19Call loans and bills bought ������������������������������������ 65,133 471 0.72 147,527 861 0�58Receivables under resale agreements ������������������ 10,707 61 0.58 32,450 15 0�05Receivables under securities
borrowing transactions ��������������������������������������� 5,319,862 6,471 0.12 6,694,461 10,740 0�16Deposits with banks ���������������������������������������������� 754,439 5,924 0.79 763,613 5,001 0�65
Interest-bearing liabilities ������������������������������������������ ¥120,824,550 ¥268,069 0.22% ¥119,039,647 ¥ 263,226 0�22Deposits ���������������������������������������������������������������� 93,322,272 33,601 0.04 84,841,300 40,376 0�05Negotiable certificates of deposit ������������������������� 6,672,747 1,087 0.02 7,422,076 5,708 0�08Call money and bills sold �������������������������������������� 303,787 193 0.06 2,295,143 1,523 0�07Payables under repurchase agreements �������������� 628,915 3,668 0.58 1,281,197 3,714 0�29Payables under securities
lending transactions�������������������������������������������� 5,686,151 4,176 0.07 6,791,583 6,724 0�10Commercial paper������������������������������������������������� 138,698 59 0.04 145,053 203 0�14Borrowed money ��������������������������������������������������� 8,330,793 114,300 1.37 9,157,549 88,978 0�97Short-term bonds �������������������������������������������������� 146,594 24 0.02 598,174 573 0�10Bonds �������������������������������������������������������������������� 4,595,891 90,868 1.98 5,700,673 106,825 1�87
Notes: 1. Domestic operations comprise the operations of SMBC (excluding overseas branches) and its domestic consolidated subsidiaries.2. In principle, average balances are calculated by using daily balances. However, some consolidated subsidiaries use weekly, monthly or quarterly balances
instead.3. “Interest-earning assets” are shown after deduction of the average balance of noninterest-earning deposits (2017, ¥33,412,267 million; 2016, ¥28,295,713
million).
013_0800804262908.indd 250 2017/08/08 14:56:19
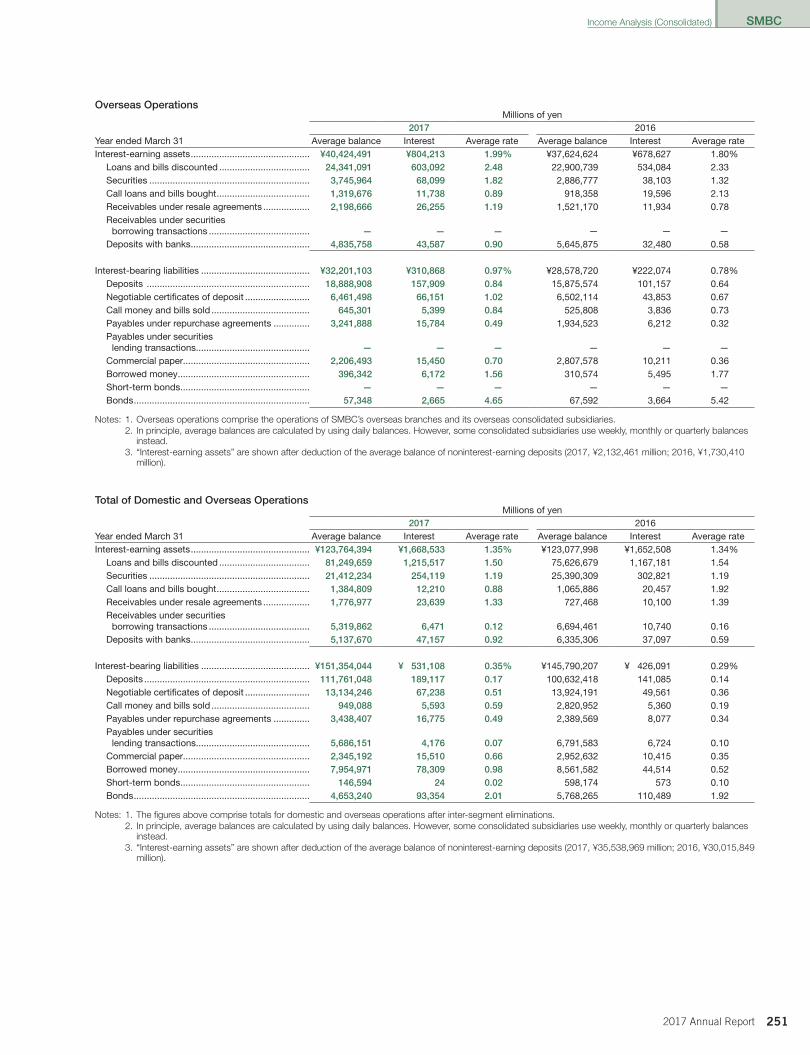
SMBC
2512017 Annual Report
Overseas OperationsMillions of yen
2017 2016Year ended March 31 Average balance Interest Average rate Average balance Interest Average rateInterest-earning assets ���������������������������������������������� ¥40,424,491 ¥804,213 1.99% ¥37,624,624 ¥678,627 1�80%
Loans and bills discounted ����������������������������������� 24,341,091 603,092 2.48 22,900,739 534,084 2�33Securities �������������������������������������������������������������� 3,745,964 68,099 1.82 2,886,777 38,103 1�32Call loans and bills bought ������������������������������������ 1,319,676 11,738 0.89 918,358 19,596 2�13Receivables under resale agreements ������������������ 2,198,666 26,255 1.19 1,521,170 11,934 0�78Receivables under securities
borrowing transactions ��������������������������������������� — — — — — —Deposits with banks ���������������������������������������������� 4,835,758 43,587 0.90 5,645,875 32,480 0�58
Interest-bearing liabilities ������������������������������������������ ¥32,201,103 ¥310,868 0.97% ¥28,578,720 ¥222,074 0�78%Deposits ��������������������������������������������������������������� 18,888,908 157,909 0.84 15,875,574 101,157 0�64Negotiable certificates of deposit ������������������������� 6,461,498 66,151 1.02 6,502,114 43,853 0�67Call money and bills sold �������������������������������������� 645,301 5,399 0.84 525,808 3,836 0�73Payables under repurchase agreements �������������� 3,241,888 15,784 0.49 1,934,523 6,212 0�32Payables under securities
lending transactions�������������������������������������������� — — — — — —Commercial paper������������������������������������������������� 2,206,493 15,450 0.70 2,807,578 10,211 0�36Borrowed money ��������������������������������������������������� 396,342 6,172 1.56 310,574 5,495 1�77Short-term bonds �������������������������������������������������� — — — — — —Bonds �������������������������������������������������������������������� 57,348 2,665 4.65 67,592 3,664 5�42
Notes: 1. Overseas operations comprise the operations of SMBC’s overseas branches and its overseas consolidated subsidiaries.2. In principle, average balances are calculated by using daily balances. However, some consolidated subsidiaries use weekly, monthly or quarterly balances
instead.3. “Interest-earning assets” are shown after deduction of the average balance of noninterest-earning deposits (2017, ¥2,132,461 million; 2016, ¥1,730,410
million).
Total of Domestic and Overseas OperationsMillions of yen
2017 2016Year ended March 31 Average balance Interest Average rate Average balance Interest Average rateInterest-earning assets ���������������������������������������������� ¥123,764,394 ¥1,668,533 1.35% ¥123,077,998 ¥1,652,508 1�34%
Loans and bills discounted ����������������������������������� 81,249,659 1,215,517 1.50 75,626,679 1,167,181 1�54Securities �������������������������������������������������������������� 21,412,234 254,119 1.19 25,390,309 302,821 1�19Call loans and bills bought ������������������������������������ 1,384,809 12,210 0.88 1,065,886 20,457 1�92Receivables under resale agreements ������������������ 1,776,977 23,639 1.33 727,468 10,100 1�39Receivables under securities
borrowing transactions ��������������������������������������� 5,319,862 6,471 0.12 6,694,461 10,740 0�16Deposits with banks ���������������������������������������������� 5,137,670 47,157 0.92 6,335,306 37,097 0�59
Interest-bearing liabilities ������������������������������������������ ¥151,354,044 ¥ 531,108 0.35% ¥145,790,207 ¥ 426,091 0�29%Deposits ���������������������������������������������������������������� 111,761,048 189,117 0.17 100,632,418 141,085 0�14Negotiable certificates of deposit ������������������������� 13,134,246 67,238 0.51 13,924,191 49,561 0�36Call money and bills sold �������������������������������������� 949,088 5,593 0.59 2,820,952 5,360 0�19Payables under repurchase agreements �������������� 3,438,407 16,775 0.49 2,389,569 8,077 0�34Payables under securities
lending transactions�������������������������������������������� 5,686,151 4,176 0.07 6,791,583 6,724 0�10Commercial paper������������������������������������������������� 2,345,192 15,510 0.66 2,952,632 10,415 0�35Borrowed money ��������������������������������������������������� 7,954,971 78,309 0.98 8,561,582 44,514 0�52Short-term bonds �������������������������������������������������� 146,594 24 0.02 598,174 573 0�10Bonds �������������������������������������������������������������������� 4,653,240 93,354 2.01 5,768,265 110,489 1�92
Notes: 1. The figures above comprise totals for domestic and overseas operations after inter-segment eliminations.2. In principle, average balances are calculated by using daily balances. However, some consolidated subsidiaries use weekly, monthly or quarterly balances
instead.3. “Interest-earning assets” are shown after deduction of the average balance of noninterest-earning deposits (2017, ¥35,538,969 million; 2016, ¥30,015,849
million).
Income Analysis (Consolidated)
013_0800804262908.indd 251 2017/08/08 14:56:19
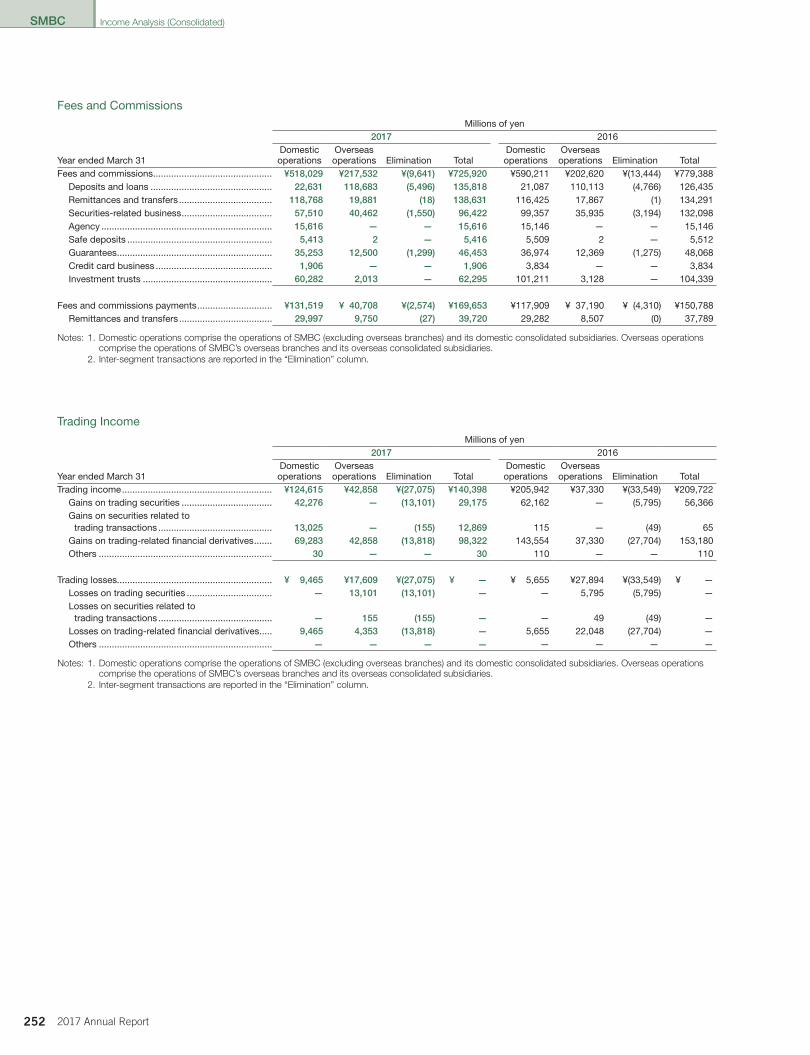
SMBC
252 2017 Annual Report
Fees and CommissionsMillions of yen
2017 2016
Year ended March 31Domesticoperations
Overseasoperations Elimination Total
Domesticoperations
Overseasoperations Elimination Total
Fees and commissions ���������������������������������������������� ¥518,029 ¥217,532 ¥(9,641) ¥725,920 ¥590,211 ¥202,620 ¥(13,444) ¥779,388Deposits and loans ����������������������������������������������� 22,631 118,683 (5,496) 135,818 21,087 110,113 (4,766) 126,435Remittances and transfers ������������������������������������ 118,768 19,881 (18) 138,631 116,425 17,867 (1) 134,291Securities-related business ����������������������������������� 57,510 40,462 (1,550) 96,422 99,357 35,935 (3,194) 132,098Agency ������������������������������������������������������������������ 15,616 — — 15,616 15,146 — — 15,146Safe deposits �������������������������������������������������������� 5,413 2 — 5,416 5,509 2 — 5,512Guarantees ������������������������������������������������������������ 35,253 12,500 (1,299) 46,453 36,974 12,369 (1,275) 48,068Credit card business ��������������������������������������������� 1,906 — — 1,906 3,834 — — 3,834Investment trusts �������������������������������������������������� 60,282 2,013 — 62,295 101,211 3,128 — 104,339
Fees and commissions payments ����������������������������� ¥131,519 ¥ 40,708 ¥(2,574) ¥169,653 ¥117,909 ¥ 37,190 ¥ (4,310) ¥150,788Remittances and transfers ������������������������������������ 29,997 9,750 (27) 39,720 29,282 8,507 (0) 37,789
Notes: 1. Domestic operations comprise the operations of SMBC (excluding overseas branches) and its domestic consolidated subsidiaries. Overseas operations comprise the operations of SMBC’s overseas branches and its overseas consolidated subsidiaries.
2. Inter-segment transactions are reported in the “Elimination” column.
Trading IncomeMillions of yen
2017 2016
Year ended March 31Domesticoperations
Overseasoperations Elimination Total
Domesticoperations
Overseasoperations Elimination Total
Trading income ���������������������������������������������������������� ¥124,615 ¥42,858 ¥(27,075) ¥140,398 ¥205,942 ¥37,330 ¥(33,549) ¥209,722Gains on trading securities ����������������������������������� 42,276 — (13,101) 29,175 62,162 — (5,795) 56,366Gains on securities related to
trading transactions �������������������������������������������� 13,025 — (155) 12,869 115 — (49) 65Gains on trading-related financial derivatives ������� 69,283 42,858 (13,818) 98,322 143,554 37,330 (27,704) 153,180Others ������������������������������������������������������������������� 30 — — 30 110 — — 110
Trading losses������������������������������������������������������������ ¥ 9,465 ¥17,609 ¥(27,075) ¥ — ¥ 5,655 ¥27,894 ¥(33,549) ¥ —Losses on trading securities ��������������������������������� — 13,101 (13,101) — — 5,795 (5,795) —Losses on securities related to
trading transactions �������������������������������������������� — 155 (155) — — 49 (49) —Losses on trading-related financial derivatives ����� 9,465 4,353 (13,818) — 5,655 22,048 (27,704) —Others ������������������������������������������������������������������� — — — — — — — —
Notes: 1. Domestic operations comprise the operations of SMBC (excluding overseas branches) and its domestic consolidated subsidiaries. Overseas operations comprise the operations of SMBC’s overseas branches and its overseas consolidated subsidiaries.
2. Inter-segment transactions are reported in the “Elimination” column.
Income Analysis (Consolidated)
013_0800804262908.indd 252 2017/08/08 14:56:20
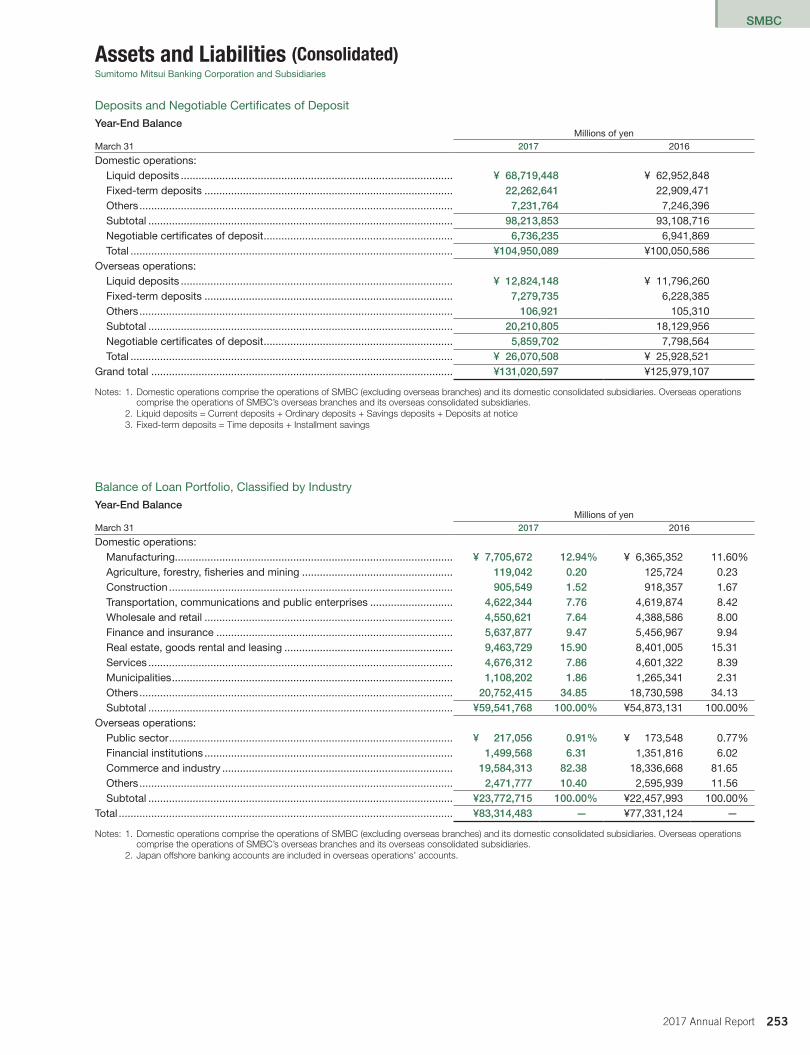
SMBC
2532017 Annual Report
Assets and Liabilities (Consolidated)Sumitomo Mitsui Banking Corporation and Subsidiaries
Deposits and Negotiable Certificates of Deposit
Year-End BalanceMillions of yen
March 31 2017 2016
Domestic operations:Liquid deposits �������������������������������������������������������������������������������������������� ¥ 68,719,448 ¥ 62,952,848Fixed-term deposits ������������������������������������������������������������������������������������ 22,262,641 22,909,471Others ���������������������������������������������������������������������������������������������������������� 7,231,764 7,246,396Subtotal ������������������������������������������������������������������������������������������������������� 98,213,853 93,108,716Negotiable certificates of deposit ���������������������������������������������������������������� 6,736,235 6,941,869Total ������������������������������������������������������������������������������������������������������������� ¥104,950,089 ¥100,050,586
Overseas operations:Liquid deposits �������������������������������������������������������������������������������������������� ¥ 12,824,148 ¥ 11,796,260Fixed-term deposits ������������������������������������������������������������������������������������ 7,279,735 6,228,385Others ���������������������������������������������������������������������������������������������������������� 106,921 105,310Subtotal ������������������������������������������������������������������������������������������������������� 20,210,805 18,129,956Negotiable certificates of deposit ���������������������������������������������������������������� 5,859,702 7,798,564Total ������������������������������������������������������������������������������������������������������������� ¥ 26,070,508 ¥ 25,928,521
Grand total ������������������������������������������������������������������������������������������������������ ¥131,020,597 ¥125,979,107
Notes: 1. Domestic operations comprise the operations of SMBC (excluding overseas branches) and its domestic consolidated subsidiaries. Overseas operations comprise the operations of SMBC’s overseas branches and its overseas consolidated subsidiaries.
2. Liquid deposits = Current deposits + Ordinary deposits + Savings deposits + Deposits at notice3. Fixed-term deposits = Time deposits + Installment savings
Balance of Loan Portfolio, Classified by Industry
Year-End BalanceMillions of yen
March 31 2017 2016
Domestic operations:Manufacturing���������������������������������������������������������������������������������������������� ¥ 7,705,672 12.94% ¥ 6,365,352 11�60%Agriculture, forestry, fisheries and mining ��������������������������������������������������� 119,042 0.20 125,724 0�23Construction ������������������������������������������������������������������������������������������������ 905,549 1.52 918,357 1�67Transportation, communications and public enterprises ���������������������������� 4,622,344 7.76 4,619,874 8�42Wholesale and retail ������������������������������������������������������������������������������������ 4,550,621 7.64 4,388,586 8�00Finance and insurance �������������������������������������������������������������������������������� 5,637,877 9.47 5,456,967 9�94Real estate, goods rental and leasing ��������������������������������������������������������� 9,463,729 15.90 8,401,005 15�31Services ������������������������������������������������������������������������������������������������������� 4,676,312 7.86 4,601,322 8�39Municipalities ����������������������������������������������������������������������������������������������� 1,108,202 1.86 1,265,341 2�31Others ���������������������������������������������������������������������������������������������������������� 20,752,415 34.85 18,730,598 34�13Subtotal ������������������������������������������������������������������������������������������������������� ¥59,541,768 100.00% ¥54,873,131 100�00%
Overseas operations:Public sector ������������������������������������������������������������������������������������������������ ¥ 217,056 0.91% ¥ 173,548 0�77%Financial institutions ������������������������������������������������������������������������������������ 1,499,568 6.31 1,351,816 6�02Commerce and industry ������������������������������������������������������������������������������ 19,584,313 82.38 18,336,668 81�65Others ���������������������������������������������������������������������������������������������������������� 2,471,777 10.40 2,595,939 11�56Subtotal ������������������������������������������������������������������������������������������������������� ¥23,772,715 100.00% ¥22,457,993 100�00%
Total ����������������������������������������������������������������������������������������������������������������� ¥83,314,483 — ¥77,331,124 —
Notes: 1. Domestic operations comprise the operations of SMBC (excluding overseas branches) and its domestic consolidated subsidiaries. Overseas operations comprise the operations of SMBC’s overseas branches and its overseas consolidated subsidiaries.
2. Japan offshore banking accounts are included in overseas operations’ accounts.
013_0800804262908.indd 253 2017/08/08 14:56:20
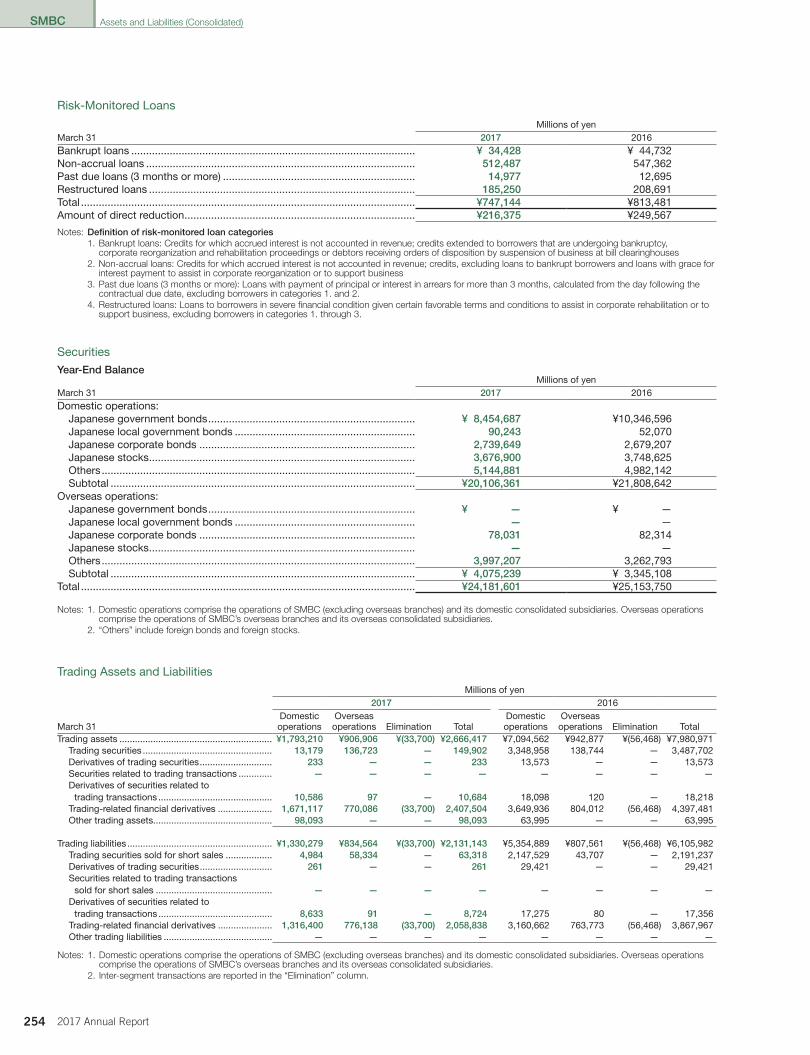
SMBC
254 2017 Annual Report
Risk-Monitored Loans
Millions of yen March 31 2017 2016Bankrupt loans ������������������������������������������������������������������������������������������������ ¥ 34,428 ¥ 44,732Non-accrual loans ������������������������������������������������������������������������������������������� 512,487 547,362Past due loans (3 months or more) ����������������������������������������������������������������� 14,977 12,695Restructured loans ������������������������������������������������������������������������������������������ 185,250 208,691Total ����������������������������������������������������������������������������������������������������������������� ¥747,144 ¥813,481Amount of direct reduction ������������������������������������������������������������������������������ ¥216,375 ¥249,567
Notes: Definition of risk-monitored loan categories1. Bankrupt loans: Credits for which accrued interest is not accounted in revenue; credits extended to borrowers that are undergoing bankruptcy,
corporate reorganization and rehabilitation proceedings or debtors receiving orders of disposition by suspension of business at bill clearinghouses2. Non-accrual loans: Credits for which accrued interest is not accounted in revenue; credits, excluding loans to bankrupt borrowers and loans with grace for
interest payment to assist in corporate reorganization or to support business3. Past due loans (3 months or more): Loans with payment of principal or interest in arrears for more than 3 months, calculated from the day following the
contractual due date, excluding borrowers in categories 1. and 2.4. Restructured loans: Loans to borrowers in severe financial condition given certain favorable terms and conditions to assist in corporate rehabilitation or to
support business, excluding borrowers in categories 1. through 3.
Securities
Year-End BalanceMillions of yen
March 31 2017 2016Domestic operations:
Japanese government bonds ���������������������������������������������������������������������� ¥ 8,454,687 ¥10,346,596Japanese local government bonds ������������������������������������������������������������� 90,243 52,070Japanese corporate bonds ������������������������������������������������������������������������� 2,739,649 2,679,207Japanese stocks ������������������������������������������������������������������������������������������ 3,676,900 3,748,625Others ���������������������������������������������������������������������������������������������������������� 5,144,881 4,982,142Subtotal ������������������������������������������������������������������������������������������������������� ¥20,106,361 ¥21,808,642
Overseas operations:Japanese government bonds ���������������������������������������������������������������������� ¥ — ¥ —Japanese local government bonds ������������������������������������������������������������� — —Japanese corporate bonds ������������������������������������������������������������������������� 78,031 82,314Japanese stocks ������������������������������������������������������������������������������������������ — —Others ���������������������������������������������������������������������������������������������������������� 3,997,207 3,262,793Subtotal ������������������������������������������������������������������������������������������������������� ¥ 4,075,239 ¥ 3,345,108
Total ����������������������������������������������������������������������������������������������������������������� ¥24,181,601 ¥25,153,750
Notes: 1. Domestic operations comprise the operations of SMBC (excluding overseas branches) and its domestic consolidated subsidiaries. Overseas operations comprise the operations of SMBC’s overseas branches and its overseas consolidated subsidiaries.
2. “Others” include foreign bonds and foreign stocks.
Trading Assets and LiabilitiesMillions of yen
2017 2016
March 31Domesticoperations
Overseasoperations Elimination Total
Domesticoperations
Overseasoperations Elimination Total
Trading assets ����������������������������������������������������������� ¥1,793,210 ¥906,906 ¥(33,700) ¥2,666,417 ¥7,094,562 ¥942,877 ¥(56,468) ¥7,980,971Trading securities �������������������������������������������������� 13,179 136,723 — 149,902 3,348,958 138,744 — 3,487,702Derivatives of trading securities ���������������������������� 233 — — 233 13,573 — — 13,573Securities related to trading transactions ������������� — — — — — — — —Derivatives of securities related to
trading transactions �������������������������������������������� 10,586 97 — 10,684 18,098 120 — 18,218Trading-related financial derivatives ��������������������� 1,671,117 770,086 (33,700) 2,407,504 3,649,936 804,012 (56,468) 4,397,481Other trading assets���������������������������������������������� 98,093 — — 98,093 63,995 — — 63,995
Trading liabilities �������������������������������������������������������� ¥1,330,279 ¥834,564 ¥(33,700) ¥2,131,143 ¥5,354,889 ¥807,561 ¥(56,468) ¥6,105,982Trading securities sold for short sales ������������������ 4,984 58,334 — 63,318 2,147,529 43,707 — 2,191,237Derivatives of trading securities ���������������������������� 261 — — 261 29,421 — — 29,421Securities related to trading transactions
sold for short sales ��������������������������������������������� — — — — — — — —Derivatives of securities related to
trading transactions �������������������������������������������� 8,633 91 — 8,724 17,275 80 — 17,356Trading-related financial derivatives ��������������������� 1,316,400 776,138 (33,700) 2,058,838 3,160,662 763,773 (56,468) 3,867,967Other trading liabilities ������������������������������������������ — — — — — — — —
Notes: 1. Domestic operations comprise the operations of SMBC (excluding overseas branches) and its domestic consolidated subsidiaries. Overseas operations comprise the operations of SMBC’s overseas branches and its overseas consolidated subsidiaries.
2. Inter-segment transactions are reported in the “Elimination” column.
Assets and Liabilities (Consolidated)
013_0800804262908.indd 254 2017/08/08 14:56:20
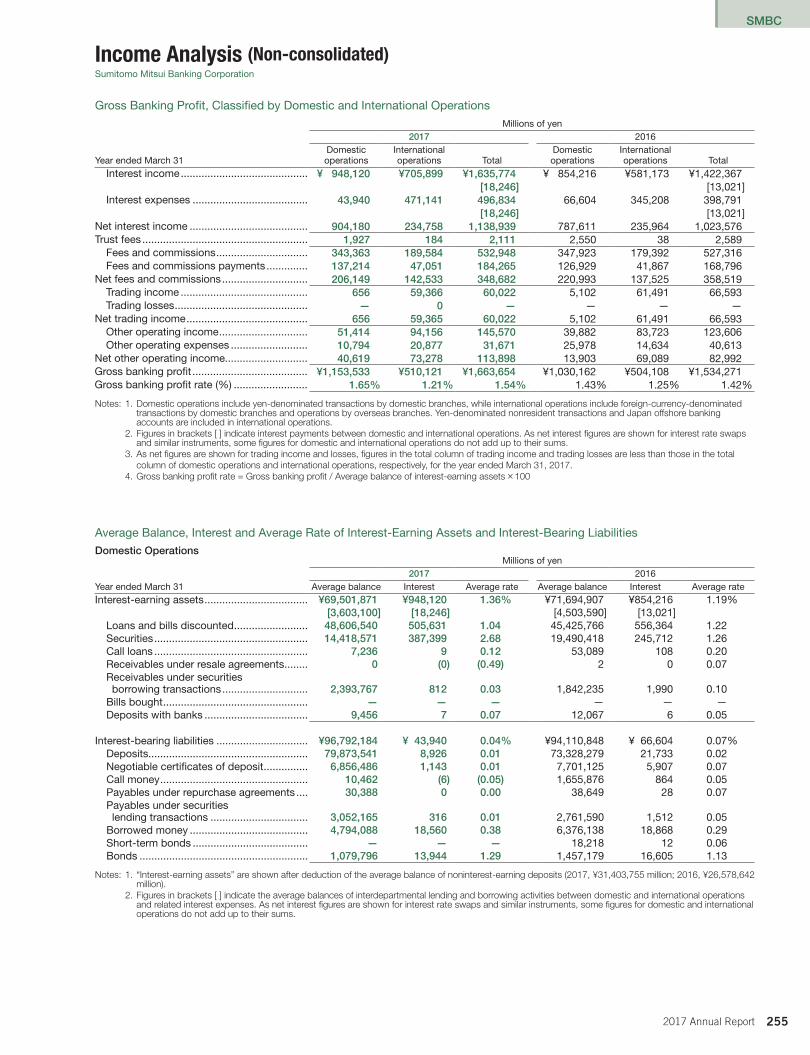
SMBC
2552017 Annual Report
Income Analysis (Non-consolidated)Sumitomo Mitsui Banking Corporation
Gross Banking Profit, Classified by Domestic and International OperationsMillions of yen
2017 2016
Year ended March 31Domesticoperations
Internationaloperations Total
Domesticoperations
Internationaloperations Total
Interest income ������������������������������������������� ¥ 948,120 ¥705,899 ¥1,635,774 ¥ 854,216 ¥581,173 ¥1,422,367[18,246] [13,021]
Interest expenses ��������������������������������������� 43,940 471,141 496,834 66,604 345,208 398,791[18,246] [13,021]
Net interest income ���������������������������������������� 904,180 234,758 1,138,939 787,611 235,964 1,023,576Trust fees �������������������������������������������������������� 1,927 184 2,111 2,550 38 2,589
Fees and commissions ������������������������������� 343,363 189,584 532,948 347,923 179,392 527,316Fees and commissions payments �������������� 137,214 47,051 184,265 126,929 41,867 168,796
Net fees and commissions ����������������������������� 206,149 142,533 348,682 220,993 137,525 358,519Trading income ������������������������������������������� 656 59,366 60,022 5,102 61,491 66,593Trading losses ��������������������������������������������� — 0 — — — —
Net trading income ����������������������������������������� 656 59,365 60,022 5,102 61,491 66,593Other operating income ������������������������������ 51,414 94,156 145,570 39,882 83,723 123,606Other operating expenses �������������������������� 10,794 20,877 31,671 25,978 14,634 40,613
Net other operating income���������������������������� 40,619 73,278 113,898 13,903 69,089 82,992Gross banking profit ��������������������������������������� ¥1,153,533 ¥510,121 ¥1,663,654 ¥1,030,162 ¥504,108 ¥1,534,271Gross banking profit rate (%) ������������������������� 1.65% 1.21% 1.54% 1�43% 1�25% 1�42%
Notes: 1. Domestic operations include yen-denominated transactions by domestic branches, while international operations include foreign-currency-denominated transactions by domestic branches and operations by overseas branches. Yen-denominated nonresident transactions and Japan offshore banking accounts are included in international operations.
2. Figures in brackets [ ] indicate interest payments between domestic and international operations. As net interest figures are shown for interest rate swaps and similar instruments, some figures for domestic and international operations do not add up to their sums.
3. As net figures are shown for trading income and losses, figures in the total column of trading income and trading losses are less than those in the total column of domestic operations and international operations, respectively, for the year ended March 31, 2017.
4. Gross banking profit rate = Gross banking profit / Average balance of interest-earning assets ✕ 100
Average Balance, Interest and Average Rate of Interest-Earning Assets and Interest-Bearing Liabilities
Domestic OperationsMillions of yen
2017 2016Year ended March 31 Average balance Interest Average rate Average balance Interest Average rateInterest-earning assets ����������������������������������� ¥69,501,871 ¥948,120 1.36% ¥71,694,907 ¥854,216 1�19%
[3,603,100] [18,246] [4,503,590] [13,021]Loans and bills discounted ������������������������� 48,606,540 505,631 1.04 45,425,766 556,364 1�22Securities ���������������������������������������������������� 14,418,571 387,399 2.68 19,490,418 245,712 1�26Call loans ���������������������������������������������������� 7,236 9 0.12 53,089 108 0�20Receivables under resale agreements �������� 0 (0) (0.49) 2 0 0�07Receivables under securities borrowing transactions ����������������������������� 2,393,767 812 0.03 1,842,235 1,990 0�10
Bills bought ������������������������������������������������� — — — — — —Deposits with banks ����������������������������������� 9,456 7 0.07 12,067 6 0�05
Interest-bearing liabilities ������������������������������� ¥96,792,184 ¥ 43,940 0.04% ¥94,110,848 ¥ 66,604 0�07%Deposits������������������������������������������������������ 79,873,541 8,926 0.01 73,328,279 21,733 0�02Negotiable certificates of deposit ��������������� 6,856,486 1,143 0.01 7,701,125 5,907 0�07Call money �������������������������������������������������� 10,462 (6) (0.05) 1,655,876 864 0�05Payables under repurchase agreements ���� 30,388 0 0.00 38,649 28 0�07Payables under securities lending transactions ��������������������������������� 3,052,165 316 0.01 2,761,590 1,512 0�05
Borrowed money ���������������������������������������� 4,794,088 18,560 0.38 6,376,138 18,868 0�29Short-term bonds ��������������������������������������� — — — 18,218 12 0�06Bonds ��������������������������������������������������������� 1,079,796 13,944 1.29 1,457,179 16,605 1�13
Notes: 1. “Interest-earning assets” are shown after deduction of the average balance of noninterest-earning deposits (2017, ¥31,403,755 million; 2016, ¥26,578,642 million).
2. Figures in brackets [ ] indicate the average balances of interdepartmental lending and borrowing activities between domestic and international operations and related interest expenses. As net interest figures are shown for interest rate swaps and similar instruments, some figures for domestic and international operations do not add up to their sums.
013_0800804262908.indd 255 2017/08/08 14:56:20
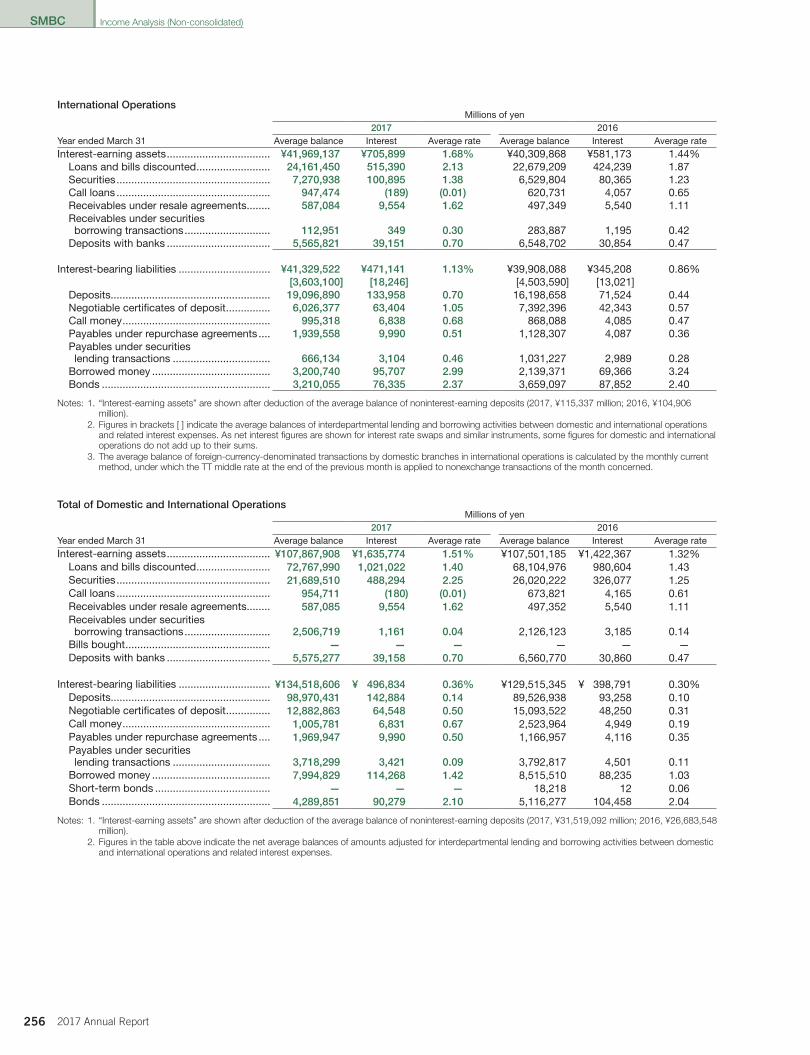
SMBC
256 2017 Annual Report
International OperationsMillions of yen
2017 2016Year ended March 31 Average balance Interest Average rate Average balance Interest Average rateInterest-earning assets ����������������������������������� ¥41,969,137 ¥705,899 1.68% ¥40,309,868 ¥581,173 1�44%
Loans and bills discounted ������������������������� 24,161,450 515,390 2.13 22,679,209 424,239 1�87Securities ���������������������������������������������������� 7,270,938 100,895 1.38 6,529,804 80,365 1�23Call loans ���������������������������������������������������� 947,474 (189) (0.01) 620,731 4,057 0�65Receivables under resale agreements �������� 587,084 9,554 1.62 497,349 5,540 1�11Receivables under securities borrowing transactions ����������������������������� 112,951 349 0.30 283,887 1,195 0�42
Deposits with banks ����������������������������������� 5,565,821 39,151 0.70 6,548,702 30,854 0�47
Interest-bearing liabilities ������������������������������� ¥41,329,522 ¥471,141 1.13% ¥39,908,088 ¥345,208 0�86%[3,603,100] [18,246] [4,503,590] [13,021]
Deposits������������������������������������������������������ 19,096,890 133,958 0.70 16,198,658 71,524 0�44Negotiable certificates of deposit ��������������� 6,026,377 63,404 1.05 7,392,396 42,343 0�57Call money �������������������������������������������������� 995,318 6,838 0.68 868,088 4,085 0�47Payables under repurchase agreements ���� 1,939,558 9,990 0.51 1,128,307 4,087 0�36Payables under securities lending transactions ��������������������������������� 666,134 3,104 0.46 1,031,227 2,989 0�28
Borrowed money ���������������������������������������� 3,200,740 95,707 2.99 2,139,371 69,366 3�24Bonds ��������������������������������������������������������� 3,210,055 76,335 2.37 3,659,097 87,852 2�40
Notes: 1. “Interest-earning assets” are shown after deduction of the average balance of noninterest-earning deposits (2017, ¥115,337 million; 2016, ¥104,906 million).
2. Figures in brackets [ ] indicate the average balances of interdepartmental lending and borrowing activities between domestic and international operations and related interest expenses. As net interest figures are shown for interest rate swaps and similar instruments, some figures for domestic and international operations do not add up to their sums.
3. The average balance of foreign-currency-denominated transactions by domestic branches in international operations is calculated by the monthly current method, under which the TT middle rate at the end of the previous month is applied to nonexchange transactions of the month concerned.
Total of Domestic and International OperationsMillions of yen
2017 2016Year ended March 31 Average balance Interest Average rate Average balance Interest Average rateInterest-earning assets ����������������������������������� ¥107,867,908 ¥1,635,774 1.51% ¥107,501,185 ¥1,422,367 1�32%
Loans and bills discounted ������������������������� 72,767,990 1,021,022 1.40 68,104,976 980,604 1�43Securities ���������������������������������������������������� 21,689,510 488,294 2.25 26,020,222 326,077 1�25Call loans ���������������������������������������������������� 954,711 (180) (0.01) 673,821 4,165 0�61Receivables under resale agreements �������� 587,085 9,554 1.62 497,352 5,540 1�11Receivables under securities borrowing transactions ����������������������������� 2,506,719 1,161 0.04 2,126,123 3,185 0�14
Bills bought ������������������������������������������������� — — — — — —Deposits with banks ����������������������������������� 5,575,277 39,158 0.70 6,560,770 30,860 0�47
Interest-bearing liabilities ������������������������������� ¥134,518,606 ¥ 496,834 0.36% ¥129,515,345 ¥ 398,791 0�30%Deposits������������������������������������������������������ 98,970,431 142,884 0.14 89,526,938 93,258 0�10Negotiable certificates of deposit ��������������� 12,882,863 64,548 0.50 15,093,522 48,250 0�31Call money �������������������������������������������������� 1,005,781 6,831 0.67 2,523,964 4,949 0�19Payables under repurchase agreements ���� 1,969,947 9,990 0.50 1,166,957 4,116 0�35Payables under securities lending transactions ��������������������������������� 3,718,299 3,421 0.09 3,792,817 4,501 0�11
Borrowed money ���������������������������������������� 7,994,829 114,268 1.42 8,515,510 88,235 1�03Short-term bonds ��������������������������������������� — — — 18,218 12 0�06Bonds ��������������������������������������������������������� 4,289,851 90,279 2.10 5,116,277 104,458 2�04
Notes: 1. “Interest-earning assets” are shown after deduction of the average balance of noninterest-earning deposits (2017, ¥31,519,092 million; 2016, ¥26,683,548 million).
2. Figures in the table above indicate the net average balances of amounts adjusted for interdepartmental lending and borrowing activities between domestic and international operations and related interest expenses.
Income Analysis (Non-consolidated)
013_0800804262908.indd 256 2017/08/08 14:56:20
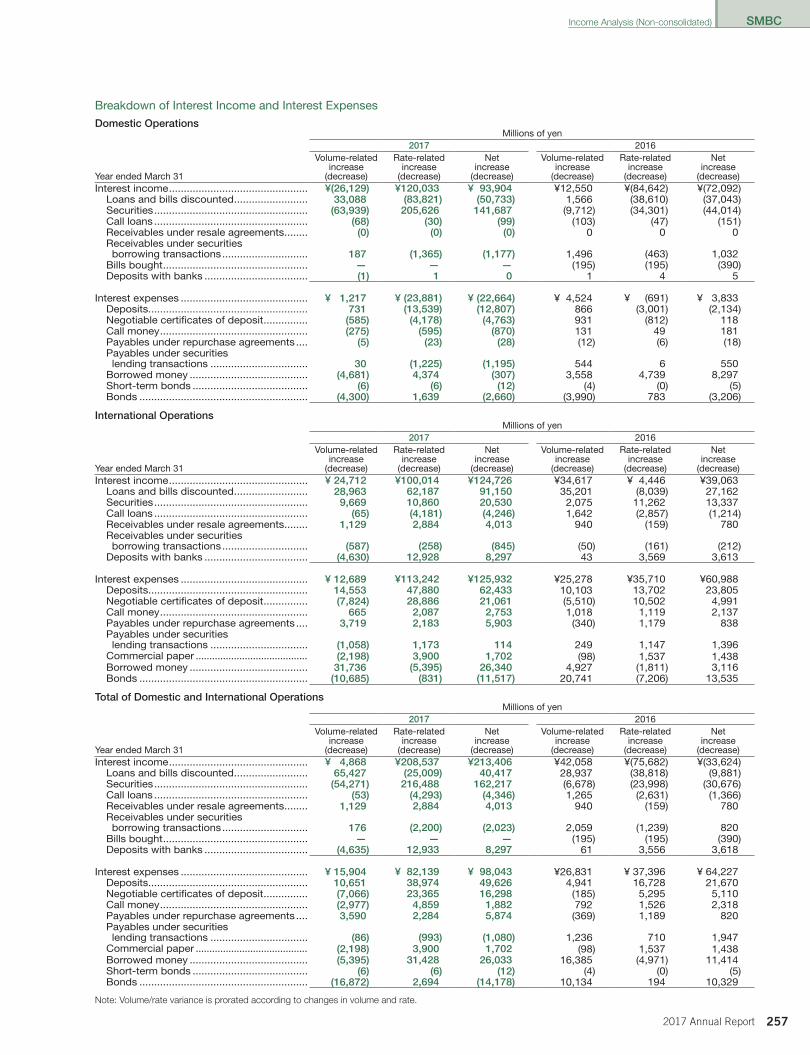
SMBC
2572017 Annual Report
Breakdown of Interest Income and Interest Expenses
Domestic OperationsMillions of yen
2017 2016
Year ended March 31
Volume-relatedincrease
(decrease)
Rate-relatedincrease
(decrease)
Netincrease
(decrease)
Volume-relatedincrease
(decrease)
Rate-relatedincrease
(decrease)
Netincrease
(decrease)Interest income ����������������������������������������������� ¥(26,129) ¥120,033 ¥ 93,904 ¥12,550 ¥(84,642) ¥(72,092)
Loans and bills discounted ������������������������� 33,088 (83,821) (50,733) 1,566 (38,610) (37,043)Securities ���������������������������������������������������� (63,939) 205,626 141,687 (9,712) (34,301) (44,014)Call loans ���������������������������������������������������� (68) (30) (99) (103) (47) (151)Receivables under resale agreements �������� (0) (0) (0) 0 0 0Receivables under securities borrowing transactions ����������������������������� 187 (1,365) (1,177) 1,496 (463) 1,032
Bills bought ������������������������������������������������� — — — (195) (195) (390)Deposits with banks ����������������������������������� (1) 1 0 1 4 5
Interest expenses ������������������������������������������� ¥ 1,217 ¥ (23,881) ¥ (22,664) ¥ 4,524 ¥ (691) ¥ 3,833Deposits������������������������������������������������������ 731 (13,539) (12,807) 866 (3,001) (2,134)Negotiable certificates of deposit ��������������� (585) (4,178) (4,763) 931 (812) 118Call money �������������������������������������������������� (275) (595) (870) 131 49 181Payables under repurchase agreements ���� (5) (23) (28) (12) (6) (18)Payables under securities lending transactions ��������������������������������� 30 (1,225) (1,195) 544 6 550
Borrowed money ���������������������������������������� (4,681) 4,374 (307) 3,558 4,739 8,297Short-term bonds ��������������������������������������� (6) (6) (12) (4) (0) (5)Bonds ��������������������������������������������������������� (4,300) 1,639 (2,660) (3,990) 783 (3,206)
International OperationsMillions of yen
2017 2016
Year ended March 31
Volume-relatedincrease
(decrease)
Rate-relatedincrease
(decrease)
Netincrease
(decrease)
Volume-relatedincrease
(decrease)
Rate-relatedincrease
(decrease)
Netincrease
(decrease)Interest income ����������������������������������������������� ¥ 24,712 ¥100,014 ¥124,726 ¥34,617 ¥ 4,446 ¥39,063
Loans and bills discounted ������������������������� 28,963 62,187 91,150 35,201 (8,039) 27,162Securities ���������������������������������������������������� 9,669 10,860 20,530 2,075 11,262 13,337Call loans ���������������������������������������������������� (65) (4,181) (4,246) 1,642 (2,857) (1,214)Receivables under resale agreements �������� 1,129 2,884 4,013 940 (159) 780Receivables under securities borrowing transactions ����������������������������� (587) (258) (845) (50) (161) (212)
Deposits with banks ����������������������������������� (4,630) 12,928 8,297 43 3,569 3,613
Interest expenses ������������������������������������������� ¥ 12,689 ¥113,242 ¥125,932 ¥25,278 ¥35,710 ¥60,988Deposits������������������������������������������������������ 14,553 47,880 62,433 10,103 13,702 23,805Negotiable certificates of deposit ��������������� (7,824) 28,886 21,061 (5,510) 10,502 4,991Call money �������������������������������������������������� 665 2,087 2,753 1,018 1,119 2,137Payables under repurchase agreements ���� 3,719 2,183 5,903 (340) 1,179 838Payables under securities lending transactions ��������������������������������� (1,058) 1,173 114 249 1,147 1,396
Commercial paper������������������������������������������ (2,198) 3,900 1,702 (98) 1,537 1,438Borrowed money ���������������������������������������� 31,736 (5,395) 26,340 4,927 (1,811) 3,116Bonds ��������������������������������������������������������� (10,685) (831) (11,517) 20,741 (7,206) 13,535
Total of Domestic and International OperationsMillions of yen
2017 2016
Year ended March 31
Volume-relatedincrease
(decrease)
Rate-relatedincrease
(decrease)
Netincrease
(decrease)
Volume-relatedincrease
(decrease)
Rate-relatedincrease
(decrease)
Netincrease
(decrease)Interest income ����������������������������������������������� ¥ 4,868 ¥208,537 ¥213,406 ¥42,058 ¥(75,682) ¥(33,624)
Loans and bills discounted ������������������������� 65,427 (25,009) 40,417 28,937 (38,818) (9,881)Securities ���������������������������������������������������� (54,271) 216,488 162,217 (6,678) (23,998) (30,676)Call loans ���������������������������������������������������� (53) (4,293) (4,346) 1,265 (2,631) (1,366)Receivables under resale agreements �������� 1,129 2,884 4,013 940 (159) 780Receivables under securities borrowing transactions ����������������������������� 176 (2,200) (2,023) 2,059 (1,239) 820
Bills bought ������������������������������������������������� — — — (195) (195) (390)Deposits with banks ����������������������������������� (4,635) 12,933 8,297 61 3,556 3,618
Interest expenses ������������������������������������������� ¥ 15,904 ¥ 82,139 ¥ 98,043 ¥26,831 ¥ 37,396 ¥ 64,227Deposits������������������������������������������������������ 10,651 38,974 49,626 4,941 16,728 21,670Negotiable certificates of deposit ��������������� (7,066) 23,365 16,298 (185) 5,295 5,110Call money �������������������������������������������������� (2,977) 4,859 1,882 792 1,526 2,318Payables under repurchase agreements ���� 3,590 2,284 5,874 (369) 1,189 820Payables under securities lending transactions ��������������������������������� (86) (993) (1,080) 1,236 710 1,947
Commercial paper������������������������������������������ (2,198) 3,900 1,702 (98) 1,537 1,438Borrowed money ���������������������������������������� (5,395) 31,428 26,033 16,385 (4,971) 11,414Short-term bonds ��������������������������������������� (6) (6) (12) (4) (0) (5)Bonds ��������������������������������������������������������� (16,872) 2,694 (14,178) 10,134 194 10,329
Note: Volume/rate variance is prorated according to changes in volume and rate.
Income Analysis (Non-consolidated)
013_0800804262908.indd 257 2017/08/08 14:56:20
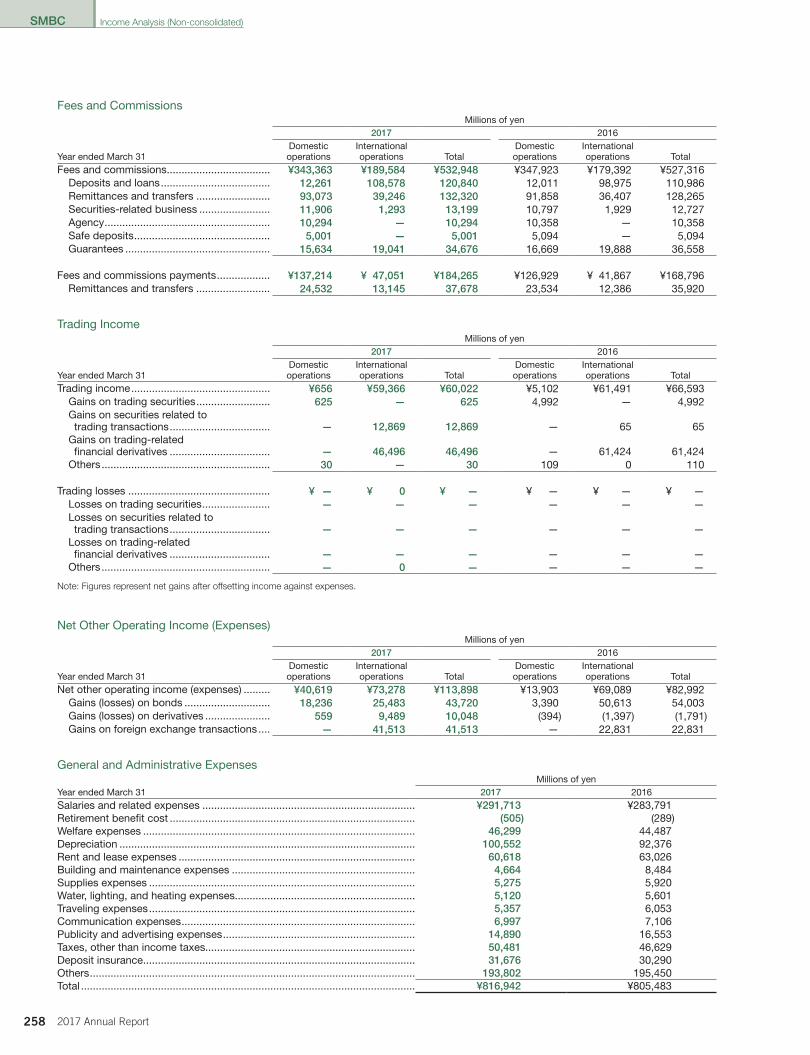
SMBC
258 2017 Annual Report
Fees and CommissionsMillions of yen
2017 2016
Year ended March 31Domesticoperations
Internationaloperations Total
Domesticoperations
Internationaloperations Total
Fees and commissions ����������������������������������� ¥343,363 ¥189,584 ¥532,948 ¥347,923 ¥179,392 ¥527,316Deposits and loans ������������������������������������� 12,261 108,578 120,840 12,011 98,975 110,986Remittances and transfers ������������������������� 93,073 39,246 132,320 91,858 36,407 128,265Securities-related business ������������������������ 11,906 1,293 13,199 10,797 1,929 12,727Agency �������������������������������������������������������� 10,294 — 10,294 10,358 — 10,358Safe deposits ���������������������������������������������� 5,001 — 5,001 5,094 — 5,094Guarantees ������������������������������������������������� 15,634 19,041 34,676 16,669 19,888 36,558
Fees and commissions payments ������������������ ¥137,214 ¥ 47,051 ¥184,265 ¥126,929 ¥ 41,867 ¥168,796Remittances and transfers ������������������������� 24,532 13,145 37,678 23,534 12,386 35,920
Trading IncomeMillions of yen
2017 2016
Year ended March 31Domesticoperations
Internationaloperations Total
Domesticoperations
Internationaloperations Total
Trading income ����������������������������������������������� ¥656 ¥59,366 ¥60,022 ¥5,102 ¥61,491 ¥66,593Gains on trading securities ������������������������� 625 — 625 4,992 — 4,992Gains on securities related to trading transactions ���������������������������������� — 12,869 12,869 — 65 65
Gains on trading-related financial derivatives ���������������������������������� — 46,496 46,496 — 61,424 61,424
Others ��������������������������������������������������������� 30 — 30 109 0 110
Trading losses ������������������������������������������������ ¥ — ¥ 0 ¥ — ¥ — ¥ — ¥ —Losses on trading securities ����������������������� — — — — — —Losses on securities related to trading transactions ���������������������������������� — — — — — —
Losses on trading-related financial derivatives ���������������������������������� — — — — — —
Others ��������������������������������������������������������� — 0 — — — —
Note: Figures represent net gains after offsetting income against expenses.
Net Other Operating Income (Expenses)Millions of yen
2017 2016
Year ended March 31Domesticoperations
Internationaloperations Total
Domesticoperations
Internationaloperations Total
Net other operating income (expenses) ��������� ¥40,619 ¥73,278 ¥113,898 ¥13,903 ¥69,089 ¥82,992Gains (losses) on bonds ����������������������������� 18,236 25,483 43,720 3,390 50,613 54,003Gains (losses) on derivatives ���������������������� 559 9,489 10,048 (394) (1,397) (1,791)Gains on foreign exchange transactions ���� — 41,513 41,513 — 22,831 22,831
General and Administrative ExpensesMillions of yen
Year ended March 31 2017 2016Salaries and related expenses ������������������������������������������������������������������������ ¥291,713 ¥283,791Retirement benefit cost ����������������������������������������������������������������������������������� (505) (289)Welfare expenses �������������������������������������������������������������������������������������������� 46,299 44,487Depreciation ���������������������������������������������������������������������������������������������������� 100,552 92,376Rent and lease expenses �������������������������������������������������������������������������������� 60,618 63,026Building and maintenance expenses �������������������������������������������������������������� 4,664 8,484Supplies expenses ������������������������������������������������������������������������������������������ 5,275 5,920Water, lighting, and heating expenses������������������������������������������������������������� 5,120 5,601Traveling expenses ������������������������������������������������������������������������������������������ 5,357 6,053Communication expenses ������������������������������������������������������������������������������� 6,997 7,106Publicity and advertising expenses ����������������������������������������������������������������� 14,890 16,553Taxes, other than income taxes����������������������������������������������������������������������� 50,481 46,629Deposit insurance �������������������������������������������������������������������������������������������� 31,676 30,290Others �������������������������������������������������������������������������������������������������������������� 193,802 195,450Total ����������������������������������������������������������������������������������������������������������������� ¥816,942 ¥805,483
Income Analysis (Non-consolidated)
013_0800804262908.indd 258 2017/08/08 14:56:21
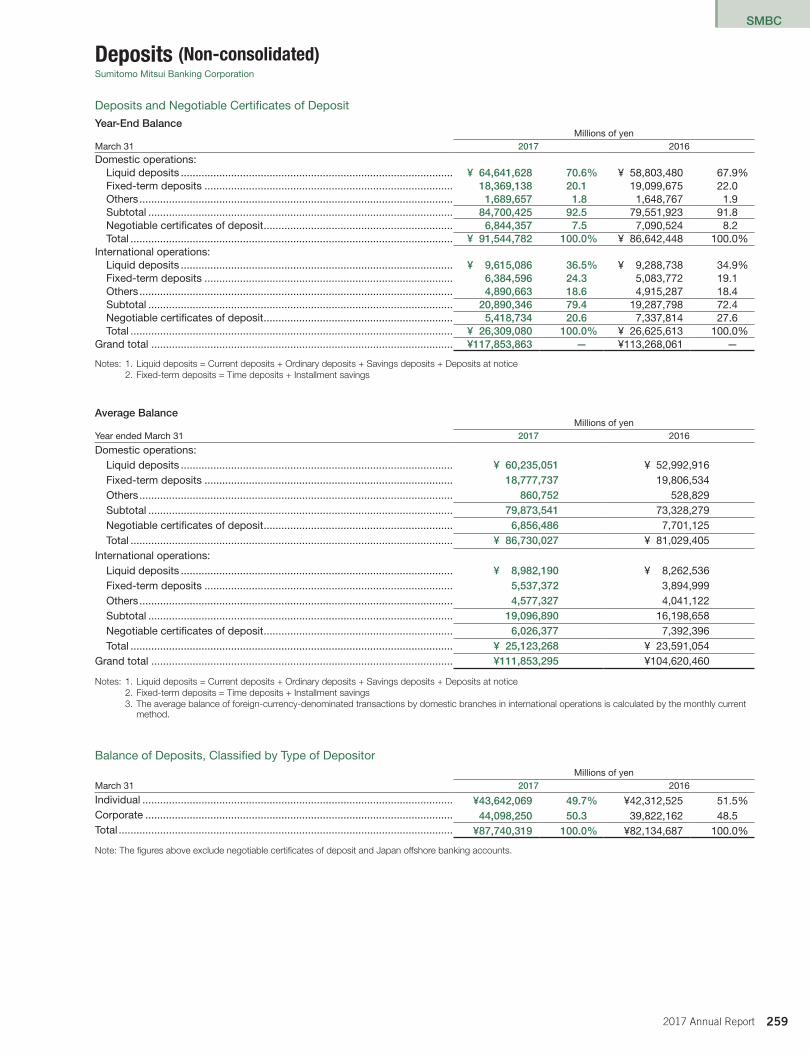
SMBC
2592017 Annual Report
Deposits (Non-consolidated)Sumitomo Mitsui Banking Corporation
Deposits and Negotiable Certificates of Deposit
Year-End BalanceMillions of yen
March 31 2017 2016Domestic operations:
Liquid deposits �������������������������������������������������������������������������������������������� ¥ 64,641,628 70.6% ¥ 58,803,480 67�9%Fixed-term deposits ������������������������������������������������������������������������������������ 18,369,138 20.1 19,099,675 22�0Others ���������������������������������������������������������������������������������������������������������� 1,689,657 1.8 1,648,767 1�9Subtotal ������������������������������������������������������������������������������������������������������� 84,700,425 92.5 79,551,923 91�8Negotiable certificates of deposit ���������������������������������������������������������������� 6,844,357 7.5 7,090,524 8�2Total ������������������������������������������������������������������������������������������������������������� ¥ 91,544,782 100.0% ¥ 86,642,448 100�0%
International operations:Liquid deposits �������������������������������������������������������������������������������������������� ¥ 9,615,086 36.5% ¥ 9,288,738 34�9%Fixed-term deposits ������������������������������������������������������������������������������������ 6,384,596 24.3 5,083,772 19�1Others ���������������������������������������������������������������������������������������������������������� 4,890,663 18.6 4,915,287 18�4Subtotal ������������������������������������������������������������������������������������������������������� 20,890,346 79.4 19,287,798 72�4Negotiable certificates of deposit ���������������������������������������������������������������� 5,418,734 20.6 7,337,814 27�6Total ������������������������������������������������������������������������������������������������������������� ¥ 26,309,080 100.0% ¥ 26,625,613 100�0%
Grand total ������������������������������������������������������������������������������������������������������ ¥117,853,863 — ¥113,268,061 —
Notes: 1. Liquid deposits = Current deposits + Ordinary deposits + Savings deposits + Deposits at notice2. Fixed-term deposits = Time deposits + Installment savings
Average BalanceMillions of yen
Year ended March 31 2017 2016
Domestic operations:Liquid deposits �������������������������������������������������������������������������������������������� ¥ 60,235,051 ¥ 52,992,916Fixed-term deposits ������������������������������������������������������������������������������������ 18,777,737 19,806,534Others ���������������������������������������������������������������������������������������������������������� 860,752 528,829Subtotal ������������������������������������������������������������������������������������������������������� 79,873,541 73,328,279Negotiable certificates of deposit ���������������������������������������������������������������� 6,856,486 7,701,125Total ������������������������������������������������������������������������������������������������������������� ¥ 86,730,027 ¥ 81,029,405
International operations:Liquid deposits �������������������������������������������������������������������������������������������� ¥ 8,982,190 ¥ 8,262,536Fixed-term deposits ������������������������������������������������������������������������������������ 5,537,372 3,894,999Others ���������������������������������������������������������������������������������������������������������� 4,577,327 4,041,122Subtotal ������������������������������������������������������������������������������������������������������� 19,096,890 16,198,658Negotiable certificates of deposit ���������������������������������������������������������������� 6,026,377 7,392,396Total ������������������������������������������������������������������������������������������������������������� ¥ 25,123,268 ¥ 23,591,054
Grand total ������������������������������������������������������������������������������������������������������ ¥111,853,295 ¥104,620,460
Notes: 1. Liquid deposits = Current deposits + Ordinary deposits + Savings deposits + Deposits at notice2. Fixed-term deposits = Time deposits + Installment savings3. The average balance of foreign-currency-denominated transactions by domestic branches in international operations is calculated by the monthly current
method.
Balance of Deposits, Classified by Type of DepositorMillions of yen
March 31 2017 2016
Individual ��������������������������������������������������������������������������������������������������������� ¥43,642,069 49.7% ¥42,312,525 51�5%Corporate �������������������������������������������������������������������������������������������������������� 44,098,250 50.3 39,822,162 48�5Total ����������������������������������������������������������������������������������������������������������������� ¥87,740,319 100.0% ¥82,134,687 100�0%
Note: The figures above exclude negotiable certificates of deposit and Japan offshore banking accounts.
013_0800804262908.indd 259 2017/08/08 14:56:21
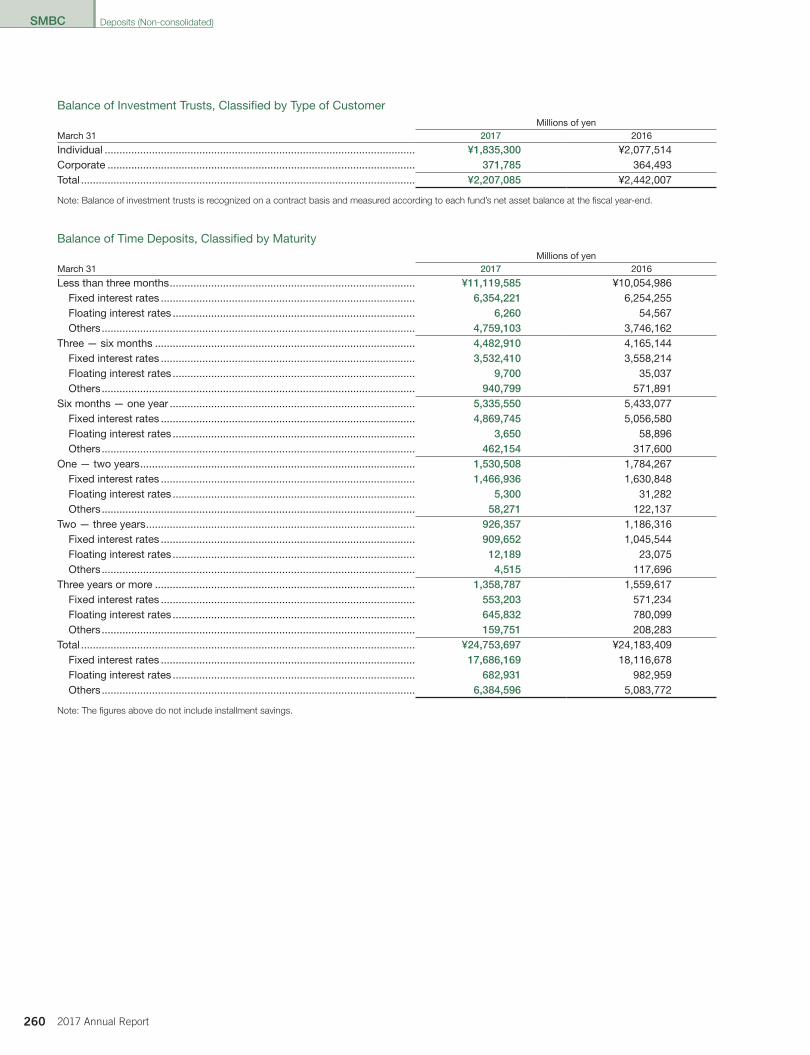
SMBC
260 2017 Annual Report
Balance of Investment Trusts, Classified by Type of CustomerMillions of yen
March 31 2017 2016
Individual ��������������������������������������������������������������������������������������������������������� ¥1,835,300 ¥2,077,514Corporate �������������������������������������������������������������������������������������������������������� 371,785 364,493Total ����������������������������������������������������������������������������������������������������������������� ¥2,207,085 ¥2,442,007
Note: Balance of investment trusts is recognized on a contract basis and measured according to each fund’s net asset balance at the fiscal year-end.
Balance of Time Deposits, Classified by MaturityMillions of yen
March 31 2017 2016
Less than three months ����������������������������������������������������������������������������������� ¥11,119,585 ¥10,054,986Fixed interest rates �������������������������������������������������������������������������������������� 6,354,221 6,254,255Floating interest rates ���������������������������������������������������������������������������������� 6,260 54,567Others ���������������������������������������������������������������������������������������������������������� 4,759,103 3,746,162
Three — six months ���������������������������������������������������������������������������������������� 4,482,910 4,165,144Fixed interest rates �������������������������������������������������������������������������������������� 3,532,410 3,558,214Floating interest rates ���������������������������������������������������������������������������������� 9,700 35,037Others ���������������������������������������������������������������������������������������������������������� 940,799 571,891
Six months — one year ����������������������������������������������������������������������������������� 5,335,550 5,433,077Fixed interest rates �������������������������������������������������������������������������������������� 4,869,745 5,056,580Floating interest rates ���������������������������������������������������������������������������������� 3,650 58,896Others ���������������������������������������������������������������������������������������������������������� 462,154 317,600
One — two years ��������������������������������������������������������������������������������������������� 1,530,508 1,784,267Fixed interest rates �������������������������������������������������������������������������������������� 1,466,936 1,630,848Floating interest rates ���������������������������������������������������������������������������������� 5,300 31,282Others ���������������������������������������������������������������������������������������������������������� 58,271 122,137
Two — three years ������������������������������������������������������������������������������������������� 926,357 1,186,316Fixed interest rates �������������������������������������������������������������������������������������� 909,652 1,045,544Floating interest rates ���������������������������������������������������������������������������������� 12,189 23,075Others ���������������������������������������������������������������������������������������������������������� 4,515 117,696
Three years or more ���������������������������������������������������������������������������������������� 1,358,787 1,559,617Fixed interest rates �������������������������������������������������������������������������������������� 553,203 571,234Floating interest rates ���������������������������������������������������������������������������������� 645,832 780,099Others ���������������������������������������������������������������������������������������������������������� 159,751 208,283
Total ����������������������������������������������������������������������������������������������������������������� ¥24,753,697 ¥24,183,409Fixed interest rates �������������������������������������������������������������������������������������� 17,686,169 18,116,678Floating interest rates ���������������������������������������������������������������������������������� 682,931 982,959Others ���������������������������������������������������������������������������������������������������������� 6,384,596 5,083,772
Note: The figures above do not include installment savings.
Deposits (Non-consolidated)
013_0800804262908.indd 260 2017/08/08 14:56:21
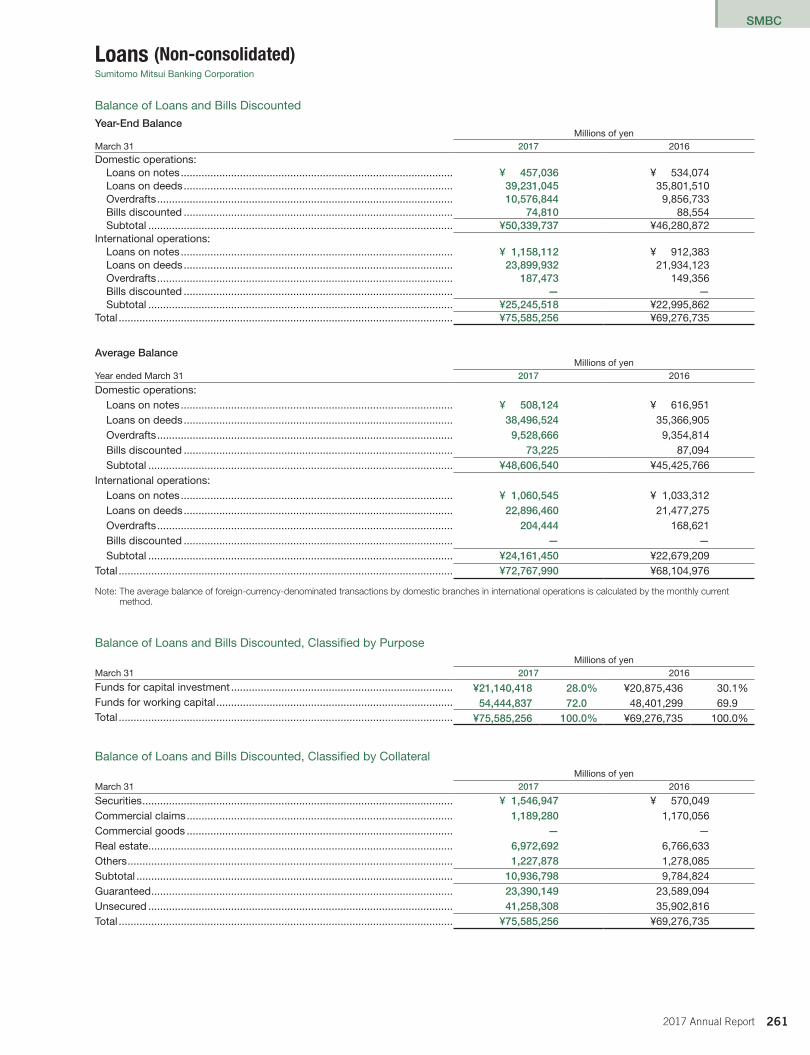
SMBC
2612017 Annual Report
Loans (Non-consolidated)Sumitomo Mitsui Banking Corporation
Balance of Loans and Bills Discounted
Year-End BalanceMillions of yen
March 31 2017 2016Domestic operations:
Loans on notes �������������������������������������������������������������������������������������������� ¥ 457,036 ¥ 534,074Loans on deeds ������������������������������������������������������������������������������������������� 39,231,045 35,801,510Overdrafts ���������������������������������������������������������������������������������������������������� 10,576,844 9,856,733Bills discounted ������������������������������������������������������������������������������������������� 74,810 88,554Subtotal ������������������������������������������������������������������������������������������������������� ¥50,339,737 ¥46,280,872
International operations:Loans on notes �������������������������������������������������������������������������������������������� ¥ 1,158,112 ¥ 912,383Loans on deeds ������������������������������������������������������������������������������������������� 23,899,932 21,934,123Overdrafts ���������������������������������������������������������������������������������������������������� 187,473 149,356Bills discounted ������������������������������������������������������������������������������������������� — —Subtotal ������������������������������������������������������������������������������������������������������� ¥25,245,518 ¥22,995,862
Total ����������������������������������������������������������������������������������������������������������������� ¥75,585,256 ¥69,276,735
Average BalanceMillions of yen
Year ended March 31 2017 2016
Domestic operations:Loans on notes �������������������������������������������������������������������������������������������� ¥ 508,124 ¥ 616,951Loans on deeds ������������������������������������������������������������������������������������������� 38,496,524 35,366,905Overdrafts ���������������������������������������������������������������������������������������������������� 9,528,666 9,354,814Bills discounted ������������������������������������������������������������������������������������������� 73,225 87,094Subtotal ������������������������������������������������������������������������������������������������������� ¥48,606,540 ¥45,425,766
International operations:Loans on notes �������������������������������������������������������������������������������������������� ¥ 1,060,545 ¥ 1,033,312Loans on deeds ������������������������������������������������������������������������������������������� 22,896,460 21,477,275Overdrafts ���������������������������������������������������������������������������������������������������� 204,444 168,621Bills discounted ������������������������������������������������������������������������������������������� — —Subtotal ������������������������������������������������������������������������������������������������������� ¥24,161,450 ¥22,679,209
Total ����������������������������������������������������������������������������������������������������������������� ¥72,767,990 ¥68,104,976
Note: The average balance of foreign-currency-denominated transactions by domestic branches in international operations is calculated by the monthly current method.
Balance of Loans and Bills Discounted, Classified by PurposeMillions of yen
March 31 2017 2016
Funds for capital investment ��������������������������������������������������������������������������� ¥21,140,418 28.0% ¥20,875,436 30�1%Funds for working capital �������������������������������������������������������������������������������� 54,444,837 72.0 48,401,299 69�9Total ����������������������������������������������������������������������������������������������������������������� ¥75,585,256 100.0% ¥69,276,735 100�0%
Balance of Loans and Bills Discounted, Classified by CollateralMillions of yen
March 31 2017 2016
Securities ��������������������������������������������������������������������������������������������������������� ¥ 1,546,947 ¥ 570,049Commercial claims ������������������������������������������������������������������������������������������ 1,189,280 1,170,056Commercial goods ������������������������������������������������������������������������������������������ — —Real estate ������������������������������������������������������������������������������������������������������� 6,972,692 6,766,633Others �������������������������������������������������������������������������������������������������������������� 1,227,878 1,278,085Subtotal ����������������������������������������������������������������������������������������������������������� 10,936,798 9,784,824Guaranteed ������������������������������������������������������������������������������������������������������ 23,390,149 23,589,094Unsecured ������������������������������������������������������������������������������������������������������� 41,258,308 35,902,816Total ����������������������������������������������������������������������������������������������������������������� ¥75,585,256 ¥69,276,735
013_0800804262908.indd 261 2017/08/08 14:56:21
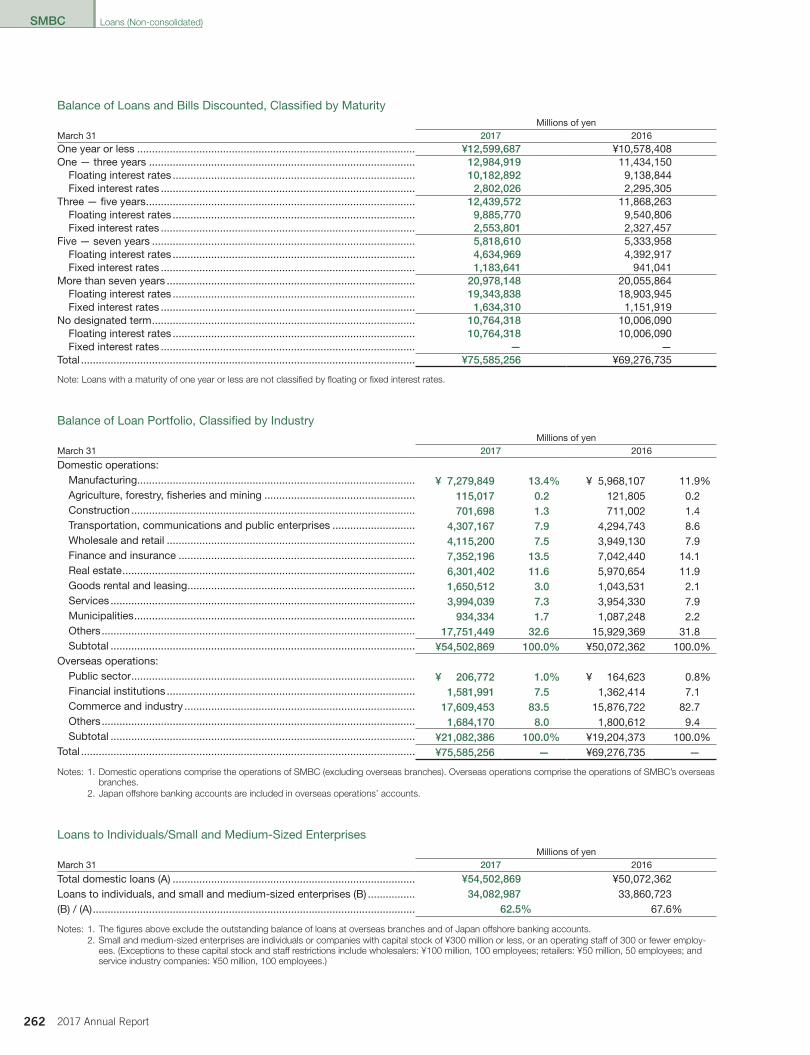
SMBC
262 2017 Annual Report
Balance of Loans and Bills Discounted, Classified by MaturityMillions of yen
March 31 2017 2016One year or less ���������������������������������������������������������������������������������������������� ¥12,599,687 ¥10,578,408One — three years ������������������������������������������������������������������������������������������ 12,984,919 11,434,150
Floating interest rates ���������������������������������������������������������������������������������� 10,182,892 9,138,844Fixed interest rates �������������������������������������������������������������������������������������� 2,802,026 2,295,305
Three — five years ������������������������������������������������������������������������������������������� 12,439,572 11,868,263Floating interest rates ���������������������������������������������������������������������������������� 9,885,770 9,540,806Fixed interest rates �������������������������������������������������������������������������������������� 2,553,801 2,327,457
Five — seven years ����������������������������������������������������������������������������������������� 5,818,610 5,333,958Floating interest rates ���������������������������������������������������������������������������������� 4,634,969 4,392,917Fixed interest rates �������������������������������������������������������������������������������������� 1,183,641 941,041
More than seven years ������������������������������������������������������������������������������������ 20,978,148 20,055,864Floating interest rates ���������������������������������������������������������������������������������� 19,343,838 18,903,945Fixed interest rates �������������������������������������������������������������������������������������� 1,634,310 1,151,919
No designated term ����������������������������������������������������������������������������������������� 10,764,318 10,006,090Floating interest rates ���������������������������������������������������������������������������������� 10,764,318 10,006,090Fixed interest rates �������������������������������������������������������������������������������������� — —
Total ����������������������������������������������������������������������������������������������������������������� ¥75,585,256 ¥69,276,735
Note: Loans with a maturity of one year or less are not classified by floating or fixed interest rates.
Balance of Loan Portfolio, Classified by IndustryMillions of yen
March 31 2017 2016
Domestic operations:Manufacturing���������������������������������������������������������������������������������������������� ¥ 7,279,849 13.4% ¥ 5,968,107 11�9%Agriculture, forestry, fisheries and mining ��������������������������������������������������� 115,017 0.2 121,805 0�2Construction ������������������������������������������������������������������������������������������������ 701,698 1.3 711,002 1�4Transportation, communications and public enterprises ���������������������������� 4,307,167 7.9 4,294,743 8�6Wholesale and retail ������������������������������������������������������������������������������������ 4,115,200 7.5 3,949,130 7�9Finance and insurance �������������������������������������������������������������������������������� 7,352,196 13.5 7,042,440 14�1Real estate ��������������������������������������������������������������������������������������������������� 6,301,402 11.6 5,970,654 11�9Goods rental and leasing ����������������������������������������������������������������������������� 1,650,512 3.0 1,043,531 2�1Services ������������������������������������������������������������������������������������������������������� 3,994,039 7.3 3,954,330 7�9Municipalities ����������������������������������������������������������������������������������������������� 934,334 1.7 1,087,248 2�2Others ���������������������������������������������������������������������������������������������������������� 17,751,449 32.6 15,929,369 31�8Subtotal ������������������������������������������������������������������������������������������������������� ¥54,502,869 100.0% ¥50,072,362 100�0%
Overseas operations:Public sector ������������������������������������������������������������������������������������������������ ¥ 206,772 1.0% ¥ 164,623 0�8%Financial institutions ������������������������������������������������������������������������������������ 1,581,991 7.5 1,362,414 7�1Commerce and industry ������������������������������������������������������������������������������ 17,609,453 83.5 15,876,722 82�7Others ���������������������������������������������������������������������������������������������������������� 1,684,170 8.0 1,800,612 9�4Subtotal ������������������������������������������������������������������������������������������������������� ¥21,082,386 100.0% ¥19,204,373 100�0%
Total ����������������������������������������������������������������������������������������������������������������� ¥75,585,256 — ¥69,276,735 —
Notes: 1. Domestic operations comprise the operations of SMBC (excluding overseas branches). Overseas operations comprise the operations of SMBC’s overseas branches.
2. Japan offshore banking accounts are included in overseas operations’ accounts.
Loans to Individuals/Small and Medium-Sized EnterprisesMillions of yen
March 31 2017 2016
Total domestic loans (A) ���������������������������������������������������������������������������������� ¥54,502,869 ¥50,072,362Loans to individuals, and small and medium-sized enterprises (B) ���������������� 34,082,987 33,860,723(B) / (A) ������������������������������������������������������������������������������������������������������������� 62.5% 67�6%
Notes: 1. The figures above exclude the outstanding balance of loans at overseas branches and of Japan offshore banking accounts.2. Small and medium-sized enterprises are individuals or companies with capital stock of ¥300 million or less, or an operating staff of 300 or fewer employ-
ees. (Exceptions to these capital stock and staff restrictions include wholesalers: ¥100 million, 100 employees; retailers: ¥50 million, 50 employees; and service industry companies: ¥50 million, 100 employees.)
Loans (Non-consolidated)
013_0800804262908.indd 262 2017/08/08 14:56:21
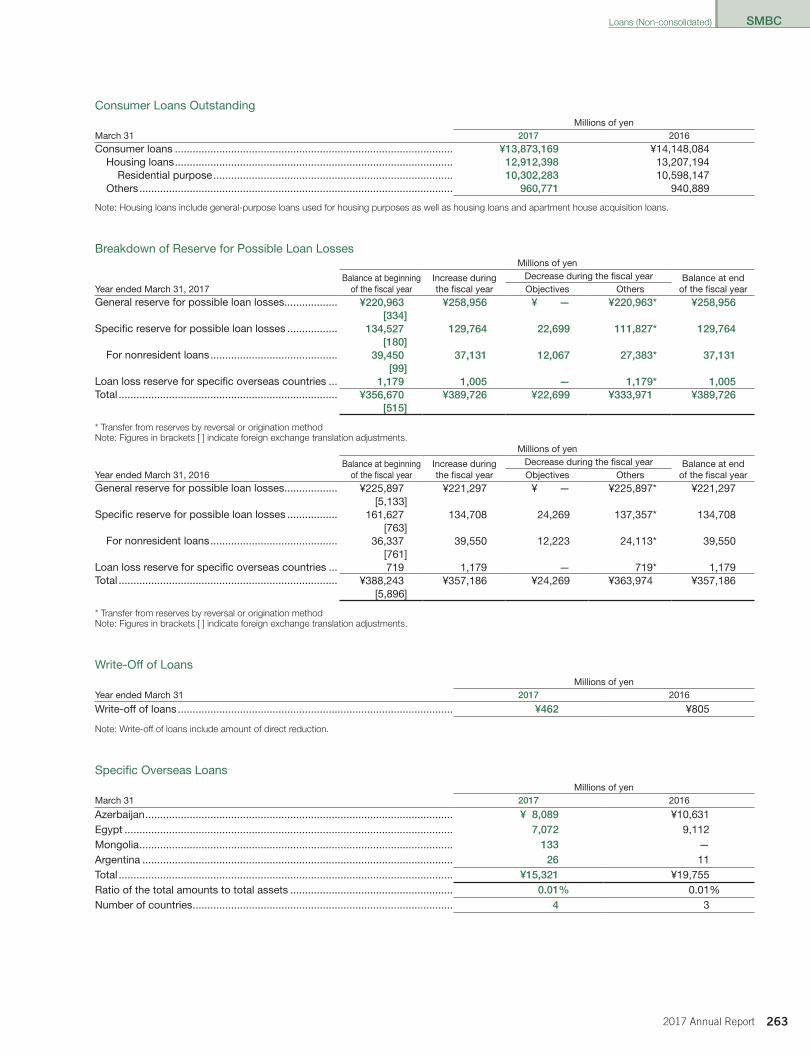
SMBC
2632017 Annual Report
Consumer Loans OutstandingMillions of yen
March 31 2017 2016Consumer loans ���������������������������������������������������������������������������������������������� ¥13,873,169 ¥14,148,084
Housing loans ���������������������������������������������������������������������������������������������� 12,912,398 13,207,194Residential purpose ��������������������������������������������������������������������������������� 10,302,283 10,598,147
Others ���������������������������������������������������������������������������������������������������������� 960,771 940,889
Note: Housing loans include general-purpose loans used for housing purposes as well as housing loans and apartment house acquisition loans.
Breakdown of Reserve for Possible Loan LossesMillions of yen
Year ended March 31, 2017Balance at beginning
of the fiscal yearIncrease duringthe fiscal year
Decrease during the fiscal year Balance at endof the fiscal yearObjectives Others
General reserve for possible loan losses������������������ ¥220,963 ¥258,956 ¥ — ¥220,963* ¥258,956[334]
Specific reserve for possible loan losses ����������������� 134,527 129,764 22,699 111,827* 129,764[180]
For nonresident loans ������������������������������������������� 39,450 37,131 12,067 27,383* 37,131[99]
Loan loss reserve for specific overseas countries ��� 1,179 1,005 — 1,179* 1,005Total �������������������������������������������������������������������������� ¥356,670 ¥389,726 ¥22,699 ¥333,971 ¥389,726
[515]
* Transfer from reserves by reversal or origination methodNote: Figures in brackets [ ] indicate foreign exchange translation adjustments.
Millions of yen
Year ended March 31, 2016Balance at beginning
of the fiscal yearIncrease duringthe fiscal year
Decrease during the fiscal year Balance at endof the fiscal yearObjectives Others
General reserve for possible loan losses������������������ ¥225,897 ¥221,297 ¥ — ¥225,897* ¥221,297[5,133]
Specific reserve for possible loan losses ����������������� 161,627 134,708 24,269 137,357* 134,708[763]
For nonresident loans ������������������������������������������� 36,337 39,550 12,223 24,113* 39,550[761]
Loan loss reserve for specific overseas countries ��� 719 1,179 — 719* 1,179Total �������������������������������������������������������������������������� ¥388,243 ¥357,186 ¥24,269 ¥363,974 ¥357,186
[5,896]
* Transfer from reserves by reversal or origination methodNote: Figures in brackets [ ] indicate foreign exchange translation adjustments.
Write-Off of LoansMillions of yen
Year ended March 31 2017 2016
Write-off of loans ��������������������������������������������������������������������������������������������� ¥462 ¥805
Note: Write-off of loans include amount of direct reduction.
Specific Overseas LoansMillions of yen
March 31 2017 2016
Azerbaijan �������������������������������������������������������������������������������������������������������� ¥ 8,089 ¥10,631Egypt ��������������������������������������������������������������������������������������������������������������� 7,072 9,112Mongolia ���������������������������������������������������������������������������������������������������������� 133 —Argentina ��������������������������������������������������������������������������������������������������������� 26 11Total ����������������������������������������������������������������������������������������������������������������� ¥15,321 ¥19,755Ratio of the total amounts to total assets ������������������������������������������������������� 0.01% 0�01%Number of countries ���������������������������������������������������������������������������������������� 4 3
Loans (Non-consolidated)
013_0800804262908.indd 263 2017/08/08 14:56:21
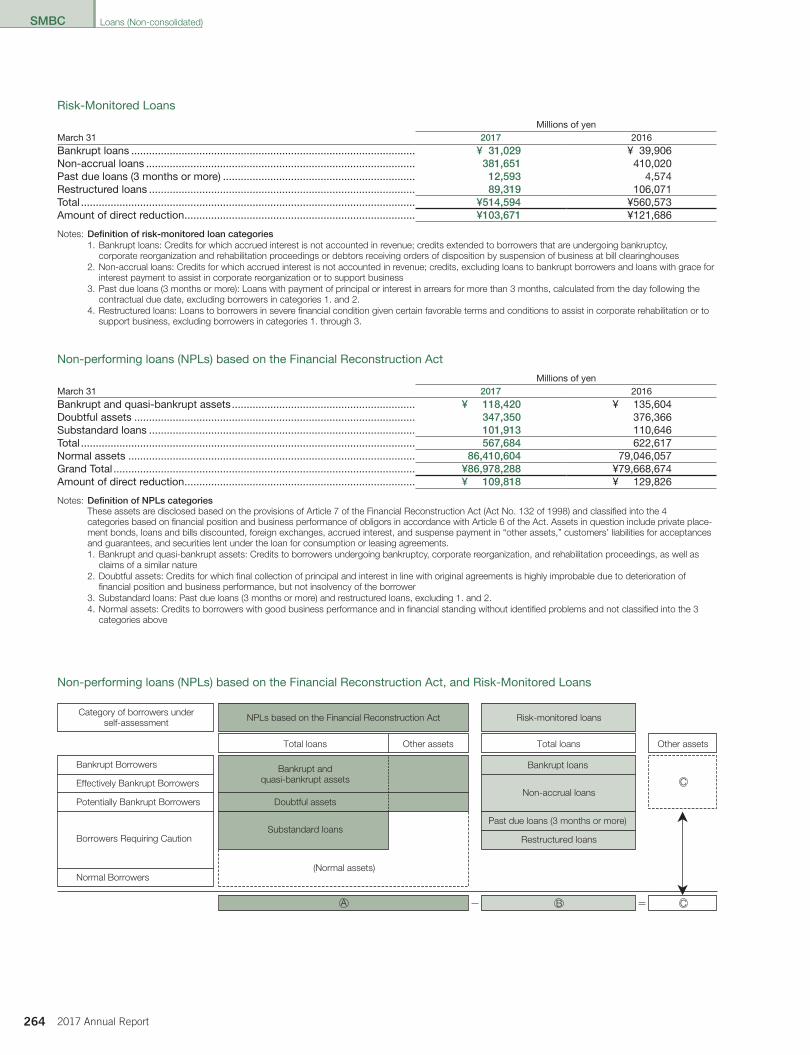
SMBC
264 2017 Annual Report
Risk-Monitored Loans
Millions of yen March 31 2017 2016Bankrupt loans ������������������������������������������������������������������������������������������������ ¥ 31,029 ¥ 39,906Non-accrual loans ������������������������������������������������������������������������������������������� 381,651 410,020Past due loans (3 months or more) ����������������������������������������������������������������� 12,593 4,574Restructured loans ������������������������������������������������������������������������������������������ 89,319 106,071Total ����������������������������������������������������������������������������������������������������������������� ¥514,594 ¥560,573Amount of direct reduction ������������������������������������������������������������������������������ ¥103,671 ¥121,686
Notes: Definition of risk-monitored loan categories1. Bankrupt loans: Credits for which accrued interest is not accounted in revenue; credits extended to borrowers that are undergoing bankruptcy,
corporate reorganization and rehabilitation proceedings or debtors receiving orders of disposition by suspension of business at bill clearinghouses2. Non-accrual loans: Credits for which accrued interest is not accounted in revenue; credits, excluding loans to bankrupt borrowers and loans with grace for
interest payment to assist in corporate reorganization or to support business3. Past due loans (3 months or more): Loans with payment of principal or interest in arrears for more than 3 months, calculated from the day following the
contractual due date, excluding borrowers in categories 1. and 2.4. Restructured loans: Loans to borrowers in severe financial condition given certain favorable terms and conditions to assist in corporate rehabilitation or to
support business, excluding borrowers in categories 1. through 3.
Non-performing loans (NPLs) based on the Financial Reconstruction Act
Millions of yen March 31 2017 2016Bankrupt and quasi-bankrupt assets �������������������������������������������������������������� ¥ 118,420 ¥ 135,604Doubtful assets ����������������������������������������������������������������������������������������������� 347,350 376,366Substandard loans ������������������������������������������������������������������������������������������ 101,913 110,646Total ����������������������������������������������������������������������������������������������������������������� 567,684 622,617Normal assets ������������������������������������������������������������������������������������������������� 86,410,604 79,046,057Grand Total ������������������������������������������������������������������������������������������������������ ¥86,978,288 ¥79,668,674Amount of direct reduction ������������������������������������������������������������������������������ ¥ 109,818 ¥ 129,826
Notes: Definition of NPLs categoriesThese assets are disclosed based on the provisions of Article 7 of the Financial Reconstruction Act (Act No. 132 of 1998) and classified into the 4 categories based on financial position and business performance of obligors in accordance with Article 6 of the Act. Assets in question include private place-ment bonds, loans and bills discounted, foreign exchanges, accrued interest, and suspense payment in “other assets,” customers’ liabilities for acceptances and guarantees, and securities lent under the loan for consumption or leasing agreements.1. Bankrupt and quasi-bankrupt assets: Credits to borrowers undergoing bankruptcy, corporate reorganization, and rehabilitation proceedings, as well as
claims of a similar nature2. Doubtful assets: Credits for which final collection of principal and interest in line with original agreements is highly improbable due to deterioration of
financial position and business performance, but not insolvency of the borrower3. Substandard loans: Past due loans (3 months or more) and restructured loans, excluding 1. and 2.4. Normal assets: Credits to borrowers with good business performance and in financial standing without identified problems and not classified into the 3
categories above
Category of borrowers underself-assessment Risk-monitored loans
Other assets
Bankrupt loans
Non-accrual loans
Past due loans (3 months or more)
Restructured loans
Bankrupt Borrowers
Total loans Total loansOther assets
Bankrupt andquasi-bankrupt assets
Substandard loans
(Normal assets)
Doubtful assets
Normal Borrowers
Effectively Bankrupt Borrowers
Potentially Bankrupt Borrowers
Borrowers Requiring Caution
A B C
C
NPLs based on the Financial Reconstruction Act
Non-performing loans (NPLs) based on the Financial Reconstruction Act, and Risk-Monitored Loans
Loans (Non-consolidated)
013_0800804262908.indd 264 2017/08/08 14:56:21
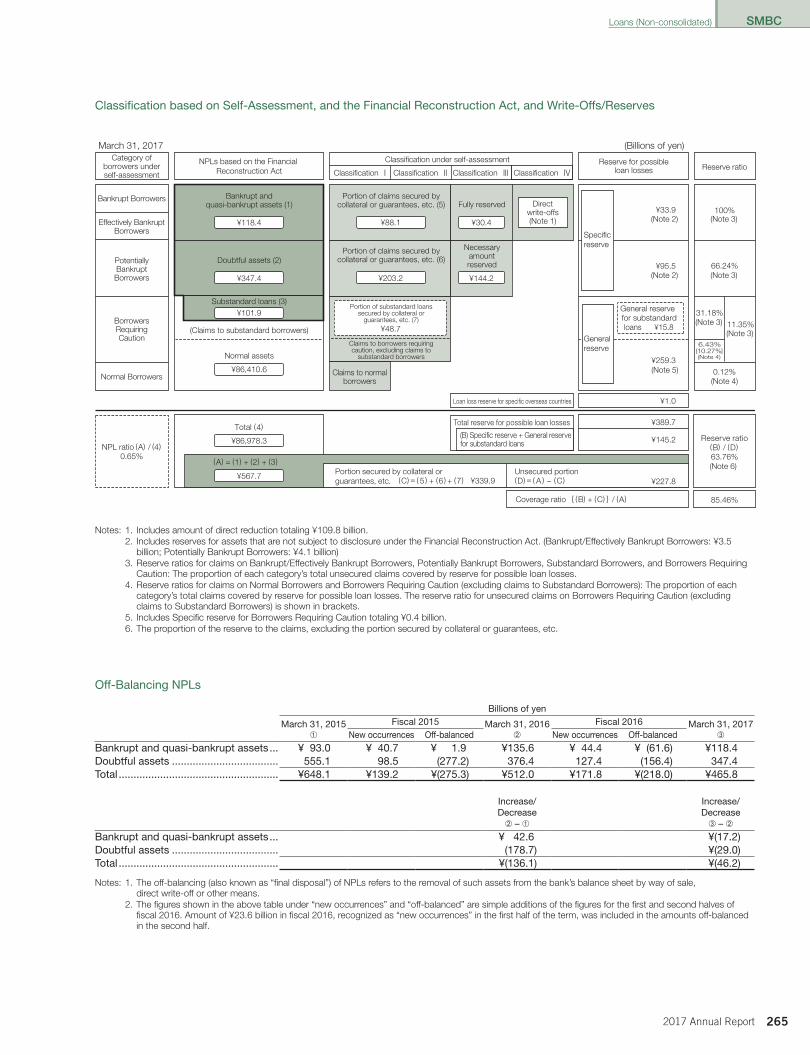
SMBC
2652017 Annual Report
Category ofborrowers underself-assessment
Reserve for possibleloan losses
Bankrupt Borrowers
Effectively BankruptBorrowers
PotentiallyBankruptBorrowers
BorrowersRequiringCaution
Normal Borrowers
I II III
NPL ratio (A) / (4)
General reserve for substandard loans ¥15.8
Reserve ratio(B) / (D)
(Note 5)
(4)
(A) = (1) + (2) + (3)
(C) = ( 5 ) + (6) + (7)
Coverage ratio { (B) + (C) } / (A)
(D) = ( A ) – (C)
IV
Bankrupt andquasi-bankrupt assets (1)
Claims to normalborrowers
Portion of claims secured bycollateral or guarantees, etc. (5) Fully reserved
Necessaryamountreserved
Directwrite-offs(Note 1)
Portion of claims secured bycollateral or guarantees, etc. (6)
Portion of substandard loanssecured by collateral or
guarantees, etc. (7)
Claims to borrowers requiringcaution, excluding claims to
substandard borrowers
Doubtful assets (2)
Substandard loans (3)
(Claims to substandard borrowers)
Normal assets
Total
Classification under self-assessment
Classification Classification Classification Classification
Specificreserve
Generalreserve
Loan loss reserve for specific overseas countries
Total reserve for possible loan losses
(B) Specific reserve + General reservefor substandard loans
[ ]
(Billions of yen)
Portion secured by collateral orguarantees, etc.
Unsecured portion
(Note 2) (Note 3)
(Note 2) (Note 3)
(Note 3)(Note 3)
(Note 4)
(Note 4)
(Note 6)
Reserve ratioNPLs based on the Financial
Reconstruction Act
March 31, 2017
¥118.4
¥347.4
¥101.9
¥86,410.6
¥86,978.3
¥567.7
0.65%
¥339.9 ¥227.8
85.46%
63.76%
¥1.0
¥145.2
¥389.7
6.43%10.27%
0.12%¥259.3
¥33.9
31.18%
100%
66.24%
11.35%
¥95.5
¥48.7
¥88.1
¥203.2
¥30.4
¥144.2
Notes: 1. Includes amount of direct reduction totaling ¥109.8 billion.2. Includes reserves for assets that are not subject to disclosure under the Financial Reconstruction Act. (Bankrupt/Effectively Bankrupt Borrowers: ¥3.5
billion; Potentially Bankrupt Borrowers: ¥4.1 billion)3. Reserve ratios for claims on Bankrupt/Effectively Bankrupt Borrowers, Potentially Bankrupt Borrowers, Substandard Borrowers, and Borrowers Requiring
Caution: The proportion of each category’s total unsecured claims covered by reserve for possible loan losses.4. Reserve ratios for claims on Normal Borrowers and Borrowers Requiring Caution (excluding claims to Substandard Borrowers): The proportion of each
category’s total claims covered by reserve for possible loan losses. The reserve ratio for unsecured claims on Borrowers Requiring Caution (excluding claims to Substandard Borrowers) is shown in brackets.
5. Includes Specific reserve for Borrowers Requiring Caution totaling ¥0.4 billion.6. The proportion of the reserve to the claims, excluding the portion secured by collateral or guarantees, etc.
Off-Balancing NPLs
Billions of yen
March 31, 2015➀
Fiscal 2015 March 31, 2016➁
Fiscal 2016 March 31, 2017➂New occurrences Off-balanced New occurrences Off-balanced
Bankrupt and quasi-bankrupt assets ��� ¥ 93�0 ¥ 40�7 ¥ 1�9 ¥135�6 ¥ 44�4 ¥ (61�6) ¥118�4Doubtful assets ������������������������������������ 555�1 98�5 (277�2) 376�4 127�4 (156�4) 347�4Total ������������������������������������������������������ ¥648�1 ¥139�2 ¥(275�3) ¥512�0 ¥171�8 ¥(218�0) ¥465�8
Increase/Decrease
➁ – ➀
Increase/Decrease
➂ – ➁Bankrupt and quasi-bankrupt assets ��� ¥ 42�6 ¥(17�2)Doubtful assets ������������������������������������ (178�7) ¥(29�0)Total ������������������������������������������������������ ¥(136�1) ¥(46�2)
Notes: 1. The off-balancing (also known as “final disposal”) of NPLs refers to the removal of such assets from the bank’s balance sheet by way of sale,direct write-off or other means.
2. The figures shown in the above table under “new occurrences” and “off-balanced” are simple additions of the figures for the first and second halves of fiscal 2016. Amount of ¥23.6 billion in fiscal 2016, recognized as “new occurrences” in the first half of the term, was included in the amounts off-balanced in the second half.
Classification based on Self-Assessment, and the Financial Reconstruction Act, and Write-Offs/Reserves
Loans (Non-consolidated)
013_0800804262908.indd 265 2017/08/08 14:56:21
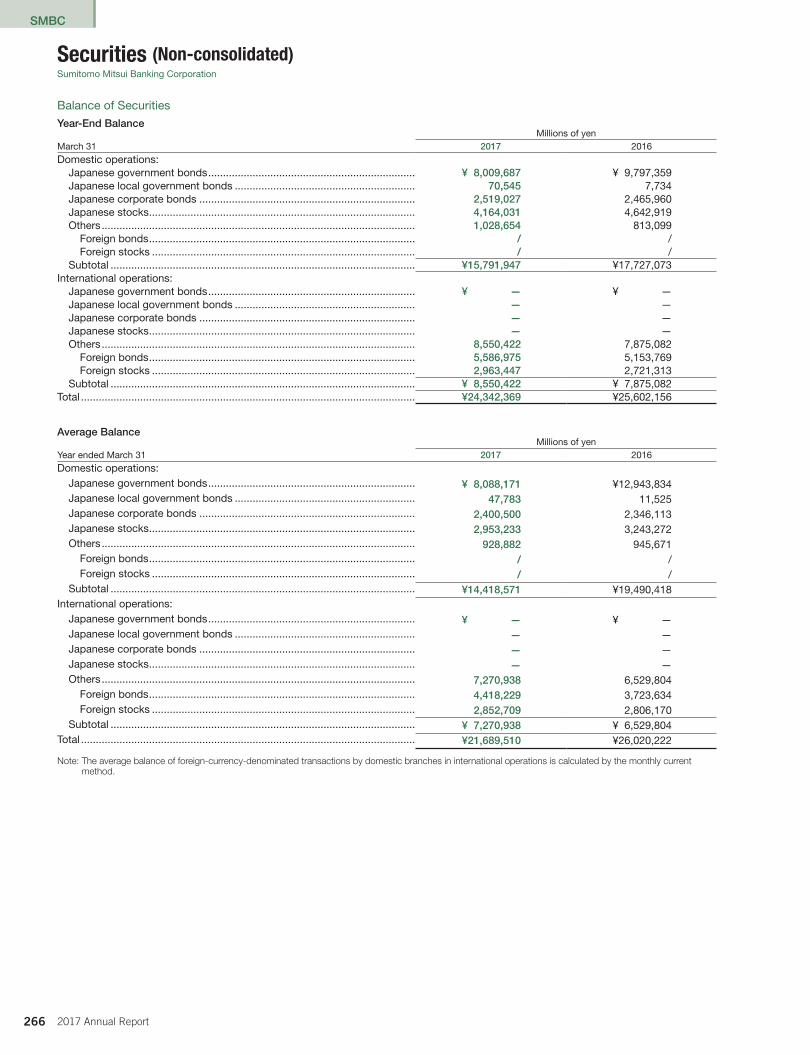
SMBC
266 2017 Annual Report
Securities (Non-consolidated)Sumitomo Mitsui Banking Corporation
Balance of Securities
Year-End BalanceMillions of yen
March 31 2017 2016Domestic operations:
Japanese government bonds ���������������������������������������������������������������������� ¥ 8,009,687 ¥ 9,797,359Japanese local government bonds ������������������������������������������������������������� 70,545 7,734Japanese corporate bonds ������������������������������������������������������������������������� 2,519,027 2,465,960Japanese stocks ������������������������������������������������������������������������������������������ 4,164,031 4,642,919Others ���������������������������������������������������������������������������������������������������������� 1,028,654 813,099
Foreign bonds ������������������������������������������������������������������������������������������ / /Foreign stocks ����������������������������������������������������������������������������������������� / /
Subtotal ������������������������������������������������������������������������������������������������������� ¥15,791,947 ¥17,727,073International operations:
Japanese government bonds ���������������������������������������������������������������������� ¥ — ¥ —Japanese local government bonds ������������������������������������������������������������� — —Japanese corporate bonds ������������������������������������������������������������������������� — —Japanese stocks ������������������������������������������������������������������������������������������ — —Others ���������������������������������������������������������������������������������������������������������� 8,550,422 7,875,082
Foreign bonds ������������������������������������������������������������������������������������������ 5,586,975 5,153,769Foreign stocks ����������������������������������������������������������������������������������������� 2,963,447 2,721,313
Subtotal ������������������������������������������������������������������������������������������������������� ¥ 8,550,422 ¥ 7,875,082Total ����������������������������������������������������������������������������������������������������������������� ¥24,342,369 ¥25,602,156
Average BalanceMillions of yen
Year ended March 31 2017 2016Domestic operations:
Japanese government bonds ���������������������������������������������������������������������� ¥ 8,088,171 ¥12,943,834Japanese local government bonds ������������������������������������������������������������� 47,783 11,525Japanese corporate bonds ������������������������������������������������������������������������� 2,400,500 2,346,113Japanese stocks ������������������������������������������������������������������������������������������ 2,953,233 3,243,272Others ���������������������������������������������������������������������������������������������������������� 928,882 945,671
Foreign bonds ������������������������������������������������������������������������������������������ / /Foreign stocks ����������������������������������������������������������������������������������������� / /
Subtotal ������������������������������������������������������������������������������������������������������� ¥14,418,571 ¥19,490,418International operations:
Japanese government bonds ���������������������������������������������������������������������� ¥ — ¥ —Japanese local government bonds ������������������������������������������������������������� — —Japanese corporate bonds ������������������������������������������������������������������������� — —Japanese stocks ������������������������������������������������������������������������������������������ — —Others ���������������������������������������������������������������������������������������������������������� 7,270,938 6,529,804
Foreign bonds ������������������������������������������������������������������������������������������ 4,418,229 3,723,634Foreign stocks ����������������������������������������������������������������������������������������� 2,852,709 2,806,170
Subtotal ������������������������������������������������������������������������������������������������������� ¥ 7,270,938 ¥ 6,529,804Total ����������������������������������������������������������������������������������������������������������������� ¥21,689,510 ¥26,020,222
Note: The average balance of foreign-currency-denominated transactions by domestic branches in international operations is calculated by the monthly currentmethod.
013_0800804262908.indd 266 2017/08/08 14:56:21
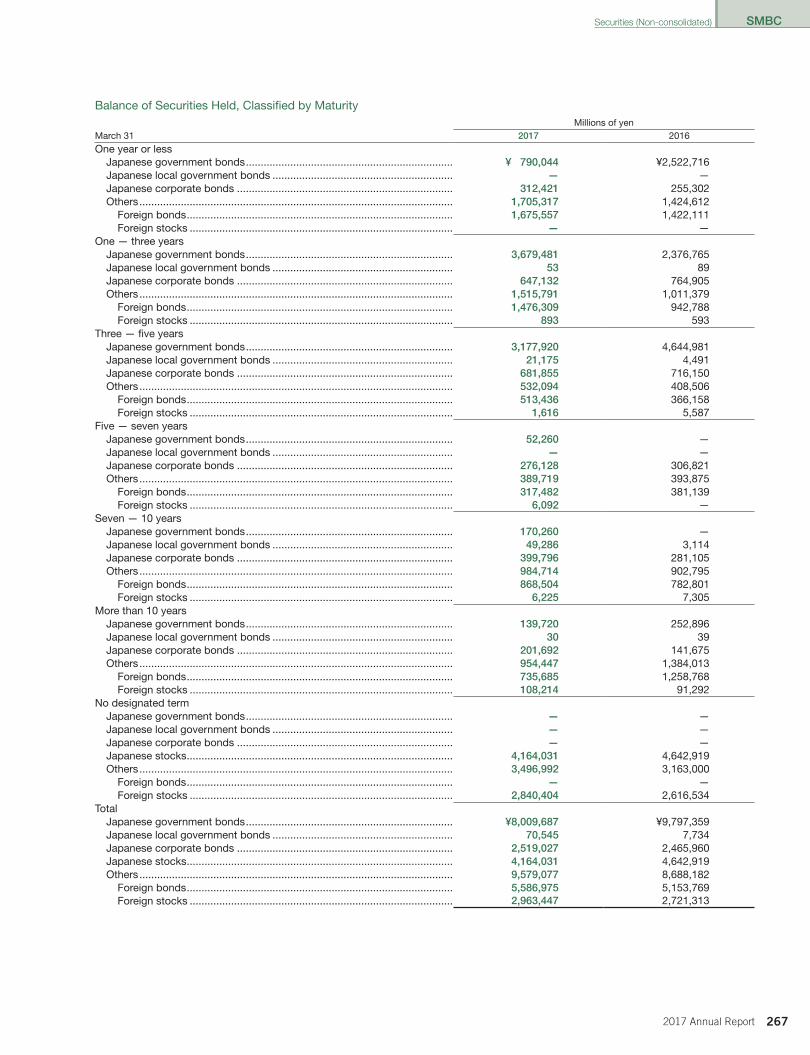
SMBC
2672017 Annual Report
Balance of Securities Held, Classified by MaturityMillions of yen
March 31 2017 2016
One year or lessJapanese government bonds ���������������������������������������������������������������������� ¥ 790,044 ¥2,522,716Japanese local government bonds ������������������������������������������������������������� — —Japanese corporate bonds ������������������������������������������������������������������������� 312,421 255,302Others ���������������������������������������������������������������������������������������������������������� 1,705,317 1,424,612
Foreign bonds ������������������������������������������������������������������������������������������ 1,675,557 1,422,111Foreign stocks ����������������������������������������������������������������������������������������� — —
One — three yearsJapanese government bonds ���������������������������������������������������������������������� 3,679,481 2,376,765Japanese local government bonds ������������������������������������������������������������� 53 89Japanese corporate bonds ������������������������������������������������������������������������� 647,132 764,905Others ���������������������������������������������������������������������������������������������������������� 1,515,791 1,011,379
Foreign bonds ������������������������������������������������������������������������������������������ 1,476,309 942,788Foreign stocks ����������������������������������������������������������������������������������������� 893 593
Three — five yearsJapanese government bonds ���������������������������������������������������������������������� 3,177,920 4,644,981Japanese local government bonds ������������������������������������������������������������� 21,175 4,491Japanese corporate bonds ������������������������������������������������������������������������� 681,855 716,150Others ���������������������������������������������������������������������������������������������������������� 532,094 408,506
Foreign bonds ������������������������������������������������������������������������������������������ 513,436 366,158Foreign stocks ����������������������������������������������������������������������������������������� 1,616 5,587
Five — seven yearsJapanese government bonds ���������������������������������������������������������������������� 52,260 —Japanese local government bonds ������������������������������������������������������������� — —Japanese corporate bonds ������������������������������������������������������������������������� 276,128 306,821Others ���������������������������������������������������������������������������������������������������������� 389,719 393,875
Foreign bonds ������������������������������������������������������������������������������������������ 317,482 381,139Foreign stocks ����������������������������������������������������������������������������������������� 6,092 —
Seven — 10 yearsJapanese government bonds ���������������������������������������������������������������������� 170,260 —Japanese local government bonds ������������������������������������������������������������� 49,286 3,114Japanese corporate bonds ������������������������������������������������������������������������� 399,796 281,105Others ���������������������������������������������������������������������������������������������������������� 984,714 902,795
Foreign bonds ������������������������������������������������������������������������������������������ 868,504 782,801Foreign stocks ����������������������������������������������������������������������������������������� 6,225 7,305
More than 10 yearsJapanese government bonds ���������������������������������������������������������������������� 139,720 252,896Japanese local government bonds ������������������������������������������������������������� 30 39Japanese corporate bonds ������������������������������������������������������������������������� 201,692 141,675Others ���������������������������������������������������������������������������������������������������������� 954,447 1,384,013
Foreign bonds ������������������������������������������������������������������������������������������ 735,685 1,258,768Foreign stocks ����������������������������������������������������������������������������������������� 108,214 91,292
No designated termJapanese government bonds ���������������������������������������������������������������������� — —Japanese local government bonds ������������������������������������������������������������� — —Japanese corporate bonds ������������������������������������������������������������������������� — —Japanese stocks ������������������������������������������������������������������������������������������ 4,164,031 4,642,919Others ���������������������������������������������������������������������������������������������������������� 3,496,992 3,163,000
Foreign bonds ������������������������������������������������������������������������������������������ — —Foreign stocks ����������������������������������������������������������������������������������������� 2,840,404 2,616,534
TotalJapanese government bonds ���������������������������������������������������������������������� ¥8,009,687 ¥9,797,359Japanese local government bonds ������������������������������������������������������������� 70,545 7,734Japanese corporate bonds ������������������������������������������������������������������������� 2,519,027 2,465,960Japanese stocks ������������������������������������������������������������������������������������������ 4,164,031 4,642,919Others ���������������������������������������������������������������������������������������������������������� 9,579,077 8,688,182
Foreign bonds ������������������������������������������������������������������������������������������ 5,586,975 5,153,769Foreign stocks ����������������������������������������������������������������������������������������� 2,963,447 2,721,313
Securities (Non-consolidated)
013_0800804262908.indd 267 2017/08/08 14:56:22
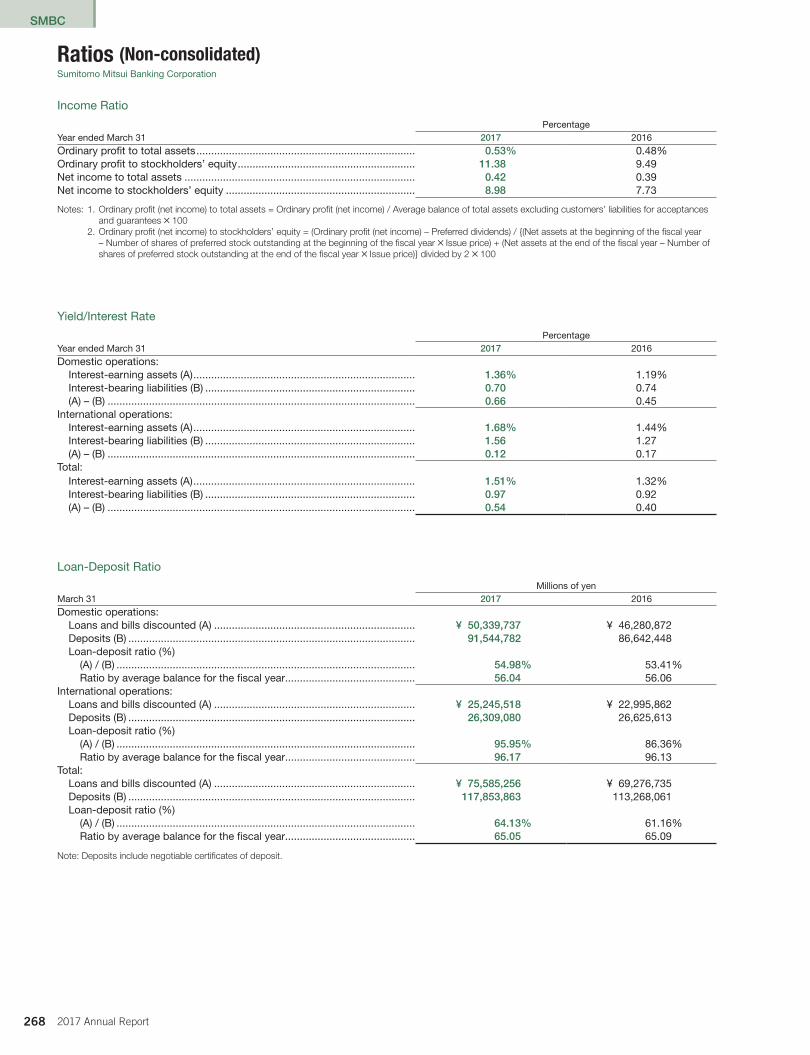
SMBC
268 2017 Annual Report
Ratios (Non-consolidated)Sumitomo Mitsui Banking Corporation
Income Ratio
PercentageYear ended March 31 2017 2016Ordinary profit to total assets �������������������������������������������������������������������������� 0.53% 0�48%Ordinary profit to stockholders’ equity ������������������������������������������������������������ 11.38 9�49Net income to total assets ������������������������������������������������������������������������������ 0.42 0�39Net income to stockholders’ equity ���������������������������������������������������������������� 8.98 7�73
Notes: 1. Ordinary profit (net income) to total assets = Ordinary profit (net income) / Average balance of total assets excluding customers’ liabilities for acceptancesand guarantees ✕ 100
2. Ordinary profit (net income) to stockholders’ equity = (Ordinary profit (net income) – Preferred dividends) / {(Net assets at the beginning of the fiscal year– Number of shares of preferred stock outstanding at the beginning of the fiscal year ✕ Issue price) + (Net assets at the end of the fiscal year – Number ofshares of preferred stock outstanding at the end of the fiscal year ✕ Issue price)} divided by 2 ✕ 100
Yield/Interest Rate
PercentageYear ended March 31 2017 2016Domestic operations:
Interest-earning assets (A) ��������������������������������������������������������������������������� 1.36% 1�19%Interest-bearing liabilities (B) ����������������������������������������������������������������������� 0.70 0�74(A) – (B) �������������������������������������������������������������������������������������������������������� 0.66 0�45
International operations:Interest-earning assets (A) ��������������������������������������������������������������������������� 1.68% 1�44%Interest-bearing liabilities (B) ����������������������������������������������������������������������� 1.56 1�27(A) – (B) �������������������������������������������������������������������������������������������������������� 0.12 0�17
Total:Interest-earning assets (A) ��������������������������������������������������������������������������� 1.51% 1�32%Interest-bearing liabilities (B) ����������������������������������������������������������������������� 0.97 0�92(A) – (B) �������������������������������������������������������������������������������������������������������� 0.54 0�40
Loan-Deposit Ratio
Millions of yen March 31 2017 2016Domestic operations:
Loans and bills discounted (A) �������������������������������������������������������������������� ¥ 50,339,737 ¥ 46,280,872Deposits (B) ������������������������������������������������������������������������������������������������� 91,544,782 86,642,448Loan-deposit ratio (%)
(A) / (B) ����������������������������������������������������������������������������������������������������� 54.98% 53�41%Ratio by average balance for the fiscal year �������������������������������������������� 56.04 56�06
International operations:Loans and bills discounted (A) �������������������������������������������������������������������� ¥ 25,245,518 ¥ 22,995,862Deposits (B) ������������������������������������������������������������������������������������������������� 26,309,080 26,625,613Loan-deposit ratio (%)
(A) / (B) ����������������������������������������������������������������������������������������������������� 95.95% 86�36%Ratio by average balance for the fiscal year �������������������������������������������� 96.17 96�13
Total:Loans and bills discounted (A) �������������������������������������������������������������������� ¥ 75,585,256 ¥ 69,276,735Deposits (B) ������������������������������������������������������������������������������������������������� 117,853,863 113,268,061Loan-deposit ratio (%)
(A) / (B) ����������������������������������������������������������������������������������������������������� 64.13% 61�16%Ratio by average balance for the fiscal year �������������������������������������������� 65.05 65�09
Note: Deposits include negotiable certificates of deposit.
013_0800804262908.indd 268 2017/08/08 14:56:22

SMBC
2692017 Annual Report
Securities-Deposit Ratio
Millions of yen March 31 2017 2016Domestic operations:
Securities (A) ������������������������������������������������������������������������������������������������ ¥ 15,791,947 ¥ 17,727,073Deposits (B) ������������������������������������������������������������������������������������������������� 91,544,782 86,642,448Securities-deposit ratio (%)
(A) / (B) ����������������������������������������������������������������������������������������������������� 17.25% 20�46%Ratio by average balance for the fiscal year �������������������������������������������� 16.62 24�05
International operations:Securities (A) ������������������������������������������������������������������������������������������������ ¥ 8,550,422 ¥ 7,875,082Deposits (B) ������������������������������������������������������������������������������������������������� 26,309,080 26,625,613Securities-deposit ratio (%)
(A) / (B) ����������������������������������������������������������������������������������������������������� 32.49% 29�57%Ratio by average balance for the fiscal year �������������������������������������������� 28.94 27�67
Total:Securities (A) ������������������������������������������������������������������������������������������������ ¥ 24,342,369 ¥ 25,602,156Deposits (B) ������������������������������������������������������������������������������������������������� 117,853,863 113,268,061Securities-deposit ratio (%)
(A) / (B) ����������������������������������������������������������������������������������������������������� 20.65% 22�60%Ratio by average balance for the fiscal year �������������������������������������������� 19.39 24�87
Note: Deposits include negotiable certificates of deposit.
Ratios (Non-consolidated)
013_0800804262908.indd 269 2017/08/08 14:56:22
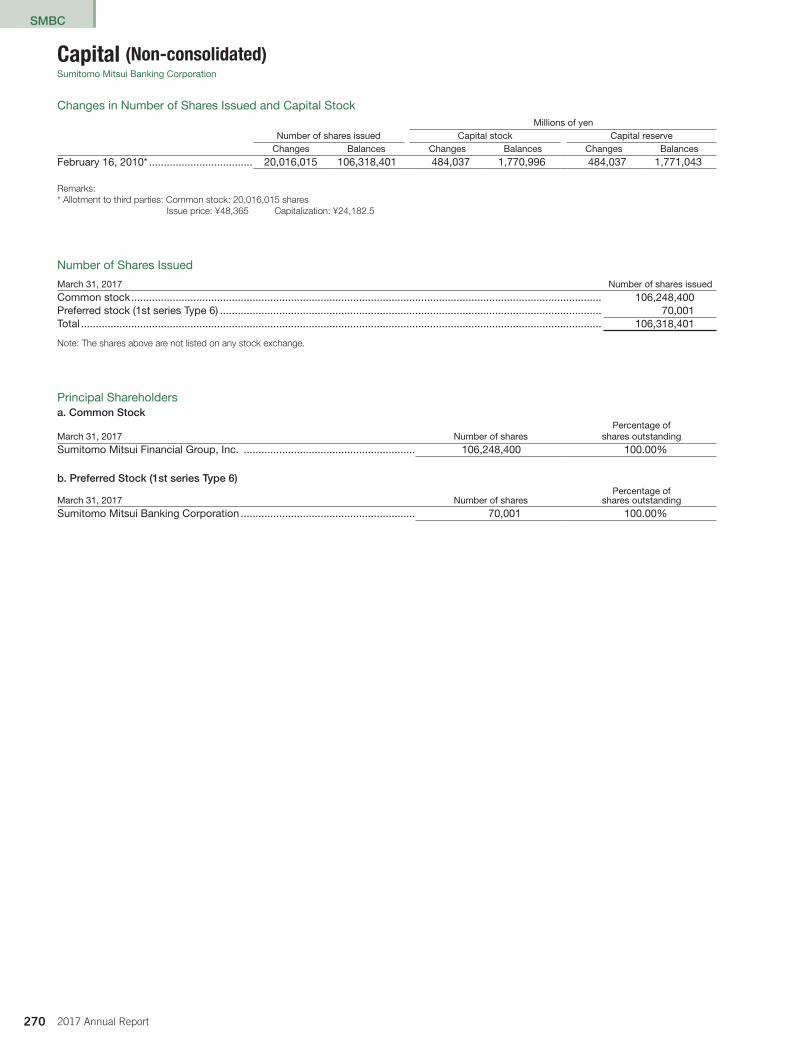
SMBC
270 2017 Annual Report
Capital (Non-consolidated)Sumitomo Mitsui Banking Corporation
Changes in Number of Shares Issued and Capital StockMillions of yen
Number of shares issued Capital stock Capital reserveChanges Balances Changes Balances Changes Balances
February 16, 2010* ����������������������������������� 20,016,015 106,318,401 484,037 1,770,996 484,037 1,771,043
Remarks:* Allotment to third parties: Common stock: 20,016,015 shares
Issue price: ¥48,365 Capitalization: ¥24,182.5
Number of Shares Issued
March 31, 2017 Number of shares issuedCommon stock ��������������������������������������������������������������������������������������������������������������������������������������������������������������� 106,248,400Preferred stock (1st series Type 6) ��������������������������������������������������������������������������������������������������������������������������������� 70,001Total �������������������������������������������������������������������������������������������������������������������������������������������������������������������������������� 106,318,401
Note: The shares above are not listed on any stock exchange.
Principal Shareholdersa. Common Stock
March 31, 2017 Number of sharesPercentage of
shares outstandingSumitomo Mitsui Financial Group, Inc� ���������������������������������������������������������� 106,248,400 100�00%
b. Preferred Stock (1st series Type 6)
March 31, 2017 Number of sharesPercentage of
shares outstandingSumitomo Mitsui Banking Corporation ����������������������������������������������������������� 70,001 100�00%
013_0800804262908.indd 270 2017/08/08 14:56:22
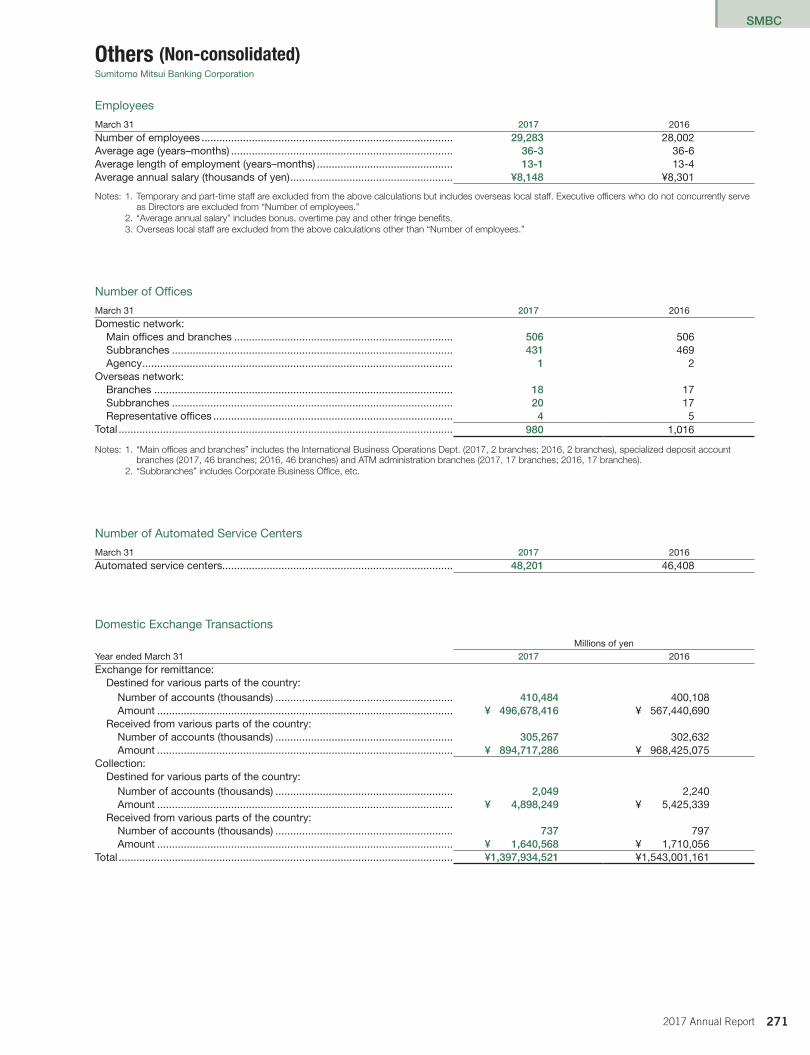
SMBC
2712017 Annual Report
Others (Non-consolidated)Sumitomo Mitsui Banking Corporation
Employees
March 31 2017 2016Number of employees ������������������������������������������������������������������������������������� 29,283 28,002Average age (years–months) ��������������������������������������������������������������������������� 36-3 36-6Average length of employment (years–months) ���������������������������������������������� 13-1 13-4Average annual salary (thousands of yen) ������������������������������������������������������� ¥8,148 ¥8,301
Notes: 1. Temporary and part-time staff are excluded from the above calculations but includes overseas local staff. Executive officers who do not concurrently serveas Directors are excluded from “Number of employees.”
2. “Average annual salary” includes bonus, overtime pay and other fringe benefits.3. Overseas local staff are excluded from the above calculations other than “Number of employees.”
Number of Offices
March 31 2017 2016Domestic network:
Main offices and branches �������������������������������������������������������������������������� 506 506Subbranches ����������������������������������������������������������������������������������������������� 431 469Agency ��������������������������������������������������������������������������������������������������������� 1 2
Overseas network:Branches ����������������������������������������������������������������������������������������������������� 18 17Subbranches ����������������������������������������������������������������������������������������������� 20 17Representative offices ��������������������������������������������������������������������������������� 4 5
Total ����������������������������������������������������������������������������������������������������������������� 980 1,016
Notes: 1. “Main offices and branches” includes the International Business Operations Dept. (2017, 2 branches; 2016, 2 branches), specialized deposit account branches (2017, 46 branches; 2016, 46 branches) and ATM administration branches (2017, 17 branches; 2016, 17 branches).
2. “Subbranches” includes Corporate Business Office, etc.
Number of Automated Service Centers
March 31 2017 2016Automated service centers������������������������������������������������������������������������������ 48,201 46,408
Domestic Exchange Transactions
Millions of yen Year ended March 31 2017 2016Exchange for remittance:
Destined for various parts of the country:Number of accounts (thousands) ������������������������������������������������������������ 410,484 400,108Amount ���������������������������������������������������������������������������������������������������� ¥ 496,678,416 ¥ 567,440,690
Received from various parts of the country:Number of accounts (thousands) ������������������������������������������������������������ 305,267 302,632Amount ���������������������������������������������������������������������������������������������������� ¥ 894,717,286 ¥ 968,425,075
Collection:Destined for various parts of the country:
Number of accounts (thousands) ������������������������������������������������������������ 2,049 2,240Amount ���������������������������������������������������������������������������������������������������� ¥ 4,898,249 ¥ 5,425,339
Received from various parts of the country:Number of accounts (thousands) ������������������������������������������������������������ 737 797Amount ���������������������������������������������������������������������������������������������������� ¥ 1,640,568 ¥ 1,710,056
Total ����������������������������������������������������������������������������������������������������������������� ¥1,397,934,521 ¥1,543,001,161
013_0800804262908.indd 271 2017/08/08 14:56:22
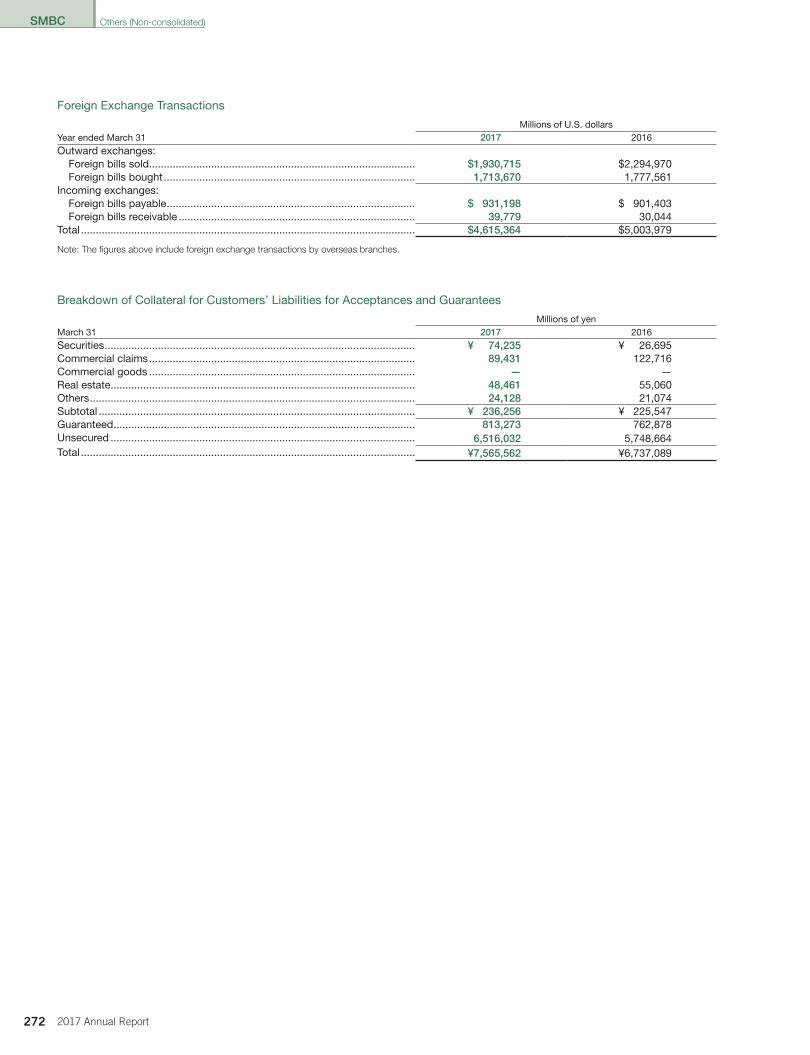
SMBC
272 2017 Annual Report
Foreign Exchange Transactions
Millions of U�S� dollarsYear ended March 31 2017 2016Outward exchanges:
Foreign bills sold������������������������������������������������������������������������������������������ $1,930,715 $2,294,970Foreign bills bought ������������������������������������������������������������������������������������� 1,713,670 1,777,561
Incoming exchanges:Foreign bills payable ������������������������������������������������������������������������������������ $ 931,198 $ 901,403Foreign bills receivable �������������������������������������������������������������������������������� 39,779 30,044
Total ����������������������������������������������������������������������������������������������������������������� $4,615,364 $5,003,979
Note: The figures above include foreign exchange transactions by overseas branches.
Breakdown of Collateral for Customers’ Liabilities for Acceptances and Guarantees
Millions of yenMarch 31 2017 2016Securities ��������������������������������������������������������������������������������������������������������� ¥ 74,235 ¥ 26,695Commercial claims ������������������������������������������������������������������������������������������ 89,431 122,716Commercial goods ������������������������������������������������������������������������������������������ — —Real estate ������������������������������������������������������������������������������������������������������� 48,461 55,060Others �������������������������������������������������������������������������������������������������������������� 24,128 21,074Subtotal ����������������������������������������������������������������������������������������������������������� ¥ 236,256 ¥ 225,547Guaranteed ������������������������������������������������������������������������������������������������������ 813,273 762,878Unsecured ������������������������������������������������������������������������������������������������������� 6,516,032 5,748,664Total ����������������������������������������������������������������������������������������������������������������� ¥7,565,562 ¥6,737,089
Others (Non-consolidated)
013_0800804262908.indd 272 2017/08/08 14:56:22

SMBC
2732017 Annual Report
Trust Assets and Liabilities (Non-consolidated)Sumitomo Mitsui Banking Corporation
Statements of Trust Assets and Liabilities
Millions of yen March 31 2017 2016Assets:
Loans and bills discounted �������������������������������������������������������������������������� ¥ 635,206 ¥ 537,839Loans on deeds ��������������������������������������������������������������������������������������� 635,206 537,839
Securities ����������������������������������������������������������������������������������������������������� 4,156,409 1,305,284Japanese government bonds ������������������������������������������������������������������ 126,392 221,728Corporate bonds�������������������������������������������������������������������������������������� 3,990,300 1,073,615Japanese stocks �������������������������������������������������������������������������������������� — —Foreign securities������������������������������������������������������������������������������������� 39,716 9,940
Trust beneficiary right ���������������������������������������������������������������������������������� 38,583 36,269Entrusted securities ������������������������������������������������������������������������������������� 20,211 7,123Monetary claims ������������������������������������������������������������������������������������������ 759,095 474,129
Monetary claims for housing loans ���������������������������������������������������������� 11,906 15,964Other monetary claims ���������������������������������������������������������������������������� 747,188 458,165
Other claims ������������������������������������������������������������������������������������������������ 1,215 1,429Call loans ����������������������������������������������������������������������������������������������������� — —Due from banking account �������������������������������������������������������������������������� 1,158,780 920,070Cash and due from banks ��������������������������������������������������������������������������� 111,699 112,024
Deposits with banks �������������������������������������������������������������������������������� 111,699 112,024Others ���������������������������������������������������������������������������������������������������������� 208 —
Others ������������������������������������������������������������������������������������������������������ 208 —Total assets �������������������������������������������������������������������������������������������������� ¥6,881,408 ¥3,394,170
Liabilities:Designated money trusts����������������������������������������������������������������������������� ¥1,225,851 ¥1,059,035Specified money trusts �������������������������������������������������������������������������������� 1,855,753 1,750,117Money in trusts other than money trusts ����������������������������������������������������� 100,000 100,000Securities in trusts ��������������������������������������������������������������������������������������� 20,211 7,123Monetary claims trusts �������������������������������������������������������������������������������� 420,242 477,772Composite trusts ����������������������������������������������������������������������������������������� 3,259,349 122Total liabilities ���������������������������������������������������������������������������������������������� ¥6,881,408 ¥3,394,170
Notes: 1. Amounts less than 1 million yen have been rounded down.2. SMBC has no co-operative trusts under any other trust bank’s administration as of the year-end.3. Excludes trusts whose monetary values are difficult to calculate.
013_0800804262908.indd 273 2017/08/08 14:56:22
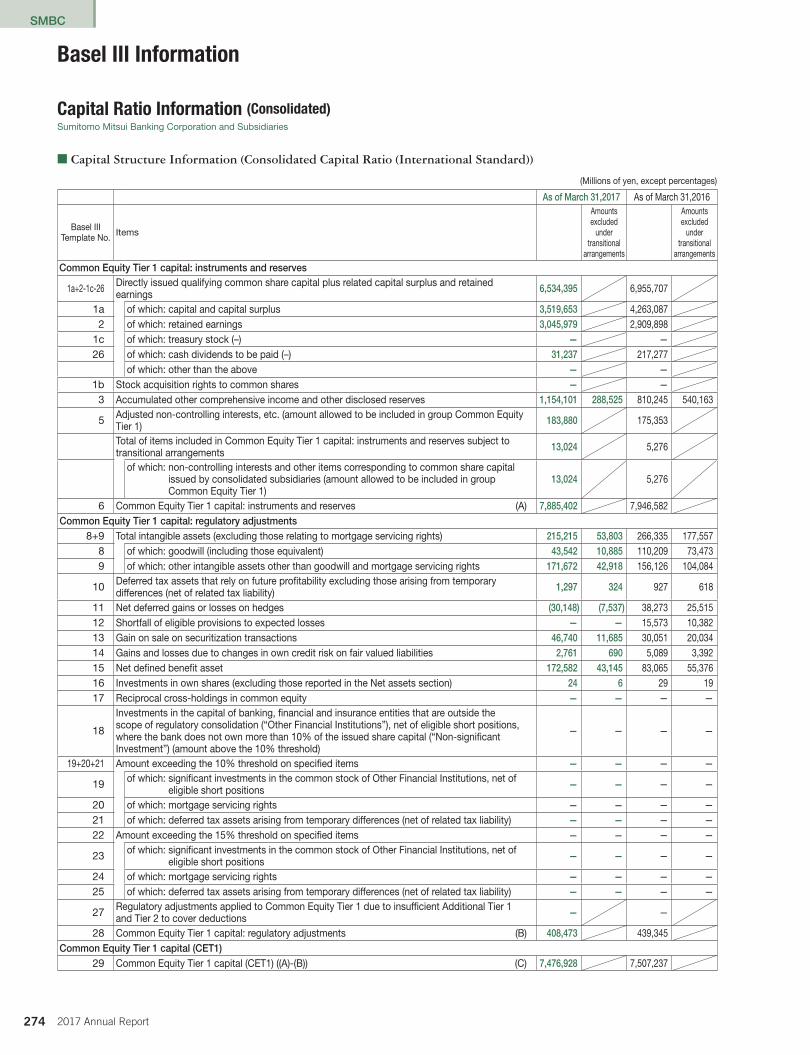
SMBC
274 2017 Annual Report
■ Capital Structure Information (Consolidated Capital Ratio (International Standard))
(Millions of yen, except percentages)
As of March 31,2017 As of March 31,2016
Basel IIITemplate No. Items
Amounts excluded
under transitional
arrangements
Amounts excluded
under transitional
arrangements
Common Equity Tier 1 capital: instruments and reserves
1a+2-1c-26 Directly issued qualifying common share capital plus related capital surplus and retainedearnings 6,534,395 6,955,707
1a of which: capital and capital surplus 3,519,653 4,263,0872 of which: retained earnings 3,045,979 2,909,898
1c of which: treasury stock (–) — —26 of which: cash dividends to be paid (–) 31,237 217,277
of which: other than the above — —1b Stock acquisition rights to common shares — —
3 Accumulated other comprehensive income and other disclosed reserves 1,154,101 288,525 810,245 540,163
5 Adjusted non-controlling interests, etc. (amount allowed to be included in group Common Equity Tier 1) 183,880 175,353
Total of items included in Common Equity Tier 1 capital: instruments and reserves subject totransitional arrangements 13,024 5,276
of which: non-controlling interests and other items corresponding to common share capital issued by consolidated subsidiaries (amount allowed to be included in group Common Equity Tier 1)
13,024 5,276
6 Common Equity Tier 1 capital: instruments and reserves (A) 7,885,402 7,946,582Common Equity Tier 1 capital: regulatory adjustments
8+9 Total intangible assets (excluding those relating to mortgage servicing rights) 215,215 53,803 266,335 177,5578 of which: goodwill (including those equivalent) 43,542 10,885 110,209 73,4739 of which: other intangible assets other than goodwill and mortgage servicing rights 171,672 42,918 156,126 104,084
10 Deferred tax assets that rely on future profitability excluding those arising from temporarydifferences (net of related tax liability) 1,297 324 927 618
11 Net deferred gains or losses on hedges (30,148) (7,537) 38,273 25,51512 Shortfall of eligible provisions to expected losses — — 15,573 10,38213 Gain on sale on securitization transactions 46,740 11,685 30,051 20,03414 Gains and losses due to changes in own credit risk on fair valued liabilities 2,761 690 5,089 3,39215 Net defined benefit asset 172,582 43,145 83,065 55,37616 Investments in own shares (excluding those reported in the Net assets section) 24 6 29 1917 Reciprocal cross-holdings in common equity — — — —
18
Investments in the capital of banking, financial and insurance entities that are outside thescope of regulatory consolidation (“Other Financial Institutions”), net of eligible short positions,where the bank does not own more than 10% of the issued share capital (“Non-significantInvestment”) (amount above the 10% threshold)
— — — —
19+20+21 Amount exceeding the 10% threshold on specified items — — — —
19 of which: significant investments in the common stock of Other Financial Institutions, net of eligible short positions — — — —
20 of which: mortgage servicing rights — — — —21 of which: deferred tax assets arising from temporary differences (net of related tax liability) — — — —22 Amount exceeding the 15% threshold on specified items — — — —
23 of which: significant investments in the common stock of Other Financial Institutions, net of eligible short positions — — — —
24 of which: mortgage servicing rights — — — —25 of which: deferred tax assets arising from temporary differences (net of related tax liability) — — — —
27 Regulatory adjustments applied to Common Equity Tier 1 due to insufficient Additional Tier 1and Tier 2 to cover deductions — —
28 Common Equity Tier 1 capital: regulatory adjustments (B) 408,473 439,345Common Equity Tier 1 capital (CET1)
29 Common Equity Tier 1 capital (CET1) ((A)-(B)) (C) 7,476,928 7,507,237
Capital Ratio Information (Consolidated)Sumitomo Mitsui Banking Corporation and Subsidiaries
Basel III Information
014_0800885852907.indd 274 2017/08/10 14:19:31
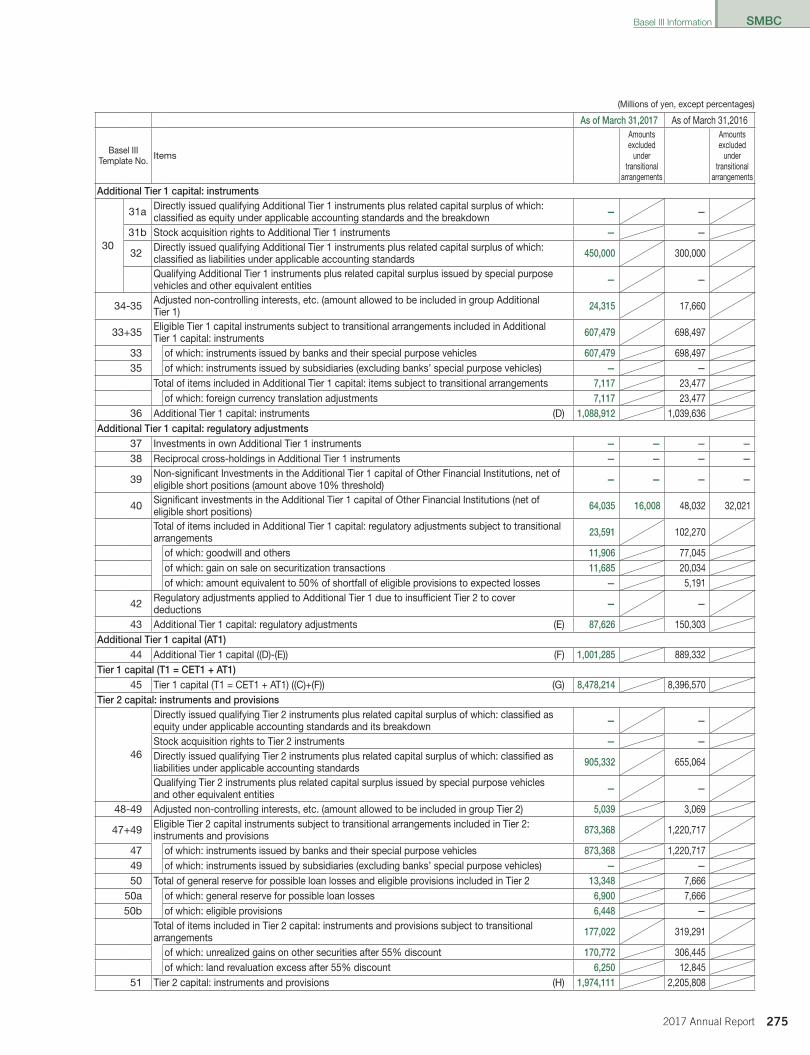
SMBC
2752017 Annual Report
SMBC
(Millions of yen, except percentages)
As of March 31,2017 As of March 31,2016
Basel IIITemplate No. Items
Amounts excluded
under transitional
arrangements
Amounts excluded
under transitional
arrangements
Additional Tier 1 capital: instruments
30
31a Directly issued qualifying Additional Tier 1 instruments plus related capital surplus of which:classified as equity under applicable accounting standards and the breakdown — —
31b Stock acquisition rights to Additional Tier 1 instruments — —
32 Directly issued qualifying Additional Tier 1 instruments plus related capital surplus of which:classified as liabilities under applicable accounting standards 450,000 300,000
Qualifying Additional Tier 1 instruments plus related capital surplus issued by special purposevehicles and other equivalent entities — —
34-35 Adjusted non-controlling interests, etc. (amount allowed to be included in group Additional Tier 1) 24,315 17,660
33+35 Eligible Tier 1 capital instruments subject to transitional arrangements included in AdditionalTier 1 capital: instruments 607,479 698,497
33 of which: instruments issued by banks and their special purpose vehicles 607,479 698,49735 of which: instruments issued by subsidiaries (excluding banks’ special purpose vehicles) — —
Total of items included in Additional Tier 1 capital: items subject to transitional arrangements 7,117 23,477of which: foreign currency translation adjustments 7,117 23,477
36 Additional Tier 1 capital: instruments (D) 1,088,912 1,039,636Additional Tier 1 capital: regulatory adjustments
37 Investments in own Additional Tier 1 instruments — — — —38 Reciprocal cross-holdings in Additional Tier 1 instruments — — — —
39 Non-significant Investments in the Additional Tier 1 capital of Other Financial Institutions, net ofeligible short positions (amount above 10% threshold) — — — —
40 Significant investments in the Additional Tier 1 capital of Other Financial Institutions (net ofeligible short positions) 64,035 16,008 48,032 32,021
Total of items included in Additional Tier 1 capital: regulatory adjustments subject to transitionalarrangements 23,591 102,270
of which: goodwill and others 11,906 77,045of which: gain on sale on securitization transactions 11,685 20,034of which: amount equivalent to 50% of shortfall of eligible provisions to expected losses — 5,191
42 Regulatory adjustments applied to Additional Tier 1 due to insufficient Tier 2 to coverdeductions — —
43 Additional Tier 1 capital: regulatory adjustments (E) 87,626 150,303Additional Tier 1 capital (AT1)
44 Additional Tier 1 capital ((D)-(E)) (F) 1,001,285 889,332Tier 1 capital (T1 = CET1 + AT1)
45 Tier 1 capital (T1 = CET1 + AT1) ((C)+(F)) (G) 8,478,214 8,396,570Tier 2 capital: instruments and provisions
46
Directly issued qualifying Tier 2 instruments plus related capital surplus of which: classified asequity under applicable accounting standards and its breakdown — —
Stock acquisition rights to Tier 2 instruments — —Directly issued qualifying Tier 2 instruments plus related capital surplus of which: classified asliabilities under applicable accounting standards 905,332 655,064
Qualifying Tier 2 instruments plus related capital surplus issued by special purpose vehiclesand other equivalent entities — —
48-49 Adjusted non-controlling interests, etc. (amount allowed to be included in group Tier 2) 5,039 3,069
47+49 Eligible Tier 2 capital instruments subject to transitional arrangements included in Tier 2:instruments and provisions 873,368 1,220,717
47 of which: instruments issued by banks and their special purpose vehicles 873,368 1,220,71749 of which: instruments issued by subsidiaries (excluding banks’ special purpose vehicles) — —50 Total of general reserve for possible loan losses and eligible provisions included in Tier 2 13,348 7,666
50a of which: general reserve for possible loan losses 6,900 7,66650b of which: eligible provisions 6,448 —
Total of items included in Tier 2 capital: instruments and provisions subject to transitionalarrangements 177,022 319,291
of which: unrealized gains on other securities after 55% discount 170,772 306,445of which: land revaluation excess after 55% discount 6,250 12,845
51 Tier 2 capital: instruments and provisions (H) 1,974,111 2,205,808
Basel III Information
014_0800885852907.indd 275 2017/08/10 14:19:31
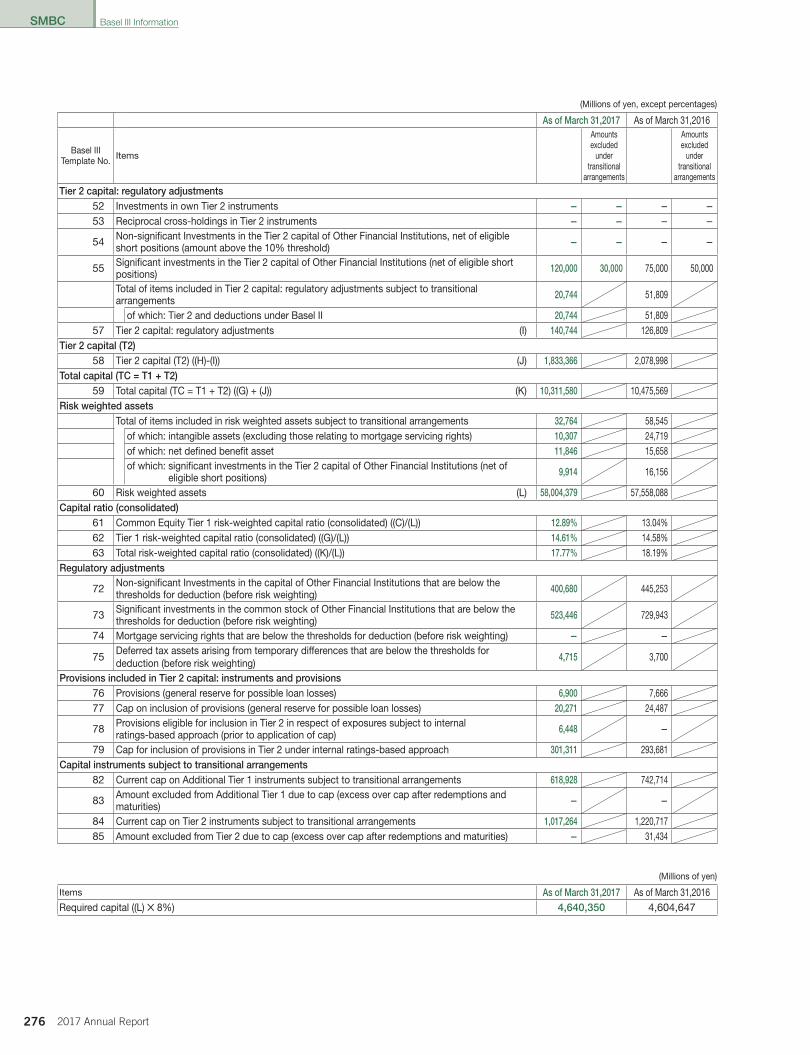
SMBC
276 2017 Annual Report
SMBC
(Millions of yen, except percentages)
As of March 31,2017 As of March 31,2016
Basel IIITemplate No. Items
Amounts excluded
under transitional
arrangements
Amounts excluded
under transitional
arrangements
Tier 2 capital: regulatory adjustments52 Investments in own Tier 2 instruments — — — —53 Reciprocal cross-holdings in Tier 2 instruments — — — —
54 Non-significant Investments in the Tier 2 capital of Other Financial Institutions, net of eligibleshort positions (amount above the 10% threshold) — — — —
55 Significant investments in the Tier 2 capital of Other Financial Institutions (net of eligible shortpositions) 120,000 30,000 75,000 50,000
Total of items included in Tier 2 capital: regulatory adjustments subject to transitionalarrangements 20,744 51,809
of which: Tier 2 and deductions under Basel II 20,744 51,80957 Tier 2 capital: regulatory adjustments (I) 140,744 126,809
Tier 2 capital (T2)58 Tier 2 capital (T2) ((H)-(I)) (J) 1,833,366 2,078,998
Total capital (TC = T1 + T2)59 Total capital (TC = T1 + T2) ((G) + (J)) (K) 10,311,580 10,475,569
Risk weighted assetsTotal of items included in risk weighted assets subject to transitional arrangements 32,764 58,545
of which: intangible assets (excluding those relating to mortgage servicing rights) 10,307 24,719of which: net defined benefit asset 11,846 15,658of which: significant investments in the Tier 2 capital of Other Financial Institutions (net of
eligible short positions) 9,914 16,156
60 Risk weighted assets (L) 58,004,379 57,558,088Capital ratio (consolidated)
61 Common Equity Tier 1 risk-weighted capital ratio (consolidated) ((C)/(L)) 12.89% 13.04%62 Tier 1 risk-weighted capital ratio (consolidated) ((G)/(L)) 14.61% 14.58%63 Total risk-weighted capital ratio (consolidated) ((K)/(L)) 17.77% 18.19%
Regulatory adjustments
72 Non-significant Investments in the capital of Other Financial Institutions that are below thethresholds for deduction (before risk weighting) 400,680 445,253
73 Significant investments in the common stock of Other Financial Institutions that are below thethresholds for deduction (before risk weighting) 523,446 729,943
74 Mortgage servicing rights that are below the thresholds for deduction (before risk weighting) — —
75Deferred tax assets arising from temporary differences that are below the thresholds fordeduction (before risk weighting)
4,715 3,700
Provisions included in Tier 2 capital: instruments and provisions76 Provisions (general reserve for possible loan losses) 6,900 7,66677 Cap on inclusion of provisions (general reserve for possible loan losses) 20,271 24,487
78 Provisions eligible for inclusion in Tier 2 in respect of exposures subject to internalratings-based approach (prior to application of cap) 6,448 —
79 Cap for inclusion of provisions in Tier 2 under internal ratings-based approach 301,311 293,681Capital instruments subject to transitional arrangements
82 Current cap on Additional Tier 1 instruments subject to transitional arrangements 618,928 742,714
83 Amount excluded from Additional Tier 1 due to cap (excess over cap after redemptions andmaturities) — —
84 Current cap on Tier 2 instruments subject to transitional arrangements 1,017,264 1,220,71785 Amount excluded from Tier 2 due to cap (excess over cap after redemptions and maturities) — 31,434
(Millions of yen)
Items As of March 31,2017 As of March 31,2016Required capital ((L) ✕ 8%) 4,640,350 4,604,647
Basel III Information
014_0800885852907.indd 276 2017/08/10 14:19:31
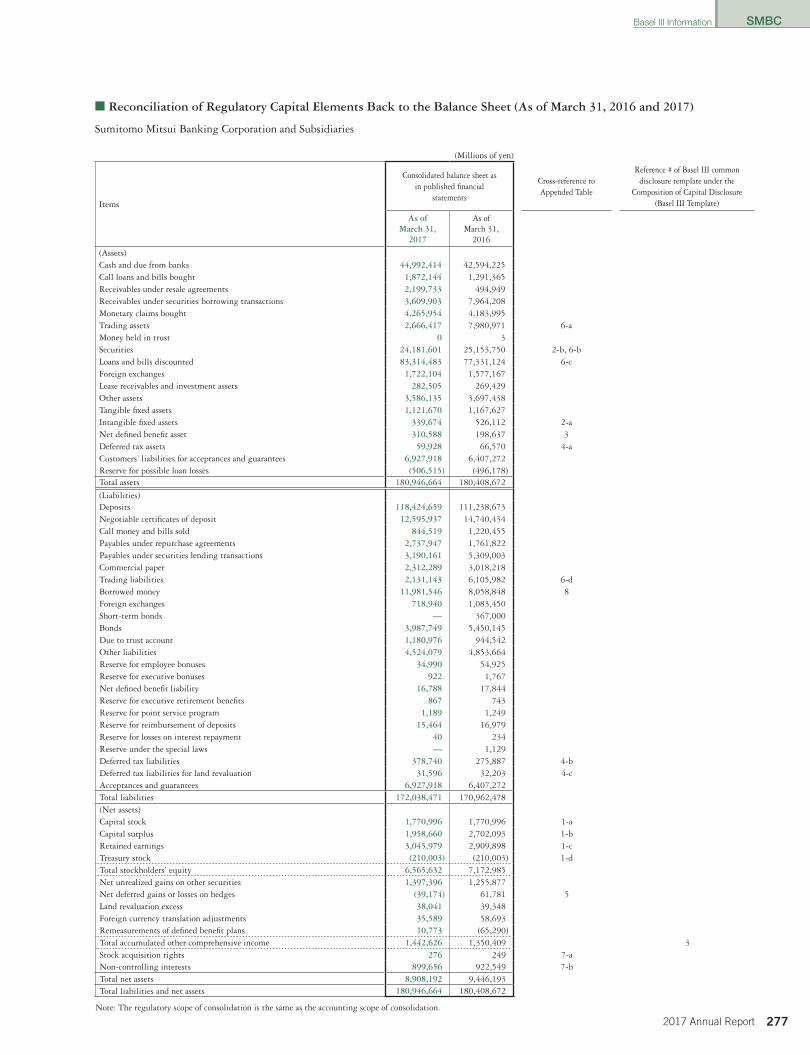
SMBC
2772017 Annual Report
SMBC
■ Reconciliation of Regulatory Capital Elements Back to the Balance Sheet (As of March 31, 2016 and 2017)
Sumitomo Mitsui Banking Corporation and Subsidiaries
(Millions of yen)
Items
Consolidated balance sheet as in published financial
statements
Cross-reference toAppended Table
Reference # of Basel III commondisclosure template under the
Composition of Capital Disclosure(Basel III Template)
As of March 31,
2017
As of March 31,
2016
(Assets)Cash and due from banks 44,992,414 42,594,225Call loans and bills bought 1,872,144 1,291,365Receivables under resale agreements 2,199,733 494,949Receivables under securities borrowing transactions 3,609,903 7,964,208Monetary claims bought 4,265,954 4,183,995Trading assets 2,666,417 7,980,971 6-aMoney held in trust 0 3Securities 24,181,601 25,153,750 2-b, 6-bLoans and bills discounted 83,314,483 77,331,124 6-cForeign exchanges 1,722,104 1,577,167Lease receivables and investment assets 282,505 269,429Other assets 3,586,135 3,697,438Tangible fixed assets 1,121,670 1,167,627Intangible fixed assets 339,674 526,112 2-aNet defined benefit asset 310,588 198,637 3Deferred tax assets 59,928 66,570 4-aCustomers’ liabilities for acceptances and guarantees 6,927,918 6,407,272Reserve for possible loan losses (506,515) (496,178)Total assets 180,946,664 180,408,672
(Liabilities)Deposits 118,424,659 111,238,673Negotiable certificates of deposit 12,595,937 14,740,434Call money and bills sold 844,519 1,220,455Payables under repurchase agreements 2,737,947 1,761,822Payables under securities lending transactions 3,190,161 5,309,003Commercial paper 2,312,289 3,018,218Trading liabilities 2,131,143 6,105,982 6-dBorrowed money 11,981,546 8,058,848 8Foreign exchanges 718,940 1,083,450Short-term bonds — 367,000Bonds 3,987,749 5,450,145Due to trust account 1,180,976 944,542Other liabilities 4,524,079 4,853,664Reserve for employee bonuses 34,990 54,925Reserve for executive bonuses 922 1,767Net defined benefit liability 16,788 17,844Reserve for executive retirement benefits 867 743Reserve for point service program 1,189 1,249Reserve for reimbursement of deposits 15,464 16,979Reserve for losses on interest repayment 40 234Reserve under the special laws — 1,129Deferred tax liabilities 378,740 275,887 4-bDeferred tax liabilities for land revaluation 31,596 32,203 4-cAcceptances and guarantees 6,927,918 6,407,272Total liabilities 172,038,471 170,962,478(Net assets)Capital stock 1,770,996 1,770,996 1-aCapital surplus 1,958,660 2,702,093 1-bRetained earnings 3,045,979 2,909,898 1-cTreasury stock (210,003) (210,003) 1-dTotal stockholders’ equity 6,565,632 7,172,985Net unrealized gains on other securities 1,397,396 1,255,877Net deferred gains or losses on hedges (39,174) 61,781 5Land revaluation excess 38,041 39,348Foreign currency translation adjustments 35,589 58,693Remeasurements of defined benefit plans 10,773 (65,290)Total accumulated other comprehensive income 1,442,626 1,350,409 3Stock acquisition rights 276 249 7-aNon-controlling interests 899,656 922,549 7-bTotal net assets 8,908,192 9,446,193Total liabilities and net assets 180,946,664 180,408,672
Note: The regulatory scope of consolidation is the same as the accounting scope of consolidation.
Basel III Information
014_0800885852907.indd 277 2017/08/10 14:19:31
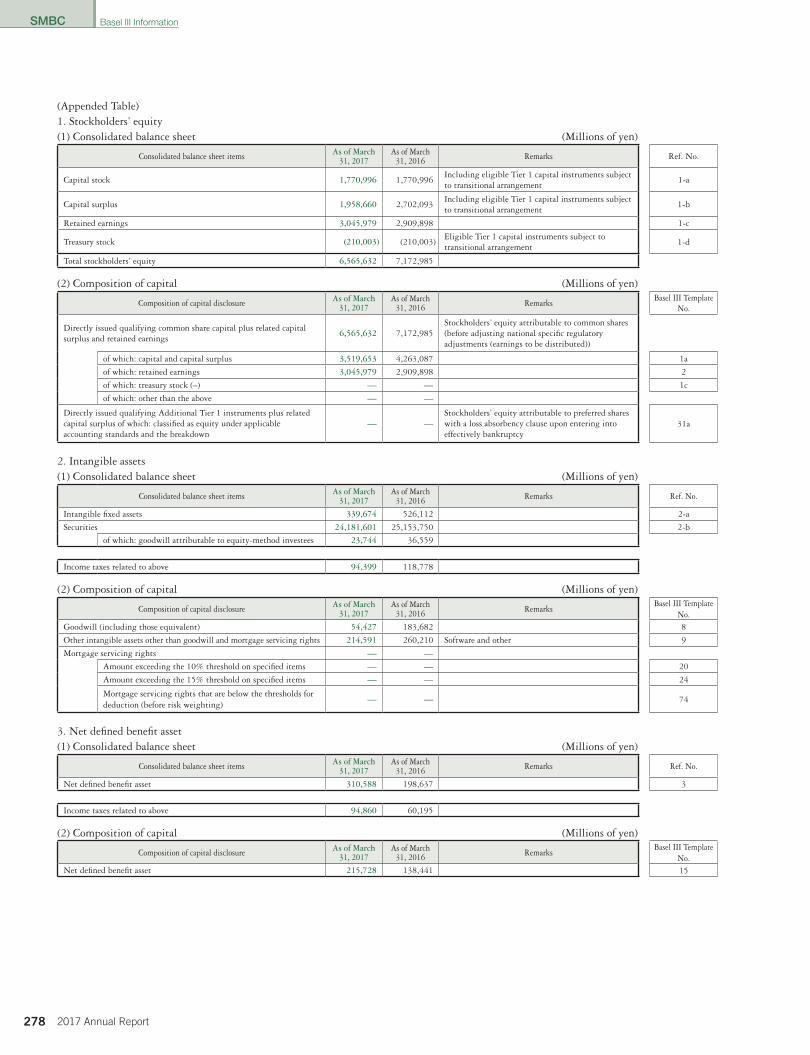
SMBC
278 2017 Annual Report
SMBC
(Appended Table)1. Stockholders’ equity(1) Consolidated balance sheet (Millions of yen)
Consolidated balance sheet items As of March31, 2017
As of March31, 2016 Remarks Ref. No.
Capital stock 1,770,996 1,770,996Including eligible Tier 1 capital instruments subject to transitional arrangement
1-a
Capital surplus 1,958,660 2,702,093Including eligible Tier 1 capital instruments subject to transitional arrangement
1-b
Retained earnings 3,045,979 2,909,898 1-c
Treasury stock (210,003) (210,003)Eligible Tier 1 capital instruments subject to transitional arrangement
1-d
Total stockholders’ equity 6,565,632 7,172,985
(2) Composition of capital (Millions of yen)
Composition of capital disclosure As of March31, 2017
As of March31, 2016 Remarks
Basel III TemplateNo.
Directly issued qualifying common share capital plus related capital surplus and retained earnings
6,565,632 7,172,985Stockholders’ equity attributable to common shares (before adjusting national specific regulatory adjustments (earnings to be distributed))
of which: capital and capital surplus 3,519,653 4,263,087 1a
of which: retained earnings 3,045,979 2,909,898 2
of which: treasury stock (–) — — 1c
of which: other than the above — —
Directly issued qualifying Additional Tier 1 instruments plus related capital surplus of which: classified as equity under applicable accounting standards and the breakdown
— —Stockholders’ equity attributable to preferred shares with a loss absorbency clause upon entering into effectively bankruptcy
31a
2. Intangible assets(1) Consolidated balance sheet (Millions of yen)
Consolidated balance sheet items As of March31, 2017
As of March31, 2016 Remarks Ref. No.
Intangible fixed assets 339,674 526,112 2-a
Securities 24,181,601 25,153,750 2-b
of which: goodwill attributable to equity-method investees 23,744 36,559
Income taxes related to above 94,399 118,778
(2) Composition of capital (Millions of yen)
Composition of capital disclosure As of March31, 2017
As of March31, 2016 Remarks
Basel III TemplateNo.
Goodwill (including those equivalent) 54,427 183,682 8
Other intangible assets other than goodwill and mortgage servicing rights 214,591 260,210 Software and other 9
Mortgage servicing rights — —
Amount exceeding the 10% threshold on specified items — — 20
Amount exceeding the 15% threshold on specified items — — 24
Mortgage servicing rights that are below the thresholds for deduction (before risk weighting)
— — 74
3. Net defined benefit asset(1) Consolidated balance sheet (Millions of yen)
Consolidated balance sheet items As of March31, 2017
As of March31, 2016 Remarks Ref. No.
Net defined benefit asset 310,588 198,637 3
Income taxes related to above 94,860 60,195
(2) Composition of capital (Millions of yen)
Composition of capital disclosure As of March31, 2017
As of March31, 2016 Remarks
Basel III TemplateNo.
Net defined benefit asset 215,728 138,441 15
Basel III Information
014_0800885852907.indd 278 2017/08/10 14:19:31
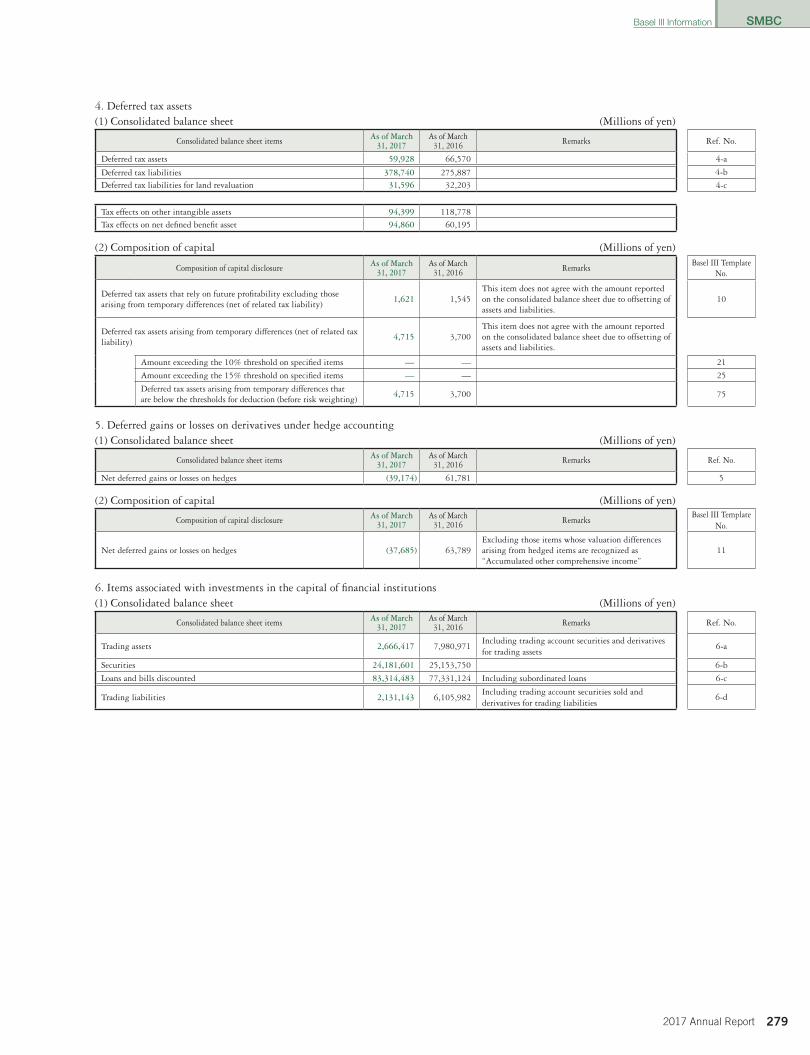
SMBC
2792017 Annual Report
SMBC
4. Deferred tax assets(1) Consolidated balance sheet (Millions of yen)
Consolidated balance sheet items As of March31, 2017
As of March31, 2016 Remarks Ref. No.
Deferred tax assets 59,928 66,570 4-a
Deferred tax liabilities 378,740 275,887 4-b
Deferred tax liabilities for land revaluation 31,596 32,203 4-c
Tax effects on other intangible assets 94,399 118,778
Tax effects on net defined benefit asset 94,860 60,195
(2) Composition of capital (Millions of yen)
Composition of capital disclosure As of March31, 2017
As of March31, 2016 Remarks
Basel III TemplateNo.
Deferred tax assets that rely on future profitability excluding those arising from temporary differences (net of related tax liability)
1,621 1,545This item does not agree with the amount reported on the consolidated balance sheet due to offsetting of assets and liabilities.
10
Deferred tax assets arising from temporary differences (net of related tax liability)
4,715 3,700This item does not agree with the amount reported on the consolidated balance sheet due to offsetting of assets and liabilities.
Amount exceeding the 10% threshold on specified items — — 21
Amount exceeding the 15% threshold on specified items — — 25
Deferred tax assets arising from temporary differences that are below the thresholds for deduction (before risk weighting)
4,715 3,700 75
5. Deferred gains or losses on derivatives under hedge accounting(1) Consolidated balance sheet (Millions of yen)
Consolidated balance sheet items As of March31, 2017
As of March31, 2016 Remarks Ref. No.
Net deferred gains or losses on hedges (39,174) 61,781 5
(2) Composition of capital (Millions of yen)
Composition of capital disclosure As of March31, 2017
As of March31, 2016 Remarks
Basel III TemplateNo.
Net deferred gains or losses on hedges (37,685) 63,789Excluding those items whose valuation differences arising from hedged items are recognized as “Accumulated other comprehensive income”
11
6. Items associated with investments in the capital of financial institutions(1) Consolidated balance sheet (Millions of yen)
Consolidated balance sheet items As of March31, 2017
As of March31, 2016 Remarks Ref. No.
Trading assets 2,666,417 7,980,971Including trading account securities and derivatives for trading assets
6-a
Securities 24,181,601 25,153,750 6-b
Loans and bills discounted 83,314,483 77,331,124 Including subordinated loans 6-c
Trading liabilities 2,131,143 6,105,982Including trading account securities sold and derivatives for trading liabilities
6-d
Basel III Information
014_0800885852907.indd 279 2017/08/10 14:19:31
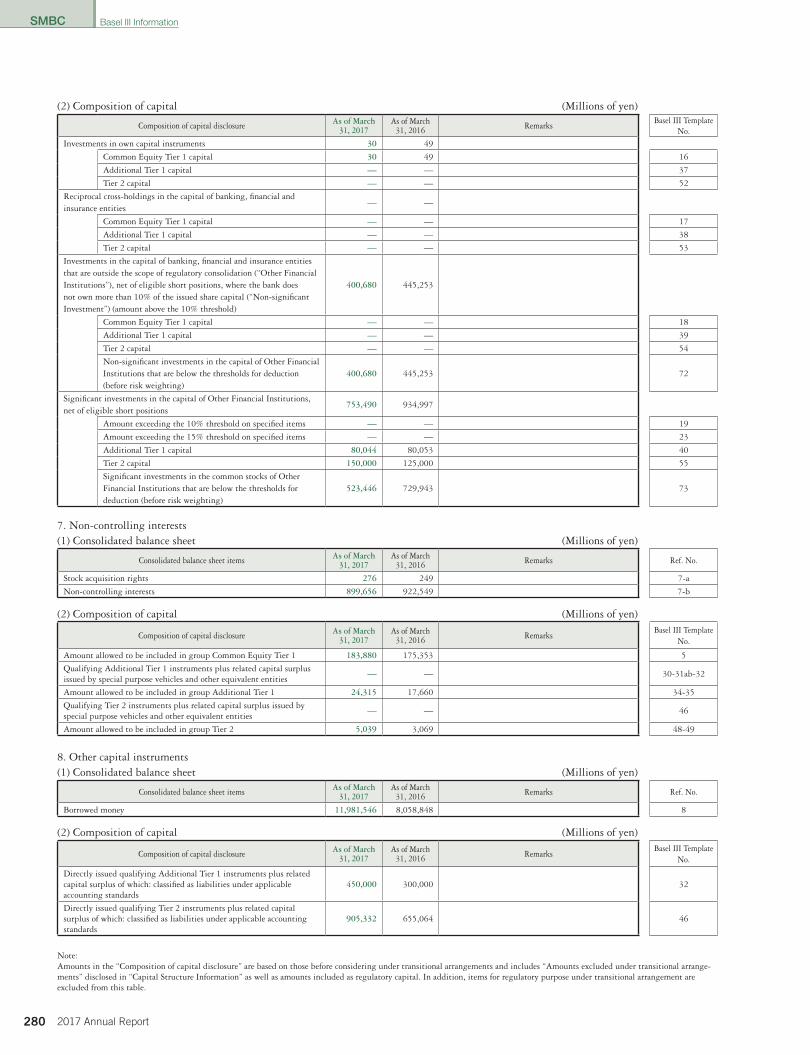
SMBC
280 2017 Annual Report
SMBC
(2) Composition of capital (Millions of yen)
Composition of capital disclosure As of March31, 2017
As of March31, 2016 Remarks
Basel III TemplateNo.
Investments in own capital instruments 30 49
Common Equity Tier 1 capital 30 49 16
Additional Tier 1 capital — — 37
Tier 2 capital — — 52
Reciprocal cross-holdings in the capital of banking, financial and insurance entities
— —
Common Equity Tier 1 capital — — 17
Additional Tier 1 capital — — 38
Tier 2 capital — — 53
Investments in the capital of banking, financial and insurance entities that are outside the scope of regulatory consolidation (“Other Financial Institutions”), net of eligible short positions, where the bank does not own more than 10% of the issued share capital (“Non-significant Investment”) (amount above the 10% threshold)
400,680 445,253
Common Equity Tier 1 capital — — 18
Additional Tier 1 capital — — 39
Tier 2 capital — — 54
Non-significant investments in the capital of Other Financial Institutions that are below the thresholds for deduction (before risk weighting)
400,680 445,253 72
Significant investments in the capital of Other Financial Institutions, net of eligible short positions
753,490 934,997
Amount exceeding the 10% threshold on specified items — — 19
Amount exceeding the 15% threshold on specified items — — 23
Additional Tier 1 capital 80,044 80,053 40
Tier 2 capital 150,000 125,000 55
Significant investments in the common stocks of Other Financial Institutions that are below the thresholds for deduction (before risk weighting)
523,446 729,943 73
7. Non-controlling interests(1) Consolidated balance sheet (Millions of yen)
Consolidated balance sheet items As of March31, 2017
As of March31, 2016 Remarks Ref. No.
Stock acquisition rights 276 249 7-a
Non-controlling interests 899,656 922,549 7-b
(2) Composition of capital (Millions of yen)
Composition of capital disclosure As of March31, 2017
As of March31, 2016 Remarks
Basel III TemplateNo.
Amount allowed to be included in group Common Equity Tier 1 183,880 175,353 5
Qualifying Additional Tier 1 instruments plus related capital surplus issued by special purpose vehicles and other equivalent entities
— — 30-31ab-32
Amount allowed to be included in group Additional Tier 1 24,315 17,660 34-35
Qualifying Tier 2 instruments plus related capital surplus issued by special purpose vehicles and other equivalent entities
— — 46
Amount allowed to be included in group Tier 2 5,039 3,069 48-49
8. Other capital instruments(1) Consolidated balance sheet (Millions of yen)
Consolidated balance sheet items As of March31, 2017
As of March31, 2016 Remarks Ref. No.
Borrowed money 11,981,546 8,058,848 8
(2) Composition of capital (Millions of yen)
Composition of capital disclosure As of March31, 2017
As of March31, 2016 Remarks
Basel III TemplateNo.
Directly issued qualifying Additional Tier 1 instruments plus related capital surplus of which: classified as liabilities under applicable accounting standards
450,000 300,000 32
Directly issued qualifying Tier 2 instruments plus related capital surplus of which: classified as liabilities under applicable accounting standards
905,332 655,064 46
Note:Amounts in the “Composition of capital disclosure” are based on those before considering under transitional arrangements and includes “Amounts excluded under transitional arrange-ments” disclosed in “Capital Structure Information” as well as amounts included as regulatory capital. In addition, items for regulatory purpose under transitional arrangement are excluded from this table.
Basel III Information
014_0800885852907.indd 280 2017/08/10 14:19:32

SMBC
2812017 Annual Report
SMBC
■ Composition of Leverage Ratio(In million yen, %)
Corresponding line # on Basel III disclosure
template (Table2)
Corresponding line # on Basel III disclosure
template (Table1)Item
As of March 31,2017
As of March 31,2016
On-balance sheet exposures (1)1 On-balance sheet exposures before deducting adjustment items 162,047,155 157,139,218
1a 1 Total assets reported in the consolidated balance sheet 180,946,664 180,408,672
1b 2The amount of assets of subsidiaries that are not included in the scope of the leverage ratio on a consolidated basis (-)
— —
1c 7The amount of assets of subsidiaries that are included in the scope of the leverage ratio on a consolidated basis (except those included in the total assets reported in the consolidated balance sheet)
— —
1d 3The amount of assets that are deducted from the total assets reported in the consolidated balance sheet (except adjustment items) (-)
18,899,509 23,269,453
2 7 The amount of adjustment items pertaining to Tier 1 capital (-) 453,155 413,9633 Total on-balance sheet exposures (a) 161,594,000 156,725,255
Exposures related to derivative transactions (2)4 Replacement cost associated with derivatives transactions, etc. 1,970,160 2,318,6945 Add-on amount associated with derivatives transactions, etc. 2,620,126 3,050,084
The amount of receivables arising from providing cash margin in relation to derivatives transactions, etc.
617,273 533,429
6The amount of receivables arising from providing cash margin, provided where deducted from the consolidated balance sheet pursuant to the operative accounting framework
— —
7The amount of deductions of receivables (out of those arising from providing cash variation margin) (-)
617,273 533,429
8The amount of client-cleared trade exposures for which a bank acting as clearing member is not obliged to make any indemnification (-)
9 Adjusted effective notional amount of written credit derivatives 121,281 583,300
10The amount of deductions from effective notional amount of written credit derivatives (-)
108,987 459,631
11 4 Total exposures related to derivative transactions (b) 4,602,580 5,492,448Exposures related to repo transactions (3)
12 The amount of assets related to repo transactions, etc. 5,809,637 8,459,15813 The amount of deductions from the assets above (line 12) (-) — —14 The exposures for counterparty credit risk for repo transactions, etc. 652,754 52,36715 The exposures for agent repo transaction16 5 Total exposures related to repo transactions, etc. (c) 6,462,392 8,511,525
Exposures related to off-balance sheet transactions (4)17 Notional amount of off-balance sheet transactions 58,401,965 53,385,837
18The amount of adjustments for conversion in relation to off-balance sheet transactions (-)
38,860,189 34,955,755
19 6 Total exposures related to off-balance sheet transactions (d) 19,541,775 18,430,082Leverage ratio on a consolidated basis (5)
20 The amount of capital (Tier 1 capital) (e) 8,478,214 8,396,57021 8 Total exposures ((a)+(b)+(c)+(d)) (f) 192,200,748 189,159,31222 Leverage ratio on a consolidated basis ((e)/(f)) 4.41% 4.43%
Leverage Ratio Information (Consolidated)Sumitomo Mitsui Banking Corporation and Subsidiaries
Basel III Information
014_0800885852907.indd 281 2017/08/10 14:19:32
SMBC
282 2017 Annual Report
SMBC
Liquidity Coverage Ratio Information (Consolidated)
Since March 31, 2015, the “Liquidity Coverage Ratio” (hereinafter referred to as “LCR”), the liquidity regulation under the Basel III, has been introduced in Japan. In addition to the application of uniform international standards, SMBC calculates its consolidated LCR using the calculation formula stipulated in the “Criteria for Evaluating the Soundness of Liquidity Status Set Forth by a Bank as a Benchmark for Judging its Soundness of Management, Based on the Provision of Article 14-2 of the Banking Act” (Notification No. 60 issued by the Japanese Financial Services Agency in 2014; hereinafter referred to as the “LCR Notification”).
■ Disclosure of Qualitative Information about Liquidity Coverage Ratio1. Intra-period Changes in Consolidated LCR As described in the following page, the LCR has remained stable with no significant fluctuation since the introduction of the liquidity
regulation on March 31, 2015.
2. Assessment of Consolidated LCR The LCR Notification stipulates that the minimum requirement of LCR for 2017 is set at 80.0% and from 2018 onwards, the minimum
requirement of LCR is raised in increments of 10.0% in stages, reaching 100.0% in and after 2019 (see table below).
2015 2016 2017 2018 2019 onwards
The minimum requirement of LCR .............................................. 60.0% 70.0% 80.0% 90.0% 100.0%
LCR of consolidated SMBC exceeds the minimum requirements of LCR for 2017 (80.0%) and for 2019 onwards (100.0%), having no cause for concern. SMBC does not expect that the future LCR forecasts will differ significantly from the announced ratios. In addition, the actual LCR does not differ significantly from the initial forecast.
3. Composition of High-Quality Liquid Assets The high-quality liquid assets held by consolidated SMBC that are allowed to be included in the calculation of LCR include deposits with
central banks, highly-rated bonds and cash. As described in the following page, the amount of such high-quality liquid assets exceed the amount of net cash outflows. Meanwhile, currency denominations, categories and location, etc. of the high-quality liquid assets allowed to be included in the calculation have not shown any significant changes. In addition, in respect of major currencies (those of which the aggregate amount of liabilities denominated in a certain currency accounts for 5.0 % or more of SMBC’s total liabilities on the consolidated basis), there is no significant mismatch in currency denomination between the total amount of the high-quality liquid assets allowed to be included in the calculation and the amount of net cash outflows.
4. Other Information Concerning Consolidated LCR SMBC has not applied “special provisions concerning qualifying operational deposits” prescribed in Article 29 of the LCR Notification and
“increased liquidity needs related to market valuation changes on derivative or other transactions simulated through Scenario Approach” prescribed in Article 38 of the same Notification. Meanwhile, SMBC records “cash outflows related to small-sized consolidated subsidiaries,” etc. under “cash outflows based on other contracts” prescribed in Article 60 of the same Notification.
Sumitomo Mitsui Banking Corporation and Subsidiaries
Basel III Information
014_0800885852907.indd 282 2017/08/10 14:19:32
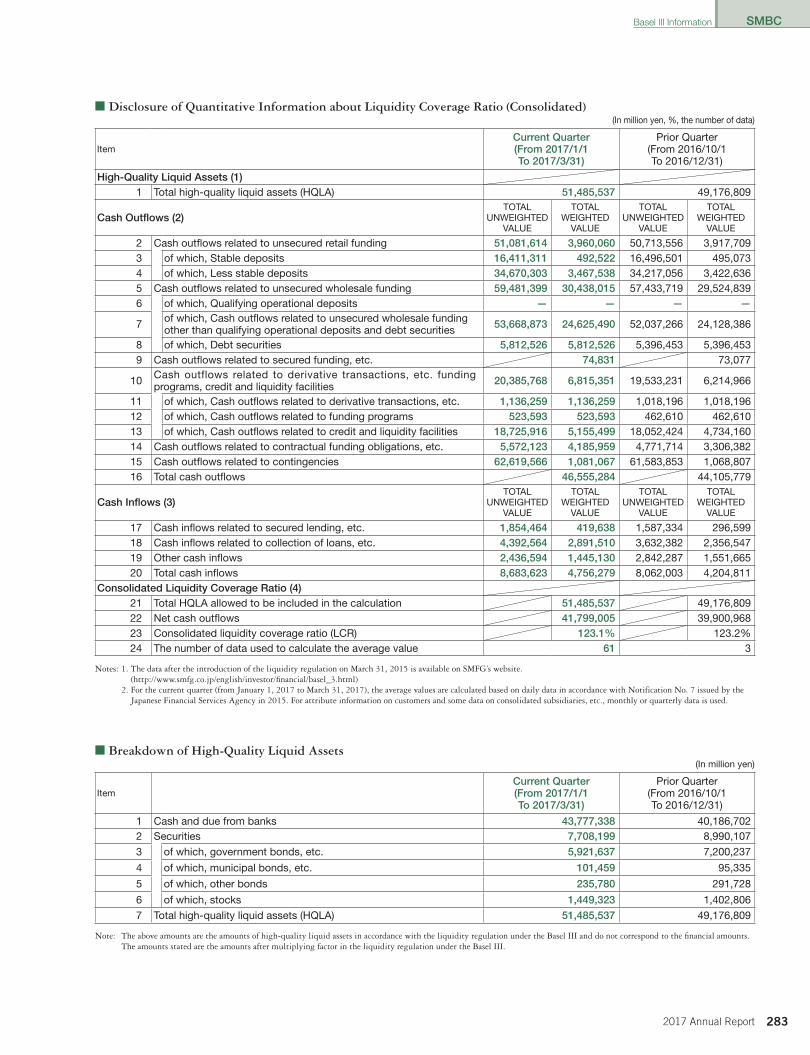
SMBC
2832017 Annual Report
SMBC
■ Disclosure of Quantitative Information about Liquidity Coverage Ratio (Consolidated) (In million yen, %, the number of data)
ItemCurrent Quarter(From 2017/1/1 To 2017/3/31)
Prior Quarter(From 2016/10/1 To 2016/12/31)
High-Quality Liquid Assets (1)1 Total high-quality liquid assets (HQLA) 51,485,537 49,176,809
Cash Outflows (2)TOTAL
UNWEIGHTEDVALUE
TOTALWEIGHTED
VALUE
TOTALUNWEIGHTED
VALUE
TOTALWEIGHTED
VALUE
2 Cash outflows related to unsecured retail funding 51,081,614 3,960,060 50,713,556 3,917,7093 of which, Stable deposits 16,411,311 492,522 16,496,501 495,0734 of which, Less stable deposits 34,670,303 3,467,538 34,217,056 3,422,6365 Cash outflows related to unsecured wholesale funding 59,481,399 30,438,015 57,433,719 29,524,8396 of which, Qualifying operational deposits — — — —
7 of which, Cash outflows related to unsecured wholesale funding other than qualifying operational deposits and debt securities 53,668,873 24,625,490 52,037,266 24,128,386
8 of which, Debt securities 5,812,526 5,812,526 5,396,453 5,396,4539 Cash outflows related to secured funding, etc. 74,831 73,077
10 Cash outflows related to derivative transactions, etc. funding programs, credit and liquidity facilities 20,385,768 6,815,351 19,533,231 6,214,966
11 of which, Cash outflows related to derivative transactions, etc. 1,136,259 1,136,259 1,018,196 1,018,19612 of which, Cash outflows related to funding programs 523,593 523,593 462,610 462,61013 of which, Cash outflows related to credit and liquidity facilities 18,725,916 5,155,499 18,052,424 4,734,16014 Cash outflows related to contractual funding obligations, etc. 5,572,123 4,185,959 4,771,714 3,306,38215 Cash outflows related to contingencies 62,619,566 1,081,067 61,583,853 1,068,80716 Total cash outflows 46,555,284 44,105,779
Cash Inflows (3)TOTAL
UNWEIGHTEDVALUE
TOTALWEIGHTED
VALUE
TOTALUNWEIGHTED
VALUE
TOTALWEIGHTED
VALUE
17 Cash inflows related to secured lending, etc. 1,854,464 419,638 1,587,334 296,59918 Cash inflows related to collection of loans, etc. 4,392,564 2,891,510 3,632,382 2,356,54719 Other cash inflows 2,436,594 1,445,130 2,842,287 1,551,66520 Total cash inflows 8,683,623 4,756,279 8,062,003 4,204,811
Consolidated Liquidity Coverage Ratio (4)21 Total HQLA allowed to be included in the calculation 51,485,537 49,176,80922 Net cash outflows 41,799,005 39,900,96823 Consolidated liquidity coverage ratio (LCR) 123.1% 123.2%24 The number of data used to calculate the average value 61 3
Notes: 1. The data after the introduction of the liquidity regulation on March 31, 2015 is available on SMFG’s website.(http://www.smfg.co.jp/english/investor/financial/basel_3.html)
2. For the current quarter (from January 1, 2017 to March 31, 2017), the average values are calculated based on daily data in accordance with Notification No. 7 issued by the Japanese Financial Services Agency in 2015. For attribute information on customers and some data on consolidated subsidiaries, etc., monthly or quarterly data is used.
■ Breakdown of High-Quality Liquid Assets (In million yen)
ItemCurrent Quarter(From 2017/1/1To 2017/3/31)
Prior Quarter(From 2016/10/1To 2016/12/31)
1 Cash and due from banks 43,777,338 40,186,7022 Securities 7,708,199 8,990,107
3 of which, government bonds, etc. 5,921,637 7,200,237
4 of which, municipal bonds, etc. 101,459 95,335
5 of which, other bonds 235,780 291,728
6 of which, stocks 1,449,323 1,402,806
7 Total high-quality liquid assets (HQLA) 51,485,537 49,176,809
Note: The above amounts are the amounts of high-quality liquid assets in accordance with the liquidity regulation under the Basel III and do not correspond to the financial amounts.The amounts stated are the amounts after multiplying factor in the liquidity regulation under the Basel III.
Basel III Information
014_0800885852907.indd 283 2017/08/10 14:19:32
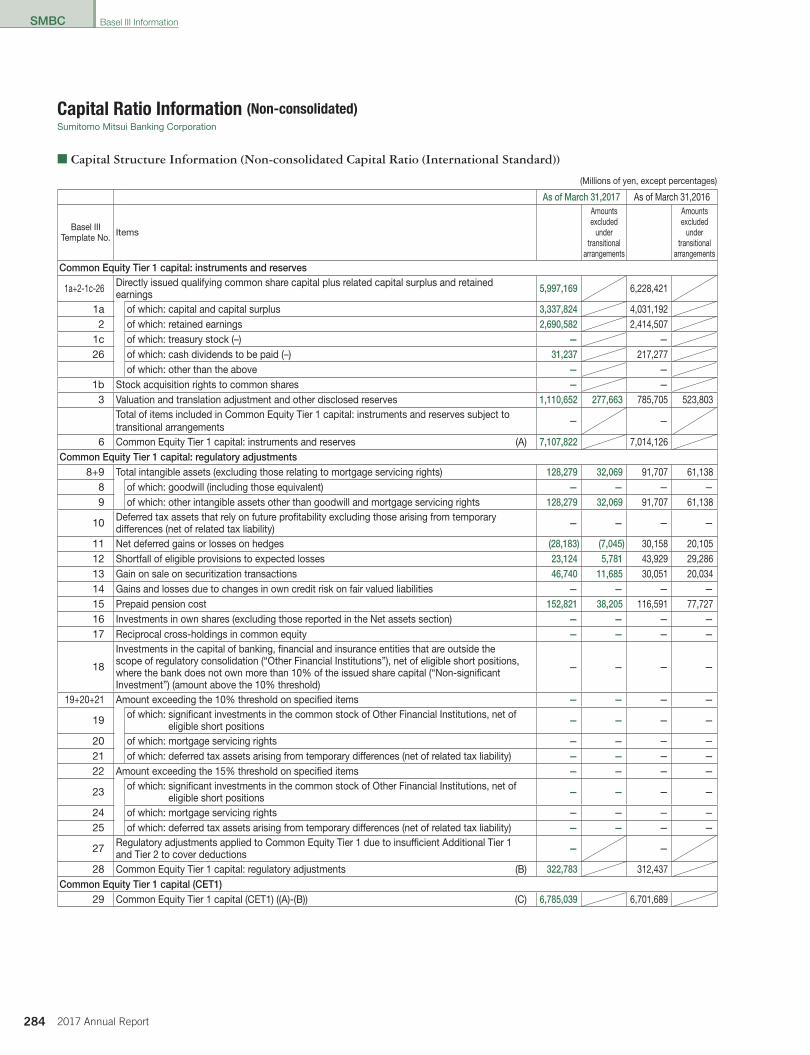
SMBC
284 2017 Annual Report
SMBC
■ Capital Structure Information (Non-consolidated Capital Ratio (International Standard))
(Millions of yen, except percentages)
As of March 31,2017 As of March 31,2016
Basel IIITemplate No. Items
Amounts excluded
under transitional
arrangements
Amounts excluded
under transitional
arrangements
Common Equity Tier 1 capital: instruments and reserves
1a+2-1c-26 Directly issued qualifying common share capital plus related capital surplus and retainedearnings 5,997,169 6,228,421
1a of which: capital and capital surplus 3,337,824 4,031,1922 of which: retained earnings 2,690,582 2,414,507
1c of which: treasury stock (–) — —26 of which: cash dividends to be paid (–) 31,237 217,277
of which: other than the above — —1b Stock acquisition rights to common shares — —
3 Valuation and translation adjustment and other disclosed reserves 1,110,652 277,663 785,705 523,803Total of items included in Common Equity Tier 1 capital: instruments and reserves subject totransitional arrangements
— —
6 Common Equity Tier 1 capital: instruments and reserves (A) 7,107,822 7,014,126Common Equity Tier 1 capital: regulatory adjustments
8+9 Total intangible assets (excluding those relating to mortgage servicing rights) 128,279 32,069 91,707 61,1388 of which: goodwill (including those equivalent) — — — —9 of which: other intangible assets other than goodwill and mortgage servicing rights 128,279 32,069 91,707 61,138
10 Deferred tax assets that rely on future profitability excluding those arising from temporarydifferences (net of related tax liability) — — — —
11 Net deferred gains or losses on hedges (28,183) (7,045) 30,158 20,10512 Shortfall of eligible provisions to expected losses 23,124 5,781 43,929 29,28613 Gain on sale on securitization transactions 46,740 11,685 30,051 20,03414 Gains and losses due to changes in own credit risk on fair valued liabilities — — — —15 Prepaid pension cost 152,821 38,205 116,591 77,72716 Investments in own shares (excluding those reported in the Net assets section) — — — —17 Reciprocal cross-holdings in common equity — — — —
18
Investments in the capital of banking, financial and insurance entities that are outside thescope of regulatory consolidation (“Other Financial Institutions”), net of eligible short positions,where the bank does not own more than 10% of the issued share capital (“Non-significantInvestment”) (amount above the 10% threshold)
— — — —
19+20+21 Amount exceeding the 10% threshold on specified items — — — —
19 of which: significant investments in the common stock of Other Financial Institutions, net of eligible short positions — — — —
20 of which: mortgage servicing rights — — — —21 of which: deferred tax assets arising from temporary differences (net of related tax liability) — — — —22 Amount exceeding the 15% threshold on specified items — — — —
23 of which: significant investments in the common stock of Other Financial Institutions, net of eligible short positions — — — —
24 of which: mortgage servicing rights — — — —25 of which: deferred tax assets arising from temporary differences (net of related tax liability) — — — —
27 Regulatory adjustments applied to Common Equity Tier 1 due to insufficient Additional Tier 1and Tier 2 to cover deductions — —
28 Common Equity Tier 1 capital: regulatory adjustments (B) 322,783 312,437Common Equity Tier 1 capital (CET1)
29 Common Equity Tier 1 capital (CET1) ((A)-(B)) (C) 6,785,039 6,701,689
Capital Ratio Information (Non-consolidated)Sumitomo Mitsui Banking Corporation
Basel III Information
014_0800885852907.indd 284 2017/08/10 14:19:32
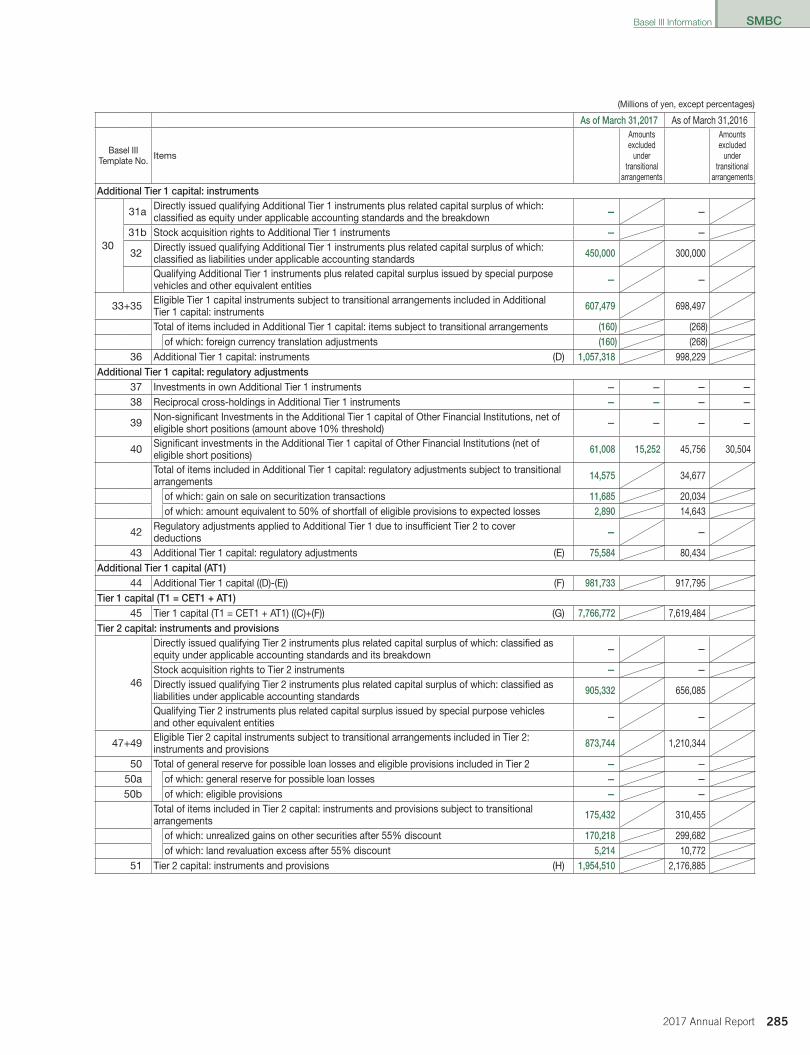
SMBC
2852017 Annual Report
SMBC
(Millions of yen, except percentages)
As of March 31,2017 As of March 31,2016
Basel IIITemplate No. Items
Amounts excluded
under transitional
arrangements
Amounts excluded
under transitional
arrangements
Additional Tier 1 capital: instruments
30
31a Directly issued qualifying Additional Tier 1 instruments plus related capital surplus of which:classified as equity under applicable accounting standards and the breakdown — —
31b Stock acquisition rights to Additional Tier 1 instruments — —
32 Directly issued qualifying Additional Tier 1 instruments plus related capital surplus of which:classified as liabilities under applicable accounting standards 450,000 300,000
Qualifying Additional Tier 1 instruments plus related capital surplus issued by special purposevehicles and other equivalent entities — —
33+35 Eligible Tier 1 capital instruments subject to transitional arrangements included in AdditionalTier 1 capital: instruments 607,479 698,497
Total of items included in Additional Tier 1 capital: items subject to transitional arrangements (160) (268)of which: foreign currency translation adjustments (160) (268)
36 Additional Tier 1 capital: instruments (D) 1,057,318 998,229Additional Tier 1 capital: regulatory adjustments
37 Investments in own Additional Tier 1 instruments — — — —38 Reciprocal cross-holdings in Additional Tier 1 instruments — — — —
39 Non-significant Investments in the Additional Tier 1 capital of Other Financial Institutions, net ofeligible short positions (amount above 10% threshold) — — — —
40 Significant investments in the Additional Tier 1 capital of Other Financial Institutions (net ofeligible short positions) 61,008 15,252 45,756 30,504
Total of items included in Additional Tier 1 capital: regulatory adjustments subject to transitionalarrangements 14,575 34,677
of which: gain on sale on securitization transactions 11,685 20,034of which: amount equivalent to 50% of shortfall of eligible provisions to expected losses 2,890 14,643
42 Regulatory adjustments applied to Additional Tier 1 due to insufficient Tier 2 to coverdeductions — —
43 Additional Tier 1 capital: regulatory adjustments (E) 75,584 80,434Additional Tier 1 capital (AT1)
44 Additional Tier 1 capital ((D)-(E)) (F) 981,733 917,795Tier 1 capital (T1 = CET1 + AT1)
45 Tier 1 capital (T1 = CET1 + AT1) ((C)+(F)) (G) 7,766,772 7,619,484Tier 2 capital: instruments and provisions
46
Directly issued qualifying Tier 2 instruments plus related capital surplus of which: classified asequity under applicable accounting standards and its breakdown — —
Stock acquisition rights to Tier 2 instruments — —Directly issued qualifying Tier 2 instruments plus related capital surplus of which: classified asliabilities under applicable accounting standards 905,332 656,085
Qualifying Tier 2 instruments plus related capital surplus issued by special purpose vehiclesand other equivalent entities — —
47+49 Eligible Tier 2 capital instruments subject to transitional arrangements included in Tier 2:instruments and provisions 873,744 1,210,344
50 Total of general reserve for possible loan losses and eligible provisions included in Tier 2 — —50a of which: general reserve for possible loan losses — —50b of which: eligible provisions — —
Total of items included in Tier 2 capital: instruments and provisions subject to transitionalarrangements 175,432 310,455
of which: unrealized gains on other securities after 55% discount 170,218 299,682of which: land revaluation excess after 55% discount 5,214 10,772
51 Tier 2 capital: instruments and provisions (H) 1,954,510 2,176,885
Basel III Information
014_0800885852907.indd 285 2017/08/10 14:19:32

SMBC
286 2017 Annual Report
SMBC
(Millions of yen, except percentages)
As of March 31,2017 As of March 31,2016
Basel IIITemplate No. Items
Amounts excluded
under transitional
arrangements
Amounts excluded
under transitional
arrangements
Tier 2 capital: regulatory adjustments52 Investments in own Tier 2 instruments — — — —53 Reciprocal cross-holdings in Tier 2 instruments — — — —
54 Non-significant Investments in the Tier 2 capital of Other Financial Institutions, net of eligibleshort positions (amount above the 10% threshold) — — — —
55 Significant investments in the Tier 2 capital of Other Financial Institutions (net of eligible shortpositions) 120,000 30,000 75,000 50,000
Total of items included in Tier 2 capital: regulatory adjustments subject to transitionalarrangements 2,890 14,643
of which: Tier 2 and deductions under Basel II 2,890 14,64357 Tier 2 capital: regulatory adjustments (I) 122,890 89,643
Tier 2 capital (T2)58 Tier 2 capital (T2) ((H)-(I)) (J) 1,831,619 2,087,242
Total capital (TC = T1 + T2)59 Total capital (TC = T1 + T2) ((G) + (J)) (K) 9,598,392 9,706,726
Risk weighted assetsTotal of items included in risk weighted assets subject to transitional arrangements 72,106 140,505
of which: prepaid pension cost 10,436 21,232of which: significant investments in Additional Tier 1 capital of Other Financial Institutions (net
of eligible short positions) 42,995 86,416
of which: significant investments in Tier 2 capital of Other Financial Institutions (net of eligible short positions) 9,914 16,156
60 Risk weighted assets (L) 51,575,789 49,829,205Capital ratio
61 Common Equity Tier 1 risk-weighted capital ratio ((C)/(L)) 13.15% 13.44%62 Tier 1 risk-weighted capital ratio ((G)/(L)) 15.05% 15.29%63 Total risk-weighted capital ratio ((K)/(L)) 18.61% 19.47%
Regulatory adjustments
72 Non-significant Investments in the capital of Other Financial Institutions that are below thethresholds for deduction (before risk weighting) 386,929 336,156
73 Significant investments in the common stock of Other Financial Institutions that are below thethresholds for deduction (before risk weighting) 524,160 657,720
74 Mortgage servicing rights that are below the thresholds for deduction (before risk weighting) — —
75Deferred tax assets arising from temporary differences that are below the thresholds fordeduction (before risk weighting)
— —
Provisions included in Tier 2 capital: instruments and provisions76 Provisions (general reserve for possible loan losses) — —77 Cap on inclusion of provisions (general reserve for possible loan losses) 2,412 2,295
78 Provisions eligible for inclusion in Tier 2 in respect of exposures subject to internalratings-based approach (prior to application of cap) — —
79 Cap for inclusion of provisions in Tier 2 under internal ratings-based approach 277,287 269,384Capital instruments subject to transitional arrangements
82 Current cap on Additional Tier 1 instruments subject to transitional arrangements 618,678 742,414
83 Amount excluded from Additional Tier 1 due to cap (excess over cap after redemptions andmaturities) — —
84 Current cap on Tier 2 instruments subject to transitional arrangements 1,008,620 1,210,34485 Amount excluded from Tier 2 due to cap (excess over cap after redemptions and maturities) — 42,804
(Millions of yen)
Items As of March 31,2017 As of March 31,2016Required capital ((L) ✕ 8%) 4,126,063 3,986,336
Basel III Information
014_0800885852907.indd 286 2017/08/10 14:19:32
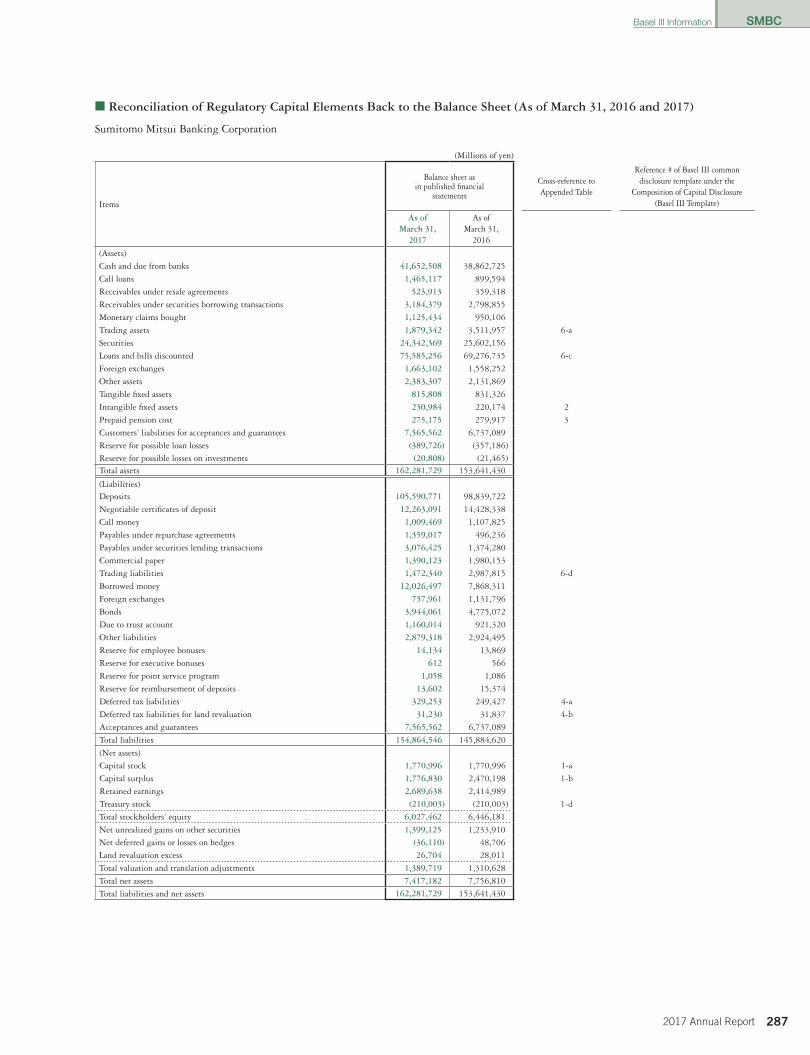
SMBC
2872017 Annual Report
SMBC
■ Reconciliation of Regulatory Capital Elements Back to the Balance Sheet (As of March 31, 2016 and 2017)
Sumitomo Mitsui Banking Corporation
(Millions of yen)
Items
Balance sheet as in published financial
statements
Cross-reference toAppended Table
Reference # of Basel III commondisclosure template under the
Composition of Capital Disclosure(Basel III Template)
As of March 31,
2017
As of March 31,
2016
(Assets)
Cash and due from banks 41,652,508 38,862,725
Call loans 1,465,117 899,594
Receivables under resale agreements 523,913 359,318
Receivables under securities borrowing transactions 3,184,379 2,798,855
Monetary claims bought 1,125,434 950,106
Trading assets 1,879,342 3,511,957 6-a
Securities 24,342,369 25,602,156
Loans and bills discounted 75,585,256 69,276,735 6-c
Foreign exchanges 1,663,102 1,558,252
Other assets 2,383,307 2,131,869
Tangible fixed assets 815,808 831,326
Intangible fixed assets 230,984 220,174 2
Prepaid pension cost 275,175 279,917 3
Customers’ liabilities for acceptances and guarantees 7,565,562 6,737,089
Reserve for possible loan losses (389,726) (357,186)
Reserve for possible losses on investments (20,808) (21,465)Total assets 162,281,729 153,641,430
(Liabilities)Deposits 105,590,771 98,839,722
Negotiable certificates of deposit 12,263,091 14,428,338
Call money 1,009,469 1,107,825
Payables under repurchase agreements 1,359,017 496,236
Payables under securities lending transactions 3,076,425 1,374,280
Commercial paper 1,390,123 1,980,153
Trading liabilities 1,472,340 2,987,815 6-d
Borrowed money 12,026,497 7,868,311
Foreign exchanges 737,961 1,131,796
Bonds 3,944,061 4,775,072
Due to trust account 1,160,014 921,320
Other liabilities 2,879,318 2,924,495
Reserve for employee bonuses 14,134 13,869
Reserve for executive bonuses 612 566
Reserve for point service program 1,058 1,086
Reserve for reimbursement of deposits 13,602 15,374
Deferred tax liabilities 329,253 249,427 4-a
Deferred tax liabilities for land revaluation 31,230 31,837 4-b
Acceptances and guarantees 7,565,562 6,737,089
Total liabilities 154,864,546 145,884,620
(Net assets)
Capital stock 1,770,996 1,770,996 1-a
Capital surplus 1,776,830 2,470,198 1-b
Retained earnings 2,689,638 2,414,989
Treasury stock (210,003) (210,003) 1-d
Total stockholders’ equity 6,027,462 6,446,181
Net unrealized gains on other securities 1,399,125 1,233,910
Net deferred gains or losses on hedges (36,110) 48,706
Land revaluation excess 26,704 28,011
Total valuation and translation adjustments 1,389,719 1,310,628
Total net assets 7,417,182 7,756,810
Total liabilities and net assets 162,281,729 153,641,430
Basel III Information
014_0800885852907.indd 287 2017/08/10 14:19:32
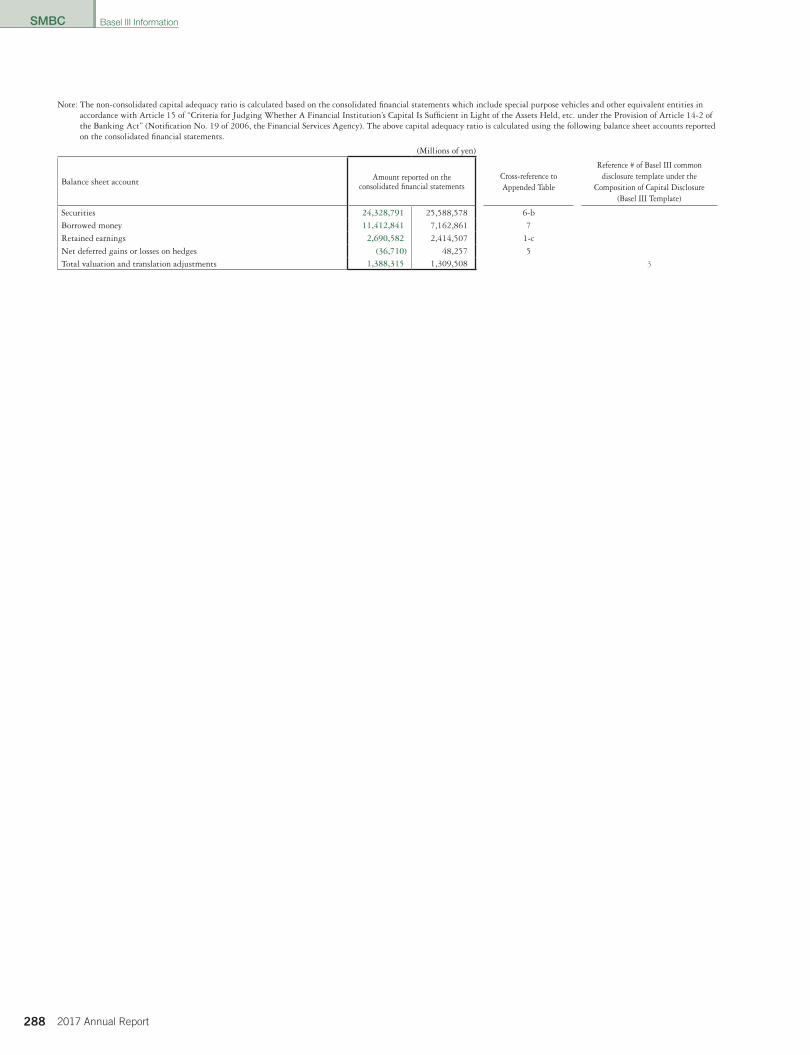
SMBC
288 2017 Annual Report
SMBC
Note: The non-consolidated capital adequacy ratio is calculated based on the consolidated financial statements which include special purpose vehicles and other equivalent entities in accordance with Article 15 of “Criteria for Judging Whether A Financial Institution’s Capital Is Sufficient in Light of the Assets Held, etc. under the Provision of Article 14-2 of the Banking Act” (Notification No. 19 of 2006, the Financial Services Agency). The above capital adequacy ratio is calculated using the following balance sheet accounts reported on the consolidated financial statements.
(Millions of yen)
Balance sheet account Amount reported on the consolidated financial statements
Cross-reference toAppended Table
Reference # of Basel III commondisclosure template under the
Composition of Capital Disclosure(Basel III Template)
Securities 24,328,791 25,588,578 6-b
Borrowed money 11,412,841 7,162,861 7
Retained earnings 2,690,582 2,414,507 1-c
Net deferred gains or losses on hedges (36,710) 48,257 5
Total valuation and translation adjustments 1,388,315 1,309,508 3
Basel III Information
014_0800885852907.indd 288 2017/08/10 14:19:32

SMBC
2892017 Annual Report
SMBC
(Appended Table)1. Stockholders’ equity(1) Balance sheet (Millions of yen)
Balance sheet items As of March31, 2017
As of March31, 2016 Remarks Ref. No.
Capital stock 1,770,996 1,770,996Including eligible Tier 1 capital instruments subject to transitional arrangement
1-a
Capital surplus 1,776,830 2,470,198Including eligible Tier 1 capital instruments subject to transitional arrangement
1-b
Retained earnings 2,690,582 2,414,507 1-c
Treasury stock (210,003) (210,003)Eligible Tier 1 capital instruments subject to transitional arrangement
1-d
Total stockholders’ equity 6,028,406 6,445,699
(2) Composition of capital (Millions of yen)
Composition of capital disclosure As of March31, 2017
As of March31, 2016 Remarks
Basel III TemplateNo.
Directly issued qualifying common share capital plus related capital surplus and retained earnings
6,028,406 6,445,699Stockholders’ equity attributable to common shares (before adjusting national specific regulatory adjustments (earnings to be distributed))
of which: capital and capital surplus 3,337,824 4,031,192 1a
of which: retained earnings 2,690,582 2,414,507 2
of which: treasury stock (–) — — 1c
of which: other than the above — —
Directly issued qualifying Additional Tier 1 instruments plus related capital surplus of which: classified as equity under applicable accounting standards and the breakdown
— —Stockholders’ equity attributable to preferred shares with a loss absorbency clause upon entering into effectively bankruptcy
31a
2. Intangible assets(1) Balance sheet (Millions of yen)
Balance sheet items As of March31, 2017
As of March31, 2016 Remarks Ref. No.
Intangible fixed assets 230,984 220,174 2
Income taxes related to above 70,635 67,329
(2) Composition of capital (Millions of yen)
Composition of capital disclosure As of March31, 2017
As of March31, 2016 Remarks
Basel III TemplateNo.
Goodwill (including those equivalent) — — 8
Other intangible assets other than goodwill and mortgage servicing rights 160,349 152,845 Software and other 9
Mortgage servicing rights — —
Amount exceeding the 10% threshold on specified items — — 20
Amount exceeding the 15% threshold on specified items — — 24
Mortgage servicing rights that are below the thresholds for deduction (before risk weighting)
— — 74
3. Prepaid pension cost(1) Balance sheet (Millions of yen)
Balance sheet items As of March31, 2017
As of March31, 2016 Remarks Ref. No.
Prepaid pension cost 275,175 279,917 3
Income taxes related to above 84,148 85,598
(2) Composition of capital (Millions of yen)
Composition of capital disclosure As of March31, 2017
As of March31, 2016 Remarks
Basel III TemplateNo.
Prepaid pension cost 191,027 194,318 15
Basel III Information
014_0800885852907.indd 289 2017/08/10 14:19:32
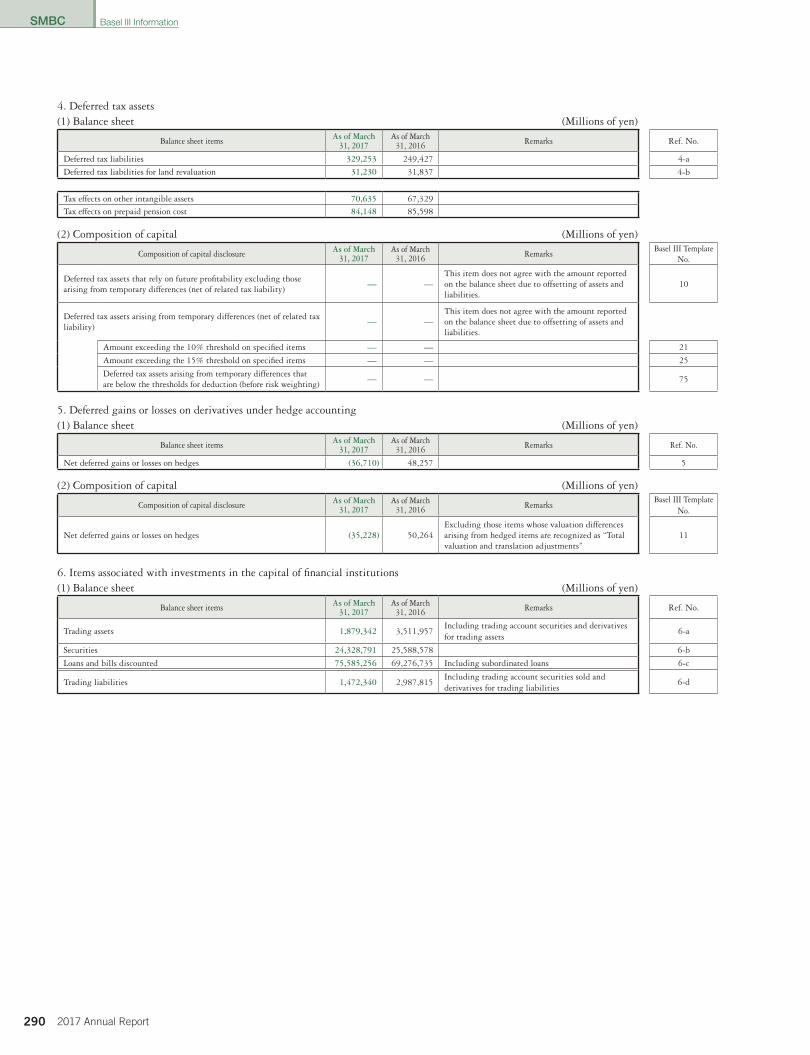
SMBC
290 2017 Annual Report
SMBC
4. Deferred tax assets(1) Balance sheet (Millions of yen)
Balance sheet items As of March31, 2017
As of March31, 2016 Remarks Ref. No.
Deferred tax liabilities 329,253 249,427 4-a
Deferred tax liabilities for land revaluation 31,230 31,837 4-b
Tax effects on other intangible assets 70,635 67,329
Tax effects on prepaid pension cost 84,148 85,598
(2) Composition of capital (Millions of yen)
Composition of capital disclosure As of March31, 2017
As of March31, 2016 Remarks
Basel III TemplateNo.
Deferred tax assets that rely on future profitability excluding those arising from temporary differences (net of related tax liability)
— —This item does not agree with the amount reported on the balance sheet due to offsetting of assets and liabilities.
10
Deferred tax assets arising from temporary differences (net of related tax liability)
— —This item does not agree with the amount reported on the balance sheet due to offsetting of assets and liabilities.
Amount exceeding the 10% threshold on specified items — — 21
Amount exceeding the 15% threshold on specified items — — 25
Deferred tax assets arising from temporary differences that are below the thresholds for deduction (before risk weighting)
— — 75
5. Deferred gains or losses on derivatives under hedge accounting(1) Balance sheet (Millions of yen)
Balance sheet items As of March31, 2017
As of March31, 2016 Remarks Ref. No.
Net deferred gains or losses on hedges (36,710) 48,257 5
(2) Composition of capital (Millions of yen)
Composition of capital disclosure As of March31, 2017
As of March31, 2016 Remarks
Basel III TemplateNo.
Net deferred gains or losses on hedges (35,228) 50,264Excluding those items whose valuation differences arising from hedged items are recognized as “Total valuation and translation adjustments”
11
6. Items associated with investments in the capital of financial institutions(1) Balance sheet (Millions of yen)
Balance sheet items As of March31, 2017
As of March31, 2016 Remarks Ref. No.
Trading assets 1,879,342 3,511,957Including trading account securities and derivatives for trading assets
6-a
Securities 24,328,791 25,588,578 6-b
Loans and bills discounted 75,585,256 69,276,735 Including subordinated loans 6-c
Trading liabilities 1,472,340 2,987,815Including trading account securities sold and derivatives for trading liabilities
6-d
Basel III Information
014_0800885852907.indd 290 2017/08/10 14:19:32
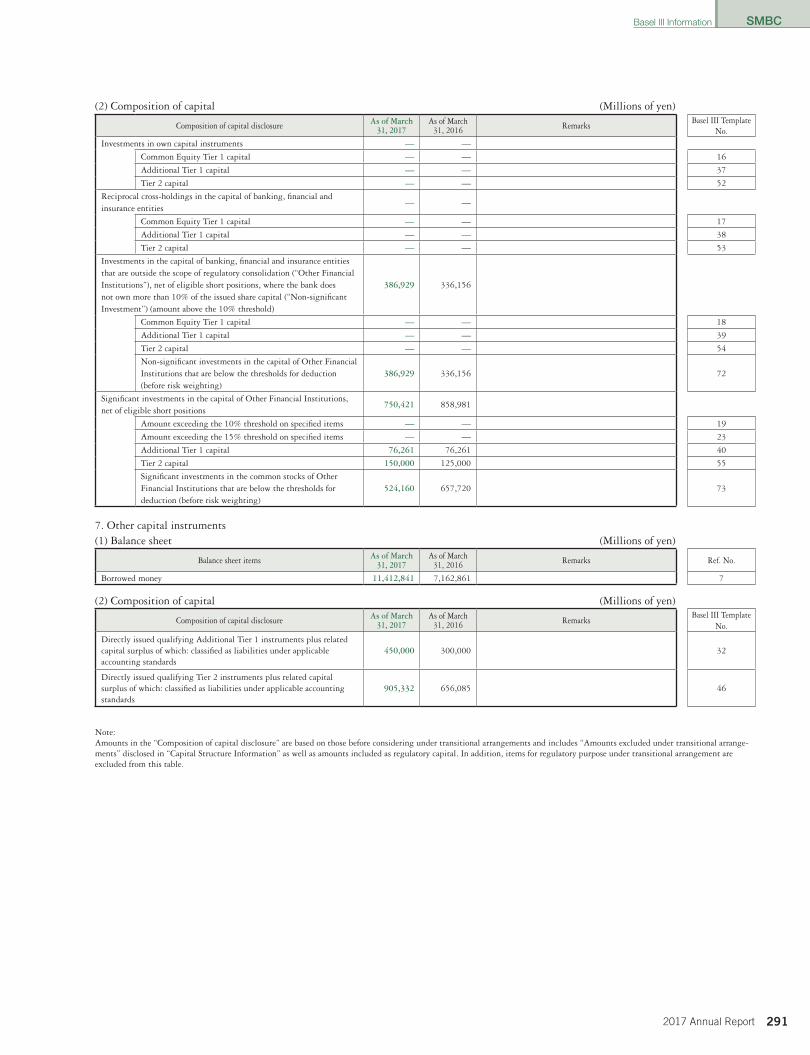
SMBC
2912017 Annual Report
SMBC
(2) Composition of capital (Millions of yen)
Composition of capital disclosure As of March31, 2017
As of March31, 2016 Remarks
Basel III TemplateNo.
Investments in own capital instruments — —
Common Equity Tier 1 capital — — 16
Additional Tier 1 capital — — 37
Tier 2 capital — — 52
Reciprocal cross-holdings in the capital of banking, financial and insurance entities
— —
Common Equity Tier 1 capital — — 17
Additional Tier 1 capital — — 38
Tier 2 capital — — 53
Investments in the capital of banking, financial and insurance entities that are outside the scope of regulatory consolidation (“Other Financial Institutions”), net of eligible short positions, where the bank does not own more than 10% of the issued share capital (“Non-significant Investment”) (amount above the 10% threshold)
386,929 336,156
Common Equity Tier 1 capital — — 18
Additional Tier 1 capital — — 39
Tier 2 capital — — 54
Non-significant investments in the capital of Other Financial Institutions that are below the thresholds for deduction (before risk weighting)
386,929 336,156 72
Significant investments in the capital of Other Financial Institutions, net of eligible short positions
750,421 858,981
Amount exceeding the 10% threshold on specified items — — 19
Amount exceeding the 15% threshold on specified items — — 23
Additional Tier 1 capital 76,261 76,261 40
Tier 2 capital 150,000 125,000 55
Significant investments in the common stocks of Other Financial Institutions that are below the thresholds for deduction (before risk weighting)
524,160 657,720 73
7. Other capital instruments(1) Balance sheet (Millions of yen)
Balance sheet items As of March31, 2017
As of March31, 2016 Remarks Ref. No.
Borrowed money 11,412,841 7,162,861 7
(2) Composition of capital (Millions of yen)
Composition of capital disclosure As of March31, 2017
As of March31, 2016 Remarks
Basel III TemplateNo.
Directly issued qualifying Additional Tier 1 instruments plus related capital surplus of which: classified as liabilities under applicable accounting standards
450,000 300,000 32
Directly issued qualifying Tier 2 instruments plus related capital surplus of which: classified as liabilities under applicable accounting standards
905,332 656,085 46
Note:Amounts in the “Composition of capital disclosure” are based on those before considering under transitional arrangements and includes “Amounts excluded under transitional arrange-ments” disclosed in “Capital Structure Information” as well as amounts included as regulatory capital. In addition, items for regulatory purpose under transitional arrangement are excluded from this table.
Basel III Information
014_0800885852907.indd 291 2017/08/10 14:19:32
SMBC
292 2017 Annual Report
SMBC
Liquidity Coverage Ratio Information (Non-consolidated)
Since March 31, 2015, the “Liquidity Coverage Ratio” (hereinafter referred to as “LCR”), the liquidity regulation under the Basel III, has been introduced in Japan. In addition to the application of uniform international standards, SMBC calculates its non-consolidated LCR using the calculation formula stipulated in the “Criteria for Evaluating the Soundness of Liquidity Status Set Forth by a Bank as a Benchmark for Judging its Soundness of Management, Based on the Provision of Article 14-2 of the Banking Act” (Notification No. 60 issued by the Japanese Financial Services Agency in 2014; hereinafter referred to as the “LCR Notification”).
■ Disclosure of Qualitative Information about Liquidity Coverage Ratio1. Intra-period Changes in Non-consolidated LCR As described in the following page, the LCR has remained stable with no significant fluctuation since the introduction of the liquidity
regulation on March 31, 2015.
2. Assessment of Non-consolidated LCR The LCR Notification stipulates that the minimum requirement of LCR for 2017 is set at 80.0% and from 2018 onwards, the minimum
requirement of LCR is raised in increments of 10.0% in stages, reaching 100.0% in and after 2019 (see table below).
2015 2016 2017 2018 2019 onwards
The minimum requirement of LCR .............................................. 60.0% 70.0% 80.0% 90.0% 100.0%
LCR of non-consolidated SMBC exceeds the minimum requirements of LCR for 2017 (80.0%) and for 2019 onwards (100.0%), having no cause for concern. SMBC does not expect that the future LCR forecasts will differ significantly from the announced ratios. In addition, the actual LCR does not differ significantly from the initial forecast.
3. Composition of High-Quality Liquid Assets The high-quality liquid assets held by non-consolidated SMBC that are allowed to be included in the calculation of LCR include deposits
with central banks, highly-rated bonds and cash. As described in the following page, the amount of such high-quality liquid assets exceed the amount of net cash outflows. Meanwhile, currency denominations, categories and location, etc. of the high-quality liquid assets allowed to be included in the calculation have not shown any significant changes. In addition, in respect of major currencies (those of which the aggregate amount of liabilities denominated in a certain currency accounts for 5.0 % or more of SMBC’s total liabilities on the non-consolidated basis), there is no significant mismatch in currency denomination between the total amount of the high-quality liquid assets allowed to be included in the calculation and the amount of net cash outflows.
4. Other Information Concerning Non-consolidated LCR SMBC has not applied “special provisions concerning qualifying operational deposits” prescribed in Article 29 of the LCR Notification and
“increased liquidity needs related to market valuation changes on derivative or other transactions simulated through Scenario Approach” prescribed in Article 38 of the same Notification. Meanwhile, SMBC records “due to trust account,” etc. under “cash outflows based on other contracts” prescribed in Article 60 of the same Notification.
Sumitomo Mitsui Banking Corporation
Basel III Information
014_0800885852907.indd 292 2017/08/10 14:19:32
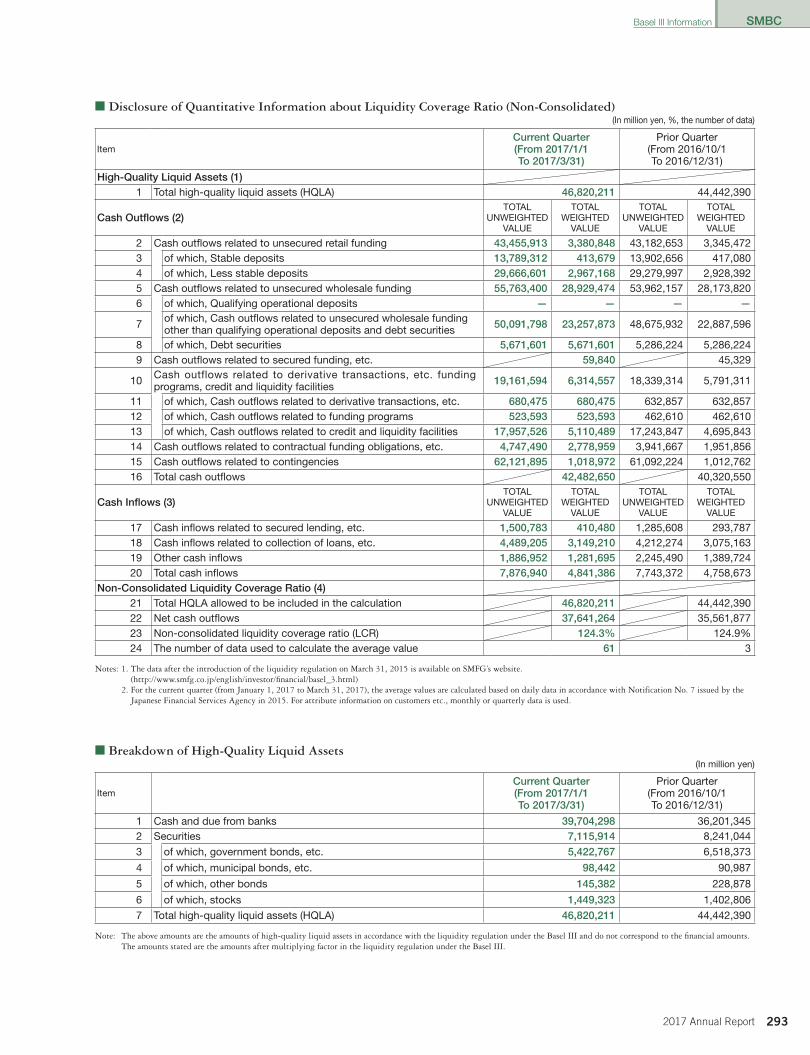
SMBC
2932017 Annual Report
SMBC
■ Disclosure of Quantitative Information about Liquidity Coverage Ratio (Non-Consolidated) (In million yen, %, the number of data)
ItemCurrent Quarter(From 2017/1/1 To 2017/3/31)
Prior Quarter(From 2016/10/1 To 2016/12/31)
High-Quality Liquid Assets (1)1 Total high-quality liquid assets (HQLA) 46,820,211 44,442,390
Cash Outflows (2)TOTAL
UNWEIGHTEDVALUE
TOTALWEIGHTED
VALUE
TOTALUNWEIGHTED
VALUE
TOTALWEIGHTED
VALUE
2 Cash outflows related to unsecured retail funding 43,455,913 3,380,848 43,182,653 3,345,4723 of which, Stable deposits 13,789,312 413,679 13,902,656 417,0804 of which, Less stable deposits 29,666,601 2,967,168 29,279,997 2,928,3925 Cash outflows related to unsecured wholesale funding 55,763,400 28,929,474 53,962,157 28,173,8206 of which, Qualifying operational deposits — — — —
7 of which, Cash outflows related to unsecured wholesale funding other than qualifying operational deposits and debt securities 50,091,798 23,257,873 48,675,932 22,887,596
8 of which, Debt securities 5,671,601 5,671,601 5,286,224 5,286,2249 Cash outflows related to secured funding, etc. 59,840 45,329
10 Cash outflows related to derivative transactions, etc. funding programs, credit and liquidity facilities 19,161,594 6,314,557 18,339,314 5,791,311
11 of which, Cash outflows related to derivative transactions, etc. 680,475 680,475 632,857 632,85712 of which, Cash outflows related to funding programs 523,593 523,593 462,610 462,61013 of which, Cash outflows related to credit and liquidity facilities 17,957,526 5,110,489 17,243,847 4,695,84314 Cash outflows related to contractual funding obligations, etc. 4,747,490 2,778,959 3,941,667 1,951,85615 Cash outflows related to contingencies 62,121,895 1,018,972 61,092,224 1,012,76216 Total cash outflows 42,482,650 40,320,550
Cash Inflows (3)TOTAL
UNWEIGHTEDVALUE
TOTALWEIGHTED
VALUE
TOTALUNWEIGHTED
VALUE
TOTALWEIGHTED
VALUE
17 Cash inflows related to secured lending, etc. 1,500,783 410,480 1,285,608 293,78718 Cash inflows related to collection of loans, etc. 4,489,205 3,149,210 4,212,274 3,075,16319 Other cash inflows 1,886,952 1,281,695 2,245,490 1,389,72420 Total cash inflows 7,876,940 4,841,386 7,743,372 4,758,673
Non-Consolidated Liquidity Coverage Ratio (4)21 Total HQLA allowed to be included in the calculation 46,820,211 44,442,39022 Net cash outflows 37,641,264 35,561,87723 Non-consolidated liquidity coverage ratio (LCR) 124.3% 124.9%24 The number of data used to calculate the average value 61 3
Notes: 1. The data after the introduction of the liquidity regulation on March 31, 2015 is available on SMFG’s website.(http://www.smfg.co.jp/english/investor/financial/basel_3.html)
2. For the current quarter (from January 1, 2017 to March 31, 2017), the average values are calculated based on daily data in accordance with Notification No. 7 issued by the Japanese Financial Services Agency in 2015. For attribute information on customers etc., monthly or quarterly data is used.
■ Breakdown of High-Quality Liquid Assets (In million yen)
ItemCurrent Quarter(From 2017/1/1To 2017/3/31)
Prior Quarter(From 2016/10/1To 2016/12/31)
1 Cash and due from banks 39,704,298 36,201,3452 Securities 7,115,914 8,241,044
3 of which, government bonds, etc. 5,422,767 6,518,373
4 of which, municipal bonds, etc. 98,442 90,987
5 of which, other bonds 145,382 228,878
6 of which, stocks 1,449,323 1,402,806
7 Total high-quality liquid assets (HQLA) 46,820,211 44,442,390
Note: The above amounts are the amounts of high-quality liquid assets in accordance with the liquidity regulation under the Basel III and do not correspond to the financial amounts.The amounts stated are the amounts after multiplying factor in the liquidity regulation under the Basel III.
Basel III Information
014_0800885852907.indd 293 2017/08/10 14:19:32

SMFG
294 2017 Annual Report
ABLAbbreviation for Asset Based Lending of having movable assets as col-lateral such as accounts receivable and/or inventory.
Advanced Measurement Approach (AMA)Based on the operational risk measurement methods used in the internal management of financial institutions, this is a method for obtaining the operational risk equivalent amount by calculating the maximum amount of operational risk loss expected over a period of one year, with a one-sided confidence interval of 99.9%.
Basic Indicator Approach (BIA)A calculation approach in which an average value for the most recent three years derived by multiplying gross profit for the financial institution as a whole by certain level (15%) is deemed to be the operational risk equivalent amount.
Calculation of credit risk-weighted assets under Article 145 of the NotificationMethod used for calculating the credit risk-weighted assets for the fund exposure, etc. There is a method of making the total credit risk-weighted asset of individual underlying asset of funds, etc. as the relevant expo-sure of the credit risk-weighted asset; or a method of applying the risk weight determined based on the formation of underlying assets to the relevant exposure.
Capital adequacy ratio notification (“the Notification”)Administrative action or written ordinance by which the Financial Services Agency officially informs Japanese banks of regulations regard-ing capital adequacy ratio.
CCFAbbreviation for Credit Conversion FactorRatio required for converting off-balance sheet items such as guaranteesor derivatives into on-balance sheet credit exposure equivalents.
CCP-related exposureExposure to a central counterparty (CCP) that interposes itself between counterparties to contracts traded in one or more financial markets, becoming the buyer to every seller and the seller to every buyer and thereby ensuring the future performance of open contracts.
CDSAbbreviation for Credit Default SwapDerivative transactions which transfer the credit risk.
Credit Risk Mitigation (CRM) TechniquesMethod of reducing credit risk by guarantees, collateral and purchase of credit derivatives, etc.
Credit risk-weighted assetsTotal assets (lending exposures, including credit equivalent amount of off-balance sheet transactions, etc.) which is reevaluated according to the level of credit risk.
Current exposure methodOne of the methods for calculating the credit exposure equivalents of derivative transactions, etc. Method of calculating the equivalents by adding the amount (multiplying the notional amount by certain rate, and equivalent to the future exposure fluctuation amount) to the mark-to-market replacement cost calculated by evaluating the market price of the transaction.
CVA (credit value adjustment) amountCapital charges for market-price fluctuation of derivatives transaction due to deteriorated creditworthiness of a counterparty.
ELAbbreviation for Expected LossAverage loss expected to occur over the coming one year.
High-quality liquid assets (HQLA)Assets that can be converted into cash without significant loss of value under stress events, and for which there is no impediment to conversion into cash.
Historical simulation methodMethod of simulating future fluctuations without the use of random num-bers, by using historical data for risk factors.
Internal models approachMethods of measuring market risk equivalent amount as the value at risk(VaR) calculated with models determined by each bank.
Internal models methodOne of the methods of market-based approach using the VaR model to calculate the loss for shares held by the bank applying the Internal Ratings-Based Approach, and dividing such loss amount by 8% to obtain the credit risk-weighted asset of the equity exposure.
The Internal Ratings-Based (IRB) ApproachA method of calculating the risk asset by applying PD (Probability of Default) estimated internally by financial institution which conducts sophisticated risk management. There are two methods to calculate exposures to corporate client, etc.: the Advanced Internal Ratings- Based (AIRB) Approach and the Foundation Internal Ratings-Based (FIRB) Approach. The former uses self-estimated LGD and EAD values, while the latter uses LGD and EAD values designated by the authorities.
LCR NotificationAdministrative action and written ordinance for official notification to the general public of regulations concerning LCR of financial institutions in Japan which are decided by the Japanese Financial Services Agency based on the Basel Agreement.
LGDAbbreviation for Loss Given Default Percentage of loss assumed in the event of default by obligor; ratio of uncollectible amount of the exposure owned in the event of default.
Liquidity Coverage Ratio (LCR)Indicator of liquidity regulations under the Basel III which has been ap-plied in stages starting from March 31, 2015.LCR regulations require banks to hold high-quality liquid assets more than a certain amount in order to cover total cash outflows over a 30-day period under stress events.
Market-based approachMethod of calculating the risk assets of equity exposures, etc., by using the simple risk weight method or internal model method.
Market risk equivalent amountPursuant to the Basel Capital Accord, the required capital amount im-posed on the market-related risk calculated for the four risk categories of mainly the trading book: interest rates, stocks, foreign exchange and commodities.
Net cash outflowsAmount obtained after subtracting the amount of cash inflows from the amount of cash outflows under stress events.
Object financeFor providing credit for purchasing ships or aircrafts, the only source of repayments for the financing should be profits generated from the said tangible assets; and the said tangible assets serve as collaterals, and having an appreciable extent of control over the said tangible assets and profits generated from the said tangible assets.
Operational risk equivalent amountOperational risk capital requirements under the Basel Capital Accord.
Glossary
Basel III Information
014_0800885852907.indd 294 2017/08/10 14:19:32
SMFG
2952017 Annual Report
OriginatorThe term “originator” is used in the case that SMFG is directly or indi-rectly involved in the formation of underlying assets for securitization transactions when SMFG has the securitization exposure; or the cases of providing the back-up line for ABCP issued by the securitization conduit for the purpose of obtaining exposure from the third party, or providing ABL to the securitization conduit (as sponsor).
PDAbbreviation for Probability of DefaultProbability of becoming default by obligor during one year.
Phased rolloutUnder the Basel Capital Accord (credit risk, operational risk), it is a tran-sition made by certain group companies planning to apply the Internal Ratings-Based Approach or the Advanced Measurement Approach after the implementation of such methods on consolidated-basis.
Project financeOut of credit provided for specified businesses such as electric power plants and transportation infrastructure, the only source of repayments is profits generated from the said businesses, and the collateral is tangi-ble assets of the said businesses, and having an appreciable extent of control over the said tangible assets and profits generated from the said tangible assets.
Qualifying Revolving Retail Exposures (QRRE)Exposure which may fluctuate up to the upper limit set forth by an agreement according to the individual’s voluntary decision, such as card loan and credit card, etc., and the upper limit of the exposure without any collateral is 10 million yen or less.
Resecuritization transactionOut of securitization transactions, it is a transaction with securitiza-tion exposure for part of or entire underlying assets. However, in the case that all of underlying assets is the single securitization exposure and the transaction’s risk characteristics are substantively unchanged prior to or after the securitization, the transaction is excluded from the resecuritization transactions.
Risk capitalThe amount of capital required to cover the theoretical maximum potential loss arising from risks of business operations. It differs from the minimum regulatory capital requirements, and it is being used in the risk management framework voluntarily developed by financial institutions for the purpose of internal management.
Risk weightIndicator which indicates the extent of credit risk determined by the types of assets (claims) owned. Risk weight becomes higher for assets with high risk of default.
Securitization transactionIt is a transaction which stratifies the credit risk for the underlying assets into more than two exposures of senior/subordinated structure and has the quality of transferring part of or entire exposure to the third party.
Servicer riskThe risk of becoming unable to claim for the collectives, in cases of which bankruptcy of the supplier/servicer occurs prior to collecting receivables, in securitization and purchased claims transactions.
Simple risk weight methodOne of market-based approaches for calculating the risk-weighted asset amount for the equity exposure, etc. by multiplying the listed shares and unlisted shares with the risk weights of 300% and 400%, respectively.
Slotting criteriaFor risk-weighted asset calculation under the Internal Ratings-Based (IRB) Approach, it is a method of mapping the credit rating to the risk-weight in 5 levels set forth by the Financial Services Agency for Specialised Lending.
Small-sized consolidated subsidiariesSmall-sized consolidated subsidiaries that have extremely small impact on the level of consolidated LCR.
Specialized Lending (SL)General term used for project finance, object finance, commodity finance and lending for commercial real estate.
The Standardized Approach (SA)Method of calculating risk-weighted assets by multiplying each obligor classification (corporation, financial institution, country, retail, etc.) by the risk-weight designated by the authorities.
Standardized methodMethod of calculating market risk using formula determined by the Financial Services Agency.
Underlying assetsGeneral term used for assets which serve as the source of payments for principal and interest for securitization exposures, etc.
VaRAbbreviation for Value at RiskThe maximum loss that can be expected to occur with a certain degree of probability when holding a financial asset portfolio for a given amount of time.
Basel III Information
014_0800885852907.indd 295 2017/08/10 14:19:32

SMFG
296 2017 Annual Report
■ Compensation Framework of SMFG and Its Group Companies1. Scope of Officers, Employees and Others
The scope of officers, employees and others whose compensation is subject to disclosure under the revised Cabinet Office on Disclosure ofCorporate Affairs, etc. and other ordinances are as described below.(1) Scope of Officers
Officers subject to compensation disclosure are directors and corporate auditors of SMFG during the fiscal year under review (excluding outside directors and corporate auditors).
(2) Scope of Employees and OthersEmployees and others subject to compensation disclosure are employees of SMFG and officers and employees of its major consolidatedsubsidiaries who are highly compensated and have a material influence on the business management or the assets of SMFG and its majorconsolidated subsidiaries.a) Scope of major consolidated subsidiaries
A major consolidated subsidiary is a consolidated subsidiary of SMFG with total assets accounting for more than 2% of the totalconsolidated assets of SMFG and has a material influence on the management of SMFG and its group companies. Specifically, they areSumitomo Mitsui Banking Corporation, SMBC Nikko Securities Inc., Kansai Urban Banking Corporation, Sumitomo Mitsui Finance and Leasing Company, SMBC Guarantee Co., Ltd., Limited and overseas subsidiaries such as Sumitomo Mitsui Banking Corporation Europe Limited and Sumitomo Mitsui Banking Corporation (China) Limited.
b) Scope of highly compensated personsA highly compensated person is an individual whose compensation paid by SMFG or its major subsidiaries is equal to or more thanthe base amount. The base amount of SMFG is set at ¥60 million which is based on the average amount of compensation paid to theofficers of SMFG and SMBC (excluding officers appointed or retired during the fiscal year in question) over the last three fiscal years(hereinafter “executive compensation amount”) and is applied to all group companies. This is because many of the officers of SMFGalso serve as officers of SMBC, and their executive compensation amount is determined according to their contribution to the groupas a whole. With respect to lump-sum retirement payment, the executive compensation amount for the fiscal year in question is “(his/her executive compensation amount – lump-sum retirement payment) + (lump-sum retirement payment/years of service)” and theexecutive compensation amount calculated using this formula is compared to the base amount.
c) Material influence on the business management or assets of SMFG and its major consolidated subsidiariesA person has a material influence on the business management or assets of SMFG and its major consolidated subsidiaries if his/herregular transactions or regular matters managed by him/her have a substantial impact on the business management of SMFG and itsgroup companies, or losses incurred through such actions have a significant impact on the financial situation of SMFG and its groupcompanies. Specifically, persons having such influence are directors, corporate auditors and corporate officers of SMFG and its majorconsolidated subsidiaries, both domestic and overseas.
2. Determination of Compensation(1) For Officers
SMFG, as a Company with a Nomination Committee, has established a Compensation Committee to resolve the “policy to determine individual remuneration for directors and executive officers,” “executive compensation programme and relevant regulations,” and “individual remuneration for SMFG’s directors and corporate executive officers.” In addition, SMFG Compensation Committee reviews and discusses executive compensation programmes/practices of group companies of SMFG and the individual remuneration for SMFG’s other executive officers. Furthermore, group companies of SMFG respect the details of the deliberations at the Compensation Committee of SMFG and determine the compensation for directors and corporate auditors within the maximum total amount of compensation approved at an ordinary general meeting of shareholders.
(2) For Employees and OthersThe amount and type of compensation paid to the employees of SMFG and SMBC and the officers and employees of major consolidated subsidiaries are determined and paid according to the compensation policies established by the boards of directors of SMFG and its major consolidated subsidiaries. Compensation systems based on the compensation policies are designed and documented by the HR departments of respective companies, independent from the influence of business units. The compensation policies of major consolidated subsidiaries are regularly reported to the HR department of SMFG for review. The amount and type of compensation for overseas officers and employees is determined and paid under the compensation system established by the relevant office or subsidiary in accordance with local laws, regulations and employment practices.
(3) Total Amount of Compensation Paid to Compensation Committee Members and Number of Compensation CommitteeMeetings Held
Number of Meetings Held(April 1, 2016 to March 31, 2017)
Compensation Committee (SMFG) ����������������������������������������������������������������������������������������������� 3Compensation Committee (SMBC Nikko Securities Inc�) ������������������������������������������������������������� 1
Note: The total amount of compensation is not provided because the portion of the compensation paid to a committee member for services rendered as a committee membercannot be calculated as the amount of compensation paid is based on the committee member’s position in the company.
CompensationSumitomo Mitsui Financial Group (SMFG)
015_0800885852907.indd 296 2017/08/10 20:50:05

SMFG
2972017 Annual Report
■ Assessment of Design and Operation of Compensation StructureCompensation Policy
(1) For OfficersSMFG hereby establishes the Executive Compensation Policy (the “Policy”) in order to provide guiding principles for its Compensation Committee to determine individual remuneration for its directors and executive officers (the “Executives”).The Policy’s aim is that executive compensation pursuant to it shall provide the appropriate incentives for the Executives to pursue our Mission and our medium-/long-term vision of becoming “a global financial group that, by earning the highest trust of our customers, leads the growth of Japan and the Asian region”.Group companies of SMFG shall determine their executive compensations in accordance with this Policy.
<Core Principles>I. SMFG’s executive compensation aims at providing appropriate incentives toward the realization of our mission and our vision.II. SMFG’s executive compensation shall reflect the changing business environment and the short-, medium- and long-term perfor-
mance of the group, and shall account for the contribution to shareholder value and customer satisfaction.III. Individual remuneration shall reflect the assigned roles and responsibilities as well as the performance of the respective Executive.IV. SMFG shall research and review market practices, including the use of third-party surveys, in order to provide its Executives with a
competitive remuneration package.V. SMFG’s executive compensation shall discourage excessive risk-taking and foster a prudent risk culture expected of a financial institution.VI. Both external and internal regulations/guidelines on executive compensation shall be observed and respected.VII. SMFG shall establish appropriate governance and controls of the compensation process, and shall regularly review to update its ex-
ecutive compensation practices according to changing market practices and/or business environment.
<Compensation Programme>I. SMFG’s executive compensation programme (the “Programme”) shall have three components: base salary, cash bonus, and stock
compensation.II. In order to hold the Executives accountable and provide them with appropriate incentives for the performance of the group, the
Programme targets the variable compensation component of total remuneration at 40%, if paid at standard levels. Corresponding with performance and the business environment, the variable component could range from 0% to 150% of the standard levels, which shall be determined by corporate titles of the Executives.
III. In order to enhance shareholding of the Executives and align their interests with shareholders, the Programme targets its stock-based compensation components at 25% of total remuneration, if paid at standard levels.
IV. The above target levels shall be appropriately set in accordance with the roles, responsibilities, etc. of each Executive.V. Base salary shall be paid in cash and shall be, in principle, determined by the corporate titles of each Executive, reflecting the roles,
responsibilities, etc.VI. Annual incentives shall be determined based on the annual performance of the group, the group company and the business unit
each Executive is accountable for, as well as on the performance of the respective Executive reviewed both from short-term and me-dium-/long-term perspectives. 70% of the determined amount shall be paid as a cash bonus and the remaining 30% shall be paid under Stock Compensation Plan II (annual performance share plan).
VII. Stock compensation plans consist of Stock Compensation Plan I (the “Plan I”), under which the remuneration of the Executives shall be determined based on SMFG’s medium-term performance, etc., Stock Compensation Plan II (the “Plan II”), determined based on SMFG’s annual performance, etc. and Stock Compensation Plan III (the “Plan III”), determined based on corporate titles, etc.
a. Under the stock compensation plans, the Executives shall receive remuneration via shares of SMFG common stock. The transfer of such stock shall be restricted for appropriately defined periods.
b. Remuneration under Plan I shall be determined based on SMFG’s performance against the Medium-term Management Plan, performance of SMFG shares, and the results of customer satisfaction surveys, etc.
c. Remunerations under Plan II shall be determined based on the annual performance of SMFG, the group company, and the busi-ness unit each Executive is accountable for, as well as on the performance of each Executive reviewed both from a short-term and medium-/long-term perspectives. Remuneration paid by restricted shares, they shall effectively act as deferred compensation.
d. Remuneration under Plan III shall be determined based on corporate titles, roles, and responsibilities, etc.VIII. In the event of material amendments to the financial statements or material reputational damages caused by the Executives, remu-
nerations under the Plans could be reduced or fully forfeit.IX. Notwithstanding the above, executive compensation for the Executives domiciled outside Japan shall be individually designed and
determined not only in accordance with this Policy, but also with consideration to local regulations, guidelines, and other local market practices, whilst ensuring the compensation should not incentivize for excessive risk-taking.
<Governance and Control of the Compensation Processes>SMFG, as a Company with a Nomination Committee, has established a Compensation Committee to resolve the following: • The Policy, executive compensation programme and relevant regulations. • Individual remunerations for SMFG’s directors and corporate executive officers.In addition to the above, SMFG Compensation Committee shall review and discuss the below: • Executive compensation programmes/practices of group companies of SMFG. • The individual remuneration for SMFG’s other executive officers.
(2) For Employees and OthersIn order to link the business philosophy and strategy of the company to the roles and responsibilities of employees and others, SMFG and its major consolidated subsidiaries determine the domestic compensation taking into account their job responsibilities, business performance and other factors.
■ Consistency between Compensation Structure and Risk Management and Link between Compensation and Performance1. SMFG and SMBC
In determining the compensation for the officers of SMFG, the details of individual compensation for directors and executive officers are determined by the mandatory Compensation Committee, where the majority of the committee members are the outside directors. The compensation for the officers of SMBC are determined within the scope approved at a shareholders' meeting.
Compensation
015_0800885852907.indd 297 2017/08/10 20:50:05
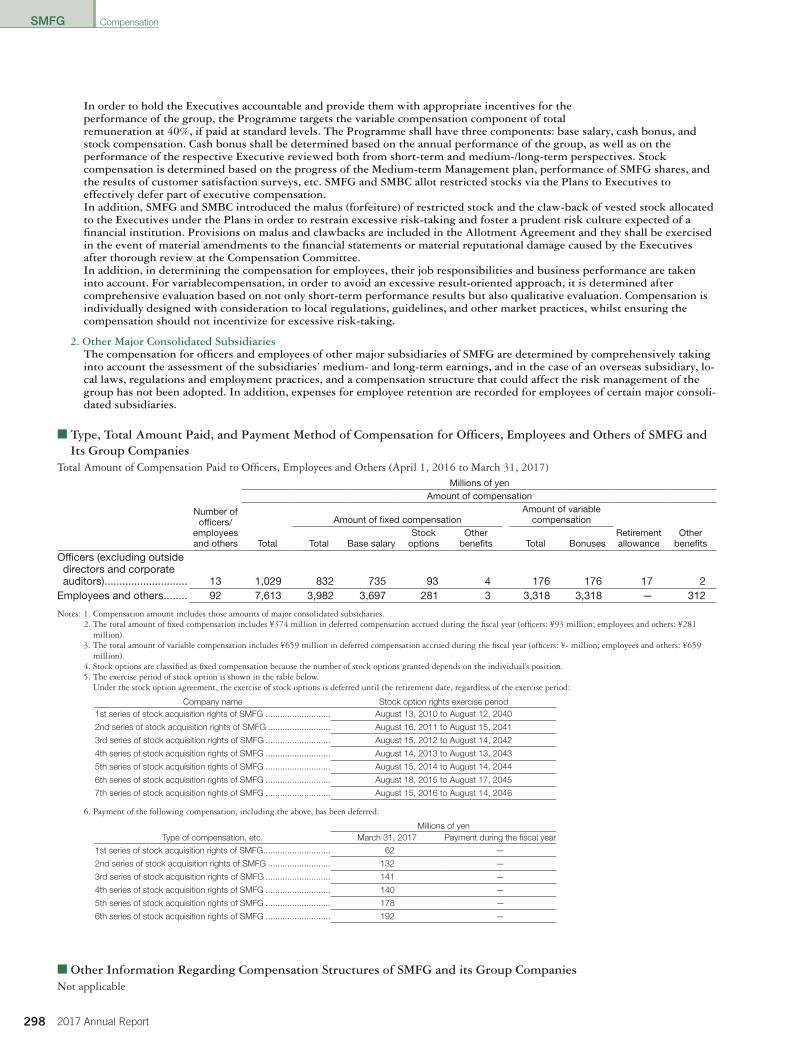
SMFG
298 2017 Annual Report
■ Type, Total Amount Paid, and Payment Method of Compensation for Officers, Employees and Others of SMFG and Its Group Companies
Total Amount of Compensation Paid to Officers, Employees and Others (April 1, 2016 to March 31, 2017)
Number ofofficers/
employeesand others
Millions of yen Amount of compensation
Total
Amount of fixed compensationAmount of variable
compensationRetirementallowance
OtherbenefitsTotal Base salary
Stockoptions
Otherbenefits Total Bonuses
Officers (excluding outside directors and corporate auditors) ���������������������������� 13 1,029 832 735 93 4 176 176 17 2
Employees and others �������� 92 7,613 3,982 3,697 281 3 3,318 3,318 — 312
Notes: 1. Compensation amount includes those amounts of major consolidated subsidiaries.2. The total amount of fixed compensation includes ¥374 million in deferred compensation accrued during the fiscal year (officers: ¥93 million; employees and others: ¥281
million).3. The total amount of variable compensation includes ¥659 million in deferred compensation accrued during the fiscal year (officers: ¥- million; employees and others: ¥659
million).4. Stock options are classified as fixed compensation because the number of stock options granted depends on the individual’s position.5. The exercise period of stock option is shown in the table below.
Under the stock option agreement, the exercise of stock options is deferred until the retirement date, regardless of the exercise period:
Company name Stock option rights exercise period1st series of stock acquisition rights of SMFG ��������������������������� August 13, 2010 to August 12, 2040
2nd series of stock acquisition rights of SMFG �������������������������� August 16, 2011 to August 15, 2041
3rd series of stock acquisition rights of SMFG ��������������������������� August 15, 2012 to August 14, 2042
4th series of stock acquisition rights of SMFG ��������������������������� August 14, 2013 to August 13, 2043
5th series of stock acquisition rights of SMFG ��������������������������� August 15, 2014 to August 14, 2044
6th series of stock acquisition rights of SMFG ��������������������������� August 18, 2015 to August 17, 2045
7th series of stock acquisition rights of SMFG ��������������������������� August 15, 2016 to August 14, 2046
6. Payment of the following compensation, including the above, has been deferred:
Millions of yenType of compensation, etc� March 31, 2017 Payment during the fiscal year
1st series of stock acquisition rights of SMFG ���������������������������� 62 —
2nd series of stock acquisition rights of SMFG �������������������������� 132 —
3rd series of stock acquisition rights of SMFG ��������������������������� 141 —
4th series of stock acquisition rights of SMFG ��������������������������� 140 —
5th series of stock acquisition rights of SMFG ��������������������������� 178 —
6th series of stock acquisition rights of SMFG ��������������������������� 192 —
■ Other Information Regarding Compensation Structures of SMFG and its Group CompaniesNot applicable
In order to hold the Executives accountable and provide them with appropriate incentives for theperformance of the group, the Programme targets the variable compensation component of totalremuneration at 40%, if paid at standard levels. The Programme shall have three components: base salary, cash bonus, and stock compensation. Cash bonus shall be determined based on the annual performance of the group, as well as on the performance of the respective Executive reviewed both from short-term and medium-/long-term perspectives. Stock compensation is determined based on the progress of the Medium-term Management plan, performance of SMFG shares, and the results of customer satisfaction surveys, etc. SMFG and SMBC allot restricted stocks via the Plans to Executives to effectively defer part of executive compensation.In addition, SMFG and SMBC introduced the malus (forfeiture) of restricted stock and the claw-back of vested stock allocated to the Executives under the Plans in order to restrain excessive risk-taking and foster a prudent risk culture expected of a financial institution. Provisions on malus and clawbacks are included in the Allotment Agreement and they shall be exercised in the event of material amendments to the financial statements or material reputational damage caused by the Executives after thorough review at the Compensation Committee.In addition, in determining the compensation for employees, their job responsibilities and business performance are taken into account. For variablecompensation, in order to avoid an excessive result-oriented approach, it is determined after comprehensive evaluation based on not only short-term performance results but also qualitative evaluation. Compensation is individually designed with consideration to local regulations, guidelines, and other market practices, whilst ensuring the compensation should not incentivize for excessive risk-taking.
2. Other Major Consolidated SubsidiariesThe compensation for officers and employees of other major subsidiaries of SMFG are determined by comprehensively taking into account the assessment of the subsidiaries’ medium- and long-term earnings, and in the case of an overseas subsidiary, lo-cal laws, regulations and employment practices, and a compensation structure that could affect the risk management of the group has not been adopted. In addition, expenses for employee retention are recorded for employees of certain major consoli-dated subsidiaries.
Compensation
015_0800885852907.indd 298 2017/08/10 20:50:05
SMBC
2992017 Annual Report
■ Compensation Framework of SMBC Group1. Scope of Officers and Employees
The scope of officers, employees and others whose compensation is subject to disclosure under the revised Cabinet Office on Disclosure ofCorporate Affairs, etc. and other ordinances are as described below.(1) Scope of Officers
Officers subject to compensation disclosure are directors and corporate auditors of SMBC during the fiscal year under review (excluding outside directors and corporate auditors).
(2) Scope of Employees and OthersEmployees and others subject to compensation disclosure are employees of SMBC and officers and employees of its major consolidatedsubsidiaries who are highly compensated and have a material influence on the business management or the assets of SMBC and its majorconsolidated subsidiaries.a) Scope of major consolidated subsidiaries
A major consolidated subsidiary is a consolidated subsidiary of SMBC with total assets accounting for more than 2% of the total consolidated assets of SMBC and has a material influence on the management of SMBC and its group companies. Specifically, they are Kansai Urban Banking Corporation, The Minato Bank, Ltd., SMBC Guarantee Co., Ltd. and overseas subsidiaries such as Sumitomo Mitsui Banking Corporation Europe Limited and Sumitomo Mitsui Banking Corporation (China) Limited.
b) Scope of highly compensated personsA highly compensated person is an individual whose compensation paid by SMBC or its major subsidiaries is equal to or more thanthe base amount. The base amount of SMBC is set at ¥60 million which is based on the average amount of compensation paid to theofficers of SMFG and SMBC (excluding officers appointed or retired during the fiscal year in question) over the last three fiscal years(hereinafter “executive compensation amount”) and is applied to all group companies. This is because many of the officers of SMFGalso serve as officers of SMBC, and their executive compensation amount is determined according to their contribution to the groupas a whole. With respect to lump-sum retirement payment, the executive compensation amount for the fiscal year in question is “(his/her executive compensation amount – lump-sum retirement payment) + (lump-sum retirement payment/years of service)” and theexecutive compensation amount calculated using this formula is compared to the base amount.
c) Material influence on the business management or assets of SMBC and its major consolidated subsidiariesA person has a material influence on the business management or assets of SMBC and its major consolidated subsidiaries if his/herregular transactions or regular matters managed by him/her have a substantial impact on the business management of SMBC and itsgroup companies, or losses incurred through such actions have a significant impact on the financial situation of SMBC and its groupcompanies. Specifically, persons having such influence are directors, corporate auditors and corporate officers of SMBC and its majorconsolidated subsidiaries, both domestic and overseas.
2. Determination of CompensationDetermination of compensation is stated in “Compensation” of Sumitomo Mitsui Financial Group (please refer to “2. Determination of Compensation” on page 296).
■ Assessment of Design and Operation of Compensation StructureCompensation Policy
Compensation policy is stated in “Compensation” of Sumitomo Mitsui Financial Group (please refer to “Compensation Policy” on page 297).
■ Consistency between Compensation Structure and Risk Management and Link between Compensation and PerformanceConsistency between compensation structure and risk management and link between compensation and performance is stated in “Compensation” of Sumitomo Mitsui Financial Group (please refer to “Consistency between Compensation Structure and Risk Management and Link between Compensation and Performance” on pages 297 to 298).
CompensationSumitomo Mitsui Banking Corporation (SMBC) and Its Group Companies
015_0800885852907.indd 299 2017/08/10 20:50:05

SMBC
300 2017 Annual Report
■ Type, Total Amount Paid, and Payment Method of Compensation for Officers, Employees and Others of SMBC and Its Group Companies
1. Total Amount of Compensation Paid to Officers, Employees and Others (SMBC consolidated, April 1, 2016 to March 31, 2017)
Number ofofficers/
employeesand others
Millions of yen Amount of compensation
Total
Amount of fixed compensationAmount of variable
compensationRetirementallowance
OtherbenefitsTotal Base salary
Stockoptions
Otherbenefits Total Bonuses
Officers (excluding outside directors and corporate auditors) ���������������������������� 25 1,765 1,451 1,274 173 2 282 282 17 14
Employees and others �������� 74 5,981 2,978 2,764 209 3 2,702 2,702 — 300
Notes: 1. Compensation amount includes those amounts of major consolidated subsidiaries.2. The total amount of fixed compensation includes ¥383 million in deferred compensation accrued during the fiscal year (officers: ¥173 million; employees and others: ¥209
million).3. The total amount of variable compensation includes ¥516 million in deferred compensation accrued during the fiscal year (officers: ¥- million; employees and others: ¥516
million).4. Stock options are classified as fixed compensation because the number of stock options granted depends on the individual’s position.5. The exercise period of stock option is shown in the table below.
Under the stock option agreement, the exercise of stock options is deferred until the retirement date, regardless of the exercise period:
Company name Stock option rights exercise period1st series of stock acquisition rights of SMFG ���������������������������� August 13, 2010 to August 12, 2040
2nd series of stock acquisition rights of SMFG �������������������������� August 16, 2011 to August 15, 2041
3rd series of stock acquisition rights of SMFG ��������������������������� August 15, 2012 to August 14, 2042
4th series of stock acquisition rights of SMFG ��������������������������� August 14, 2013 to August 13, 2043
5th series of stock acquisition rights of SMFG ��������������������������� August 15, 2014 to August 14, 2044
6th series of stock acquisition rights of SMFG ��������������������������� August 18, 2015 to August 17, 2045
7th series of stock acquisition rights of SMFG ��������������������������� August 15, 2016 to August 14, 2046
6. Payment of the following compensation, including the above, has been deferred:Millions of yen
Type of compensation, etc� March 31, 2017 Payment during the fiscal year
1st series of stock acquisition rights of SMFG ���������������������������� 46 —
2nd series of stock acquisition rights of SMFG �������������������������� 137 —
3rd series of stock acquisition rights of SMFG ��������������������������� 170 —
4th series of stock acquisition rights of SMFG ��������������������������� 134 —
5th series of stock acquisition rights of SMFG ��������������������������� 153 —
6th series of stock acquisition rights of SMFG ��������������������������� 165 —
Compensation
015_0800885852907.indd 300 2017/08/10 20:50:05
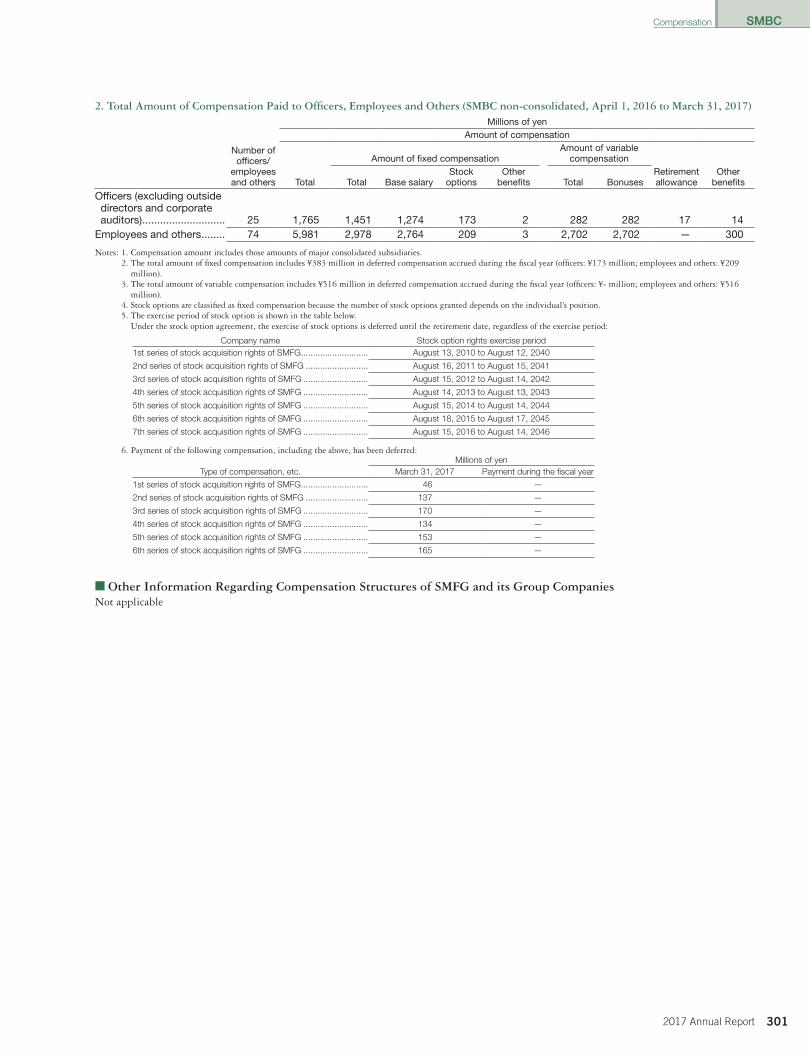
SMBC
3012017 Annual Report
2. Total Amount of Compensation Paid to Officers, Employees and Others (SMBC non-consolidated, April 1, 2016 to March 31, 2017)
Number ofofficers/
employeesand others
Millions of yen Amount of compensation
Total
Amount of fixed compensationAmount of variable
compensationRetirementallowance
OtherbenefitsTotal Base salary
Stockoptions
Otherbenefits Total Bonuses
Officers (excluding outside directors and corporate auditors) ���������������������������� 25 1,765 1,451 1,274 173 2 282 282 17 14
Employees and others �������� 74 5,981 2,978 2,764 209 3 2,702 2,702 — 300
Notes: 1. Compensation amount includes those amounts of major consolidated subsidiaries.2. The total amount of fixed compensation includes ¥383 million in deferred compensation accrued during the fiscal year (officers: ¥173 million; employees and others: ¥209
million).3. The total amount of variable compensation includes ¥516 million in deferred compensation accrued during the fiscal year (officers: ¥- million; employees and others: ¥516
million).4. Stock options are classified as fixed compensation because the number of stock options granted depends on the individual’s position.5. The exercise period of stock option is shown in the table below.
Under the stock option agreement, the exercise of stock options is deferred until the retirement date, regardless of the exercise period:
Company name Stock option rights exercise period1st series of stock acquisition rights of SMFG ���������������������������� August 13, 2010 to August 12, 2040
2nd series of stock acquisition rights of SMFG �������������������������� August 16, 2011 to August 15, 2041
3rd series of stock acquisition rights of SMFG ��������������������������� August 15, 2012 to August 14, 2042
4th series of stock acquisition rights of SMFG ��������������������������� August 14, 2013 to August 13, 2043
5th series of stock acquisition rights of SMFG ��������������������������� August 15, 2014 to August 14, 2044
6th series of stock acquisition rights of SMFG ��������������������������� August 18, 2015 to August 17, 2045
7th series of stock acquisition rights of SMFG ��������������������������� August 15, 2016 to August 14, 2046
6. Payment of the following compensation, including the above, has been deferred:Millions of yen
Type of compensation, etc� March 31, 2017 Payment during the fiscal year
1st series of stock acquisition rights of SMFG ���������������������������� 46 —
2nd series of stock acquisition rights of SMFG �������������������������� 137 —
3rd series of stock acquisition rights of SMFG ��������������������������� 170 —
4th series of stock acquisition rights of SMFG ��������������������������� 134 —
5th series of stock acquisition rights of SMFG ��������������������������� 153 —
6th series of stock acquisition rights of SMFG ��������������������������� 165 —
■ Other Information Regarding Compensation Structures of SMFG and its Group CompaniesNot applicable
Compensation
015_0800885852907.indd 301 2017/08/10 20:50:05

015_0800885852907.indd 302 2017/08/10 20:50:05

Printed in Japan