2011 port colborne canal days economic impact study
TRANSCRIPT
8/3/2019 2011 Port Colborne Canal Days economic impact study
http://slidepdf.com/reader/full/2011-port-colborne-canal-days-economic-impact-study 1/35
1
2011 Port Colborne Canal DaysEconomic Impact Study
Port Colborne, Ontario • July 29 to August 1, 2011
START
8/3/2019 2011 Port Colborne Canal Days economic impact study
http://slidepdf.com/reader/full/2011-port-colborne-canal-days-economic-impact-study 2/35
2< index view print exit ? >
methodology
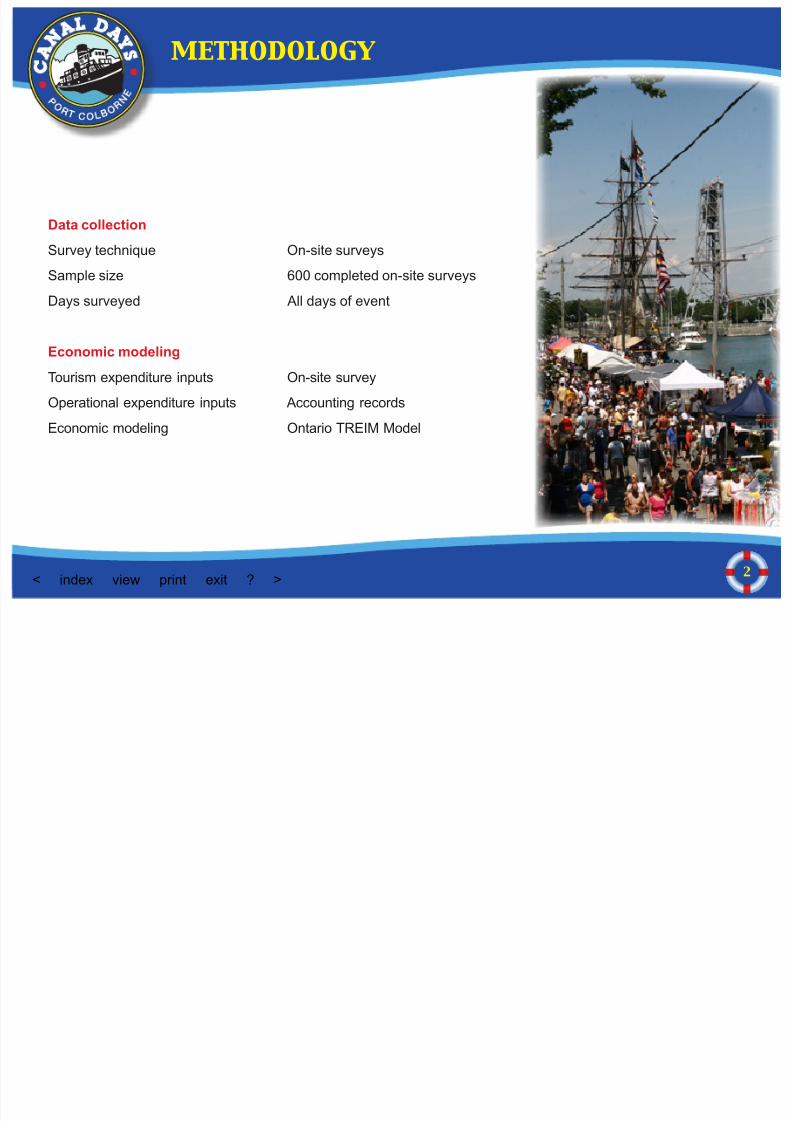
Data collection
Survey technique On-site surveys
Sample size 600 completed on-site surveys
Days surveyed All days of event
Economic modeling
Tourism expenditure inputs On-site survey
Operational expenditure inputs Accounting records
Economic modeling Ontario TREIM Model
8/3/2019 2011 Port Colborne Canal Days economic impact study
http://slidepdf.com/reader/full/2011-port-colborne-canal-days-economic-impact-study 3/35
3< index view print exit ? >
EXECUTIVE SUMMARY
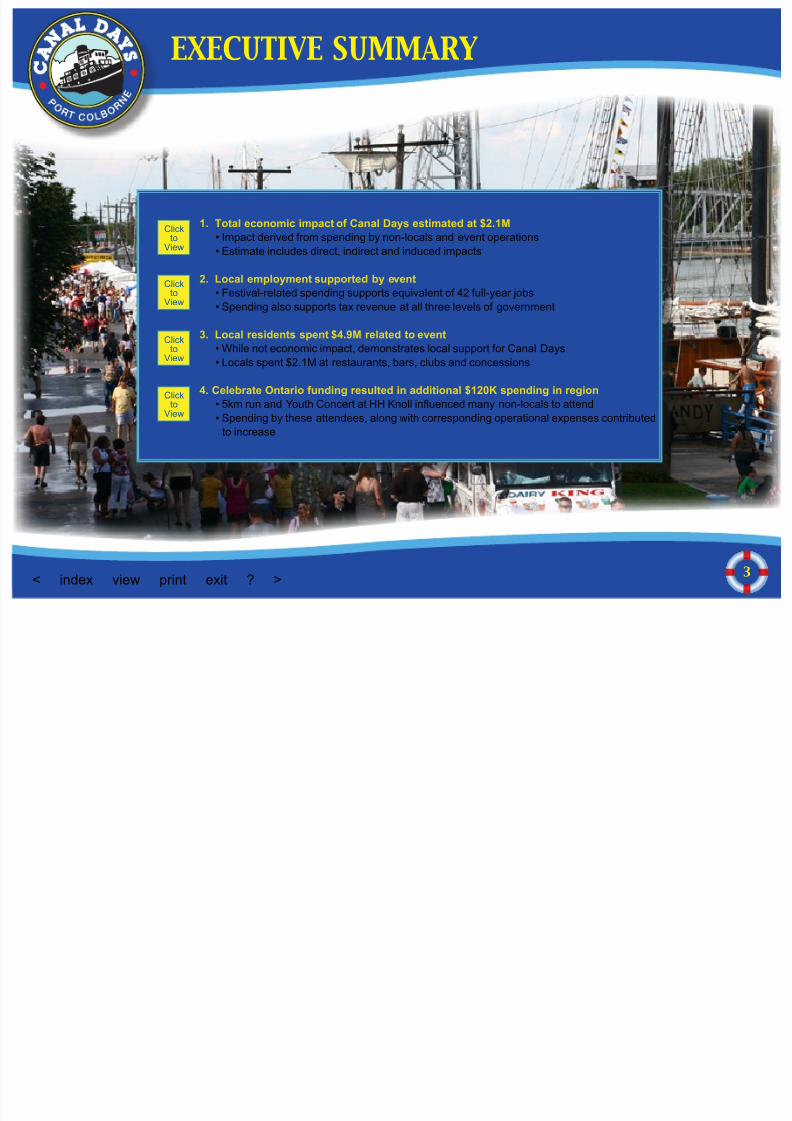
1. Total economic impact of Canal Days estimated at $2.1M
• Impact derived from spending by non-locals and event operations
• Estimate includes direct, indirect and induced impacts
2. Local employment supported by event• Festival-related spending supports equivalent of 42 full-year jobs
• Spending also supports tax revenue at all three levels of government
3. Local residents spent $4.9M related to event
• While not economic impact, demonstrates local support for Canal Days
• Locals spent $2.1M at restaurants, bars, clubs and concessions
4. Celebrate Ontario funding resulted in additional $120K spending in region
• 5km run and Youth Concert at HH Knoll inuenced many non-locals to attend
• Spending by these attendees, along with corresponding operational expenses contributedto increase
Click
to
View
Click
to
View
Click
to
View
Click
to
View
8/3/2019 2011 Port Colborne Canal Days economic impact study
http://slidepdf.com/reader/full/2011-port-colborne-canal-days-economic-impact-study 4/35
4< index view print exit ? >
EXECUTIVE SUMMARY
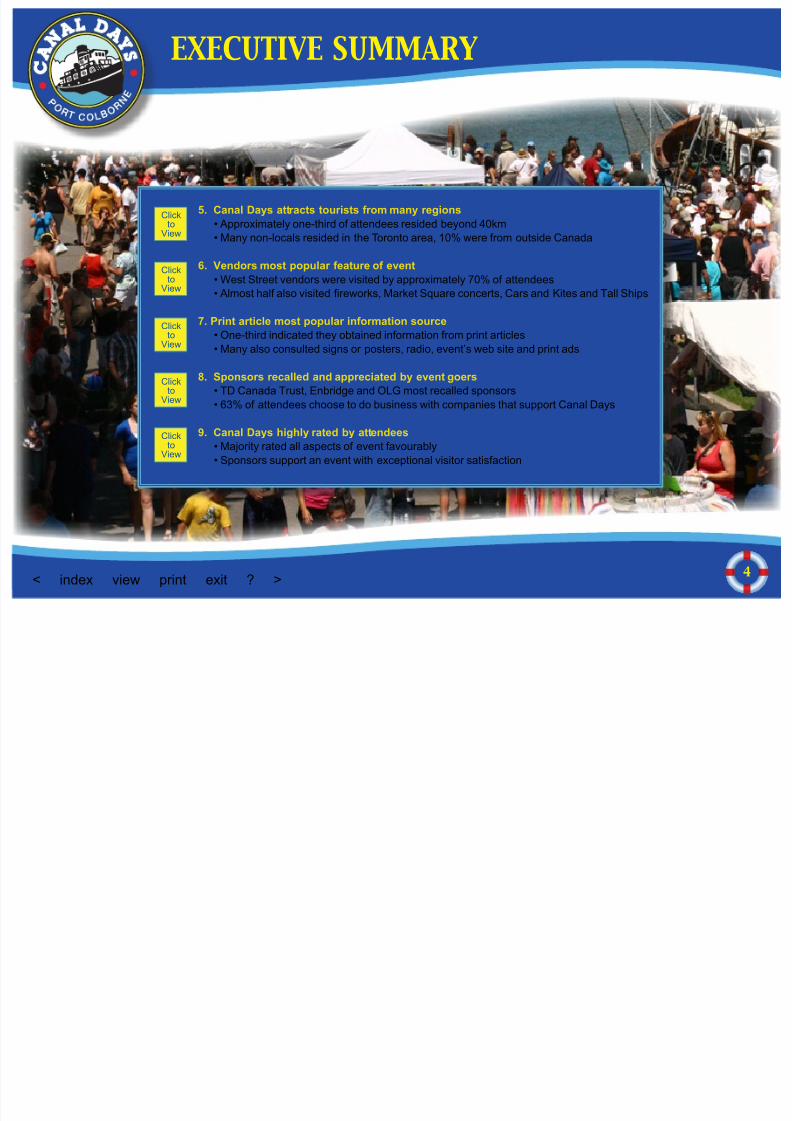
5. Canal Days attracts tourists from many regions
• Approximately one-third of attendees resided beyond 40km
• Many non-locals resided in the Toronto area, 10% were from outside Canada
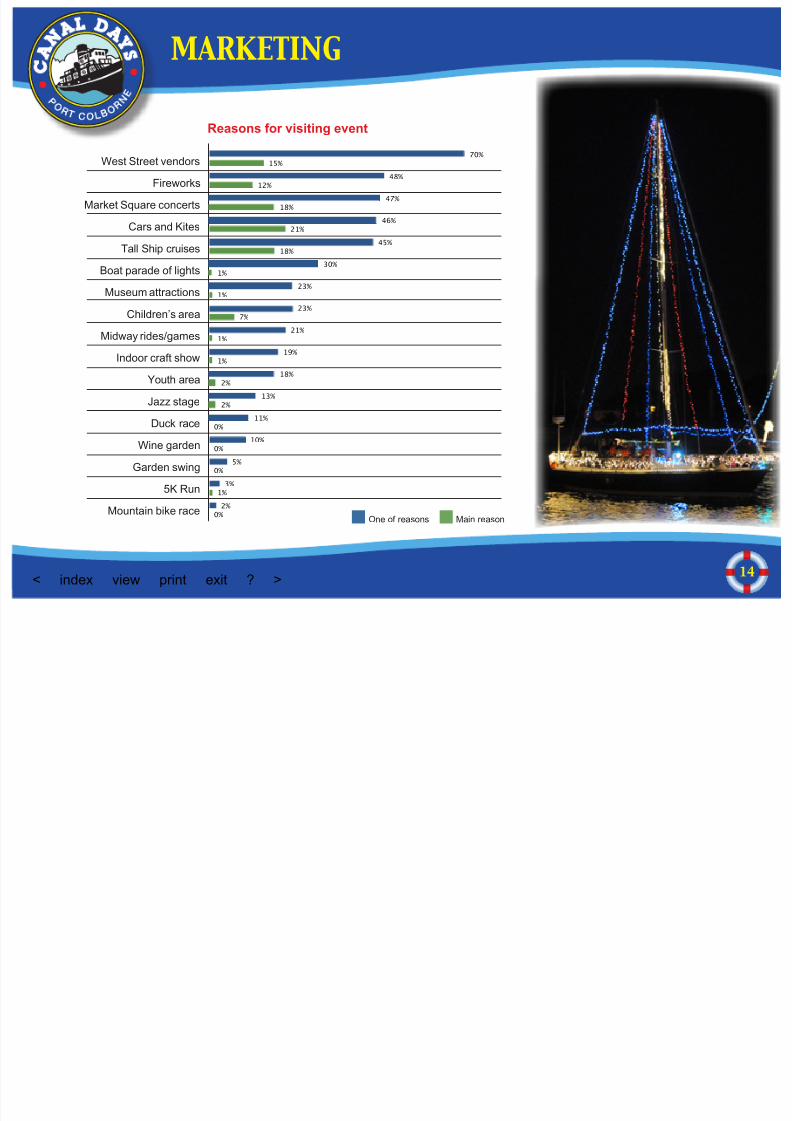
6. Vendors most popular feature of event
• West Street vendors were visited by approximately 70% of attendees• Almost half also visited reworks, Market Square concerts, Cars and Kites and Tall Ships
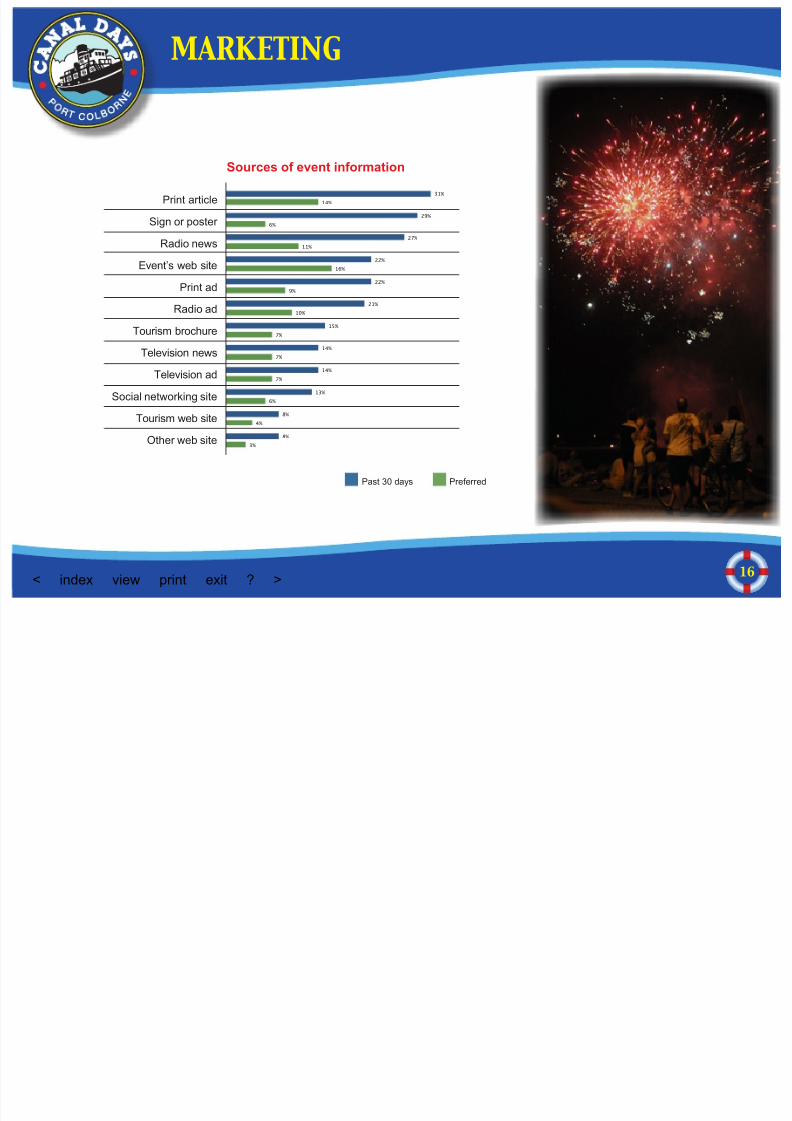
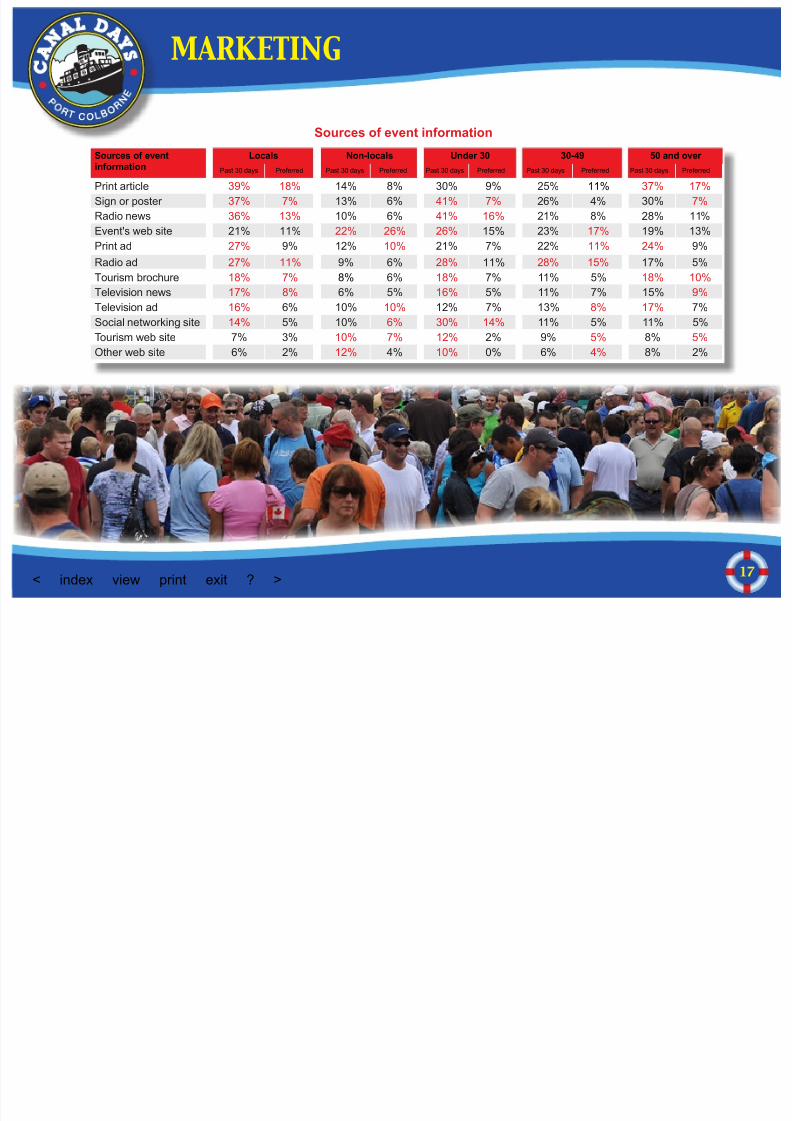
7. Print article most popular information source
• One-third indicated they obtained information from print articles
• Many also consulted signs or posters, radio, event’s web site and print ads
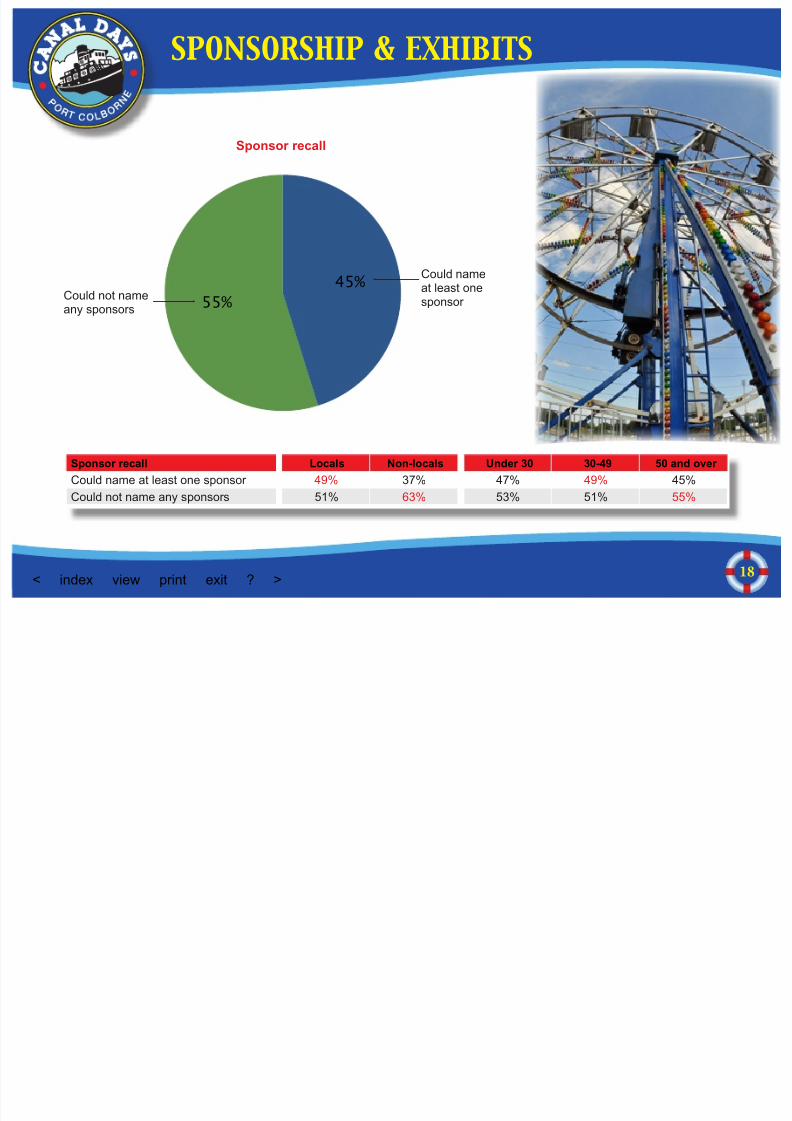
8. Sponsors recalled and appreciated by event goers
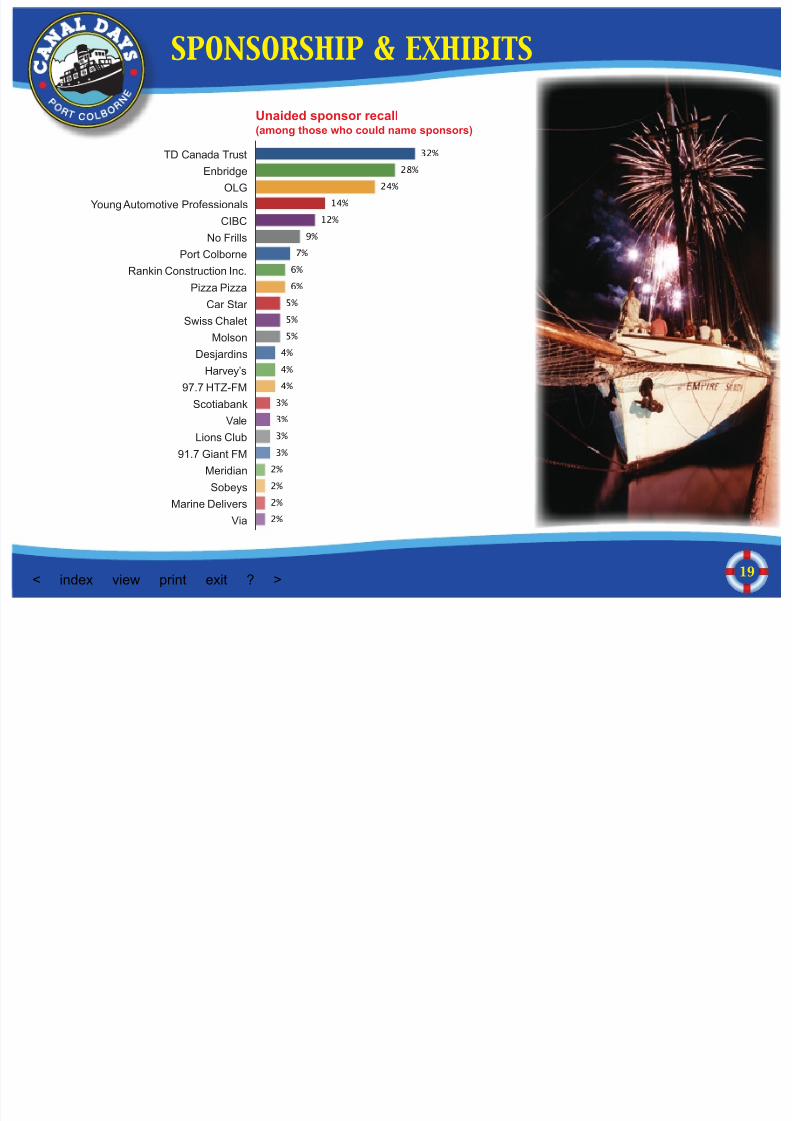
• TD Canada Trust, Enbridge and OLG most recalled sponsors
• 63% of attendees choose to do business with companies that support Canal Days
9. Canal Days highly rated by attendees
• Majority rated all aspects of event favourably
• Sponsors support an event with exceptional visitor satisfaction
Click
to
View
Click
to
View
Click
to
View
Click
to
View
Click
to
View
8/3/2019 2011 Port Colborne Canal Days economic impact study
http://slidepdf.com/reader/full/2011-port-colborne-canal-days-economic-impact-study 5/35
5< index view print exit ? >
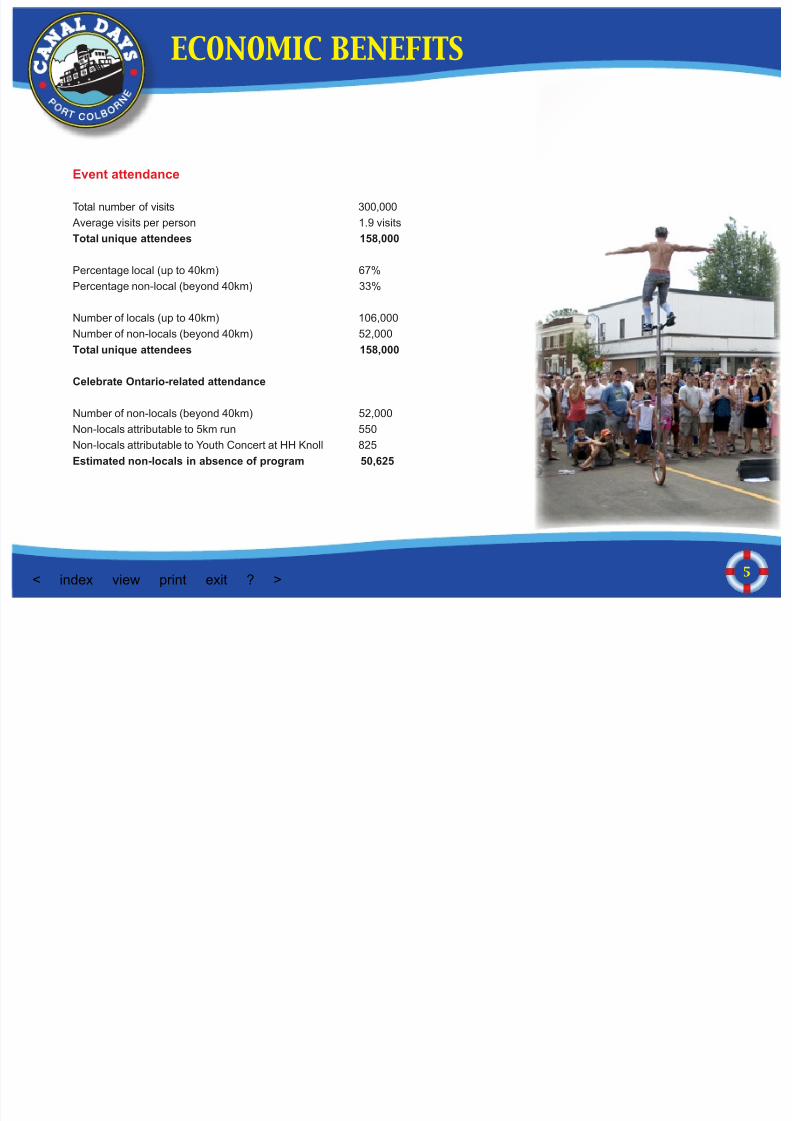
Event attendance
Total number of visits 300,000
Average visits per person 1.9 visits
Total unique attendees 158,000
Percentage local (up to 40km) 67%
Percentage non-local (beyond 40km) 33%
Number of locals (up to 40km) 106,000
Number of non-locals (beyond 40km) 52,000
Total unique attendees 158,000
Celebrate Ontario-related attendance
Number of non-locals (beyond 40km) 52,000Non-locals attributable to 5km run 550
Non-locals attributable to Youth Concert at HH Knoll 825
Estimated non-locals in absence of program 50,625
ECONOMIC BENEFITS
8/3/2019 2011 Port Colborne Canal Days economic impact study
http://slidepdf.com/reader/full/2011-port-colborne-canal-days-economic-impact-study 6/35
6< index view print exit ? >
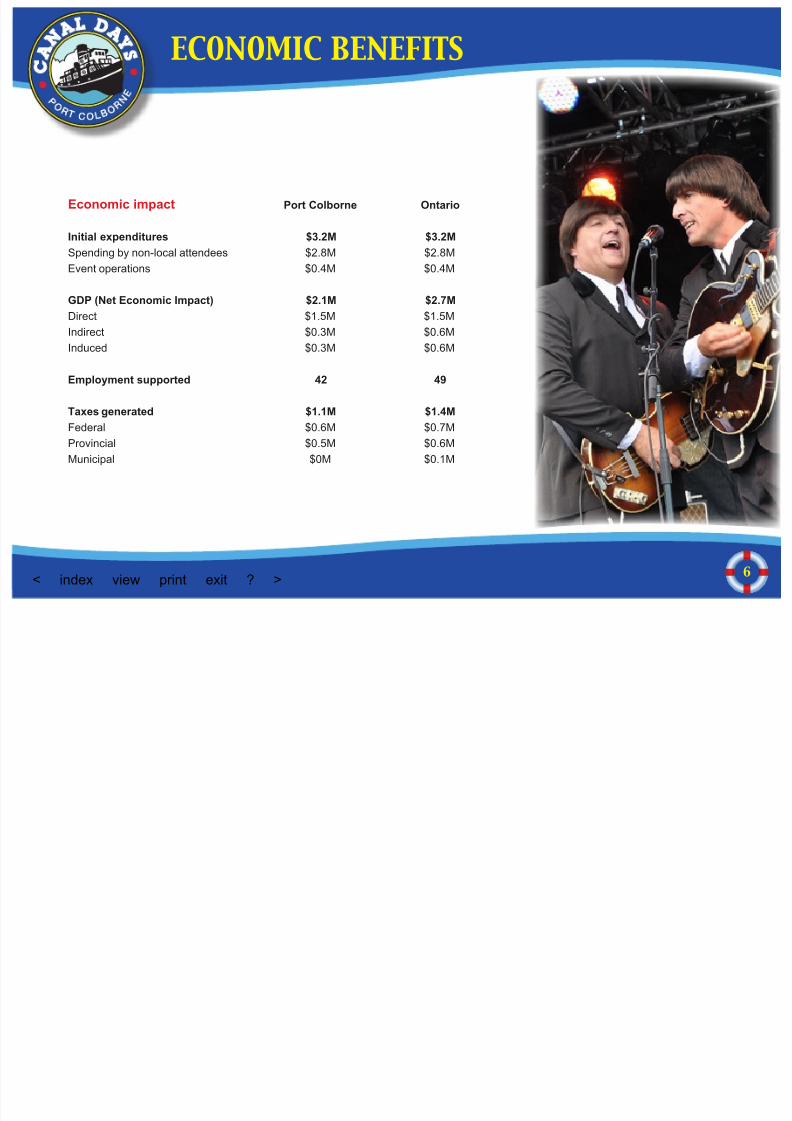
Economic impact Port Colborne Ontario
Initial expenditures $3.2M $3.2M
Spending by non-local attendees $2.8M $2.8M
Event operations $0.4M $0.4M
GDP (Net Economic Impact) $2.1M $2.7M
Direct $1.5M $1.5M
Indirect $0.3M $0.6M
Induced $0.3M $0.6M
Employment supported 42 49
Taxes generated $1.1M $1.4MFederal $0.6M $0.7M
Provincial $0.5M $0.6M
Municipal $0M $0.1M
ECONOMIC BENEFITS
8/3/2019 2011 Port Colborne Canal Days economic impact study
http://slidepdf.com/reader/full/2011-port-colborne-canal-days-economic-impact-study 7/35
7< index view print exit ? >
$10,000
$40,000
$55,000
$115,000
$120,000
$155,000
$170,000
$210,000
$325,000
$430,000
$495,000
$705,000
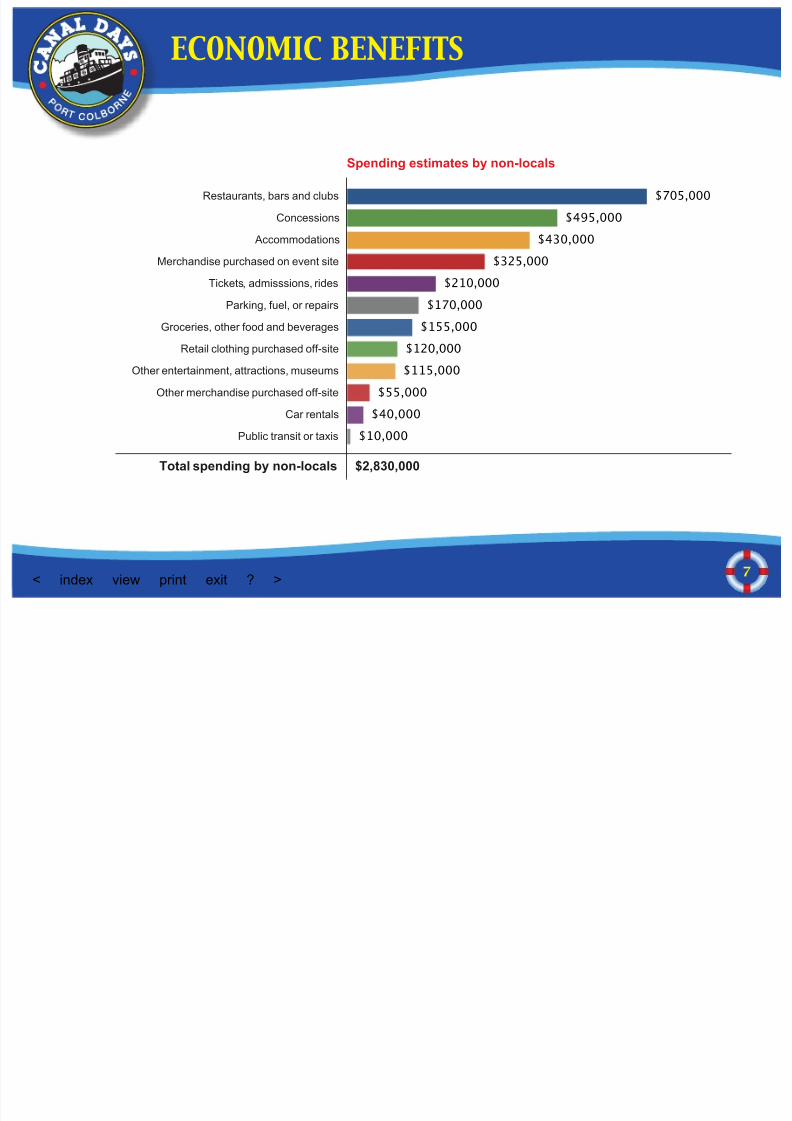
Spending estimates by non-locals
Restaurants, bars and clubs
Concessions
Accommodations
Merchandise purchased on event site
Tickets, admisssions, rides
Parking, fuel, or repairs
Groceries, other food and beverages
Retail clothing purchased off-site
Other entertainment, attractions, museums
Other merchandise purchased off-site
Car rentals
Public transit or taxis
Total spending by non-locals $2,830,000
ECONOMIC BENEFITS
8/3/2019 2011 Port Colborne Canal Days economic impact study
http://slidepdf.com/reader/full/2011-port-colborne-canal-days-economic-impact-study 8/35
8< index view print exit ? >
$55,000
$5,000
$5,000
$5,000
$8,000
$10,000
$15,000$35,000
$55,000
$100,000
$134,000
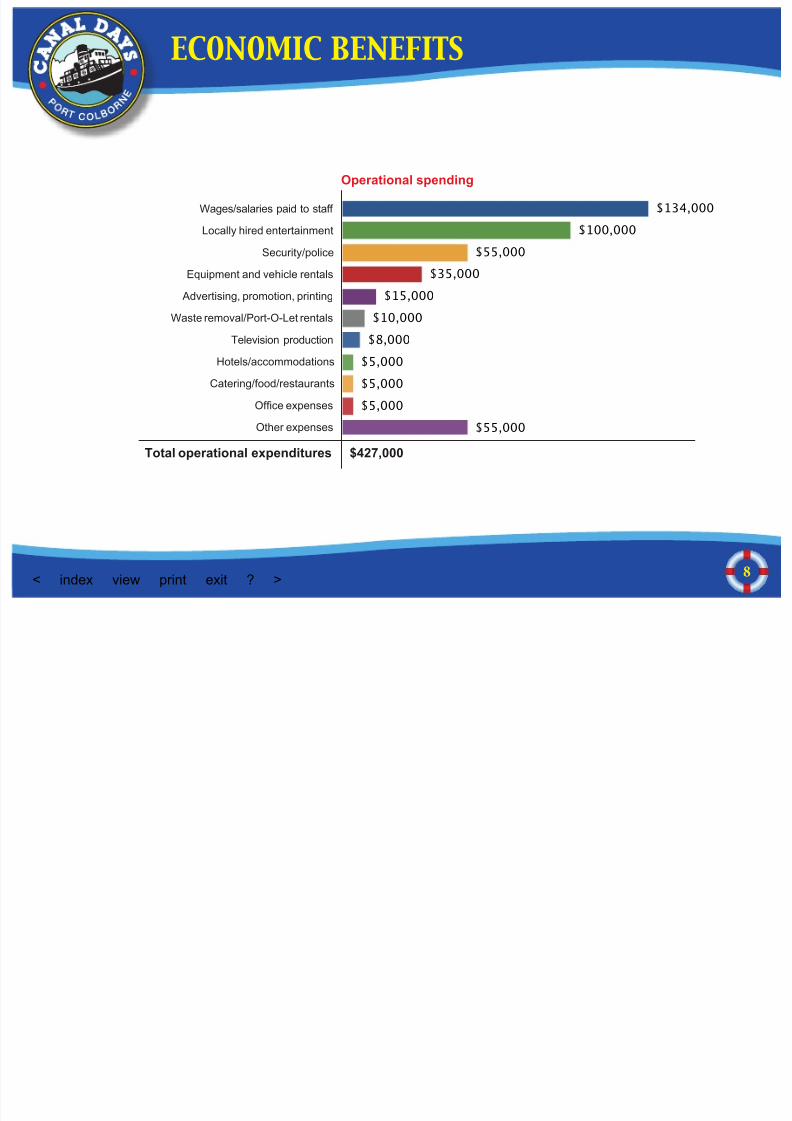
Operational spending
Wages/salaries paid to staff
Locally hired entertainment
Security/police
Equipment and vehicle rentals
Advertising, promotion, printing
Waste removal/Port-O-Let rentals
Television production
Hotels/accommodations
Catering/food/restaurants
Ofce expenses
Other expenses
Total operational expenditures $427,000
ECONOMIC BENEFITS
8/3/2019 2011 Port Colborne Canal Days economic impact study
http://slidepdf.com/reader/full/2011-port-colborne-canal-days-economic-impact-study 9/35
9< index view print exit ? >
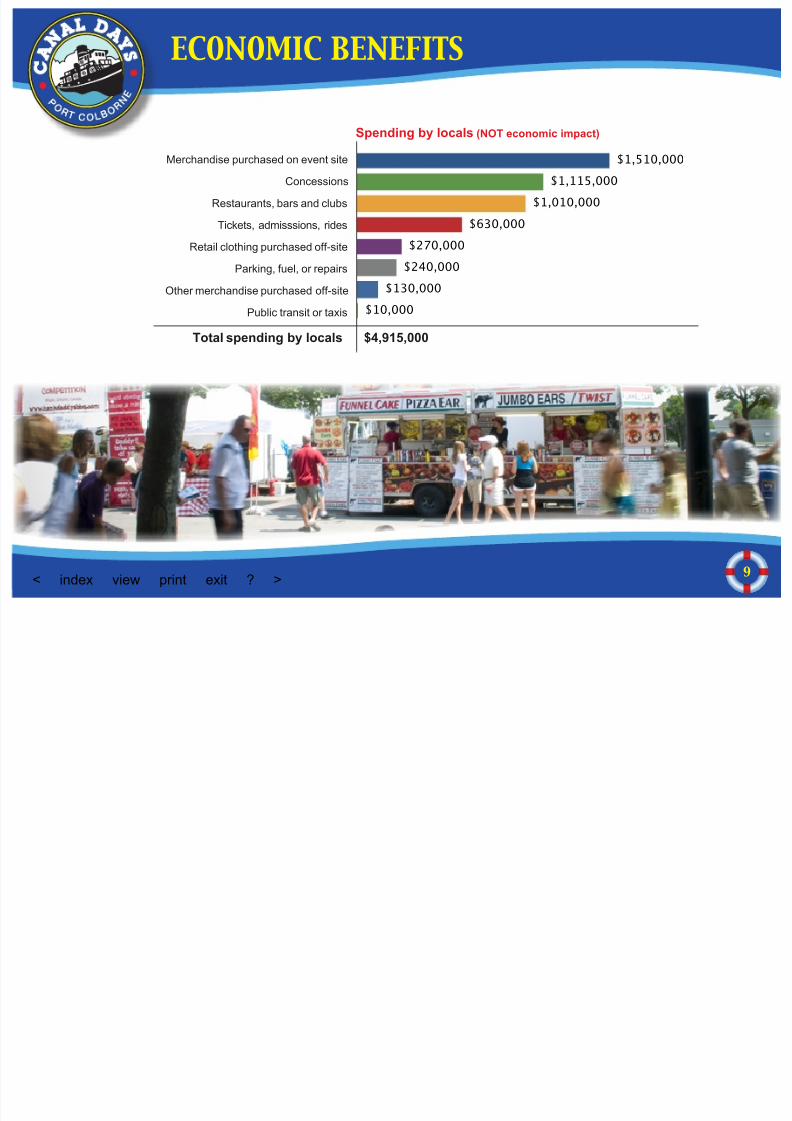
$10,000
$130,000
$240,000
$270,000
$630,000
$1,010,000
$1,115,000
$1,510,000
Spending by locals (NOT economic impact)
Merchandise purchased on event site
Concessions
Restaurants, bars and clubs
Tickets, admisssions, rides
Retail clothing purchased off-site
Parking, fuel, or repairs
Other merchandise purchased off-site
Public transit or taxis
Total spending by locals $4,915,000
ECONOMIC BENEFITS
8/3/2019 2011 Port Colborne Canal Days economic impact study
http://slidepdf.com/reader/full/2011-port-colborne-canal-days-economic-impact-study 10/35
10< index view print exit ? >
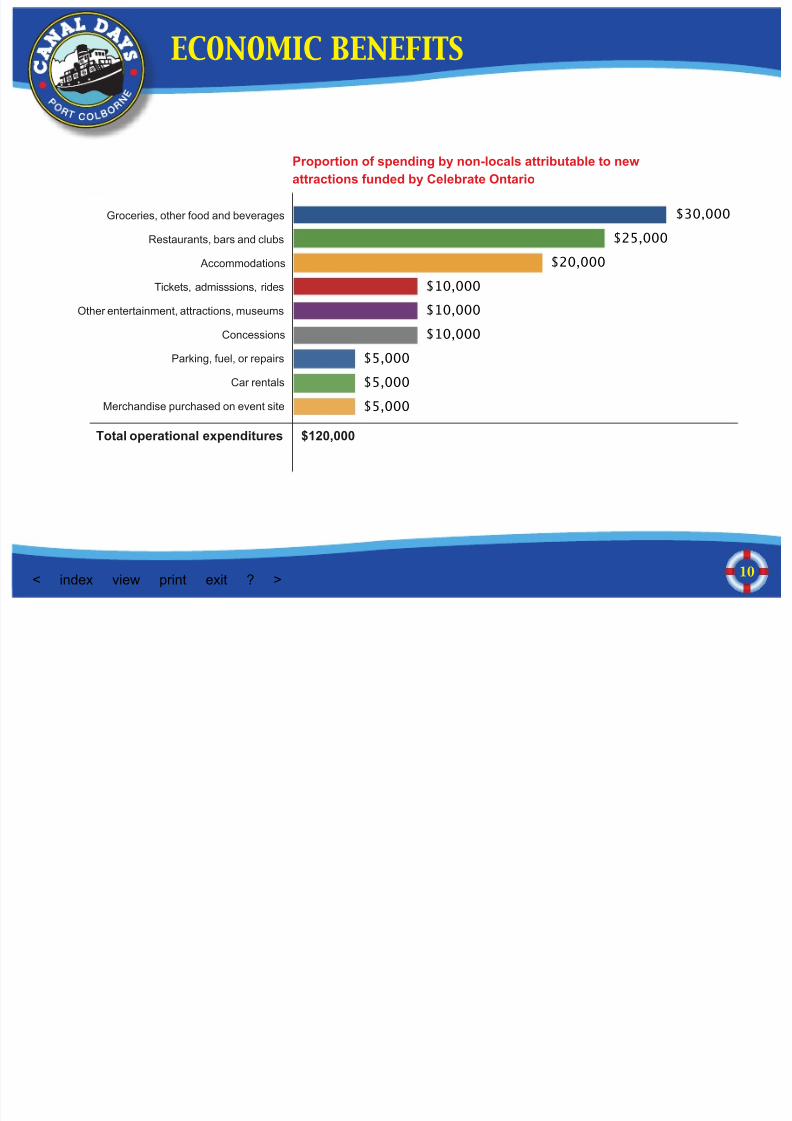
$5,000
$5,000
$5,000
$10,000
$10,000
$10,000
$20,000
$25,000
$30,000
ECONOMIC BENEFITS
Proportion of spending by non-locals attributable to new
attractions funded by Celebrate Ontario
Groceries, other food and beverages
Restaurants, bars and clubs
Accommodations
Tickets, admisssions, rides
Other entertainment, attractions, museums
Concessions
Parking, fuel, or repairs
Car rentals
Merchandise purchased on event site
Total operational expenditures $120,000
8/3/2019 2011 Port Colborne Canal Days economic impact study
http://slidepdf.com/reader/full/2011-port-colborne-canal-days-economic-impact-study 11/35
11< index view print exit ? >
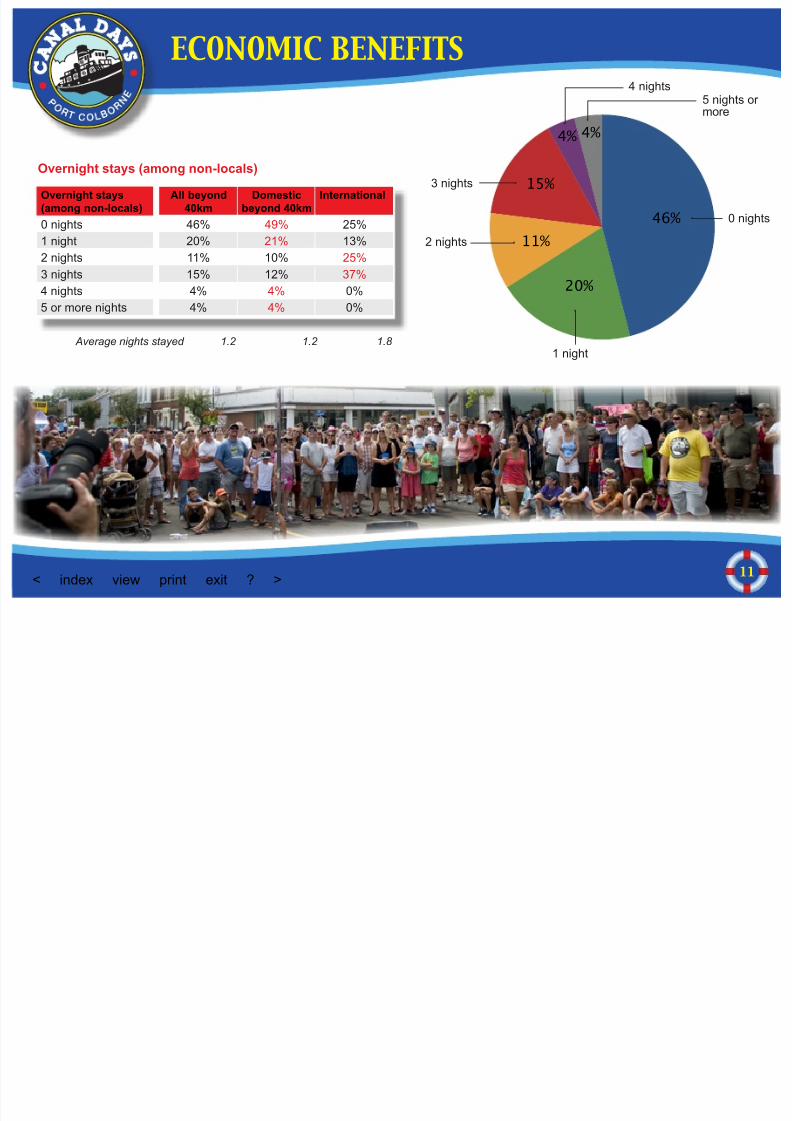
4%4%
15%
11%
20%
46%
Overnight stays(among non-locals)
All beyond40km
Domesticbeyond 40km
International
0 nights 46% 49% 25%
1 night 20% 21% 13%
2 nights 11% 10% 25%
3 nights 15% 12% 37%4 nights 4% 4% 0%
5 or more nights 4% 4% 0%
Overnight stays (among non-locals)
0 nights
1 night
2 nights
3 nights
4 nights5 nights or more
Average nights stayed 1.2 1.2 1.8
ECONOMIC BENEFITS
8/3/2019 2011 Port Colborne Canal Days economic impact study
http://slidepdf.com/reader/full/2011-port-colborne-canal-days-economic-impact-study 12/35
12< index view print exit ? >
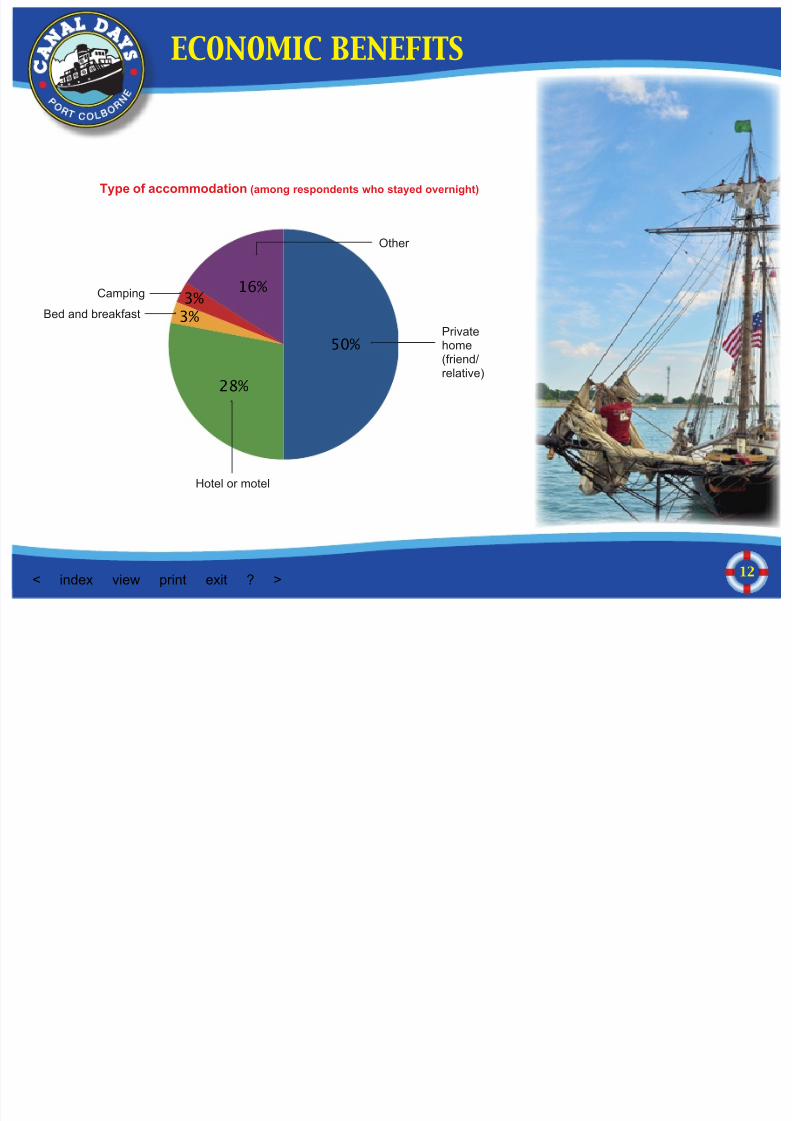
16%3%
3%
28%
50%
Type of accommodation (among respondents who stayed overnight)
Privatehome(friend/relative)
Hotel or motel
Bed and breakfast
Camping
Other
ECONOMIC BENEFITS
8/3/2019 2011 Port Colborne Canal Days economic impact study
http://slidepdf.com/reader/full/2011-port-colborne-canal-days-economic-impact-study 13/35
13< index view print exit ? >
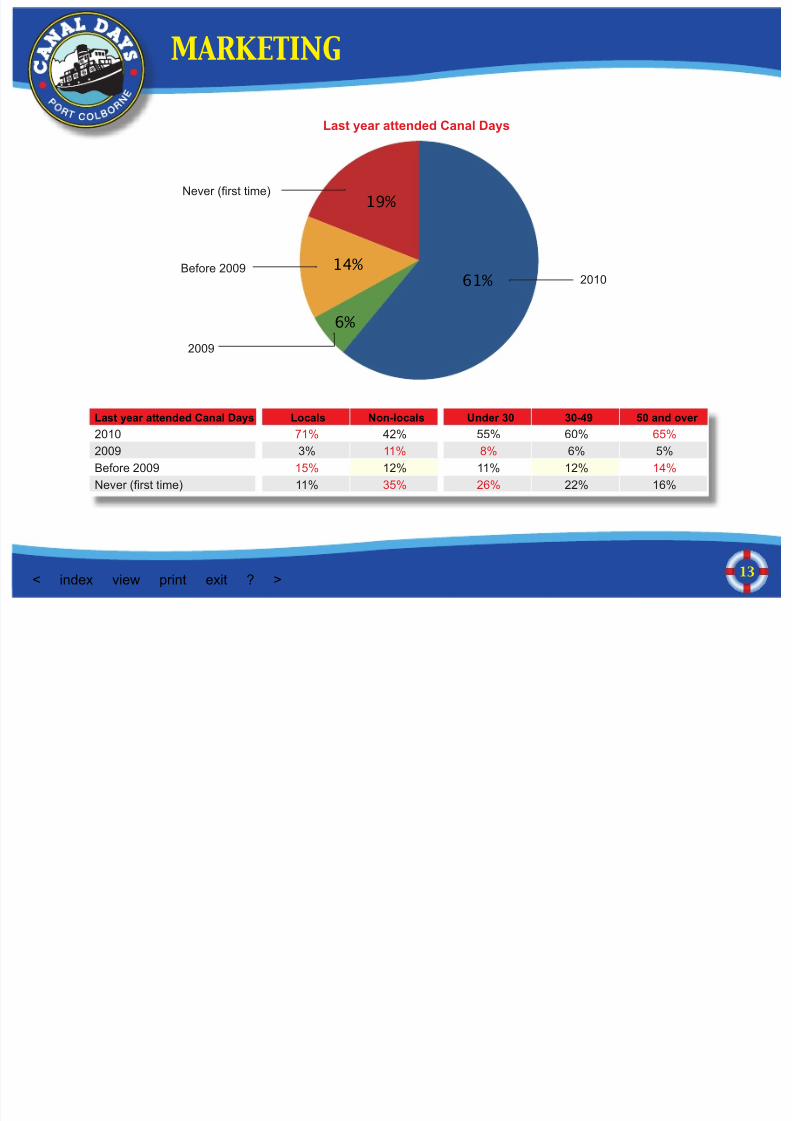
19%
14%
6%
61%
Last year attended Canal Days Locals Non-locals Under 30 30-49 50 and over
2010 71% 42% 55% 60% 65%
2009 3% 11% 8% 6% 5%
Before 2009 15% 12% 11% 12% 14%
Never (rst time) 11% 35% 26% 22% 16%
Last year attended Canal Days
2010
2009
Before 2009
Never (rst time)
MARKETING
8/3/2019 2011 Port Colborne Canal Days economic impact study
http://slidepdf.com/reader/full/2011-port-colborne-canal-days-economic-impact-study 14/35
14< index view print exit ? >
Reasons for visiting event
MARKETING
West Street vendors
Fireworks
Market Square concerts
Cars and Kites
Tall Ship cruises
Boat parade of lights
Museum attractions
Children’s area
Midway rides/games
Indoor craft show
Youth area
Jazz stage
Duck race
Wine garden
Garden swing
5K Run
Mountain bike raceOne of reasons Main reason
0%
1%
0%
0%
0%
2%
2%
1%
1%
7%
1%
1%
18%
21%
18%
12%
15%
2%
3%
5%
10%
11%
13%
18%
19%
21%
23%
23%
30%
45%
46%
47%
48%
70%
8/3/2019 2011 Port Colborne Canal Days economic impact study
http://slidepdf.com/reader/full/2011-port-colborne-canal-days-economic-impact-study 15/35
15< index view print exit ? >
MARKETING
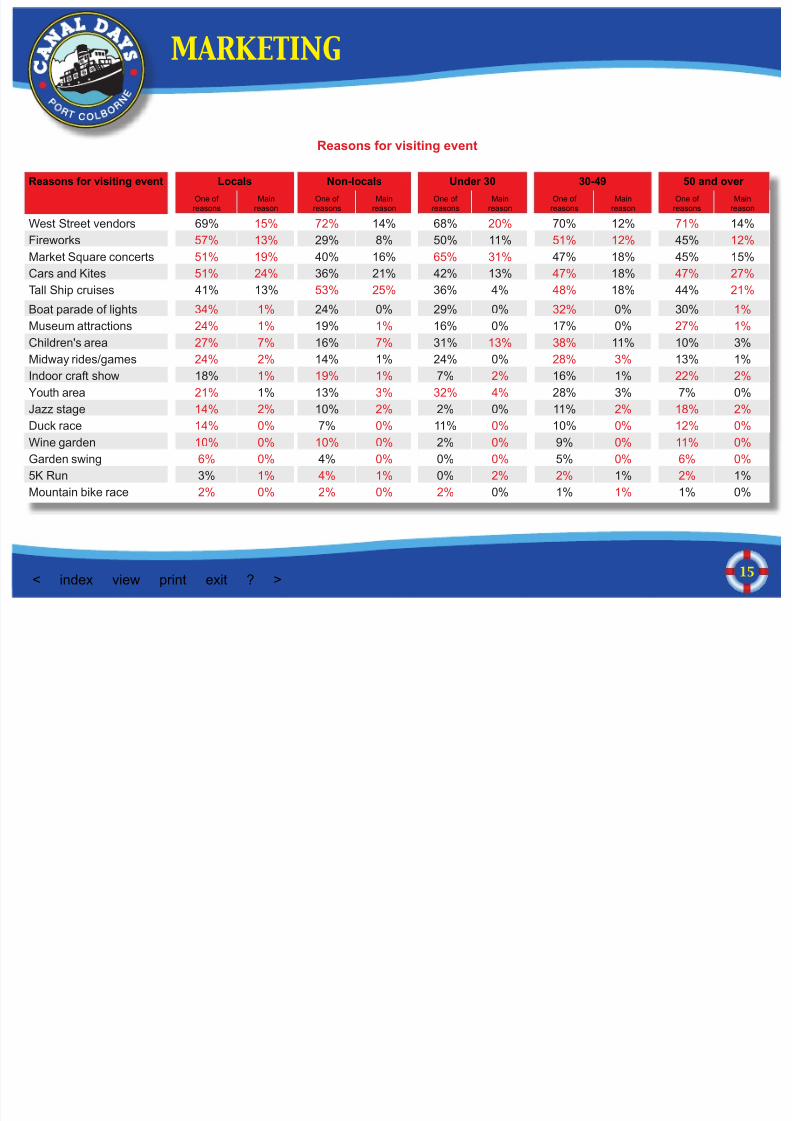
Reasons for visiting event Locals Non-locals Under 30 30-49 50 and over
One of
reasons
Main
reason
One of
reasons
Main
reason
One of
reasons
Main
reason
One of
reasons
Main
reason
One of
reasons
Main
reason
West Street vendors 69% 15% 72% 14% 68% 20% 70% 12% 71% 14%
Fireworks 57% 13% 29% 8% 50% 11% 51% 12% 45% 12%
Market Square concerts 51% 19% 40% 16% 65% 31% 47% 18% 45% 15%
Cars and Kites 51% 24% 36% 21% 42% 13% 47% 18% 47% 27%Tall Ship cruises 41% 13% 53% 25% 36% 4% 48% 18% 44% 21%
Boat parade of lights 34% 1% 24% 0% 29% 0% 32% 0% 30% 1%
Museum attractions 24% 1% 19% 1% 16% 0% 17% 0% 27% 1%
Children's area 27% 7% 16% 7% 31% 13% 38% 11% 10% 3%
Midway rides/games 24% 2% 14% 1% 24% 0% 28% 3% 13% 1%
Indoor craft show 18% 1% 19% 1% 7% 2% 16% 1% 22% 2%
Youth area 21% 1% 13% 3% 32% 4% 28% 3% 7% 0%
Jazz stage 14% 2% 10% 2% 2% 0% 11% 2% 18% 2%
Duck race 14% 0% 7% 0% 11% 0% 10% 0% 12% 0%
Wine garden 10% 0% 10% 0% 2% 0% 9% 0% 11% 0%
Garden swing 6% 0% 4% 0% 0% 0% 5% 0% 6% 0%
5K Run 3% 1% 4% 1% 0% 2% 2% 1% 2% 1%
Mountain bike race 2% 0% 2% 0% 2% 0% 1% 1% 1% 0%
Reasons for visiting event
8/3/2019 2011 Port Colborne Canal Days economic impact study
http://slidepdf.com/reader/full/2011-port-colborne-canal-days-economic-impact-study 16/35
16< index view print exit ? >
3%
4%
6%
7%
7%
7%
10%
9%
16%
11%
6%
14%
8%
8%
13%
14%
14%
15%
21%
22%
22%
27%
29%
31%
MARKETING
Sources of event information
Print article
Sign or poster
Radio news
Event’s web site
Print ad
Radio ad
Tourism brochure
Television news
Television ad
Social networking site
Tourism web site
Other web site
Past 30 days Preferred
8/3/2019 2011 Port Colborne Canal Days economic impact study
http://slidepdf.com/reader/full/2011-port-colborne-canal-days-economic-impact-study 17/35
17< index view print exit ? >
Sources of event
information
Locals Non-locals Under 30 30-49 50 and over
Past 30 days Preferred Past 30 days Preferred Past 30 days Preferred Past 30 days Preferred Past 30 days Preferred
Print article 39% 18% 14% 8% 30% 9% 25% 11% 37% 17%
Sign or poster 37% 7% 13% 6% 41% 7% 26% 4% 30% 7%
Radio news 36% 13% 10% 6% 41% 16% 21% 8% 28% 11%
Event's web site 21% 11% 22% 26% 26% 15% 23% 17% 19% 13%
Print ad 27% 9% 12% 10% 21% 7% 22% 11% 24% 9%
Radio ad 27% 11% 9% 6% 28% 11% 28% 15% 17% 5%
Tourism brochure 18% 7% 8% 6% 18% 7% 11% 5% 18% 10%Television news 17% 8% 6% 5% 16% 5% 11% 7% 15% 9%
Television ad 16% 6% 10% 10% 12% 7% 13% 8% 17% 7%
Social networking site 14% 5% 10% 6% 30% 14% 11% 5% 11% 5%
Tourism web site 7% 3% 10% 7% 12% 2% 9% 5% 8% 5%
Other web site 6% 2% 12% 4% 10% 0% 6% 4% 8% 2%
Sources of event information
MARKETING
8/3/2019 2011 Port Colborne Canal Days economic impact study
http://slidepdf.com/reader/full/2011-port-colborne-canal-days-economic-impact-study 18/35
18< index view print exit ? >
55%
45%
Sponsor recall
Could nameat least onesponsor
Could not nameany sponsors
SPONSORSHIP & EXHIBITS
Sponsor recall Locals Non-locals Under 30 30-49 50 and over
Could name at least one sponsor 49% 37% 47% 49% 45%
Could not name any sponsors 51% 63% 53% 51% 55%
8/3/2019 2011 Port Colborne Canal Days economic impact study
http://slidepdf.com/reader/full/2011-port-colborne-canal-days-economic-impact-study 19/35
19< index view print exit ? >
2%
2%
2%
2%
3%
3%
3%
3%
4%
4%
4%
5%
5%
5%
6%
6%
7%
9%
12%
14%
24%
28%
32%
Unaided sponsor recall(among those who could name sponsors)
TD Canada Trust
Enbridge
OLG
Young Automotive Professionals
CIBC
No Frills
Port Colborne
Rankin Construction Inc.
Pizza Pizza
Car Star
Swiss Chalet
Molson
Desjardins
Harvey’s
97.7 HTZ-FM
Scotiabank
Vale
Lions Club
91.7 Giant FM
Meridian
Sobeys
Marine Delivers
Via
SPONSORSHIP & EXHIBITS
8/3/2019 2011 Port Colborne Canal Days economic impact study
http://slidepdf.com/reader/full/2011-port-colborne-canal-days-economic-impact-study 20/35
20< index view print exit ? >
SPONSORSHIP & EXHIBITS
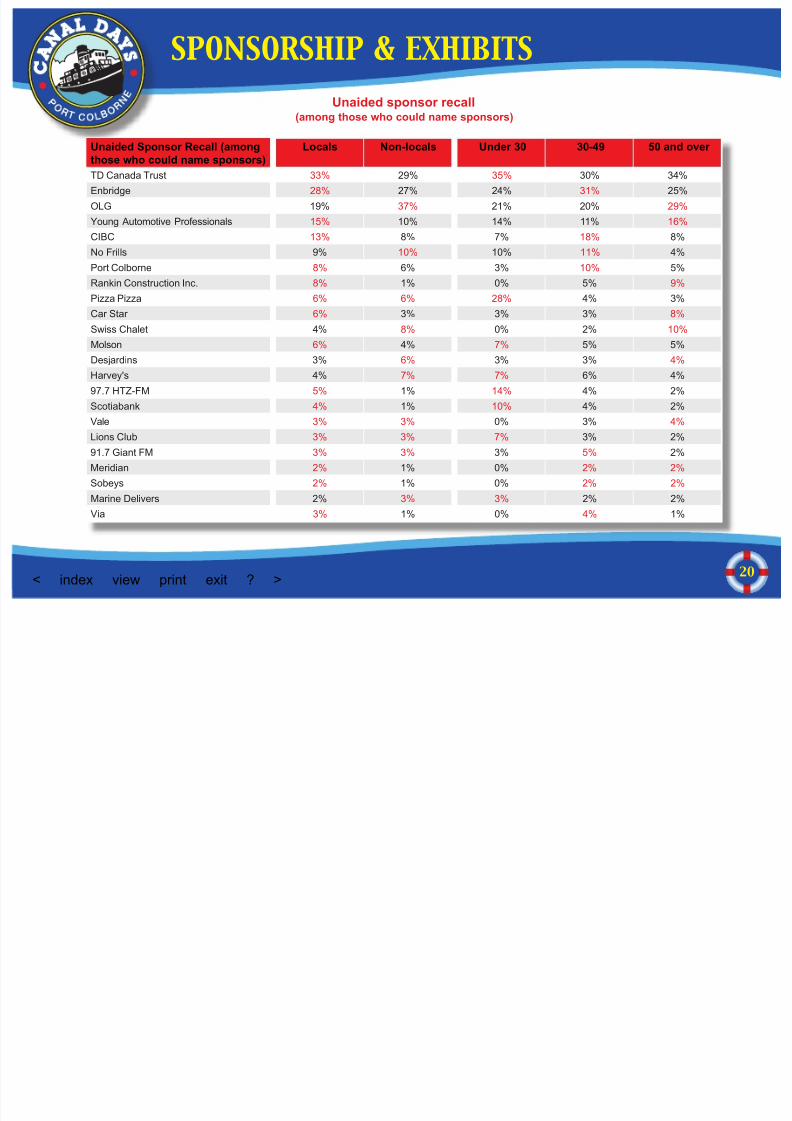
Unaided Sponsor Recall (amongthose who could name sponsors)
Locals Non-locals Under 30 30-49 50 and over
TD Canada Trust 33% 29% 35% 30% 34%
Enbridge 28% 27% 24% 31% 25%
OLG 19% 37% 21% 20% 29%
Young Automotive Professionals 15% 10% 14% 11% 16%
CIBC 13% 8% 7% 18% 8%
No Frills 9% 10% 10% 11% 4%
Port Colborne 8% 6% 3% 10% 5%
Rankin Construction Inc. 8% 1% 0% 5% 9%
Pizza Pizza 6% 6% 28% 4% 3%
Car Star 6% 3% 3% 3% 8%
Swiss Chalet 4% 8% 0% 2% 10%
Molson 6% 4% 7% 5% 5%
Desjardins 3% 6% 3% 3% 4%
Harvey's 4% 7% 7% 6% 4%
97.7 HTZ-FM 5% 1% 14% 4% 2%
Scotiabank 4% 1% 10% 4% 2%
Vale 3% 3% 0% 3% 4%
Lions Club 3% 3% 7% 3% 2%
91.7 Giant FM 3% 3% 3% 5% 2%
Meridian 2% 1% 0% 2% 2%
Sobeys 2% 1% 0% 2% 2%
Marine Delivers 2% 3% 3% 2% 2%
Via 3% 1% 0% 4% 1%
Unaided sponsor recall(among those who could name sponsors)
8/3/2019 2011 Port Colborne Canal Days economic impact study
http://slidepdf.com/reader/full/2011-port-colborne-canal-days-economic-impact-study 21/35
21< index view print exit ? >
SPONSORSHIP & EXHIBITS
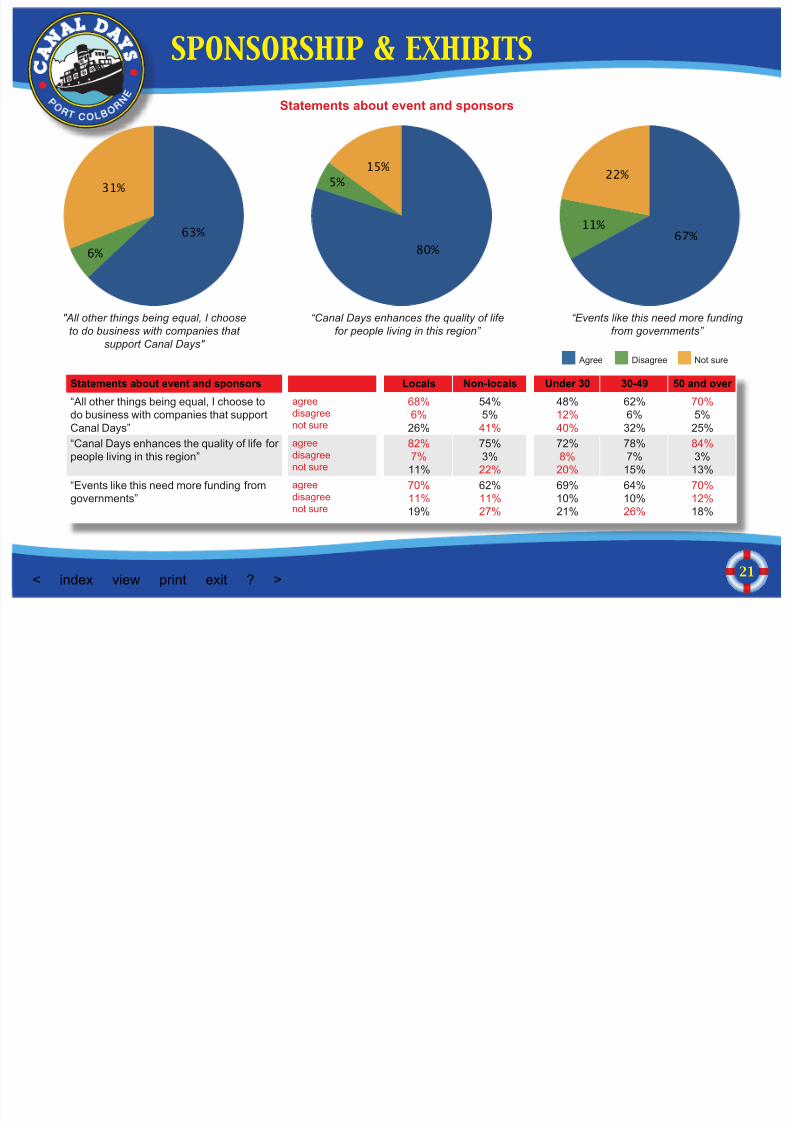
Statements about event and sponsors
31%
6%
63%
15%
5%
80%
22%
11%
67%
"All other things being equal, I choose
to do business with companies that
support Canal Days"
“Canal Days enhances the quality of life
for people living in this region”
“Events like this need more funding
from governments”
Statements about event and sponsors Locals Non-locals Under 30 30-49 50 and over
“All other things being equal, I choose to
do business with companies that supportCanal Days”
agree
disagreenot sure
68%
6%26%
54%
5%41%
48%
12%40%
62%
6%32%
70%
5%25%
“Canal Days enhances the quality of life for people living in this region”
agreedisagreenot sure
82%7%11%
75%3%22%
72%8%20%
78%7%15%
84%3%13%
“Events like this need more funding fromgovernments”
agreedisagreenot sure
70%11%19%
62%11%27%
69%10%21%
64%10%26%
70%12%18%
Agree Disagree Not sure
8/3/2019 2011 Port Colborne Canal Days economic impact study
http://slidepdf.com/reader/full/2011-port-colborne-canal-days-economic-impact-study 22/35
22< index view print exit ? >
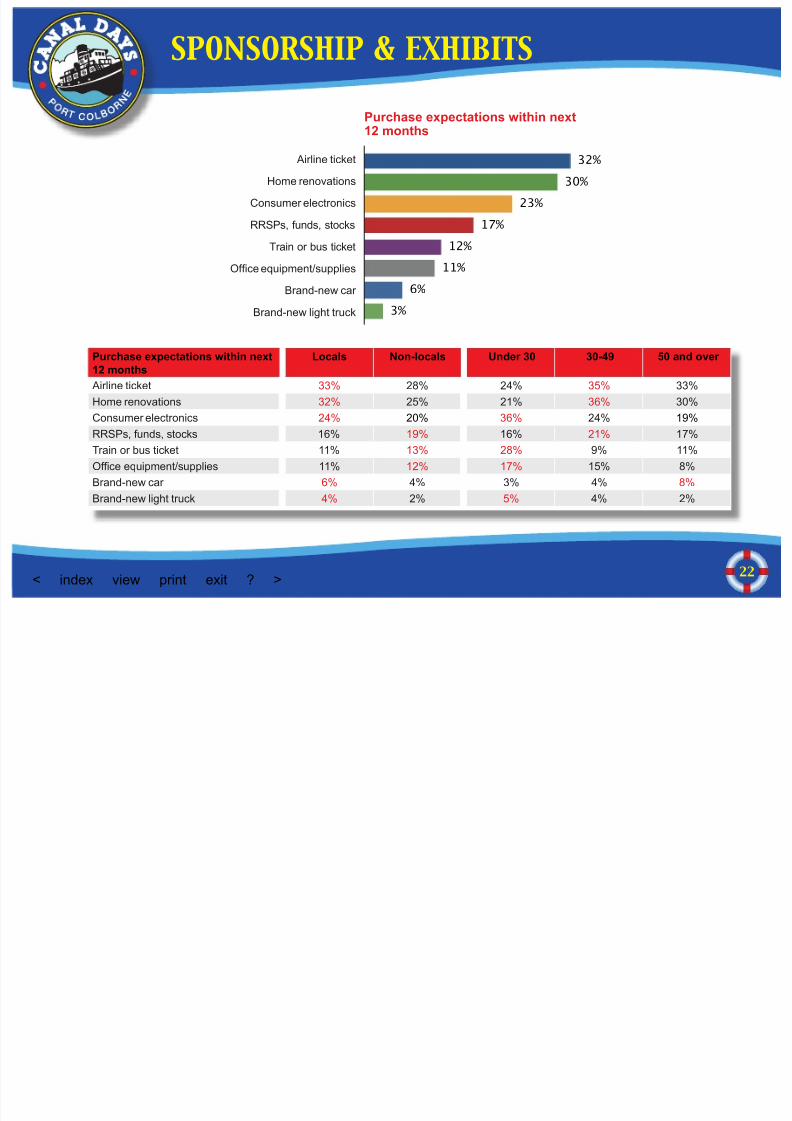
3%
6%
11%
12%
17%
23%
30%
32%
Purchase expectations within next12 months
Airline ticket
Home renovations
Consumer electronics
RRSPs, funds, stocks
Train or bus ticket
Ofce equipment/supplies
Brand-new car
Brand-new light truck
Purchase expectations within next12 months
Locals Non-locals Under 30 30-49 50 and over
Airline ticket 33% 28% 24% 35% 33%
Home renovations 32% 25% 21% 36% 30%
Consumer electronics 24% 20% 36% 24% 19%RRSPs, funds, stocks 16% 19% 16% 21% 17%
Train or bus ticket 11% 13% 28% 9% 11%
Ofce equipment/supplies 11% 12% 17% 15% 8%
Brand-new car 6% 4% 3% 4% 8%
Brand-new light truck 4% 2% 5% 4% 2%
SPONSORSHIP & EXHIBITS
8/3/2019 2011 Port Colborne Canal Days economic impact study
http://slidepdf.com/reader/full/2011-port-colborne-canal-days-economic-impact-study 23/35
23< index view print exit ? >
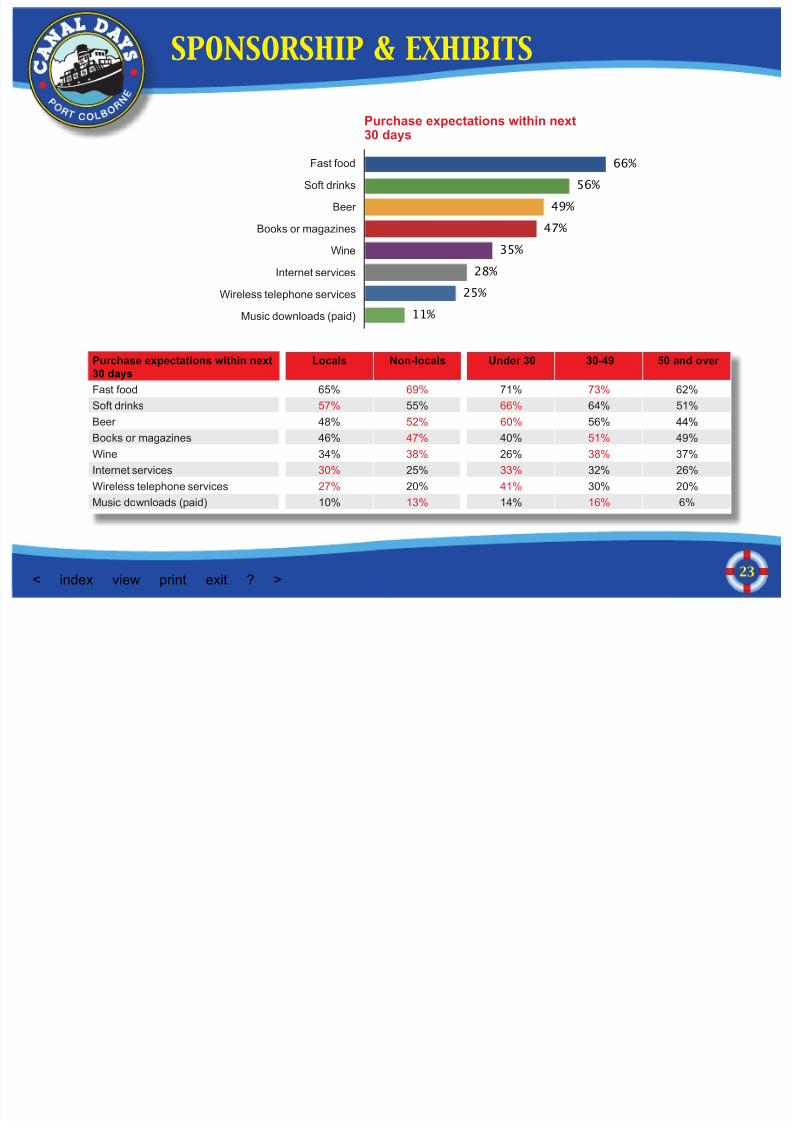
11%
25%
28%
35%
47%
49%
56%
66%
SPONSORSHIP & EXHIBITS
Purchase expectations within next
30 daysFast food
Soft drinks
Beer
Books or magazines
Wine
Internet services
Wireless telephone services
Music downloads (paid)
Purchase expectations within next30 days
Locals Non-locals Under 30 30-49 50 and over
Fast food 65% 69% 71% 73% 62%
Soft drinks 57% 55% 66% 64% 51%
Beer 48% 52% 60% 56% 44%
Books or magazines 46% 47% 40% 51% 49%
Wine 34% 38% 26% 38% 37%
Internet services 30% 25% 33% 32% 26%
Wireless telephone services 27% 20% 41% 30% 20%
Music downloads (paid) 10% 13% 14% 16% 6%
8/3/2019 2011 Port Colborne Canal Days economic impact study
http://slidepdf.com/reader/full/2011-port-colborne-canal-days-economic-impact-study 24/35
24< index view print exit ? >
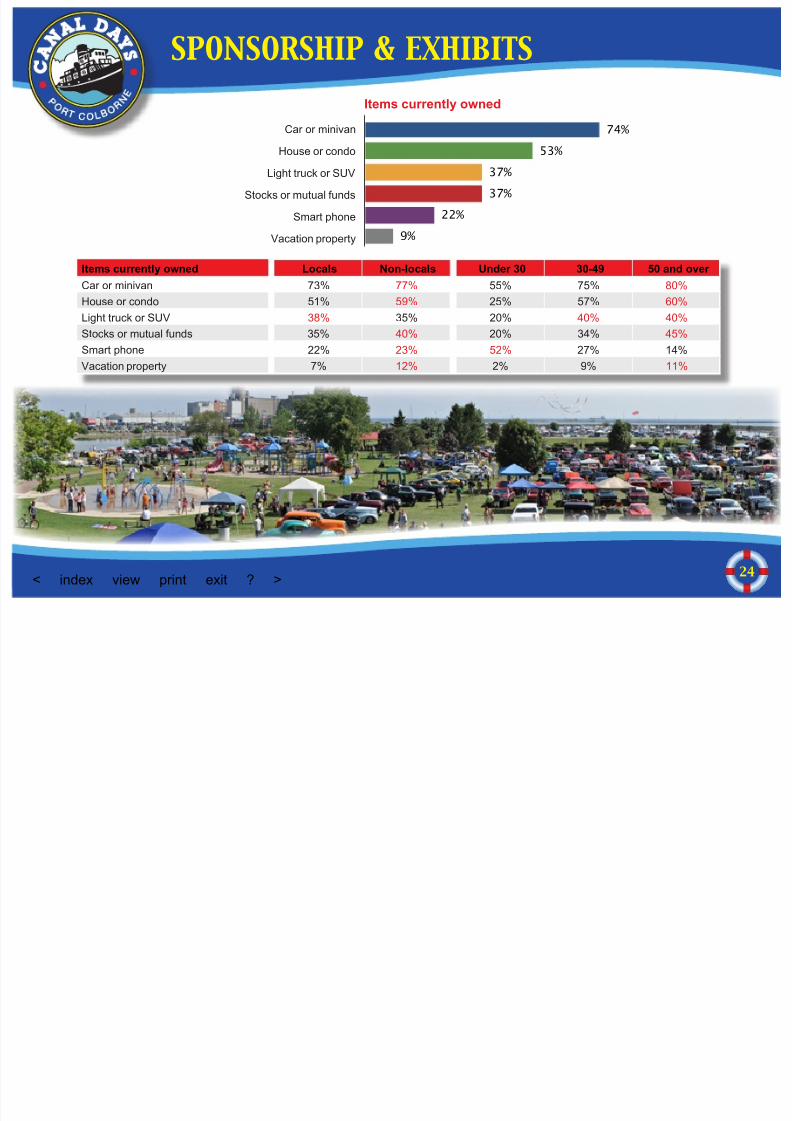
9%
22%
37%
37%
53%
74%
SPONSORSHIP & EXHIBITS
Items currently owned
Car or minivan
House or condo
Light truck or SUV
Stocks or mutual funds
Smart phone
Vacation property
Items currently owned Locals Non-locals Under 30 30-49 50 and over
Car or minivan 73% 77% 55% 75% 80%
House or condo 51% 59% 25% 57% 60%
Light truck or SUV 38% 35% 20% 40% 40%
Stocks or mutual funds 35% 40% 20% 34% 45%
Smart phone 22% 23% 52% 27% 14%
Vacation property 7% 12% 2% 9% 11%
8/3/2019 2011 Port Colborne Canal Days economic impact study
http://slidepdf.com/reader/full/2011-port-colborne-canal-days-economic-impact-study 25/35
25< index view print exit ? >
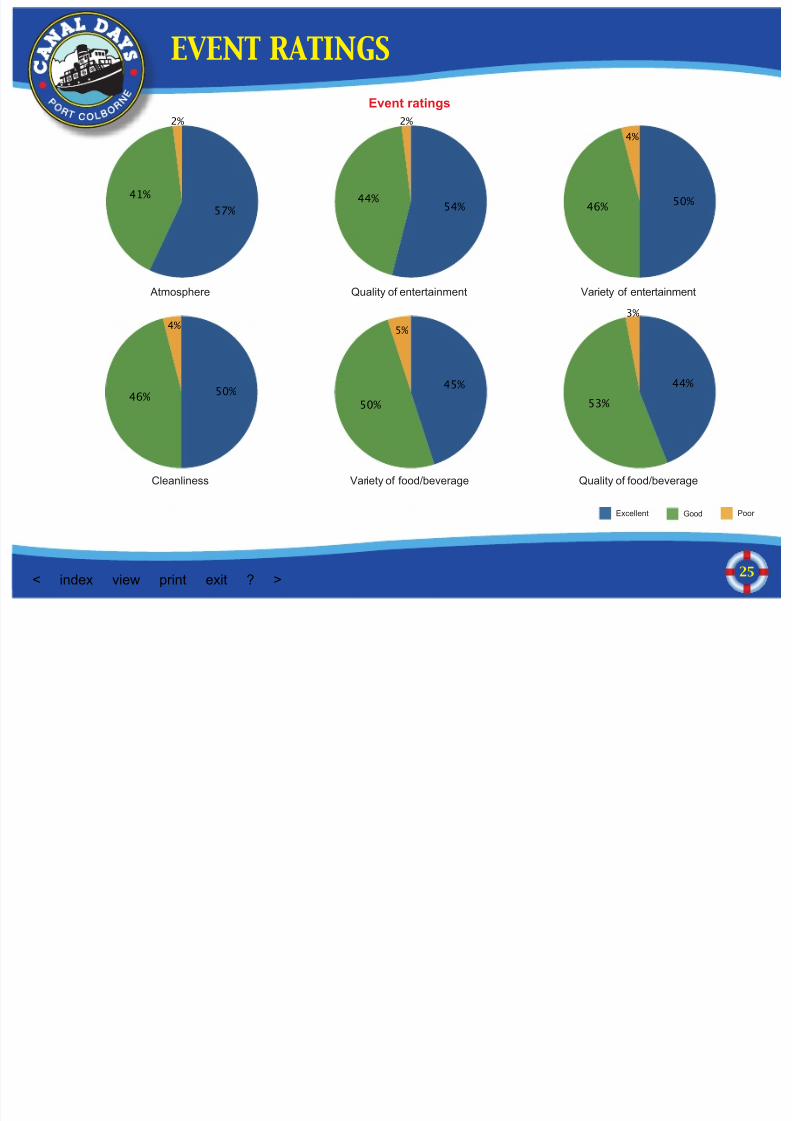
3%
53%
44%
5%
50%
45%
4%
46%50%
4%
46%50%
2%
44%54%
2%
41%
57%
Event ratings
Atmosphere
Cleanliness
Quality of entertainment
Variety of food/beverage
Variety of entertainment
Quality of food/beverage
Excellent Good Poor
EVENT RATINGS
8/3/2019 2011 Port Colborne Canal Days economic impact study
http://slidepdf.com/reader/full/2011-port-colborne-canal-days-economic-impact-study 26/35
26< index view print exit ? >
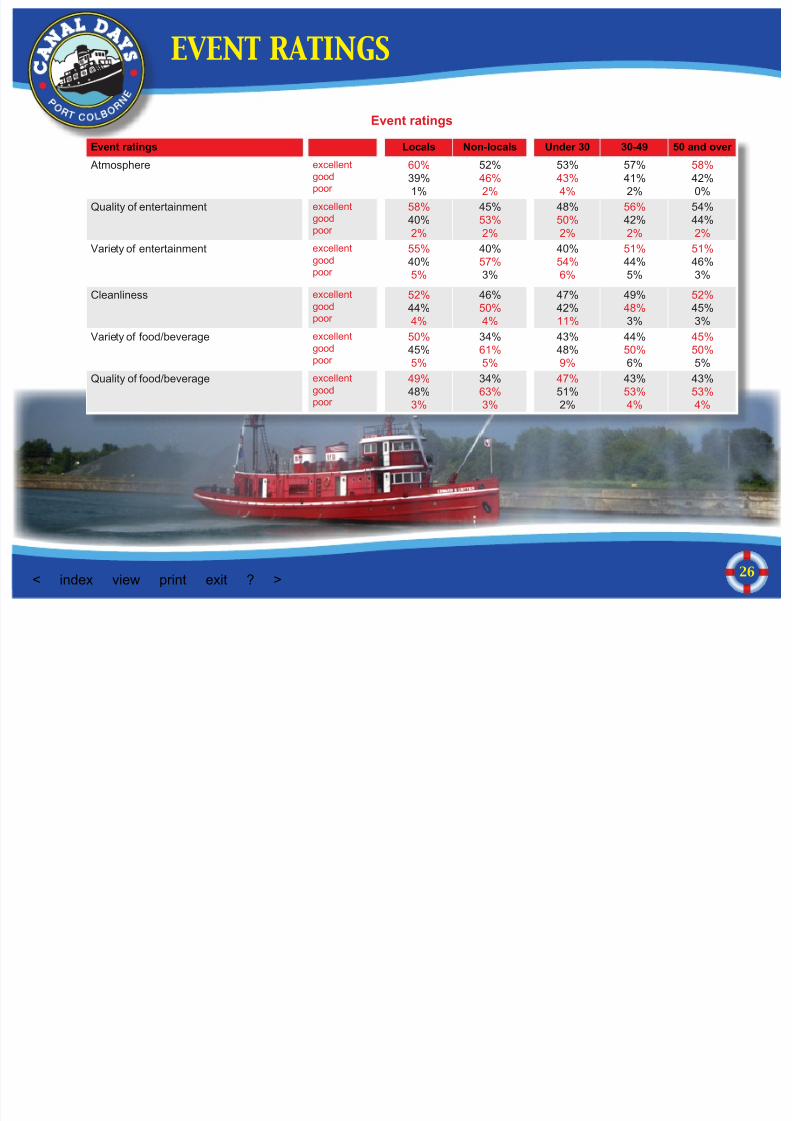
Event ratings
EVENT RATINGS
Event ratings Locals Non-locals Under 30 30-49 50 and over
Atmosphere excellentgoodpoor
60%39%1%
52%46%2%
53%43%4%
57%41%2%
58%42%0%
Quality of entertainment excellentgoodpoor
58%40%2%
45%53%2%
48%50%2%
56%42%2%
54%44%2%
Variety of entertainment excellentgoodpoor
55%40%
5%
40%57%
3%
40%54%
6%
51%44%
5%
51%46%
3%Cleanliness excellent
goodpoor
52%44%4%
46%50%4%
47%42%11%
49%48%3%
52%45%3%
Variety of food/beverage excellentgoodpoor
50%45%5%
34%61%5%
43%48%9%
44%50%6%
45%50%5%
Quality of food/beverage excellentgoodpoor
49%48%3%
34%63%3%
47%51%2%
43%53%4%
43%53%4%
8/3/2019 2011 Port Colborne Canal Days economic impact study
http://slidepdf.com/reader/full/2011-port-colborne-canal-days-economic-impact-study 27/35
27< index view print exit ? >
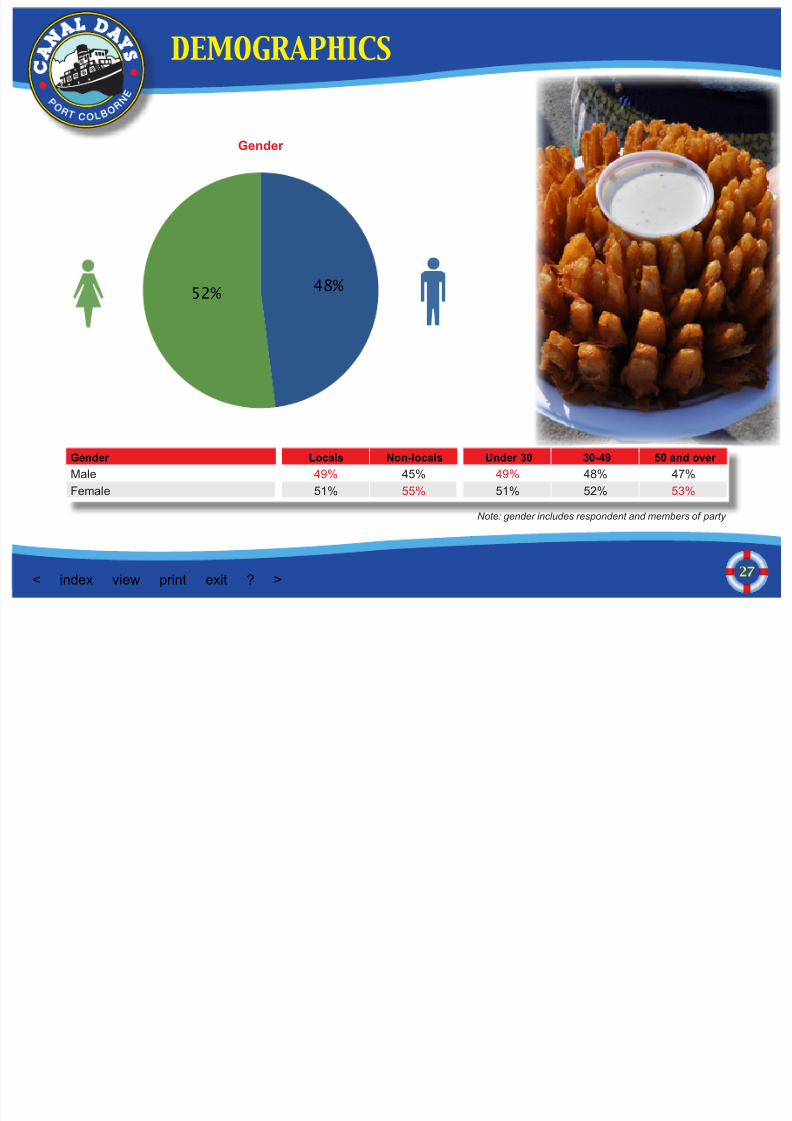
52%48%
Gender
Note: gender includes respondent and members of party
DEMOGRAPHICS
Gender Locals Non-locals Under 30 30-49 50 and over
Male 49% 45% 49% 48% 47%
Female 51% 55% 51% 52% 53%
8/3/2019 2011 Port Colborne Canal Days economic impact study
http://slidepdf.com/reader/full/2011-port-colborne-canal-days-economic-impact-study 28/35
28< index view print exit ? >
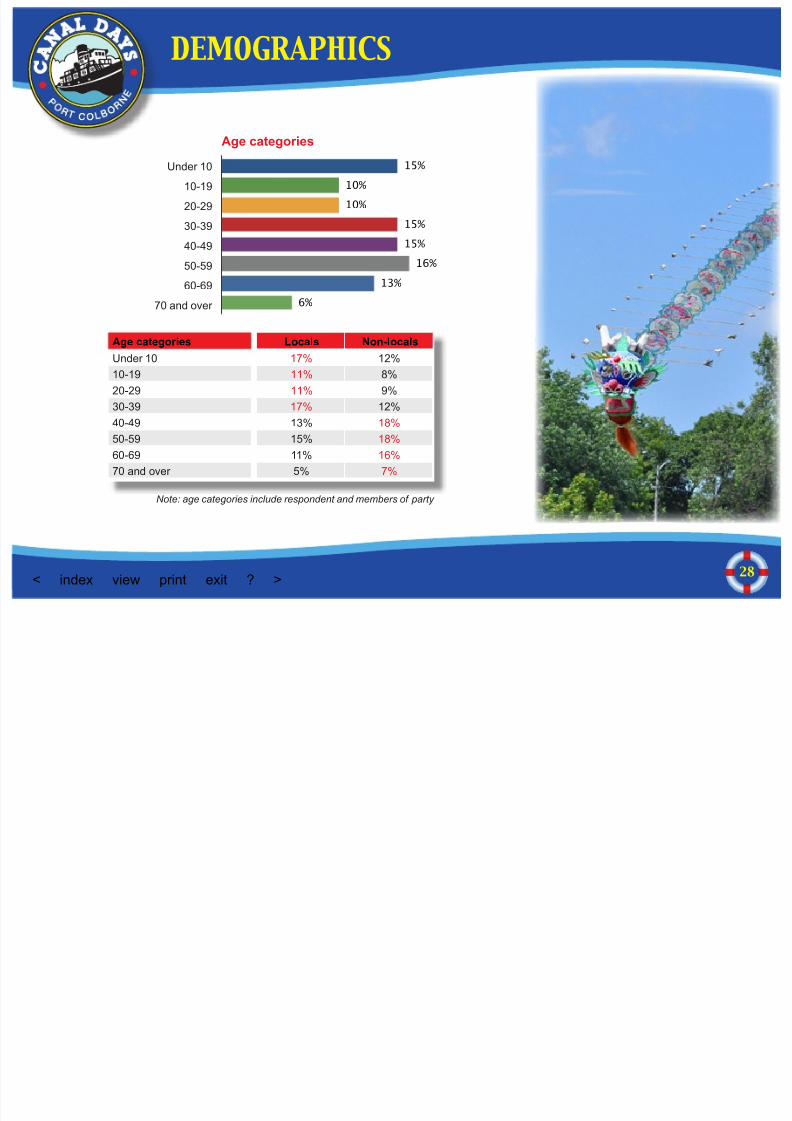
6%
13%
16%
15%
15%
10%
10%
15%
Age categories
Under 10
10-19
20-29
30-39
40-49
50-59
60-69
70 and over
Age categories Locals Non-locals
Under 10 17% 12%
10-19 11% 8%
20-29 11% 9%
30-39 17% 12%
40-49 13% 18%
50-59 15% 18%
60-69 11% 16%
70 and over 5% 7%
Note: age categories include respondent and members of party
DEMOGRAPHICS
8/3/2019 2011 Port Colborne Canal Days economic impact study
http://slidepdf.com/reader/full/2011-port-colborne-canal-days-economic-impact-study 29/35
29< index view print exit ? >
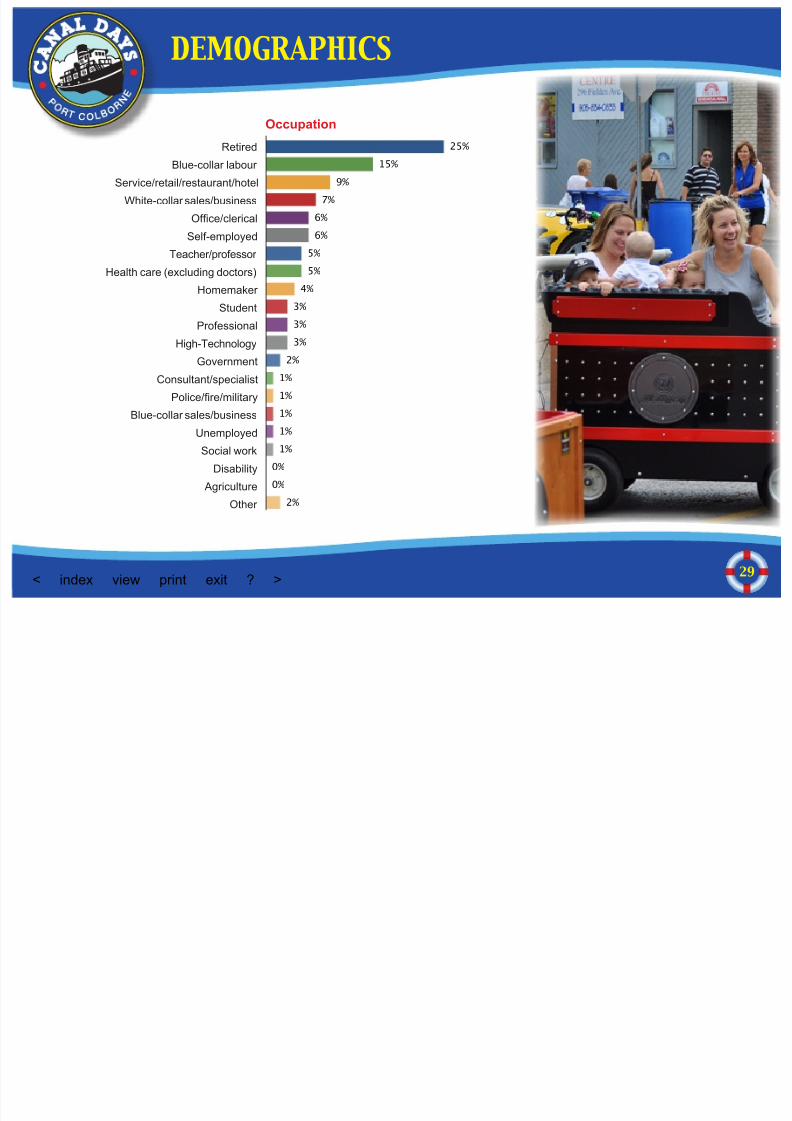
2%
0%
0%
1%
1%
1%
1%
1%
2%
3%
3%
3%
4%
5%
5%
6%
6%
7%
9%
15%
25%
Occupation
Retired
Blue-collar labour
Service/retail/restaurant/hotel
White-collar sales/business
Ofce/clerical
Self-employed
Teacher/professor
Health care (excluding doctors)
Homemaker
Student
Professional
High-Technology
Government
Consultant/specialist
Police/re/military
Blue-collar sales/businessUnemployed
Social work
Disability
Agriculture
Other
DEMOGRAPHICS
8/3/2019 2011 Port Colborne Canal Days economic impact study
http://slidepdf.com/reader/full/2011-port-colborne-canal-days-economic-impact-study 30/35
30< index view print exit ? >
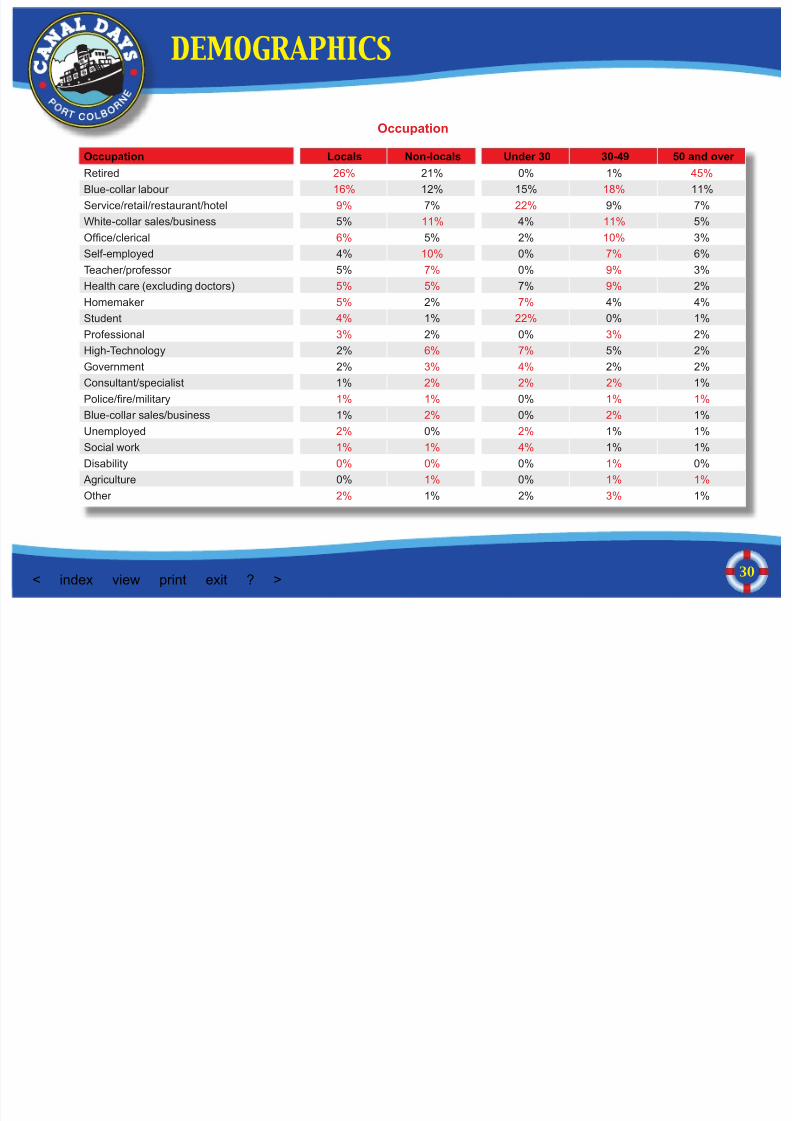
Occupation
Occupation Locals Non-locals Under 30 30-49 50 and over
Retired 26% 21% 0% 1% 45%
Blue-collar labour 16% 12% 15% 18% 11%
Service/retail/restaurant/hotel 9% 7% 22% 9% 7%
White-collar sales/business 5% 11% 4% 11% 5%
Ofce/clerical 6% 5% 2% 10% 3%
Self-employed 4% 10% 0% 7% 6%
Teacher/professor 5% 7% 0% 9% 3%
Health care (excluding doctors) 5% 5% 7% 9% 2%
Homemaker 5% 2% 7% 4% 4%
Student 4% 1% 22% 0% 1%
Professional 3% 2% 0% 3% 2%
High-Technology 2% 6% 7% 5% 2%
Government 2% 3% 4% 2% 2%
Consultant/specialist 1% 2% 2% 2% 1%
Police/re/military 1% 1% 0% 1% 1%
Blue-collar sales/business 1% 2% 0% 2% 1%Unemployed 2% 0% 2% 1% 1%
Social work 1% 1% 4% 1% 1%
Disability 0% 0% 0% 1% 0%
Agriculture 0% 1% 0% 1% 1%
Other 2% 1% 2% 3% 1%
DEMOGRAPHICS
8/3/2019 2011 Port Colborne Canal Days economic impact study
http://slidepdf.com/reader/full/2011-port-colborne-canal-days-economic-impact-study 31/35
31< index view print exit ? >
2%
26%
33%
14%
6%
13%
6%
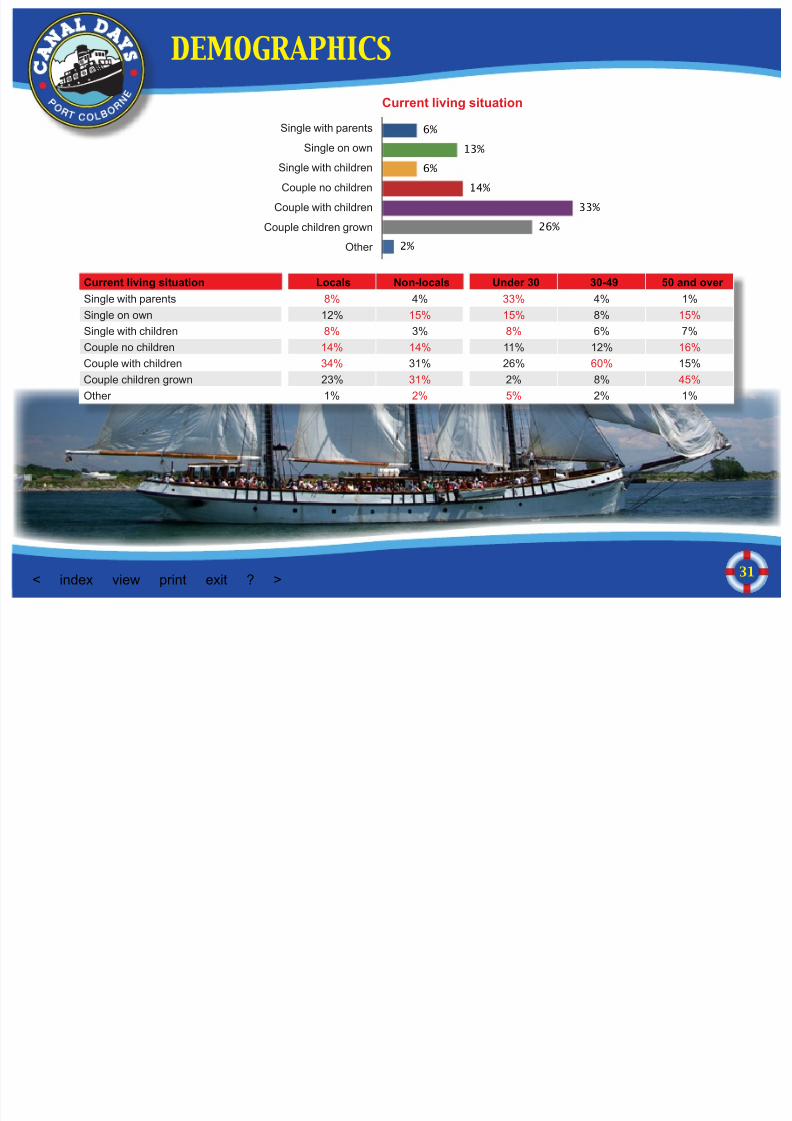
Current living situation
Single with parents
Single on own
Single with children
Couple no children
Couple with children
Couple children grown
Other
Current living situation Locals Non-locals Under 30 30-49 50 and over Single with parents 8% 4% 33% 4% 1%
Single on own 12% 15% 15% 8% 15%
Single with children 8% 3% 8% 6% 7%
Couple no children 14% 14% 11% 12% 16%
Couple with children 34% 31% 26% 60% 15%
Couple children grown 23% 31% 2% 8% 45%
Other 1% 2% 5% 2% 1%
DEMOGRAPHICS
8/3/2019 2011 Port Colborne Canal Days economic impact study
http://slidepdf.com/reader/full/2011-port-colborne-canal-days-economic-impact-study 32/35
32< index view print exit ? >
4%
16%
17%
25%
24%
14%
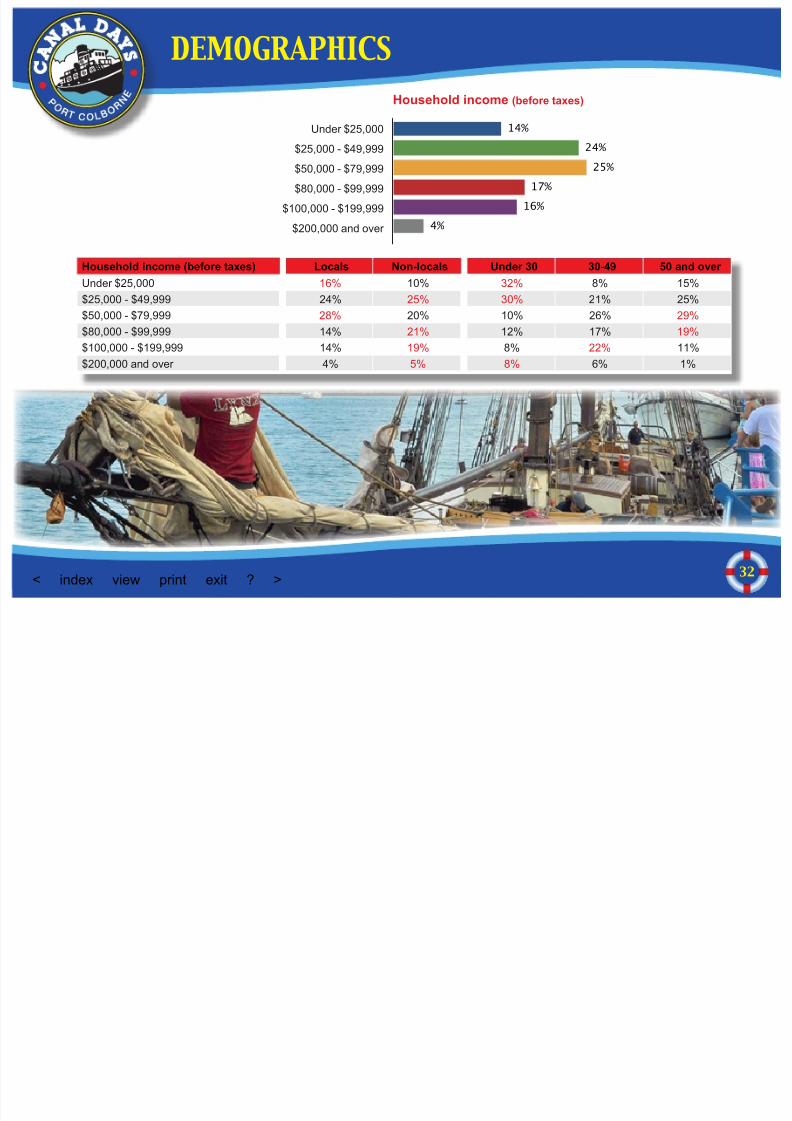
Household income (before taxes)
Under $25,000
$25,000 - $49,999
$50,000 - $79,999
$80,000 - $99,999
$100,000 - $199,999
$200,000 and over
Household income (before taxes) Locals Non-locals Under 30 30-49 50 and over
Under $25,000 16% 10% 32% 8% 15%$25,000 - $49,999 24% 25% 30% 21% 25%
$50,000 - $79,999 28% 20% 10% 26% 29%
$80,000 - $99,999 14% 21% 12% 17% 19%
$100,000 - $199,999 14% 19% 8% 22% 11%
$200,000 and over 4% 5% 8% 6% 1%
DEMOGRAPHICS
8/3/2019 2011 Port Colborne Canal Days economic impact study
http://slidepdf.com/reader/full/2011-port-colborne-canal-days-economic-impact-study 33/35
33< index view print exit ? >
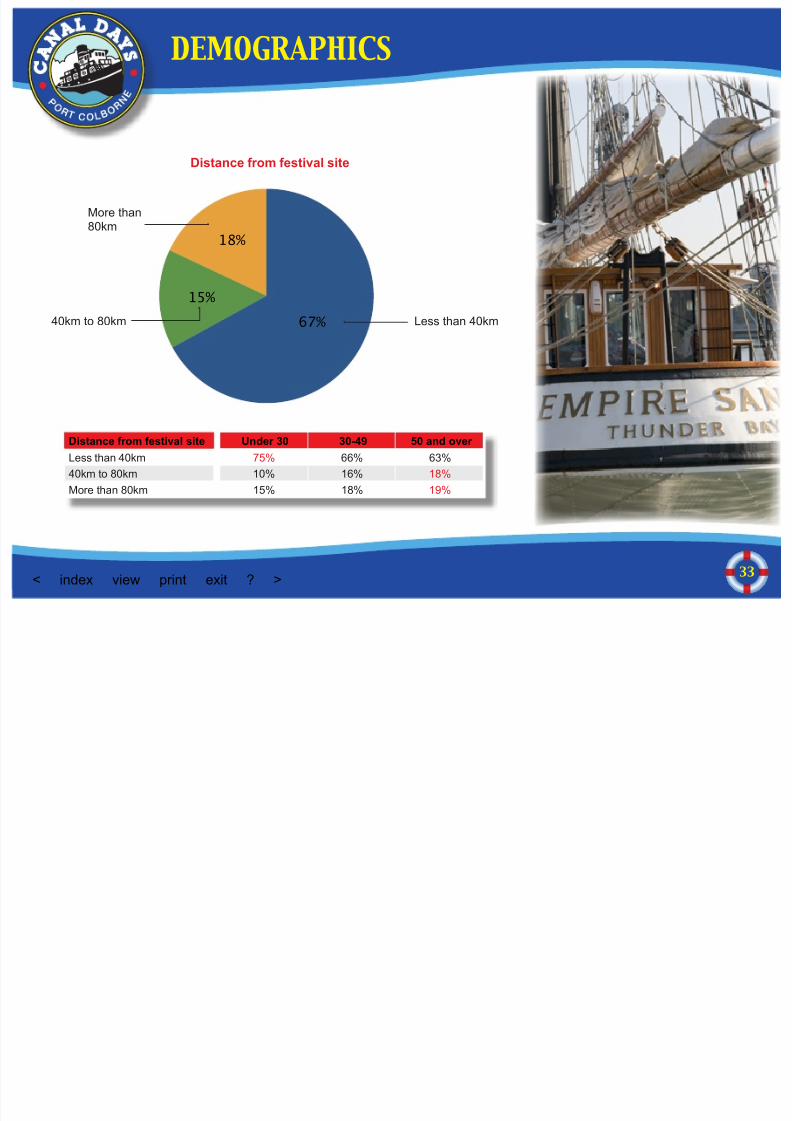
18%
15%
67%
Distance from festival site
Distance from festival site Under 30 30-49 50 and over
Less than 40km 75% 66% 63%
40km to 80km 10% 16% 18%
More than 80km 15% 18% 19%
Less than 40km
More than80km
40km to 80km
DEMOGRAPHICS
8/3/2019 2011 Port Colborne Canal Days economic impact study
http://slidepdf.com/reader/full/2011-port-colborne-canal-days-economic-impact-study 34/35
34< index view print exit ? >
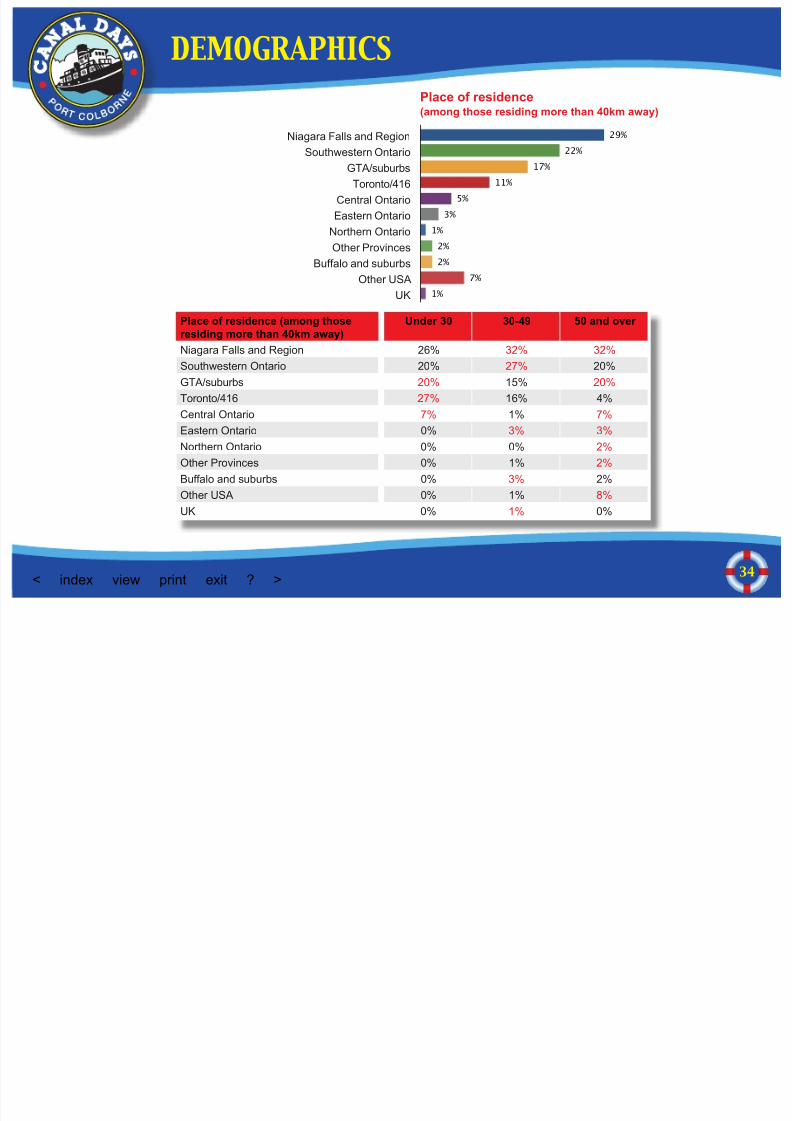
1%
7%
2%
2%
1%
3%
5%
11%
17%
22%
29%
Place of residence(among those residing more than 40km away)
Niagara Falls and Region
Southwestern Ontario
GTA/suburbs
Toronto/416
Central Ontario
Eastern Ontario
Northern Ontario
Other Provinces
Buffalo and suburbs
Other USAUK
Place of residence (among thoseresiding more than 40km away)
Under 30 30-49 50 and over
Niagara Falls and Region 26% 32% 32%
Southwestern Ontario 20% 27% 20%
GTA/suburbs 20% 15% 20%
Toronto/416 27% 16% 4%
Central Ontario 7% 1% 7%Eastern Ontario 0% 3% 3%
Northern Ontario 0% 0% 2%
Other Provinces 0% 1% 2%
Buffalo and suburbs 0% 3% 2%
Other USA 0% 1% 8%
UK 0% 1% 0%
DEMOGRAPHICS
8/3/2019 2011 Port Colborne Canal Days economic impact study
http://slidepdf.com/reader/full/2011-port-colborne-canal-days-economic-impact-study 35/35
35< index view print exit ? >
How to use the iReport.The iReport is designed to be viewed full screen usingAdobe® Reader or Adobe® Acrobat. If you prefer, click theVIEW tab to switch back to regular screen mode (revealyour menu and toolbars). You can also use the ESC keyto exit full screen mode.
How to Navigate the iReport.Click the index button to choose the page you want to
view. Use the “previous” and “next” buttons at the bottomof each page to move forward and backward through thedocument.
How to print the iReport.Click the print button at the bottom of each page to openyour print dialogue box. From there you can choose toprint 1, a range or all of the pages of thisreport.
How to Exit the iReport.Simply click the exit button at the bottom of each page toclose this iReport.
QuestionsOur researchers and technical staff will receive your question immediately and respond via email as soon aspossible.
Please select one of the following categories:
Ask question about researchor methodology
Request additional crosstabsor analysis
Report technical issue or problem
By clicking one of the categories listed above, your email client will automatically open so that you cancomplete your email message and send it directly toEnigma Research.
QUESTIONS & FEEDBACK