public environmental review port bouvard1 urban & canal ... · public environmental review port...
TRANSCRIPT

S: 6 2-6,1
F7
RE OADERT
Public Environmental Review
Port Bouvard1
Urban & Canal Development
Volume 2
Appendix 'A'
Groundwater Regime Dames & Moore
Appendix 'B'
Coastal Dunes, Caddadup Reserve, Estuary Foreshore Quilty Environmental Consulting
Appendix 'C'
Ocean Foreshore Stability, Canal Water Quality, Estuary Reclamation Steedman Science & Engineering
PORT BOUVARD URBAN AND CANAL DEVELOPMENT
MANDURAH
POTENTIAL IMPACT OF DEVELOPMENT
ON THE GROUNDWATER REGIME
AND PROPOSALS FOR MANAGEMENT
for
Wannanup Development Nominees Pty Ltd
.1 V% 'W1 j
j
Dames & Moore Job No. 23641-003-074
August 1992

PORT BOUVARD URBAN AND CANAL DEVELOPMENT
MANDURAH
POTENTIAL IMPACT OF DEVELOPMENT
40 ON THE GROUNDWATER REGIME
AND PROPOSALS FOR MANAGEMENT
1(
16 1.0 INTRODUCTION
17 nes & Moore has been commissioned to prepare this report on the groundwater aspects of
11 proposed urban and canal development near Dawesville. This report also contains
posals for groundwater and nutrient management and is to form part of a Public
1 iironmental Review report.
18 project is being developed by Wannanup Development Nominees Pty Ltd and is referred to
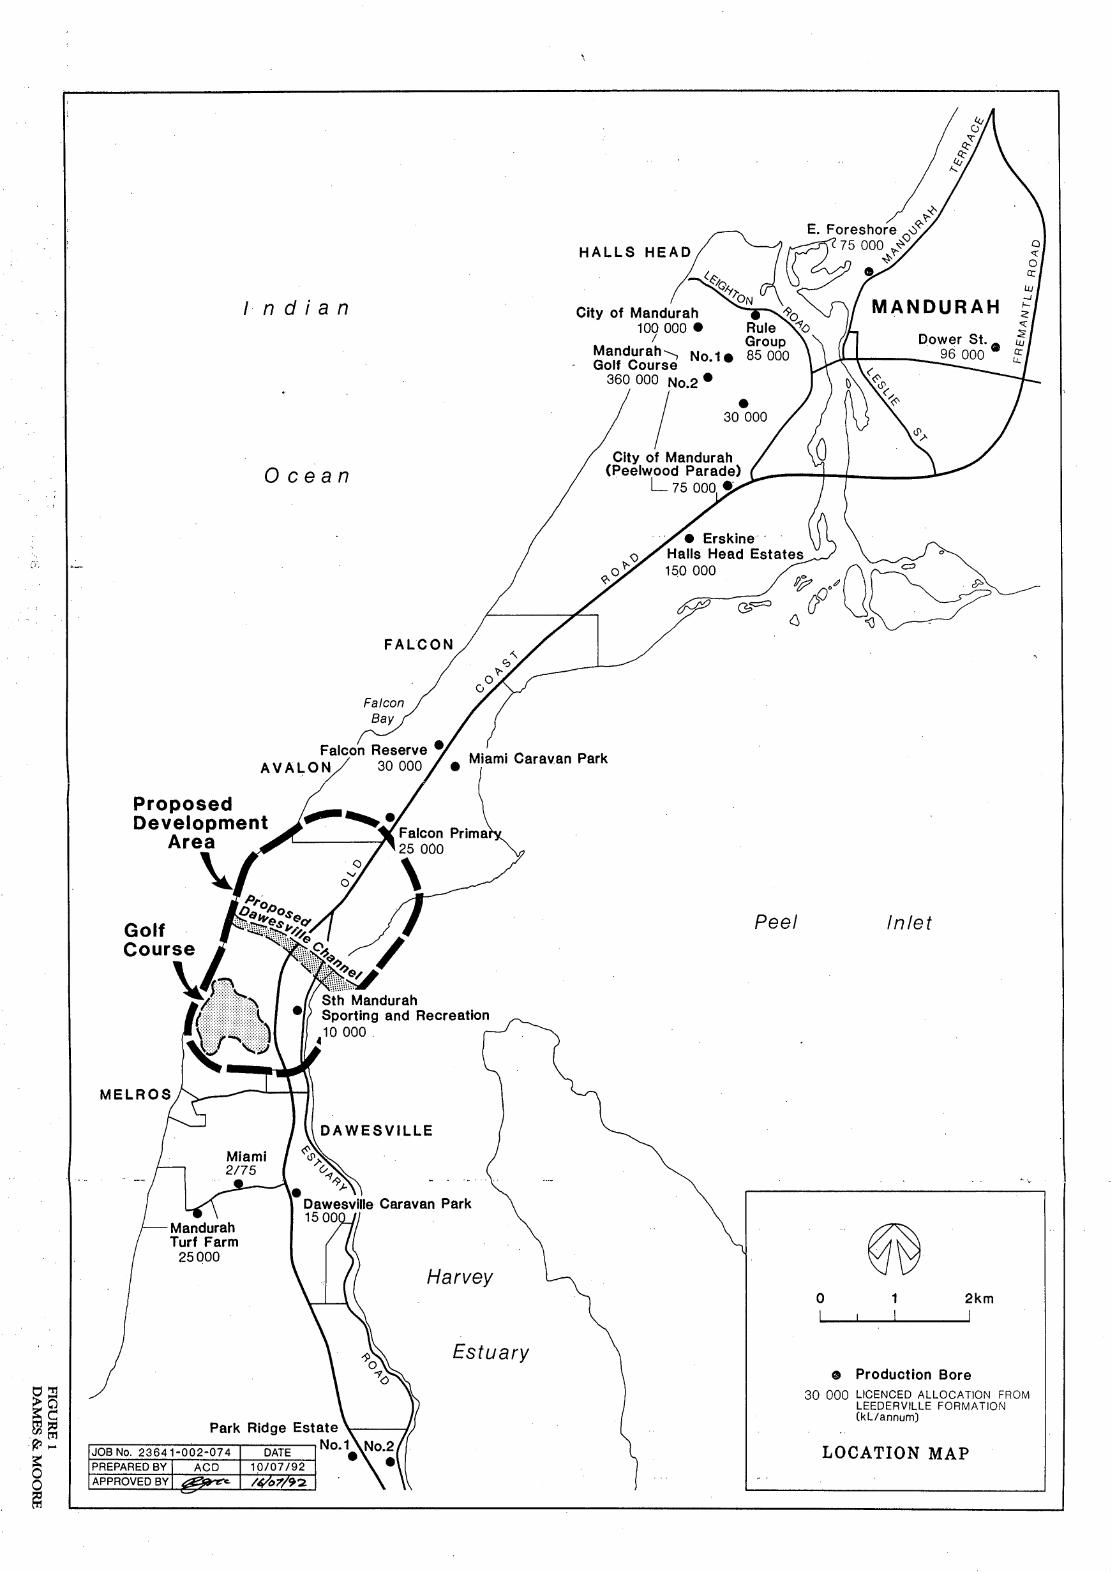
the Port Bouvard Urban and Canal Development. The project site (Figure 1) is
roximately 10km southwest of Mandurah and occupies an area of land immediately to the
1h and south of the Dawesville Channel which is to be known as the 'Dawesville Channel
relopment Zone'. The development will comprise of approximately 1,400 residential lots
tred around a canal system, an 18 hole golf course, a resort and tourist development
uding public recreation reserves and, a marina to be located on reclaimed land adjacent to
Harvey estuary foreshore to the north of the Channel entrance (Figure 2).
2.0 EXISTING ENVIRONMENT
CLIMATE, PHYSIOGRAPHY AND DRAINAGE
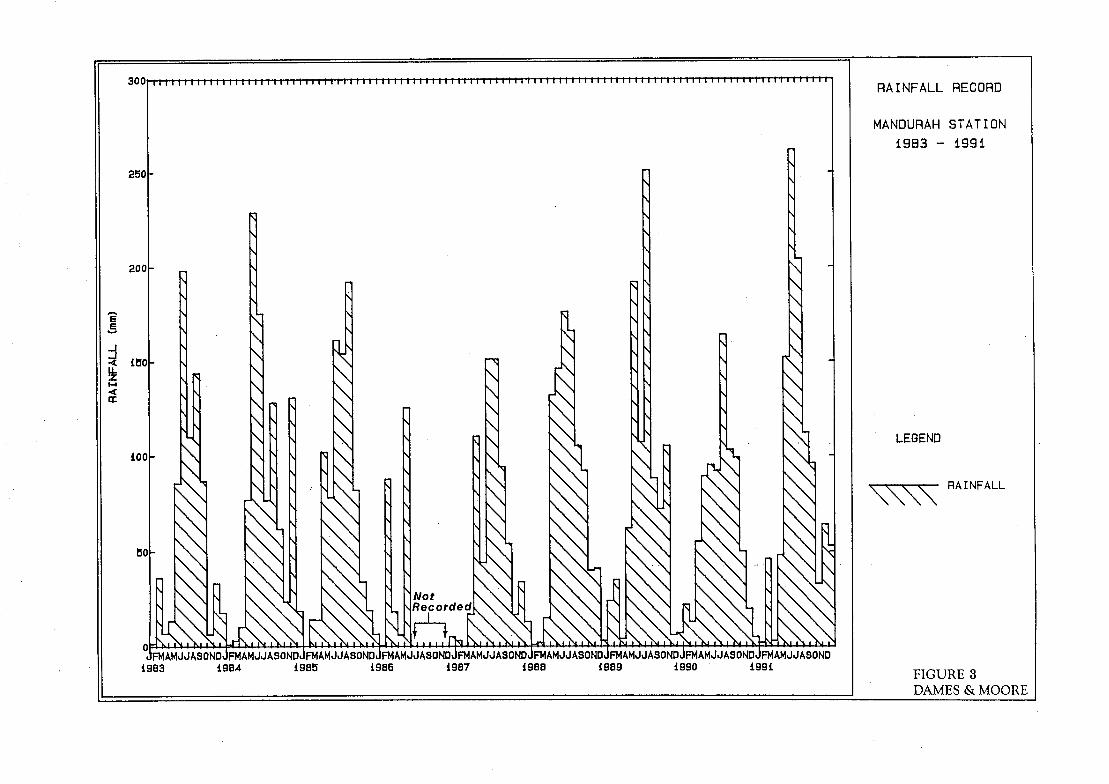
area has a Mediterranean type climate, with warm dry summers and cool wet winters.
average annual rainfall recorded at Mandurah is 895mm. Rainfall generally exceeds
poration during the five months May to September. The annual average evaporation is
at 1,700mm. Histograms of monthly rainfall (Mandurah Station) and pan evaporation
th Station) during the period 1983-1991 are given in Figures 3 and 4 respectively.
proposed development is located on a narrow belt of coastal dunes, 1,500 to 2,000m wide,
ch separates the Peel Inlet from the Indian Ocean. The dunes are aligned parallel to the
;t and two dunal systems are recognised, namely, the Quindalup Dune System along the
n side, and the Spearwood Dune System on the inland side.
)RE DAMES & MOORE

-2-
The coastal dunes are stabilised by natural vegetation and form a land surface with very steep
slopes on the southern part of the site where surface elevations range from about
5 to 40m AHD. On the northern part, the site is characterised by more gentle slopes with
surface elevations ranging from 5 to 25m AHD. Swamps occur in some of the low-lying
interdunal depressions.
Drainage occurs predominantly by subsurface flow to the Indian Ocean and Peel Inlet. There
are no major surface drainage features on the project site. -
2.2 HYDROGEOLOGICAL SETTING
The project area is underlain by three main aquifers, namely, the superficial formations, the
Leederville Formation and the Cockleshell Gully Formation. The superficial formations are
underlain by the Leederville Formation, either directly or more likely with an intervening
sequence of shales and siltstones of the Osborne Formation which has a total thickness of about
30 to 40m in this area. Low permeability sediments of the South Perth Shale form a major
aquitard which underlies the Leederville Formation and separates it from the Cockleshell Gully
Formation.
2.2.1 Superficial Formations
The project area is underlain by the superficial formations which extend from the ground
surface to about -15m AHD and consist mainly of calcarenite and sand. The superficial
formations comprise the Tamala Limestone and the Safety Bay Sand in this area. On the
ocean side, the Tamala Limestone is overlain by the Safety Bay Sand which generally consists
of unconsolidated calcareous sand forming the Quindalup Dune System. On the inland side,
the Tamala Limestone is exposed and consists of calcarenite and sand which form the
Spearwood Dune System. These sediments form an inhomogeneous unconfined aquifer of
generally high permeability.
The groundwater system in the superficial formations comprises a thin freshwater lens
overlying saline groundwater in the lower part of the aquifer. The freshwater lens is only
about Sm thick and it is separated from the saline groundwater by an interface zone which
contains brackish groundwater.
DAMES & MOORE

-3-
The superficial aquifer is recharged by percolating rainfall which maintains the freshwater
lens. The annual average rainfall surplus (excess of rainfall over evaporation during winter) is
336mm at Mandurah. Allowing for runoff and evapotranspiration losses, the maximum
available recharge is expected to be about 250mm per annum. The water table reaches a
maximum level in August to September of about 0.5m AHD in response to winter rainfall and
declines to slightly below Om MID in the summer.
Groundwater flows away from the central part of the peninsula westwards towards the Indian
Ocean and eastwards towards the Peel Inlet. Groundwater discharge occurs across seawater
interfaces along the shores of the ocean and the inlet.
The freshwater lens in the superficial formations is currently exploited by means of a number
of shallow private bores. Yields are low as higher pumping rates result in upconing of the
underlying saline groundwater.
An operational domestic refuse disposal site is located about 800m south of the Dawesville
Channel (Figure 2). Leachates generated by percolating rainfall are likely to be causing
contamination of the superficial aquifer.
2.2.2 Leederville Formation
The Leederville Formation is a major regional aquifer, consisting of interbedded sandstone,
siltstone and clay. In the Mandurah area, the Leederville Formation contains a distinct
marker horizon, 3 to Gm thick known as the "green clay'. This horizon is readily identifiable
on natural gamma logs, enabling correlation between boreholes. In the Dawesville area the
green clay appears to be downthrown about 90m to the south, along an east-west trending fault
line The general dip of the Leederville Formation is about half a degree, to the
west-southwest.
In the vicinity of Mandurah, groundwater in the Leederville Formation is generally saline
above the green clay horizon, and fresh, becoming brackish with depth, below it. At
Dawesville, however, borehole logs indicate that fresh groundwater occurs both above and
below the green clay, which is at a depth of about 265m in Bore Miami 2/75, just south of
Dawesville (Figure 1). The general groundwater flow direction is westwards, so the occurrence
of freshwater above the green clay, downgradient of saline groundwater east of the Peel Inlet
DAMES & MOORE

-4-
itself, is anomalous. The fresh groundwater may be derived from below the green clay, either
by upward leakage, or laterally from the north, across the inferred fault. Alternatively, it may
represent fossil groundwater remaining from a previous period of lower sea level, which has not
as yet been flushed out by subsequent more saline recharge from the east.
The groundwater in the Leederville Formation is artesian, with hydraulic heads generally
3 to 4m above AHD in the strata above the green clay, and 7 to 8m AHD in the strata below it.
Groundwater in the Leederville Formation probably has a salinity in the range of
400 to 3,500mgIL TDS and may contain significant concentrations of dissolved iron.
2.2.3 Cockleshell Gully Formation
The Cockleshell Gully Formation consists predominantly of sandstone and shale in the
Dawesville area and occurs at a depth of about 250 to 300m below ground surface. It is
unconformably overlain by the South Perth Shale which forms a major aquitard between the
Leederville Formation and Cockleshell Gully Formation. The Cockleshell Gully Formation
contains only brackish to saline groundwater in this area.
3.0 DEVELOPMENT OF WATER SUPPLIES FOR GOLF COURSE IRRIGATION
Development of the groundwater resource in the Leederville Formation is planned for irrigation
of the 18-hole golf course and the recreational reserve. Treated residential wastewater may be
a supplementary source in the long-term, but will not be available for the first few years during
the construction and establishment phase.
3.1 WATER REQUIREMENTS
Preliminary estimates of the water requirements for the irrigation of the golf course are given
in Table 1. These estimates will be revised as final detailed design of the golf course proceeds.
DAMES & MOORE

TABLE 1
IRRIGATION WATER REQUIREMENTS
Water Requirement Abstraction
Rainfall Pan Evaporation Net Pan Evaporation (kL) ______________
Greens Fairways and Tees Reserve Lakes Total Ave Daily Month
(mm) (mm) (mm)
(2.Oha) (34.Oha) (6.Oha) (2.Oha) (kL) (kL/d)
January 10 253.79 243.79 8338.54 66310.88 11701.92 4875.80 89227.14 2878.29
February 13 225.76 212.76 5531.76 57870.72 10212.48 4255.20 77870.16 2781.08
March 19 195.08 176.08 4578.11 47894.12 8451.90 3521.63 64445.77 2078.90
April 46 120.60 74.60 1939.72 20292.48 3581.03 1492.09 27305.32 910.18
May 128 83.01 -44.99 0 0 0 -899.83 -899.83 0
June 192 61.79 -130.21 0 0 0 -2604.26 -2604.26 0
July 176 63.65 -112.35 0 0 0 -2247.03 -2247.03 0
August 126 79,21 -46.79 0 0 0 -935.87 -935.87 0
September 88 107.16 19.16 498.17 5211.65 919.70 383.21 7012.73 233.76
October 63 155.93 92.93 2416,26 25277.78 4460.78 1858.66 34013.48 1097.21
November 22 192.02 170.02 4420.49 46242.16 8160.91 3400.38 62226.94 2074.23
December 12 234.71 222.71 5790.37 60576.17 10689.91 4454,13 81510.59 2629.27
TOTAL 895 1772.71 877.71 31513 329679 58179 17554 436925 1197
Source: Department of Administrative Services, Bureau of Meteorology.
Note: Based on monthly rainfall data (1889-1991), Mandurah Station and monthly Epan (1967-1990), Perth Station.
Projected Application Rates:
Greens 180% Net Epan Fairways, tees 80% Net Epan Recreation Reserve : 80% Net Epan Lakes : Net Epan
S
The water requirements have been calculated using the projected application rates which are
based on long-term daily evaporation rates for Perth and monthly rainfall data for Mandurah.
The total water requirement for the irrigation of the golf course and recreation reserve is
estimated to be 440,000kL/annum with a peak demand of 2,900kL/day. Additional supplies
may be required during initial phase for the re-establishment of vegetation in areas disturbed
during golf course construction.
3.2 GROUNDWATER SUPPLY AND TREATMENT
Abstraction of a significant supply of groundwater of suitable quality from the superficial
formations would be difficult and expensive, because of the depth to water (20 to 40m) and the
presence of only a thin freshwater lens. It is therefore not an economic source of water for golf
course irrigation.
The water supply will be obtained by groundwater abstraction from a borefield completed in
the Leederville Formation aquifer. It is anticipated that the borefleld will be located to the
south of the project site, in the vicinity of the proposed golf course.
The Leederville Formation is known to contain a substantial resource of fresh groundwater at
Dawesville but the long term sustainable yield is unproven. The resource is presently
under-utilised, although there has been substantial abstraction further north in the vicinity of
Mandurah for more than 20 years. Current abstraction for both public and private use totals
1.7 x 10⁶kL/annum. In the Dawesville area, there are only four current licences issued by the
Water Authority for small abstractions from the Leederville Formation, with a combined total
of 75,000kL/annum. The Water Authority has no plans to use the resource in the Dawesville
area for public water supply.
Abstraction from the Leederville Formation can therefore be supported on the following
grounds:
known fresh groundwater resource;
minimum usage at present;
no planned use for public water supply; and
DAMES & MOORE
-7-
o abstraction of about 2 x 10⁶kJjannum from the Leederville Formation has been
sustained since 1965 without any adverse effects on regional groundwater levels or
water quality.
Abstraction from the Leederville Formation for irrigation in the development area has been
approved by the Water Authority of WA and a licence will be issued when water requirements
have been finalised and bores have been drilled and tested. Groundwater from the Leederville
Formation will be pumped into lakes which will be lined and will form temporary water storage
facilities from which the reticulated water supplies will be drawn. These lakes will be located
at selected sites around the golf course to facilitate the distribution of water across terrain
where differences in surface elevation of up to 30m are encountered. If necessary, the
irrigation supply will be treated by aeration for iron removal.
3.3 TREATED WASTEWATER
The Perth Urban Water Balance Study showed that the average annual in-house consumption
of water is 173kL. When the 1,400 residences have been established, this will provide an
estimated aggregate wastewater volume of 242,200kL/annum.
If half the wastewater could be recovered and recycled for irrigation, it would provide a useful
supplementary source, particularly as a proposed water treatment plant is to be located
adjacent to the golf course.
However, the residential areas will only be fully established after a period of 10-15 years and
therefore this supplementary source could only be available in the long term. The recycled
water would require treatment to appropriate standards defined by the Health Department.
DAMES & MOORE

4.0 EFFECTS OF DEVELOPMENT ON THE GROUNDWATER REGIME
4.1 ENHANCED RECHARGE
Land clearing and urban development will result in a rise in water table levels due to the
following factors:
reduced evapotranspiration losses following removal of vegetation;
enhanced recharge from roofed and paved areas which have higher runoff potential
than uncleared land; and
enhanced recharge as a result of losses from domestic and irrigation water reticulation
systems and discharge to ground of stormwater drainage.
Enhanced recharge to the superficial aquifer will potentially increase the thickness of the
freshwater lens. However, the construction of the Dawesville Channel and also the canals will
reduce the thickness of this lens in the immediate vicinity of the development.
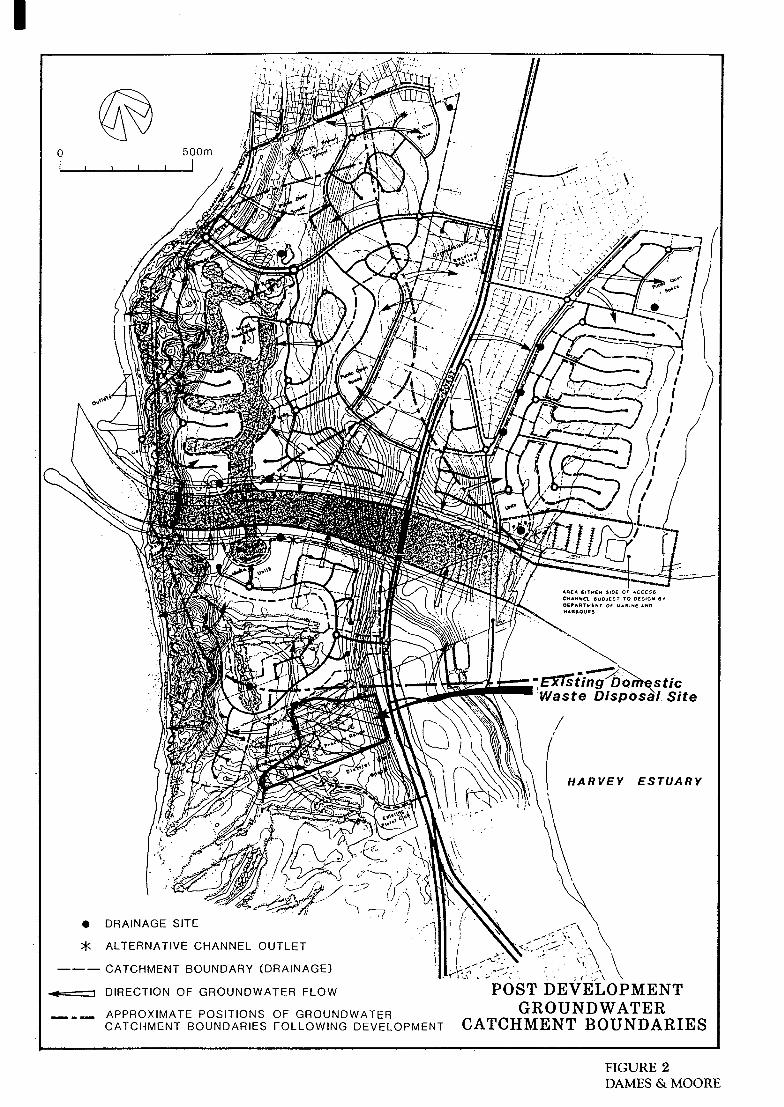
4.2 EFFECT OF DEVELOPMENT ON PEEL-HARVEY CATCHMENT BOUNDARY
It is difficult to accurately define the pre-development position of the Peel-Harvey groundwater
catchment boundary since it migrates seasonally and the maximum difference in the elevation
of the water table across the peninsula is only about 0.5m.
The construction of the Dawesville Channel will alter the hydrology of the surrounding area
and change the position of the Peel-Harvey Catchment Boundary. Currently, groundwater
discharges to the Indian Ocean and the Peel Inlet. The proposed development will create
additional groundwater discharge areas which comprise the Dawesville Channel and also the
proposed canal system and marina. The positions of the groundwater catchment boundaries
following development (Figure 2) are difficult to predict accurately. The positions shown on
Figure 2 were predicted using preliminary design information for the development to assess the
impact on the groundwater flow regime. These positions can only be regarded as approximate
since the factors which make it difficult to define the pre-development catchment boundary
affect the post-development boundary positions and in addition, the accuracy to which it is
possible to make predictions is limited at this stage.
DAMES & MOORE

4.3 EFFECTS OF ABSTRACTION
The proposed borefield will be at least 2,000m from the nearest existing user of groundwater
from the Leederville Formation. Groundwater exploration and aquifer testing are planned
prior to golf course construction to obtain aquifer parameters and to enable the borefield to be
designed to minimise the effects of abstraction on existing users. Abstraction from the
Leederville Formation is unlikely to have any measurable effect on the superficial aquifer.
4.4 EFFECTS ON GROUNDWATER QUALITY
Stormwater drainage systems will be designed to prevent the introduction of oils and other
noxious chemicals into the superficial aquifer. Consequently, the only effect of the development
on groundwater quality which is potentially of significance is the addition of nutrients to the
shallow groundwater system in the superficial aquifer. The sands and limestones in the
unsaturated zone underlying the development area have a high capacity to remove phosphorus
by absorption due to the nature of the sediments (high phosphorus retention indices are likely,
based on previous testing of similar materials at other locations) and the thickness of the
unsaturated zone (Sm to 40m). Attenuation of any phosphorus reaching the saturated zone will
also occur by absorption and dilution as groundwater flows through the aquifer.
4.4.1 Effluent Discharge from Sewage Treatment Works
The development is to be serviced by a reticulated sewerage scheme constructed, operated and
maintained to Water Authority of Western Australia standards. The sewerage scheme will be
connected to the proposed treatment plant which will be located adjacent to the golf course and
constructed and operated by the Water Authority.
Treated effluent from the plant may be utiised in 10-15 years time for the irrigation of some
areas of the golf course using a low pressure irrigation system. The golf course is underlain by
Tamala Limestone which is highly permeable. Consequently, high infiltration rates can readily
be maintained without generating surface runoff of treated effluent. Attenuation of nutrients
by absorption is also likely to occur as discussed above.
DAMES & MOORE

- 10 -
4.4.2 Golf Course and Turfed Areas
Fertiiser applied to the golf course and turfed areas is a potential source of nutrient loading to
the shallow groundwater system.
Application rates • will form part of a detailed fertiliser programme which will be drawn up
when soil analyses are carried out. Key components of the programme will be the use of slow
release fertiisers, tissue testing and foliar feeding to minimise the leaching of nutrients to the
water table.
4.5 IMPACT OF CANAL CONSTRUCTION ON THE GROUNDWATER REGIME
The construction of the canals will alter the groundwater flow regime in the upper section of
the superficial aquifer. Construction of the canals will result in groundwater discharge to the
canal systems as well as the ocean and inlet. The directions of groundwater flow following
development are shown on Figure 2. The original design for the development included two
canal systems and groundwater inflows into each of the canals have been evaluated.
Preliminary estimates based on the limited data available are presented below:
Southern Canal - 170,000m3/annum; and
Northern Canal - 190,000m3/annum.
Because of the proximity of the southern canal to an existing domestic refuse disposal site,
there would be a high potential for serious contamination of the southern canal system to occur
via groundwater throughflow from beneath the tip. Based on Darcy's equation, the
groundwater throughflow from the tip to the southern canal would be approximately
76,000m3/annum. Due the highly permeable nature of the underlying sediments, any leachate
emanating from the tip would be rapidly transported to the southern canal. A 'typical'
composition for leachate from landfill sites is summarised in Table 2. The concentration of
each constituent in groundwater discharging into the canal would depend on the following
factors:
composition of the landfill;
rainfall infiltration rate within and around the landfill;
permeability of the aquifer;
DAMES & MOORE
thickness of the unsaturated zone; and
attenuation of contaminants in the aquifer.
Because of the potential problems and risks associated with the construction and operation of a
southern canal system, it is proposed that the southern canal will not be constructed and that
the golf course will be extended into this area.
4.6 IMPACT OF MARINA CONSTRUCTION ON THE GROUNDWATER REGIME
A marina complex is to be constructed on the Harvey estuary foreshore on reclaimed land
adjacent to the north of the Dawesville Channel entrance. This land will be created by the
disposal of spoil associated with excavation of the Channel. The reclamation of land will
enhance aquifer recharge locally and cause the seawater interface present in the basal section
of the superficial aquifer to migrate eastwards to a new equilibrium position. The impact on
the groundwater regime is expected to be localised and confined to the immediate vicinity of
the marina because of the moderate to high permeability and low hydraulic gradient of the
superficial aquifer.
Groundwater inflow to the marina is estimated to be about 44,500m3/annum. The development
and management of the marina is the responsibility of the Department of Marine and
Harbours.
DAMES & MOORE
- 12 -
TABLE 2
TYPICAL LEACHATE COMPOSITION FROM LANDFILL SITES
Parameter -- Concentration
pH* 2.5 -7.5
BOD5* 10,000
COD 6,000
Total Suspended Solids 500
Total Dissolved Solids 15,000
Alkalinity 3,000
Total Hardness 3,500
Organochiorine Pesticides <0.002
Organophosphate Pesticides <0.02
Total PAIl <0.02
Total Petroleum <2 Hydrocarbons
Ammonia Nitrogen* 2,500
Nitrate 370
Total Phosphorus 30
Ortho Phosphate 20
Copper* 15
Lead* 15
Zinc* 130
Total Iron* 400
Cadmium <0.1
Total Chromium 3
Dissolved Manganese <14
Arsenic <0.01
Selenium <0.01
Mercury <0.1
Sodium 2,200
Potassium 1,400
Calcium 1,000
Magnesium 250
Chloride 6,000
Sulphate* 900
Free Cyanide <0.1
Note: * Exceeds primary seven target concentrations.
All units in mgi1 except pH. DAMES & MOORE
- 13 -
5.0 MANAGEMENT AND MONITORING
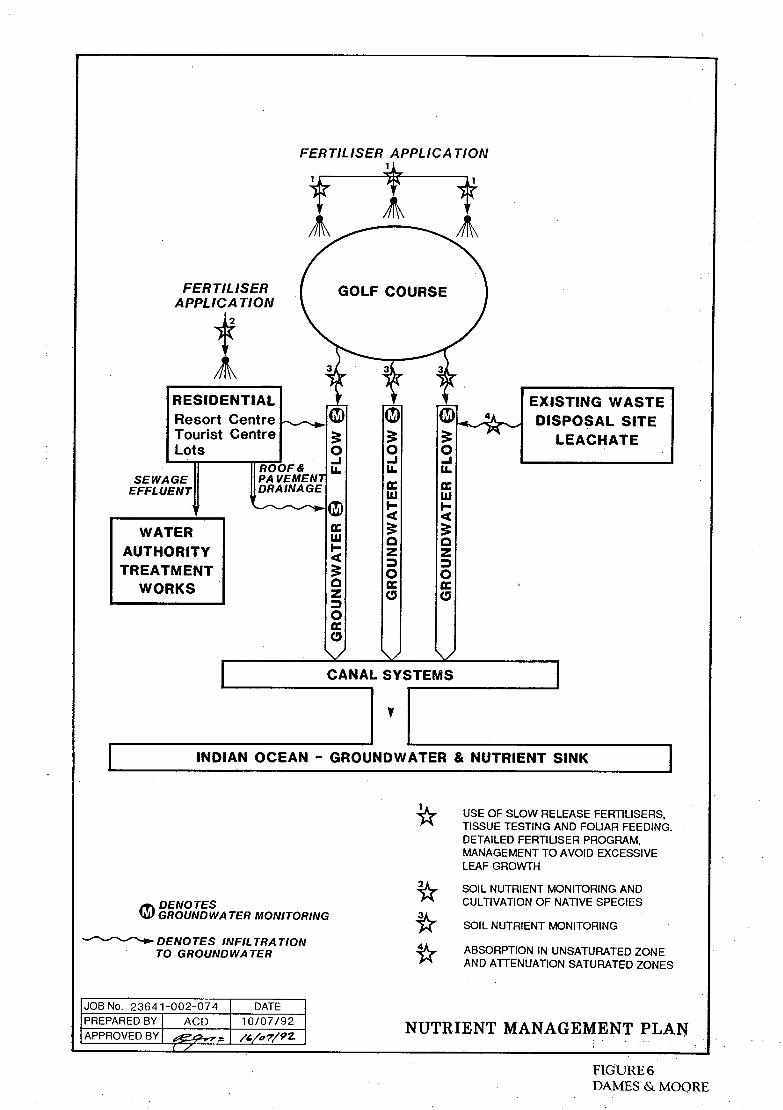
5.1 NUTRIENT MANAGEMENT PLAN
A staged nutrient management programme has been designed to minimise the impact of the
development on the environment and to address the major nutrient inputs and the potential
export. A schematic nutrient flux diagram for the resort is presented on Figure 5.
Sources of nutrient input to the site are summarised below:
fertiliser application to the 18 hole golf course - both for establishment and
maintenance;
disposal of sewage effluent;
fertiliser application to turfed areas and gardens; and
leachate from the existing rubbish tip.
The nutrient management programme aims to minimise nutrient export from the site by the
following methods:
Golf Course Management
- minimise fertiliser application through the use of slow release fertiisers and
foliar feeding; and
- regular soil sampling and tissue testing to assess soil and plant nutrient levels.
Management of Sewage Effluent Disposal
- to be undertaken by the Water Authority of WA.
Management of Fertiiser Application to Turfed Areas and Gardens
- annual soil testing of resort lawns to monitor soil nutrient levels and hence
minimise fertiliser usage; and
- private lot owners to be encouraged to cultivate native species and to use slow
release fertilisers on turfed areas.
Management of Existing Rubbish Tip
- to be undertaken by the Shire of Mandurah.
DAMES & MOORE
- 14 -
The overall nutrient management plan is shown schematically on Figure 6.
5.2 GOLF COURSE MANAGEMENT IN TERMS OF NUTRIENTS AND GROUNDWATER CONSERVATION
5.2.1 Establishment of Turf
Planting will be undertaken in stages to minimise the additional water required in excess of
normal operating requirements.
A fertiliser program will be drawn up to achieve the following results:
to establish a deep root system to obtain maximum benefit from the water applied and
assist in maintaining the turf against wear stress; and
to avoid excessive leaf growth which would cause turf maintenance problems and result
in the use of more water.
5.2.2 Turf Management Programme
A turf management programme will be designed to achieve a turf coverage, which is adequate
for the anticipated wear stress and is of satisfactory appearance, using the minimum quantities
of water and nutrients.
The application of too much water andlor nutrient results in the development of excessively
succulent leaves and heavy thatching. This causes maintenance costs to rise and ultimately
requires the removal and replanting of the grass. Overwatering can also lead to temporary
waterlogging, reduced soil oxygen levels, a restricted root system, increased disease
development and an overall reduction in turf-grass vigour and quality.
Regular de-thatching of fairways, tees and greens, including removal of grass clippings, is a
prime management objective. This will allow maximum benefit to be obtained from the water
applied in that it facilitates rapid infiltration to the root zone and minimises evaporation
losses. Other measures to facilitate and maintain water movement to the root zone include
coring of the turf and the application of products such as Wetta Soil.
DAMES & MOORE

- 15 -
Irrigation scheduling is important and will be given careful consideration in terms of the soil
water retention characteristics and the soil infiltration rates. Irrigating too frequently can
cause excessive leaf growth at the expense of root development.
It is planned to operate the irrigation system as necessary between 6pm and 6am to lessen
wind interference and minimise evaporation losses. This will also avoid disturbance of players
during daylight hours.
There is some variation in soil type across the golf course and the irrigation system will be
designed to accommodate this variation in terms of head to head coverage, sprinkler coverage,
sprinkler size and quantity applied.
5.2.3 Monitoring
A monitoring programme will be designed to allow the determination of the plant water
balance and the nutrient requirements on a regular basis. This will allow the growth and
maintenance of satisfactory turf.
The installation of soil-moisture level-sensing units is under consideration and this would
greatly assist in the determination of appropriate water application rates.
Regular monitoring of the soil nutrient levels and tissue testing is also planned.
5.2.4 Operational Water Usage
Operational water usage will be based on the evaporation of a free water surface measured at
the Perth Meteorological Station and calculated on a weekly basis.
The golf course superintendent will adjust application rates for each hole on a daily basis after
consideration of the condition of the grass, the nature of the soil, the soil-moisture levels and
the local weather conditions.
Maintenance of top quality turf is a necessary aim of the developer in order to attract tourists
and the proposed golf course management strategy is designed to achieve this aim whilst
minimising the water and fertiliser requirements.
DAMES & MOORE
- 16 -
The monitoring programme will enable accurate assessment of turf water and nutrient
requirements on a regular basis and, allow efficient operation of the golf course.
5.3 GROUNDWATER MONITORING PROGRAMME
It is understood that the Water Authority of WA is managing a programme to monitor the
effects of construction of the Dawesville Channel on the superficial aquifer. This programme
will be reviewed to confirm that it provides adequate coverage for monitoring the effects of
canal and marina construction on the groundwater system.
The efficient maintenance of the golf course and associated facilities requires a considerable
commitment by the developer in terms of the operation of the water supply scheme. Routine
groundwater monitoring will be undertaken by the golf course maintenance personnel who will
receive appropriate training for this work.
The water supply monitoring programme proposed for the long-term operation of the system is
described in three parts:
water level monitoring;
discharge, lake storage and irrigation monitoring; and
water quality monitoring.
5.3.1 Water Level Monitoring
Water levels in all bores will be measured before the commencement of the seasonal pumping
and every month thereafter.
5.3.2 Discharge, Lake Storage and Irrigation Monitoring
Volumes of water abstracted from each bore will be recorded monthly using cumulative flow
meters installed on each bore main. Lake levels will be monitored by staff gauge and, the
irrigation rates and distribution of irrigation throughout the resort will be recorded.
DAMES & MOORE

- 17 -
5.3.3 Water Quality Monitoring
An annual sample from each production bore will be taken at the end of summer and
submitted to an approved laboratory for chemical analysis to ensure that the water-quality is
not declining significantly.
5.3.4 Monitoring Reviews
Annual reviews of borefield perfonnance will be undertaken to the satisfaction of Water
Authority requirements. It is anticipated these reviews could be prepared during the winter
low-pumping period each year. This will ensure that the aquifer is maintaining the required
abstraction without any adverse hydrogeological and environmental effects, and will enable
pumping schedules to be adjusted if necessary to avoid such effects.
6.0 SUMMARY AND CONCLUSIONS
The quantitative assessment of the existing groundwater regime presented in this report and
the prediction of changes which may be caused by the development are based on limited data
and on comparisons with similar projects in the Perth area.
The development site is underlain by the superficial formations which extend from the ground
surface to about -15m AHD and consist mainly of calcarenite and sand. The aquifer contains
freshwater lens overlying saline groundwater in the basal section. Abstraction of useable
supplies of groundwater from the superficial aquifer would be difficult and uneconomic because
of the depth to water and the presence of only a thin freshwater lens.
The Leederville Formation underlying the superficial formations is the most prospective source
of a water supply for the golf course irrigation. The formation is known to contain a
substantial resource of fresh groundwater but the long-term sustainable yield has yet to be
proven. The resource is currently under-utilised in the Dawesville area and there are no plans
by the Water Authority to use it for public water supply. Abstraction from the Leederville
Formation aquifer has been approved by the Water Authority and a licence will be issued
following the construction and testing of bores and the finalisation of water requirements.
DAMES & MOORE
Groundwater will be pumped into lined lakes which will form temporary water storage
facilities from which the irrigation water supplies will be drawn. Treated wastewater may be a
supplementary source in the long-term but will not be available for the first 10 to 15 years
following construction.
The total water requirement for irrigation of about 38ha of golf course and 6ha of public
reserve area is estimated to be 440,000kLlannum with a peak demand of about 2,900kL/day.
This preliminary estimate will be revised as detailed design of the development proceeds.
Potential impacts of development on the shallow groundwater system include:
enhanced recharge;
change in the position of Peel-Harvey Catchment Boundary;
canal and marina construction; and
sources of nutrients.
The main sources of nutrients associated with the development are discussed and proposals for
nutrient management are provided. In general, the impacts of the proposed development on
the groundwater regime are minor and not significant in comparison to the effects of the
development of the Dawesville Channel.
7.0 REFERENCES
Dames & Moore, 1990. Eglinton Beach Resort. Predicted Impact of Development on the
Groundwater Regime and Proposals for Management. Appendix 5 of Public
Environmental Review Report. Prepared for Eglinton Resort Development Pty Ltd.
Dames & Moore, 1992. Assessment of Water Storage Options for Proposed Golf Course and
Recreational Reserve at Dawesville. Unpublished Report for Wannanup Development
Nominees Pty Ltd.
National Health and Medical Research Council (NH&MRC)/Australian Water Resources
Council (AWRC) 1987. Guidelines for Drinking Water Quality in Australia.
DAMES & MOORE

- 19 -
Water Authority of Western Australia, 1987. Perth Urban Water Balance Study.
* * *
Respectfully submitted
DAMES & MOORE
J. Ding
Project Engineer
JD641-003-O74/DK:74-425
DAMES & MOORE
LIMITATIONS OF REPORT
We have prepared this report for the use of Wannanup Development Nominees Pty Ltd in accordance with
generally accepted consulting practice. No other warranty, expressed or implied, is made as to the
professional advice included in this report. This report has not been prepared for the use by parties other than
the client, the owner and their respective consulting advisors. It may not contain sufficient information for
purposes of other parties or for other uses.
It is recommended that any plans and specifications prepared by others and relating to the content of this
report or amendments to the original plans and specifications be reviewed by Dames & Moore to verify that the
intent of our recommendations is properly reflected in the design.
Whilst to the best of our knowledge information contained in this report is accurate at the date of issue,
subsurface conditions, including groundwater levelsand contaminant concentrations, can change in a limited
time. This should be borne in mind if the report is used after a protracted delay.
There are always some variations in subsurface conditions across a site which cannot be fully defined by
investigation. Hence it is unlikely that the measurements and values obtained from sampling and testing
during the investigation will represent the extremes of conditions which exist within the site.
DAMES & MOORE


I — JOB No. 23641-002-074 PREPAREDBY I ACD 10/07/92 APPROVED BY
DATE
Park Ridge Estate \No.2 No.
E. Foresho '
HALLS HEAD 75000 0 0
/ ON
0
I n d / a fl City of Mandurah MANDURAH 100 000 I Rule 'o
/ Group Dower St. Mandurah---,No.10 85000 96 000 Golf Course
360 000 No.2 b I •
/
30000
City of Mandurah 0
0 c e a ,, (Peelwood Parade) L 75 000 •
I Erskine Halls Head Estates
91
-- - o" 150000
oel
FALCON/ C:,
0 FalconBay
I
Falcon Reserve Miami Caravan Park AVALON 30000 •
Proposed
Development Falcon Prima Area 25 000 \
'.1 0
Z1p
Golf i'0 Go, Peel
Inlet
Course
Sth Mandurah Sporting and Recreation
4 10 000
ME LR OS
/ DAWESVILLE
I Miami - 2/75 - -
Dawesville Caravan Park
I- Mandurah 1500,PJ
Turf Farm 25000
Harve
101\N0
Es

300 RAINFALL RECORD ii ii I ii 11111 I 11111111 I ii I I I I I I I I I ii I II I I 11111111 I
MANDURAH STATION
1983 - i991
250-
200
o.
N N LEGEND
too N
RAINFALL
Not Recorded
H II IiIIIfl C
FMAMJJASOND FMAMJJASOND FMAM1JJASOND FMAM1JJASONDJFMAMJJASOND FMAMJIJASOND_FMAMJJASONDIIFMAMJJASOND FMAMJJASOND 1983 064 i9als t98B 1967 1988 1969 1990 199i
FIGURE 3 DAMES & MOORE
300 PAN EVAPORATION
RECORD
PERTH STATION
1983 - 199i 20
200
I
z 0 1-4 II i0 0- > Ui N z
_ 0-
LEG END ioo.
EVAPORATION
150
FMAMJJASOND FMAMJJASONDJFMAMJJASOND FMAMJJASO1.DJFMAMJJASONPJFHAP4JJASONO FMAMJJASONDJFMAMJJASONDJFMAMJJAS0ND 1983 L984 198 086 1987 i9BB 1989 i990 i9i
FIGURE 4 DAMES & MOORE

FERTILISER APPLICATION
1
FERTILISER GOLF COURSE APPL ICA TION
ESI NTIAL TGWT! LEACHATE
SEWAGE II IIPAVEMEN1
::;; I TREATMENT cc
WORKS
I CANAL SYSTEMS
I
I INDIAN OCEAN - GROUNDWATER & NUTRIENT SINK
I
--- DENOTES INFIL TRA TION TO GROUNDWATER
NUTRIENT FLUX DIAGRAM
C-,
IJOBNo. 23641-002-074 DATE I I PREPARED 6Yj2 10/07/92 I
APPROVED BY
FIGURE 5 DAMES & MOORE
FERTILISER APPLICA TION
A AA
FERTILISER APPLICATION
A RESIDENTIAL Resort Centre Tourist Centre Lots
TPRO"
SEWAGE AV
EFFLUENT RA
WATER AUTHORITY TREATMENT
WORKS
GOLF COURSE
3
o 0 0 _j _I & U. IL. It.
4EN AGE cc Ir
ILl
ILl I— z
0 0 O z a 0 a
EXISTING WASTE DISPOSAL SITE
LEACHATE
CANAL SYSTEMS
V
INDIAN OCEAN - GROUNDWATER & NUTRIENT SINK
USE OF SLOW RELEASE FERTILISERS, TISSUE TESTING AND FOLIAR FEEDING. DETAILED FERTILISER PROGRAM, MANAGEMENT TO AVOID EXCESSIVE LEAF GROWTH
4k SOIL NUTRIENT MONITORING AND
DENOTES CULTIVATION OF NATIVE SPECIES GROUNDWATER MONITORING * SOIL NUTRIENT MONITORING
---DENOTES INFILTRATION TO GROUNDWATER 4A'
ABSORPTION IN UNSATURATED ZONE AND ATTENUATION SATURATED ZONES
JOBNo. 23641-002-074 DATE PREPAREDBY ACD 10/07/92
APPROVED BY /7a7/92.
FIGURE 6 DAMES & MOORE
Miami / DAWESVILLE
2/75 1 Dawesville Caravan Park
/Mandurah Turf Farm
25000
150
Harve
110\~76 Es
JOB No. 23641-002- PREPARED BY ACO 10/07/92 APPROVED BY .rc /44'/92
to / Sth Mandurah Sporting and Recreation
4 10 000
074 DATE
Park Ridge Estate \- No.1 1 •
Peel Inlet Golf Course
MELROS
I nd/an
Ocean
/1
E. Foreshore 75 000 0
'c 0 0 cc
L1J
City of Mandurah ,c0 MA N D U R A H '
100 000 • Rule o
/ Group Dower St. Ui Mandurah
Golf Cour No.1 85 000 96 000 LL
360 000 No.2 t
30000
Mandurah 0 /(PC'telwoo/d Parade)
L 75 000 •
Erskine Halls Head Estates 0
150000
HALLS HEAD
FALCON /
VFalcon
Bay
Falcon Reserve Miami Caravan Park • AVALON 30000
Proposed Development
Falcon Prima Area 125 000
C~/
300 RAINFALL RECORD
I I si I I I I 11111111 I I I I I I I I I I
MANDURAH STATION
1983 - 1991
20
200
i 0.
S. N.
N N LEGEND
100W
N
xq N \ NNN'
RAINFALL
t5o - N N
11 Not
g~
Recorded
11115 fl FMAP4JJASOND FMAMIJIJASOND FMAMJJASONP FMAMJJASONDJFMAMJJASOND F1IIAP*IJJASOND_FMAMJJASONDI.IFMAMJJASDND FMAMJJASOND
983 i984 085 i986 1987 1988 1989 1990 iggi FiGURE 3 DAMES & MOORE
W,)
300 Iii liii PAN EVAPORATION iii illiii ill, I liii II Iii Ii I I Ii iiii Iii ii Li I I ii ill I ''iii' Iiiuu Iii ii I
RECORD
PERTH STATION 1983 - 1991
250
200
1-4
LEG END
100
EVAPORATION
. III 'II 111J I 'I'I III III' IliI IIIiI FMAMJ.JASOND FMAMJJASONPJFMAM1JJASONO MAMJJASONDiFMAMJJASO4DlFMAMJJASOND FMAMJJASONDJFMAMJJASDNDIIFMAMJJASONP
1983 1984 1985 1986 1987 1988 1989 1990 i9si FIGURE 4 DAMES & MOORE

FERTILISER APPLICATION
A A A
FERTILISER GOL S APPLICATION
ç
RESI
A DENTIAL EXISTINGA 1
I Resort Centre D ISPOSAL SITE I Tourist Centre 0 0 0 LEACHATE ILots U. U.
—I U. I
iT T6oF& SEWAGE w w w
EFFLUENT DRAINAGE Jj . 4 4 4
0 WATER Z Z Z AUTHORITY 0 0 0 TREATMENT
WORKS 0 0
I '7
CANAL SYSTEMS I
I INDIAN OCEAN - GROUNDWATER & NUTRIENT SINK
--'-DENOTES INFILTRATION TO GROUNDWATER
NUTRIENT FLUX DIAGRAM
!JOBNo. 23641-002-074 I DATE I PREPARED BY I ACD I 10/07/92 I kPPROvEDBYj.s/7z I
FIGURE 5 DAMES & MOORE

FERTILISER APPLICATION 11
FERTILISER APPLICATION
A RESIDENTIAL Resort Centre
I Tourist Centre I I Lots
ROOF& LL-I
SEWAGE IIPAVEMEN1 EFFLUENT11 ILDRAINAGE
WATER cc LU
AUTHORITY TREATMENT
WORKS
EXISTING WASTE DISPOSAL SITE
LEACHATE
GOLF COURSE
3
CANAL SYSTEMS
INDIAN OCEAN - GROUNDWATER & NUTRIENT SINK
- USE OF SLOW RELEASE FERTILISERS, TISSUE TESTING AND FOUAR FEEDING. DETAILED FERTILISER PROGRAM, MANAGEMENT TO AVOID EXCESSIVE LEAF GROWTH * SOIL NUTRIENT MONITORING AND CULTIVATION OF NATIVE SPECIES
DENOTES 3 GROUNDWATER MONITORING
SOIL NUTRIENT MONITORING
-----ø'-DENOTES INFILTRATION ABSORPTION IN UNSATURATED ZONE TO GROUNDWATER AND ATTENUATION SATURATED ZONES
JOB No. 23641-002-074 DATE
PREPARED BY I ACD 10/07/92
APPROVEDBY1 141,,7197- NUTRIENT MANAGEMENT PLAN
FIGURE 6 DAMES & MOORE

PORT BOU YARD
IMPACTS ON COASTAL DUNES
WI,]
ESTUARINE FORESHORE
Prepared for:
Feilman Planning Consultants Pty Ltd
By:
Quilty Environmental Consulting
JUNE 1992
CONTENTS
1. INTRODUCTION .....--•.-....... . 3
2. EXISTING ENVIRONMENT ................ 3
2.1 Coastal Dunes ................. 3 2.2 CaddadLtP Reserve ................ 4 2.3 EstuarY Foreshore ...............
3. DEVELOPMENT IMPACTS AND THEIR MANAGEMENT ....... 5
3.1 Coastal Dunes ................. 32 Caddadup Reserve
...............S 10
3.3 Estuary Foreshore ............... 13 34 Channel Bans ..................
14 REFERENCES .......................
APPENDIX: REPORT ON DRILLING IN COASTAL ZONE ADJACENT TO DAWESVILLE CHANNEL
INTRODUCTION
CF Developments Fty Ltd is planning a c:anal and dry lot development at Nannanup associated with the construct ion of the Dawesvi lie Channel link i no Harvey Estuary to the ocean. The development will impose environmental pressures on the area, including potential impacts on the fragile coastal dunes- and
unesand on the estuary -foreshore which is to be relocated eastwards by Fill derived from excavation of the channel.
Purpose of the present report is to consi der the environmental values potentially impacted in these areas and design and management avenues to attenuate these impacts.
EXISTING ENVIRONMENT
The areas to be impacted by the development and which are of relevance to the present study are:
- the coastal dunes,
portion of Caddadup Reserve 5 and
- the estuary foreshore.
2.1 Coastal Dunes
The coastal dunes in the project area are unconsolidated Holocene sands of the Quindalup System over-lying Tamal
limestone. They are covered by a healthy and vigorous
community OF diver-se coastal vegetation.
2. 1. 1 St r agpy
The dunes are divided into four phases 5 01 to 04. by Mcrthur and Bartle. 04 is the youngest and the predominant type along the foreshore frontage, with 03 and 02 appearing immediately east of the frontal crest and the 02 type also evident as low dunes behind the Frontal zone in the north.
South of Dawesvi lie Channel the foreshore dunes are
particularly iarge, rising to a height of over 20 metres, with a width of up to 150 metres. North of the channel they are of similar dimensions as far asAvalon Point be-fore dropping to a lower elevation of 5 to 8 metres and a width of abi.ut 50 metres beyond the Point towards Falcon.
The dunes are underlain by three distinct pre—Holocene limestone units deposited during separate marine phases. The stratigraphy is discussed in the appendix which presents the findings of a recent drilling program, but a brief summary is provided here.
South of the channel the uppermost of these three limestone units rises to 5 metres AHD within 80 metres of the vegetation line on the beach. The second limestone unit rises to 0.5 metres AHD beneath the beach, extending seawards to outcrop as a wave—cut platform.

2
North of the channel as far as Avalon Point the uppermost limestone unit outcrops as a cliff along the back of the beach and is at about 4 metres AHD beneath the dunes. Beyond the Point the stratigraphy changes, with the uppermost unit rising from below or close to sea level at the shoreline to an elevation of 0.5-0.75 metres AHD 70 to 80 metres from the vegetation line. Here the second unit is removed offshore, separated from the beach by a protected lagoon.
Examination of 80 years' data on shoreline movement indicatus that over this period the shoreline in this portion of the coast has been stable apart from short term fluctuations associated with particular storm sequences. Should serious erosion ofthe foreshore dunes occur at some stage in the future, however, the uppermost limestone unit mentioned above is sufficiently indurated to offer some resistance to such erosion as evidenced by the cliff outcrop at Avalon Point.
2.1.2 Vegetation
The vegetation sequence across the foreshore dunes as a reflection of the comparative exposure of their different sectors: the strand immediately behind the beach, the intermittent berm at the toe of the frontal dune, the steep face of that dune and its moregentle upper slopes, the crest and the protected hind slopes.
Within the strand fleshy annual succulents are found: Cakile maritima, Salsola kali and )Irctotheca populifolia. This is the AC open heathiand as classified by Trudgen in his vegetation map of the Mandurah coastline.
Where it is present, the berm is colonised by a healthy cover of grasses and succulents - predominantly Spinifex hirsutus
and Tetragonia decumbens, with some Spinhfex longifolius also
present.
Behind this the exposed face of the frontal dune is dominated by these three species with the herbaceouS Carpobrotus virescens, PelargoniUfl7 capitatum and the shrubs Olearia
axillaris and Scaevola crassifolia also appearing.
Behind the immediate frontal face in the sometimes broken and semi-sheltered terrain rising to the crest a wider variety of dune species is evidenced. A well developed shrub storey in the substantial dunes south of Avalon Point has Olearia axillaris , Scaevola crassifolia, Acacia rostellifera and
Spyridium globulosum as the dominant species amongst a diverse range which includes all of the species mentioned previously together with the groundcovers and creepers Hardenbergia
comptoniana Isolepis nodosus, Herniandra pungens
LepidoSperfl23 g1adiaturn Conostylis acculeata, various native
and invasive grasses and the weed Euphorbia peplus
Apart from the dominant species already mentioned, the shrub storey here also contains Santa.Z urn accurninatUin, Myoporurn insulare. Threlkeldia diffusa, Jacksonia furcellata, AcanthocarpuS preissii Helichrysurn cordatum, Rhagodia

3
baccata, Exocarpos sparteus, Diplolaena dampieri. Alyxia buxifolia and Acacia saligna
The berm and frontal face vegetation described above are the Sb as classified by Trudgen. The more varied communities covering the rising slopes of the frontal dune behind this are Trudgens OA and SO open to closed heath to open scrub. These vegetation types dominate the foreshore dunes from here south into Yalgorup National Park.
To the north of Avalon Point the lower dunes carry a lesser diversity of vegetation with the spinifexes and Tetragonia
decumbens the most prominent groundcovers and Olearia
axillaris and Acacia rostellifera the predominant shrubs in a narrower band of Trudgens SO and OA vegetation types.
On the protected eastern slope of the high frontal dunes Acacia rostellifera tends to dominate. S'pyridium globulosum,
Olearia axillaris and .9caevola crassifolia are also prominent
amongst a wide variety of shrub species, with Nelaleuca
huegelii dominating in some lower slope situations which lead into low—lying Melaleuca huegelii and N. viminea scrub behind the dunes - the MM and Mv vegetation types of Trudgen
2.2 Caddadup Reserve
Within Caddadup Reserve the areas to be affected by the proposed development are the more mature Qi dune type, with some Q2 in a central valley. Vegetation on these is dominated by the EAf forest and the As woodland of Trudgen.
The EAf type has been degraded in the north of the reserve where a rubbish tip, rifle range and miscellaneous vehicle tracks have impacted on it. Across a ridge to the south, however, this vegetation type is in good condition. Here healthy and attractive Eucalyptus gomphocephala/AgOfliS flexuosa forest towards the east changes to Agonis .flexuosa
forest to closed forest westwards, with Acacia saligna.. A.
truncata, A rostellifera, Olearia axillaris, and Spyridiurn
globulosum the most prominent shrubs amongst the rather open understorey.
The As vegetation type occurs in a wide valley south of the EAf type. Here there is more open scrub dominated by a shrub storey in which Acacia saligna, A. truncata and A.
rostellifera are most prominent with Spyridiufn globulosum,
Melaleuca huegelii.. Acacia lasiocarpa and Jacksonia furcellata
also prominent. Within this low woodland some clumps of Agonis flexuosa are still to be found as pockets of Af type vegetation.
To the west of the reserve the frontal dunes have a vegetation assembly similar to that previously described. These dunes are, however, degraded in numerous places by blowouts which are advancing eastwards into the reserve.
The worst of these blowouts have been partly stabilised by marram (Ammophila arenaria) which, judging by its extent and

4
cirowth StCtLIS, was presumablY introduced some years ago to attempt to check the sand advance..
2.3 Estuary Foreshore
The estuarY -foreshore at the development site comprises marshy flats and depressiOnS interspersed by minor beach ridges..
2..3. 1-hoj'etfl
In the tidal zone or the estuarine edge Sarcocorflla sp
predominates with SporoholuS virginiCL-IS and JLU7cLIS kraussii dominant on slightly higher ground immediately behind it. The
marshy ground beyond is a low cnelaleLtca forest dominated by
MCJCJ8LCC rhaphiophylla and M cLt±icLlleri5 with Juncus
kreusSii and patches of Gehnia trifida prominent beneath them.
Beach ridge scrub interspersed includes dense growth of sternbergi.ay Kunzea vestita, littorea and occasional Aracia
amongst the melaleuca woodland Jarksonia furcel late. J.
Regelia ciliata, .AnthocerC2s saligna and CCSLICr2T?a obese.
Behind the marshy flats and intervening sand ridges on slightly elvated Karakatta Sands the vegetation changes to a
tuart-marri woodland. EucalyptUS gocnphocephalC and
EucalyptUS calophylla dominate the overstorey, but with
widespread Agonis flexuosa also present. Acacia' saligria and
Jacksonia furcellata are prominent amongst an understoreY
which also includes MelaleUca Cut3cUlafiS, Jacksonia
sternhergiafla and Xanthorrhoea preissii as some of the more
prominent shrub species.
- Bio Ectuarine ta
Estuat-ine fauna to be found in the shallows are dealt with in the Stage 2 ERMP for the Dawesville Channel. A summary
derived from this is presented below..
The seagrasses Ruppia inegac-arPa and 1-/alophila avails which
originally grew in these areas have declined as a result of epiphytic diatoms reducing available light and smothering by
macroalgee.
Large faunal communities are however to be found here, their composition varying according to salinity.
These include
large numbers of foraminiferans, over 30 species of molluscs,
large numbers of the snail HydrocOcCi.tS brazieri, and abundant
bivalves including j4rthritica semen Teilina, sangL1if101aria
pJSLIla and Ant.corbUta arnara,
The most abundant polycheete worms found in the estuary are C&raton&reiS, HaploScOlOPlOS. Prioflospia and Gapltila..
Small crustaceans found amongst the seagrasses and algae
include the amphipods ParacOrOPhL1ffl, Melita and COrOPhILUnY the
shrimp PlíiiOfl8t8S australiS coppads and mysids.

Estuar i na cietr itus and the rich assembl aqe of estuar inc in'ertebrate<5 are a bountiful food source for fish crabs and prawns which use the estuarY as a nursery habitat and/or a
rich feeding qround.
The shal lows are also bount i-Ful feedi nq areas for a wide range of waterfowl which also find refuge in the marshy habitats
around the foreshore.
3.. DEVELOPMENT IMPACTS AND THEIR MANAGEMENT
Impacts on the above areas will derive from both site chanqes
and structural measures associated with the development) and
sbsequeflt people usage, particularly in a recreational sense, which will flow from that development.
3.1 Coastal Dunes
Developments that will impact on the coastal dunes include:
- the establishment of R20 residential development impinging on their eastrn slopes and associated reshap.ing of the mid and lower slopes of this face;
- establishment of a carpark at the protected beach immediately north of the channel mouth and of road access
to that carpark;
- development of pedestrian access pathways through and within the dunes
- possible development of a limited number of fairways
within the dunes.
3.1.1 c siden+ial Subdivision .., -.
R2.0 residential subdivision will extend onto the backslopes of the high dunes north and south of the channel mouth. This
will involve some cutting into the mid and lower slopes of these dunes and associated filling to establish satisfactory
gradients for development.
The location of this residential development is believed to be consistent with the objectives of SFC Coastal F'lanning Policy
in that:
- A substantial foreshore reserve is to be retained between the residential development and the beach.
- Setback of buildings from the vegetation line behind the beach is about 100 metres over most of the length of affected coastline, although it reduces to 70 metres north of Avalon Point. Here the -foreshore road at Falcon is to be extended south to link with the new development, following an existing track which lies 40 to 50 metres east of the vegetation line.

- Location of the boundary line for development has also ensured that it does not encroach onto the crest of the foreshore dunes, thereby maintaining the aesthetic value of the natural dune landform and its cover of native vegetation along the western skyline. This approach has entailed widening the foreshore reserve beyond 100 metres in certain locations.
Considering the substantial and well vegetated nature of the dunes, the presence beneath them of an erosion barrier in the form of limestone as discussed at 2.1.1 above and the stable nature of the coastline in this area, this setback indicated above is considered to leave an adequate buffer between the development and the ocean. The adequacy of same will, however, hinge on retaining adequate stabilising cover on the dunes and on maintaining sand feed past the Dawesville Channel to the beaches to the north.
A sand bypass operation proposed in the stage 2 EPMP for the Dawesville Channel should ensure that sand feed is maintained. Rehabilitation and protection measures proposed for the dunes at 3.1.4 below should ensure the continued retention on these of adequate vegetative cover.
3.1.2 Carparks Roads and Pathways
The SPC Coastal Planning Policy also advocates provision of public access to the foreshore at suitable locations. The
development plan addresses this through provision of one carpark immediately behind the beach at the northern breakwall, with a further carpark at Avalon Point with a pedestrian path from it through the dunes to the beach.
From a stability viewpoint, locations behind the dune are
preferred for car parking. The one to be located immediately adjacent to the beach is, however, in a situation which is protected by two breakwallS and which is therefore not expected to be at risk. Its situation here recogniseS that this beach is likely to be very popular because of the shelter from the afternoon sea breeze and swell provided by the breakwaters to the south.
The carpark at Avalon Point will serve the beach here which is popular with surfers and for which a surf club has been proposed with the support of Council. This area offers the options of safe swimming to the north in a lagoon protected by an offshore reef, and good surfing conditions to the south where waves break onto the reef.
South of the channel surfing and fishing are currently popular, with access to the beach provided along a number of sand tracks. Disposition of access paths through the dunes to the beach here will ensure easier and formalised access to these areas to accommodate the increasing use which development of the land behind will occasion.

.1.3 Fairways
Development of a golf course at the soLithern end of the estate extending into Caddadup Reserve will see several -Fairways located in the foreshore dunes. Exact location of these will be determined on the ground at a later stage of planning but the objective will be to site them in areas where they will not detract from the rich assemblage of foreshore vegetation.
Thus preferred locations will be degraded areas associated with the numerous blowouts in the south. Fairway development here will provide a basis for stabilising and rehabilitating these blowouts for ause that is consistent with retention of vegetative cover and thus protection of their stability.
.1.4 DuneManaqqm jnt and Rehabilitatç
The most significant impact of development will be the increased recreational pressctre which it places on the foreshore dunes and the beach as increasing numbers of residents and visitors use it for fishing, surfing and
relaxation.
Development per se will also remove some dunal vegetation for establishment of roads, access paths and residential allotments and the hind slopes of the dunes will be reshaped by cutting and filling to accommodate residential. development which extends onto these.
As previously mentioned, the development allows an adequate foreshore reserve within the dunes to accommodate any long term erosion, bearing in mind the size and stability of these dunes and the underlying limestone basement. Building allotments are generally to be located on the rear slopes of the high frontal dunes, thereby ensuring that the natural skyline is retained for aesthetic benefit when viewed from both the beach on the one side and the subdivided land on the other.
Where development activities do enter the dunes, the area of disturbance will be minimied to ensure that the majority of existing vegetation cover is retained. Such vegetation as is cleared for roads and pathways through the dunes and for-
residential
or
residential development on their rear slopes will be stockpiled. This can be used later as stabilising brush cover on areas which are to be rehabilitated.
Topsoil will also be stripped and stockpiled for use in subsequent rehabilitation. Such rehabilitation will follow completion of roads and pathways through the dunes, to reinstate any adjacent ground disturbed during their construction. It will also extend to existing areas of instability along the berm and frontal •Face over the length of the development site, to numerous minor blowouts encroaching into the dunes over this same length and to larger blowouts to the south, in Caddadup Reserve, where these affect the proposed golf course development.

This rehabilitation will
biowout.s estabi ishina a where these have broken down revegetation. Subsequent I y provide temporary stability and natural iced qroundcovers propagated by planting and cover to afford permanent protect ion.
entail earthworks within the continuous berm and frontal dune to provide a stable landform for brush and mulch will be spread to over the bare surface. The native and shrubs of the dunes will be seeding beneath this temporary vegetation cover for long term
Formal beach access pathways through the dunes will be
careFully sited 5 particularly where they emerge through the frontal -Face or berm onto the beach 5 to ensure they are not
prone to wind scour or sand deposition.
All pathways within the dunes will be surfaced with concrete or limestone as appropriate. They will also be fencedq as will the perimeters of carparks and the eastern edge of the foreshore reserve where this abuts public land. Temporary
fencing may also be appropriate on the western side of the
dunes, immediately behind the berm 5 to protect stabilisatn and revegetation work until this is well established.
Signs will be installed at key points to direct pedestrians to pathways through the dunes and to request cooperation in respecting dune vegetation and rehabi 1 itated areas.
High quality treatments will be used throughout for fencing, signage, surfacing of paths, rest areas along these and associated benches, etc. If a high standard is adopted
initiall'y> j there is a greater tendency by the general public to respect the work so that vandalism and indiscriminate access through vegetated and rehabilitated areas is minimised.
As a basis for the foregoing work, a foreshore management plan will be developed detailing
- areas to be treated;
- the nature of such treatment including earthworks, temporary stabi 1 isat ion measures, revegetation species
and techniques;
- location, design and management of accessways;
- ongoing maintenance requirements to preserve the stability and vegetative cover of the dunes.
3.2 Caddadup Reserve
The golf course proposed at the southern end of the estate will be partly within private land owned by the developer and partly within Caddadup Reserve to the south. In the former it is on land which is to be filled with spoil from the channel development. In the latter a majority of the fairways will be in the disturbed northern sector of the reserve but some may extend into the- well vegetated central portion of the reserve and westwards into the foreshore zone.
CaddadLtp Reserve is an A Class reserve for recreation and camping vested in the Local Authority. Present uses within
the northern portion of this reserve - the part most affected by the golf course development - include the llandurah City rubbish tip a sand quarry and a motocross circuit within same a pistol ranqe and various informal access tracks to the
coast.
Random bike and 4WD tracks traverse the dunes and swales of the balance of the reserve to the south. These are a source
of damage to the area, although the most degraded land is in the north where the more intensive uses have occurred.
The area is recognised by the EPA in it, advice on the Dawesville Channel Strategy Plan as "likely to become the only significant area of regional open space containing representative woodland vegetation species on the land joining the ocean and the estuary." In this context they consider it to be important as a potential Faunal corridor between the ocean and the estuary and to be significant also to the visual character of the estuarine precinct. They therefore sugest that the suitability of the reserve for a golf iourse be
studied carefully.
Fairways within the private development land and the northern sector of the reserve will have little adverse impact because these areas have already been grossly disturbed. Their
development is a sound approach to rehabilitation of these areas to a productive recreational use which will reinstate vegetative cover and enhance the visual amenity of a degraded
landscape.
Further south, fairways within areas of the reserve which are now disturbed only by bike and 4WD tracks have the potenta 1 to impact on tuart woodland and peppermint forest of higher conservation value. Siting of these fairways will accordingly be determined carefully on the ground to contain deleterious
impacts.
Those fairways which are located towards the west will, as
mentioned in Section 3.1-35 be preferentiallY located to minimise their impact on better vegetation assemblages and to capitalise on areas of dunal erosion where native vegetation
is being inundated by sand drift. This is an attractive
option as it affords the opportunity to reinstate a degraded dunal area whilst providing an attractive ocean -Frontage environment for users of the course.
A substantial natural link between the ocean and the estuary will remain through the southernmOst portion of the reserve which will be unaffected by the golf course. Furthermore,
aesthetic values will be protected the terrain is such that
a high ridge following Old Coast Road will hide the golf course development from the estuary,.while to the west of this ridgeline the perspective over the southern end of the reserve remains unchanged and to the north Judicious' siting of fairways, as previOuslY mentioned, will contain impacts on the tree storey in particular. . ,
PilOnfl the -fairways themselves amendment with bauxite resi due will be consi det-ed to irno rove nutrient and moisture reten ion. This c:oncept is consistent with one of the policy provisions for open space recreation areas of the Feel Harvey Catchment
Planning Policy.
3.3 Estuary Foreshore
The estuary foreshore on either side of the Daweevi lie Channel entry is to be filled with spoil excavated from the channel and the estuary floor beyond its moLtth. Landscape and rehabilitation plans for this -fill and for the channel banks
are being prepared by the Department of Mar inc and Harbours.
The plans for the area of fill north of the channel mouth include development of a canal estate and a marina with a
peninsular of land east of the estate which might serve as a foreshore reserve for public recreation. in this context it
could be effectively rehabilitated as recreational parkiand, interspersed by nodes of natural foreshore venetat ion.
2.3.1 -ives forForeshOre Use
The recently released Peel Inlet Management Programme advocates that the subdivision of any land along the estuary foreshore be accompanied by dedication of adjoining land to the Crown as a foreshore reserve. The design indicated above is consistent with this objective.
The Management Programme further advocates a priority on development of recreational nodes to accommodate future demands, with such nodes providing for a broad range of recreational opportunities compatible with the estuarine environment and having well planned and appropriate facilities
established within them. such facilities could include launching areas, barbecues, toilets, shelters, tables and seating, play equipments fresh water supply, rubbish disposal facilities, vehicular and/or pedestrian access, car parking, nature interpretatiOn facilities and beaches.
With respect to the lastq the possibility of creating areas of deeper water suited to swimming is canvassed. Development of dual use paths to provide and encourage linear acceSs for cyclists and pedestrians to the foreshore is also advocated.
The emphasis on recreational use of the estuary and its foreshores is reinforced by surveys conducted in the area - notably one carried out for the Mandurah Tourism Development Plan in 1984 which indicated that the largest single tourist attraction at Mandurah was fishing and crabbing (29% of responses), followed by beaches (17.47.) and the jniet/estuary/boatiflg (15.47.).
That the demand for these and other recreational activities within the area will increase is axiomatic, deriving not only from the intended development adjacent to the Dawesville Channel but also from increasing visitation pressure from Mandurah and Perth.

11
Thus the suggested dedication to recreational use of 1.5 kilometres of foreshore created by fill from the Dawesville Channel would be a sound response to a well documented need and would be consistent with priorities indicated in the Peel Inlet Management Plan.
3.3.2 Impacts on Foreshore Vegetation and Estuarine Biota
The environmental impact of the channel development on foreshore vegetation and estuarine biota as dealt with in the Stage 2 ERNP for the Dawesville Channel will apply equally to this particular section of the foreshore at the channel entry. Accordingly those impacts are simply summarised here.
The filling operation on either side of the channel mouth will bury the fringing vegetation along the foreshore. This vegetation does not have a high conservation value in its own right but is nonetheless a valuable buffer between the estuary and urban development.
In the estuary itself creation of the channel will lead to increased tidal fluctuation, a reduction in salinity variation through the year and a reduction in macroalgae in the long term after a possible initial increase. Foreshore erosion may increase, w-ith such erosion possibly greatest in the vicinity of the channel mouth where tidal variation will be greatest.
The reduction in macroalgae will see an improvement in clarity and dissolved oxygen levels, and there will be a likely recruitment of seagrasses to the shallows with the better light penetration.
There is unlikely to be any major adverse impact on the biota, with benthic fauna persisting as the dominant species, increased species diversity overall, but possibly a reduced population of true estuarine species.
Elimination of Nodularia will create a more favourable environment for certain fish species and there is likely to be further recruitment of blue manna crabs and a greater variety of marine fish. There may, however., be a reduction in the numbers of sea mullet and also of the Western King prawn which favours the hypersaline summer conditions of the estuary.
Overall the decline in macroalgae together with a reduction in the area of shallows permanently underwater may reduce the productivity of the estuary as a fishery.
The increased tidal variation is also likely to see less roasting sites available for waterfowl, although predictions of the effect on these are speculative.
3.3.3 Foreshore Rehabilitation and Development
Rehabilitation and development of the foreshore strip created north of the channel entry should aim to ameliorate some of the impacts on the estuarine flora and fauna. This rehabilitation could, at the same time, capitalise on . the

12
radical disturbance of this area to develop a frontage to the estuary which can accommodate much of the increasing recreational pressure on its foreshore.
In forming, rehabilitating and developing this area particular attention might be paid to the importance of establishing a stable foreshore, providing an aesthetically pleasing environment and servicing diverse recreational demands.
Contouring of the fill along the estuary interface should be designed to match the anticipated shoreline form which natural erosion and. accretion will otherwise establish in time. Engineering measures should be adopted, as and where appropriateS to protect this form from serious erosion, with concurrent attention to any impacts such measures may have on the neighbouring shoreline to the north.
Modest variations might be provided in surface levels of fill to break the continuity of what would otherwise be a flat plain and to provide micro-environments within which different foreshore plant species can be established.
Once the fill has been placed, topsoil which has been pre-stripped from the original foreshore should be respread to provide a satisfactory surface medium for plant regeneration.
In areas which are to be grassed for recreational use, amelioration of the surface soil with bauxite residue could be considered to improve nutrient and water retention and thus aid development and maintenance of healthy grass cover, the more so as these areas are unlikely to be irrigated. These areas should then be sown or sprigged to an appropriate turf species - kikuyu (Penniseturn clandestinurn) and, at least near the estuary edge, saltwater couch (Sporobolus virginicus) are likely to be most suitable. Establishment of sandy beaches would then be focused along the frontages to these recreational areas.
Trees might be planted for shade, shelter and aesthetic enhancement. drawing upon endemic species such as tuart (Eucalyptus gomphocephala), peppermint (Agonis flexuosa),
swamp oak (Casuarina obesa) and paperbark (Melaleuca
rhaphiophyl Ia).
In time facilities could be introduced as warranted to meet progressive demands - barbecues, tables and seating, play equipment, toilets and possibly a kiosk.
For diversity, aesthetic enhancement and restoration of some of the pre-existing ecological values, pockets of native foreshore vegetation might be established to break up the recreational area, occupying up to 509 of this frontage. With the proposed variation in surface contours this vegetation could provide a continuity from tidal sedgeland on the estuary edge through tea tree and paperbark woodland/forest behind to beach ridge scrub and possibly tuart-marri woodland on higher ground.

LC5U5O this area will initially be an extensive tract of bare ciround adjacent to the ooen expanse of the estuary, exposure
to wind may 1 nter1-ere with n iant establishment and may
generate surtac:e erosion. Should this prove a problem,
bruhing/mu1Chiflg of the sur-Face use of wind fences and/or cover croppi no with cereal rye might be considered to cf-Ford temporary protect ion to develop i no plant cover.
To provide public access to this area a road is to be constructed along its length leading to a carpark at its southern end adjacent to the proposed marina. Further carparks could be provided adjacent to any recreational segments developed along the length of this peninsular of
land.
A dual use path might also be constructed along its length. This would desirably follow an irregular route, weaving amongst the vegetation and at times approaching the Fareshore, to provide visual diversity and interest to pedestrians and
cyclists.
3.4 Channel Banks
The channel, banks offer a golden opportunity for developing a major recreational and access resource linking the estuary to
the ocean. Periodic access will be required by Marine and Harbours to permit repairs to canal walling or dredging, and this will in turn demand temporary dumping areas for dredge
spoil and rocks. This access requirement need not, however, preclude public use of the channel banks and development of facilities suited to this.
Establishment of a promenade for use by strollers, cyclists, anglers, etc is the primary development suggested here. This
will not demand more than the 15-metre width presently within the public domain behind the channel walls, but intermittent increases in this width are proposed to accommodate areas of grassed parkiand with play equipment and space for picnicking.
The promenade will be improved by planting of trees in clumps and as individual specimens to provide shade, shelter and aesthetic enhancement. Emphasis in species selection for this purpose will attach to the horsetail oak (Casuarifla
equisetifo.lia) and the peppermint (,gonis flexuosa) which are well suited to such an environment.
At the western end of the promenade there will be limited access only to the breakwaters extending into the ocean. Current plans foreshadow the southern breakwall being armoured with granite rock from a point &) metres from the shoreline, the central one being similarly armoured from a point 90 metres from the shore and the northern-most being armoured from a point 100 metres from the shore. This armouring will preclude public use beyond the point where it commences.

REPORT ON DRILLING N COASTAL ZONE ADJACENT TO DAWESVILLE CHANNEL
PETER J WOODS & ASSOCIATES
JUNE 1992
Report to QUILTY ENVIRONMENTAL CONSULTING

iPX
1 INTRODUCTIi 1
1.1 THE STUDYAREA 1
1.2 REVIEW OF PREVIOUS DATA 1
2 METHOD 2
2.1 DRILUNG 1 2
2.2 MAPPING : 3
2.3 SURVEYING 3
3 NOMENCLATURE 3
4 RESULTS 4
5 CONCLUSIQ1 6
6 REFERENCES 7
FIGURE 1 Study Area showing basic geology and locations of drill holes
and cross sections.
FIGURE 2 Department of Marine and Harbours Drill hole locations near
Dawesville Channel (see also Cross section 2)
CROSSSECTIONS 1-5
TABLE 1 Borehole and rock outcrops locations provided by McMullen
Nolan & Partners.

-1-
I INTRODUCT1ON
In order to provide some data on the potential for coastal erosion as a basis
for determining the width of the coastal reserve adjacent to the Dav:ssviile Chane!, a drilling programme has been carried out to determine the
stratigraphy of the coastal zone within 100-15Gm of the shoreline.
Because of the size of the drilling rig provided, and lack of suitable access
along the coast, drilling was limited. However, the information obtaineo from this programme correlated well with information logged in 1986 from cores
provided by the Department of Marine and HarbourS and reported in Woods
(1986). Thus white further drilling wou!d have provided more data, the
consistency of the data gained has allowed the stratigraptiy in areas between
drill lines to be predicted with some confidence.
1.1 THESTUDYAREA
The study area is shown in Figure 1. It lies immediately north of the Shire of
Mandurah rubbish tip and extends to the southern boundary of residania!
housing
1.2 REVlEW OF PREVIOUS DATA
A report by Woods (1986) contains details of Marine and Harbour's cores
logged by Peter Woods and Vic SemenhlJk in 1986.
Vary briefly, previous drilling along a transect immediately north of the
proposed Dawesville Channel, revealed that the area is underlain by three
distinct limestone units (Units 1, 2 and 3) with a fourth presently being
deposited along the modern coast (Unit 4) Due to the presence of calcrete
and soils on the upper surface of the three limestone units it is clear that
these three units were deposited during three separate marine phases.

-2-
The first (le. oldest) two units underlie the narrow neck of land between the Harvey Estuary and the modern coast. The third (ie. younger) unit, however, abuts a ridge of yellow sand which unconformably overlies the eastern part of the second unit. The youngest or fourth unit, which is being deposited today, unconformably overlies the western part of the third limestone unit. This fourth unit is clearly Holocene. As the third unit has been caicreted it is likely to be pre-Holocene in age.
in general the oldest two limestone units are more cemented and have thicker caicrete cappings than the Unit 3 limestone. The Holocene (Unit 4) dune sands are unconsolidated.
The stratigraphy along the drilled section has been repeated here as Cross section 2 (see also Figure 2). Of significance to this report is the occurrence above sealevel (0.0m AHD) of the Unit 2 limestone beneath the modern beach, in Holes L6/84 (+0.9m) and Sites 10, 11 and 12 (±lm), and Unit 3 limestone beneath the modern dunes.
2 METHOD
2.1 DRILLING
Nine holes were drilled using a Wallis Mantis 500 rig (see Figure 1 for locations). Holes were logged continuously with special note taken of grain size, colour, composition and degree of cementation. In general, holes were drilled through the Holocene sand dunes (Unit 4) into the underlying weakly to well cemented Unit 3 limestones. The uncomformity between Units 3 and 4 is generally marked by a brown sandy soil where the contact is above sea level, or a thin layer of course shells and round lithoclasts (the Rocky Shore Unit) where the contact is below sea level. In some holes drilling continued until a very dense hard calcrete layer prevented further penetration. This surface marks the contact between Unit 3 limestone and the underlying and older Unit 2 limestone.

-3-
2.2 PPiNG
The ccstat area was mapped using a 1:5,000 scale air photograph. Spcai
note was taken of:
the oation of the most seaward outcrops of caicrete-capped Unit 3
llmestone,
the ocaiCfl of caicrete-capPed Unit 3 Hmestcfle cliffs behind the beach.
the presence, or not, along the coast of a platform cut into Unit 2
t -_ + LSCfle•
The dstribut!on of the Holocene Unit 4 sands and the pre-HotoCefle Unit 2
and 3 UmestofleS is shown in Figure 1.
2.3 SURVEYING
Holes, calcrete outcrops and the Vegetation Line were surveyed n and naCura surtace Cross sections produced from previous surveying data by
McMuiefl Noar. & Partners (Tablel).
3 NCENCLATURE
In order to be consistent with Woods (1986) the following simplified
nomencature has been adopted:
Dune/Beach Ridge Unit - Sediments formed behind the beach which
typically comprise well sorted fine to medium quartzoSe shs; sands.
Beach Unit - Sediments formed in the beach zone which typically
compnse well laminated, medium to coarse quartzose seUy sands.
Swash zone sediments typically are coarse, seaward-dipping laminated sheily sands whilst backshOre zone sediments typically ccmprSe
ahernating horizontal laminae of medium to coarse sand.
me
Rocky Shore Unit - Sediments, formed on a rocky wave-Cut shore,
wh:ch iypica!lY comprse coarse, sheUy maenal with large pelecypods
and gastropOdS and coarse quartz and rounded lithoci2StS.
Unit rin - Brown quartzoSe sands developed dug w
(d) Soieathering over
the caicreted surface of an underlying limestone.
Yeiow Sand Unit - Sediments formed in' the subaerial environment
whcn are typically meo!Um to coarse yellow-stained quart sands.
(f) Lmestcne - Any pre-NolOCefle sethmer.tS (ie. induces Unit 2 anc 3
limestones).
4 ESULTS
The results of both current and previous drilling indicate that the coast
adjacent to the Dawesvlle Channel cut is underlain by three pre-l-iOiOCene
limestone (Units 1, 2 and 3).
Unit 2 limestone outcrops as wave cut platforms along the coast and forms a
reef, in the northern part of the study area. This well cemented unit vaa
penetrated during the current drilling, however, it is 2 - 5m thick based on
previous drilling.
The uppermost limestone unit Uflit 3) which is 2 - 5m thicK outcrops as:
(a) a low lying plain behind the modern dune and beach ridge system,
(b) underlies the modern dunes and beach ridges, and
(C) outcrops in places behind the beach as resistant cliffs.
The Unit 3 limestone which has a calcrete capping and is poorly - moderately
cemented rests on the heavily caicreted surface of the underlying Unit 2
limestone.
The unconsolidated Holocefle dunes and beach ridges (Unit 4) rest
unconformabtY on the underlying limestone units.

-5-
in the southern part of the study area it is evident that the i- cCefle u-S
rest upon a pre-existing low dune of limestone with its overlying brown
sandy soil. In Hole 5, SCm from the Vegetation Line, yellow sand v.:as
encountered at Sm AHD and well cemented limestone at 5.2rn AHD. A
wea•dy cemented limestone was found at 6.5m AHD. This may be nort of,
Unit 3 iimestofle hcwever for the purposes of this report it is as Unit
4 (see Cross section 1). Thus in this area unequivocal limestone (Unit 3) lies
) at 5.2m AHD within BOrn of the Vegetation Line. 73
cliff In the vicinity of the DaweSvflle Channel, Unit 3 limestone outcrcpS asa behind the beach. The Holocefle dunes overlie the pre-existing Unit 3
limestone dune which rises to 5m AHD within 50m of the Vegetation Line
(see Cross section 2). This section also shows that the Unit 2 limascfle
rises above sea-level (O.5rn AHD) beneath the beach - presumably it extends
seawards as the wave-cut platform
In the vicinity 01 the prominent point, the upper surface of the Unit 3
limestone outcrops behind the beach as a cliff. The 1-lolocefle dunes overlie
the Unit 3 limestone which occurs at around 4rn AHD (see Cross section 3).
Thus the stratigraphy of the strip of coast from the southern end of the study
area to the point is generally consiSteflL, with the calcreted surface of the
Unt rnestOfle occuring at 4-ni AHD below the Holocene dune system..
North of the point, the coast and the offshore reef are separated by sha!0W
lagoon. This part of the study area is characterised by a series of curved
Holocene beach ridges which basically parallel the current shc,:sne. The Holocefle sequence comprises dune sands which overlie a sandy beach and
a rocky shore unit composed of coarse shelly grit, shelis and rounded
pebbles of caicreted limestone. This unit rests upon the gently seaward-
slop!ng calcreted surface of the Unit 3 lmestOfle.
In Cross section 4 the upper surface of Unit 3 limestone rises from O.Orn AND
at 45m in from the Vegetation Line to 0.75rn AHD at about 70m. in Cross section 5 the upper surface of the Unit 3 limestone rises from -irn M-D at
50rn in from the Vegetation Line to 0.5m AHD at 85m. The Unit 3 limestOne in
turn rests on the heavily caicreted surface of the underlying Unit 2 limestOne
at around -ito -2m AHD (see Cross sections 4 and 5).
r

01
Thus the stratigraPhY north of the point differs from that to the south in that
ie caicreted surface of the Unit 3 limestone rises from below or close to sea
level at the current shoreline, to reach an elevation of about 0.5 - 0.75m AHD
it 70 - 80m in from the Vegetation Line.
CONCLUS1O
[he results of current and previous drilling provide evidence that the
unconsolidated Unit 4 Holocene dune and beach ridge units are underlain by
wo pre-HoloCene limestone units whose upper calcreted surfaces are above
present sea level near the current shoreline. This implies that should
conditions which induce loss of sand from the coast occur, erosion will
proceed until the underlying limestone units are sufficientlY exposed to offer
resistance. The more cemented Unit 2 limestone outcrops along the coast
as a wave-cut platform which to some extent appears to be determining the,
shape and location of the current shoreline south of the point. North of the
point the ridge of Unit 2 limestone is detached from the coast.
The Unit 3 limestone while not strongly cemented, is sufficiently indurated to
offer some resistance to erosion as evidenced by the cliffs along the coast
south of the point, and the buried rocky platform north of the point.
Given data from drilling it is likely that only limited erosion will occur south of
the point as the Unit 2 limestone currently outcrops as a resistant wave-cut
platform and rises to above sea level beneath the modern beach and dune
system. In places the beach 15 backed by a cliff of Unit 3 limestone.
Elsewhere the Unit 3 limestone consistently occurs at 4 - 5m AHD within at
least 50 - 80m of the Vegetation Line. While no drilling was possible between the southern transect and the DawesVille Channel, it is likely that the Unit 3
limestone exists above present sea level within 10 - 50m of the Vegetation
Line.
fi
-7..
rth of the point the Unit 2 limestOfle outcrops as a reef whiCh s
dCtSChCd
from the shore. Beneath the current coast the caicreted surtaCe of this Unit
ours at around -im AHO within 60rn of the shoreUfle (Cross ct 4.
1 ne Unit was ot encounterea n Cross sectiOn 5. ErosiOn will thereCe be
ntrdlld by the presence or absefiCS of the Unit 3 ilmestOfle. Based on
U data on Cross sectoflS 4 and 5, erosiOn is Ukei to be llntad to m as the Unit 3 limestOne occurs at O.75m AND within 80m of the
1 etScri Line in HoleS 2 and 7 (COS sectiOnS 4 and 5).
C ' r-• -,
/oodS P.J., 1986, interpretatiofl of geoLOgical history from DaweSViile,
Jestarn Australia: Report to Department of Marine and HarbourS.
C)
0 (I)
C') m C) —4
0 z --4
:IJ 0
Ti 1)
TI

McMULLEN NOLAN AND PARTNERS SURVEYORS PTY LTD
A.C.N. ooc 363 31
Consulting Surveyors • Land Development • Mining • E n gineering
TABLE 1
DAWSEVILLE - 05/06/92
BOREHOLE & ROCK OUTCROP LOCATIONS
No East North RL
1 21408.7 192106.4 1.55
2 21414.35 192080.0 2.85
3 21473-4 192072.7 3.10
4 21145.9 191927.7 12.65
R/OutcroP 21236.6 191927.8 5.15
vegetation 20594.. 3 190345.8 6.35
5 20681.7 190345.7 16.45
6 20709.2 190341.8 17.05
R/OutcrOP 20821.75 190343.2 4.95
7 21708.55 192228.5 5.05
8 21738.7 192224.35 5.0
9 21689.2 192227.95 4.05
9 LyaU Street.
South Perth. W.A. 6151.
Phone: 474 1099 Fax: 474 1093

PorellOmeler 19 CROSS•SECTION THROUGH DAWESVLLE
+5m
—lOr
- 5r
sI
/ Fine - medium, well sorted gralnslofle (DUNE)
Medium - coarse, well sorted, bedded grainstono (BACKSHORE)
Coarse - laminated. shelly gralnslone (SWASH)
Fine - medium, poorly sorted. packslone (SEACRASS)
S I Large shells. coarse quartz (ROCKY SHORE)
Laminar - vu9gy caicrole and soil (UNCONFORMITY)
rOOm Fine - coarse sands. blosliomos (SHE(.F)
Shelty mudslestuarlfle sands (ESTUARIHE)
Medium - coarse quartz sand (YELLOW SAND)
Lost cote 2 - r Position ol sample br analysis
Position ol sample for analysts brom an adjzcent core

HP4
'0
1W
0
I>
(I) IC
III
0 iOo /0)
titii Iii II I . !I
METRES II
/ci/
w >
N\
OR Ift° BRANCH - - IMP7 MP8A MP8
HP7
L6/84 L7184 L8/84 Mp26:),C,A,8 MP11
*8
L9/84
L103/86
S ITE11 - __________ -
HP HPG . MP15 6
10
7GMp14
SITE 3 LlO2/86
7.B MP9
L1O1/86\
[84 INVESTIGATION
D PENEIROMETER PROBE IT1
/1
0 CORE HOLE SITE
V B
MP2 (approxHOC3 p2la 18A,
(approx. Ioc3t
PENETR
ion)
7 OMETER 19
OZL4184
3HP2
P2Z
FIQJRE2
Departnnt of Marine and Harbours DriLl bole locations
..
SITE 1
INDIAN
OCEAN

. .'-,- 2
4 0
S

• l7r1 ,//'
(i4II'(A) S.L
olo
1I
AO 50.A
I if.... . I L
T - ;•
1tI I.
......
S .'.. '
I'
II I 1 I I i A. 6. _I_III .- I I
Aj I
:1 . • 1-4
I I
f•'\t;(/i..I [
LV I

STEEDMAN SCIENCE & ENGINEERING
Port Bouvard
Coastal and Hydraulic Engineering Study
Prepared for
Wannunup Development Nominees Pty. Ltd
Prepared by: Michael Rogers
Reviewed by: Steve Buchan
Steedman Science & Engineering July 17, 1992 Job No. C1350 Report No. R556 Copy No. 12

STEEDMAN SCIENCE & ENGINEERING A Division of Oceanroutes (Australia) Pty Ltd A.C.N. 008 885 998
31 Bishop Street, Jolimont, Western Australia, 6014 Ph. (09)387 7955, Telex AA93934, Fax (09)387 6686
July 17, 1992
CP Developments Pty Ltd Cl- Development Strategies International Pty Ltd 62 Cohn Street WEST PERTH WA 6005
Attention: Mr Ed Turner
Dear Sir
PORT BOUVARD COASTAL AND HYDRAULIC ENGINEERING
As per your letter of March 16, 1992 we have prepared the attached 3 unbound copies of our report R556 titled "Port Bouvard, Coastal and Hydraulic Engineering Study" for your use in the PER.
We have sent bound copies of the report to both Mr Merv Warren of Wannunup Development Nominees Pty Ltd and Mr Erwin Roberts of Fielman Planning Consultants.
If you have any queries on this work, please do not hesitate to contact us.
Yours faithfully STEEDMAN SCIENCE & ENGINEERING
It/I
Michael Rogers Manager, Coastal & Ocean Engineering
MPR: CEW:C1350:92426

STEEDMAN SCIENCE & ENGINEERING
TABLE OF CONTENTS Page No.
1. INTRODUCTION ..................................... 1
2. WATER QUALITY IN THE PROPOSED CANAL ESTATES .......... 2
2.1 General ...................................... 2
2.2 Source Water .................................. 3 2.3 Management of Nutrient and Pollutant Inflow .............. 3 2.4 Water Mixing and Exchange ......................... 5
2.4.1 Wind Induced Currents .............................. 6 2.4.2 Density Currents ................................ 8 2.4.3 Astronomical Tidal Fluctuations ...................... 9 2.4.4 Meteorological Effects ............................. 10
2.4.5 Groundwater Inflow .............................. 10
2.5 Resultant Water Quality ............................ 11
3. OCEAN SHORELINE STABILITY AND RECOMMENDED SET-BACK FOR DEVELOPMENT .................................. 12
3.1 Description of the Ocean Beaches .....................12
3.2 Historical Records ...............................12
3.3 Longshore Drift ................................13
3.4 Recommended Set-back to Buildings .....................14
ESTUARY SHORELINE AND RECOMMENDED RECLAMATION AREA .............................................. 16
RIVER FLOOD AND STORM SURGE LEVELS AND RECOMMENDED MINIMUM BUILDING LEVELS ...........................18
5.1 Possible Greenhouse Effects ..........................18
5.2 River Flood Levels ..............................19
5.3 Ocean Storm Surge ..............................19
SUMMARY AND RECOMMENDATIONS .....................21
6.1 Water Quality in the Proposed Canal Estates ...............21
6.2 Ocean Foreshore Stability and Recommended Set-Back for Development ..................................21
6.3 Estuary Shoreline and Recommended Reclamation ............22
6.4 River Flood and Storm Surge Levels and Recommended Minimum Building Levels ..........................22
REFERENCES .......................................23
Tables
Figures
Append ices
STEEDMAN SCIENCE & ENGINEERING
LIST OF TABLES
Table 2.1 Estimated composition of leachate from the Mandurah tip (taken from the Dames and Moore report, appendix 2).
Table 2.2 Estimated load of nutrients and pollutants discharged in bilge water.
Table 2.3 Estimated daily tidal exchange in the canals.
Table 5.1 Scenarios for possible rise in global sea levels due to possible climate change (taken from Institution of Engineers, Australia, 1991).
Table 5.2 Extreme surge values for Fremantle Harbour. Surge levels for Dawesville identical. (Note, the surge is additional to the astronomical tide).

STEEDMAN SCIENCE & ENGINEERING
LIST OF FIGURES
Figure 1.1. Location map.
Figure 2.1 Initial concept for 3 canal estates.
Figure 2.2 Proposed concept for 2 canal estates.
Figure 2.3 Wind induced currents in a closed end canal.
Figure 2.4 Wind rose for summer mornings at Mandurah.
Figure 2.5 Wind rose for summer afternoons at Mandurah.
Figure 2.6 Wind rose for autumn mornings at Mandurah.
Figure 2.7 Wind rose for autumn afternoons at Mandurah.
Figure 2.8 Wind rose for winter mornings at Mandurah.
Figure 2.9 Wind rose for winter afternoons at Mandurah.
Figure 2.10 Wind rose for spring mornings at Mandurah.
Figure 2.11 Wind rose for spring afternoons at Mandurah.
Figure 2.12 Wind induced currents in the main canals.
Figure 2.13 Schematic diagram of the action of density currents.
Figure 2.14 Tidal record taken offshore from Dawesville (taken from Steedman Limited, 1986).
Figure 2.15 Position of locations ito 4 from table 2.3.
Figure 3.1 Ocean beaches near the Dawesville Channel.
Figure 3.2 Geological sections through the beach backed by high dunes.
Figure 3.3 Geological section through the sandy embayment at Avalon.
Figure 3.4 Photographs of limestone outcropping from the dunes and beaches near the Dawesville Channel.
Figure 3.5 DMH shoreline movement plan for the area near the Dawesville Channel.
Figure 3.6 Comparison of High Water Mark Surveys taken in March 1909 and June 1992.

STEEDMAN SCIENCE & ENGINEERING
LIST OF FIGURES
Figure 4.1 Bathymetry of the Harvey Estuary near the Dawesville Channel.
Figure 4.2 Summer water levels in the Harvey Estuary with and without the Dawesville Channel.
Figure 4.3 Extent of shallow water and drying mud flats at low tide after the construction of the Dawesville Channel.
Figure 4.4 Proposed extent of reclamation of the mud flats north of the Dawesville Channel.
Figure 5.1 Storm surge values, Fremantle, based on 17 years of tide residuals from Fremantle Harbour tide gauge over the periods 1967 to 1981 and 1984 to 1985.

STEEDMAN SCIENCE & ENGINEERING
LIST OF APPENDICES
Appendix 1 Water Quality Criteria for Beneficial Uses Nos. 1 and 3, taken from Bulletin 103, Department of Conservation and Environment, 1981.
Appendix 2 Groundwater report by Dames and Moore.

STEEDMAN SCIENCE & ENGINEERING
1. INTRODUCTION
Over the past 20 years the Peel Harvey Estuarine System has suffered significant biological deterioration. This has been due to excessive algal growth that has been linked to the high levels of nutrients in the inflows to the estuary. In the 1980's, the State Government completed numerous studies into the problem and possible solutions. A comprehensive review is provided in the Stage 2 Environmental Review and Management Programme prepared by Kinhill, 1988.
The Dawesville Channel was adopted by the State Government as part of the overall management strategy and is presently under construction. The channel is some 12 km south west of the City of Mandurah as shown in figure 1.1. When completed it will significantly improve the exchange of water between the Indian Ocean and the Peel Harvey Estuarine System. As outlined in the ERMP (Kinhill, 1988), the channel will not only remove nutrients from the estuarine system but also provide social benefits in the form of new recreational opportunities.
Wannunup Development Nominees Pty Ltd (Wannunup) owns a large proportion of the land adjacent to the Dawesville Channel. It wishes to develop both dry lot and canal subdivisions on this land and where practicable create a variety of recreational opportunities. The development will be known as Port Bouvard.
As part of its studies for the development, Wannunup has engaged Steedman Science & Engineering (Steedman) to investigate the following aspects.
* Water quality in the proposed canal estates.
Stability of the ocean foreshore and recommended set back to buildings
* Reclamation and stability of the estuary foreshore immediately north of the channel with the aim to create safe swimming beaches.
* Recommend appropriate building levels inconsideration of river flooding, ocean storm surge and possible "greenhouse" effects.
The results of this work are presented in this report.
STEEDMAN SCIENCE & ENGINEERING
2. WATER QUALITY IN THE PROPOSED CANAL ESTATES
2.1 General
The developer initially put forward the concept of 3 separate canal estates as shown on figure 2. 1. The proposal was to develop the naturally low lying areas behind the coastal dunes, both north and south of the Dawesville Channel as well as the low lying area north of the channel adjacent to the Harvey Estuary. The canal estates were called North Port, South Port and East Port.
The proposed South Port canal estate south of the channel abuts the existing open tip used by the City of Mandurah for more than the last decade. As will be explained in section 2.3, ground water containing high levels of both nutrients and pollutants would flow from the tip area into the proposed South Port canal estate. This would result in unacceptable water quality in this canal estate and consequently, the developer amended the concept plans and deleted the proposed South Port canal estate. The development concept that is now proposed, has only the 2 northern canal estates, North Port and East Port, as shown on figure 2.2.
In line with the Recommendations for the Development of Canal Estates produced by the Steering Committee on Canal Developments, 1984, the beneficial uses of the proposed canal waterways are proposed as follows:
* occasional human immersion;
* boating;
* adjacent residential development; and
* passive recreation.
The Department of Conservation and Environment, 1981 put forward various categories of beneficial use for marine and estuarine waters of WA. The above uses are subsets of Beneficial Use No. 1 - Direct Contact Recreation. A copy of the Marine and Estuarine Water Quality Criteria for Direct Contact Recreation is included in appendix 1. In addition to these criteria, a copy of the more stringent criteria for Beneficial Use No. 3 - Harvesting Molluscs for Food has also been included in appendix 1. Except where limited by the source water, the canal waterways will be designed and managed in order to meet not only the requirements for Direct Contact Immersion but also the more stringent requirements appropriate to Harvesting Molluscs for Food.
The resultant water quality in the canals is dependent upon the following:
* the quality of the source water;
* the management of nutrient and pollutant inflow; and
2

STEEDMAN SCIENCE & ENGINEERING
the mixing and exchange processes.
Each of these items and the resultant canal water quality will be discussed in the following sections.
2.2 Source Water
The source water for the proposed canal estates will be clean ocean water during incoming tides and Harvey Estuary water for outgoing tides and significant river flows. As outlined in the ERMP - (Kinhill, 1988), the outgoing water from the estuary will be a mix of the ocean water from the previous flood tide and the residual estuary water. The source water will be suitable for canal development and is expected to further improve over time because of the longer term influences of the Dawesville Channel and the catchment management strategies being implemented by the State Government.
2.3 Management of Nutrient and Pollutant Inflow
Minimisation of nutrient and pollutant inputs to the canals will be achieved by careful design and management of the water bodies. The design elements comprise the following.
* The site selection will avoid inflow of polluted groundwater from the tip site.
* The development will be serviced with a reticulated sewerage system.
* All road runoff will be collected and allowed to soak into the groundwater aquifer. This drainage system will have an overflow into the canals for flood events with return periods greater than 1 year.
* Only runoff from roofs will be allowed to be discharged directly into the canals.
The ongoing management of nutrient and pollutant inputs will comprise the following:
* Rubbish disposal and effluent discharge into the canal will be banned and policed by the appropriate authority.
* The use of slow release fertilizers and vegetation species that require minimal fertilizing will be encouraged.
All of these design and management features are important to minimise the inflow of nutrients and pollutants to the proposed canals. With respect to the site selection, the original proposal was to develop all 3 canal estates as shown on figure 2.1. During the initial investigations, the groundwater inflow rates and quality were estimated by Dames and Moore. Its report is included as

STEEDMAN SCIENCE & ENGINEERING
appendix 2. It was estimated that the average groundwater inflow rates would be as follows:
North Port canal estate - 450 - 500 m3 day 1
South Port canal estate - 450 - 500 in3 day 1
East Port canal estate - 100 m3 day-1
In addition, the groundwater flowing into the southern canal estate would be greatly influenced by the tip site which is less than 0.5 km away. The estimated composition of the leachates from the tip is presented in table 2.1. The leachate is believed to exceed the target concentrations for primary sewers for the following items. For comparison the criteria given for Beneficial Use No. 3 - Harvesting Molluscs for Food are also listed.
Item Tip Leachate Beneficial Use No. 3
pH 2.5 - 7.5 6.5 - 8.5 biological oxygen demand5 10,000 mg L' not applicable
ammonia nitrogen 2,500 mg L' 600 ig L'
copper 15 mg U' 5 L'
lead 15 mg L' 8 jzg L'
zinc 130 mg L' 20 Itg L'
total iron 400 mg L' not given
sulphate 900 mg U' not given
The tip leachate concentrations are expressed in mg L 1 (one-thousandth of a gram per litre) and the Beneficial Use in gg L4 (one millionth of a gram per litre). Consequently dilutions in the order of 2,000 to 10,000 would be required to make the tip leachate acceptable in the canal water body, This magnitude of dilution is not attainable without extraordinary mechanical effort. Such mechanical assistance is not practicable for these sorts of developments.
Another approach to this issue would be to use flow minimisation techniques such as barrier membranes and capping of the tip site. These were briefly assessed to be very expensive and not without attendant risks. Given the above, the developer decided to delete the South Port canal estate from the development concept and adopt the configuration shown in figure 2.2.
Another potential source of nutrients and pollutants would be from vessels using the canal estates. There would be inputs of copper from the antifouling paints, a variety of nutrients and pollutants from bilge water and oils, fuels and greases from maintenance and refuelling activities.
In 1991, a new regulation was added under the Environmental Protection Act of WA that now totally prohibits the use of Tributyl Tin Oxide antifouling paints
El

STEEDMAN SCIENCE & ENGINEERING
on vessels less than 25 m in length. Consequently, virtually all antifouling paints now used on vessels less than 25 m contain copper as the toxin.
The amount of copper released from well maintained antifouling paint for pleasure craft has been estimated to be in the order of 5 to 10 zg/cm 2/day (Taubman Australia, pers comm). On the basis of the typical vessel being a power boat 10 m long, the average daily release of copper is estimated to be in the order of 0.5 to 1.0 g per boat. Given the large volume of water in the canal estates and good mixing and exchange characteristics, this is a manageable load.
Bilge water would not be permitted to be discharged into the canals. Nevertheless it is reasonable to anticipate a small amount of leakage and some infrequent accidental discharge. This is normal for any marine facility. The composition and discharge rate of bilge water varies greatly from boat to boat, region to region and season to season.
Public Works Department-NSW, 1987 presents a reasonable analysis of the impact of bilge water. Table 2.2 has been prepared on the basis of this analysis. This table shows that the leakage and accidental discharge of bilge water accounts for only minor inputs of nutrients and pollutants into the canal. With good mixing and exchange characteristics, these levels are readily manageable.
Inputs of oils, fuels, and greases into the canal waters would occur primarily as minor accidents during refuelling and maintenance activities. Although hydrocarbons can be quite toxic to marine organisms, there has been virtually no reported problems in the existing canal developments at Mandurah. This is probably due to the following factors.
* Spillage is believed to be very small, probably less than 20 mL during most refuelling or maintenance operations.
* Only a small proportion of vessels would be refuelled or maintained in the canals, and such activities would be infrequent.
* Fuels are very volatile and quickly evaporate so there is little chance for the soluble portions to enter the water in large concentrations.
Given the above, and good water mixing and exchange, hydrocarbons would not be present in concentrations greater than the recommendations for Beneficial Use No. 3 except in significant accidents which would rarely occur.
2.4 Water Mixing and Exchange
The canal water bodies will be mixed by winds, waves, advecting currents as well as boat traffic. All of these would ensure that the canal waters are regularly mixed.
5

STEEDMAN SCIENCE & ENGINEERING
There are several mechanisms that will cause water exchange between the canals and the source waters (the ocean and the Harvey Estuary). The dominant mechanisms are:
* wind induced currents; and
* density currents.
Secondary mechanisms are:
* astronomical tidal fluctuations;
* meteorological effects on water levels; and
* groundwater inflow.
All of these mechanisms will be discussed in the following sections.
2.4.1 Wind Induced Currents
Winds blowing over closed-end canals are known to create water motions that are important for water mixing and exchange. McKeehan, 1975 specifically studied the effects of wind on water motion in canals. This work included a theoretical approach as well as presenting extensive measurements taken in existing residential canal estates. This study shows that wind blowing over a closed-end canal water body causes:
* a slope of the water surface, raising the level at the down-wind end of the canal; and
* down-wind water motion in the upper levels of the water, profile and a reverse motion in the bottom layer.
These features are shown on figure 2.3. The expression for the water velocity as a function of depth and surface velocity was given as:
U(z) = U. (1-4z/h + 3(z/h)2) (2.1)
where U(z) = water velocity at depth z
Ur = water velocity at the surface
z = distance below the surface
h = the total depth of water.
The water flow at the surface is usually taken to be in the range of 2 to 5% of the wind speed, refer to Wu, 1973, Bishop, .1979 and McKeehan, 1975. The above suggests that the water speed decreases rapidly with depth and reaches
0

STEEDMAN SCIENCE & ENGINEERING
zero at about 1/3 of the total depth. Underneath this level there is the reverse flow in order to satisfy the conservation of mass law.
Fortunately there have been good quality wind records taken at Mandurah from 1965 to 1985. As there is a significant "sea breeze" effect in the region, the Bureau of Meteorology took a recording each morning at 9:00 am and a second in the afternoon at 3:00 pm. These data have been separated into the four seasons and a separate wind rose produced for each of the morning and afternoon readings. The 8 wind roses are presented as figures 2.4 to 2.11.
Figures 2.4 and 2.5 are for summer. In the summer mornings the winds come from the easterly quadrant about 50% of the time with speeds in the range of 5 to 30 kph. Typically the speeds would be 10 kph. For 25% of the time the summer morning winds come from the south and southwest. Again the typical speed is 10 kph.
In the summer afternoons the pattern is significantly different with over 55% of the winds coming from the south and southwest. The wind speed tends to be marginally stronger with typical values of 10 to 20 kph. For about 20% of the time the wind speed comes from the southeast of east, with speeds typically 10 kph.
The wind roses for other seasons show different patterns but do show that the most common wind directions are along the southwest/northeast and east/west axes.
The canals have been aligned to take full benefit of these wind patterns. During southerly winds, the winds will flow along the main canals which are oriented north northeast/south southwest. Local topography effects and the layout of the buildings along the canals will ensure that the southerly winds funnel down the main canals causing strong wind-induced currents and associated water exchange with the source water.
The secondary or branch canals have been aligned east/west to take full advantage of the easterly and westerly winds. These winds will funnel down the secondary canals and cause good water exchange between the secondary canals and the main canals.
These commonly occurring winds are important in the exchange of water between the canal water body and the source water. Using the method outlined in McKeehan, 1975 and equation 2.1 above it was calculated that a wind of 10 kph would cause the top one-third of the water column to move at an average of 0.04 m s. This would be accompanied by a return flow of equal mass in the bottom two-thirds column. This is shown diagrammatically in figure 2.12 for southerly winds.
As the main canals are about 800 m long, the wind-induced current of 0.04 m s' in the top third of the water column would take about 5 to 6 hours to travel the length of the main canals. This would result in exchange of about
FA

STEEDMAN SCIENCE & ENGINEERING
one-third of the volume of the main canals with the source water. Such a scenario would be representative of the sea breeze events experienced during most summer afternoons.
2.4.2 Density Currents
In the ERMP (Kinhill, 1988) it is predicted that the Harvey Estuary will be less saline than the ocean during winter and early spring. During these seasons the water from the Harvey Estuary is predicted to have salinities in the range of 15 to 25 p.p.t. Under these conditions it would be possible to have the canals full of ocean water at 35 p.p.t. at the start of the ebb tide and during the ebb tide, the less saline and less dense Harvey Estuary water would flow past the canal entrances. Provided there are not mechanisms to suppress vertical stratification (e.g. strong winds), then density currents may form and cause exchange of canal waters.
McKeehan, 1975 and Turner, 1973 provide a description and calculation methods for density or gravity currents. Figure 2.13 shows the mechanisms for mutual intrusion of fluids of different densities.
McKeehan, 1975 gives the speed of the advancing front as follows.
U1 = 0.46 (pghj 1/2
(2.2)
where U1 speed of the advancing front
AP = the difference in density of the two fluids
the near density of the two fluids
g = the acceleration due to. gravity
h = depth of the water column.
For a difference in the salinity of 15 p.p.t. the Ap = 10.7 kg m 3. Such a difference would cause the fronts to advance at Uf = 0.26 m s. This would cause 50% of the canal waters to exchange about 1 hour and total exchange in about 2 hours.
From this analysis it can be seen that density currents can be a very powerful exchange mechanism. Unfortunately they are only likely to exist during winter and early spring and could be readily suppressed by strong winds.
N.
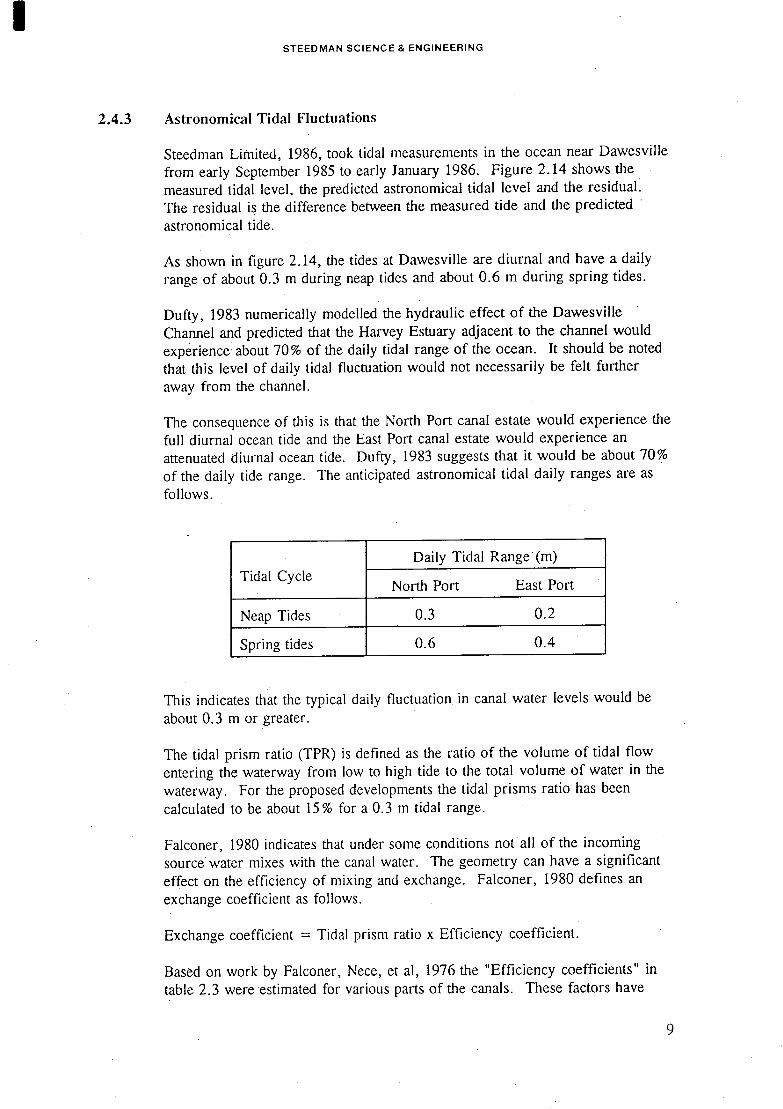
STEEDMAN SCIENCE & ENGINEERING
2.4.3 Astronomical Tidal Fluctuations
Steedman Limited, 1986, took tidal measurements in the ocean near Dawesville from early September 1985 to early January 1986. Figure 2.14 shows the measured tidal level, the predicted astronomical tidal level and the residual. The residual is the difference between the measured tide and the predicted astronomical tide.
As shown in figure 2.14, the tides at Dawesville are diurnal and have a daily range of about 0.3 in during neap tides and about 0.6 m during spring tides.
Dufty, 1983 numerically modelled the hydraulic effect of the Dawesville Channel and predicted that the Harvey Estuary adjacent to the channel would experience about 70% of the daily tidal range of the ocean. It should be noted that this level of daily tidal fluctuation would not necessarily be felt further away from the channel.
The consequence of this is that the North Port canal estate would experience the full diurnal ocean tide and the East Port canal estate would experience an attenuated diurnal ocean tide. Dufty, 1983 suggests that it would be about 70% of the daily tide range. The anticipated astronomical tidal daily ranges are as follows.
Tidal Cycle Daily Tidal Range (m)
North Port East Port
Neap Tides 0.3 0.2
Spring tides 0.6 0.4
This indicates that the typical daily fluctuation in canal water levels would be about 0.3 m or greater.
The tidal prism ratio (TPR) is defined as the ratio of the volume of tidal flow entering the waterway from low to high tide to the total volume of water in the waterway. For the proposed developments the tidal prisms ratio has been calculated to be about 15% for a 0.3 m tidal range.
Falconer, 1980 indicates that under some conditions not all of the incoming source water mixes with the canal water. The geometry can have a significant effect on the efficiency of mixing and exchange. Falconer, 1980 defines an exchange coefficient as follows.
Exchange coefficient = Tidal prism ratio x Efficiency coefficient.
Based on work by Falconer, Nece, et a!, 1976 the "Efficiency coefficients" in table 2.3 were estimated for various parts of the canals. These factors have

STEEDMAN SCIENCE & ENGINEERING
then been multiplied by the typical tidal prism ratio of 15% to obtain an estimate of the daily tidal exchange caused by the astronomical tides alone.
Locations I to 4 in table 2.3 are shown on figure 2.15. Table 2.3 shows that the astronomical tide is expected to have a good flushing effect for the canal entrances as well as the proposed DM11 marina in East Port. Unfortunately the astronomical tide is expected to cause little flushing of the northern portions of the canals.
2.4.4 Meteorological Effects
Long period water level variations are commonly experienced along the southwest coast of Western Australia. Provost and Radok, 1979 studied these variations by removing the astronomical tide from water level records taken at Fremantle. The resultant residuals were water level fluctuations with periods of 1 to 20 days (typically 3 to 10 days) and 20 to 265 days (seasonal fluctuations). The 3 to 10 day fluctuations can be seen in the plot of residuals shown on figure 2.14.
Several factors are believed to cause these long period water level fluctuations. They include the following:
* response to high and low pressure synoptic features moving from west to east across the Indian Ocean and Australia at intervals of 3 to 10 days;
* wind and wave setup from storms moving across the coast at intervals of 3 to 10 days during winter;
* oscillations of the water over the shallow continental shelf.
In order to roughly gauge the effect of these long period fluctuations a typical height of 0.2 m and a period of 7 days will be taken. Because the incoming source water has a long time to mix with the canal water body, this mechanism is very efficient and the entire "meteorological tidal prism ratio" will be effective water exchange. This has been calculated to be an exchange about 10% of the canal volume and would occur about every 7 days. This is a persistent mechanism that would occur throughout the year. Consequently it is an important adjunct to the other mechanisms.
2.4.5 Groundwater Inflow
Canals and marina with significant inflows of less saline groundwater can experience significant water flushing due to density currents. As outlined in the Dames & Moore report in appendix 2, there is expected to be only small inflow of groundwater to the proposed canals. The estimated inflow rates for North Port and East Port are only 500 and 100 m3 day-' respectively. These are too small to cause a major water exchange mechanism. Nevertheless, they will add a minor contribution to the flushing of the canals.
10
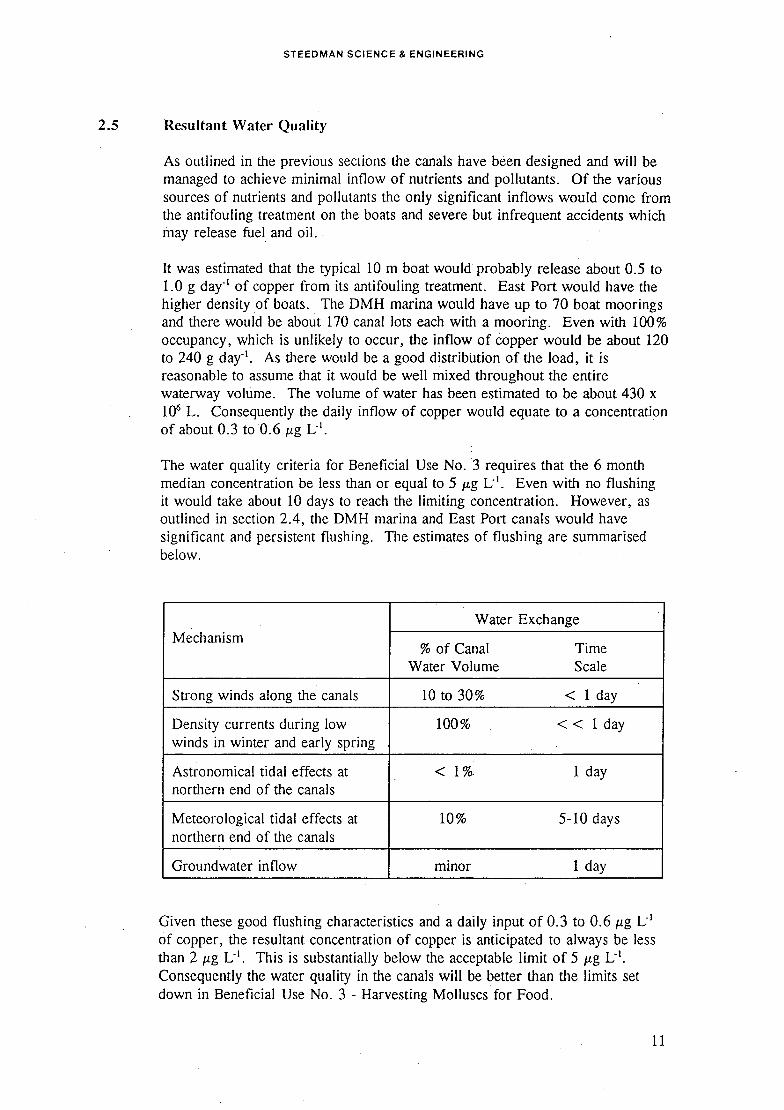
STEEDMAN SCIENCE & ENGINEERING
2.5 Resultant Water Quality
As outlined in the previous sections the canals have been designed and will be managed to achieve minimal inflow of nutrients and pollutants. Of the various sources of nutrients and pollutants the only significant inflows would come from the antifouling treatment on the boats and severe but infrequent accidents which may release fuel and oil.
It was estimated that the typical 10 m boat would probably release about 0.5 to 1.0 g day' of copper from its antifouling treatment. East Port would have the higher density of boats. The DMH marina would have up to 70 boat moorings and there would be about 170 canal lots each with a mooring. Even with 100% occupancy, which is unlikely to occur, the inflow of copper would be about 120 to 240 g day-'. As there would be a good distribution of the load, it is reasonable to assume that it would be well mixed throughout the entire waterway volume. The volume of water has been estimated to be about 430 x 106 L. Consequently the daily inflow of copper would equate to a concentration of about 0.3 to 0.6 g L-'.
The water quality criteria for Beneficial Use No. 3 requires that the 6 month median concentration be less than or equal to 5 ag U'. Even with no flushing it would take about 10 days to reach the limiting concentration. However, as outlined in section 2.4, the DMH marina and East Port canals would have significant and persistent flushing. The estimates of flushing are summarised below.
Water Exchange Mechanism
% of Canal Time Water Volume Scale
Strong winds along the canals 10 to 30% < 1 day
Density currents during low 100% < < 1 day winds in winter and early spring
Astronomical tidal effects at < 1 %. 1 day northern end of the canals
Meteorological tidal effects at 10% 5-10 days northern end of the canals
Groundwater inflow minor I day
Given these good flushing characteristics and a daily input of 0.3 to 0.6 tig L' of copper, the resultant concentration of copper is anticipated to always be less than 2 Ag L'. This is substantially below the acceptable limit of 5 tg U'. Consequently the water quality in the canals will be better than the limits set down in Beneficial Use No. 3 - Harvesting Molluscs for Food.
11

STEEDMAN SCIENCE & ENGINEERING
3. OCEAN SHORELINE STABILITY AND RECOMMENIED SET-BACK FOR DEVELOPMENT
3.1 Description of the Ocean Beaches
The ocean beaches either side of the Dawesville Channel are generally narrow sandy beaches between a rocky shore and well vegetated and high primary sand dunes. These dunes are generally 15 to 20 m high. About 1 km north of the Dawesville Channel is the sandy embayment at Avalon. This beach is backed with well vegetated sand dunes 6 to 8 m high. These features are shown on figure 3.1.
Various boreholes were drilled in the 1980's as part of the engineering investigations for the Dawesville Channel. Woods, 1992 reports on the relevant results of these boreholes together with additional boreholes drilled in June 1992 as part of this present study. Figures 3.2 and 3.3 have been taken from this report and show the geological cross sections through the common situation with the 15 to 20 m high dunes and a section through the sandy beach in the Avalon embayment. Both sections show the presence of significant pre-holocene limestone units. Figure 3.4 has photographs of the limestone (Unit 3) outcropping from the high dunes and the limestone (Unit 2) outcropping as the rocky shore.
The presence of these limestone units will significantly restrict any extensive erosion of this entire shoreline.
3.2 Historical Records
There are two reliable sources of historical record on the stability of the ocean shoreline at Dawesville. One source is the coastline movements plan, DMH 067-5-1 produced by DMH. This plan has been reproduced as figure 3.5. It shows the waterline and the vegetation line plotted from aerial photographs taken in January 1955 and December 1982. The plan shows the extensive nearshore reef along the coast near the Dawesville Channel. In addition it indicates that the coast about 800 in either side of the channel has been very stable over the 27 year period between photographs. The movement of the vegetation and water lines was virtually nil. This is undoubtedly due to the extensive presence of rock along this shore.
To the north, the sandy embayment at Avalon has experienced some movement. The main vegetation line has retreated about 10 m over the 27 years. However, the water line has advanced some 30 m over the same period. This accretion is confirmed by the presence in 1982 of light vegetation west of the water line of 1955. It would be possible that there had been periods of both erosion and accretion in this embayment over the 27 years. Significant erosion events such as Cyclone Alby in 1978 could have caused the retreat of the vegetation line between 1955 and 1982. Subsequent accretion could have occurred causing the westerly movement of the water line and the presence of the light vegetation in 1982.
12
STEEDMAN SCIENCE & ENGINEERING
The other source of information is the surveys of High Water Mark (HWM) taken in March 1909 and February 1992. The earlier survey was taken as part of the regional cadastral surveys. The later survey was taken by McMullen, Nolan and Partners as part of the present studies. The results of both HWM surveys are plotted on figure 3.6.
With HWM surveys there is only limited accuracy as the actual HWM is selected by the surveyor of the day. Given that there is likely to be seasonal variations in HWM, it is likely that the HWM lines are only accurate to ±10 m. Nevertheless, figure 3.6 does indicate that this coastline has been basically stable over the 83 years between surveys.
The indication is that most of the coastline had little movement or small accretion. The largest indicated retreat of the HWM is in the sandy embayment at Avalon. Here the two surveys indicate a retreat of 30 to 40 m. This is quite contradictory to the DMH shoreline movement plan.
Considering all of the historical evidence it would seem likely that this sandy embayment experiences cycles of erosion and accretion. The amount of fluctuation appears to be up to 30 to 40 m.
3.3 Longshore Drift
As part of the investigations into the Dawesville Channel, DMH studied the coastal processes along the coastline at Dawesville, refer DMH 1987. This work showed that the area is subjected to moderately high wave energy that is attenuated to some extent by offshore reefs.
The above study included a review of the following features along the coastline between Bunbury and Mandurali:
* analysis of aerial photographs;
* field inspections;
* DMH shoreline movement plans;
* detailed aerial photogrammetry;
* suspended sediment measurements;
* mathematical modelling of sediment movement along the shore;
* the behaviour of the Mandurah Ocean Entrance.
This work provided a range of estimates of the longshore drift at Dawesville. DMH adopted a value of 80,000 m3 year' for average conditions with the expectation that the actual amount may vary from season to season and year to year. Using this figure, DMH developed the concept of sand bypassing system
13

STEEDMAN SCIENCE & ENGINEERING
to avoid any siltation problems at the ocean entrance of the Dawesville Channel and maintain the down drift beaches to the north.
In the ERMP (Kinhill, 1988) it was stated that:
"As the bypassing system would simulate the natural passage of littoral drift, it is not anticipated that there would be adverse effects on beaches to the north and south of the channel entrance".
Most of the beaches north of the Dawesville Channel have a protective rocky base that can be exposed by winter storm activity. However, the sandy embayments, such as at Avalon, don't have such effective protection and are subject to a greater amount of seasonal fluctuation. These sandy embayments would quickly show the deleterious effects of ineffective or partial sand bypassing at the Dawesville Channel. To avoid such an adverse impact it is essential that the sand bypassing system at the Dawesville Channel be designed and operated in a way that bypasses all of the littoral drift.
3.4 Recommended Set-back to Buildings
The ocean foreshore has been studied and assessed to be generally quite stable. The historical evidence consistent of the following:
* shoreline movement plans prepared by DM11 based on aerial photographs taken in 1955 and 1982; and
* HWM surveys in 1909 and 1992.
Both data suggest a generally stable coastline but with some fluctuations in the embayment at Avalon. This is supported by the coastal engineering assessment and by the fact that a large proportion of the shoreline in question has natural protection in the form of extensive rock on the beach. The natural protection is in fact generally more extensive as the higher primary dunes have substantial areas of limestone to generally 2 to 2.5 m above the AHD and the lower dunes at the Avalon embayment have limestone to AHD only 40 to 60 m from HWM.
In the ERMP (Kinhill, 1988) it was stated that the littoral drift along the beach would be trapped and mechanically bypassed across the Dawesville Channel. Provided that the bypassing is suitably designed and managed, there is not expected to be adverse impacts on the beaches to the north of the Dawesville Channel. Naturally, there will be seasonal and interannual changes on the beaches. However, provided there are adequate buffers there would be no impact on buildings in the development.
14

STEEDMAN SCIENCE & ENGINEERING
In view of the above assessment, the proposed development line is generally 100 m behind the vegetation line. To the north of the proposed development, the setback has been proposed to marry up to the existing development at Avalon Beach. Nevertheless, the minimum building setback is 70 m which would be adequate on this coast.
15

STEEDMAN SCIENCE & ENGINEERING
4. ESTUARY SHORELINE AND RECOMMENDED RECLAMATION AREA
In the ERMP (Kinhill, 1988) there was significant emphasis placed on the recreational opportunities which would result from the construction of the Dawesville Channel. The developer wishes to pursue these opportunities to create the best possible water based recreation facilities.
Presently, there are only limited and modest swimming beaches in the district near the Dawesville Channel. The South West Development Authority, the Department of Planning and Urban Development and the City of Mandurah have jointly funded a study into the issue of recreational beaches in the area. With the increased population resulting from the proposed development there will be increased demand for good, safe swimming beaches. This demand would come from local residents and the numerous visitors that would be attracted to the area.
Unfortunately, much of the ocean coastline is not suitable for swimming because of the presence of rock and nearshore reefs coupled with reasonably high levels of wave energy. The best swimming beach would be the sandy embayment at Avalon. Realistically there is little scope for improving the remaining beaches. With this in mind, the estuary shoreline was examined. The estuary shoreline immediately north of the Dawesville Channel is ideal from planning and water quality points of view to create safe beaches for swimming, wading and windsurfing in addition to passive recreation.
As shown in figure 3.1 this area has substantial and very shallow sand and mud flats that widen to the north. The bathymetry of the area is shown on figure 4.1. To the north, the -0.5 m AHD contour is about 200 m from the current shoreline.
As part of the DMH engineering investigations into the physical effects of the Dawesville Channel, numerical modelling of the hydraulics was done. Some of the work is reported in Dufty, 1983. Figure 4.2 has been taken from this report. This clearly shows that the Dawesville Channel will have a significant impact on the daily tidal range experienced in the Harvey Estuary. The biggest changes will be experienced in the areas nearest to the channel.
During summer, it is expected that about half of the time the water level would be -0.2 m AHD or lower. There would also be many episodes when the water would be 0.5 m or more below AHD. This would result in the mud flats being totally exposed for 150 to 200 m. In addition there would be a further 200 to 500 m of mud flat with less than 0.5 m of water at low tide. These areas are shown on figure 4.3.
In order to create useable swimming beaches it is essential to reclaim some of the mud flat area. The proposed reclamation is shown on figure 4.4. The proposed reclamation widens to the north to follow the general shape of the mud flats. Such reclamation would create about 1 km of safe swimming beaches.
16

STEEDMAN SCIENCE & ENGINEERING
Naturally, it is important to ensure that the resultant beaches are stable. The wind patterns and fetches for wave generation are such that some seasonal fluctuation would be inevitable. Nevertheless, by providing two headlands and orientating the beaches to face the dominant southerly wave direction the beaches would be stable. These features are shown in figure 4.4. The two headlands could be made using small rocks or the pine pole walling commonly used by the Peel Inlet Management Authority.
The proposed reclamation would enable the creation of safe swimming beaches that could form an important part of the recreational facilities of the Dawesville Channel area.
17

STEEDMAN SCIENCE & ENGINEERING
S. RIVER FLOOD AND STORM SURGE LEVELS AND RECOMMENIED MINIMUM BUILDING LEVELS
5.1 Possible Greenhouse Effects
Although the so called "Greenhouse Effects" receive much publicity there is still no definitive evidence available that proves that the Greenhouse changes are occurring or will occur. There is certainly clear evidence that the amount of Carbon Dioxide and other "Greenhouse Gases" has increased dramatically over the last century and is continuing to rise. However, the link to global warming and associated sea level rise is still largely based on predictive numerical models of the global atmospheric and oceanic processes. These general circulation models are currently run on coarse grids and have rather rudimentary treatment of ice melting, cloud cover and albedo feed back links and impacts. Pielke, 1991 presents a good review of the scientific uncertainty with the present "Greenhouse" predictions.
Some of the possible impacts on the southwest coast of WA of Greenhouse Gas Warming could be:
* increase in cyclone frequency;
* increase in sea level; and
* change in position of synoptic features causing a changed wave climate.
The current knowledge about such possible changes is extremely limited. This coupled with the uncertainty about Global Warming, has lead to many organisations and authorities to take a low key approach to the issue until more definitive proof is available.
The Institution of Engineers, Australia 1991, put forward a draft document for assessing the impacts of possible climate change on coastal engineering projects. The paper is aimed at ensuring that a responsible review of the possible impacts is made. Designs should be robust and minimise future risk. This document does not say that climate change will happen but merely it may happen and engineering design should take this risk into consideration.
The issue of minimum building levels for the proposed developments is fundamentally linked to the mean sea level. The Institution of Engineers, Australia, 1991 presents three scenarios for possible (not necessarily probable) changes in the Global Mean Sea Level. These are reproduced in table 5.1. Considering the uncertainty of these scenarios, the design life of buildings and the frequency and impact of flood inundation, it is appropriate at this stage to make an allowance of 0.3 m for the affects of the possible climate change. This is believed to represent a reasonable compromise between present day costs and future risk.
Fl-

STEEDMAN SCIENCE & ENGINEERING
5.2 River Flood Levels
Public Works Department, 1984 presents calculations of river flood levels in the Peel/Harvey Estuary System with the existing catchment and ocean outlet conditions. The 100 year return period river flood level was calculated to be 1.6 m AHD in the estuary. One of the studies in the investigation of the Dawesville Channel examined the effect of the proposed channel on flood levels in the estuary. Dufty, 1983 calculated that the Dawesville Channel would reduce the 100 year return period river flood level in the estuary by 0.35 m.
Given the above, the appropriate minimum floor level for buildings near the Harvey Estuary end of the Dawesville Channel is estimated as follows:
Existing 100 year river flood level + 1.60 m AHD
Reduction due to Dawesville Channel - 0.35 m
Climate change allowance + 0.30 m
Freeboard for wind and wave set-up, seiching and wave run up, etc + 0.40 m
Recommended Minimum Floor Level = 1.95 m AHD
The recommended minimum floor level for permanent buildings near the Harvey Estuary, end of the Dawesville Channel is 2.0 m AHD.
During this extreme river flood event the ocean end of the Dawesville Channel would be controlled by the water level in the adjacent ocean and not the estuary level. The ocean water level is likely to be less than 1.0 m AHD.
5.3 Ocean Storm Surge
Given the proximity of Dawesville to Fremantle and the similar offshore bathymetry, it is reasonable to use the extensive storm surge record available at Fremantle for estimating the ocean storm surge versus return period at Dawesville.
The measured ocean water levels or "tides" consist of the sum of deterministic astronomical tides and non-tidal residuals due to other effects including long waves and storm surges. The astronomical tide can be decomposed using harmonic analysis techniques into tidal constituents, each possessing a distinct amplitude, frequency and phase.
Tide measurements have been taken by the Fremantle Port Authority for over 90 years, However, accurate tide data are presently only available from March 1967. These data are to an assured datum of 0.756 m below AHD.
Iv

STEEDMAN SCIENCE & ENGINEERING
Using the calculated tidal constituents, astronomical tidal predictions for Fremantle have been done by the Tidal Laboratory of the Flinders Institute for Atmospheric and Marine Sciences (FIAMS). The predicted astronomical tides have been subtracted from the total measured water levels to give "residual tides" which include any storm surges. These were supplied by FIAMS for the 17 year record 1967 to 1981 and 1984 to 1985. The 17 years of tide height residual for Fremantle Harbour represents combined wave setup, storm surge and the effect of any flooding due to the outflow of the Swan River into the harbour. The effect of flooding is believed to be minor due to the closeness of the harbour to the ocean. The 17 years record includes Tropical Cyclone Alby in April 1978 with an estimated surge of 1.0 m.
Extreme surges corresponding to return periods up to 100 years have been estimated using the technique of Petrauskas and Aagaard, 1971. Extreme values were obtained in the following way; a threshold of 0.5 m was selected and a total of 52 independent surge events exceeding this level were identified from the 17 year record. A Weibull distribution was then fitted to the exceedence probabilities associated with the 52 surge values.
Return period storm surge values are shown on table 5.2 and figure 5.1. It should be noted that these values do not include an allowance for wave runup which is dependent on the size of the wave and the nature and slope of the surface that the wave is impinging upon. Finally it is noted that generally, reliable extreme values can be obtained by extrapolation of the fitted distribution for return periods up to twice the length of the available record. Therefore, extreme values for 50 and 100 year return periods will be less certain than those for shorter return periods. The extreme surge for a 100 year return period is estimated to be 1. 1 m.
Based on the above, the appropriate minimum floor level for buildings near the ocean end of the Dawesville Channel is estimated as follows:
Mean Sea Level
+0.OmAHD
Climate change allowance +0.3m
100 year return period ocean surge + 1.1 m
Freeboard for wave runup, etc
+0.4m
Recommended Minimum Floor Level = 1.8 m AHD
The recommended minimum floor level for buildings near the ocean end of the Dawesville Channel is 1.8 m AHD. Given the fill that is available from the excavation of the Dawesville Channel and the natural topography, it would be reasonable to simply adopt a minimum floor level of 2.0 m AHD throughout the proposed development.
20

STEEDMAN SCIENCE & ENGINEERING
6. SUMMARY AND RECOMMENDATIONS
This study into the coastal and hydraulic engineering aspects of the proposed development can be summarised as follows:
6.1 Water Quality in the Proposed Canal Estates
* The existing tip south of the Dawesville Channel is a source of significant nutrients and pollutants. Because of the deleterious impact of the leachates from the tip, the South Port canal estate has been removed from the concept plans.
* The North Port and East Port canal estates have been designed and will be managed to ensure minimal inflow of nutrients and pollutants.
* The North Port and East Port canal estates will experience strong and persistent water mixing and exchange through the physical processes of:
- wind induced currents;
- density currents;
- astronomical tidal current; and
- meteorological tidal currents.
* The resultant water quality in the North Port and East Port canal estates is expected to be better than the requirements for Beneficial Use No. 3 - Harvesting Molluscs for Food.
6.2 Ocean Foreshore Stability and Recommended Set-Back for Development
* The ocean beaches near the proposed development have significant natural protection from erosion in the form of limestone beneath the sand dunes.
* The historical evidence of DMH shoreline movement plans and HWM surveys from 1909 and 1992 suggest that the coast is basically stable. Nevertheless, some fluctuations can be expected in the embayment at Avalon.
* DMH has made a commitment to mechanically bypassing the littoral drift across the Dawesville Channel to ensure that the northern beaches are not affected.
* The ocean coast adjacent to the proposed development has been assessed as being stable. The proposed development line is generally 100 in behind the vegetation line. To the north of the proposed development, the set-back to buildings is proposed to be 70 in. This is sufficient from a coastal
21

STEEDMAN SCIENCE & ENGINEERING
engineering point of view and will enable the new development to marry up to the existing development at Avalon.
6.3 Estuary Shoreline and Recommended Reclamation
* The ERMP for the Dawesville Channel highlighted that there would be opportunities for increased water related recreation once the channel was constructed.
* There are only limited safe swimming beaches in the district. The ocean beaches are restricted due to rock and nearshore reefs and the high wave energy regime.
* The estuary shoreline immediately north of the Dawesville Channel would be ideal for safe swimming beaches because of its location and anticipated water quality.
* This area of the estuary has extensive sand and mud flats that widen to the north.
* The construction of the Dawesville Channel will greatly affect the daily tidal range in the adjacent Harvey Estuary. Much of the mud flats will be dry or very shallow at low tide.
* In order to create safe swimming beaches it is recommended to reclaim and stabilise an area of the mud flats immediately north of the Dawesville Channel.
6.4 River Flood and Storm Surge Levels and Recommended Minimum Building Levels
* There is still some uncertainty about the so-called "Greenhouse Effect". No definitive evidence that it is occurring or will occur is presently available.
* An allowance of 0.3 rn for possible increase in sea level has been adopted for the design of the development.
* The hydraulic effect of the Dawesville Channel will be to reduce the 100 year river flood level at Dawesville by 0.35 m.
* The extreme ocean storm surge level will be experienced all along the Dawesville Channel.
* Considering all of these issues, it is recommended that the minimum finished floor level be set at 2.0 m AHD for the entire development.
22

STEEDMAN SCIENCE & ENGINEERING
7. REFERENCES
Bishop, J.M., 1979. A note on surface wind driven flow. Ocean Engineering Vol. 6, 273-284.
Department of Conservation and Environment, 1981. Water Quality Criteria for Marine and Estuarine Waters for WA. DCE Bulletin No. 103, April 1981.
DMH, 1987. Peel Inlet and Harvey Estuary Management Strategy, Dawesville Channel engineering investigations. Department of Marine & Harbours Report No. DMH 5/88, May 1987.
Dufty, P., 1983. Modelling of the proposed Harvey to ocean channel and its effect on estuary levels and Mandurah Channel flows. Environmental Dynamics, Centre for Water Research, University of Western Australia, Paper No. WP-83-008.
Falconer, Nece, et al, 1976. Plan form influence and flushing circulation in small harbours. Proc. 15th mt. Coastal Eng. Conf., 1976.
Falconer, R.A., 1980. Modelling of plan form influence on circulation in small harbours. Proc. 17th mt. Coastal Eng. Conf., 1976.
Institution of Engineers Australia, 1991. Climate Change and Coastal Engineering Draft No. 3. National Committee on Coastal and Ocean Engineering.
Kinhill, 1988. Peel Inlet and Harvey Estuary management strategy - Environmental Review and Management Programme - Stage 2. Prepared by Kinhill Engineers Ply Ltd for the Department of Agriculture and the Department of Marine & Harbours.
McKeehan, D.S., 1975. Water motion in closed-end canals. RSMAS, Technical Report 75-1. University of Miami, USA.
Petrauskas, C. and P.M. Aagaard, 1971. Extrapolation of historical storm data for estimating design wave heights. Soc. Pet. Engr. J., Trans. AIME, Vol. 251, pp. 23-37.
Pielk, R.A., 1991. Overlooked Scientific Issues in Assessing Hypothesized Greenhouse Gas Warming. Environmental Software, 1991, Vol. 6, No. 2.
Public Works Department of Western Australia, 1984. Murray River Flood Study. ISBN 0 7244 6909 5.
Public Works Department-NSW, 1987. Environmental Impact Statement for the Proposed Rozelle Bay Marina and Bicentennial Park - Stage 1, May 1987.
23
STEEDMAN SCIENCE & ENGINEERING
Steedman Limited, 1986. Directional wave measurements offshore Dawesville, Western Australia, September 5, 1985 of January 9, 1986. Steedman Limited Report R314 prepared for the Department of Marine and Harbours, May 12, 1986.
Steering Committee on Canal Developments, 1984. Recommendations for the Development of Canal Estates.
Turner, J.S., 1973. Buoyancy Effects in Fluids. Cambridge University Press.
Woods, P., 1992. Report on drilling in the coastal zone adjacent to Dawesville Channel. Report to Quilty Environmental Consultants by Peter J. Woods and Associates, June 1992.
Wu, J., 1973. Prediction of near surface drift currents from wind velocity. ASCE HY9, September 1973.
24

STEEDMAN SCIENCE & ENGINEERING
Tables

STEEDMAN SCIENCE & ENGINEERING
Tables
STEEDMAN SCIENCE & ENGINEERING
pH2 2.5 - 7.5
BOD 10,000 mg/L
COD 6,000 mg/L
Total Suspended Solids 500 mg/L'
Total Dissolved Salts 15,000 mg/L
Organochiorine Pesticides <0.002 mg/L'
Organophosphate Pesticides <0.02 mg/U
Total PAH <0.02 mg/U
Total Petroleum Hydrocarbons <2 mg/L'
Ammonia Nitrogen2 2,500 mg/U
Nitrate 370 mg/L'
Total Phosphorus 30 mg/L
Ortho Phosphate 20 mg/L
Alkalinity 3,000 mg/L
Total Hardness 3,500 mg/L
Copper, Lead2 15 mg/L
Zinc2 130 mg/L
Total Iron2 400 mg/L
Cadmium <0.1 mg/L
Total Chromium 3 mg/L
Dissolved Manganese <14 mg/L'
Arsenic <0.01 mg/U
Selenium <0.01 mg/L'
Mercury <0.1 mg/L'
Chloride 6,000 mg/L'
_Sulphide2 900mg/L'
Sodium 2,200 mg/U
Potassium 1,400 mg/L'
Calcium 1,000 mg/L'
Magnesium 250 mg/L'
Cyanide-free <0.1 mg/L
NOTES: 1. Based on available test data.
2. Exceeds primary sewer target concentrations.
Table 2.1 Estimated composition of leachate from the Mandurah tip (taken from the Dames and Moore report, appendix 2).
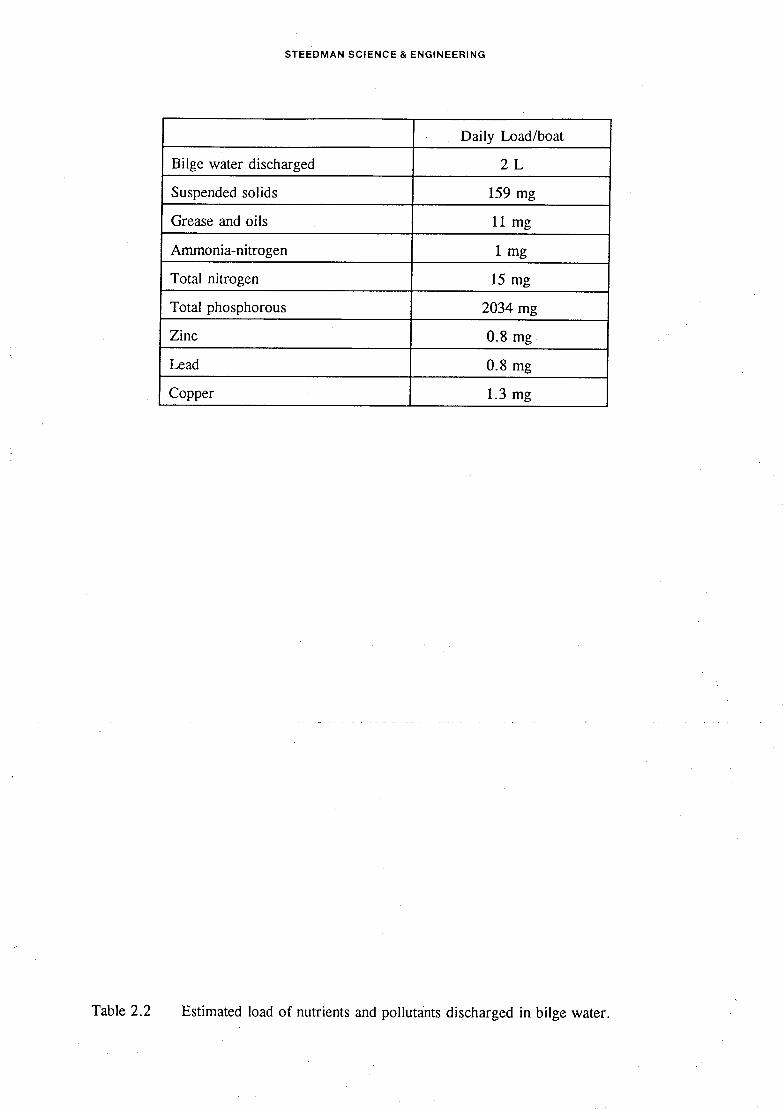
STEEDMAN SCIENCE & ENGINEERING
Daily Load/boat
Bilge water discharged 2 L
Suspended solids 159 mg
Grease and oils 11 mg
Ammonia-nitrogen 1 mg
Total nitrogen 15 mg
Total phosphorous 2034 mg
Zinc 0.8 mg
Lead 0.8 mg
Copper 1.3 mg
Table 2.2 Estimated load of nutrients and pollutants discharged in bilge water.
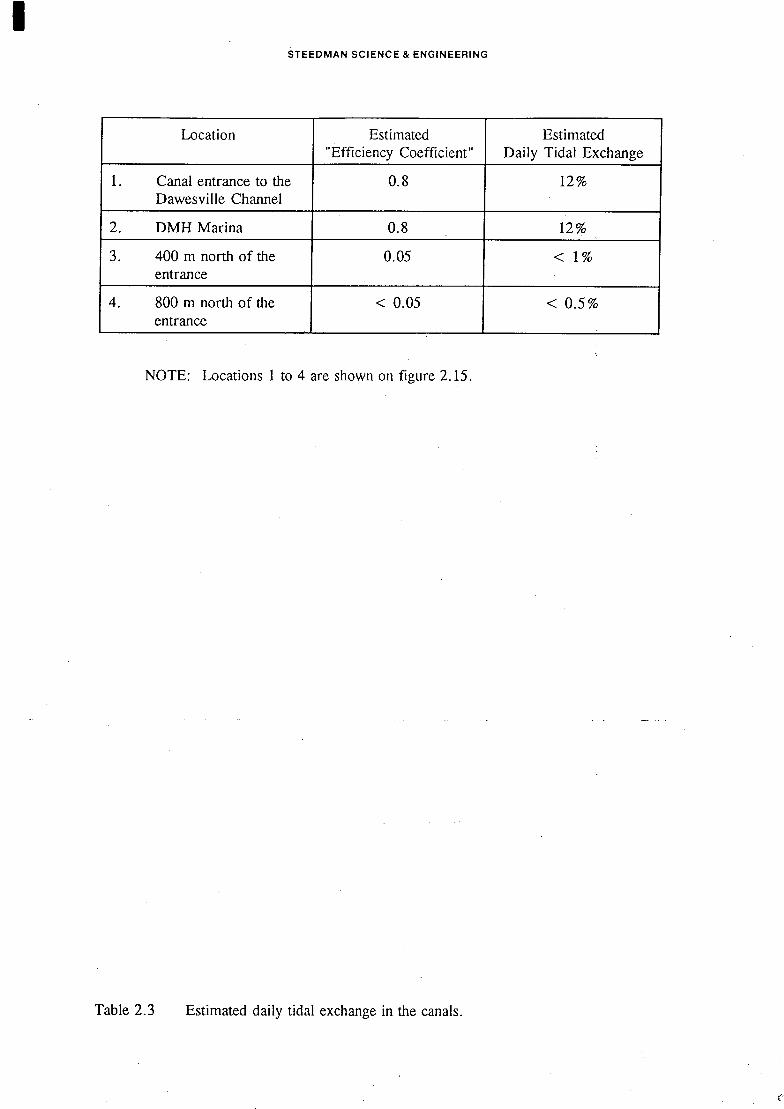
STEEDMAN SCIENCE & ENGINEERING
Location Estimated Estimated 'Efficiency Coefficient" Daily Tidal Exchange
Canal entrance to the 0.8 12% Dawesville Channel
DM11 Marina 0.8 12%
400 m north of the 0.05 < 1% entrance
800mnorth of the <0.05 <0.5% entrance
NOTE: Locations 1 to 4 are shown on figure 2.15.
Table 2.3 Estimated daily tidal exchange in the canals.

STEEDMAN SCIENCE & ENGINEERING
Year 2030 (m)
2050 (m)
2100 (m)
Low Scenario 0.10 0.16 0.32
Medium Scenario 0.20 0.32 0.68
High Scenario 0.32 0.51 1.13
Table 5.1 Scenarios for possible rise in global sea levels due to possible climate change (taken from Institution of Engineers, Australia, 1991).
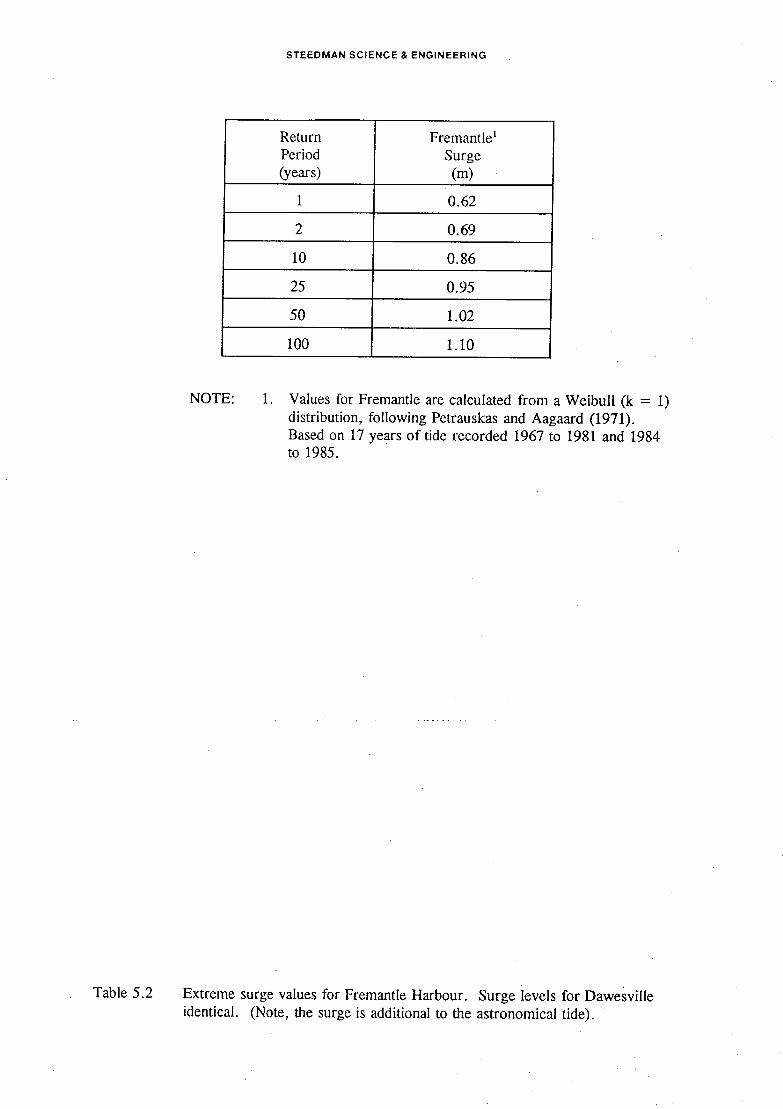
STEEDMAN SCIENCE & ENGINEERING
Return Period (years)
Fremantle' Surge (m)
1 0.62
2 0.69
10 0.86
25 0.95
50 1.02
100 1.10
NOTE: 1. Values for Fremantle are calculated from a Weibull (k = 1) distribution, following Petrauskas and Aagaard (1971). Based on 17 years of tide recorded 1967 to 1981 and 1984 to 1985.
Table 5.2 Extreme surge values for Fremantle Harbour. Surge levels for Dawesville identical. (Note, the surge is additional to the astronomical tide).

STEEDMAN SCIENCE & ENGINEERING
Figures

STEEDMAN SCIENCE & ENGINEERING
/ 1 - /
/ ' / ' .150
22 / N 20 ( urayii's+
8
24 23 16
cS
15 (Co
(j s 2: 2
17 Robw Pt rM
Ma nduh
19 +
16
Surveyed 16
19 Reefs
13
0 S ID
Scale (km)
Figure 1.1 Location map.

WJ ¼
p •4
- -. ;:.., : '-'- -.• ••.
; -
J .' / •0
-•-- . - --'- .
-:

\.J
If
/
I 'a'
All
5.. 1 . - ." -n. , Ø5• .%• S -
L-7
Vv
- -: - •-1•/-;'\ ..-•• - 1,
•J ?%
-'-4.
- ,

STEEDMAN SCIENCE & ENGINEERING
WIND V
n
Us 3
Figure 2.3 Wind induced currents in a closed end canal.
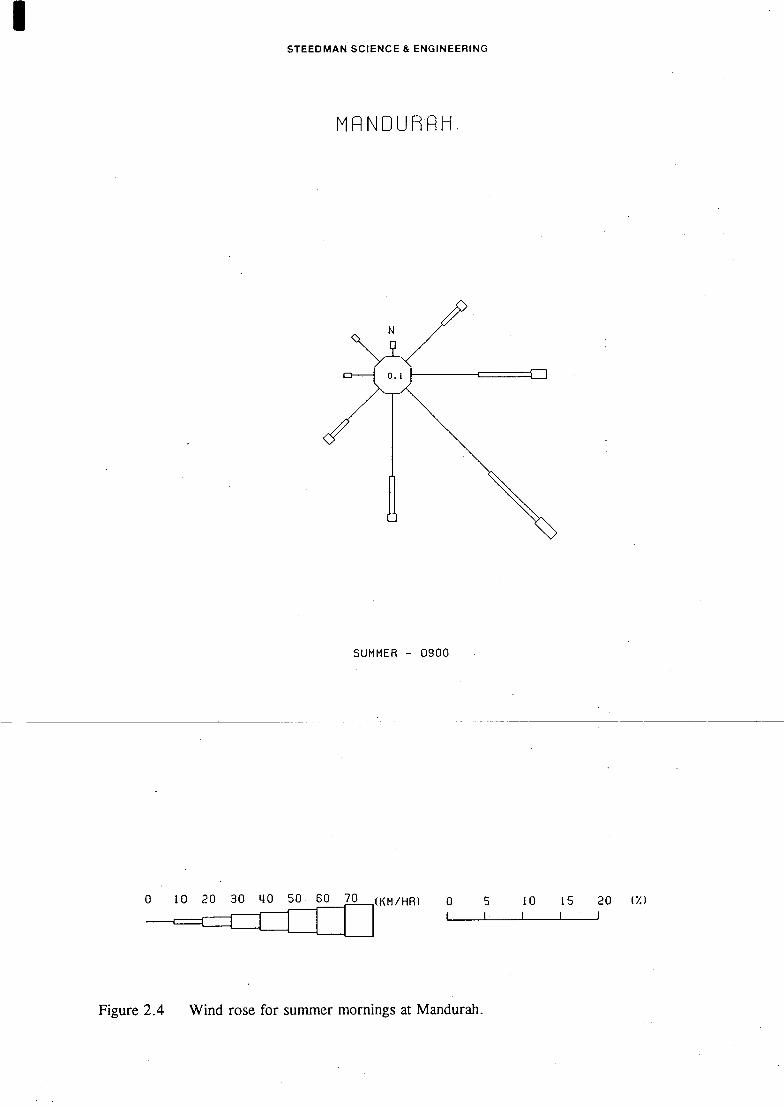
STEEDMAN SCIENCE & ENGINEERING
MPNDUHPH
SUMMER - 0900
0 10 20 30 qO 50 60 70 (hM/HR) 0 5 10 15 20 (X)
I I I I
Figure 2.4 Wind rose for summer mornings at Mandurah.

STEEDMAN SCIENCE & ENGINEERING
MANDUHAEI
SUMMER - 1500
20 30 qO 50 60 70 (KM/HA) 0 5 10 15 20 (7.) I I I 1
Figure 2.5 Wind rose for summer afternoons at Mandurah.
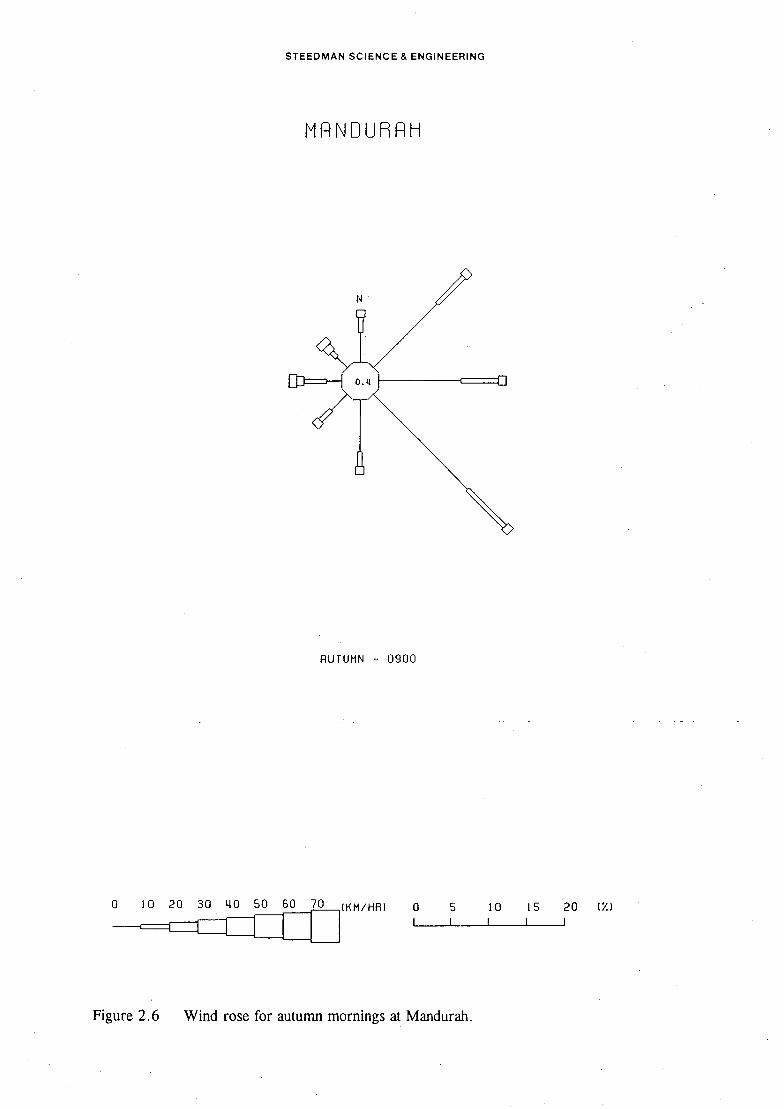
STEEDMAN SCIENCE & ENGINEERING
MRNDUHRH
RUTUMN -. 0900
0 10 20 30 40 50 60 70 (IftI/HA) 0 5 10 15 20 (ZI 11111
Figure 2.6 Wind rose for autumn mornings at Mandurah.

STEEDMAN SCIENCE & ENGINEERING
MANDUHAH
RUTUMN - 1500
0 10 20 30 40 50 60 70 (KM/HA) 0 5 10 15 20 (7.)
------- IEI= I I I
Figure 2.7 Wind rose for autumn afternoons at Mandurah.

STEEDMAN SCIENCE & ENGINEERING
MANDUHAhI
WINTER - 0900
0 10 20 30 40 SO 60 70 ucM/Hrn 0 5 10 IS 20 (X) 11111
Figure 2.8 Wind rose for winter mornings at Mandurah.

STEEDMAN SCIENCE & ENGINEERING
MANDURPH
WINTEFI - 1500
40 50 60 70 (IM/HA) 0 S 10 15 20 (7.)
ELILII I I I I
Figure 2.9 Wind rose for winter afternoons at Mandurah.

STEEDMAN SCIENCE & ENGINEERING
MRNDUHPH
SPf1NG - 0900
20 30 143 50 so 70 (1KM/HA) 0 5 10 15 20 IX)
Figure 2.10 Wind rose for spring mornings at Mandurah.

STEEDMAN SCIENCE & ENGINEERING
MANDUHAH
SPRING - 1500
0 10 20 30 40 50 60 70 (KM/FIR) 0 5 10 15 20 (Z)
I I I I
Figure 2.11 Wind rose for spring afternoons at Mandurah.
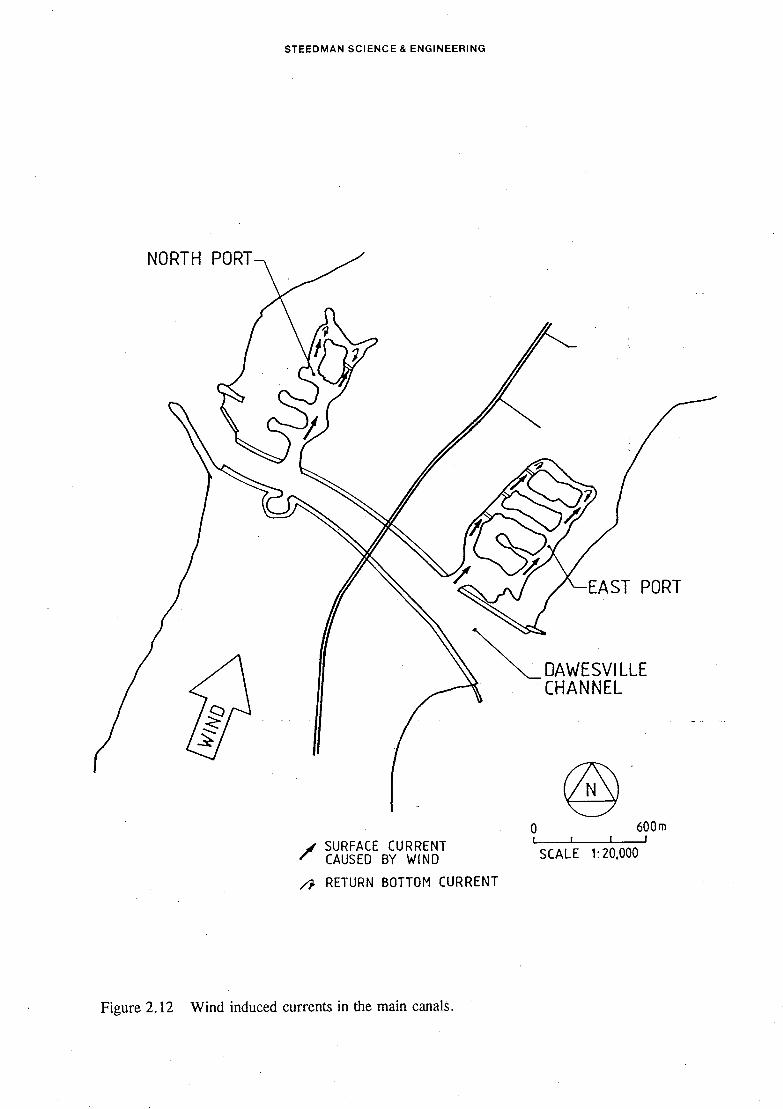
STEEDMAN SCIENCE & ENGINEERING
0 600rn
SURFACE CURRENT I I CAUSED BY WtNO SCALE 1:20,000
,-. RETURN BOTTOM CURRENT
Figure 2.12 Wind induced currents in the main canals.

STEEDMAN SCIENCE & ENGINEERING
Lf 01
Figure 2.13 Schematic diagram of the action of density currents.

171 UQ
6 CD
0
0 CD
0
CD
CD
CD
0
C..,
CD 0
60 '10 20
.00 -.20 - .60 - • 60 - 60
60 '10
.20
.00 -.20 -.60
60 60
60 40
.20 00
- 20 40
- .60 - .60
C') —I m m a
> z Cl) C) m z C) m Qo Ph 2 C) z Ph Ph
2 C)

STEEDMAN SCIENCE & ENGINEERING
i___ I I
SCALE 1:20000
Figure 2.15 Position of locations 1to 4 from table 2.3.


STEEDMAN SCIENCE & ENGINEERING
DUNE
I I PEE HOLOCENE LIMESTONE I
-50
I 50 TOO 1S0
V E SE TAT IC N LINE
BEACFI_S\
PSL /
DUNE
UNIT /HOLOCENE SANODES
PRE HOLOCENE LIMESTONE
iNn
16
14
12
-10
N
6
0 50 100 15Dm
Figure 3.2 Geological sections through the beach backed by high dunes.

STEEDMAN SCIENCE & ENGINEERING
LOW DUNE
VEGETATION
j
POE HOLOCENE LIMESTONE I
UNIT 2
- POE HOLOCENE LIMESTONE
12 50 100 10
Figure 3.3 Geological section through the sandy embayment at Avalon.

STEEDMAN SCIENCE & ENGINEERING
Figure 3.4 Photographs of limestone outcropping from the dunes and beaches near the Dawesville Channel.

OCEAN
+ -. •l-. H-- -
o
Pftef
PC
INDIAN
( \
FLORIDA
---------------
PCI
L
BOUVARO
jj- . - RI
6
/ t !L± \ / I
RUBBISh - DUMP I
- - I DAWESVILLE CHANN( ADIIEO BY
+ + - - ~ +
....1
I
W 0 200 3 . .../ -
SCALEOFIIETR€S / -I-
1I5000I - -- + +_ ' - 7
REFERENCE - -,
WATER AND VEGE1ATION LINES DECEMBER 1982 .......... .. - ' JANUARY 1955..............-
EXTENT OFSANOORIFTS DEC EMBER 1962..................-
ROAOCENTRELINES ..... " - - TRACKS.................................................- ._ /
ORIV0
BUILDINGS, PHOTO CONTROL POINTS.................. PC2 /7 .
\\
FALCON
ni
-1-- -- 373000
RECORDS SURVEY & GRAFTING NOTES . - SCALE
l.II**IA *AI.IU OAOE
'' Y-'" CEllAR ITIEIOT
MARINE & HARBOURS - WESTERN AUSTRALIA ARCHr :
ReSERVED AT •IR 1100.....r r° ROBERT POINT (MANDURAH) TO BUNBURY -
PLMC P.W.D.- 55010 OAL WATER £00 VEGETATION lIlIES . BREAKWATER nao,.c10
ITT R5 ND TtOTVEO TR00000A.0,EVRICAU.T. - FOR lAYOUT OF SHEETS REFER 067-I--I DATUM I- '- .- '-. ! •' 005111W1 00*00 RAVE OOED RESO1!PT000 . C APPROVED j-
11A VMI~
CADDADUP 0
- . I0ZReTAL AOSVRDI.IDV C/P 0010 0/Sb 00 /0.0 -
'l/
A SUHVI OS - - 0010 SIZE
Al IS/F 0(01
f z '' I
FILE 00
DRAWING I&JMBER 067 5 1
- . - -. . Figure 3.5 DM11 shoreline movement plan for the area near the Dawesville Channel.

'I
752
SOURCE: MCMULLEN NOLAN & PARTNERS
1/ + I'! /
/802
2
STEEDMAN SCIENCE & ENGINEERING
100 200 300 400 500m
'SCALE 1:10,000
HIGH WATER MARK 7
MARCH 1909
+ HIGH WATER MARK FEBRUARY 1992
752
+
Figure 3.6 Comparison of High Water Mark Surveys taken in March 1909 and June 1992.
\..
1130
STEEDMAN SCIENCE & ENGINEERING
O4WESV!LLE CI-Ii% 7 / ESTUARY CONTOURS
IPNNEL ,.J SOURCE D.M.H - MAY 1992
pup 0 100 200 300 400 500m
SCALE 1: 10,000 x
DATUM A.H.D.
Figure 4.1 Bathymetry of the Harvey Estuary near the Dawesville Channel.

STEEDMAN SCIENCE & ENGINEERING
li-I
SUMMER WATER LEVELS MEASURED IN THE HARVEY ESTUARY BEFORE CONSTRUCTION OF THE OAWESVILLE CHANNEL
/l II t11
'I
ca I' I I tI I '
w > ij I v u \J Li _1 l l LI 11 1
LLJ a LI
PREOlCTED SUMMER WATER LEVELS IN THE HARVEY ESTUARY WITH THE DAWESVILLE CHANNEL
CD
0 2 4 6 8 10 12 14
TIME (DAYS)
SOURCE : DUFTY. 1983
Figure 4.2 Summer water levels in the Harvey Estuary with and without the Dawesville Channel.

ILI
STEEDMAN SCIENCE & ENGINEERING
I:
DAWESVILLE ESTUARY CONTOURS C'' ' 'NEL / 7 SOURCE D.M.H
I MAY 1992 -.- / I I 0
2 -\-. - -
I
K
\1
DRYAT —OSrnAHD
05m DEEP AT — 0-Sm AHD
0 100 200 300 400 SOOrn I I I I
SCALE 1:10000 DATUM A.H.D.
Figure 4.3 Extent of shallow water and drying mud flats at low tide after the construction of the Dawesville Channel.
STEEDMAN SCIENCE & ENGINEERING
EAST PORT
HEADLAND TO STABILIZE BEACHES
(_62
/
rOPOSED SWIMMING BEACHES & EXTENT OF RECLAMATION
----I--
BA WESVILL E
CHANNEL / ESTUARY CONTOURS
SOURCE D.M.H. MAY1992
0 100 200 300 400 500m I 1 4 4
SCALE 1: 10000 DATUM A.H.D.
Figure 4.4 Proposed extent of reclamation of the mud flats north of the Dawesville Channel.

0. q
0.2
1.2
1.0
0.8 tLJ. ci
(I)
CC 0.6
907.
70 Z
70X
907.
STEEDMAN SCIENCE & ENGINEERING
EXTREME RNRLYSIS
PETRRUSKIRS 4 RRGR1RD METHOD
FPR 1967 TO 1985
1 2 10 25 50 100 RETURN PERIOD (IRS)
Figure 5.1 Storm surge values, Fremantle, based on 17 years of tide residuals from Fremantle Harbour tide gauge over the periods 1967 to 1981 and 1984 to 1985.

STEEDMAN SCIENCE & ENGINEERING
Appendices

STEEDMAN SCIENCE & ENGINEERING
Appendix 1
Water Quality Criteria for
Beneficial Uses Nos. 1 and 3
taken from Bulletin 103, Department of Conservation and Environment, 1981.

STEEDMAN SCIENCE & ENGINEERING
WATER QUALITY CRITERIA
for
MARINE AND ESTUARENE WATERS OF WESTERN AUSTRALIA
REPORT
of the
MARINE AND ESTUARINE WATER QUALITY CRITERIA
WORKING GROUP
established by the
-- - ENVIPNMENTAL PROTECTION AUTHORITY
April, 1981
Department of
Conservation and Environment
Western Australia
Bulletin No. 103

- 10 -
STEEDMAN SCIENCE & ENGINEERING
BENEFICIAL USE NO. 1
DIRECT CONTACT RECREATION
The criteria in Schedule 1 are intended to protect marine and estuarine waters for direct contact recreation including bathing, diving, water-skiing and other activities in which the human body may come into direct contact with the water to the point of complete immersion-
The waters should conform to the general aesthetic criteria for marine and estuarine waters- They should also be protected against loads of nutrients and other biostimulantS capable of causing excessive or -
nuisance growths of algae or other aquatic plants
It should be pointed out that for a complete understanding of the criteria in Schedule 1, especially as far as 'health investigation levels are con-cerned, the relevant passages in the Introduction should be read (see
pages 3 and 4).

-11- STEEDMAN SCIENCE & ENGINEERING
cr-urrr1T3' 1
MARINE AND ESTUARINE WATER QUALITY CRITERIA FOR DIRECT CONTACT RECREATION
Parameter Criterion Source
Aesthetic As on page 9 USA EPA
Considerations (Comp)
Physical Hazards The water in designated bathing and NH&MRC swimming areas should be free of sub-merged bodies and other subsurface hazards.
Light Penetration A Secchi disc should be. visible to a NH&MRC depth of 2 m except in "learn to swim" areas where a Secchi disc should be visible on the bottom.
pH 6.5 - 8.5, except for waters with a low NH&MRC buffer capacity where a range of pH between 5.0 and 9.0 may be tolerated.
Chemicals and The waters should not contain chemicals NH&MRC
Biological and biological materials in such
Materials concentrations as to be irritating to the skin or mucous membranes of the human body upon brief immersion. In addition, they should not contain chemicals and biological materials in such concentrations as to be toxic to man if small quantities are ingested.
Faecal Coliforms A health investigation level for water in WG open and unenclosed bathing and swimming areas may be established on the basis of a minimum of five samples taken over not more than a 30-day period under conditions representative of the water quality to which users are commonly exposed, and is reached either when the median reading of such samples exceeds 150 organisms/lOO mL, or when more than 20% of the total samples during this period exceed 500/100 mL. For this purpose samples during the wettest quarterly interval may be omitted if users are not commonly exposed during that interval.
The water in designated bathing and swimming areas in which the median reading ordinarily exceeds 50/100 mL and/or in which more than 20% of samples ordinarily exceed 150/100 mL, should be protected against any degradation in that quality from a new or increased source of pollution. water of higher quality should be similarly protected against degrad- ation beyond the levels mentioned in this paragraph.

- 12 -
STEEDMAN SCIENCE & ENGINEERING
Parameter Criterion Source
Faecal Material The water in designated bathing and WG
swimming areas should be protected against direct contamination with fresh faecal material of human or domesticated animal origin
Radioactive The waters should not contain radio- DH&MS
Substances active substances in such concentrat- ions as to be deleterious to man if small quantities are ingested.
- 2± -
SCHEDULE 3 STEEDMAN SCIENCE & ENGINEERING
MARINE AND ESTUARINE WATER QUALITY CRITERIA FOR HARVESTING OF
MOLLUSCS FOR FOOD
Parameter Criterion
Aesthetic As on page 9.
Considerations
Floating and No materials should be present which Submerged Litter directly or indirectly have an
adverse effect upon molluscs or which interfere with normal fishing or harvesting practices or damage fishing equipment.
Barriers No barrier should be constructed, sub- stances added nor alterations made to the marine or estuarine environment which will prevent the normal movement and migratory patterns of molluscs to the detriment of their populations or cause changes in the normal water movement pattern which will lead to adverse effects upon them.
Light The combined effects of turbidity and
Attenuation colour should not reduce the depth of the compensation point for photo-synthetic activity by more than 10% from the seasonal background value.
Settleable Unnatural inputs of settleable material
Matter should not cause the formation of deposits which are harmful to aquatic organisms. -
Suspended Solids Upper limit of. 80 mg/L and depth of compensation point for
- photosynthetic activity should not be reduced by more than 10% from the natural seasonal norm.
Temperature The maximum acceptable variation in the weekly average temperature due to artifical sources is 10C for waters north and 20C for waters south of latitude 270S during all seasons of the year, provided that no single value exceeds the highest summer maximum recorded over the previous five years inclusive.
Source
USA EPA (Comp)
WG
WG
USA EPA
VIC EPA (M)
Hart/USA EPA
USA EPA
Salinity Unnatural influences should not change the seasonal mean salinity, measured preferably over not less than five years, by more than 0.25 of the standard deviation, nor
change, the salinity beyond the range recorded
WG/VIC
EPA (G)

ZZ - -
STEEDMAN SCIENCE & ENGINEERING Parameter Criterion Source
Ionic Ratio The ratio of major ions should not be WG altered such that this beneficial use is affected.
pH 6.5-8.5 and no change in excess USA EPA/ of 0.2 units from normal. For WG/1-Iart waters of salinity below 5 000 mg/L (50/oo) the pH range should be 6.0 to 9.0 and no change in excess of 0.5 units.
Dissolved Oxygen Not to fall below 4.0 mL/L (5.7 mg/L) for WG more than 6 consecutive hours, and never to fall below 3.5 mL/L (5.0 mg/L)
Arsenic 6 month median not to exceed 8 ig/L. Calif (K&S) No more than 20 per cent of readings to exceed 80 pg/L. No single reading to exceed 500pg/L.
Cadmium 6 month median not to exceed 3 lig/L. Calif (K&S) No single reading to exceed 8 pg/L.
Chromium 6 month median not to exceed 2 pg/L. Calif (K&S) (total) No single reading to exceed 7 ig/L.
Copper 6 month median not to exceed 5 pg/L. Calif (K&S) No single reading to exceed 40 pg/L.
Lead 6 month median not to exceed 8 pg/L. Calif (K&S) No more than 20 per cent of readings to exceed 80 pg/L. No single reading to exceed 200 g/L.
Mercury 6 month median not to exceed 0.14 lig/L. Calif (K&S) No more than 20 per cent of readings to exceed 1.4 pg/L. No single reading to exceed 3 jg/L.
Nickel 6 month median not to exceed 20 pg/L. Calif (K&S) No more than 20 per cent of readings to exceed 200 pg/L. No single reading to exceed 450 pg/L.
Silver 6 month median not to exceed 0.45 pg/L. Calif (K&S) No more than 20 per cent of readings to exceed 4.5 pg/L. No single reading to exceed 10 pg/L.

- 23 - STEEDMAN SCIENCE & ENGINEERING
Parameter Criterion Source
Zinc 6 month median not to exceed 20 pg/L. Calif (K&S) No single reading to exceed 200 pg/L.
Aidrin Not to exceed 0.003 pg/L USA EPA
Azinphosmethyl Not to exceed 0.01 pg/L USA EPA
Carnphechlor Not to exceed 0.005 pg/L USA EPA
Chiordane Not to exceed 0.004 jig/L USA EPA
2,4-D Not to exceed 4 pg/L NAS/NAE
DDT Not to exceed 0.001 pg/L USA EPA
Dieldrin Not to exceed 0.003 pg/L USA EPA
Endosulfan Not to exceed 0.001 pg/L USA EPA
Endrin Not to exceed 0.004 pg/L USA EPA
Heptachior Not to exceed 0.001 pg/L USA EPA
Lindane Not to exceed 0.004 pg/L USA EPA
Maldison Not to exceed 0.1 pg/L USA EPA
Methoxychlor Not to exceed 0.03 jig/L USA EPA
Parathion Not to exceed 0.04 pg/L USA EPA
Other Pesticides Not to exceed 0.01 of the 96-hour WG
LC50 value for the selected test - species.
Ammonia 6 month median not to exceed 600 pg/L. Calif (K&S)
(expressed as No single reading to exceed 2000 pg/L.
Nitrogen)
Chlorine (Total 6 month median not to exceed 2 pg/L. Calif (K&S)
Residual) No single reading to exceed 10 pg/L.
Cyanide 6 month median not to exceed 5 pg/L. Calif (K&S)
No single reading to exceed 10 pg/L.
Fluoride 6 month median not to exceed 2 u/L. WG
No single reading to exceed 10 mg/L.
Hydrogen Not to exceed 2 pg/L USA EPA
Suiphide
I -24-
STEEDMAN SCIENCE & ENGINEERING
Parameter Criterion
Total Not to exceed 10 pg/L Hydrocarbons
Aromatic Not to exceed 1 pg/L
Hydrocarbons
Pheriolic 6 month median not to exceed 300 pg/L.
Compounds
Polychlorinated Not to exceed 0.001 pg/L
Biphenyls (PCB)
Surfactants Not to exceed 0.01 of the 96-hour LC50 value for the test organisms.
Other Toxic No material should be present in an
Substances amount exceeding 0.01 of the 96-hour LC50 value for the test organism.
Netals In addition to the criteria set out
Accumulation above for individual metals in water, a health investigation level may be established for any given metal on the basis of samples of the edible portion of a particular mollusc species, and is reached when more than 10% of such samples exceed the maximum permissible level prescribed for that metal in the Food and Drug Regulations, 1961, as amended, made under the Health Act, 1911-1978.
Tainting Agents Taste- or odour-producing substances should not be present at concentrations that lead to undesirahletastes or odours in fish flesh or other edible products of aquatic origin.
For examples of levels and types of compounds known to taint aquatic organisms see Table 1. These are not intended to be criteria.
wG
WG
Calif. (K&S)
USA EPA
WG
DH&MS
Calif.
Radioactive Radioactive substances should not be Calif.
Substances present in concentrations that are deleterious to human, plant, animal, or aquatic life or that result in the accumulation of radioactive substances in the food web to an extent that presents a hazard to human, plant, animal, or aquatic life.

- 25 -
STEEDMAN SCIENCE & ENGINEERING
Parameter Criterion Source
Nutrients and The loads of nutrients and other VIC EPA (M)
other biostimulantS to receiving waters
BiostimularitS should not cause excessive or nuisance growths of algae or other aquatic plants or deleterious reductions in dissolved oxygen concentrations in those waters.
Faecal A health investigation level for NSSP/Maifle
Coliforms water in areas designated for mollusc harvesting may be established on the basis of a minimum of five samples taken over not more than a 30-day period under circumstances in which faecal contaminatior is most probable, and is reached either when the median reading of such samples exceeds 15 organismS/100 mL, or when more than 20% of such samples exceed 50/100 mL.
Faecai The water in areas designated for DH&MS
Material moliusc harvesting should be protected against direct contamination with fresh faecal material of human or domesticated
animal origin-

STEEDMAN SCIENCE & ENGINEERING
Appendix 2
Groundwater report by Dames and Moore.
I
STEEDMAN SCIENCE & ENGINEERING
DAMES & MOORE SOUTH SHORE CENTRE
85 THE ESPLAT'JADE J SOUTH PERTH, W.A. 6151
rETEPl1oNE(o9) 37 8055 FACSIMILE:(09) 367 6780
FACSiMIlE TRANSM[SSION SHEET
NO. OF PAGES L4
TO: Mick Rogers FAX NO, 387 6686
FROM: Alan Deeney JOB NO. 09074-074
DATE: 18 May 1992
SUBJECT: DAt1RSVTLLE CHANNEL - WANNANUP DEVELOPMENT
This facsimile transmission is intended for the persons named above. If you are not one of those persons we do not waive any privilege attaching to this facsimile transmission, and any disclosure or use of this transmission by you Is prohibited. If you receive this transmission in error please notify the sender immediately and return the original transmission by certified mail.
Further to your fax of April 1 1992, our estimates of the groundwater inflow into each canal., the expected quality of groundwater and likely composition of the leachate frorii the the rubbish tip are outlined below. A wide range of aquifer parameter values were obtained from limited investigations in the area and the appropriate values for the groundwater inflow analyses have been selected on the basis of the available information. Due to the liniited data avafl.abie, the results should therefore only be used as an indication of the order of magnitude of groundwater inflow into the can1s,
1. Groundwater Inflow
Two methods w e r e used to estimate the volume of groundwater flow into the cana.ts. The first (a) is based on rainfal.l recharge to Ihe shallow aquifer. The second method (b) is based on groundwater throughfiow calculations.
(a) Using rainfa]l recharge
Assumptions used:
o 55% of residential areas are paved (ic, housing, roads ,driveways, etc);

STEEDMAN SCIENCE & ENGINEERING
recharge from public open space and lawns i 15%; recharge from paved areas (residences and roads) is 50%.; and an annual rainfall of 897mm
Based on the above assumptions, the annual groundwator inflo(v into each canal, is estimated at:
Southern canal: .150 000niS North western canal: 1000m Eastern canal: 44 500m
(14 Using groundwater throughf'1ow
Darcy's equation is used to deterxniz,e the groundwater throughfiow into each canal. Aquifer parameters based on earlier work completed by Dames & Moore were used. The following parameters were appl:ied:
use of winter water table gradients prior to development; average permeability- of 100n/d for limestone strata; average permeability of 40m/d for sand strata; and effective aquifer, thickness of 2.5m
The fo]iowing estimated annual groundw&ir throughflow: were obtained:
Southern canal: 170 000zn3 North-western canal: 175 000rn3 Eastern canal: 40 000m
The estimated groundwater inflows into each canal based on the two methods are within 12% of each other.
Groundwater Quality
Groundwater quality based on field data indicate that to a depth of up to Sm from the water table, the groundwater is generally fresh to brackish(1000mg/i, to 5000rng/L). Below this fresh to brackish groundwater lens, the groundwater is generally saline (5000mg/L up to 36000ing/L). Inflows into the canals will, be from the upper fresh groundwater lens.
Groundwater Flow from Rubbish Tip to Canal
Darcy's equation was used to determine the groundwater throughflow from the tip ty the southern canal. An estimated flowrai.e of 76 000 rn/yr is esti.matedestimated
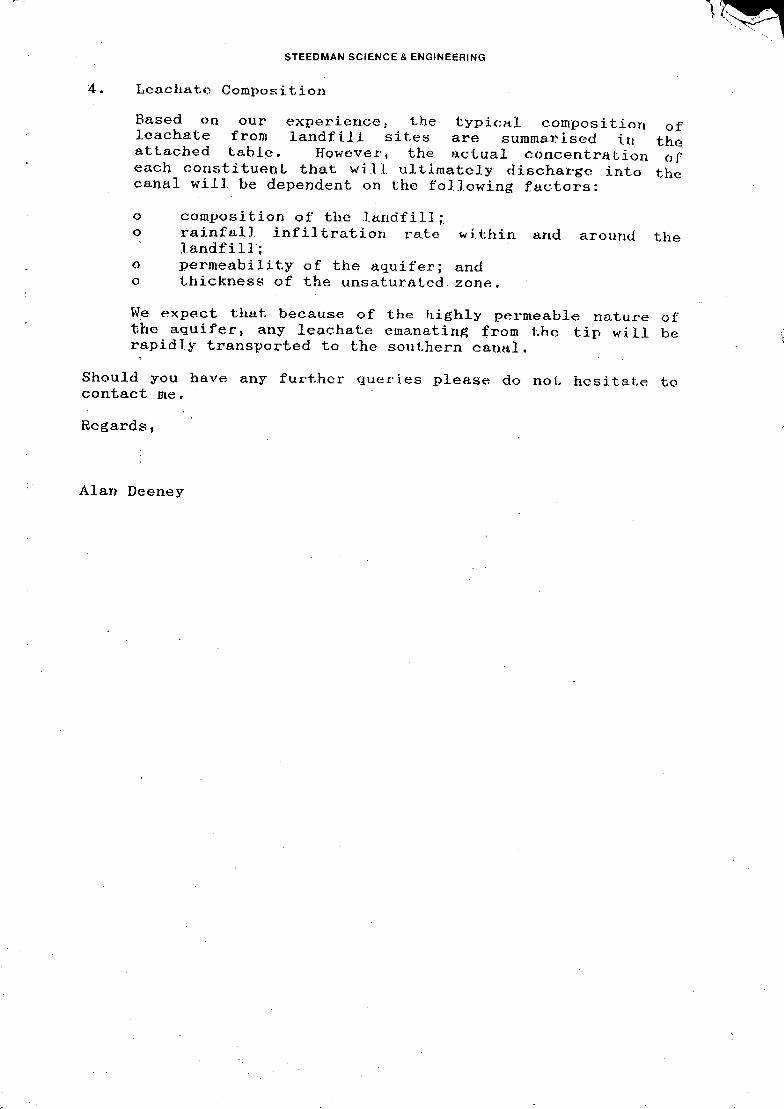
STEEDMAN SCIENCE & ENGINEERING
4,. Leachate Composition
Based on our experience, the typical COmposition of leachate from landfill sites are summarised ira the attached table. However, the actual eoncentraLjon of each constituaL that wi.0 ultimately discharge into the canal will, be dependent on the following factors:
composition of the landfill; rainfall infiltration rate vi.thin and around the landfill; permeability- of the aquifer; and thickness of the unsaturated. zone.
We expect that because of the highl' permeable nature of the aquifer, any leachate emanating from Ehe. tip will be rapidly transported to the southern canal.
Should you have any further queries please do noL hesitate to contact nte.
Regards,
Alan Deeney

I. (
TEEDMANSCIENCE&ENGINEERING
o cxo L
C0t • ,wo
1b1 t$SD • L+ iS COD L +
dcWIQ cc1s. . ocx
cff}GkJt€ a5-cz c o /L
16.k H
Toa1 Coeu H Jcanarbns<
*E i41ccc x,
dk Qock o
:i:: p /L
4 jfjfI2 Lcod IS /L
k 2c Q vJL
* Tb oo t/L •
1ck i(l 3 (ree -< 17 rijIL *
(ent'c icct *
Qe41L&w <'oo /L k
<EDq
dorQ6cm Su(cde 'co c2 r&_ çeia .< 0' 1 W3 IL*
&d o *+ cL4.
LIBRARY I r. I • VOET1L POTCTOU AUTHORITy
UARE 38 MOWTS BAY ROAD, PERTH
Zwo /L s
ltqoo • 4
1000
Vj/L*