2011 ibrahim index of african governance: summary ibrah i m index of a fr i can governance: summary...
TRANSCRIPT

2011 Ibrahim Index of African Governance
Summary

2011 Ibrahim Index of African Governance: Summary
published October 2011
copyright © 2011 Mo Ibrahim Foundation
The Mo Ibrahim Foundation is committed to making data on governance quality in Africa freely available and accessible to all citizens of the continent and interested stakeholders. We welcome and encourage any accurate reproduction, translation and dissemination of this material. The material must be attributed to the Mo Ibrahim Foundation, but not in any way that suggests that the Foundation endorses you or your use of the material.
We also welcome any feedback and comments on the Ibrahim Index. To request additional copies of this or other publications, to provide feedback or to discuss use of the Ibrahim Index please email [email protected]
Printed and bound in Swindon, England
Designed and typeset by Text Matters (www.textmatters.com)

Foreword—2
About the Ibrahim Index—3
Structure of the Index—4
Methodology—6Ibrahim Index: from raw data to final scores—7
Overall Country Results—8
Key Findings—10Country Case Studies—11
Category Results—13Safety and Rule of Law—14Participation and Human Rights—17Sustainable Economic Opportunity—20Human Development—23
Data Providers—26Indicators—27Appendix 1: Executive Elections in Africa—31Appendix 2: Ibrahim Index Timeline (2007–2011)—32Project Team—33Acknowledgements—34About the Mo Ibrahim Foundation—35
Centre-spread pull-out page:2011 Ibrahim Index of African Governance Country Rankings and Scores
Data used in the 2011 Ibrahim Index are from 2000 to 2010, prior to South Sudan’s secession from Sudan.

2011 Ib
ra
hIm
Ind
ex
of a
fr
Ica
n G
ov
er
na
nc
e: S
um
ma
ry
2
Dr Mo IbrahimFounder and Chair of the Mo Ibrahim Foundation
Foreword
We are pleased to present the 2011 Ibrahim Index of African Governance.
In a year when governance has dominated global as well as African headlines we hope that the findings of the 2011 Ibrahim Index will help to establish a constructive basis towards the achievement of an increasingly peaceful and prosperous Africa.
The findings of the 2011 Index present a complex yet hopeful picture for African governance. An optimistic story is emerging from our continent’s successes. A clear link can be observed between a balanced, equitable and inclusive approach to all categories of governance and national progress. These findings strongly challenge the narrative that supposes governments should pick and choose which areas to focus on at the expense of others as a natural and unavoidable trade-off of leadership. The events of this year have clearly shown the possible consequences of a skewed focus that selectively denies citizens some of the public goods and services they are entitled to expect. The dramatic progress being made by countries embracing the whole basket of public goods and services are also examples that other countries might find useful.
We are delighted to see the evident economic growth across Africa but we are concerned about the stagnation, and in many cases the reversal, in the rule of law and citizens’ rights. We sounded alarm bells last year concerning this issue. If economic progress is not translated into better quality of life and respect for citizens’ rights, we will witness more Tahrir Squares in Africa.
In 2011 we have continued the process of engaging the wider African academic community through a workshop in Dakar, hosted jointly by the Foundation and CODESRIA. Furthermore, we have begun two major projects that will both significantly improve the quality and availability of data that can be used to assess governance, and further entrench African ownership of the Index. We are supporting the expansion of Afrobarometer in order to increase the number of African countries in which the organisation collects citizens’ views on a wide range of social and economic issues. With Global Integrity Trust, we are building a network of experts across Africa to provide assessments of key issues from an African perspective. We hope these contributions will go some way towards filling the many gaps to be found in data on Africa.
We are also continuing to refine the structure of the Index. The growing consensus around physical infrastructure as a crucial tool for development – which I have seen first-hand through my participation in the G20 High Level Panel for Infrastructure Investment – has been reflected in the inclusion of new indicators. Similarly, we have enhanced our assessment of soft infrastructure (telecoms and IT) to reflect their political dividends. The Foundation is also working to improve our assessment of sustainable economic opportunities. We are particularly focused on capturing the inclusivity and sustainability of the economic programmes pursued by governments. Sound economic management must be about equity as well as growth.
But the patchiness of data concerning Africa continues to be a major challenge in the compilation of the Index. The Foundation is working on a number of projects to help fill some of these gaps as well as advocating for all stakeholders to focus attention on this crucial issue.
Whatever the issue, we continue to welcome feedback to ensure that the Index is the most robust, relevant and user-friendly assessment possible.
We have also this year seen the birth of two new African states, South Sudan and Sudan, born from the split of former Sudan. In the 2011 Index which covers the period 2000 to 2010, Sudan is assessed throughout as a single entity. Moving forward, the Foundation will endeavour to include the two new entities of Sudan and South Sudan in the Index as soon as data are available.
The Ibrahim Index is a collaborative project, made possible by tireless work and dedication. My particular gratitude goes to the Index team at the Foundation. Our special advisor, Dr Daniel Kaufmann, co-producer of the Worldwide Governance Indicators and senior fellow at the Brookings Institution, as well as the Technical Committee and the Advisory Council, have added greatly to the Index. The 23 organisations which provide the data are essential partners and, last but not least, I particularly want to thank the Foundation’s two African institutional partners: the African Development Bank and the United Nations Economic Commission for Africa.
“We hope that the findings of the 2011 Ibrahim Index will help to establish a constructive basis towards achieving an increasingly peaceful and prosperous Africa.”

2011 Ib
ra
hIm
Ind
ex
of a
fr
Ica
n G
ov
er
na
nc
e: S
um
ma
ry
3
Established in 2007, the Ibrahim Index is the most comprehensive collection of quantitative data that provides an annual assessment of governance performance in every African country.
The Ibrahim Indexis funded and led by an African institution. �
is Africa’s leading assessment of governance. �
provides a framework and tools for citizens, public authorities and �
partners to assess progress in governance.compiles 86 indicators grouped into 14 sub-categories and four �
overarching categories to measure the effective delivery of public goods and services to African citizens (see pp.4–5 for full structure of the Index).uses indicators from 23 data providers. �
is made up of over 40,000 raw data points. �
PartnershipsThe Ibrahim Index is currently compiled in partnership with an Advisory Council and a Technical Committee that include experts from a range of African institutions (see p.33 for Project Team).
The Foundation is also working with Afrobarometer and Global Integrity South Africa.
Through partnership with the Mo Ibrahim Foundation and other donors, �
Afrobarometer (which is managed from the Centre for Democratic Development Ghana) will be expanding its citizen surveys to cover over two thirds of African countries, creating the first pan-African databank of citizens’ views and voices on a range of governance issues.
The Foundation will support the � Global Integrity Trust (based in South Africa) to recruit a network of experts in every African country to provide assessments of key social, economic and political indicators; those indicators will eventually feed into and bolster the Ibrahim Index.
This is part of the Foundation’s commitment to further entrench the continent’s ownership of governance issues and to improve the quality and availability of data on Africa.
The 2011 Ibrahim IndexThe 2011 Ibrahim Index includes new indicators in the following areas: physical and telecommunications infrastructure; gender; health; welfare service provision; and economic management.
DataThe Ibrahim Index is currently compiled using various international and African sources. Many crucial indicators of governance, such as poverty, could not be included as the data are not sufficiently comprehensive. The future provision of robust data, including poverty statistics, from African sources is a core priority for the Foundation.
About the Ibrahim Index
1st Mauritius 822nd Cape Verde 793rd Botswana 764th Seychelles 735th South Africa 716th Namibia 707th Ghana 668th Lesotho 639th Tunisia 62
10th Egypt 6111th Benin 6012nd São Tomé and Príncipe 5813rd Tanzania 5814th Morocco 5815th Senegal 5716th Zambia 5717th Malawi 5718th Algeria 5519th Burkina Faso 5520th Uganda 5521st Mozambique 5522nd Mali 5423rd Kenya 5324th Gambia 5225th Rwanda 5226th Swaziland 5127th Gabon 5128th Libya 5029th Djibouti 4930th Sierra Leone 4831st Comoros 4732nd Mauritania 4733rd Madagascar 4734th Ethiopia 4635th Togo 4636th Liberia 4537th Burundi 4538th Cameroon 4539th Niger 4440th Congo 4241st Nigeria 4142nd Angola 4143rd Guinea 3844th Guinea-Bissau 3745th Equatorial Guinea 37
46th Côte d’Ivoire 3647th Eritrea 3548th Sudan 3349th Central African Republic 3350th Congo, Democratic Rep. 3251st Zimbabwe 3152nd Chad 3153rd Somalia 8
Rank Score (out of 100)
2011 IBRAhIM INDEx CoUNTRy RANKINGS

2011 Ib
ra
hIm
Ind
ex
of a
fr
Ica
n G
ov
er
na
nc
e: S
um
ma
ry
4
PARTICIPATIoN AND hUMAN RIGhTS
Free and Fair Executive Elections
Free and Fair Elections
Political Participation
Electoral Self-Determination
Effective Power to Govern
Participation
Core International Human Rights Conventions
Human Rights
Political Rights
Workers’ Rights
Freedom of Expression*
Freedom of Association and Assembly*
Civil Liberties*
Rights
Gender Equality*
Gender Balance in Primary and Secondary Education
Women’s Participation in the Labour Force
Equal Representation in Rural Areas
Women in Parliament
Women’s Rights*
Legislation on Violence against Women
Gender
SAFETy AND RULE oF LAw
Cross-Border Tensions
Government Involvement in Armed Conflict
Domestic Armed Conflict
Political Refugees
Internally Displaced People
National Security
Judicial Process
Judicial Independence
Sanctions
Transfers of Power
Property Rights*
Rule of Law
Domestic Political Persecution*
Social Unrest
Safety of the Person
Violent Crime
Human Trafficking
Personal Safety
Accountability, Transparency and Corruption in the Public Sector*
Accountability, Transparency and Corruption in Rural Areas
Corruption and Bureaucracy
Accountability of Public Officials
Corruption in Government and Public Officials
Prosecution of Abuse of Office
AccountabilitySub-categories
Indicators
Categories
Structure of the Index
2011 IbrahIm Index of afrIcan Governance

2011 Ib
ra
hIm
Ind
ex
of a
fr
Ica
n G
ov
er
na
nc
e: S
um
ma
ry
5
SUSTAINABLE ECoNoMIC oPPoRTUNITy
Statistical Capacity
Public Administration*
Inflation
Diversification
Reserves
Budget Management*
Ratio of Total Revenue to Total Expenditure
Ratio of Budget Deficit or Surplus to GDP
Debt Management*
Ratio of External Debt Service to Exports
Reliability of Financial Institutions
Public Management
Competitive Environment*
Investment Climate
Investment Climate for Rural Businesses
Rural Financial Services Development
Bureaucracy and Red Tape
Business Environment
Access to Electricity
Road and Rail Networks*
Air Transport Facilities
Telephone and IT Infrastructure*
Digital Connectivity*
Infrastructure
Public Resources for Rural Development
Land and Water for Low-Income Rural Populations*
Agricultural Research and Extension Services
Agricultural Input and Produce Markets
Policy and Legal Frame work for Rural Organisations
Dialogue between Government and Rural Organisations
Rural Sector
hUMAN DEVELoPMENT
Maternal Mortality
Child Mortality
Immunisation (Measles and DPT)*
Antiretroviral Treatment Provision
Disease (Cholera, Malaria and TB)*
health
Education Provision and Quality
Ratio of Pupils to Teachers in Primary School
Primary School Completion
Progression to Secondary School
Tertiary Enrolment
Education
Welfare Regime
Social Protection and Labour*
Social Exclusion
Welfare Services (Health and Education)*
Equity of Public Resource Use*
Access to Water*
Access to Sanitation*
Environmental Policy
Environmental Sustainability*
welfare
* clustered indicator
Sub-categories
Indicators
Categories
2011 IbrahIm Index of afrIcan Governance

2011 Ib
ra
hIm
Ind
ex
of a
fr
Ica
n G
ov
er
na
nc
e: S
um
ma
ry
6
Methodology
The Ibrahim Index of African Governance is a composite index, constructed by combining underlying indicators in a standardised way to provide a statistical measure of governance performance in all African countries. As a progressive and consultative project, the Index continuously adapts, accommodating the input and critiques of stakeholders.
Governance, as defined by the Board of the Mo Ibrahim Foundation, is inclusive from the viewpoint of the citizen. The definition is intentionally broad so as to capture all aspects of what a citizen has the right to demand from his or her state. It can be summarised by four over-arching dimensions: Safety and Rule of Law, Participation and Human Rights, Sustainable Economic Opportunity, and Human Development. As governance is not measurable directly, it is necessary to determine the most suitable proxy indicators that appropriately reflect this definition of governance.
Beyond the requirement for a particular indicator to be compatible with the Foundation’s definition of governance, there are other criteria that the indicator must meet. An included indicator should cover at least two thirds of the countries on the continent (35 or more) and should provide at least two years’ worth of data between 2000 and 2010. The latest available data should not be more than three years old and new data releases should be regular (at least every three years). Even when indicators meet these criteria, often their data sources do not provide data for all countries, in all years. Missing raw data values in the Ibrahim Index are estimated using country mean substitution or extrapolation, where appropriate.
Some of the raw data used in the computation of the Ibrahim Index contain observations that lie an abnormal distance from other values of the indicator. In the 2011 Index, the following ten indicators required statistical treatment to reduce the effects of such outliers on final scores: Inflation, Refugees, Internally Displaced People, Reserves, Ratio of Budget Deficit or Surplus to GDP, Ratio of External Debt Service to Exports, Ratio of Total Revenue to Total Expenditure, Internet Subscribers, Tertiary Enrolment, and Cholera.
As data included in the Index come from 23 separate institutions, and are on different scales at source, these raw data must be standardised in order to be meaningfully combined. The data for each indicator are transformed by the method of Min-Max normalisation, which performs a linear transformation on the data whilst preserving the relationships among the original data values. Min-Max normalisation subtracts the minimum value of an indicator’s raw data set from each country’s value for that indicator in a particular year. That value is then divided by the range of the indicator (maximum value in the raw data set minus the minimum value in the data set). The new values are multiplied by 100 in order to put them on a new scale of 0–100, where 100 is always the best possible score.
A simple statistical method of data aggregation is applied to combine the normalised data into a composite index. Each normalised indicator is assigned to the sub-category in which it best sits conceptually. Sub-category scores are calculated by averaging the scores of the underlying indicators. Category scores are calculated by averaging the 14 sub-category scores, and finally, the overall Index scores are obtained by averaging the scores of the four categories. Neither the categories nor sub-categories are explicitly weighted. Whilst the overall composite score for the Ibrahim Index enables users to make broad comparisons, interesting analysis can be done at the category and sub-category levels.
The inherently unobservable nature of governance means that the Index is a proxy measurement. The main sources of uncertainty in the computation of the Index arise from missing data and measurement errors. The Foundation publishes standard errors and confidence intervals alongside the overall Index and category scores to reflect this uncertainty. Given that measurement imprecision exists in any governance index, users of the Ibrahim Index are encouraged to avoid the over-interpretation of small score differences.
The addition of new indicators annually provides calibrations and refinements to the Index. Furthermore, the entire Index database is updated each year, in accordance with best practices. Retrospective revisions – compelled by data reassessments at source – mean that data used in the 2011 Index may be different in some instances from those used in the 2007 Index. A country’s rank in the 2011 Index is reflective of the Foundation’s assessment based on the best available information at the time of construction. Comparisons between years should therefore be performed entirely on the 2011 data set.
For a more detailed methodology paper please visit: www.moibrahimfoundation.org/en/section/the-ibrahim-index/methodology
Data used in the 2011 Ibrahim Index are from 2010, prior to South Sudan’s secession from Sudan.
The data set used to calculate the 2011 Ibrahim Index contains data from 2000 to 2010.
A decline or improvement is described as “significant” through the use of standard statistical methodology at a 90% confidence level. However some analysts may find it instructive to examine movements below this threshold.
Comparisons between sub-categories should only be made on the basis of rank. These comparisons are relative (not absolute) for each country.
All figures have been rounded to the nearest whole number. This means that countries may appear to have the same score but do not when decimal places are taken into account. Countries have been ranked and trends have been described based on the full scores, not the rounded numbers that appear here.

2011 Ib
ra
hIm
Ind
ex
of a
fr
Ica
n G
ov
er
na
nc
e: S
um
ma
ry
7
Safety and Rule of Law
Human Development
Sustainable Economic
Opportunity
Participation and Human
Rights
IbRaHIm InDEx
data1
2 indicators
3 sub-categories
4 categories
The data gathered comes in different units and scales. Before they can be used in the Ibrahim Index, they are transformed onto a scale on which they can be meaningfully compared and averaged.*
Once the 86 indicators have been transformed to a common scale, each one is grouped with similar indicators to form 14 sub-categories. The sub-category score is the simple average of all the indicator scores.
Sub-categories are then grouped into one of four categories; the category score is the average of sub-category scores.
The category scores are then averaged to produce the final Ibrahim Index score.
1 2 3 4
Ibrahim Index: from raw data to final scores
* Clustered indicators: 24 indicators were formed by clustering a number of underlying variables which each measure the same dimension and come from different sources, or measure similar concepts and come from the same source. A cluster is formed by averaging the underlying variables (post normalisation).
METhoDoLoGy

2011 Ib
ra
hIm
Ind
ex
of a
fr
Ica
n G
ov
er
na
nc
e: S
um
ma
ry
8
Just over half of the countries in Africa have improved in overall governance quality, and just under half have declined. This masks large differences in performances between countries and across categories.
The majority of countries have improved in both Sustainable Economic Opportunity and Human Development, but this progress is not mirrored in Safety and Rule of Law and Participation and Human Rights.
Number of countries with improved scores
PARTICIPATIoN AND hUMAN
RIGhTS
oVERALL SUSTAINABLE ECoNoMIC
oPPoRTUNITy
hUMAN DEVELoPMENT
SAFETy AND RULE oF LAw
27 countries
17 countries
14 countries
38 countries
48 countries
Overall Country Results
< 30
30–39
40–50
51–55
56–69
≥ 70
Western Sahara is on the UN list of non-self-governing territories.
Data shown are from 2010, prior to South Sudan’s secession from Sudan.

2011 Ib
ra
hIm
Ind
ex
of a
fr
Ica
n G
ov
er
na
nc
e: S
um
ma
ry
9
18th Algeria 54 56 56 55 55
42nd Angola 34 35 38 40 41
11th Benin 59 60 59 60 60
3rd Botswana 76 76 76 76 76
19th Burkina Faso 54 53 53 55 55
37th Burundi 44 46 44 48 45
38th Cameroon 44 46 46 45 45
2nd Cape Verde 76 78 80 78 79
49th Central African Republic 29 31 34 32 33
52nd Chad 31 31 28 30 31
31st Comoros 51 45 49 48 47
40th Congo 40 40 42 42 42
50th Congo, Democratic Rep. 30 32 32 32 32
46th Côte d’Ivoire 36 36 35 37 36
29th Djibouti 49 49 48 49 49
10th Egypt 56 59 59 62 61
45th Equatorial Guinea 35 37 37 36 37
47th Eritrea 39 38 36 35 35
34th Ethiopia 46 46 47 46 46
27th Gabon 49 49 49 50 51
24th Gambia 54 53 54 52 52
7th Ghana 65 65 64 66 66
43rd Guinea 39 38 36 36 38
44th Guinea-Bissau 41 41 42 37 37
23rd Kenya 54 54 53 51 53
8th Lesotho 63 64 64 61 63
36th Liberia 34 39 41 43 45
28th Libya 53 53 53 51 50
33rd Madagascar 59 60 57 50 47
17th Malawi 53 54 54 56 57
22nd Mali 54 53 54 54 54
32nd Mauritania 51 54 45 47 47
1st Mauritius 79 79 83 83 82
14th Morocco 59 58 57 58 58
21st Mozambique 55 54 53 55 55
6th Namibia 70 71 70 70 70
39th Niger 43 44 46 44 44
41st Nigeria 42 42 42 41 41
25th Rwanda 51 51 52 51 52
12th São Tomé and Príncipe 59 59 60 58 58
15th Senegal 60 59 57 58 57
4th Seychelles 74 72 72 73 73
30th Sierra Leone 39 45 45 46 48
53rd Somalia 9 9 7 8 8
5th South Africa 71 71 70 70 71
48th Sudan 32 33 30 32 33
26th Swaziland 50 50 52 52 51
13th Tanzania 57 58 57 58 58
35th Togo 39 40 43 44 46
9th Tunisia 65 65 63 63 62
20th Uganda 54 56 54 54 55
16th Zambia 56 57 57 57 57
51st Zimbabwe 32 32 30 31 31
OverviewContinental average: 50highest country score: Mauritius (82)Lowest country score: Somalia (8)highest regional average: Southern Africa (58)Lowest regional average: Central Africa (39)
Top ten 1 Mauritius 2 Cape Verde 3 Botswana 4 Seychelles 5 South Africa 6 Namibia 7 Ghana 8 Lesotho 9 Tunisia 10 Egypt
Significant changes
Significant decline
Significant improvement
Madagascar
LiberiaSierra Leone
0-15 +15
ANNUAL SCoRES 2006 2007 2008 2009 2010
TREND 2006–10
RANK 2010
2011 oVERALL CoUNTRy RESULTS
2011 Ib
ra
hIm
Ind
ex
of a
fr
Ica
n G
ov
er
na
nc
e: S
um
ma
ry
10
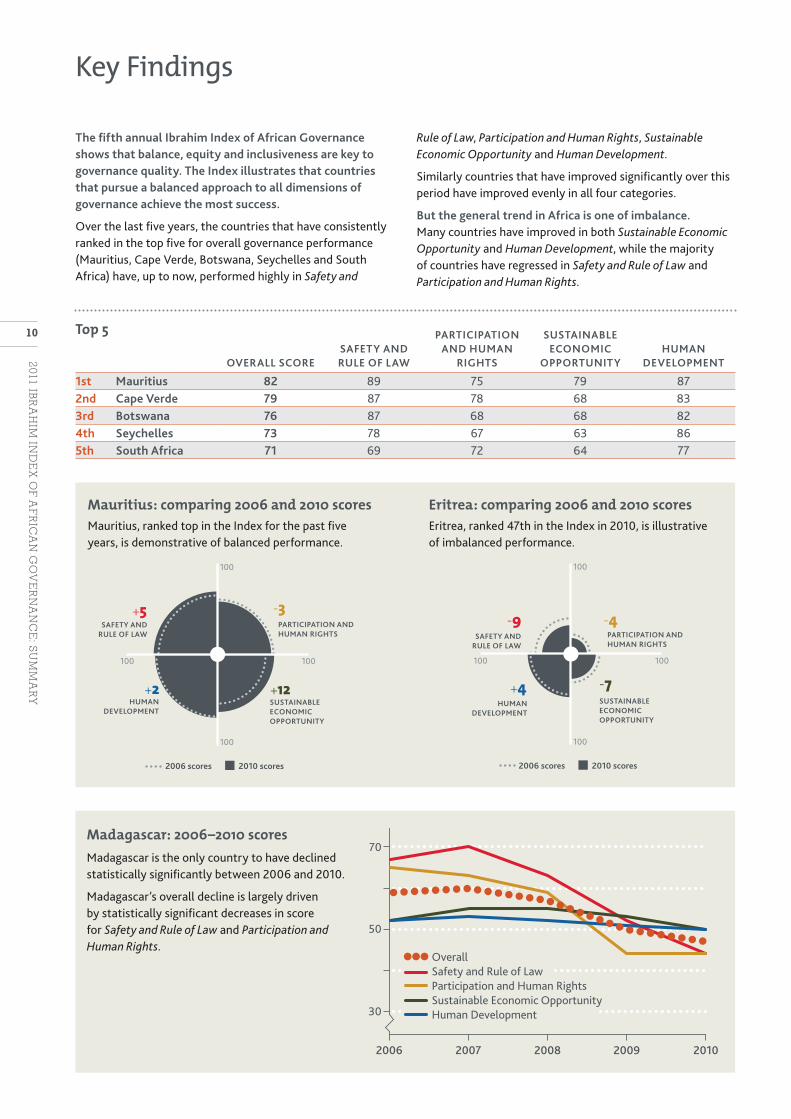
Mauritius: comparing 2006 and 2010 scoresMauritius, ranked top in the Index for the past five years, is demonstrative of balanced performance.
Eritrea: comparing 2006 and 2010 scoresEritrea, ranked 47th in the Index in 2010, is illustrative of imbalanced performance.
+5
+2 +12
-3
SUSTAINABLE ECONOMIC OPPORTUNITY
HUMAN DEVELOPMENT
SAFETY ANDRULE OF LAW
PARTICIPATION AND HUMAN RIGHTS
2006 scores 2010 scores
100
100
100100
-9
+4 -7
-4
SUSTAINABLE ECONOMIC OPPORTUNITY
HUMAN DEVELOPMENT
SAFETY ANDRULE OF LAW
PARTICIPATION AND HUMAN RIGHTS
2006 scores 2010 scores
100
100
100100
2006 2007 2008 2009 2010
30
70
50
OverallSafety and Rule of LawParticipation and Human RightsSustainable Economic OpportunityHuman Development
The fifth annual Ibrahim Index of African Governance shows that balance, equity and inclusiveness are key to governance quality. The Index illustrates that countries that pursue a balanced approach to all dimensions of governance achieve the most success.
Over the last five years, the countries that have consistently ranked in the top five for overall governance performance (Mauritius, Cape Verde, Botswana, Seychelles and South Africa) have, up to now, performed highly in Safety and
Rule of Law, Participation and Human Rights, Sustainable Economic Opportunity and Human Development.
Similarly countries that have improved significantly over this period have improved evenly in all four categories.
But the general trend in Africa is one of imbalance. Many countries have improved in both Sustainable Economic Opportunity and Human Development, while the majority of countries have regressed in Safety and Rule of Law and Participation and Human Rights.
Key Findings
Top 5
oVERALL SCoRESAFETy AND RULE oF LAw
PARTICIPATIoN AND hUMAN
RIGhTS
SUSTAINABLE ECoNoMIC
oPPoRTUNITyhUMAN
DEVELoPMENT
1st Mauritius 82 89 75 79 872nd Cape Verde 79 87 78 68 833rd Botswana 76 87 68 68 824th Seychelles 73 78 67 63 865th South Africa 71 69 72 64 77
Madagascar: 2006–2010 scoresMadagascar is the only country to have declined statistically significantly between 2006 and 2010.
Madagascar’s overall decline is largely driven by statistically significant decreases in score for Safety and Rule of Law and Participation and Human Rights.

2011 Ib
ra
hIm
Ind
ex
of a
fr
Ica
n G
ov
er
na
nc
e: S
um
ma
ry
11
Sierra LeoneSierra Leone is the second country that demonstrates statistically significant improvement in overall governance quality over the past five years.
Sierra Leone has similarly gained ground in all four categories of the Index.
LiberiaLiberia is one of the two countries to show statistically significant improvement in overall governance quality over the past five years.
This has been achieved through improvements in all four categories of the Index and 13 out of 14 sub-categories.
Liberia: comparing 2006 and 2010 scores
+14
+8 +12
+11
SUSTAINABLE ECONOMIC OPPORTUNITY
HUMAN DEVELOPMENT
SAFETY ANDRULE OF LAW
PARTICIPATION AND HUMAN RIGHTS
2006 scores 2010 scores
100
100
100100
Liberia: 2006–2010 scores
2006 2007 2008 2009 2010
40
35
50
45
Sierra Leone: 2006–2010 scores
2006 2007 2008 2009 2010
40
35
50
45
KEy FINDINGS
Sierra Leone: comparing 2006 and 2010 scores
+18
+4 +11
+4
SUSTAINABLE ECONOMIC OPPORTUNITY
HUMAN DEVELOPMENT
SAFETY ANDRULE OF LAW
PARTICIPATION AND HUMAN RIGHTS
2006 scores 2010 scores
100
100
100100
Two countries emerging from lengthy civil conflicts – Liberia and Sierra Leone – have shown the most striking improvements over the past five years.
This has been achieved through even progress across all categories.
Country Case Studies

2011 Ib
ra
hIm
Ind
ex
of a
fr
Ica
n G
ov
er
na
nc
e: S
um
ma
ry
12
KEy FINDINGS
Egypt: comparing 2006 and 2010 scores
Tunisia: comparing 2006 and 2010 scores
+4
+2 +11
-1
SUSTAINABLE ECONOMIC OPPORTUNITY
HUMAN DEVELOPMENT
SAFETY ANDRULE OF LAW
PARTICIPATION AND HUMAN RIGHTS
2006 scores 2010 scores
100
100
100100
-7
+2 +1
-7
SUSTAINABLE ECONOMIC OPPORTUNITY
HUMAN DEVELOPMENT
SAFETY ANDRULE OF LAW
PARTICIPATION AND HUMAN RIGHTS
2006 scores 2010 scores
100
100
100100
Country Case StudiesThere are also countries which show a strong disconnect between performances in categories.
Egypt and TunisiaEgypt and Tunisia both rank in the top ten for overall governance quality. This is driven by strong performances in Human Development, and to a lesser extent Sustainable Economic Opportunity.
Conversely both countries perform particularly poorly in Participation and Human Rights.
The imbalance between performances in Human Development and Participation and Human Rights might well have been a trigger for instability.
One of the other major issues is also the imbalance between high levels of education and the shortage of job opportunities, specifically for young graduates. This issue is not yet captured by the Index but the Foundation is currently working on ways to assess this.
LibyaLibya is ranked in the bottom half of the Index in 2010. Similarly to Egypt and Tunisia, Libya shows imbalance in performance between Human Development and Participation and Human Rights. In Libya’s case the imbalance is extreme with the country ranking in the top ten for Human Development and in the bottom three for Participation and Human Rights. Libya’s performances in Safety and Rule of Law and Sustainable Economic Opportunity are also weak in relation to Human Development.
Libya: comparing 2006 and 2010 scores
-8
0 -5
+3
SUSTAINABLE ECONOMIC OPPORTUNITY
HUMAN DEVELOPMENT
SAFETY ANDRULE OF LAW
PARTICIPATION AND HUMAN RIGHTS
2006 scores 2010 scores
100
100
100100

2011 Ib
ra
hIm
Ind
ex
of a
fr
Ica
n G
ov
er
na
nc
e: S
um
ma
ry
13
Category Results
2011 IBRAHIM INDEX OF AFRICAN GOVERNANCE
SAFETY AND RULE OF LAW
Rule of Law
Accountability
Personal Safety
National Security
Participation
Rights
Gender
Public Management
Business Environment
Infrastructure
Rural Sector
Welfare
Education
Health
HUMAN DEVELOPMENT
PARTICIPATION AND HUMAN RIGHTS
SUSTAINABLE ECONOMIC OPPORTUNITY
Categories
Sub-categories

2011 Ib
ra
hIm
Ind
ex
of a
fr
Ica
n G
ov
er
na
nc
e: S
um
ma
ry
14
Safety and Rule of Law“Having a firmly embedded judicial system that is just, effective, accessible to all, administered by competent and independent judges who work independently of political influences and in a corruption-free environment and make decisions according to merit, is a major prerequisite for ensuring safety and rule of law. Indeed consideration of safety cannot be separated from an assessment of the entrenchment of the rule of law in a state. This accords citizens the right to safety rather than the mere presence of safety with no guarantees of entitlement. This extends to include the accountability of public officials and prevention, control and elimination of corruption in the country.
Experience has demonstrated that a legal system can easily be subverted if its enforcers are not accountable to those they serve and if they are prone to influence through financial and other considerations. Furthermore, an empowered citizenry conscious of its constitutional and fundamental rights and responsibilities ensures the conditions for the entrenchment of the rule of law and safety in the state.
To ensure maximum progress in the efforts to promote good governance in Africa, it is imperative to see to it that safety in its holistic form and the rule of law exist concomitantly.”
Salim ahmed SalimFormer Secretary-General, Organisation of African Unity and former Prime Minister of Tanzania; Member of the Board and Chair of the Prize Committee of the Mo Ibrahim Foundation
In this category
Rule of LawJudicial Process �
Judicial Independence �
Sanctions �
Transfers of Power �
Property Rights � *
AccountabilityAccountability, Transparency and �
Corruption in the Public Sector*Accountability, Transparency and �
Corruption in Rural AreasCorruption and Bureaucracy �
Accountability of Public Officials �
Corruption in Government and �
Public OfficialsProsecution of Abuse of Office �
Personal SafetyDomestic Political Persecution � *Social Unrest �
Safety of the Person �
Violent Crime �
Human Trafficking �
National SecurityCross-Border Tensions �
Government Involvement in �
Armed ConflictDomestic Armed Conflict �
Political Refugees �
Internally Displaced People �
* clustered indicator (see Indicators p.27)‡ newly-included indicator for 2011
CATEGoRy RESULTS
Safety and Rule of Law country scores
< 20
20–42
43–50
51–59
60–70
> 70
Western Sahara is on the UN list of non-self-governing territories.
Data shown are from 2010, prior to South Sudan’s secession from Sudan.

2011 Ib
ra
hIm
Ind
ex
of a
fr
Ica
n G
ov
er
na
nc
e: S
um
ma
ry
15
RESULTS
28th Algeria 51 51 54 53 54
45th Angola 40 37 42 39 39
9th Benin 71 72 70 68 66
2nd Botswana 87 88 88 86 87
19th Burkina Faso 68 63 60 62 59
35th Burundi 46 51 46 48 46
37th Cameroon 49 49 50 48 46
3rd Cape Verde 91 90 91 83 87
50th Central African Republic 31 30 40 29 29
47th Chad 41 36 31 34 36
27th Comoros 58 45 53 54 54
42nd Congo 39 41 41 43 43
49th Congo, Democratic Rep. 30 27 30 29 30
48th Côte d’Ivoire 33 32 35 36 31
26th Djibouti 58 60 59 58 56
12th Egypt 59 62 63 65 63
39th Equatorial Guinea 43 46 45 44 45
46th Eritrea 45 45 37 35 36
38th Ethiopia 47 47 47 45 45
21st Gabon 55 57 56 55 59
34th Gambia 59 55 56 46 46
6th Ghana 73 73 72 73 72
41st Guinea 48 41 36 37 43
44th Guinea-Bissau 45 47 47 43 40
31st Kenya 52 53 52 47 48
8th Lesotho 69 69 70 69 69
33rd Liberia 33 39 45 47 47
43rd Libya 49 49 50 50 41
40th Madagascar 67 70 63 52 44
11th Malawi 66 65 65 65 65
14th Mali 62 62 62 60 62
32nd Mauritania 60 56 42 44 47
1st Mauritius 84 84 88 89 89
13th Morocco 64 63 61 61 62
17th Mozambique 66 65 63 62 61
4th Namibia 78 79 80 78 78
29th Niger 56 50 53 54 50
36th Nigeria 42 44 47 44 46
30th Rwanda 52 54 56 51 49
10th São Tomé and Príncipe 68 70 70 66 65
20th Senegal 62 63 62 59 59
5th Seychelles 78 77 76 79 78
22nd Sierra Leone 41 48 52 49 58
53rd Somalia 13 4 4 5 5
7th South Africa 74 72 71 69 69
52nd Sudan 24 25 21 20 21
16th Swaziland 62 64 63 62 62
18th Tanzania 64 62 63 61 60
25th Togo 51 53 55 54 57
24th Tunisia 64 63 60 62 58
23rd Uganda 54 56 56 54 58
15th Zambia 65 65 65 62 62
51st Zimbabwe 33 32 26 31 28
ANNUAL SCoRES 2006 2007 2008 2009 2010
TREND 2006–10
RANK 2010
SAFETy AND RULE oF LAw
OverviewContinental average: 53highest country score: Mauritius (89)Lowest country score: Somalia (5)highest regional average: Southern Africa (63)Lowest regional average: Central Africa (41)
Top ten 1 Mauritius 2 Botswana 3 Cape Verde 4 Namibia 5 Seychelles 6 Ghana 7 South Africa 8 Lesotho 9 Benin 10 São Tomé and Príncipe
Significant changes
Significant decline
Significant improvement
Madagascar
Sierra Leone
0-25 +25

2011 Ib
ra
hIm
Ind
ex
of a
fr
Ica
n G
ov
er
na
nc
e: S
um
ma
ry
16
Top ten scores Bottom ten scores
1st Botswana (86) 44th Gambia (25)
2nd Mauritius (82) 45th Congo (24)
3rd Cape Verde (82) 46th Guinea-Bissau (24)
4th Namibia (76) 47th Angola (22)
5th South Africa (72) 48th Chad (22)
6th Seychelles (68) 49th Libya (21)
7th Lesotho (65) 50th Sudan (20)
8th Ghana (61) 51st Equatorial Guinea (18)
9th Rwanda (59) 52nd Zimbabwe (15)
10th Swaziland (59) 53rd Somalia (3)
Accountability
Top ten scores Bottom ten scores
1st Mauritius (80) 44th South Africa (25)
2nd Cape Verde (77) 45th Chad (24)
3rd Seychelles (70) 45th Nigeria (24)
4th São Tomé and Príncipe (69) 47th Côte d’Ivoire (23)
5th Botswana (65) 47th Guinea (23)
5th Comoros (65) 49th Guinea-Bissau (20)
7th Namibia (63) 50th Sudan (16)
8th Djibouti (61) 50th Zimbabwe (16)
9th Benin (59) 52nd Congo, Democratic Rep. (11)
9th Burkina Faso (59) 53rd Somalia (3)
Personal Safety
Top ten scores Bottom ten scores
1st Botswana (97) 44th Comoros (31)
2nd Mauritius (94) 45th Congo, Democratic Rep. (30)
3rd Cape Verde (88) 46th Libya (30)
4th South Africa (85) 47th Liberia (29)
5th Ghana (85) 48th Zimbabwe (27)
6th Namibia (81) 49th Madagascar (21)
7th Seychelles (74) 50th Sudan (17)
8th Lesotho (66) 51st Côte d’Ivoire (11)
9th Uganda (65) 52nd Eritrea (6)
10th Malawi (64) 53rd Somalia (0)
Rule of Law
Top ten scores Bottom ten scores
1st Mauritius (100) 44th Chad (63)
2nd Botswana (100) 45th Ethiopia (61)
3rd Cape Verde (100) 46th Côte d’Ivoire (59)
4th Seychelles (100) 47th Zimbabwe (55)
5th South Africa (95) 48th Eritrea (54)
6th Malawi (95) 49th Rwanda (54)
7th Zambia (95) 50th Congo, Democratic Rep. (52)
8th Benin (95) 51st Sudan (30)
9th Gabon (95) 52nd Central African Republic (23)
10th Namibia (95) 53rd Somalia (13)
National Security
Continental average: 48highest country score: Botswana (97)Lowest country score: Somalia (0)highest regional average: Southern Africa (63)Lowest regional average: Central Africa (36)
Continental average: 43highest country score: Botswana (86)Lowest country score: Somalia (3)highest regional average: Southern Africa (55)Lowest regional average: Central Africa (26)
Continental average: 44highest country score: Mauritius (80)Lowest country score: Somalia (3)highest regional average: West Africa (47)Lowest regional average: Central Africa (33)
Continental average: 78highest country score: Mauritius (100)Lowest country score: Somalia (13)highest regional average: Southern Africa (87)Lowest regional average: East Africa (66)
SUB-CATEGoRy RESULTS
2011 Ib
ra
hIm
Ind
ex
of a
fr
Ica
n G
ov
er
na
nc
e: S
um
ma
ry
17
Participation and Human Rights“In preparing an index illustrating outcomes in the areas of participation and human rights, it is clear that participation is much easier to assess and measure. Of course, participation encompasses and overlaps with areas of human rights, such as the right to vote, the right to a fair election, and freedom to express views on political issues and to hold government accountable for commitments made under national and international law.
When we look back at the development of the international human rights system over the past 60 years there is a significant gap in implementation which poses a problem in developing an index to measure outcomes in a comparable way in all countries in Africa.
Despite the present gap, and the weakness in data, I believe the Ibrahim Index is making a significant contribution. It is exerting a healthy pressure on the UN and others to develop more practical ways to compare the human rights record of African countries.
By offering the best measurements and relevant data the Index can find at present, it is creating a demand – which civil society in each country should champion – for better performance measurements.
What an innovative way to enhance protection and promotion of human rights in African countries!”
mary robinsonFormer President of Ireland and former UN High Commissioner for Human Rights; Member of the Board and Prize Committee of the Mo Ibrahim Foundation
In this category
ParticipationFree and Fair Executive Elections �
Free and Fair Elections �
Political Participation �
Electoral Self-Determination �
Effective Power to Govern �
RightsCore International �
Human Rights ConventionsHuman Rights �
Political Rights �
Workers’ Rights �
Freedom of Expression � *Freedom of Association and Assembly � *Civil Liberties � *
GenderGender Equality � *Gender Balance in Primary and �
Secondary EducationWomen’s Participation in the �
Labour ForceEqual Representation in Rural Areas � ‡
Women in Parliament �
Women’s Rights � *Legislation on Violence against Women �
CATEGoRy RESULTS
* clustered indicator (see Indicators p.27)‡ newly-included indicator for 2011
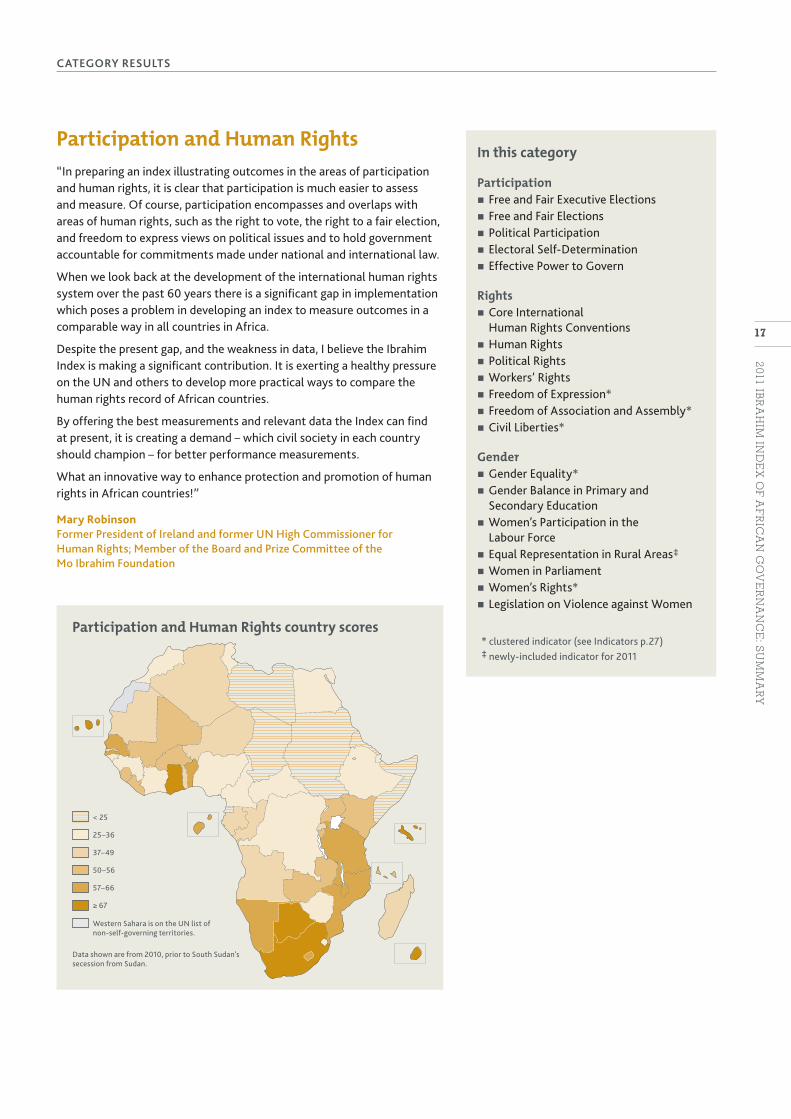
Participation and Human Rights country scores
< 25
25–36
37–49
50–56
57–66
≥ 67
Western Sahara is on the UN list of non-self-governing territories.
Data shown are from 2010, prior to South Sudan’s secession from Sudan.

2011 Ib
ra
hIm
Ind
ex
of a
fr
Ica
n G
ov
er
na
nc
e: S
um
ma
ry
18
RESULTS
OverviewContinental average: 45highest country score: Cape Verde (78)Lowest country score: Somalia (13)highest regional average: Southern Africa (55)Lowest regional average: Central Africa (31)
Top ten 1 Cape Verde 2 Mauritius 3 South Africa 4 Ghana 5 Botswana 6 Seychelles 7 Lesotho 8 Namibia 9 Benin 10 São Tomé and Príncipe
Significant changes
32nd Algeria 38 43 36 38 38
27th Angola 31 37 40 42 43
9th Benin 67 67 62 64 65
5th Botswana 72 71 69 68 68
15th Burkina Faso 54 56 57 57 56
23rd Burundi 55 55 49 55 50
37th Cameroon 36 38 33 34 34
1st Cape Verde 74 76 79 78 78
36th Central African Republic 33 37 40 38 34
48th Chad 25 27 22 24 24
22nd Comoros 57 48 56 54 51
33rd Congo 37 37 40 38 38
44th Congo, Democratic Rep. 31 34 31 33 33
45th Côte d’Ivoire 29 31 26 28 30
41st Djibouti 37 35 33 34 34
39th Egypt 35 37 33 35 34
52nd Equatorial Guinea 18 20 17 17 17
50th Eritrea 24 23 22 20 20
38th Ethiopia 38 34 34 35 34
31st Gabon 45 44 39 39 39
25th Gambia 49 49 49 46 44
4th Ghana 71 71 68 69 69
43rd Guinea 34 36 33 29 33
34th Guinea-Bissau 53 53 51 34 35
20th Kenya 60 57 56 51 53
7th Lesotho 69 72 72 65 66
18th Liberia 43 50 49 54 54
51st Libya 17 18 19 19 19
26th Madagascar 65 63 59 44 44
13th Malawi 56 56 50 58 59
16th Mali 59 57 57 55 56
24th Mauritania 48 63 43 49 47
2nd Mauritius 78 80 78 77 75
35th Morocco 42 36 36 35 35
14th Mozambique 63 59 58 59 58
8th Namibia 75 71 67 66 66
29th Niger 50 51 47 39 42
40th Nigeria 40 39 37 33 34
30th Rwanda 44 43 40 39 39
10th São Tomé and Príncipe 62 62 62 62 63
12th Senegal 69 64 60 59 59
6th Seychelles 72 65 64 66 67
19th Sierra Leone 49 56 53 52 53
53rd Somalia 14 12 13 12 13
3rd South Africa 76 73 72 72 72
49th Sudan 18 18 19 20 22
46th Swaziland 31 30 27 28 28
11th Tanzania 64 64 57 60 60
28th Togo 29 31 37 40 42
42nd Tunisia 41 40 37 33 34
21st Uganda 53 56 51 50 51
17th Zambia 59 56 54 54 54
47th Zimbabwe 30 30 27 27 27
ANNUAL SCoRES 2006 2007 2008 2009 2010
TREND 2006–10
RANK 2010
PARTICIPATIoN AND hUMAN RIGhTS
Significant decline Madagascar
0-25 +25

2011 Ib
ra
hIm
Ind
ex
of a
fr
Ica
n G
ov
er
na
nc
e: S
um
ma
ry
19
Top ten scores Bottom ten scores
1st Cape Verde (86) 44th Swaziland (26)
2nd Mauritius (81) 45th Djibouti (25)
3rd Ghana (75) 46th Congo, Democratic Rep. (23)
4th Namibia (69) 47th Tunisia (21)
5th Benin (68) 48th Zimbabwe (20)
6th South Africa (67) 49th Libya (16)
7th Mali (67) 50th Sudan (15)
8th São Tomé and Príncipe (65) 51st Equatorial Guinea (11)
9th Lesotho (62) 52nd Somalia (9)
10th Zambia (61) 53rd Eritrea (7)
Rights
Top ten scores Bottom ten scores
1st Lesotho (76) 44th Liberia (38)
2nd South Africa (75) 45th Togo (37)
3rd Seychelles (74) 46th Mali (36)
4th Rwanda (74) 47th Chad (34)
5th Tanzania (71) 48th Nigeria (33)
6th Botswana (70) 49th Congo, Democratic Rep. (33)
7th Cape Verde (66) 50th Central African Republic (32)
8th Mauritania (65) 51st Niger (30)
9th Mauritius (65) 52nd Equatorial Guinea (26)
10th Tunisia (63) 53rd Somalia (23)
Gender
Top ten scores Bottom ten scores
1st Cape Verde (83) 44th Tunisia (17)
2nd Mauritius (80) 45th Rwanda (17)
3rd Liberia (78) 46th Sudan (13)
4th Benin (78) 47th Equatorial Guinea (13)
5th South Africa (75) 48th Morocco (11)
6th Seychelles (75) 49th Swaziland (10)
7th Botswana (75) 50th Chad (8)
8th São Tomé and Príncipe (73) 51st Somalia (7)
9th Ghana (72) 52nd Eritrea (3)
10th Comoros (68) 52nd Libya (3)
ParticipationContinental average: 42highest country score: Cape Verde (83)Lowest country score: Eritrea, Libya (3)highest regional average: Southern Africa (53)Lowest regional average: North Africa (22)
Continental average: 43highest country score: Cape Verde (86)Lowest country score: Eritrea (7)highest regional average: West Africa (53)Lowest regional average: Central Africa (30)
Continental average: 51highest country score: Lesotho (76)Lowest country score: Somalia (23)highest regional average: Southern Africa (60)Lowest regional average: Central Africa (37)
SUB-CATEGoRy RESULTS

2011 Ib
ra
hIm
Ind
ex
of a
fr
Ica
n G
ov
er
na
nc
e: S
um
ma
ry
20
Sustainable Economic Opportunity“Sustainable Economic Opportunity is one of the four pillars under which governance is measured in the Ibrahim Index. Freedom to participate in the creation of economic wealth is a key right for all citizens and governments have an overwhelming duty to develop an enabling framework.
This pillar seeks to measure, first, governments’ abilities to manage the macro economy along sound lines to ensure broad economic development. It also seeks to measure the regulatory framework, which allows, inter alia, the wealth-creating private sector to grow within the constraints and interest of society as a whole. A third category of variables covers the availability of basic infrastructure, which in some cases is provided by the State, whilst in others by the private sector, within a system determined by governments.
The final group of indicators cover aspects of rural and environmental issues. These are of particular significance, given the large rural populations of most countries, the importance of subsistence goods together with concerns associated with environmental degradation and climate change, which may become even more acute.
It is encouraging to note that on average the majority of countries of Africa have consistently improved their scores in this pillar.”
Lord cairnsFormer Chief Executive Officer, SG Warburg and Former Chairman, Actis Capital LLP; Member of the Board of the Mo Ibrahim Foundation
In this category
Public ManagementStatistical Capacity �
Public Admin istration � *Inflation �
Diversification � ‡
Reserves �
Budget Manage ment � *Ratio of Total Revenue to �
Total ExpenditureRatio of Budget Deficit or Surplus �
to GDPDebt Management � *Ratio of External Debt Service �
to ExportsReliability of Financial Institutions �
Business EnvironmentCompetitive Environment � *Investment Climate �
Investment Climate for Rural Businesses �
Rural Financial Services Development �
Bureaucracy and Red Tape �
InfrastructureAccess to Electricity �
Road and Rail Networks � *‡
Air Transport Facilities � ‡
Telephone and IT Infrastructure � *‡
Digital Connectivity � *
Rural SectorPublic Resources for Rural Development �
Land and Water for Low-Income Rural �
Populations*Agricultural Research and �
Extension Services‡
Agricultural Input and Produce Markets �
Policy and Legal Frame work for �
Rural OrganisationsDialogue between Government and �
Rural Organisations
CATEGoRy RESULTS
* clustered indicator (see Indicators p.27)‡ newly-included indicator for 2011
Sustainable Economic Opportunity country scores
< 20
20–40
41–49
50–55
56–65
> 65
Western Sahara is on the UN list of non-self-governing territories.
Data shown are from 2010, prior to South Sudan’s secession from Sudan.

2011 Ib
ra
hIm
Ind
ex
of a
fr
Ica
n G
ov
er
na
nc
e: S
um
ma
ry
21
SUSTAINABLE ECoNoMIC oPPoRTUNITy RESULTS
21st Algeria 56 56 56 53 52
34th Angola 35 35 36 39 42
19th Benin 50 50 48 52 52
4th Botswana 68 67 68 67 68
10th Burkina Faso 51 49 51 57 59
38th Burundi 36 36 40 44 40
29th Cameroon 44 47 49 48 48
3rd Cape Verde 58 63 69 68 68
44th Central African Republic 22 26 26 29 36
47th Chad 34 33 32 32 33
50th Comoros 31 31 29 28 29
37th Congo 39 38 40 39 41
51st Congo, Democratic Rep. 27 29 32 28 29
40th Côte d’Ivoire 41 39 38 38 39
30th Djibouti 46 46 42 47 47
2nd Egypt 58 61 62 70 70
43rd Equatorial Guinea 33 36 38 33 36
49th Eritrea 36 35 34 29 29
15th Ethiopia 55 55 56 55 54
35th Gabon 34 33 39 41 42
20th Gambia 48 48 47 51 52
16th Ghana 52 47 50 55 53
48th Guinea 33 36 34 34 30
46th Guinea-Bissau 30 27 31 33 33
25th Kenya 49 50 48 45 50
14th Lesotho 57 55 55 54 55
45th Liberia 22 24 25 27 34
12th Libya 62 60 61 55 57
24th Madagascar 52 55 55 53 50
27th Malawi 42 44 47 47 48
31st Mali 49 47 48 51 47
28th Mauritania 49 50 49 48 48
1st Mauritius 67 68 78 79 79
6th Morocco 60 63 62 63 64
22nd Mozambique 50 49 48 52 51
9th Namibia 60 60 60 63 63
32nd Niger 36 42 45 44 45
36th Nigeria 40 40 39 42 41
13th Rwanda 54 51 52 54 57
41st São Tomé and Príncipe 40 38 40 40 38
17th Senegal 51 50 49 54 53
8th Seychelles 61 61 60 61 63
33rd Sierra Leone 32 39 40 43 43
53rd Somalia 2 2 2 4 4
7th South Africa 62 62 60 61 64
39th Sudan 43 43 31 39 40
26th Swaziland 44 44 52 50 50
11th Tanzania 53 54 57 57 58
42nd Togo 31 31 32 34 36
5th Tunisia 66 67 68 67 67
18th Uganda 56 57 53 52 52
23rd Zambia 47 49 48 49 51
52nd Zimbabwe 21 21 22 21 24
ANNUAL SCoRES 2006 2007 2008 2009 2010
TREND 2006–10
RANK 2010
OverviewContinental average: 47highest country score: Mauritius (79)Lowest country score: Somalia (4)highest regional average: North Africa (60)Lowest regional average: Central Africa (38)
Top ten 1 Mauritius 2 Egypt 3 Cape Verde 4 Botswana 5 Tunisia 6 Morocco 7 South Africa 8 Seychelles 9 Namibia 10 Burkina Faso
Significant changes
Significant improvement
EgyptCentral African Rep.
Sierra Leone
0-15 +15

2011 Ib
ra
hIm
Ind
ex
of a
fr
Ica
n G
ov
er
na
nc
e: S
um
ma
ry
22
Top ten scores Bottom ten scores
1st Mauritius (98) 44th Togo (33)
2nd Egypt (80) 45th Comoros (33)
3rd Botswana (77) 46th Guinea-Bissau (31)
4th South Africa (72) 47th Congo (30)
5th Morocco (70) 48th Equatorial Guinea (26)
6th Cape Verde (70) 49th Libya (26)
7th Rwanda (69) 50th Congo, Democratic Rep. (22)
8th Ghana (68) 51st Eritrea (11)
9th Namibia (66) 52nd Zimbabwe (9)
10th Seychelles (65) 53rd Somalia (3)
Business Environment
Top ten scores Bottom ten scores
1st Seychelles (81) 44th Liberia (16)
2nd Libya (75) 45th Mali (16)
3rd Mauritius (70) 46th Burundi (15)
4th Tunisia (67) 47th Sierra Leone (14)
5th Namibia (64) 48th Nigeria (10)
6th Egypt (63) 49th Niger (6)
7th Botswana (63) 50th Somalia (4)
8th Cape Verde (52) 51st Comoros (3)
9th Lesotho (50) 52nd Guinea (2)
10th Morocco (47) 53rd Congo, Democratic Rep. (1)
Infrastructure
Top ten scores Bottom ten scores
1st South Africa (73) 44th Congo, Democratic Rep. (48)
2nd Libya (71) 45th Equatorial Guinea (47)
3rd Tunisia (71) 46th Comoros (47)
4th Morocco (70) 47th Central African Republic (46)
5th Botswana (70) 48th Zimbabwe (44)
6th Mauritius (66) 49th Sudan (43)
7th Algeria (66) 50th Chad (41)
8th Rwanda (65) 51st Guinea (40)
9th Cape Verde (64) 52nd Eritrea (34)
10th Namibia (62) 53rd Somalia (4)
Public Management
Top ten scores Bottom ten scores
1st Cape Verde (87) 42nd Angola (38)
2nd Mauritius (81) 43rd Djibouti (38)
3rd Burkina Faso (76) 44th Togo (37)
4th Egypt (75) 45th Chad (37)
5th Tanzania (74) 46th Central African Republic (36)
6th Rwanda (70) 47th Côte d’Ivoire (36)
7th Tunisia (68) 48th Comoros (35)
8th Senegal (67) 49th Guinea-Bissau (35)
9th Morocco (67) 50th Liberia (35)
10th Benin (66) 51st* Zimbabwe (8)
Rural Sector*
Continental average: 56highest country score: South Africa (73)Lowest country score: Somalia (4)highest regional average: North Africa (65)Lowest regional average: East Africa (49)
Continental average: 50highest country score: Mauritius (98)Lowest country score: Somalia (3)highest regional average: Southern Africa (59)Lowest regional average: Central Africa (36)
Continental average: 31highest country score: Seychelles (81)Lowest country score: Congo, Democratic Rep. (1)highest regional average: North Africa (54)Lowest regional average: Central Africa (20)
Continental average: 54highest country score: Cape Verde (87)Lowest country score: Zimbabwe (8)*highest regional average: North Africa (65)Lowest regional average: Central Africa (43)
* No data available for Somalia or Libya
SUB-CATEGoRy RESULTS

2011 Ib
ra
hIm
Ind
ex
of a
fr
Ica
n G
ov
er
na
nc
e: S
um
ma
ry
23
Human Development“Human Development reflects the outcomes of investments made in the talents of a country, with a particular focus on education, health and social safety nets. Human Development indicators measure the efforts contributed by the individual, family, community and society as a whole to develop the human capital base of a nation. Government’s commitment to make the appropriate investment to provide equitable access to, and quality outcomes of education, training and health care systems is key to success. In addition government has a role in creating an appropriate investment climate for innovative partnerships between public sector/private sector/civil society to ensure good and shared outcomes in developing the talents of citizens. Human Development indicators provide a profile of the quality of a country’s human capital base and its ability to participate in the competitive global knowledge economy.
Although the trend in most African countries is encouraging with respect to greater focus on investments in Human Development, more effort needs to go into data collection about monitoring and evaluating outcomes of those investments. Access to education and health care facilities does not necessarily translate into higher quality of outcomes in the form of well-educated and trained people nor in healthier populations. Africa needs to ensure that it invests effectively and efficiently in its youthful population for it to compete in the market place for industrial and service sector investment. The youthful population of the African continent should be turned into a competitive advantage in a world where the war on talent separates successful nations from failed ones.”
dr mamphela rampheleFormer Managing Director, World Bank and former Vice-Chancellor, University of Cape Town; Member of the Board of the Mo Ibrahim Foundation
In this category
WelfareWelfare Regime �
Social Protection and Labour � *Social Exclusion �
Welfare Services (Health and �
Education)*‡
Equity of Public Resource Use � *‡ Access to Water � *Access to Sanitation � *Environmental Policy �
Environmental Sustainability � *
EducationEducation Provision and Quality �
Ratio of Pupils to Teachers in �
Primary SchoolPrimary School Completion �
Progression to Secondary School �
Tertiary Enrolment �
HealthMaternal Mortality � ‡
Child Mortality �
Immunisation (Measles and DPT) � *Antiretroviral Treatment Provision �
Disease (Cholera, Malaria and TB) � *‡
CATEGoRy RESULTS
* clustered indicator (see Indicators p.27)‡ newly-included indicator for 2011
Human Development country scores
< 25
25–40
41–50
51–59
60–75
> 75
Western Sahara is on the UN list of non-self-governing territories.
Data shown are from 2010, prior to South Sudan’s secession from Sudan.

2011 Ib
ra
hIm
Ind
ex
of a
fr
Ica
n G
ov
er
na
nc
e: S
um
ma
ry
24
RESULTShUMAN DEVELoPMENT
OverviewContinental average: 56highest country score: Tunisia (88)Lowest country score: Somalia (10)highest regional average: North Africa (74)Lowest regional average: Central Africa (45)
Top ten 1 Tunisia 2 Mauritius 3 Seychelles 4 Cape Verde 5 Libya 6 Botswana 7 Algeria 8 South Africa 9 Egypt 10 Namibia
Significant changesThere were no significant changes in this category between 2006 and 2010.
7th Algeria 72 74 78 77 77
48th Angola 28 33 36 40 39
24th Benin 50 51 54 56 56
6th Botswana 79 79 81 82 82
40th Burkina Faso 42 44 45 47 47
44th Burundi 40 42 43 44 44
29th Cameroon 48 50 52 53 53
4th Cape Verde 80 81 82 83 83
51st Central African Republic 29 30 30 31 31
52nd Chad 25 27 28 29 29
25th Comoros 58 55 57 56 56
35th Congo 45 45 48 48 48
50th Congo, Democratic Rep. 32 37 35 38 38
41st Côte d’Ivoire 41 42 43 45 45
23rd Djibouti 56 56 57 57 58
9th Egypt 74 75 76 76 76
34th Equatorial Guinea 45 46 47 49 49
28th Eritrea 50 49 52 54 54
31st Ethiopia 45 47 51 50 50
16th Gabon 61 62 63 64 64
15th Gambia 60 59 62 64 64
12th Ghana 63 67 68 69 70
43rd Guinea 41 39 41 44 44
46th Guinea-Bissau 35 37 37 39 40
20th Kenya 56 56 57 59 60
18th Lesotho 58 58 59 59 61
39th Liberia 39 41 43 46 47
5th Libya 82 84 83 82 82
30th Madagascar 52 53 52 51 50
26th Malawi 49 50 52 54 54
32nd Mali 45 47 48 49 50
38th Mauritania 46 48 48 47 47
2nd Mauritius 85 86 87 87 87
11th Morocco 70 70 70 71 71
36th Mozambique 42 42 45 48 48
10th Namibia 70 73 72 72 72
47th Niger 32 34 37 40 40
45th Nigeria 44 45 44 44 44
17th Rwanda 54 53 59 62 62
13th São Tomé and Príncipe 64 65 66 62 68
22nd Senegal 56 57 58 59 59
3rd Seychelles 85 86 87 86 86
49th Sierra Leone 34 38 36 38 38
53rd Somalia 7 19 9 10 10
8th South Africa 74 75 77 77 77
33rd Sudan 42 45 48 49 49
14th Swaziland 60 63 65 66 66
27th Tanzania 48 51 52 54 54
37th Togo 44 44 46 47 48
1st Tunisia 87 89 88 88 88
21st Uganda 53 55 56 59 59
19th Zambia 53 57 60 61 61
42nd Zimbabwe 45 46 43 44 44
ANNUAL SCoRES 2006 2007 2008 2009 2010
TREND 2006–10
RANK 2010

2011 Ib
ra
hIm
Ind
ex
of a
fr
Ica
n G
ov
er
na
nc
e: S
um
ma
ry
25
Top ten scores Bottom ten scores
1st Seychelles (96) 44th Mozambique (36)
2nd Tunisia (87) 45th Sierra Leone (35)
3rd Mauritius (84) 46th Niger (33)
4th Libya (83) 47th Burkina Faso (31)
5th South Africa (82) 48th Burundi (31)
6th Algeria (81) 49th Chad (28)
7th Egypt (79) 50th Guinea-Bissau (26)
8th Botswana (78) 51st Angola (21)
9th Cape Verde (74) 52nd Central African Republic (17)
10th Ghana (66) 53rd Somalia (0)
Education
Top ten scores Bottom ten scores
1st Seychelles (99) 44th Burundi (52)
2nd Libya (98) 45th Niger (49)
3rd Cape Verde (95) 46th Liberia (47)
4th Tunisia (95) 47th Guinea-Bissau (47)
5th Botswana (91) 48th Central African Republic (44)
6th Namibia (88) 49th Congo, Democratic Rep. (43)
7th Mauritius (87) 50th Sierra Leone (38)
8th São Tomé and Príncipe (87) 51st Nigeria (36)
9th Morocco (84) 52nd Chad (29)
10th Swaziland (84) 53rd Somalia (27)
Health
Top ten scores Bottom ten scores
1st Mauritius (89) 44th Eritrea (38)
2nd Tunisia (83) 45th Côte d’Ivoire (36)
3rd Cape Verde (81) 46th Central African Republic (33)
4th South Africa (80) 47th Congo, Democratic Rep. (33)
5th Botswana (77) 48th Togo (32)
6th Ghana (69) 49th Equatorial Guinea (32)
7th Algeria (68) 50th Chad (30)
8th Djibouti (68) 51st Sudan (28)
9th Egypt (68) 52nd Zimbabwe (28)
10th Rwanda (66) 53rd Somalia (4)
WelfareContinental average: 52highest country score: Mauritius (89)Lowest country score: Somalia (4)highest regional average: North Africa (66)Lowest regional average: Central Africa (41)
Continental average: 51highest country score: Seychelles (96)Lowest country score: Somalia (0)highest regional average: North Africa (72)Lowest regional average: Central Africa (42)
Continental average: 66highest country score: Seychelles (99)Lowest country score: Somalia (27)highest regional average: North Africa (83)Lowest regional average: Central Africa (51)
SUB-CATEGoRy RESULTS

2011 Ib
ra
hIm
Ind
ex
of a
fr
Ica
n G
ov
er
na
nc
e: S
um
ma
ry
26
Data Providers
african development bank (afdb)website: www.afdb.orgData sources: Country Performance Assessment (CPA) (tinyurl.com/IIAG2011-AfDB-CPA); African Economic Outlook (AEO) (tinyurl.com/IIAG2011-AEO)
bertelsmann foundation (bf)website: www.bertelsmann-stiftung.deData source: Bertelsmann Transformation Index (BTI) (tinyurl.com/IIAG2011-BTI)
centre for democratic development (cdd Ghana)website: www.cddghana.orgData source: Sanctions in Africa 2000–2010 (tinyurl.com/IIAG2011-CDDGhana)
The cingranelli-richards human rights data Project (cIrI)website: http://ciri.binghamton.eduData source: Cingranelli-Richards (CIRI) Human Rights Dataset (tinyurl.com/IIAG2011-CIRI)
economist Intelligence Unit (eIU)website: www.eiu.comData sources: Democracy Index (tinyurl.com/IIAG2011-EIU); CountryData (tinyurl.com/IIAG2011-EIU); Commissioned Expert Assessments (tinyurl.com/IIAG2011-EIU-MIF)
freedom house (fh)website: www.freedomhouse.orgData sources: Freedom in the World Survey (tinyurl.com/IIAG2011-FH-FW); Freedom of the Press Index (tinyurl.com/IIAG2011-FH-FP)
The heritage foundation and The Wall Street Journal (her-WSJ)website: www.heritage.org/IndexData source: Index of Economic Freedom (tinyurl.com/IIAG2011-HER-WSJ)
Institut de recherche empirique en economie Politique (IreeP)website: www.ireep.orgData source: African Electoral Index: 2000–2010 (tinyurl.com/IIAG2011-IERPE)
Inter-agency Group for child mortality estimation (IGme)website: www.childmortality.orgData source: Child Mortality Estimates Info (CME) (tinyurl.com/IIAG2011-IGCME)
Internal displacement monitoring centre (Idmc)website: www.internal-displacement.orgData source: Internal Displacement: Global Overview of Trends and Developments (tinyurl.com/IIAG2011-IDMC)
International bank for reconstruction and development, The World bank (Wb) website: www.worldbank.orgData sources: IDA Resource Allocation Index (tinyurl.com/IIAG2011-WB-IRAI); Bulletin Board on Statistical Capacity (BBSC) (tinyurl.com/IIAG2011-WB-BBSC); World Development Indicators (WDI) (tinyurl.com/IIAG2011-WB-WDIdata); Worldwide Governance Indicators (WGI) (tinyurl.com/IIAG2011-WB-WGI)
International fund for agricultural development (Ifad)website: www.ifad.orgData source: Performance-based Allocation System (PBAS): Rural Sector Performance Assessments (RSPA) (tinyurl.com/IIAG2011-IFAD)
International monetary fund (Imf)website: www.imf.orgData sources: International Financial Statistics (IFS) (tinyurl.com/IIAG2011-IMF-FS); Article IV Consultation Staff Reports (tinyurl.com/IIAG2011-IMF)
International Telecommunication Union (ITU)website: www.itu.int Data source: World Telecommunications/ICT Indicators Database (tinyurl.com/IIAG2011-ITU)
Joint United nations Programme on hIv/aIdS (UnaIdS)website: www.unaids.orgData source: UNAIDS Report on the Global AIDS Epidemic (tinyurl.com/IIAG2011-UNAIDS)
office of the high commissioner for human rights (ohchr)website: www.ohchr.orgData sources: Multilateral Treaties Deposited with the Secretary General (MTDSG) database (tinyurl.com/IIAG2011-OHCHR-MTDSG); Treaty Body database (tinyurl.com/IIAG2011-OHCHR-TBD)
office of the United nations high commissioner for refugees (Unhcr)website: www.unhcr.orgData source: UNHCR Statistical Online Population Database (tinyurl.com/IIAG2011-UNHCR)
organisation for economic co-operation and development (oecd)website: www.oecd.orgData sources: Gender, Institutions and Development Database (GID-DB) (tinyurl.com/IIAG2011-OECD); African Economic Outlook (AEO) (tinyurl.com/IIAG2011-AEO)
Political Terror Scale (PTS)website: www.politicalterrorscale.orgData source: Political Terror Scale (PTS) (tinyurl.com/IIAG2011-PTS)
reporters sans frontières (rSf)website: http://en.rsf.orgData source: Press Freedom Index (PFI) (tinyurl.com/IIAG2011-RSF)
Uppsala University, department of Peace and conflict research – Uppsala conflict data Programme (UcdP)website: www.pcr.uu.se/research/ucdpData source: UCDP Dataset (tinyurl.com/IIAG2011-UCDP)
US department of State – office to monitor and combat Trafficking in Persons (USdS)website: www.state.gov/g/tipData source: Trafficking in Persons Report (TPR) (tinyurl.com/IIAG2011-USDS)
World health organization (Who)website: www.who.intData sources: WHO/UNICEF Joint Monitoring Programme (JMP) for Water Supply and Sanitation Database (tinyurl.com/IIAG2011-JMP); Global Health Observatory (GHO) (tinyurl.com/IIAG2011-WHO)

2011 Ib
ra
hIm
Ind
ex
of a
fr
Ica
n G
ov
er
na
nc
e: S
um
ma
ry
27
Indicators
Safety and Rule of Law
Rule of LawJudicial Process (EIU)Extent to which the judicial process or courts are subject to interference or distortion by interest groups (EA)
Judicial Independence (BF) Extent to which the courts can interpret and review norms and pursue their own reasoning, free from the influence of rulers or powerful groups and individuals (EA)
Sanctions (CDD Ghana)Imposition of sanctions by the United Nations and/or the African Union on a state and/or governmental and/or non-governmental actors (EA/OD)
Transfers of Power (EIU)Clarity, establishment and acceptance of constitutional mechanisms for the orderly transfer of power from one administration to the next (EA)
Property Rights*Property Rights Z(AfDB, wB)*Extent to which private economic activity is facilitated by an effective legal system and rule-based governance structure in which property and contract rights are reliably respected and enforced (EA)Property Rights (BF) ZExtent to which government ensures well-defined rights of private property and regulates the acquisition of property (EA)Property Rights Protection Z(EIU)Degree to which property rights are respected and enforced (EA)Property Freedom Z(hER-wSJ)Ability of individuals to accumulate private property, secured by clear laws that are fully enforced by the
state. The independence of the judiciary, including the extent of corruption, and the ability to enforce contracts are also assessed (EA)
AccountabilityAccountability, Transparency and Corruption in the Public Sector (AfDB, wB)* Accountability of the executive for use of funds and results of actions by the electorate, legislature and judiciary and extent to which public employees within the executive are accountable for use of resources, administrative decisions and results (EA)
Accountability, Transparency and Corruption in Rural Areas (IFAD)Local level accountability of the executive and legislature, including public employees and elected officials, to low-income rural populations for use of funds and results of actions (EA)
Corruption and Bureaucracy (wB)Intrusiveness of bureaucracy, amount of red tape likely to be encountered and likelihood of experiencing corruption among officials and other groups (EA)
Accountability of Public officials (EIU)Existence of safeguards or sanctions ensuring accountability and performance from public officials (both elected and appointed) (EA)
Corruption in Government and Public officials (EIU)Level of vested cronyism among, and corruption of, public officials (both elected and appointed) (EA)
Prosecution of Abuse of office (BF)Legal or political penalties for officeholders who abuse their positions (EA)
Personal SafetyDomestic Political Persecution*
Physical Integrity Rights Z(CIRI)Prevalence of torture, extrajudicial killings, political imprisonment and disappearance (EA)Political Terror (PTS) ZDegree of state terror, defined as violations of physical or personal integrity rights carried out by a state or its agents. These include state-sanctioned killings, torture, disappearances, and political imprisonment (EA)
Social Unrest (EIU)Prevalence of violent social unrest (EA)
Safety of the Person (EIU)Level of criminality (EA)
Violent Crime (EIU)Prevalence of violent crime, both organised and common (EA)
human Trafficking (USDS)Government action to combat forced labour and involuntary commercial sex (EA)
National SecurityCross-Border Tensions (EIU) Potential threats to economic and political stability due to tensions with neighbouring states (EA)
Government Involvement in Armed Conflict (UCDP)Direct or indirect involvement of the government in an armed conflict which results in at least 25 annual battle-related deaths (EA)
Domestic Armed Conflict (EIU)Level of internal conflict and/or civil war, or the likelihood of conflict developing in the near future (EA)
Political Refugees (UNhCR)People fleeing the country due to fear of persecution (EA)
Internally Displaced People (IDMC)People displaced within the country due to violence, conflict, human rights violations, or natural or human-made disasters (EA)
The Ibrahim Index is compiled using indicators based on either Expert Assessment (EA) or Official Data (OD). Data Providers are shown as acronyms (see p.26) after the name of each indicator and variable.
* A clustered indicator is composed of a number of underlying variables which each measure the same dimension and come from different sources, or measure similar dimensions and come from the same source.

2011 Ib
ra
hIm
Ind
ex
of a
fr
Ica
n G
ov
er
na
nc
e: S
um
ma
ry
28
Participation and Human Rights
ParticipationFree and Fair Executive Elections (IREEP)Freedom and fairness of executive elections across the campaign period and all aspects of the election process, including extent of opposition participation, adherence to electoral procedures, citizens’ access to information, levels of violence, acceptance of results and turnover of power (EA)
Free and Fair Elections (BF) Degree of freedom and fairness of elections (EA)
Political Participation (EIU)Availability of relevant information for citizens and their freedom to participate in the political process (EA)
Electoral Self-Determination (CIRI)Extent to which citizens enjoy freedom of political choice, and the legal right and effective capacity to change laws and governing bodies through free and fair elections (EA)
Effective Power to Govern (BF)Extent to which democratically elected rulers have effective power to govern or to which there are veto powers and political enclaves (EA)
RightsCore International human Rights Conventions (ohChR)Whether a country has ratified the nine core international human rights conventions and, additionally, whether it has submitted the first of a number of regular reports to treaty bodies that monitor implementation (EA/OD)
human Rights (EIU)Likelihood of a state being accused of serious human rights violations (EA)
Political Rights (Fh)Freedom to participate in the political process including the right to vote freely for distinct alternatives in legitimate elections, compete for public office, join political parties and organisations, and elect accountable representatives (EA)
workers’ Rights (CIRI)Extent to which workers enjoy internationally recognised rights at work, including freedom of association, the right to bargain collectively, a minimum age of employment and acceptable conditions with regards to minimum wages, hours of work, and occupational safety and health (EA)
Freedom of Expression*Freedom of Expression (BF) ZExtent to which citizens, organisations and mass media can express opinions freely (EA)Freedom of Speech and ZPress (CIRI)Extent to which freedoms of speech and press are affected by government censorship, including ownership of media outlets (EA)Press Freedom (Fh) ZDegree of print, broadcast and internet freedom (EA)Press Freedom (RSF) ZState of press freedom, including every kind of violation that directly affects journalists (such as murders, imprisonment, physical attacks and threats) and news media (such as censorship, confiscation, searches and harassment). Self-censorship, financial pressure and degree of impunity enjoyed by those responsible for violations are also assessed (EA)
Freedom of Association and Assembly*
Freedom of Association and ZAssembly (BF)Extent to which independent political and/or civic groups can associate and assemble freely (EA)Freedom of Assembly and ZAssociation (CIRI)Extent to which the internationally recognised right of citizens to associate freely with other persons
in political parties, trade unions, cultural organisations or other special interest groups exists in practice (EA)Freedom of Association Z(EIU)Extent to which freedom of association and the right to collective bargaining is respected (EA)
Civil Liberties*Protection of Civil Liberties Z(BF)Extent to which civil rights are guaranteed and protected and citizens can seek redress for violations of these liberties (EA)Civil Liberties (EIU) ZExtent of various citizens’ freedoms including equality under the law, freedom from torture and freedom of expression (EA)Civil Liberties (Fh) ZExtent of civil liberties: freedom of expression and belief; associational and organisational rights; rule of law; and personal autonomy without interference from the state (EA)
GenderGender Equality (AfDB, wB)* Whether a country has enacted, and enforces, laws and policies that promote equal access for men and women to human capital development opportunities, and productive and economic resources; and give men and women equal status and protection under the law (EA)
Gender Balance in Primary and Secondary Education (wB)Ratio of girls to boys enrolled at primary and secondary levels in public and private schools (OD)
women’s Participation in the Labour Force (wB)Proportion of the female population, 15 and older, that is economically active (OD)
Equal Representation in Rural Areas (IFAD)Extent to which laws, policies, institutions and practices promote equal representation of men and women in local decision-making (EA)
women in Parliament (wB)Parliamentary seats, in a single or lower chamber, held by women (OD)
women’s Rights (CIRI)*women’s Economic Rights ZExtent to which women enjoy internationally recognised rights at work (EA)women’s Political Rights ZExtent to which women enjoy internationally recognised rights to participate freely in the political process (EA)
Legislation on Violence against women (oECD)Existence of laws against domestic violence, sexual assault or rape, and sexual harassment (EA)
INDICAToRS
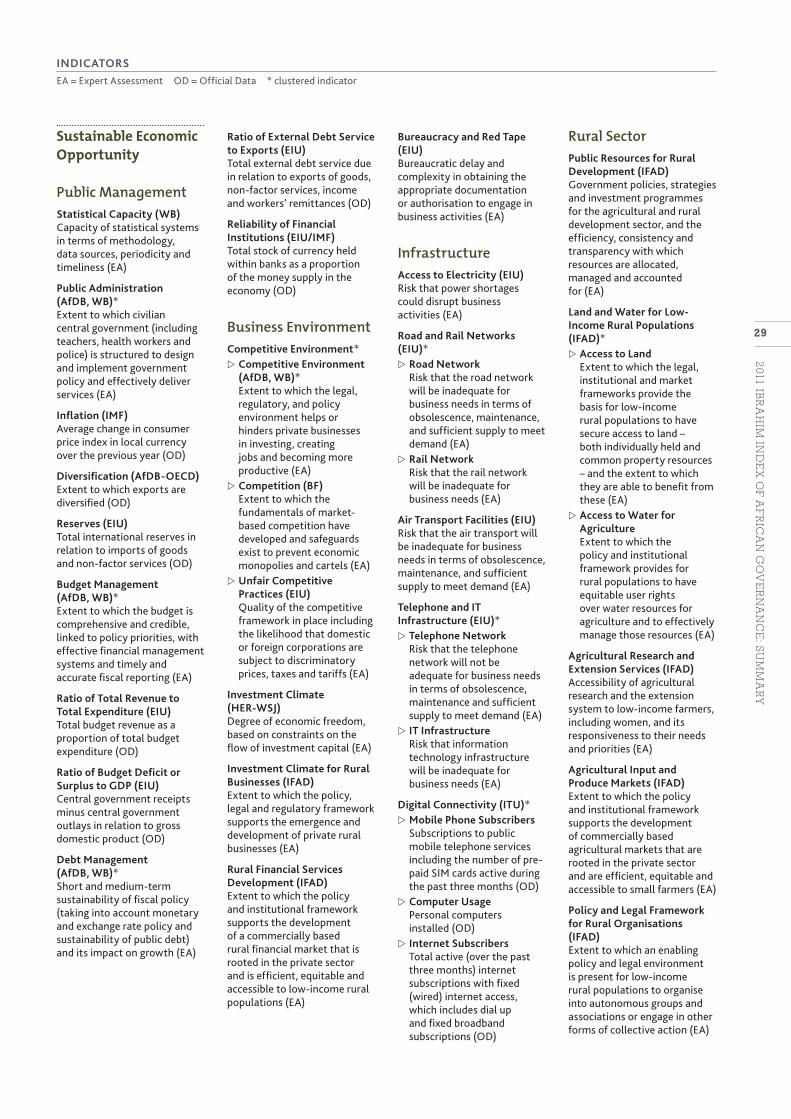
2011 Ib
ra
hIm
Ind
ex
of a
fr
Ica
n G
ov
er
na
nc
e: S
um
ma
ry
29
Sustainable Economic Opportunity
Public ManagementStatistical Capacity (wB)Capacity of statistical systems in terms of methodology, data sources, periodicity and timeliness (EA)
Public Administration (AfDB, wB)* Extent to which civilian central government (including teachers, health workers and police) is structured to design and implement government policy and effectively deliver services (EA)
Inflation (IMF)Average change in consumer price index in local currency over the previous year (OD)
Diversification (AfDB-oECD)Extent to which exports are diversified (OD)
Reserves (EIU)Total international reserves in relation to imports of goods and non-factor services (OD)
Budget Management (AfDB, wB)* Extent to which the budget is comprehensive and credible, linked to policy priorities, with effective financial management systems and timely and accurate fiscal reporting (EA)
Ratio of Total Revenue to Total Expenditure (EIU)Total budget revenue as a proportion of total budget expenditure (OD)
Ratio of Budget Deficit or Surplus to GDP (EIU)Central government receipts minus central government outlays in relation to gross domestic product (OD)
Debt Management (AfDB, wB)* Short and medium-term sustainability of fiscal policy (taking into account monetary and exchange rate policy and sustainability of public debt) and its impact on growth (EA)
Ratio of External Debt Service to Exports (EIU)Total external debt service due in relation to exports of goods, non-factor services, income and workers’ remittances (OD)
Reliability of Financial Institutions (EIU/IMF)Total stock of currency held within banks as a proportion of the money supply in the economy (OD)
Business EnvironmentCompetitive Environment*
Competitive Environment Z(AfDB, wB)*Extent to which the legal, regulatory, and policy environment helps or hinders private businesses in investing, creating jobs and becoming more productive (EA)Competition (BF) ZExtent to which the fundamentals of market-based competition have developed and safeguards exist to prevent economic monopolies and cartels (EA)Unfair Competitive ZPractices (EIU)Quality of the competitive framework in place including the likelihood that domestic or foreign corporations are subject to discriminatory prices, taxes and tariffs (EA)
Investment Climate (hER-wSJ) Degree of economic freedom, based on constraints on the flow of investment capital (EA)
Investment Climate for Rural Businesses (IFAD)Extent to which the policy, legal and regulatory framework supports the emergence and development of private rural businesses (EA)
Rural Financial Services Development (IFAD)Extent to which the policy and institutional framework supports the development of a commercially based rural financial market that is rooted in the private sector and is efficient, equitable and accessible to low-income rural populations (EA)
Bureaucracy and Red Tape (EIU)Bureaucratic delay and complexity in obtaining the appropriate documentation or authorisation to engage in business activities (EA)
InfrastructureAccess to Electricity (EIU)Risk that power shortages could disrupt business activities (EA)
Road and Rail Networks (EIU)*
Road Network ZRisk that the road network will be inadequate for business needs in terms of obsolescence, maintenance, and sufficient supply to meet demand (EA)Rail Network ZRisk that the rail network will be inadequate for business needs (EA)
Air Transport Facilities (EIU)Risk that the air transport will be inadequate for business needs in terms of obsolescence, maintenance, and sufficient supply to meet demand (EA)
Telephone and IT Infrastructure (EIU)*
Telephone Network ZRisk that the telephone network will not be adequate for business needs in terms of obsolescence, maintenance and sufficient supply to meet demand (EA)IT Infrastructure ZRisk that information technology infrastructure will be inadequate for business needs (EA)
Digital Connectivity (ITU)*Mobile Phone Subscribers ZSubscriptions to public mobile telephone services including the number of pre-paid SIM cards active during the past three months (OD)Computer Usage ZPersonal computers installed (OD)Internet Subscribers ZTotal active (over the past three months) internet subscriptions with fixed (wired) internet access, which includes dial up and fixed broadband subscriptions (OD)
Rural SectorPublic Resources for Rural Development (IFAD)Government policies, strategies and investment programmes for the agricultural and rural development sector, and the efficiency, consistency and transparency with which resources are allocated, managed and accounted for (EA)
Land and water for Low-Income Rural Populations (IFAD)*
Access to Land ZExtent to which the legal, institutional and market frameworks provide the basis for low-income rural populations to have secure access to land – both individually held and common property resources – and the extent to which they are able to benefit from these (EA)Access to water for ZAgricultureExtent to which the policy and institutional framework provides for rural populations to have equitable user rights over water resources for agriculture and to effectively manage those resources (EA)
Agricultural Research and Extension Services (IFAD)Accessibility of agricultural research and the extension system to low-income farmers, including women, and its responsiveness to their needs and priorities (EA)
Agricultural Input and Produce Markets (IFAD)Extent to which the policy and institutional framework supports the development of commercially based agricultural markets that are rooted in the private sector and are efficient, equitable and accessible to small farmers (EA)
Policy and Legal Framework for Rural organisations (IFAD)Extent to which an enabling policy and legal environment is present for low-income rural populations to organise into autonomous groups and associations or engage in other forms of collective action (EA)
INDICAToRSEA = Expert Assessment OD = Official Data * clustered indicator

2011 Ib
ra
hIm
Ind
ex
of a
fr
Ica
n G
ov
er
na
nc
e: S
um
ma
ry
30
Dialogue between Government and Rural organisations (IFAD)Extent to which rural populations are able to enter into dialogue with, and lobby, government and express their concerns and priorities, and extent of government responsiveness to low-income rural populations and consideration of their views in policy-making for the sector (EA)
Human Development
Welfarewelfare Regime (BF)Extent to which there is equality of opportunity and there are social safety nets which compensate for poverty and other risks, such as old age, illness, unemployment or disability (EA)
Social Protection and Labour (AfDB, wB)* Government policies in the area of social protection and labour market regulation, which reduce the risk of becoming poor, assist those who are poor to better manage further risks, and ensure a minimum level of welfare to all people (EA)
Social Exclusion (BF)Extent to which significant parts of the population are fundamentally excluded from society due to poverty and inequality combined (income gaps, gender, education, religion, ethnicity) (EA)
welfare Services (health and Education) (AfDB, wB)*National policies and public and private sector service delivery that affect access to and quality of: health and nutrition services, including population and reproductive health; education, early childhood development, training and literacy programmes; and prevention and treatment of HIV/AIDS, tuberculosis and malaria (EA)
Equity of Public Resource Use (AfDB, wB)* Extent to which the pattern of public expenditures and revenue collection affects the poor and is consistent with national poverty reduction priorities (EA)
Access to water (who-UNICEF)*
Access to Piped water ZProportion of the total population served with piped water into their dwelling, yard or plot (OD)Access to Improved water ZProportion of the population that is served with a drinking water source that, by nature of its construction,
adequately protects the source from outside contamination particularly with faecal matter (OD)
Access to Sanitation (who-UNICEF)*
Access to Improved ZSanitationProportion of the total population that is served with a sanitation facility that hygienically separates human excreta from human contact and which includes specified mechanisms for disposal and storage of that waste (OD)open Defecation Sanitation ZProportion of the total population that is forced to dispose of human faeces in outdoor spaces or alongside solid waste (OD)
Environmental Policy (BF)Extent to which environmental concerns are effectively taken into account in both macro and microeconomic policy-making (EA)
Environmental Sustainability (AfDB, wB)*Extent to which environmental policies foster the protection and sustainable use of natural resources and the management of pollution (EA)
EducationEducation Provision and Quality (BF)Extent to which there are solid institutions for basic, secondary, and tertiary education as well as for research and development (EA)
Ratio of Pupils to Teachers in Primary School (wB)Pupils enrolled in primary school in relation to primary school teachers (OD)
Primary School Completion (wB)Students completing the last year of primary school (OD)
Progression to Secondary School (wB)New entrants to the first grade of secondary school in a given year, in relation to students enrolled in the final grade of primary school in the previous year (OD)
Tertiary Enrolment (wB)Total enrolment, regardless of age, in relation to the population of the age group for tertiary education (OD)
HealthMaternal Mortality (who)Female deaths from any cause related to or aggravated by pregnancy or its management (excluding accidental or incidental causes) (OD)
Child Mortality (IGME)Probability of a child born in a specified year dying before reaching the age of five if subject to current age-specific mortality rates (OD)
Immunisation (Measles and DPT) (wB)*
Immunisation against ZMeaslesChildren aged 12–23 months who have received appropriate vaccinations against measles before 12 months or anytime before the survey (OD)Immunisation against DPT ZChildren aged 12–23 months who have received appropriate vaccinations against diphtheria, pertussis and tetanus before 12 months or anytime before the survey (OD)
Antiretroviral Treatment Provision (UNAIDS)Adults and children with advanced HIV infection receiving antiretroviral therapy (OD)
Disease (Cholera, Malaria and TB) (who)*
Cholera ZDeaths due to cholera per 100,000 population per year (OD)Malaria ZDeaths due to malaria per 100,000 population per year (OD)Tuberculosis ZDeaths due to TB, including HIV-related TB deaths per 100,000 population per year (OD)
INDICAToRS

54
61
Egypt
Egypt
49
54
Mali
Mali
48
51
Gabon
Gabon
62
66
Ghana
Ghana
53 53Kenya Kenya
57 57Senegal Senegal
48
33Sierra Leone
Sierra Leone
30
70
55
60
65
35
40
45
50
2000 2001 2003 20042002 2006 200920082005 2007 2010
2011 Ib
ra
hIm
Ind
ex
of a
fr
Ica
n G
ov
er
na
nc
e: S
um
ma
ry
31
Appendix 1: Executive Elections in Africa
A number of African countries will be holding executive elections in 2012. For these countries, the following data
show performances in each category of the Index and the trends over time for overall governance quality.
Overall governance quality scores (2000–2010)
57 59 59 53 59
54 62 56 47 50
48 58 53 43 38
51 59 39 42 64
53 48 53 50 60
66 72 69 53 70
15th
22nd
30th
27th
23rd
7th
Senegal February 2012
Mali April 2012
Sierra Leone August 2012
Gabon November 2012
Kenya tbc
61 63 34 70 7610th Egypt tbc
Ghana December 2012
PARTICIPATION AND HUMAN RIGHTS
SUSTAINABLE ECONOMIC
OPPORTUNITY
HUMAN DEVELOPMENT
SAFETY ANDRULE OF LAW
OVERALLINDEX SCORE
COUNTRY NEXT ELECTIONOVERALL RANK
Index scores for countries with confirmed executive elections

2011 Ib
ra
hIm
Ind
ex
of a
fr
Ica
n G
ov
er
na
nc
e: S
um
ma
ry
32
Appendix 2: Ibrahim Index Timeline (2007–2011)
4
4
4
13
13
14
84
88
86
Amalgamation of ‘Safety and Security’ and‘Rule of Law’ categories
New sub-categories: ‘Gender’ and ‘Environment and Rural Sector’
Combination of ‘Poverty’ and ‘Health’ sub-categories
Increased emphasis on civil liberties
Introduction of underlying variables and sub-category data
+ 0 indicators - 7 indicators
Inaugural edition,no sub-category data provided
+ 11 indicators (assessing HIV/AIDS governance; water and sanitation provision; statistical capacity; gender)
- 8 indicators
Creation of new sub-category through separation of indicators measuring health and welfare
+ 10 indicators (assessing physical and telecommunications infrastructure; gender; health; welfare service provision; and economic management)
- 3 indicators
2009
2010
2011
106
100
121
indicators variablessub-categoriescategories
Transfer of Index compilation from Kennedy School of Government (Harvard) to a Foundation research team with support from an Advisory Council and Technical Committee including representatives from CODESRIA, CDD Ghana and IREEP Benin. The roles of the Technical Committee and Advisory Council were expanded substantially in 2009.
Agreements with Afrobarometer andGlobal Integrity to implement citizen survey and expert assessment projects.
Academic workshop, hosted in partnership with CODESRIA, in Dakar to discuss the measurement and conceptualisation of governance, and the use of the Ibrahim Index for teaching, research and policy-making.
Continued expansion of Technical Committee
Exploration and initial work on projects with Afrobarometer to expand citizen surveys across Africa and with Global Integrity to create expert assessments using experts based on the continent.
Beginnings of capacity development programme that will ultimately see the process of Index compilation transferred to partner institutions in Africa. The programme included a technical workshop in partnership with the London School of Economics and Political Science (LSE).
5
14
51
2008
2007
5
58
15
Kennedy School of Government, Harvard University
Kennedy School of Government, Harvard University

2011 Ib
ra
hIm
Ind
ex
of a
fr
Ica
n G
ov
er
na
nc
e: S
um
ma
ry
33
Mo Ibrahim Foundation Research TeamNathalie Delapalme �
Director of Research and Policy
Elizabeth McGrath �
Head of the Index Team
Salmana Ahmed �
Analyst
Kenza Ziar �
Analyst
Estelle Levoyer �
Data and Research Intern
Dr Daniel Kaufmann �
Special Advisor to the Index
Advisory Council and Technical CommitteeKarin Alexander �
Institute of Democracy in Africa (Idasa), South Africa
Lord Cairns � *Board Member, Mo Ibrahim Foundation
Nathalie Delapalme � *Board Member, Mo Ibrahim Foundation
Keli Gadzekpo �
Databank, Ghana
Dr E Gyimah-Boadi � *Afrobarometer, and Ghana Center for Democratic Development (CDD Ghana), Ghana
Dr Ali Hadi � *American University in Cairo (AUC), Egypt
Dr Abdalla Hamdok � *United Nations Economic Commission for Africa (UNECA), Ethiopia
Hadeel Ibrahim � *Board Member, Mo Ibrahim Foundation
Dr Daniel Kaufmann � *Brookings Institution, USA
Dr Georges Nzongola-Ntalaja �
The University of North Carolina at Chapel Hill, USA
Dr ’Funmi Olonisakin � *King’s College London, UK; African Leadership Centre, Kenya
Julie Oyegun �
World Bank Group, USA
Dr Irene Pogoson �
University of Ibadan, Nigeria
Dr Mamphela Ramphele � *Board Member, Mo Ibrahim Foundation
Dr Ebrima Sall � *Council for the Development of Social Science Research in Africa (CODESRIA), Senegal
Dr Akilagpa Sawyerr � *formerly, Association of African Universities (AAU), Ghana
Dr Piero Stanig � *London School of Economics and Political Science (LSE), UK
Dr Leonard Wantchekon � *Institute for Empirical Research in Political Economy (IREEP), Benin; Princeton University, USA
* Technical Committee Member
Project Team

2011 Ib
ra
hIm
Ind
ex
of a
fr
Ica
n G
ov
er
na
nc
e: S
um
ma
ry
34
The Ibrahim Index has benefited greatly from the advice and expertise of many individuals and institutions over the past five years. As a progressive and consultative project, the Index continues to evolve, accommodating the input, feedback and critiques of numerous stakeholders. This engagement is an essential element in the development of the Index and I would like to express particular thanks to those who have collaborated in, and supported, the 2011 Ibrahim Index.
First of all, warmest thanks go to my fellow Board Members of the Mo Ibrahim Foundation: the Chairman, Dr Mo Ibrahim; Lord Cairns; Hadeel Ibrahim; Sir Ketumile Masire; Dr Mamphela Ramphele; Dr Mary Robinson; and Dr Salim Ahmed Salim for their invaluable guidance during the Index process.
The Ibrahim Index has also benefited from collaboration with Dr Daniel Kaufmann, of the Brookings Institution. His engaged input contributes to making the Ibrahim Index a rigorous and robust reference tool for citizens, governments and analysts.
Special thanks also go to the Ibrahim Index Technical Committee members for sharing their time and expertise. Their insightful and constructive comments contributed greatly to the Index’s overall quality. They are: Dr E. Gyimah Boadi (Afrobarometer/Centre for Democratic Development
Ghana); Dr Ali Hadi (The American University in Cairo); Dr Abdalla Hamdok (UNECA); Dr ‘Funmi Olonisakin (African Leadership Centre); Dr Ebrima Sall (CODESRIA); Dr Akilagpa Sawyerr (Former Head of the Association of African Universities); Dr Piero Stanig (London School of Economics and Political Science); and Dr Leonard Wantchekon (IREEP Benin and Princeton University).
I would also like to thank the Ibrahim Index Advisory Council members who provided important feedback and recommendations in the preparation of the 2011 Ibrahim Index. They are: Karin Alexander (Idasa); Keli Gadzekpo (Databank Ghana); Dr Georges Nzongola-Ntalaja (University of North Carolina at Chapel Hill); Julie Oyegun (The World Bank Group); and Dr Irene Pogoson (University of Ibadan). The Technical Committee members are also members of the Advisory Council.
As a composite index, the Ibrahim Index utilises data from 23 data providers, a full list of which is available in this report. I would like to thank each of the organisations which supplied underlying data for the 2011 Index. Their work is a source of great knowledge which is of service to Africa and the world.
Last but not least, I give special thanks to the members of the Ibrahim Index Research Team: Elizabeth McGrath, Salmana Ahmed, Kenza Ziar and Estelle Levoyer for their hard work and dedication.
Acknowledgements
Nathalie DelapalmeDirector of Research and Policy

2011 Ib
ra
hIm
Ind
ex
of a
fr
Ica
n G
ov
er
na
nc
e: S
um
ma
ry
35
About the Mo Ibrahim Foundation
Established in 2006, by Mo Ibrahim, the Mo Ibrahim Foundation supports good governance and great leadership in Africa. The Foundation works to:
provide a framework and tools by which citizens �
and governments can assess and measure progress in governancerecognise excellence in African leadership and provide a �
practical way in which leaders can build positive legacies on the continent when they have left national officestimulate debate on the quality of governance and major �
governance issues in Africadevelop leadership and governance capacity in Africa. �
Board of DirectorsThe Foundation is governed by a Board of Directors comprised of:
Mo Ibrahim �
(Founder and Chair), Founder, Celtel International
Lord Cairns �
Former Chairman, Actis Capital LLP; former Chief Executive Officer, SG Warburg
Nathalie Delapalme �
Director of Research and Policy, Mo Ibrahim Foundation; former Advisor on Africa and Development issues to various French Foreign Ministers
hadeel Ibrahim �
Director of Strategy and External Relations, Mo Ibrahim Foundation
Sir Ketumile Masire �
Co-Chairperson of the Global Coalition for Africa; former President of Botswana
Dr Mamphela Ramphele �
Former Managing Director, World Bank; former Vice-Chancellor, University of Cape Town
Mary Robinson �
Former President of Ireland; former UN High Commissioner for Human Rights
Salim Ahmed Salim �
Former Secretary-General, Organisation of African Unity; former Prime Minister of Tanzania.
The Ibrahim Index of African GovernanceEstablished in 2007, the Ibrahim Index is the most �
comprehensive collection of quantitative data that provides an annual assessment of governance performance in every African country. Compiled in partnership with experts from a number of African institutions, the Ibrahim Index provides a framework for citizens, public authorities and partners to assess progress in governance. The Index is made up of over 40,000 raw data points and contains 86 indicators from 23 data providers that measure the effective delivery of public goods and services to citizens.
The Ibrahim Prize for Achievement in African Leadership
Established in 2007, the Ibrahim Prize celebrates �
excellence in African leadership. It is awarded to a former Executive Head of State or Government by a Prize Committee composed of eminent figures, including two Nobel Laureates. Previous laureates include President Joaquim Chissano of Mozambique (2007), President Festus Mogae of Botswana (2008) and President Nelson Mandela (Honorary). In 2009 and 2010, the Ibrahim Prize was not awarded by the Prize Committee.
The Ibrahim Discussion ForumEstablished in 2009, the Ibrahim Discussion �
Forum is an annual high level discussion forum on major African issues, facilitated by the Mo Ibrahim Foundation.
Capacity Building ProgrammesThe Ibrahim Scholarship Programmes � are a range of scholarships to support aspiring African leaders at a number of distinguished academic institutions, including Ahfad University in Khartoum, the American University in Cairo, London Business School and the School of Oriental and African Studies.
The Ibrahim Leadership Fellowships Programme � is a selective programme designed to identify and prepare the next generation of outstanding African leaders by providing them with mentoring opportunities in key multilateral institutions. Ibrahim Leadership Fellows will be hosted at the African Development Bank, the UN Economic Commission for Africa and the World Trade Organization. The inaugural Ibrahim Fellows will be announced in November 2011.
The Foundation’s core initiatives

2011 Ib
ra
hIm
Ind
ex
of a
fr
Ica
n G
ov
er
na
nc
e: S
um
ma
ry
36
EGYPT
GUINEA
NIGER
ALGERIALIBYA
TUNISIA
MOROCCO
WESTERN SAHARA
MAURITANIA
MALI
SENEGAL
GAMBIA
GUINEA-BISSAU
SIERRA LEONE
LIBERIAGHANA
TOGOBENIN
BURKINAFASO
NIGERIA
CHAD
CAPE VERDE
ETHIOPIA
KENYA
DJIBOUTI
SOMALIA
UGANDA
RWANDA
BURUNDI
EQUATORIAL GUINEA
CONGO
GABON
CÔTE D’IVOIRE
SUDAN
SOUTHSUDAN
ERITREA
TANZANIA
CENTRAL AFRICAN REPUBLIC
CAMEROON
DEMOCRATIC REPUBLIC OF THE CONGO
SÃO TOMÉ & PRÍNCIPE
ANGOLA
NAMIBIA
ZAMBIA
SWAZILAND
ZIMBABWE
BOTSWANA
MALAWI
MOZAMBIQUE
LESOTHO
MADAGASCAR
SOUTH AFRICA
SEYCHELLES
MAURITIUS
COMOROS
The regional groupings are those used by the African Development Bank (www.afdb.org):
Central Africa: Cameroon, Central African Republic, Chad, Democratic Republic of the Congo, Congo, Equatorial Guinea, Gabon.
East Africa: Burundi, Comoros, Djibouti, Eritrea, Ethiopia, Kenya, Rwanda, Seychelles, Somalia, Sudan, Tanzania, Uganda.
North Africa: Algeria, Egypt, Libya, Mauritania, Morocco, Tunisia.
Southern Africa: Angola, Botswana, Lesotho, Madagascar, Malawi, Mauritius, Mozambique, Namibia, South Africa, Swaziland, Zambia, Zimbabwe.
west Africa: Benin, Burkina Faso, Cape Verde, Côte d’Ivoire, Gambia, Ghana, Guinea, Guinea-Bissau, Liberia, Mali, Niger, Nigeria, São Tomé and Príncipe, Senegal, Sierra Leone, Togo.


published October 2011 2011 Ibrahim Index of African Governance: Summary copyright © 2011 Mo Ibrahim Foundation