2013 ibrahim index of african governance - afcgn.org · ibrahim index of african governance—3...
TRANSCRIPT

2013 Ibrahim Index of African GovernanceSUMMARY

2013 Ibrahim Index of African Governance: Summary
published October 2013
copyright © 2013 Mo Ibrahim Foundation
The Mo Ibrahim Foundation is committed to making data on governance quality in Africa freely available and accessible to all citizens of the continent and interested stakeholders. We welcome and encourage any accurate reproduction, translation and dissemination of this material. The material must be attributed to the Mo Ibrahim Foundation, but not in any way that suggests that the Foundation endorses you or your use of the material.
We also welcome any feedback and comments on the IIAG. To request additional copies of this or other publications, to provide feedback or to discuss use of the IIAG please email [email protected]
Printed and bound in Swindon, England
Designed and typeset by Text Matters (www.textmatters.com)
Foreword—2
Ibrahim Index of African Governance—3
Structure of the 2013 IIAG—4
Synthesis of the Methodology—6
Overall Country Results—8
Key Findings—10
Regional Results—12Central Africa—13East Africa—14North Africa—15Southern Africa—16West Africa—17
Category Results—18Safety & Rule of Law—18Participation & Human Rights—22Sustainable Economic Opportunity—26Human Development—30
Data Sources—34Indicators—35Project Team—39About the Mo Ibrahim Foundation—40Tools—41
Pull-out page:2013 Ibrahim Index of African Governance Country Rankings and Scores
2013 IB
RA
HIM
IND
EX O
F AFR
ICA
N G
OV
ERN
AN
CE: SU
MM
ARY
2
Mo IbrahimFounder and Chair of the Mo Ibrahim Foundation
Foreword
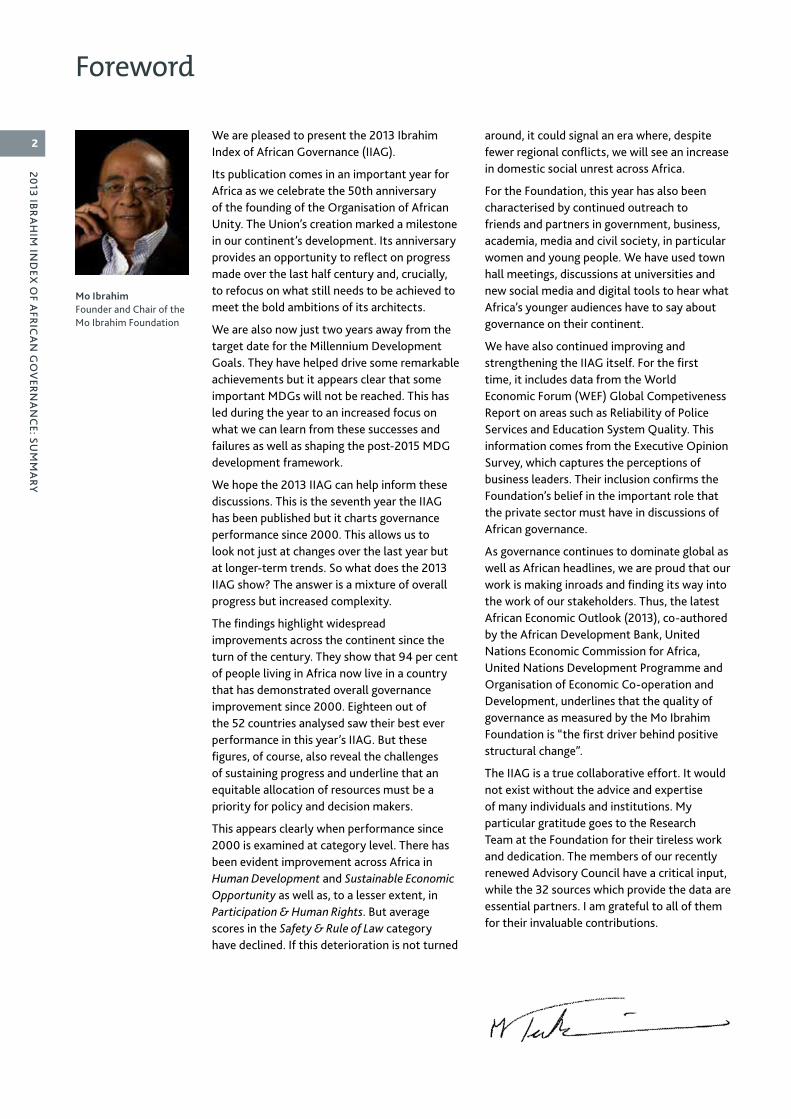
We are pleased to present the 2013 Ibrahim Index of African Governance (IIAG).
Its publication comes in an important year for Africa as we celebrate the 50th anniversary of the founding of the Organisation of African Unity. The Union’s creation marked a milestone in our continent’s development. Its anniversary provides an opportunity to reflect on progress made over the last half century and, crucially, to refocus on what still needs to be achieved to meet the bold ambitions of its architects.
We are also now just two years away from the target date for the Millennium Development Goals. They have helped drive some remarkable achievements but it appears clear that some important MDGs will not be reached. This has led during the year to an increased focus on what we can learn from these successes and failures as well as shaping the post-2015 MDG development framework.
We hope the 2013 IIAG can help inform these discussions. This is the seventh year the IIAG has been published but it charts governance performance since 2000. This allows us to look not just at changes over the last year but at longer-term trends. So what does the 2013 IIAG show? The answer is a mixture of overall progress but increased complexity.
The findings highlight widespread improvements across the continent since the turn of the century. They show that 94 per cent of people living in Africa now live in a country that has demonstrated overall governance improvement since 2000. Eighteen out of the 52 countries analysed saw their best ever performance in this year’s IIAG. But these figures, of course, also reveal the challenges of sustaining progress and underline that an equitable allocation of resources must be a priority for policy and decision makers.
This appears clearly when performance since 2000 is examined at category level. There has been evident improvement across Africa in Human Development and Sustainable Economic Opportunity as well as, to a lesser extent, in Participation & Human Rights. But average scores in the Safety & Rule of Law category have declined. If this deterioration is not turned
around, it could signal an era where, despite fewer regional conflicts, we will see an increase in domestic social unrest across Africa.
For the Foundation, this year has also been characterised by continued outreach to friends and partners in government, business, academia, media and civil society, in particular women and young people. We have used town hall meetings, discussions at universities and new social media and digital tools to hear what Africa’s younger audiences have to say about governance on their continent.
We have also continued improving and strengthening the IIAG itself. For the first time, it includes data from the World Economic Forum (WEF) Global Competiveness Report on areas such as Reliability of Police Services and Education System Quality. This information comes from the Executive Opinion Survey, which captures the perceptions of business leaders. Their inclusion confirms the Foundation’s belief in the important role that the private sector must have in discussions of African governance.
As governance continues to dominate global as well as African headlines, we are proud that our work is making inroads and finding its way into the work of our stakeholders. Thus, the latest African Economic Outlook (2013), co-authored by the African Development Bank, United Nations Economic Commission for Africa, United Nations Development Programme and Organisation of Economic Co-operation and Development, underlines that the quality of governance as measured by the Mo Ibrahim Foundation is “the first driver behind positive structural change”.
The IIAG is a true collaborative effort. It would not exist without the advice and expertise of many individuals and institutions. My particular gratitude goes to the Research Team at the Foundation for their tireless work and dedication. The members of our recently renewed Advisory Council have a critical input, while the 32 sources which provide the data are essential partners. I am grateful to all of them for their invaluable contributions.
2013 IB
RA
HIM
IND
EX O
F AFR
ICA
N G
OV
ERN
AN
CE: SU
MM
ARY
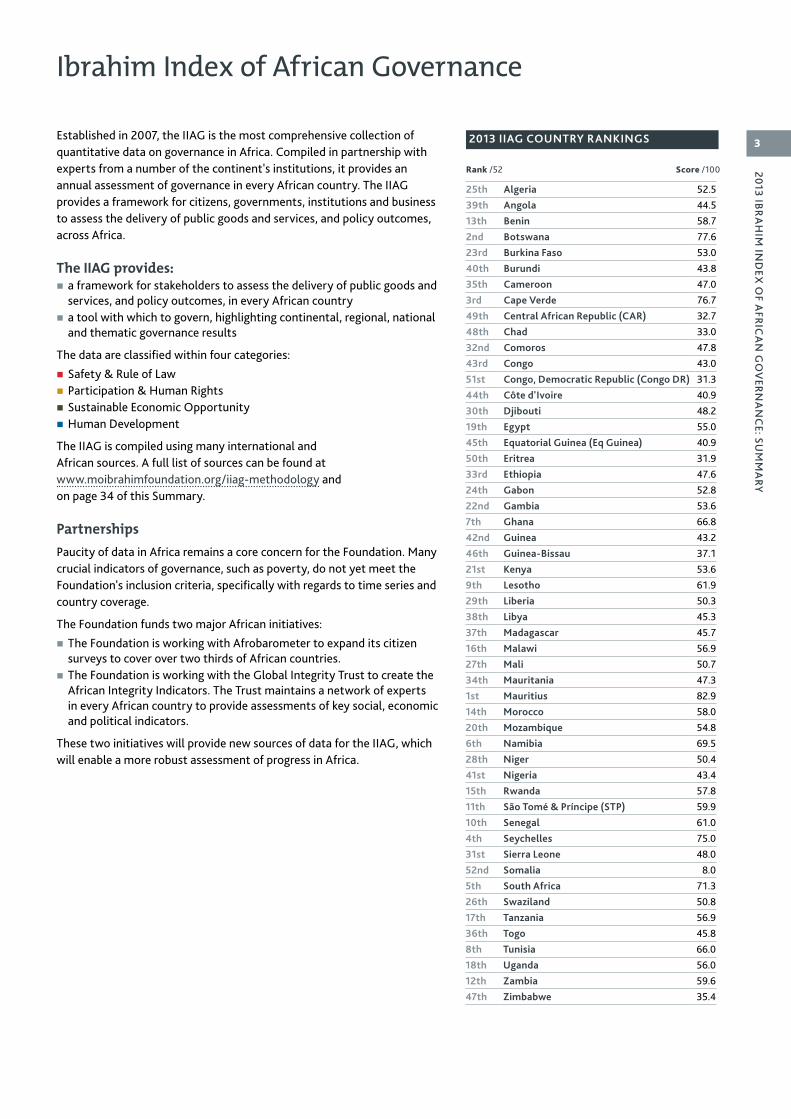
3Established in 2007, the IIAG is the most comprehensive collection of quantitative data on governance in Africa. Compiled in partnership with experts from a number of the continent's institutions, it provides an annual assessment of governance in every African country. The IIAG provides a framework for citizens, governments, institutions and business to assess the delivery of public goods and services, and policy outcomes, across Africa.
The IIAG provides: � a framework for stakeholders to assess the delivery of public goods and services, and policy outcomes, in every African country
� a tool with which to govern, highlighting continental, regional, national and thematic governance results
The data are classified within four categories:
� Safety & Rule of Law � Participation & Human Rights � Sustainable Economic Opportunity � Human Development
The IIAG is compiled using many international and African sources. A full list of sources can be found at www.moibrahimfoundation.org/iiag-methodology and on page 34 of this Summary.
PartnershipsPaucity of data in Africa remains a core concern for the Foundation. Many crucial indicators of governance, such as poverty, do not yet meet the Foundation's inclusion criteria, specifically with regards to time series and country coverage.
The Foundation funds two major African initiatives:
� The Foundation is working with Afrobarometer to expand its citizen surveys to cover over two thirds of African countries.
� The Foundation is working with the Global Integrity Trust to create the African Integrity Indicators. The Trust maintains a network of experts in every African country to provide assessments of key social, economic and political indicators.
These two initiatives will provide new sources of data for the IIAG, which will enable a more robust assessment of progress in Africa.
Ibrahim Index of African Governance
25th Algeria 52.539th Angola 44.513th Benin 58.72nd Botswana 77.623rd Burkina Faso 53.040th Burundi 43.835th Cameroon 47.03rd Cape Verde 76.749th Central African Republic (CAR) 32.748th Chad 33.032nd Comoros 47.843rd Congo 43.051st Congo, Democratic Republic (Congo DR) 31.344th Côte d'Ivoire 40.930th Djibouti 48.219th Egypt 55.045th Equatorial Guinea (Eq Guinea) 40.950th Eritrea 31.933rd Ethiopia 47.624th Gabon 52.822nd Gambia 53.67th Ghana 66.842nd Guinea 43.246th Guinea-Bissau 37.121st Kenya 53.69th Lesotho 61.929th Liberia 50.338th Libya 45.337th Madagascar 45.716th Malawi 56.927th Mali 50.734th Mauritania 47.31st Mauritius 82.914th Morocco 58.020th Mozambique 54.86th Namibia 69.528th Niger 50.441st Nigeria 43.415th Rwanda 57.811th São Tomé & Príncipe (STP) 59.910th Senegal 61.04th Seychelles 75.031st Sierra Leone 48.052nd Somalia 8.05th South Africa 71.326th Swaziland 50.817th Tanzania 56.936th Togo 45.88th Tunisia 66.018th Uganda 56.012th Zambia 59.647th Zimbabwe 35.4
Rank /52 Score /100
2013 IIAG COUNTRY RANKINGS
2013 IB
RA
HIM
IND
EX O
F AFR
ICA
N G
OV
ERN
AN
CE: SU
MM
ARY
4
Judicial Process (Commd EIU)
Judicial Independence
Judicial Independence (BTI BS) Judicial Independence (GCR WEF)
Sanctions (Commd CDD)
Transfers of Power (Commd EIU)
Property Rights
Property Rights* (CPA AfDB) (IRAI WB) Property Rights (BTI BS) Property Rights Protection (Commd EIU) Property Freedom (Index Econ Freedom HER-WSJ) Property Rights (GCR WEF)
5 indicators
Rule Of Law
7 indicators
Accountability, Transparency & Corruption in the Public Sector
Accountability, Transparency & Corruption in the Public Sector (CPA AfDB) (IRAI WB)
Prosecution of Abuse of Office (BTI BS)
Diversion of Public Funds (GCR WEF)
Corruption in Government & Public Officials (Commd EIU)
Accountability of Public Officials (Commd EIU)
Corruption & Bureaucracy (WGI WB)
Accountability, Transparency & Corruption in Rural Areas (PBAS IFAD)
Accountability
6 indicators
Domestic Political Persecution
Physical Integrity Rights (CIRI CIRI) Political Terror (PTS PTS)
Social Unrest (Commd EIU)
Safety of the Person (Commd EIU)
Violent Crime (Commd EIU)
Human Trafficking (TIP USDS)
Personal Safety
5 indicators
Cross-Border Tensions (Commd EIU)
Government Involvement in Armed Conflict (UCDP/PRIO UCDP)
Domestic Armed Conflict (Commd EIU)
Political Refugees (Online Population Database UNHCR)
Internally Displaced People (Global Overview of Trends IDMC)
National Security
SAFETY & RULE OF LAW
Free & Fair Executive Elections (Commd IREEP)
Free & Fair Elections (BTI BS)
Political Participation (DemIndex EIU)
Electoral Self-Determination (CIRI CIRI)
Effective Power to Govern (BTI BS)
5 indicators
Participation
Core International Human Rights Conventions (MTDSG OHCHR)
Human Rights (Commd EIU)
Political Rights (FITW FH)
Workers’ Rights (CIRI CIRI)
Freedom of Expression
Freedom of Expression (BTI BS) Freedom of Speech & Press (CIRI CIRI) Press Freedom (FOTP FH)
Freedom of Association & Assembly
Freedom of Association & Assembly (BTI BS) Freedom of Association & Assembly (CIRI CIRI) Freedom of Association (Commd EIU)
Civil Liberties
Protection of Civil Liberties (BTI BS) Civil Liberties (DemIndex EIU) Civil Liberties (FITW FH)
7 indicators
Rights
Gender Equality
Gender Equality (CPA AfDB) (IRAI WB)
Gender Balance in Primary & Secondary Education (WDI WB)
Women’s Participation in the Labour Force (WDI WB)
Equal Representation in Rural Areas (PBAS IFAD)
Women in Parliament (WDI WB)
Women’s Rights
Women’s Economic Rights (CIRI CIRI) Women’s Political Rights (CIRI CIRI)
Legislation on Violence against Women (GID-DB/SIGI OECD)
7 indicators
Gender
PARTICIPATION & HUMAN RIGHTS
Overall Governance Score
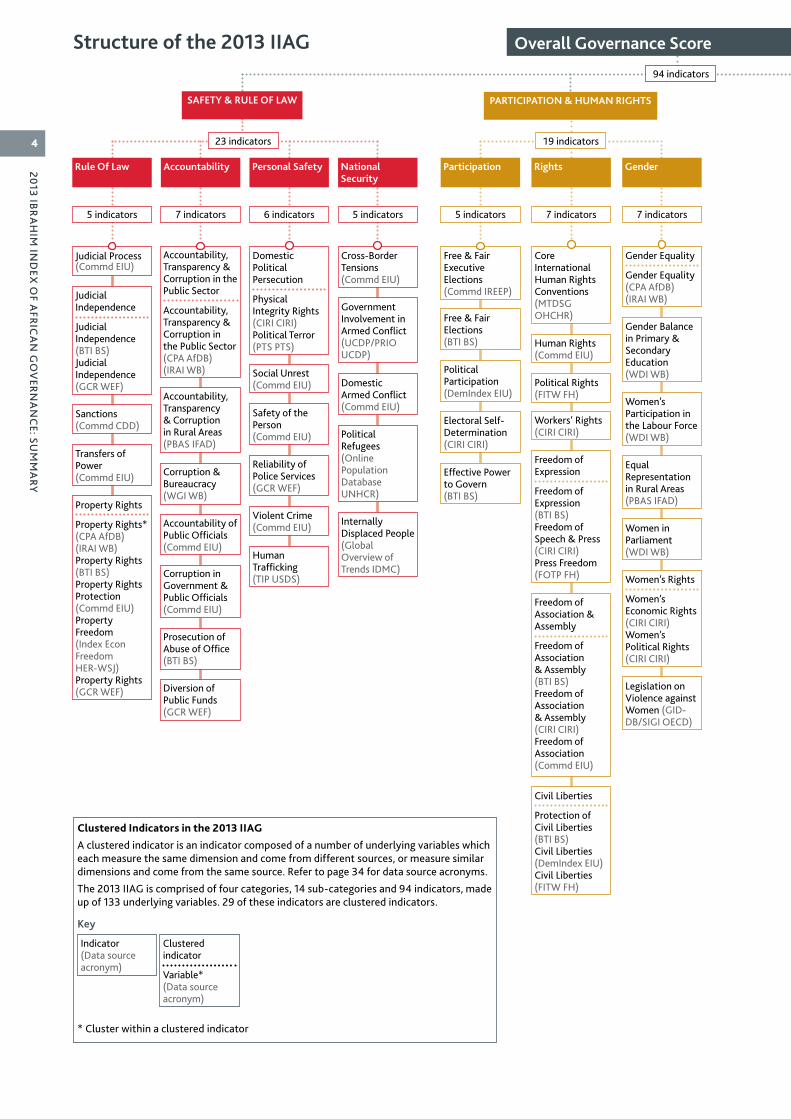
23 indicators 19 indicators
94 indicators
Clustered Indicators in the 2013 IIAG
A clustered indicator is an indicator composed of a number of underlying variables which each measure the same dimension and come from different sources, or measure similar dimensions and come from the same source. Refer to page 34 for data source acronyms.
The 2013 IIAG is comprised of four categories, 14 sub-categories and 94 indicators, made up of 133 underlying variables. 29 of these indicators are clustered indicators.
Key
Indicator (Data source acronym)
Clustered indicator
Variable* (Data source acronym)
* Cluster within a clustered indicator
Reliability of Police Services (GCR WEF)
Structure of the 2013 IIAG

2013 IB
RA
HIM
IND
EX O
F AFR
ICA
N G
OV
ERN
AN
CE: SU
MM
ARY
5
Statistical Capacity (BBSC WB)
Public Administration
Public Administration (CPA AfDB) (IRAI WB)
Inflation (ASY AU / AfDB / UNECA)
Diversification (AEO AfDB / OECD / UNDP / UNECA)
Reserves (CountryData EIU)
Budget Management
Budget Management (CPA AfDB) (IRAI WB)
Ratio of Total Revenue to Total Expenditure (ASY AU / AfDB / UNECA)
Soundness of Banks (GCR WEF)
Fiscal Policy
Fiscal Policy (CPA AfDB) (IRAI WB)
Ratio of External Debt Service to Exports (CountryData EIU)
Revenue Collection
Revenue Collection (CPA AfDB) (IRAI WB)
11 indicators
Public Management
Competitive Environment
Competitive Environment * (CPA AfDB) (IRAI WB) Competition (BTI BS) Unfair Competitive Practices (Commd EIU)
Investment Climate (Index Econ Freedom HER-WSJ)
Investment Climate for Rural Businesses (PBAS IFAD)
Rural Financial Services Development (PBAS IFAD)
Bureaucracy & Red Tape (Commd EIU)
Customs Procedures (GCR WEF)
6 indicators
Business Environment
Electricity
Access to Electricity (Commd EIU) Quality of Electricity Supply (GCR WEF)
Air Transport
Air Transport Facilities (Commd EIU) Quality of Air Transport (GCR WEF)
Telephone & IT Infrastructure
Telephone Network (Commd EIU) IT Infrastructure (Commd EIU)
Digital Connectivity
Mobile Phone Subscribers (ICT Database ITU) Household Computers (ICT Database ITU) Internet Subscribers (ICT Database ITU)
Rail Network (Commd EIU)
Roads
Road Network (Commd EIU) Quality of Roads (GCR WEF)
6 indicators
Infrastructure
Public Resources for Rural Development (PBAS IFAD)
Land & Water for low income Rural Populations
Access to Land (PBAS IFAD) Access to Water for Agriculture (PBAS IFAD)
Agricultural Input & Produce Markets (PBAS IFAD)
Agricultural Research & Extension Services (PBAS IFAD)
Policy & Legal Framework for Rural Organisations (PBAS IFAD)
Dialogue between Government & Rural Organisations (PBAS IFAD)
Agricultural Policy Costs (GCR WEF)
7 indicators
Rural Sector
SUSTAINABLE ECONOMIC OPPORTUNITY
Welfare Regime (BTI BS)
Social Protection & Labour
Social Protection & Labour (CPA AfDB) (IRAI WB)
Social Exclusion (BTI BS)
Welfare Services (Health & Education)
Welfare Services (Health & Education) (CPA AfDB) (IRAI WB)
Equity of Public Resource Use
Equity of Public Resource Use (CPA AfDB) (IRAI WB)
Access to Water
Access to Piped Water (WHO/UNICEF JMP WHO) Access to Improved Water (WHO/UNICEF JMP WHO)
Access to Sanitation
Access to Improved Sanitation (WHO/UNICEF JMP WHO) Open Defecation Sanitation (WHO/UNICEF JMP WHO)
Environmental Policy (BTI BS)
Environmental Sustainability
Environmental Sustainability (CPA AfDB) (IRAI WB)
9 indicators
Welfare
Education Provision & Quality (BTI BS)
Ratio of Pupils to Teachers in Primary School (WDI WB)
Educational System Quality (GCR WEF)
Primary School Completion (WDI WB)
Progression to Secondary School (WDI WB)
Tertiary Enrolment (WDI WB)
Literacy (UIS UNESCO)
7 indicators
Education
Maternal Mortality (GHO WHO)
Child Mortality (CME IGME)
Immunisation (Measles & DPT)
Immunisation against Measles (WDI WB) Immunisation against DPT (WDI WB)
Antiretroviral Treatment Provision
ART Provision (AIDSinfo UNAIDS) ART Provision for Pregnant Women (AIDSinfo UNAIDS)
Disease (Malaria & TB)
Malaria (GHO WHO) Tuberculosis (GHO WHO)
6 indicators
Health
HUMAN DEVELOPMENT
Overall Governance Score
30 indicators 22 indicators
Undernourish-ment (WDI WB)

2013 IB
RA
HIM
IND
EX O
F AFR
ICA
N G
OV
ERN
AN
CE: SU
MM
ARY
6
Synthesis of the Methodology
The Ibrahim Index of African Governance (IIAG) is an annually published composite index that provides a statistical measure of governance performance in African countries.
Governance is defined by the Mo Ibrahim Foundation as the provision of the political, social and economic public goods and services that a citizen has the right to expect from his or her state, and that a state has the responsibility to deliver to its citizens. This definition is focused on outputs and outcomes of policy. The IIAG governance framework comprises four dimensions (categories): Safety & Rule of Law, Participation & Human Rights, Sustainable Economic
Opportunity, and Human Development. These categories are made up of 14 sub-categories, consisting of 94 indicators. The 2013 IIAG is calculated using data from 32 independent, external sources.
Slight annual refinements are made to the IIAG, which may be methodological, or based on the inclusion or exclusion of indicators. The entire IIAG data set is therefore retrospectively revised, in accordance with best practices. Although the changes are not very large, comparisons between years should therefore be performed entirely on the 2013 IIAG data set.
Calculation Steps1 Indicators that are consistent with the Foundation’s
definition of governance and meet basic standards of quality, periodicity and country coverage are identified as proxy measurements. In particular, they cover at least two thirds of the countries on the continent and provide at least two years of data between 2000 and 2012. The latest available data should not be more than three years old and future data releases should be regular (at least every three years).
2 Missing raw data values are estimated. Outlier data values are subject to statistical treatment to mitigate their impact.
3 As data included in the 2013 IIAG come from 32 sources, these raw data must be standardised in order to be meaningfully combined. The data for each indicator are transformed by the method of Min-Max normalisation which puts the data on a standardised 0–100 range, where 100 is the best possible score.
4 A simple statistical method of data aggregation is applied to combine the normalised indicators into sub-categories, the sub-categories into categories and the categories into the overall IIAG.
Data Results � Overall IIAG, category, sub-category and indicator level scores and ranks, for all countries in all years (the 2013 IIAG covers 2000-2012), are published. These results can be accessed at: http://www.moibrahimfoundation.org/downloads/2013-IIAG.xls
� The inherently unobservable nature of the true quality of governance in a country means that the IIAG is a proxy measurement and that uncertainty and imprecision will accompany the scores. Thus the IIAG scores are complemented by the estimation of margins of error (using a bootstrapping methodology). Given that measurement imprecision exists in any governance index, users of the IIAG are encouraged to avoid the over-interpretation of small score differences and the application of a 90% confidence range is recommended (which on average translates to roughly a margin of error of ± 4.2 points).
The data set used to calculate the 2013 IIAG contains data from 2000 to 2012.
Comparisons between sub-categories should only be made on the basis of rank. These comparisons are relative (not absolute) for each country.
All figures have been rounded to one decimal place for this report. Countries may appear to have the same score but do not when additional decimal places are taken into account. Countries have been ranked and trends have been described based on the full scores, not the rounded numbers that appear here. Full scores can be accessed at bit.ly/1b4q7NK.

2013 IB
RA
HIM
IND
EX O
F AFR
ICA
N G
OV
ERN
AN
CE: SU
MM
ARY
7
Safety & Rule of Law
Human Development
Sustainable Economic
Opportunity
Participation & Human
Rights
IIAG
raw data1
2 indicators
3 sub-categories
4 categories
The raw data gathered come in different units and scales. Before they can be used in the IIAG, they are transformed onto a scale on which they can be meaningfully compared and averaged.*
Once the 94 indicators have been transformed to a common scale, each one is grouped with similar indicators to form 14 sub-categories. The sub-category score is the simple average of all the indicator scores.
Sub-categories are then grouped into one of four categories; the category score is the average of sub-category scores.
The category scores are then averaged to produce the final IIAG score.
1 2 3 4
IIAG: From raw data to final scores
* Clustered indicators: 29 indicators were formed by clustering a number of underlying variables which each measure the same dimension and come from different sources, or measure similar concepts and come from the same source. A cluster is formed by averaging the underlying variables (post normalisation).
METHODOLOGY

2013 IB
RA
HIM
IND
EX O
F AFR
ICA
N G
OV
ERN
AN
CE: SU
MM
ARY
8 Top 101 Mauritius2 Botswana3 Cape Verde4 Seychelles5 South Africa6 Namibia7 Ghana8 Tunisia9 Lesotho10 Senegal
Bottom 1043 Congo44 Côte d'Ivoire45 Equatorial Guinea46 Guinea-Bissau47 Zimbabwe48 Chad49 CAR50 Eritrea51 Congo DR52 Somalia
Biggest Improvements
Biggest Deteriorations
29th Liberia 50.3 +24.8
39th Angola 44.5 +18.1
31st Sierra Leone 48.0 +14.8
15th Rwanda 57.8 +10.9
40th Burundi 43.8 +8.8
37th Madagascar 45.7 -11.7
50th Eritrea 31.9 -5.5
46th Guinea-Bissau 37.1 -1.8
52nd Somalia 8.0 -1.7
38th Libya 45.3 -0.4
RANK /52 2012
RANK /52 2012
SCORE /100 2012
SCORE /100 2012
CHANGE SINCE 2000
CHANGE SINCE 2000
Overall
46
20
Safety & Rule of Law
35
Participation & Human Rights
45
Sustainable Economic Opportunity
52
HumanDevelopment
Number of countries with improved scores 2000-2012
Continental average 51.6
Highest country score Mauritius (82.9)
Lowest country score Somalia (8.0)
Highest regional average Southern Africa (59.2)
Lowest regional average Central Africa (40.1)
SUMMARY
average (51.6) |
MauritiusBotswanaCape VerdeSeychellesSouth AfricaNamibiaGhanaTunisiaLesothoSenegalSTPZambiaBeninMoroccoRwandaMalawiTanzaniaUgandaEgyptMozambiqueKenyaGambiaBurkina FasoGabonAlgeriaSwazilandMaliNigerLiberiaDjiboutiSierra LeoneComorosEthiopiaMauritaniaCameroonTogoMadagascarLibyaAngolaBurundiNigeriaGuineaCongoCôte d'IvoireEq GuineaGuinea-BissauZimbabweChadCAREritreaCongo DRSomalia
82.9
77.6
76.7
75.0
71.3
69.5
66.8
66.0
61.9
61.0
59.9
59.6
58.7
58.0
57.8
56.9
56.9
56.0
55.0
54.8
53.6
53.6
53.0
52.8
52.5
50.8
50.7
50.4
50.3
48.2
48.0
47.8
47.6
47.3
47.0
45.8
45.7
45.3
44.5
43.8
43.4
43.2
43.0
40.9
40.9
37.1
35.4
33.0
32.7
31.9
31.3
8.0
SCORE /100
Overall Country Results
2013 IB
RA
HIM
IND
EX O
F AFR
ICA
N G
OV
ERN
AN
CE: SU
MM
ARY
9
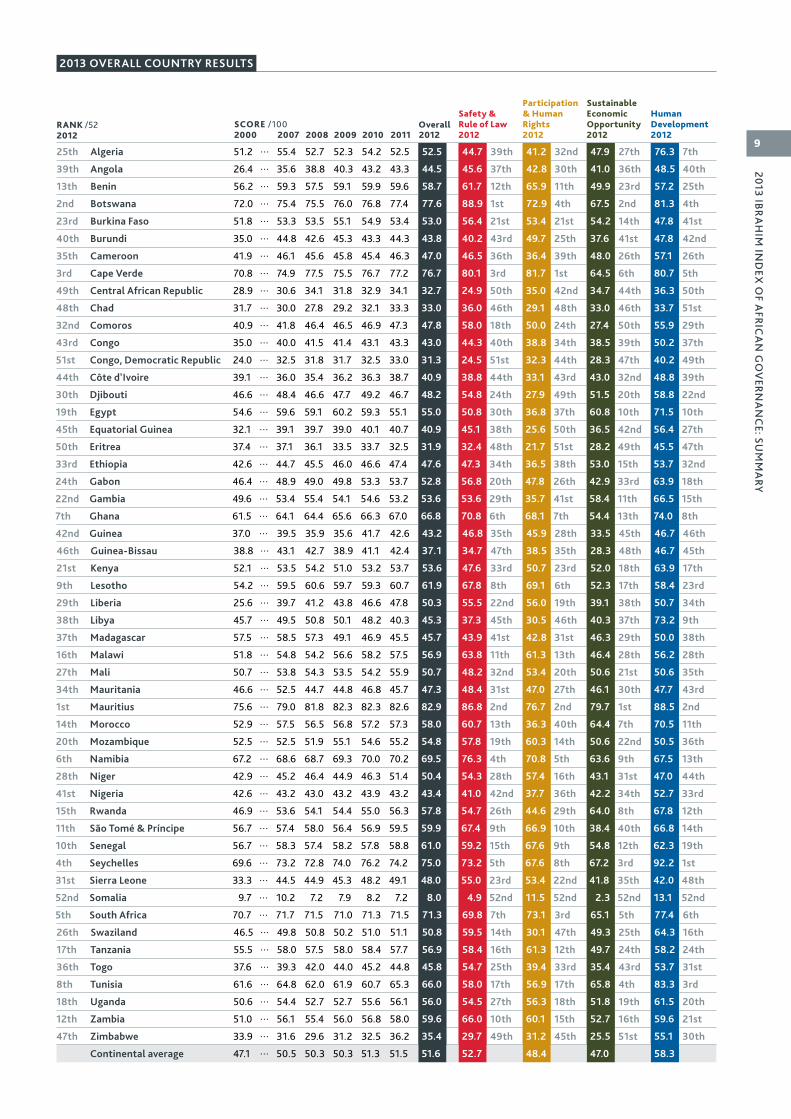
2013 OVERALL COUNTRY RESULTS
25th Algeria 51.2 … 55.4 52.7 52.3 54.2 52.5 52.5 44.7 39th 41.2 32nd 47.9 27th 76.3 7th
39th Angola 26.4 … 35.6 38.8 40.3 43.2 43.3 44.5 45.6 37th 42.8 30th 41.0 36th 48.5 40th
13th Benin 56.2 … 59.3 57.5 59.1 59.9 59.6 58.7 61.7 12th 65.9 11th 49.9 23rd 57.2 25th
2nd Botswana 72.0 … 75.4 75.5 76.0 76.8 77.4 77.6 88.9 1st 72.9 4th 67.5 2nd 81.3 4th
23rd Burkina Faso 51.8 … 53.3 53.5 55.1 54.9 53.4 53.0 56.4 21st 53.4 21st 54.2 14th 47.8 41st
40th Burundi 35.0 … 44.8 42.6 45.3 43.3 44.3 43.8 40.2 43rd 49.7 25th 37.6 41st 47.8 42nd
35th Cameroon 41.9 … 46.1 45.6 45.8 45.4 46.3 47.0 46.5 36th 36.4 39th 48.0 26th 57.1 26th
3rd Cape Verde 70.8 … 74.9 77.5 75.5 76.7 77.2 76.7 80.1 3rd 81.7 1st 64.5 6th 80.7 5th
49th Central African Republic 28.9 … 30.6 34.1 31.8 32.9 34.1 32.7 24.9 50th 35.0 42nd 34.7 44th 36.3 50th
48th Chad 31.7 … 30.0 27.8 29.2 32.1 33.3 33.0 36.0 46th 29.1 48th 33.0 46th 33.7 51st
32nd Comoros 40.9 … 41.8 46.4 46.5 46.9 47.3 47.8 58.0 18th 50.0 24th 27.4 50th 55.9 29th
43rd Congo 35.0 … 40.0 41.5 41.4 43.1 43.3 43.0 44.3 40th 38.8 34th 38.5 39th 50.2 37th
51st Congo, Democratic Republic 24.0 … 32.5 31.8 31.7 32.5 33.0 31.3 24.5 51st 32.3 44th 28.3 47th 40.2 49th
44th Côte d'Ivoire 39.1 … 36.0 35.4 36.2 36.3 38.7 40.9 38.8 44th 33.1 43rd 43.0 32nd 48.8 39th
30th Djibouti 46.6 … 48.4 46.6 47.7 49.2 46.7 48.2 54.8 24th 27.9 49th 51.5 20th 58.8 22nd
19th Egypt 54.6 … 59.6 59.1 60.2 59.3 55.1 55.0 50.8 30th 36.8 37th 60.8 10th 71.5 10th
45th Equatorial Guinea 32.1 … 39.1 39.7 39.0 40.1 40.7 40.9 45.1 38th 25.6 50th 36.5 42nd 56.4 27th
50th Eritrea 37.4 … 37.1 36.1 33.5 33.7 32.5 31.9 32.4 48th 21.7 51st 28.2 49th 45.5 47th
33rd Ethiopia 42.6 … 44.7 45.5 46.0 46.6 47.4 47.6 47.3 34th 36.5 38th 53.0 15th 53.7 32nd
24th Gabon 46.4 … 48.9 49.0 49.8 53.3 53.7 52.8 56.8 20th 47.8 26th 42.9 33rd 63.9 18th
22nd Gambia 49.6 … 53.4 55.4 54.1 54.6 53.2 53.6 53.6 29th 35.7 41st 58.4 11th 66.5 15th
7th Ghana 61.5 … 64.1 64.4 65.6 66.3 67.0 66.8 70.8 6th 68.1 7th 54.4 13th 74.0 8th
42nd Guinea 37.0 … 39.5 35.9 35.6 41.7 42.6 43.2 46.8 35th 45.9 28th 33.5 45th 46.7 46th
46th Guinea-Bissau 38.8 … 43.1 42.7 38.9 41.1 42.4 37.1 34.7 47th 38.5 35th 28.3 48th 46.7 45th
21st Kenya 52.1 … 53.5 54.2 51.0 53.2 53.7 53.6 47.6 33rd 50.7 23rd 52.0 18th 63.9 17th
9th Lesotho 54.2 … 59.5 60.6 59.7 59.3 60.7 61.9 67.8 8th 69.1 6th 52.3 17th 58.4 23rd
29th Liberia 25.6 … 39.7 41.2 43.8 46.6 47.8 50.3 55.5 22nd 56.0 19th 39.1 38th 50.7 34th
38th Libya 45.7 … 49.5 50.8 50.1 48.2 40.3 45.3 37.3 45th 30.5 46th 40.3 37th 73.2 9th
37th Madagascar 57.5 … 58.5 57.3 49.1 46.9 45.5 45.7 43.9 41st 42.8 31st 46.3 29th 50.0 38th
16th Malawi 51.8 … 54.8 54.2 56.6 58.2 57.5 56.9 63.8 11th 61.3 13th 46.4 28th 56.2 28th
27th Mali 50.7 … 53.8 54.3 53.5 54.2 55.9 50.7 48.2 32nd 53.4 20th 50.6 21st 50.6 35th
34th Mauritania 46.6 … 52.5 44.7 44.8 46.8 45.7 47.3 48.4 31st 47.0 27th 46.1 30th 47.7 43rd
1st Mauritius 75.6 … 79.0 81.8 82.3 82.3 82.6 82.9 86.8 2nd 76.7 2nd 79.7 1st 88.5 2nd
14th Morocco 52.9 … 57.5 56.5 56.8 57.2 57.3 58.0 60.7 13th 36.3 40th 64.4 7th 70.5 11th
20th Mozambique 52.5 … 52.5 51.9 55.1 54.6 55.2 54.8 57.8 19th 60.3 14th 50.6 22nd 50.5 36th
6th Namibia 67.2 … 68.6 68.7 69.3 70.0 70.2 69.5 76.3 4th 70.8 5th 63.6 9th 67.5 13th
28th Niger 42.9 … 45.2 46.4 44.9 46.3 51.4 50.4 54.3 28th 57.4 16th 43.1 31st 47.0 44th
41st Nigeria 42.6 … 43.2 43.0 43.2 43.9 43.2 43.4 41.0 42nd 37.7 36th 42.2 34th 52.7 33rd
15th Rwanda 46.9 … 53.6 54.1 54.4 55.0 56.3 57.8 54.7 26th 44.6 29th 64.0 8th 67.8 12th
11th São Tomé & Príncipe 56.7 … 57.4 58.0 56.4 56.9 59.5 59.9 67.4 9th 66.9 10th 38.4 40th 66.8 14th
10th Senegal 56.7 … 58.3 57.4 58.2 57.8 58.8 61.0 59.2 15th 67.6 9th 54.8 12th 62.3 19th
4th Seychelles 69.6 … 73.2 72.8 74.0 76.2 74.2 75.0 73.2 5th 67.6 8th 67.2 3rd 92.2 1st
31st Sierra Leone 33.3 … 44.5 44.9 45.3 48.2 49.1 48.0 55.0 23rd 53.4 22nd 41.8 35th 42.0 48th
52nd Somalia 9.7 … 10.2 7.2 7.9 8.2 7.2 8.0 4.9 52nd 11.5 52nd 2.3 52nd 13.1 52nd
5th South Africa 70.7 … 71.7 71.5 71.0 71.3 71.5 71.3 69.8 7th 73.1 3rd 65.1 5th 77.4 6th
26th Swaziland 46.5 … 49.8 50.8 50.2 51.0 51.1 50.8 59.5 14th 30.1 47th 49.3 25th 64.3 16th
17th Tanzania 55.5 … 58.0 57.5 58.0 58.4 57.7 56.9 58.4 16th 61.3 12th 49.7 24th 58.2 24th
36th Togo 37.6 … 39.3 42.0 44.0 45.2 44.8 45.8 54.7 25th 39.4 33rd 35.4 43rd 53.7 31st
8th Tunisia 61.6 … 64.8 62.0 61.9 60.7 65.3 66.0 58.0 17th 56.9 17th 65.8 4th 83.3 3rd
18th Uganda 50.6 … 54.4 52.7 52.7 55.6 56.1 56.0 54.5 27th 56.3 18th 51.8 19th 61.5 20th
12th Zambia 51.0 … 56.1 55.4 56.0 56.8 58.0 59.6 66.0 10th 60.1 15th 52.7 16th 59.6 21st
47th Zimbabwe 33.9 … 31.6 29.6 31.2 32.5 36.2 35.4 29.7 49th 31.2 45th 25.5 51st 55.1 30th
Continental average 47.1 … 50.5 50.3 50.3 51.3 51.5 51.6 52.7 48.4 47.0 58.3
SCORE /1002000 2007 2008 2009 2010 2011 2012
RANK /52 2012
Sustainable Economic Opportunity2012
Participation & Human Rights2012
Safety & Rule of Law2012
OverallHuman Development2012

2013 IB
RA
HIM
IND
EX O
F AFR
ICA
N G
OV
ERN
AN
CE: SU
MM
ARY
10
Key Findings: Changes 2000–2012
94% 18/52Countries that have experienced overall governance improvement since 2000 are today home to 94% of people living on the continent
Mauritius (+7.3)
African average (+4.5)
Somalia (-1.7)9.7
75.6
82.9
51.6
8.0
2000 2012
47.1
The continental average of 51.6 for overall governance in 2012 conceals the widening difference in performance between the African countries, with the top performing country, Mauritius, scoring 82.9 while Somalia, the poorest performing country, registered the lowest country score of 8.0.
Average Performance Conceals Widening Gaps Most Improved Countries
Sierra Leone
Liberia
Angola
Rwanda
Burundi
Liberia (+24.8)Angola (+18.1)Sierra Leone (+14.8)Rwanda (+10.9)Burundi (+8.8)
Category Performance
+10.2
+5.6
+3.2
-1.1
Human Development
Sustainable Economic Opportunity
Participation & Human Rights
Safety & Rule of Law
18 out of 52 countries reached their highest ever score in overall governance in 2012
2013 IB
RA
HIM
IND
EX O
F AFR
ICA
N G
OV
ERN
AN
CE: SU
MM
ARY
11
KEY FINDINGS
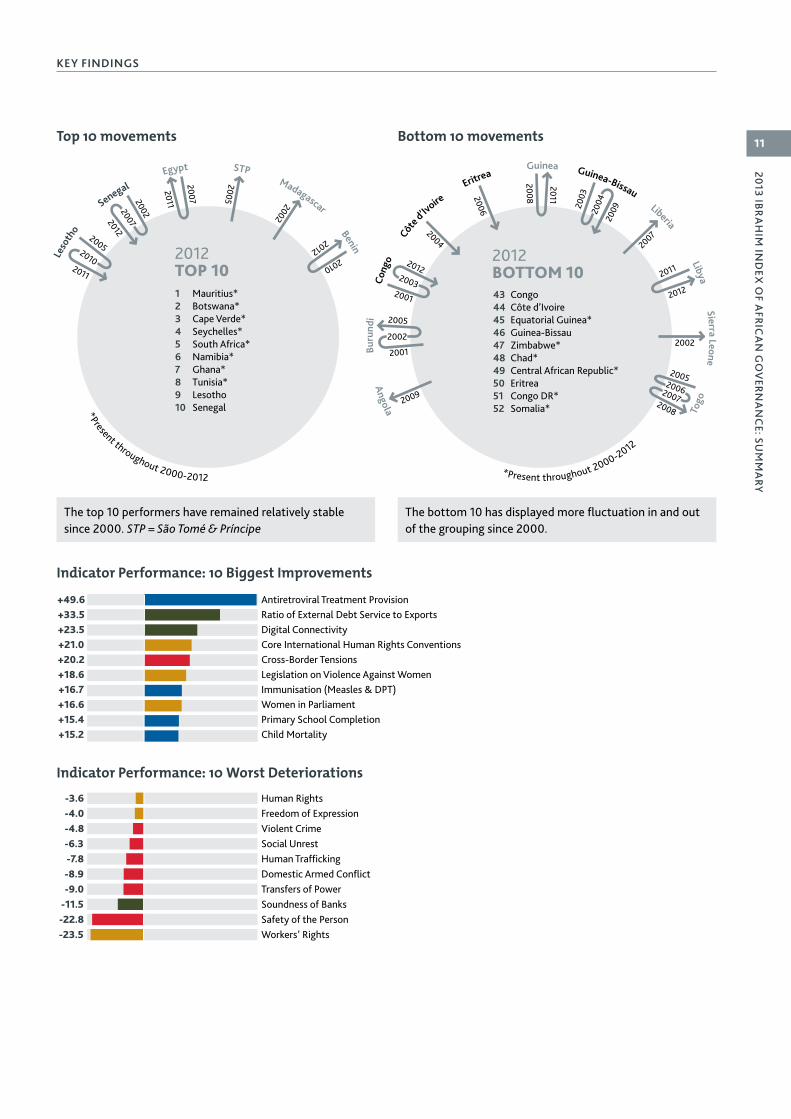
Top 10 movements Bottom 10 movements
*Present throughout 2000-2012
*Present throughout 2000-2012
Madagascar
Benin
STPEgypt
Senegal
Leso
tho
2010
2012
2002
2005
2007
20112002
2012
2005
2011
2007
2010
1 Mauritius*2 Botswana*3 Cape Verde*4 Seychelles*5 South Africa*6 Namibia*7 Ghana*8 Tunisia*9 Lesotho10 Senegal
2012TOP 10
2012BOTTOM 10
Liberia
LibyaSierra Leone
Togo
Guinea-Bissau
Guinea
Eritrea
Côte d’Iv
oire
Cong
o
Buru
ndi
Angola
2002
2012
2011
2007
2004
200920
03
2011
20082006
2004
2003
2012
2001
2002
2005
2001
20092006
2005
20072008
43 Congo44 Côte d’Ivoire45 Equatorial Guinea*46 Guinea-Bissau47 Zimbabwe*48 Chad*49 Central African Republic*50 Eritrea51 Congo DR*52 Somalia*
The top 10 performers have remained relatively stable since 2000. STP = São Tomé & Príncipe
The bottom 10 has displayed more fluctuation in and out of the grouping since 2000.
+49.6+33.5+23.5
+20.2
+16.7+18.6
+16.6+15.4+15.2
+21.0
-3.6-4.0-4.8
-7.8
-9.0-8.9
-11.5-22.8-23.5
-6.3
Antiretroviral Treatment ProvisionRatio of External Debt Service to ExportsDigital Connectivity
Cross-Border Tensions
Immunisation (Measles & DPT)Legislation on Violence Against Women
Women in ParliamentPrimary School CompletionChild Mortality
Core International Human Rights Conventions
Human RightsFreedom of ExpressionViolent Crime
Human Trafficking
Transfers of PowerDomestic Armed Conflict
Soundness of BanksSafety of the PersonWorkers’ Rights
Social Unrest
Indicator Performance: 10 Biggest Improvements
Indicator Performance: 10 Worst Deteriorations
2013 IB
RA
HIM
IND
EX O
F AFR
ICA
N G
OV
ERN
AN
CE: SU
MM
ARY
12
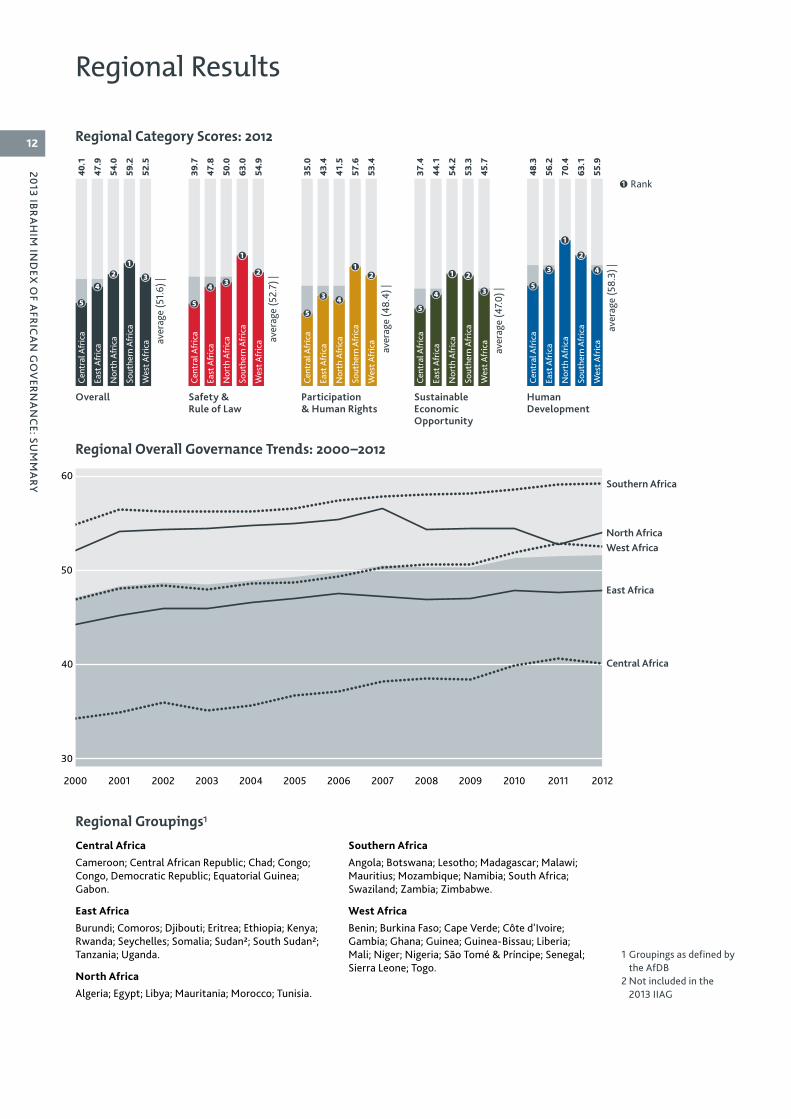
Regional Results40
.1
47.9
54.0
59.2
52.5
39.7
47.8
50.0
63.0
54.9
35.0
43.4
41.5
57.6
53.4
37.4
44.1
54.2
53.3
45.7
48.3
56.2
70.4
63.1
55.9
Cent
ral A
fric
a
East
Afr
ica
Nor
th A
fric
a
Sout
hern
Afr
ica
Wes
t Afr
ica
Cent
ral A
fric
a
East
Afr
ica
Nor
th A
fric
a
Sout
hern
Afr
ica
Wes
t Afr
ica
Cent
ral A
fric
a
East
Afr
ica
Nor
th A
fric
a
Sout
hern
Afr
ica
Wes
t Afr
ica
Cent
ral A
fric
a
East
Afr
ica
Nor
th A
fric
a
Sout
hern
Afr
ica
Wes
t Afr
ica
Cent
ral A
fric
a
East
Afr
ica
Nor
th A
fric
a
Sout
hern
Afr
ica
Wes
t Afr
icaav
erag
e (5
1.6)
|
aver
age
(52.
7) |
aver
age
(48.
4) |
aver
age
(47.0
) |
aver
age
(58.
3) |
Overall Safety & Rule of Law
Participation & Human Rights
Sustainable Economic Opportunity
Human Development
2000 2001 2002 2003 2004 2005 2006 2007 2008 2009 2010 2011 2012
40
30
50
60
Central Africa
East Africa
West AfricaNorth Africa
Southern Africa
Regional Overall Governance Trends: 2000–2012
Regional Groupings1
Regional Category Scores: 2012
1 Rank
Central Africa
Cameroon; Central African Republic; Chad; Congo; Congo, Democratic Republic; Equatorial Guinea; Gabon.
East Africa
Burundi; Comoros; Djibouti; Eritrea; Ethiopia; Kenya; Rwanda; Seychelles; Somalia; Sudan2; South Sudan2; Tanzania; Uganda.
North Africa
Algeria; Egypt; Libya; Mauritania; Morocco; Tunisia.
Southern Africa
Angola; Botswana; Lesotho; Madagascar; Malawi; Mauritius; Mozambique; Namibia; South Africa; Swaziland; Zambia; Zimbabwe.
West Africa
Benin; Burkina Faso; Cape Verde; Côte d'Ivoire; Gambia; Ghana; Guinea; Guinea-Bissau; Liberia; Mali; Niger; Nigeria; São Tomé & Príncipe; Senegal; Sierra Leone; Togo.
1 Groupings as defined by the AfDB
2 Not included in the 2013 IIAG
2013 IB
RA
HIM
IND
EX O
F AFR
ICA
N G
OV
ERN
AN
CE: SU
MM
ARY
13
REGIONAL RESULTS
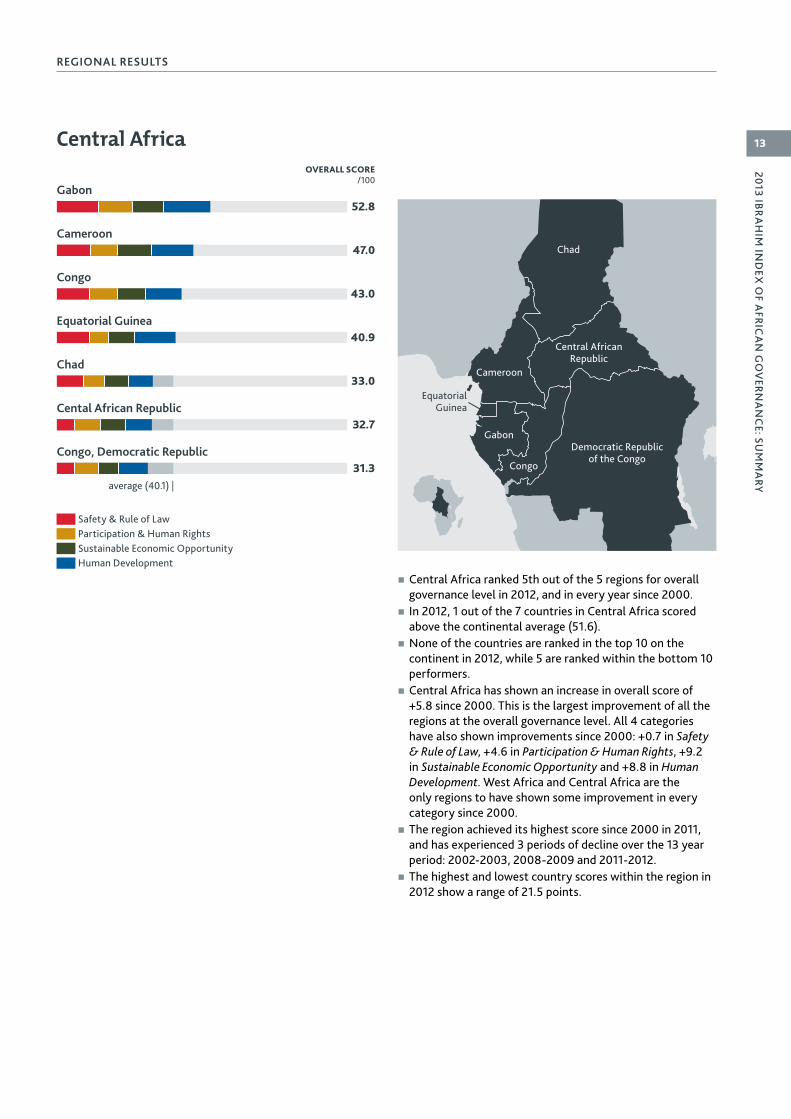
Central Africa OVERALL SCORE
/100
52.8Gabon
47.0Cameroon
43.0Congo
40.9Equatorial Guinea
33.0Chad
32.7Cental African Republic
31.3Congo, Democratic Republic
average (40.1) |
Chad
Cameroon
Central African Republic
Gabon
Congo
Democratic Republic of the Congo
Equatorial Guinea
Safety & Rule of LawParticipation & Human RightsSustainable Economic OpportunityHuman Development
� Central Africa ranked 5th out of the 5 regions for overall governance level in 2012, and in every year since 2000.
� In 2012, 1 out of the 7 countries in Central Africa scored above the continental average (51.6).
� None of the countries are ranked in the top 10 on the continent in 2012, while 5 are ranked within the bottom 10 performers.
� Central Africa has shown an increase in overall score of +5.8 since 2000. This is the largest improvement of all the regions at the overall governance level. All 4 categories have also shown improvements since 2000: +0.7 in Safety & Rule of Law, +4.6 in Participation & Human Rights, +9.2 in Sustainable Economic Opportunity and +8.8 in Human Development. West Africa and Central Africa are the only regions to have shown some improvement in every category since 2000.
� The region achieved its highest score since 2000 in 2011, and has experienced 3 periods of decline over the 13 year period: 2002-2003, 2008-2009 and 2011-2012.
� The highest and lowest country scores within the region in 2012 show a range of 21.5 points.
2013 IB
RA
HIM
IND
EX O
F AFR
ICA
N G
OV
ERN
AN
CE: SU
MM
ARY
14
REGIONAL RESULTS
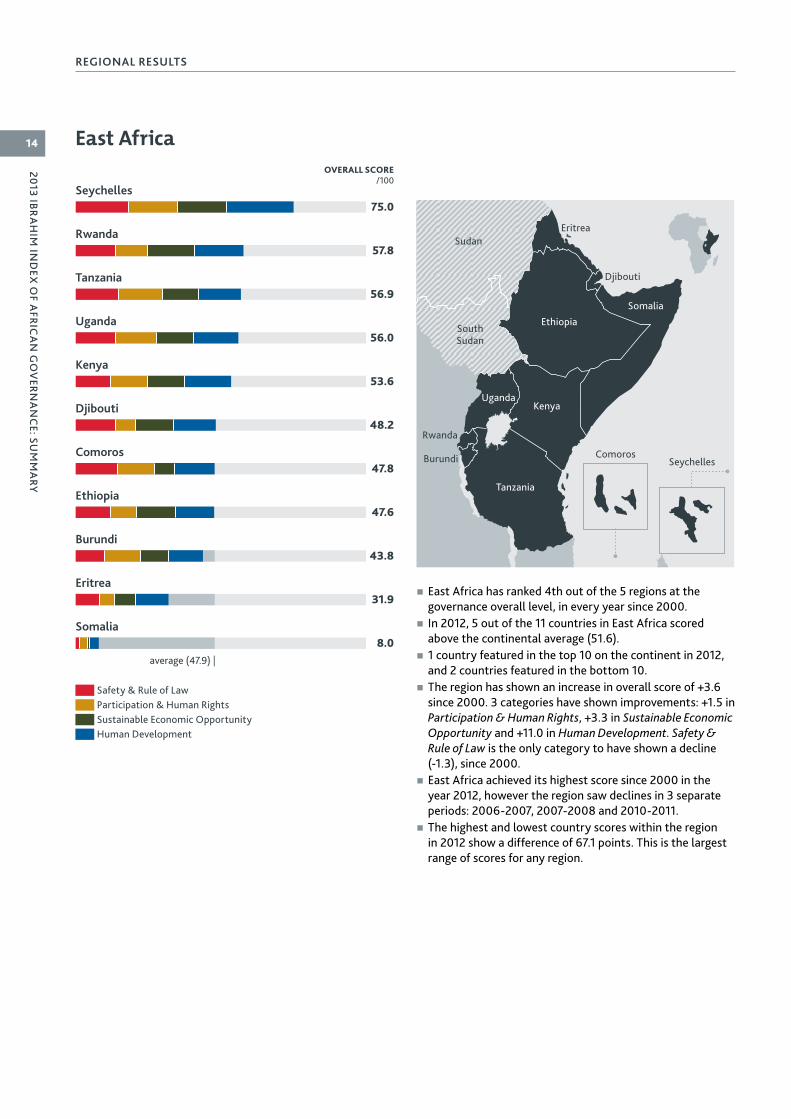
East AfricaOVERALL SCORE
/100
75.0Seychelles
57.8Rwanda
56.9Tanzania
56.0Uganda
53.6Kenya
48.2Djibouti
47.8Comoros
43.8Burundi
47.6Ethiopia
31.9Eritrea
8.0Somalia
average (47.9) |
Ethiopia
Sudan
SouthSudan
Kenya
Tanzania
Somalia
Uganda
Eritrea
Djibouti
ComorosSeychelles
Rwanda
Burundi
� East Africa has ranked 4th out of the 5 regions at the governance overall level, in every year since 2000.
� In 2012, 5 out of the 11 countries in East Africa scored above the continental average (51.6).
� 1 country featured in the top 10 on the continent in 2012, and 2 countries featured in the bottom 10.
� The region has shown an increase in overall score of +3.6 since 2000. 3 categories have shown improvements: +1.5 in Participation & Human Rights, +3.3 in Sustainable Economic Opportunity and +11.0 in Human Development. Safety & Rule of Law is the only category to have shown a decline (-1.3), since 2000.
� East Africa achieved its highest score since 2000 in the year 2012, however the region saw declines in 3 separate periods: 2006-2007, 2007-2008 and 2010-2011.
� The highest and lowest country scores within the region in 2012 show a difference of 67.1 points. This is the largest range of scores for any region.
Safety & Rule of LawParticipation & Human RightsSustainable Economic OpportunityHuman Development
2013 IB
RA
HIM
IND
EX O
F AFR
ICA
N G
OV
ERN
AN
CE: SU
MM
ARY
15
REGIONAL RESULTS
North Africa
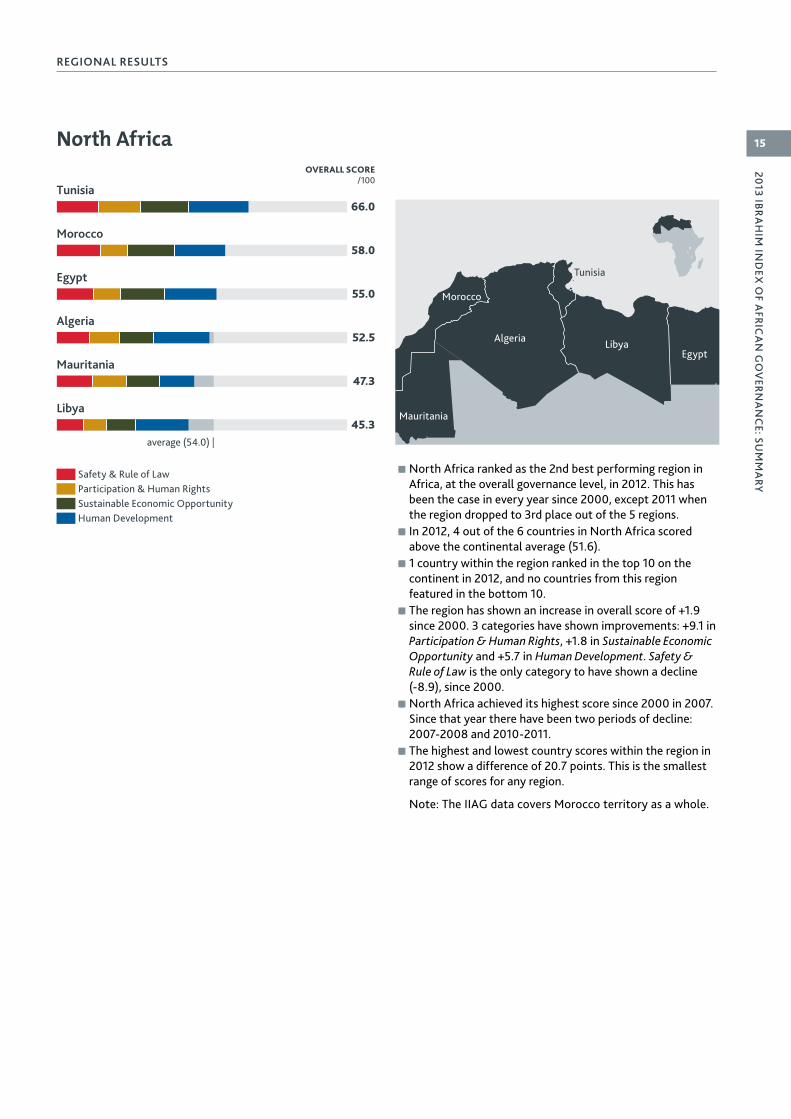
66.0Tunisia
58.0Morocco
55.0Egypt
52.5Algeria
47.3Mauritania
45.3Libya
OVERALL SCORE/100
average (54.0) |
Algeria Libya
Mauritania
Morocco
Egypt
Tunisia
� North Africa ranked as the 2nd best performing region in Africa, at the overall governance level, in 2012. This has been the case in every year since 2000, except 2011 when the region dropped to 3rd place out of the 5 regions.
� In 2012, 4 out of the 6 countries in North Africa scored above the continental average (51.6).
� 1 country within the region ranked in the top 10 on the continent in 2012, and no countries from this region featured in the bottom 10.
� The region has shown an increase in overall score of +1.9 since 2000. 3 categories have shown improvements: +9.1 in Participation & Human Rights, +1.8 in Sustainable Economic Opportunity and +5.7 in Human Development. Safety & Rule of Law is the only category to have shown a decline (-8.9), since 2000.
� North Africa achieved its highest score since 2000 in 2007. Since that year there have been two periods of decline: 2007-2008 and 2010-2011.
� The highest and lowest country scores within the region in 2012 show a difference of 20.7 points. This is the smallest range of scores for any region.
Note: The IIAG data covers Morocco territory as a whole.
Safety & Rule of LawParticipation & Human RightsSustainable Economic OpportunityHuman Development
2013 IB
RA
HIM
IND
EX O
F AFR
ICA
N G
OV
ERN
AN
CE: SU
MM
ARY
16
REGIONAL RESULTS
Southern Africa
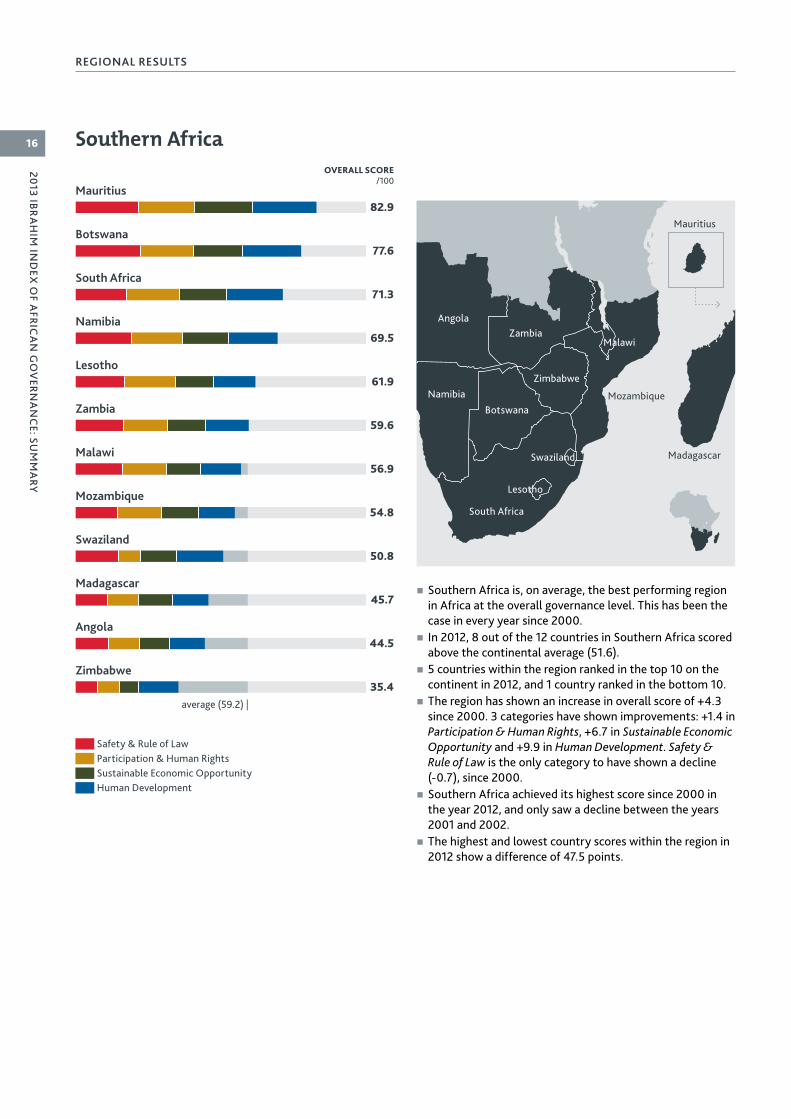
82.9Mauritius
77.6Botswana
71.3South Africa
69.5Namibia
61.9Lesotho
59.6Zambia
56.9Malawi
50.8Swaziland
54.8Mozambique
45.7Madagascar
44.5Angola
35.4Zimbabwe
OVERALL SCORE/100
average (59.2) |
AngolaZambia
Malawi
Zimbabwe
Botswana
Namibia
South Africa
Lesotho
Swaziland Madagascar
Mauritius
Mozambique
� Southern Africa is, on average, the best performing region in Africa at the overall governance level. This has been the case in every year since 2000.
� In 2012, 8 out of the 12 countries in Southern Africa scored above the continental average (51.6).
� 5 countries within the region ranked in the top 10 on the continent in 2012, and 1 country ranked in the bottom 10.
� The region has shown an increase in overall score of +4.3 since 2000. 3 categories have shown improvements: +1.4 in Participation & Human Rights, +6.7 in Sustainable Economic Opportunity and +9.9 in Human Development. Safety & Rule of Law is the only category to have shown a decline (-0.7), since 2000.
� Southern Africa achieved its highest score since 2000 in the year 2012, and only saw a decline between the years 2001 and 2002.
� The highest and lowest country scores within the region in 2012 show a difference of 47.5 points.
Safety & Rule of LawParticipation & Human RightsSustainable Economic OpportunityHuman Development

2013 IB
RA
HIM
IND
EX O
F AFR
ICA
N G
OV
ERN
AN
CE: SU
MM
ARY
17
REGIONAL RESULTS
West AfricaOVERALL SCORE
/100
76.7Cape Verde
66.8Ghana
61.0Senegal
59.9São Tomé & Príncipe
58.7Benin
53.6Gambia
53.0Burkina Faso
50.4Niger
50.7Mali
50.3Liberia
48.0Sierra Leone
45.8Togo
43.4Nigeria
43.2Guinea
40.9Côte d’Ivoire
37.1Guinea-Bissau
average (52.5) |
NigerMali
NigeriaCôte
d’Ivoire
Guinea
Ghana
Burkina Faso
Senegal
Gambia
Cape Verde
Guinea-Bissau
Sierra Leone
Liberia
São Tomé & Príncipe
Togo Benin
� West Africa ranked in 3rd place out of the 5 regions in Africa, at the overall governance level in 2012. The region has ranked in 3rd place every year since 2000, except in 2011 when it was ranked 2nd.
� In 2012, 7 out of the 16 countries in West Africa scored above the continental average (51.6).
� 3 countries within the region ranked in the top 10 on the continent in 2012, and 2 countries featured in the bottom 10 performers.
� West Africa has shown an increase in overall score of +5.6 since 2000. All 4 categories have also shown improvements since 2000: +0.8 in Safety & Rule of Law, +3.1 in Participation & Human Rights, +6.1 in Sustainable Economic Opportunity and +12.2 in Human Development. West Africa and Central Africa are the only regions to have shown some improvement in every category since 2000.
� The region achieved its highest score since 2000 in 2011, and has experienced 2 periods of decline over the 13 years: 2002-2003 and 2011-2012.
� The highest and lowest country scores within the region in 2012 show a difference of 39.7 points.
Safety & Rule of LawParticipation & Human RightsSustainable Economic OpportunityHuman Development
2013 IB
RA
HIM
IND
EX O
F AFR
ICA
N G
OV
ERN
AN
CE: SU
MM
ARY
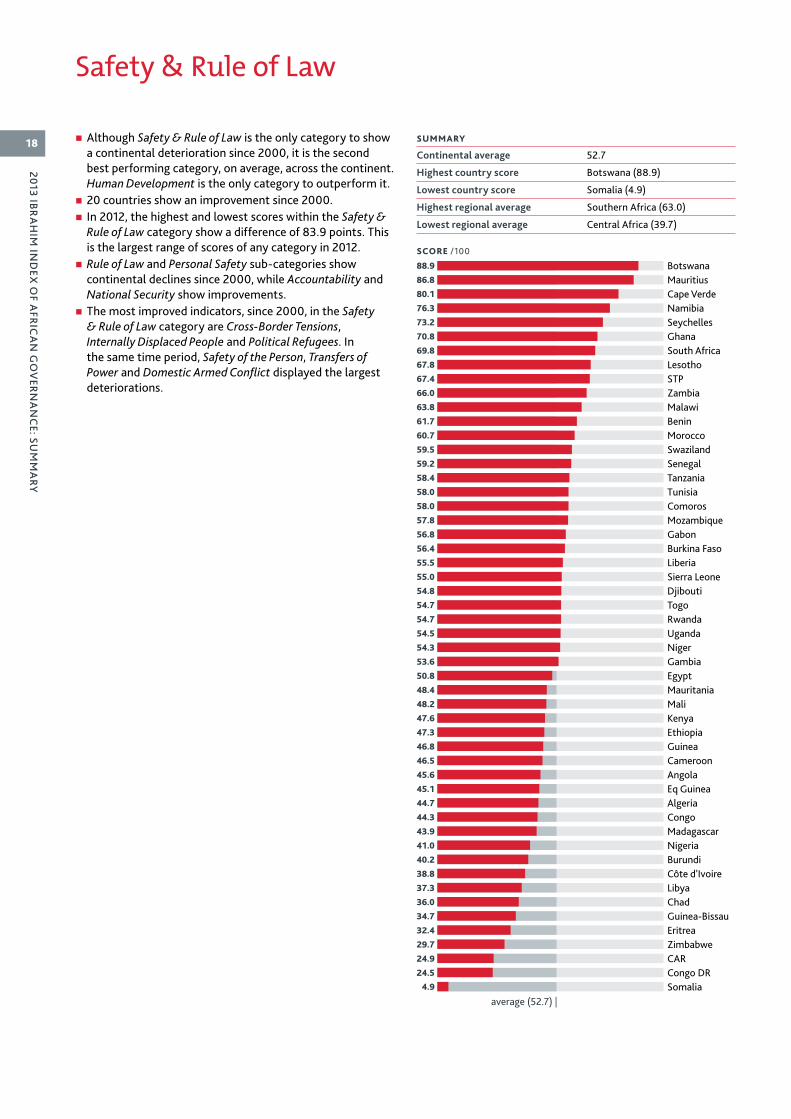
18Continental average 52.7
Highest country score Botswana (88.9)
Lowest country score Somalia (4.9)
Highest regional average Southern Africa (63.0)
Lowest regional average Central Africa (39.7)
average (52.7) |
BotswanaMauritiusCape VerdeNamibiaSeychellesGhanaSouth AfricaLesothoSTPZambiaMalawiBeninMoroccoSwazilandSenegalTanzaniaTunisiaComorosMozambiqueGabonBurkina FasoLiberiaSierra LeoneDjiboutiTogoRwandaUgandaNigerGambiaEgyptMauritaniaMaliKenyaEthiopiaGuineaCameroonAngolaEq GuineaAlgeriaCongoMadagascarNigeriaBurundiCôte d'IvoireLibyaChadGuinea-BissauEritreaZimbabweCARCongo DRSomalia
88.9
86.8
80.1
76.3
73.2
70.8
69.8
67.8
67.4
66.0
63.8
61.7
60.7
59.5
59.2
58.4
58.0
58.0
57.8
56.8
56.4
55.5
55.0
54.8
54.7
54.7
54.5
54.3
53.6
50.8
48.4
48.2
47.6
47.3
46.8
46.5
45.6
45.1
44.7
44.3
43.9
41.0
40.2
38.8
37.3
36.0
34.7
32.4
29.7
24.9
24.5
4.9
SCORE /100
SUMMARY
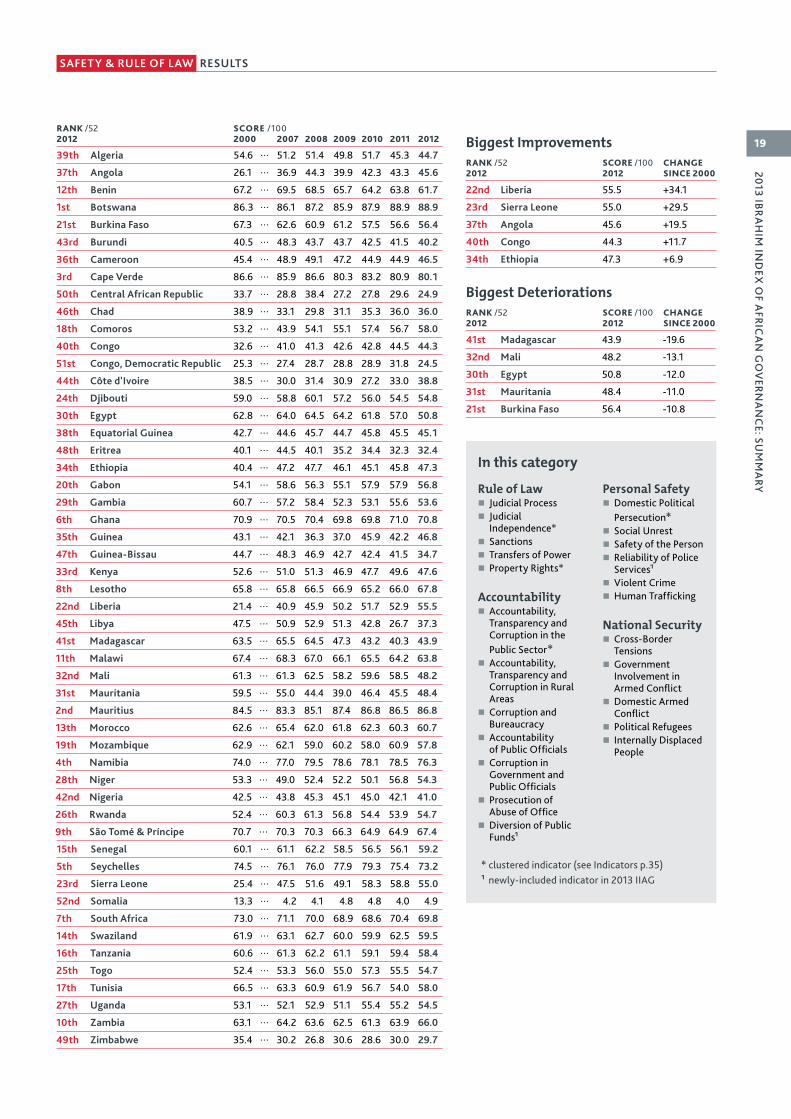
Safety & Rule of Law
� Although Safety & Rule of Law is the only category to show a continental deterioration since 2000, it is the second best performing category, on average, across the continent. Human Development is the only category to outperform it.
� 20 countries show an improvement since 2000. � In 2012, the highest and lowest scores within the Safety & Rule of Law category show a difference of 83.9 points. This is the largest range of scores of any category in 2012.
� Rule of Law and Personal Safety sub-categories show continental declines since 2000, while Accountability and National Security show improvements.
� The most improved indicators, since 2000, in the Safety & Rule of Law category are Cross-Border Tensions, Internally Displaced People and Political Refugees. In the same time period, Safety of the Person, Transfers of Power and Domestic Armed Conflict displayed the largest deteriorations.
2013 IB
RA
HIM
IND
EX O
F AFR
ICA
N G
OV
ERN
AN
CE: SU
MM
ARY
19
RESULTSSAFETY & RULE OF LAW
39th Algeria 54.6 … 51.2 51.4 49.8 51.7 45.3 44.7
37th Angola 26.1 … 36.9 44.3 39.9 42.3 43.3 45.6
12th Benin 67.2 … 69.5 68.5 65.7 64.2 63.8 61.7
1st Botswana 86.3 … 86.1 87.2 85.9 87.9 88.9 88.9
21st Burkina Faso 67.3 … 62.6 60.9 61.2 57.5 56.6 56.4
43rd Burundi 40.5 … 48.3 43.7 43.7 42.5 41.5 40.2
36th Cameroon 45.4 … 48.9 49.1 47.2 44.9 44.9 46.5
3rd Cape Verde 86.6 … 85.9 86.6 80.3 83.2 80.9 80.1
50th Central African Republic 33.7 … 28.8 38.4 27.2 27.8 29.6 24.9
46th Chad 38.9 … 33.1 29.8 31.1 35.3 36.0 36.0
18th Comoros 53.2 … 43.9 54.1 55.1 57.4 56.7 58.0
40th Congo 32.6 … 41.0 41.3 42.6 42.8 44.5 44.3
51st Congo, Democratic Republic 25.3 … 27.4 28.7 28.8 28.9 31.8 24.5
44th Côte d'Ivoire 38.5 … 30.0 31.4 30.9 27.2 33.0 38.8
24th Djibouti 59.0 … 58.8 60.1 57.2 56.0 54.5 54.8
30th Egypt 62.8 … 64.0 64.5 64.2 61.8 57.0 50.8
38th Equatorial Guinea 42.7 … 44.6 45.7 44.7 45.8 45.5 45.1
48th Eritrea 40.1 … 44.5 40.1 35.2 34.4 32.3 32.4
34th Ethiopia 40.4 … 47.2 47.7 46.1 45.1 45.8 47.3
20th Gabon 54.1 … 58.6 56.3 55.1 57.9 57.9 56.8
29th Gambia 60.7 … 57.2 58.4 52.3 53.1 55.6 53.6
6th Ghana 70.9 … 70.5 70.4 69.8 69.8 71.0 70.8
35th Guinea 43.1 … 42.1 36.3 37.0 45.9 42.2 46.8
47th Guinea-Bissau 44.7 … 48.3 46.9 42.7 42.4 41.5 34.7
33rd Kenya 52.6 … 51.0 51.3 46.9 47.7 49.6 47.6
8th Lesotho 65.8 … 65.8 66.5 66.9 65.2 66.0 67.8
22nd Liberia 21.4 … 40.9 45.9 50.2 51.7 52.9 55.5
45th Libya 47.5 … 50.9 52.9 51.3 42.8 26.7 37.3
41st Madagascar 63.5 … 65.5 64.5 47.3 43.2 40.3 43.9
11th Malawi 67.4 … 68.3 67.0 66.1 65.5 64.2 63.8
32nd Mali 61.3 … 61.3 62.5 58.2 59.6 58.5 48.2
31st Mauritania 59.5 … 55.0 44.4 39.0 46.4 45.5 48.4
2nd Mauritius 84.5 … 83.3 85.1 87.4 86.8 86.5 86.8
13th Morocco 62.6 … 65.4 62.0 61.8 62.3 60.3 60.7
19th Mozambique 62.9 … 62.1 59.0 60.2 58.0 60.9 57.8
4th Namibia 74.0 … 77.0 79.5 78.6 78.1 78.5 76.3
28th Niger 53.3 … 49.0 52.4 52.2 50.1 56.8 54.3
42nd Nigeria 42.5 … 43.8 45.3 45.1 45.0 42.1 41.0
26th Rwanda 52.4 … 60.3 61.3 56.8 54.4 53.9 54.7
9th São Tomé & Príncipe 70.7 … 70.3 70.3 66.3 64.9 64.9 67.4
15th Senegal 60.1 … 61.1 62.2 58.5 56.5 56.1 59.2
5th Seychelles 74.5 … 76.1 76.0 77.9 79.3 75.4 73.2
23rd Sierra Leone 25.4 … 47.5 51.6 49.1 58.3 58.8 55.0
52nd Somalia 13.3 … 4.2 4.1 4.8 4.8 4.0 4.9
7th South Africa 73.0 … 71.1 70.0 68.9 68.6 70.4 69.8
14th Swaziland 61.9 … 63.1 62.7 60.0 59.9 62.5 59.5
16th Tanzania 60.6 … 61.3 62.2 61.1 59.1 59.4 58.4
25th Togo 52.4 … 53.3 56.0 55.0 57.3 55.5 54.7
17th Tunisia 66.5 … 63.3 60.9 61.9 56.7 54.0 58.0
27th Uganda 53.1 … 52.1 52.9 51.1 55.4 55.2 54.5
10th Zambia 63.1 … 64.2 63.6 62.5 61.3 63.9 66.0
49th Zimbabwe 35.4 … 30.2 26.8 30.6 28.6 30.0 29.7
SCORE /1002000 2007 2008 2009 2010 2011 2012
RANK /52 2012 Biggest Improvements
Biggest Deteriorations
22nd Liberia 55.5 +34.1
23rd Sierra Leone 55.0 +29.5
37th Angola 45.6 +19.5
40th Congo 44.3 +11.7
34th Ethiopia 47.3 +6.9
41st Madagascar 43.9 -19.6
32nd Mali 48.2 -13.1
30th Egypt 50.8 -12.0
31st Mauritania 48.4 -11.0
21st Burkina Faso 56.4 -10.8
RANK /52 2012
RANK /52 2012
SCORE /100 2012
SCORE /100 2012
CHANGE SINCE 2000
CHANGE SINCE 2000
In this category
Rule of Law � Judicial Process � Judicial Independence*
� Sanctions � Transfers of Power � Property Rights*
Accountability � Accountability, Transparency and Corruption in the Public Sector*
� Accountability, Transparency and Corruption in Rural Areas
� Corruption and Bureaucracy
� Accountability of Public Officials
� Corruption in Government and Public Officials
� Prosecution of Abuse of Office
� Diversion of Public Funds¹
Personal Safety � Domestic Political Persecution*
� Social Unrest � Safety of the Person � Reliability of Police Services¹
� Violent Crime � Human Trafficking
National Security � Cross-Border Tensions
� Government Involvement in Armed Conflict
� Domestic Armed Conflict
� Political Refugees � Internally Displaced People
* clustered indicator (see Indicators p.35)¹ newly-included indicator in 2013 IIAG

2013 IB
RA
HIM
IND
EX O
F AFR
ICA
N G
OV
ERN
AN
CE: SU
MM
ARY
20 Rule of Law Accountability
SUB-CATEGORY RESULTS
Continental average 47.6
Highest country score Botswana (95.7)
Lowest country score Somalia (0.2)
Highest regional average Southern Africa (63.4)
Lowest regional average Central Africa (34.4)
Continental average 41.5
Highest country score Botswana (85.8)
Lowest country score Somalia (3.7)
Highest regional average Southern Africa (51.4)
Lowest regional average Central Africa (26.4)
SCORE /100SCORE /100
average(47.6) |
BotswanaMauritiusSouth AfricaNamibiaCape VerdeGhanaMalawiZambiaLesothoSeychellesSenegalBeninMoroccoSwazilandUgandaMozambiqueTanzaniaTunisiaSTPKenyaNigerBurkina FasoEgyptGabonRwandaTogoSierra LeoneGambiaComorosBurundiDjiboutiMaliLiberiaMauritaniaNigeriaAlgeriaAngolaEthiopiaGuineaCARCameroonEq GuineaCongoCongo DRZimbabweChadCôte d'IvoireMadagascarLibyaGuinea-BissauEritreaSomalia
95.7
94.1
88.2
82.1
81.5
81.0
68.4
68.3
67.0
64.3
60.7
58.3
57.7
56.0
55.7
55.1
53.5
53.0
52.2
51.5
51.0
50.9
49.7
49.4
48.7
48.4
48.2
44.0
43.6
42.8
42.6
42.4
42.0
41.9
40.3
40.3
39.6
39.5
37.9
36.5
34.4
32.4
31.5
29.0
27.5
27.4
23.5
18.9
17.1
6.6
3.3
0.2average (41.5) |
BotswanaCape VerdeMauritiusNamibiaSouth AfricaSeychellesRwandaGhanaTunisiaLesothoLiberiaMoroccoSwazilandMadagascarSTPMalawiZambiaMaliAlgeriaNigerSenegalEthiopiaTanzaniaDjiboutiBurkina FasoSierra LeoneEgyptBeninGambiaMozambiqueTogoUgandaMauritaniaKenyaComorosGabonNigeriaCôte d'IvoireCameroonEritreaGuineaCARCongo DRLibyaBurundiChadCongoAngolaZimbabweEq GuineaGuinea-BissauSomalia
85.8
79.4
75.8
68.1
65.2
64.9
63.2
60.3
59.1
57.1
50.8
49.4
48.5
48.0
47.6
46.6
46.2
45.3
43.9
43.6
42.9
42.4
42.1
41.5
40.8
40.4
40.4
40.4
38.5
38.3
38.0
37.8
36.7
36.7
36.1
35.7
35.3
31.5
29.9
29.7
26.6
26.6
26.4
26.1
24.6
24.4
24.2
18.9
18.2
18.0
17.5
3.7

2013 IB
RA
HIM
IND
EX O
F AFR
ICA
N G
OV
ERN
AN
CE: SU
MM
ARY
21Personal Safety National Security
SUB-CATEGORY RESULTS
Continental average 43.1
Highest country score Mauritius (77.3)
Lowest country score Somalia (0.0)
Highest regional average Southern Africa (47.3)
Lowest regional average Central Africa (31.8)
Continental average 78.4
Highest country score Zambia (100.0)
Lowest country score Somalia (15.8)
Highest regional average Southern Africa (89.8)
Lowest regional average Central Africa (66.3)
SCORE /100 SCORE /100
average (43.1) |
MauritiusSTPBotswanaSeychellesComorosCape VerdeBeninGabonRwandaMoroccoNamibiaSenegalMaliDjiboutiMozambiqueGhanaLesothoEthiopiaTanzaniaZambiaGambiaNigerUgandaSierra LeoneMalawiLiberiaBurkina FasoTogoSwazilandAngolaEq GuineaTunisiaCongoEritreaCameroonKenyaMauritaniaGuinea-BissauAlgeriaGuineaSouth AfricaBurundiLibyaMadagascarEgyptChadCôte d'IvoireZimbabweNigeriaCARCongo DRSomalia
77.3
75.0
74.0
63.6
62.5
59.5
58.3
57.1
56.3
55.8
55.0
54.8
54.6
53.8
52.9
52.5
52.1
51.1
50.5
49.6
47.9
47.5
46.5
45.2
45.2
45.0
44.0
43.8
43.6
40.0
40.0
40.0
38.8
37.5
37.1
36.2
35.1
35.0
34.6
33.6
30.6
30.2
29.7
28.6
28.3
25.9
24.2
18.9
15.8
15.0
8.8
0.0average (78.4) |
ZambiaCape VerdeMauritiusBotswanaSeychellesNamibiaLesothoSouth AfricaMalawiSTPBeninSwazilandBurkina FasoEq GuineaComorosGhanaGuineaTogoTanzaniaSierra LeoneMozambiqueGabonEgyptCameroonLiberiaGambiaAngolaCongoDjiboutiMauritaniaMadagascarMoroccoTunisiaGuinea-BissauSenegalUgandaLibyaCôte d'IvoireNigerNigeriaChadKenyaBurundiAlgeriaEritreaEthiopiaZimbabweMaliRwandaCongo DRCARSomalia
100.0
100.0
100.0
100.0
99.8
99.8
95.0
95.0
95.0
94.9
90.0
90.0
90.0
89.8
89.7
89.5
89.3
88.6
87.5
86.0
85.0
84.9
84.9
84.7
84.4
84.1
84.0
82.7
81.3
80.0
80.0
80.0
79.9
79.6
78.2
77.9
76.2
76.1
75.0
72.7
66.5
65.9
63.2
60.1
59.2
56.3
54.1
50.5
50.4
33.8
21.4
15.8

2013 IB
RA
HIM
IND
EX O
F AFR
ICA
N G
OV
ERN
AN
CE: SU
MM
ARY
22 � Participation & Human Rights has shown an improvement of +3.2 at the continental level since 2000.
� 35 (out of 52) countries show an improvement in this category since 2000.
� Participation & Human Rights shows the smallest difference between the highest and lowest scores of any category in 2012 (range of 70.2 points).
� Rights is the only sub-category within Participation & Human Rights to show a decline at the continental level over the period from 2000 to 2012. Both Participation and Gender show improvements.
� The 3 most improved indicators, since 2000, in the Participation & Human Rights category are Core International Human Rights Conventions, Legislation on Violence Against Women and Women in Parliament.
� In the same time period, Workers’ Rights, Freedom of Expression and Human Rights displayed the 3 largest deteriorations.
Continental average 48.4
Highest country score Cape Verde (81.7)
Lowest country score Somalia (11.5)
Highest regional average Southern Africa (57.6)
Lowest regional average Central Africa (35.0)
average (48.4) |
Cape VerdeMauritiusSouth AfricaBotswanaNamibiaLesothoGhanaSeychellesSenegalSTPBeninTanzaniaMalawiMozambiqueZambiaNigerTunisiaUgandaLiberiaMaliBurkina FasoSierra LeoneKenyaComorosBurundiGabonMauritaniaGuineaRwandaAngolaMadagascarAlgeriaTogoCongoGuinea-BissauNigeriaEgyptEthiopiaCameroonMoroccoGambiaCARCôte d'IvoireCongo DRZimbabweLibyaSwazilandChadDjiboutiEq GuineaEritreaSomalia
81.7
76.7
73.1
72.9
70.8
69.1
68.1
67.6
67.6
66.9
65.9
61.3
61.3
60.3
60.1
57.4
56.9
56.3
56.0
53.4
53.4
53.4
50.7
50.0
49.7
47.8
47.0
45.9
44.6
42.8
42.8
41.2
39.4
38.8
38.5
37.7
36.8
36.5
36.4
36.3
35.7
35.0
33.1
32.3
31.2
30.5
30.1
29.1
27.9
25.6
21.7
11.5
SCORE /100
SUMMARY
Participation & Human Rights

2013 IB
RA
HIM
IND
EX O
F AFR
ICA
N G
OV
ERN
AN
CE: SU
MM
ARY
23
RESULTSPARTICIPATION & HUMAN RIGHTS
32nd Algeria 36.5 … 41.6 34.5 36.7 38.5 38.2 41.2
30th Angola 25.5 … 35.4 38.8 40.3 42.5 40.4 42.8
11th Benin 65.3 … 66.9 62.0 64.6 65.2 65.4 65.9
4th Botswana 71.7 … 71.5 68.5 70.7 71.0 71.9 72.9
21st Burkina Faso 50.9 … 56.0 56.4 55.5 58.7 53.7 53.4
25th Burundi 32.9 … 54.2 47.6 54.1 46.2 49.2 49.7
39th Cameroon 37.8 … 38.4 33.0 33.9 31.7 36.2 36.4
1st Cape Verde 71.7 … 76.8 79.7 78.2 78.3 81.7 81.7
42nd Central African Republic 31.3 … 35.8 39.2 37.5 33.2 34.4 35.0
48th Chad 31.1 … 25.8 21.7 22.8 27.2 29.3 29.1
24th Comoros 37.4 … 43.8 52.5 49.9 48.4 50.0 50.0
34th Congo 33.9 … 37.2 39.7 38.7 40.6 38.8 38.8
44th Congo, Democratic Republic 20.5 … 34.7 31.2 34.1 34.9 32.3 32.3
43rd Côte d'Ivoire 35.5 … 29.7 25.4 26.6 29.0 32.1 33.1
49th Djibouti 34.8 … 32.1 30.1 30.9 36.7 26.9 27.9
37th Egypt 30.1 … 37.9 33.6 36.0 34.2 28.5 36.8
50th Equatorial Guinea 17.6 … 22.3 19.9 21.2 22.8 25.5 25.6
51st Eritrea 31.1 … 24.2 23.0 21.4 21.9 21.8 21.7
38th Ethiopia 43.1 … 33.4 32.9 34.8 35.1 36.4 36.5
26th Gabon 40.9 … 43.2 37.5 37.7 46.9 47.6 47.8
41st Gambia 35.7 … 48.2 48.4 44.4 43.6 35.6 35.7
7th Ghana 67.4 … 70.8 67.2 68.7 69.4 69.2 68.1
28th Guinea 32.1 … 34.6 31.2 27.3 43.0 48.8 45.9
35th Guinea-Bissau 52.8 … 52.3 50.5 34.9 41.0 46.8 38.5
23rd Kenya 52.9 … 55.7 54.9 48.9 51.0 50.6 50.7
6th Lesotho 54.4 … 67.7 68.1 62.9 61.1 65.4 69.1
19th Liberia 28.0 … 50.6 49.0 53.7 55.3 55.7 56.0
46th Libya 15.9 … 18.8 19.4 20.3 19.6 20.5 30.5
31st Madagascar 71.5 … 62.5 58.2 44.4 42.2 43.7 42.8
13th Malawi 54.9 … 56.3 50.3 58.7 60.9 59.0 61.3
20th Mali 58.2 … 57.0 57.1 55.3 58.7 62.9 53.4
27th Mauritania 40.6 … 61.0 40.5 46.4 47.8 46.2 47.0
2nd Mauritius 76.0 … 79.0 77.5 76.9 76.4 76.7 76.7
40th Morocco 32.8 … 36.4 36.0 34.6 33.9 35.1 36.3
14th Mozambique 64.6 … 58.9 57.1 59.9 58.4 58.0 60.3
5th Namibia 75.5 … 71.7 66.8 67.2 68.8 70.8 70.8
16th Niger 51.3 … 50.4 46.7 39.5 45.4 57.8 57.4
36th Nigeria 45.9 … 40.0 37.5 33.7 37.4 37.2 37.7
29th Rwanda 38.4 … 42.4 39.8 40.0 41.7 44.1 44.6
10th São Tomé & Príncipe 61.0 … 62.2 62.3 61.6 62.7 67.3 66.9
9th Senegal 70.2 … 64.0 60.1 58.5 59.2 62.9 67.6
8th Seychelles 65.1 … 64.5 63.1 65.6 67.6 67.4 67.6
22nd Sierra Leone 48.0 … 55.2 52.3 51.4 54.8 53.8 53.4
52nd Somalia 12.3 … 10.0 11.0 10.4 11.1 10.0 11.5
3rd South Africa 77.7 … 73.5 72.9 72.8 73.4 73.1 73.1
47th Swaziland 25.8 … 29.0 26.6 27.3 29.9 29.5 30.1
12th Tanzania 64.3 … 64.4 57.6 59.9 61.8 61.7 61.3
33rd Togo 30.8 … 31.2 37.7 41.1 39.1 39.6 39.4
17th Tunisia 38.2 … 39.7 37.0 33.7 33.9 55.9 56.9
18th Uganda 49.2 … 55.3 50.6 50.6 54.0 56.4 56.3
15th Zambia 46.2 … 55.5 53.0 53.0 56.4 57.5 60.1
45th Zimbabwe 31.0 … 29.4 26.4 26.8 27.9 31.3 31.2
SCORE /1002000 2007 2008 2009 2010 2011 2012
RANK /52 2012 Biggest Improvements
Biggest Deteriorations
19th Liberia 56.0 +28.0
17th Tunisia 56.9 +18.7
30th Angola 42.8 +17.4
25th Burundi 49.7 +16.8
6th Lesotho 69.1 +14.7
31st Madagascar 42.8 -28.7
35th Guinea-Bissau 38.5 -14.3
51st Eritrea 21.7 -9.5
36th Nigeria 37.7 -8.2
49th Djibouti 27.9 -6.9
RANK /52 2012
RANK /52 2012
SCORE /100 2012
SCORE /100 2012
CHANGE SINCE 2000
CHANGE SINCE 2000
In this category
Participation � Free and Fair Executive Elections
� Free and Fair Elections
� Political Participation
� Electoral Self-Determination
� Effective Power to Govern
Rights � Core International Human Rights Conventions
� Human Rights � Political Rights � Workers’ Rights � Freedom of Expression*
� Freedom of Association and Assembly*
� Civil Liberties*
Gender � Gender Equality* � Gender Balance in Primary and Secondary Education
� Women’s Participation in the Labour Force
� Equal Representation in Rural Areas
� Women in Parliament
� Women’s Rights* � Legislation on Violence against Women
* clustered indicator (see Indicators p.35)

2013 IB
RA
HIM
IND
EX O
F AFR
ICA
N G
OV
ERN
AN
CE: SU
MM
ARY
24 Participation Rights
SUB-CATEGORY RESULTS
Continental average 46.1
Highest country score Cape Verde (96.2)
Lowest country score Eritrea (2.9)
Highest regional average West Africa (57.2)
Lowest regional average Central Africa (31.0)
Continental average 45.3
Highest country score Cape Verde (83.2)
Lowest country score Eritrea (6.4)
Highest regional average West Africa (54.6)
Lowest regional average Central Africa (30.9)
SCORE /100SCORE /100
average (45.3) |
Cape VerdeMauritiusGhanaNamibiaSTPSouth AfricaBeninSenegalZambiaLesothoBurkina FasoBotswanaNigerSierra LeoneTunisiaMalawiMaliSeychellesMozambiqueLiberiaGabonTanzaniaKenyaMoroccoComorosTogoUgandaMauritaniaNigeriaMadagascarBurundiCongoGuineaAlgeriaCôte d'IvoireEgyptCARChadGambiaGuinea-BissauAngolaLibyaSwazilandCameroonRwandaEthiopiaDjiboutiCongo DRZimbabweEq GuineaSomaliaEritrea
83.2
77.4
77.1
71.3
68.9
68.8
68.4
68.3
64.4
61.7
59.5
58.5
58.1
57.3
57.2
56.8
55.2
53.8
53.5
51.6
51.0
50.2
49.4
47.3
47.2
45.9
44.5
43.3
42.6
41.4
40.5
38.8
38.6
38.2
36.5
36.5
34.9
32.5
31.8
31.3
30.5
30.4
29.8
29.7
27.5
25.1
25.0
20.9
19.4
8.4
6.9
6.4average(46.1) |
Cape VerdeBotswanaMauritiusSTPBeninNigerLesothoSouth AfricaLiberiaComorosNamibiaGhanaMaliSenegalZambiaSeychellesTanzaniaMalawiSierra LeoneUgandaGuineaBurkina FasoTunisiaKenyaMozambiqueAngolaGabonBurundiGuinea-BissauMauritaniaCongo DREgyptCongoCameroonAlgeriaCôte d'IvoireCARNigeriaTogoEthiopiaLibyaChadZimbabweGambiaMadagascarRwandaEq GuineaMoroccoDjiboutiSwazilandSomaliaEritrea
96.2
87.4
84.0
79.6
78.7
77.1
76.9
73.0
71.8
70.8
69.1
68.7
66.2
66.2
66.2
65.3
63.8
61.0
57.7
53.4
51.6
50.2
49.6
49.5
49.3
45.9
45.8
44.7
42.9
40.6
37.7
33.7
32.7
32.7
32.2
31.7
29.8
28.8
28.0
24.5
23.3
23.1
19.4
19.2
17.3
16.0
15.1
13.8
13.7
11.9
7.1
2.9

2013 IB
RA
HIM
IND
EX O
F AFR
ICA
N G
OV
ERN
AN
CE: SU
MM
ARY
25Gender
SUB-CATEGORY RESULTS
Continental average 53.8
Highest country score Rwanda (90.2)
Lowest country score Somalia (20.5)
Highest regional average Southern Africa (64.9)
Lowest regional average Central Africa (43.1)
SCORE /100
average (53.8) |
RwandaSeychellesMozambiqueSouth AfricaBotswanaNamibiaUgandaTanzaniaMadagascarLesothoMauritiusSenegalMalawiCape VerdeTunisiaBurundiEthiopiaGhanaMauritaniaGambiaEritreaZimbabweEq GuineaKenyaAlgeriaSTPAngolaBeninBurkina FasoZambiaSwazilandMoroccoGuineaCameroonGabonSierra LeoneDjiboutiCongoLiberiaTogoNigeriaGuinea-BissauCAREgyptMaliCongo DRLibyaNigerComorosChadCôte d'IvoireSomalia
90.2
83.8
78.2
77.5
72.7
72.0
70.9
70.0
69.6
68.8
68.7
68.3
66.1
65.6
63.9
63.7
59.9
58.6
57.2
56.2
55.7
54.8
53.3
53.2
53.1
52.4
52.1
50.7
50.5
49.8
48.6
47.8
47.4
46.9
46.5
45.2
45.0
45.0
44.6
44.3
41.8
41.5
40.3
40.3
39.0
38.3
37.8
36.9
31.9
31.7
31.0
20.5
2013 IB
RA
HIM
IND
EX O
F AFR
ICA
N G
OV
ERN
AN
CE: SU
MM
ARY
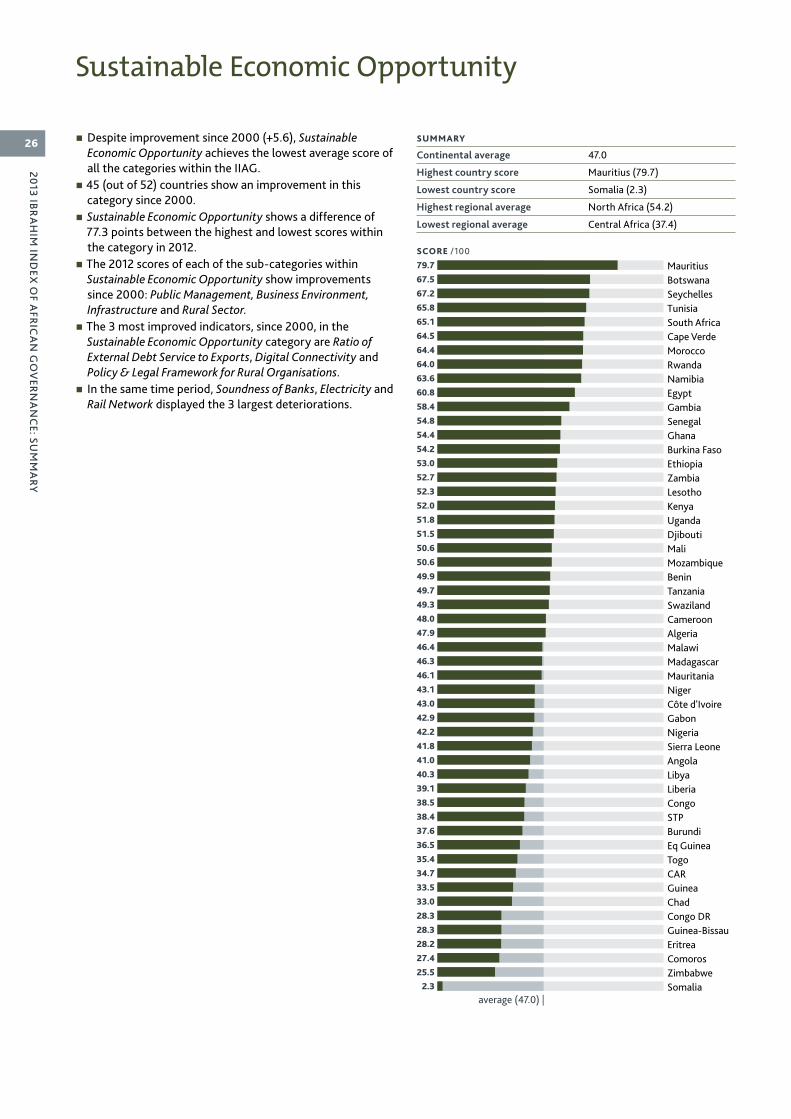
26 � Despite improvement since 2000 (+5.6), Sustainable Economic Opportunity achieves the lowest average score of all the categories within the IIAG.
� 45 (out of 52) countries show an improvement in this category since 2000.
� Sustainable Economic Opportunity shows a difference of 77.3 points between the highest and lowest scores within the category in 2012.
� The 2012 scores of each of the sub-categories within Sustainable Economic Opportunity show improvements since 2000: Public Management, Business Environment, Infrastructure and Rural Sector.
� The 3 most improved indicators, since 2000, in the Sustainable Economic Opportunity category are Ratio of External Debt Service to Exports, Digital Connectivity and Policy & Legal Framework for Rural Organisations.
� In the same time period, Soundness of Banks, Electricity and Rail Network displayed the 3 largest deteriorations.
Continental average 47.0
Highest country score Mauritius (79.7)
Lowest country score Somalia (2.3)
Highest regional average North Africa (54.2)
Lowest regional average Central Africa (37.4)
average (47.0) |
MauritiusBotswanaSeychellesTunisiaSouth AfricaCape VerdeMoroccoRwandaNamibiaEgyptGambiaSenegalGhanaBurkina FasoEthiopiaZambiaLesothoKenyaUgandaDjiboutiMaliMozambiqueBeninTanzaniaSwazilandCameroonAlgeriaMalawiMadagascarMauritaniaNigerCôte d'IvoireGabonNigeriaSierra LeoneAngolaLibyaLiberiaCongoSTPBurundiEq GuineaTogoCARGuineaChadCongo DRGuinea-BissauEritreaComorosZimbabweSomalia
79.7
67.5
67.2
65.8
65.1
64.5
64.4
64.0
63.6
60.8
58.4
54.8
54.4
54.2
53.0
52.7
52.3
52.0
51.8
51.5
50.6
50.6
49.9
49.7
49.3
48.0
47.9
46.4
46.3
46.1
43.1
43.0
42.9
42.2
41.8
41.0
40.3
39.1
38.5
38.4
37.6
36.5
35.4
34.7
33.5
33.0
28.3
28.3
28.2
27.4
25.5
2.3
SCORE /100
SUMMARY
Sustainable Economic Opportunity
2013 IB
RA
HIM
IND
EX O
F AFR
ICA
N G
OV
ERN
AN
CE: SU
MM
ARY
27
SUSTAINABLE ECONOMIC OPPORTUNITY RESULTS
27th Algeria 49.2 … 54.0 53.3 50.7 51.7 49.7 47.9
36th Angola 23.9 … 31.4 32.2 37.6 39.5 41.0 41.0
23rd Benin 47.1 … 48.9 46.5 50.5 52.4 50.9 49.9
2nd Botswana 63.0 … 66.7 68.3 68.0 68.1 67.7 67.5
14th Burkina Faso 50.0 … 49.7 50.7 56.6 57.4 55.9 54.2
41st Burundi 30.8 … 33.8 36.3 40.0 39.0 39.5 37.6
26th Cameroon 38.6 … 45.7 48.2 47.5 48.7 47.4 48.0
6th Cape Verde 54.1 … 58.8 64.1 63.0 63.6 64.3 64.5
44th Central African Republic 23.7 … 26.7 26.6 28.9 35.4 36.6 34.7
46th Chad 29.9 … 31.3 30.2 30.1 32.6 34.4 33.0
50th Comoros 26.2 … 28.2 26.6 26.3 27.8 27.0 27.4
39th Congo 31.9 … 36.1 38.4 37.7 39.6 39.8 38.5
47th Congo, Democratic Republic 16.0 … 28.3 29.7 25.1 27.1 27.8 28.3
32nd Côte d'Ivoire 41.8 … 40.2 39.3 41.5 41.1 42.7 43.0
20th Djibouti 46.2 … 45.0 41.0 45.7 46.0 47.4 51.5
10th Egypt 56.2 … 60.5 61.7 67.9 68.7 63.5 60.8
42nd Equatorial Guinea 25.7 … 33.3 35.5 33.7 34.2 35.3 36.5
49th Eritrea 35.3 … 34.3 33.8 28.6 30.1 29.1 28.2
15th Ethiopia 50.8 … 53.8 54.6 53.4 54.0 53.8 53.0
33rd Gabon 31.8 … 31.5 37.5 40.6 40.4 41.3 42.9
11th Gambia 47.8 … 48.9 49.4 54.1 55.3 55.2 58.4
13th Ghana 50.3 … 49.2 51.7 55.0 54.4 54.9 54.4
45th Guinea 35.9 … 36.4 34.3 34.0 31.7 33.0 33.5
48th Guinea-Bissau 22.3 … 29.4 29.6 32.5 32.6 32.4 28.3
18th Kenya 48.8 … 51.6 50.5 46.6 51.5 49.7 52.0
17th Lesotho 46.3 … 49.4 50.3 51.0 52.1 52.7 52.3
38th Liberia 18.7 … 24.2 24.2 26.0 32.9 33.7 39.1
37th Libya 49.2 … 50.2 52.4 50.7 53.5 40.8 40.3
29th Madagascar 47.0 … 53.5 54.7 52.4 49.8 46.9 46.3
28th Malawi 40.7 … 45.4 48.0 48.4 50.0 49.3 46.4
21st Mali 45.9 … 49.3 49.6 51.3 48.1 50.8 50.6
30th Mauritania 41.3 … 46.7 46.4 46.4 46.2 43.9 46.1
1st Mauritius 64.4 … 68.3 77.6 78.1 78.9 78.9 79.7
7th Morocco 54.7 … 62.4 61.7 63.7 63.7 63.6 64.4
22nd Mozambique 44.6 … 46.5 46.0 51.5 51.8 51.6 50.6
9th Namibia 57.1 … 59.6 62.7 64.7 65.6 64.1 63.6
31st Niger 37.9 … 43.4 45.5 44.1 45.0 44.6 43.1
34th Nigeria 37.3 … 39.4 38.5 41.5 40.0 40.8 42.2
8th Rwanda 50.4 … 54.6 54.5 56.4 58.4 60.6 64.0
40th São Tomé & Príncipe 41.3 … 38.2 40.2 37.3 35.9 39.0 38.4
12th Senegal 50.0 … 49.7 50.8 56.0 54.1 53.5 54.8
3rd Seychelles 55.4 … 60.6 59.5 60.5 64.8 66.7 67.2
35th Sierra Leone 27.4 … 34.6 37.2 40.7 40.4 40.3 41.8
52nd Somalia 1.3 … 2.2 1.8 3.0 3.0 1.9 2.3
5th South Africa 59.3 … 65.7 65.4 66.3 66.9 65.0 65.1
25th Swaziland 42.2 … 45.0 51.6 50.2 50.2 48.1 49.3
24th Tanzania 52.3 … 53.1 55.1 54.6 55.5 52.9 49.7
43rd Togo 25.5 … 28.1 28.3 32.1 33.5 31.1 35.4
4th Tunisia 64.0 … 66.5 67.2 66.8 67.0 67.8 65.8
19th Uganda 50.6 … 52.8 49.1 49.0 51.7 51.2 51.8
16th Zambia 46.9 … 49.4 47.3 48.6 50.1 51.3 52.7
51st Zimbabwe 24.4 … 18.5 20.4 22.7 24.6 26.0 25.5
SCORE /1002000 2007 2008 2009 2010 2011 2012
RANK /52 2012
* clustered indicator (see Indicators p.35)¹ newly-included indicator in 2013 IIAG
Public Management
� Statistical Capacity � Public Admin istration*
� Inflation � Diversification � Reserves � Budget Manage-ment*
� Ratio of Total Revenue to Total Expenditure
� Fiscal Policy* � Ratio of External Debt Service to Exports
� Revenue Collection*
� Soundness of banks¹
Business Environment
� Competitive Environment*
� Investment Climate � Investment Climate for Rural Businesses
� Rural Financial Services Development
� Bureaucracy and Red Tape
� Customs Procedures¹
Infrastructure � Electricity*¹ � Roads*¹ � Rail Network � Air Transport*¹ � Telephone and IT Infrastructure*
� Digital Connectivity*
Rural Sector � Public Resources for Rural Development
� Land and Water for Low-Income Rural Populations*
� Agricultural Research and Extension Services
� Agricultural Input and Produce Markets
� Policy and Legal Frame work for Rural Organisations
� Dialogue between Government and Rural Organisations
� Agricultural Policy Costs¹
In this category
Biggest Improvements
Biggest Deteriorations
38th Liberia 39.1 +20.4
36th Angola 41.0 +17.1
1st Mauritius 79.7 +15.3
35th Sierra Leone 41.8 +14.4
8th Rwanda 64.0 +13.7
37th Libya 40.3 -8.9
49th Eritrea 28.2 -7.1
40th São Tomé & Príncipe 38.4 -2.9
24th Tanzania 49.7 -2.6
45th Guinea 33.5 -2.5
RANK /52 2012
RANK /52 2012
SCORE /100 2012
SCORE /100 2012
CHANGE SINCE 2000
CHANGE SINCE 2000

2013 IB
RA
HIM
IND
EX O
F AFR
ICA
N G
OV
ERN
AN
CE: SU
MM
ARY
28 Public Management Business Environment
SUB-CATEGORY RESULTS
Continental average 53.4
Highest country score South Africa (76.9)
Lowest country score Somalia (3.8)
Highest regional average Southern Africa (58.7)
Lowest regional average East Africa (46.6)
Continental average 49.1
Highest country score Mauritius (93.0)
Lowest country score Somalia (0.0)
Highest regional average Southern Africa (57.3)
Lowest regional average Central Africa (34.9)
SCORE /100SCORE /100
average (53.4) |
South AfricaMauritiusBotswanaTunisiaMoroccoRwandaSenegalNamibiaBurkina FasoNigerMozambiqueCape VerdeKenyaNigeriaLesothoGhanaBeninTanzaniaZambiaUgandaAlgeriaMauritaniaMaliGambiaEthiopiaCameroonSeychellesCongoSwazilandCôte d'IvoireMalawiLiberiaGabonTogoGuineaEgyptDjiboutiMadagascarSierra LeoneAngolaCARCongo DREq GuineaBurundiChadSTPLibyaGuinea-BissauZimbabweComorosEritreaSomalia
76.9
73.6
72.8
69.9
69.2
64.0
63.3
62.6
62.4
62.4
61.3
61.2
61.1
58.3
58.2
58.0
57.7
57.2
56.9
56.8
56.7
56.6
56.3
55.8
55.6
55.3
53.8
53.7
53.4
53.1
53.1
52.9
52.3
52.0
50.6
50.6
50.1
49.3
48.8
47.7
46.5
45.3
44.2
43.8
43.7
43.0
40.6
40.3
39.2
37.4
29.5
3.8average (49.1) |
MauritiusRwandaBotswanaMoroccoSouth AfricaCape VerdeGambiaSenegalEgyptGhanaSeychellesNamibiaDjiboutiTunisiaLesothoZambiaUgandaMaliEthiopiaMadagascarBeninBurkina FasoSwazilandKenyaTanzaniaMozambiqueMalawiNigerGabonMauritaniaNigeriaSierra LeoneAngolaAlgeriaSTPCôte d'IvoireCameroonBurundiLiberiaCARChadComorosTogoGuinea-BissauGuineaCongoLibyaEq GuineaCongo DRZimbabweEritreaSomalia
93.0
84.7
73.3
71.5
70.4
68.0
67.7
65.1
64.7
63.8
63.6
63.0
60.9
60.7
60.4
59.6
58.2
57.7
56.4
55.0
54.7
54.7
53.5
52.6
52.2
50.8
48.3
48.3
47.2
46.6
46.3
46.0
44.9
44.3
43.3
43.2
43.2
40.0
39.8
39.3
34.2
33.9
32.8
31.5
30.4
29.9
28.7
27.6
22.7
15.6
10.1
0.0
2013 IB
RA
HIM
IND
EX O
F AFR
ICA
N G
OV
ERN
AN
CE: SU
MM
ARY
29Infrastructure Rural Sector
SUB-CATEGORY RESULTS
Continental average 32.6
Highest country score Seychelles (83.4)
Lowest country score Congo DR (1.0)
Highest regional average North Africa (46.8)
Lowest regional average Central Africa (22.1)
Continental average 53.8
Highest country score Cape Verde (81.2)
Lowest country score Zimbabwe (12.5)
Highest regional average North Africa (60.0)
Lowest regional average Central Africa (44.1)
SCORE /100 SCORE /100
average (32.6) |
SeychellesMauritiusNamibiaTunisiaBotswanaEgyptSouth AfricaMoroccoLibyaCape VerdeDjiboutiLesothoSwazilandEthiopiaCôte d'IvoireGambiaZambiaAlgeriaZimbabweGhanaCameroonEq GuineaTanzaniaAngolaMozambiqueMalawiKenyaBurkina FasoRwandaGabonMadagascarMaliCongoUgandaSenegalBeninLiberiaEritreaMauritaniaSTPTogoSierra LeoneBurundiNigeriaCARChadGuinea-BissauGuineaNigerComorosSomaliaCongo DR
83.4
71.7
69.6
61.6
59.8
55.0
54.1
53.3
52.0
47.7
46.1
42.1
41.4
39.3
39.3
39.3
37.7
36.8
34.7
34.1
33.5
33.2
32.7
32.3
31.7
31.3
31.3
30.7
30.5
30.4
29.5
27.4
27.1
26.9
25.4
25.4
24.9
23.4
22.3
19.5
18.4
17.8
16.8
14.9
14.9
14.2
7.9
6.5
5.4
3.3
3.3
1.0 average (53.8) |
Cape VerdeMauritiusRwandaEgyptTunisiaGambiaBurkina FasoSeychellesSenegalUgandaBotswanaMoroccoKenyaBeninGhanaEthiopiaMaliCameroonNamibiaMauritaniaSouth AfricaMozambiqueTanzaniaZambiaNigerSierra LeoneAlgeriaMalawiMadagascarEritreaBurundiNigeriaSwazilandDjiboutiLesothoSTPGuineaCongo DRCongoGabonEq GuineaLibyaChadAngolaLiberiaTogoCARCôte d'IvoireComorosGuinea-BissauZimbabwe
81.2
80.4
76.9
72.9
70.9
70.7
68.9
68.0
65.5
65.3
64.0
63.8
63.2
61.9
61.7
60.9
60.8
60.2
59.1
59.0
58.9
58.4
56.8
56.7
56.3
54.6
53.8
52.9
51.7
49.9
49.7
49.1
49.0
48.8
48.5
47.7
46.2
44.4
43.3
41.7
41.1
39.8
39.8
38.9
38.8
38.5
38.0
36.2
34.9
33.6
12.5
* No data are available for Somalia
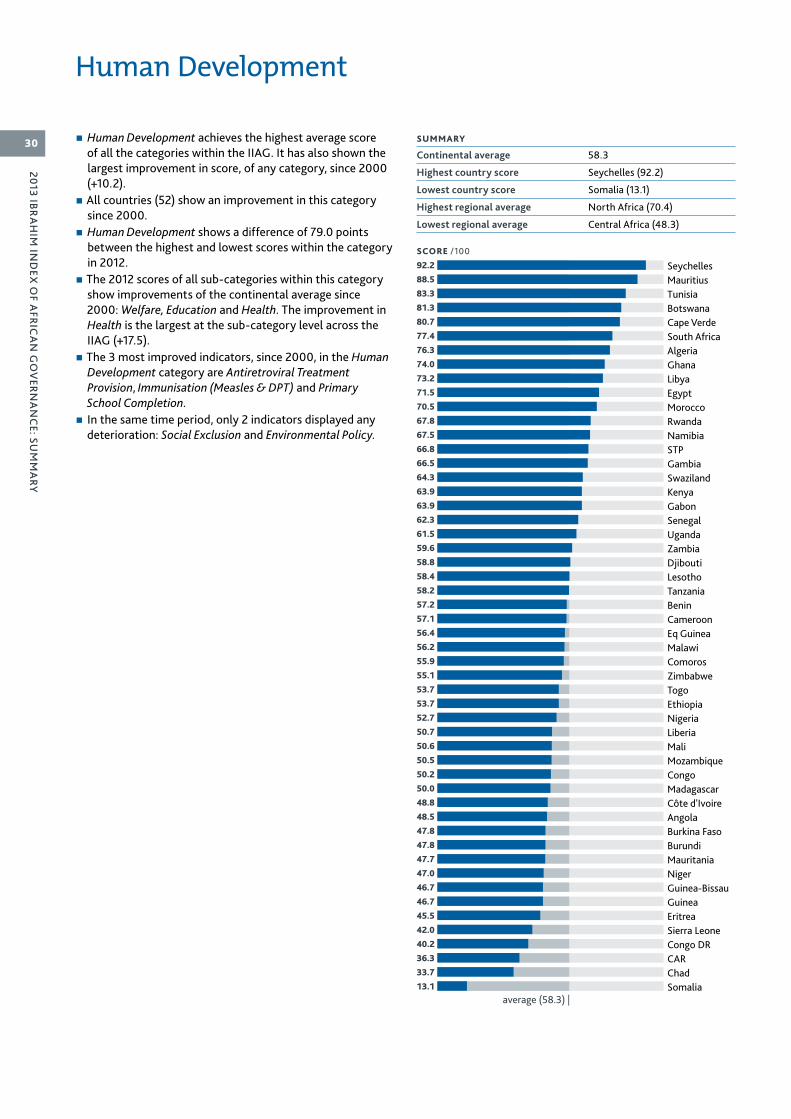
2013 IB
RA
HIM
IND
EX O
F AFR
ICA
N G
OV
ERN
AN
CE: SU
MM
ARY
30 � Human Development achieves the highest average score of all the categories within the IIAG. It has also shown the largest improvement in score, of any category, since 2000 (+10.2).
� All countries (52) show an improvement in this category since 2000.
� Human Development shows a difference of 79.0 points between the highest and lowest scores within the category in 2012.
� The 2012 scores of all sub-categories within this category show improvements of the continental average since 2000: Welfare, Education and Health. The improvement in Health is the largest at the sub-category level across the IIAG (+17.5).
� The 3 most improved indicators, since 2000, in the Human Development category are Antiretroviral Treatment Provision, Immunisation (Measles & DPT) and Primary School Completion.
� In the same time period, only 2 indicators displayed any deterioration: Social Exclusion and Environmental Policy.
Continental average 58.3
Highest country score Seychelles (92.2)
Lowest country score Somalia (13.1)
Highest regional average North Africa (70.4)
Lowest regional average Central Africa (48.3)
average (58.3) |
SeychellesMauritiusTunisiaBotswanaCape VerdeSouth AfricaAlgeriaGhanaLibyaEgyptMoroccoRwandaNamibiaSTPGambiaSwazilandKenyaGabonSenegalUgandaZambiaDjiboutiLesothoTanzaniaBeninCameroonEq GuineaMalawiComorosZimbabweTogoEthiopiaNigeriaLiberiaMaliMozambiqueCongoMadagascarCôte d'IvoireAngolaBurkina FasoBurundiMauritaniaNigerGuinea-BissauGuineaEritreaSierra LeoneCongo DRCARChadSomalia
92.2
88.5
83.3
81.3
80.7
77.4
76.3
74.0
73.2
71.5
70.5
67.8
67.5
66.8
66.5
64.3
63.9
63.9
62.3
61.5
59.6
58.8
58.4
58.2
57.2
57.1
56.4
56.2
55.9
55.1
53.7
53.7
52.7
50.7
50.6
50.5
50.2
50.0
48.8
48.5
47.8
47.8
47.7
47.0
46.7
46.7
45.5
42.0
40.2
36.3
33.7
13.1
SCORE /100
SUMMARY
Human Development
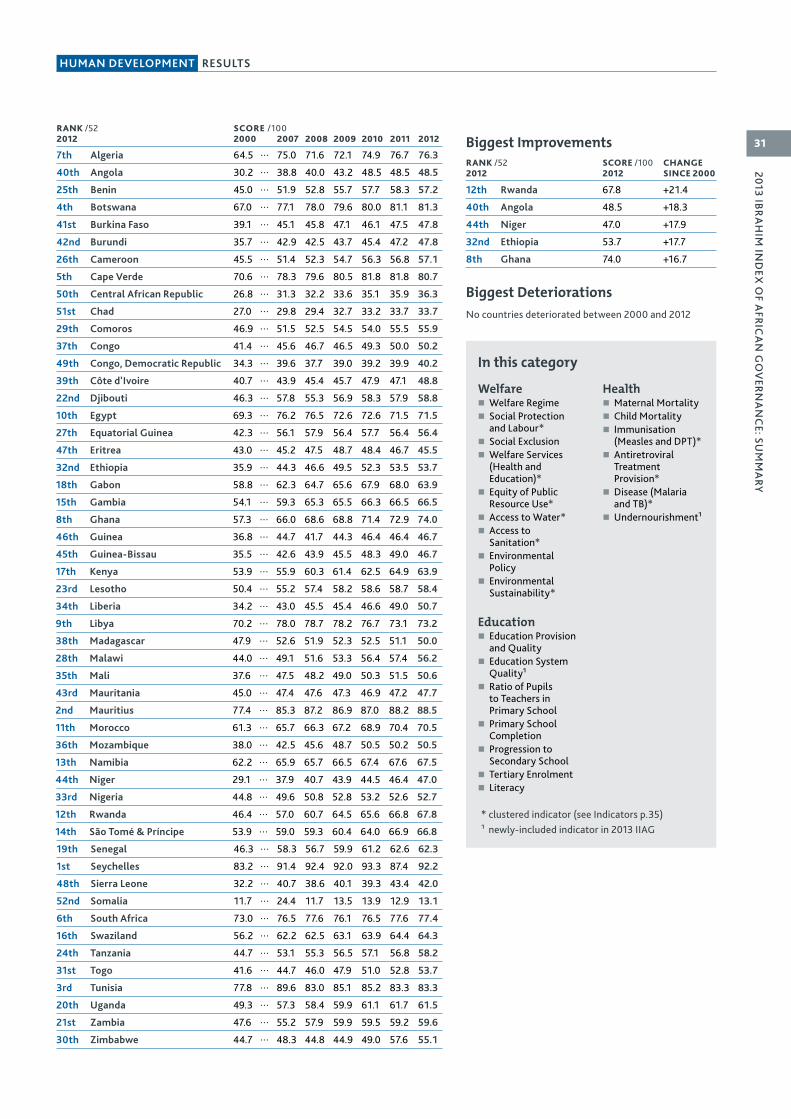
2013 IB
RA
HIM
IND
EX O
F AFR
ICA
N G
OV
ERN
AN
CE: SU
MM
ARY
31
RESULTSHUMAN DEVELOPMENT
7th Algeria 64.5 … 75.0 71.6 72.1 74.9 76.7 76.3
40th Angola 30.2 … 38.8 40.0 43.2 48.5 48.5 48.5
25th Benin 45.0 … 51.9 52.8 55.7 57.7 58.3 57.2
4th Botswana 67.0 … 77.1 78.0 79.6 80.0 81.1 81.3
41st Burkina Faso 39.1 … 45.1 45.8 47.1 46.1 47.5 47.8
42nd Burundi 35.7 … 42.9 42.5 43.7 45.4 47.2 47.8
26th Cameroon 45.5 … 51.4 52.3 54.7 56.3 56.8 57.1
5th Cape Verde 70.6 … 78.3 79.6 80.5 81.8 81.8 80.7
50th Central African Republic 26.8 … 31.3 32.2 33.6 35.1 35.9 36.3
51st Chad 27.0 … 29.8 29.4 32.7 33.2 33.7 33.7
29th Comoros 46.9 … 51.5 52.5 54.5 54.0 55.5 55.9
37th Congo 41.4 … 45.6 46.7 46.5 49.3 50.0 50.2
49th Congo, Democratic Republic 34.3 … 39.6 37.7 39.0 39.2 39.9 40.2
39th Côte d'Ivoire 40.7 … 43.9 45.4 45.7 47.9 47.1 48.8
22nd Djibouti 46.3 … 57.8 55.3 56.9 58.3 57.9 58.8
10th Egypt 69.3 … 76.2 76.5 72.6 72.6 71.5 71.5
27th Equatorial Guinea 42.3 … 56.1 57.9 56.4 57.7 56.4 56.4
47th Eritrea 43.0 … 45.2 47.5 48.7 48.4 46.7 45.5
32nd Ethiopia 35.9 … 44.3 46.6 49.5 52.3 53.5 53.7
18th Gabon 58.8 … 62.3 64.7 65.6 67.9 68.0 63.9
15th Gambia 54.1 … 59.3 65.3 65.5 66.3 66.5 66.5
8th Ghana 57.3 … 66.0 68.6 68.8 71.4 72.9 74.0
46th Guinea 36.8 … 44.7 41.7 44.3 46.4 46.4 46.7
45th Guinea-Bissau 35.5 … 42.6 43.9 45.5 48.3 49.0 46.7
17th Kenya 53.9 … 55.9 60.3 61.4 62.5 64.9 63.9
23rd Lesotho 50.4 … 55.2 57.4 58.2 58.6 58.7 58.4
34th Liberia 34.2 … 43.0 45.5 45.4 46.6 49.0 50.7
9th Libya 70.2 … 78.0 78.7 78.2 76.7 73.1 73.2
38th Madagascar 47.9 … 52.6 51.9 52.3 52.5 51.1 50.0
28th Malawi 44.0 … 49.1 51.6 53.3 56.4 57.4 56.2
35th Mali 37.6 … 47.5 48.2 49.0 50.3 51.5 50.6
43rd Mauritania 45.0 … 47.4 47.6 47.3 46.9 47.2 47.7
2nd Mauritius 77.4 … 85.3 87.2 86.9 87.0 88.2 88.5
11th Morocco 61.3 … 65.7 66.3 67.2 68.9 70.4 70.5
36th Mozambique 38.0 … 42.5 45.6 48.7 50.5 50.2 50.5
13th Namibia 62.2 … 65.9 65.7 66.5 67.4 67.6 67.5
44th Niger 29.1 … 37.9 40.7 43.9 44.5 46.4 47.0
33rd Nigeria 44.8 … 49.6 50.8 52.8 53.2 52.6 52.7
12th Rwanda 46.4 … 57.0 60.7 64.5 65.6 66.8 67.8
14th São Tomé & Príncipe 53.9 … 59.0 59.3 60.4 64.0 66.9 66.8
19th Senegal 46.3 … 58.3 56.7 59.9 61.2 62.6 62.3
1st Seychelles 83.2 … 91.4 92.4 92.0 93.3 87.4 92.2
48th Sierra Leone 32.2 … 40.7 38.6 40.1 39.3 43.4 42.0
52nd Somalia 11.7 … 24.4 11.7 13.5 13.9 12.9 13.1
6th South Africa 73.0 … 76.5 77.6 76.1 76.5 77.6 77.4
16th Swaziland 56.2 … 62.2 62.5 63.1 63.9 64.4 64.3
24th Tanzania 44.7 … 53.1 55.3 56.5 57.1 56.8 58.2
31st Togo 41.6 … 44.7 46.0 47.9 51.0 52.8 53.7
3rd Tunisia 77.8 … 89.6 83.0 85.1 85.2 83.3 83.3
20th Uganda 49.3 … 57.3 58.4 59.9 61.1 61.7 61.5
21st Zambia 47.6 … 55.2 57.9 59.9 59.5 59.2 59.6
30th Zimbabwe 44.7 … 48.3 44.8 44.9 49.0 57.6 55.1
SCORE /1002000 2007 2008 2009 2010 2011 2012
RANK /52 2012 Biggest Improvements
Biggest DeteriorationsNo countries deteriorated between 2000 and 2012
12th Rwanda 67.8 +21.4
40th Angola 48.5 +18.3
44th Niger 47.0 +17.9
32nd Ethiopia 53.7 +17.7
8th Ghana 74.0 +16.7
RANK /52 2012
SCORE /100 2012
CHANGE SINCE 2000
In this category
Welfare � Welfare Regime � Social Protection and Labour*
� Social Exclusion � Welfare Services (Health and Education)*
� Equity of Public Resource Use*
� Access to Water* � Access to Sanitation*
� Environmental Policy
� Environmental Sustainability*
Education � Education Provision and Quality
� Education System Quality¹
� Ratio of Pupils to Teachers in Primary School
� Primary School Completion
� Progression to Secondary School
� Tertiary Enrolment � Literacy
Health � Maternal Mortality � Child Mortality � Immunisation (Measles and DPT)*
� Antiretroviral Treatment Provision*
� Disease (Malaria and TB)*
� Undernourishment¹
* clustered indicator (see Indicators p.35)¹ newly-included indicator in 2013 IIAG

2013 IB
RA
HIM
IND
EX O
F AFR
ICA
N G
OV
ERN
AN
CE: SU
MM
ARY
32 Welfare Education
SUB-CATEGORY RESULTS
Continental average 51.6
Highest country score Mauritius (86.5)
Lowest country score Somalia (5.5)
Highest regional average North Africa (60.8)
Lowest regional average Central Africa (41.9)
Continental average 52.9
Highest country score Seychelles (92.9)
Lowest country score Somalia (0.0)
Highest regional average North Africa (65.8)
Lowest regional average Central Africa (47.3)
SCORE /100 SCORE /100
average (51.6) |
MauritiusSeychellesSouth AfricaBotswanaCape VerdeTunisiaRwandaAlgeriaGhanaGambiaEgyptNamibiaDjiboutiMoroccoUgandaSenegalGabonSTPKenyaCameroonTanzaniaBurundiMalawiSwazilandLibyaBeninZambiaComorosLesothoEthiopiaMaliBurkina FasoNigeriaMozambiqueMauritaniaCongoAngolaEq GuineaLiberiaNigerGuineaSierra LeoneGuinea-BissauCôte d'IvoireMadagascarTogoZimbabweCARCongo DRChadEritreaSomalia
86.5
84.8
77.8
77.4
76.9
74.8
68.9
68.5
68.2
62.8
62.5
62.5
61.8
61.7
60.7
60.0
56.4
55.8
54.0
52.8
52.5
51.9
51.7
51.3
51.3
50.6
50.2
49.4
48.8
48.8
48.6
48.2
47.9
47.7
46.1
45.0
45.0
42.3
42.3
41.2
40.8
40.3
39.8
38.7
36.6
35.7
35.1
33.8
31.6
31.1
20.9
5.5average (52.9) |
SeychellesMauritiusTunisiaCape VerdeBotswanaGhanaSouth AfricaEq GuineaLibyaAlgeriaEgyptMoroccoGabonSTPSwazilandKenyaComorosGambiaNamibiaZambiaCameroonLiberiaRwandaZimbabweUgandaTogoSenegalLesothoEthiopiaNigeriaMadagascarTanzaniaBeninDjiboutiEritreaCongoCôte d'IvoireCongo DRMalawiMaliGuinea-BissauAngolaBurundiMozambiqueSierra LeoneMauritaniaGuineaNigerChadBurkina FasoCARSomalia
92.9
88.1
86.0
78.0
76.9
71.7
71.4
70.9
70.0
69.9
67.8
65.0
62.6
62.3
62.1
60.6
59.5
59.4
57.1
57.0
55.1
54.5
54.4
54.2
53.7
53.5
53.3
53.2
49.3
49.0
48.6
47.6
46.6
45.8
45.0
43.2
41.8
41.1
41.0
40.6
40.3
39.9
39.0
38.7
37.4
36.3
36.0
34.7
31.6
28.7
26.3
0.0
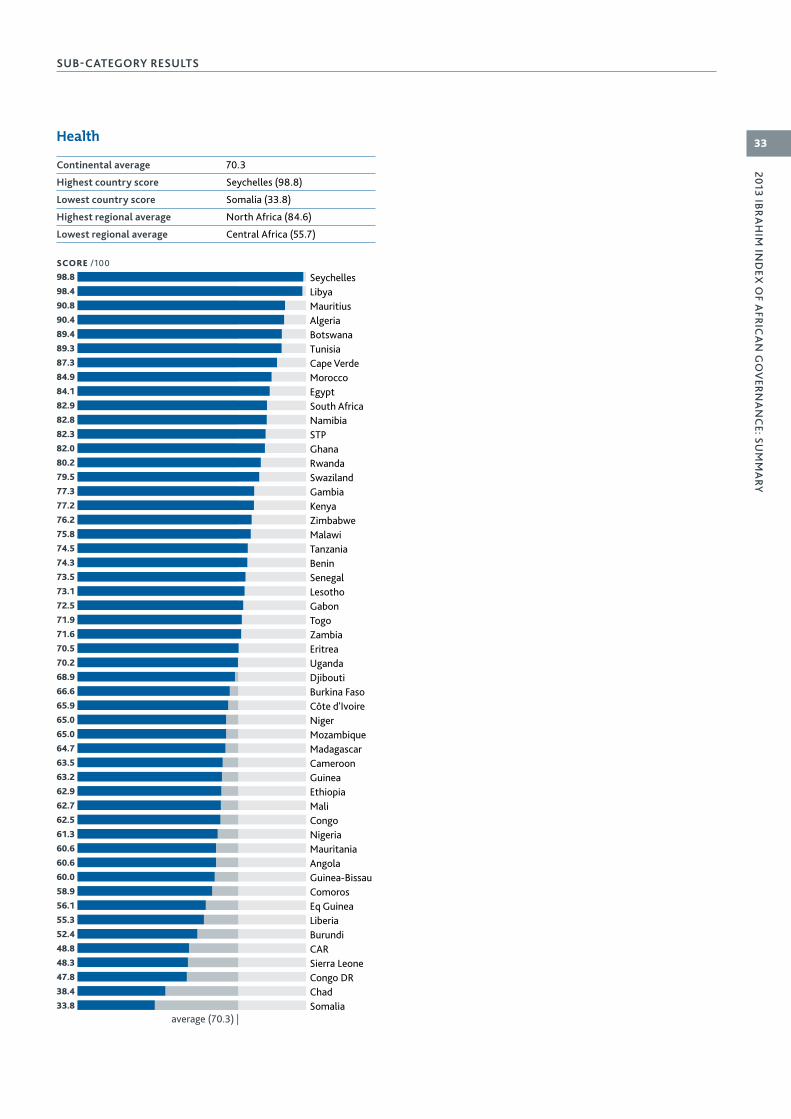
2013 IB
RA
HIM
IND
EX O
F AFR
ICA
N G
OV
ERN
AN
CE: SU
MM
ARY
33Health
SUB-CATEGORY RESULTS
Continental average 70.3
Highest country score Seychelles (98.8)
Lowest country score Somalia (33.8)
Highest regional average North Africa (84.6)
Lowest regional average Central Africa (55.7)
SCORE /100
average (70.3) |
SeychellesLibyaMauritiusAlgeriaBotswanaTunisiaCape VerdeMoroccoEgyptSouth AfricaNamibiaSTPGhanaRwandaSwazilandGambiaKenyaZimbabweMalawiTanzaniaBeninSenegalLesothoGabonTogoZambiaEritreaUgandaDjiboutiBurkina FasoCôte d'IvoireNigerMozambiqueMadagascarCameroonGuineaEthiopiaMaliCongoNigeriaMauritaniaAngolaGuinea-BissauComorosEq GuineaLiberiaBurundiCARSierra LeoneCongo DRChadSomalia
98.8
98.4
90.8
90.4
89.4
89.3
87.3
84.9
84.1
82.9
82.8
82.3
82.0
80.2
79.5
77.3
77.2
76.2
75.8
74.5
74.3
73.5
73.1
72.5
71.9
71.6
70.5
70.2
68.9
66.6
65.9
65.0
65.0
64.7
63.5
63.2
62.9
62.7
62.5
61.3
60.6
60.6
60.0
58.9
56.1
55.3
52.4
48.8
48.3
47.8
38.4
33.8

2013 IB
RA
HIM
IND
EX O
F AFR
ICA
N G
OV
ERN
AN
CE: SU
MM
ARY
34
Data Sources
African Economic Outlook (AEO)Website: www.africaneconomicoutlook.orgAfrican Development Bank (AfDB); Organisation for Economic Co-operation and Development (OECD); United Nations Development Programme (UNDP); United Nations Economic Commission for Africa (UNECA)
African Electoral Index: 2000-2012 commissioned by the Mo Ibrahim FoundationWebsite: bit.ly/1b4q7NKInstitut de Recherche Empirique en Economie Politique (IREEP)
African Statistical Yearbook (ASY)Website: bit.ly/PLLfykAfrican Union (AU); African Development Bank (AfDB); United Nations Economic Commission for Africa (UNECA)
AIDSinfo Database (AIDSinfo)Website: www.aidsinfoonline.orgJoint United Nations Programme on HIV/AIDS (UNAIDS)
Bertelsmann Transformation Index (BTI)Website: www.bti-project.orgBertelsmann Stiftung (BS)
Bulletin Board on Statistical Capacity (BBSC)Website: go.worldbank.org/3J9X57XKY0World Bank (WB)
Child Mortality Estimates Info (CME)Website: www.childmortality.orgInter-agency Group for Child Mortality Estimation (IGME)
Cingranelli-Richards Human Rights Dataset (CIRI)Website: www.humanrightsdata.orgThe Cingranelli-Richards Human Rights Data Project (CIRI)
Country Data (CountryData)Website: bit.ly/1b4q7NKEconomist Intelligence Unit (EIU)
Country Performance Assessment (CPA)Website: bit.ly/HDYvO0African Development Bank (AfDB)
Data commissioned by the Mo Ibrahim FoundationWebsite: bit.ly/1b4q7NKEconomist Intelligence Unit (EIU)
Democracy Index (DemIndex)Website: bit.ly/1b4q7NKEconomist Intelligence Unit (EIU)
Freedom in the World Survey (FITW)Website: bit.ly/A422EJFreedom House (FH)
Freedom of the Press Index (FOTP)Website: bit.ly/wrZ4uaFreedom House (FH)
Global Competitiveness Report (GCR)Website: bit.ly/dN63V4World Economic Forum (WEF)
Global Health Observatory Database (GHO)Website: apps.who.int/ghodataWorld Health Organization (WHO)
IDA Resource Allocation Index (IRAI)Website: bit.ly/1eD4ELvWorld Bank (WB)
Index of Economic Freedom (Index Econ Freedom)Website: www.heritage.org/indexThe Heritage Foundation and The Wall Street Journal (HER-WSG)
Institute for Statistics (UIS)Website: www.uis.unesco.orgUnited Nations Educational, Scientific and Cultural Organization (UNESCO)
Internal Displacement: Global Overview of Trends and Developments (Global Overview of Trends)Website: bit.ly/19GPT6JInternal Displacement Monitoring Centre (IDMC)
Multilateral Treaties Deposited with the Secretary General (MTDSG)Website: bit.ly/9Gj8Z5 | bit.ly/1aBQFq8Office of the High Commissioner for Human Rights (OHCHR)
Performance-based Allocation System & Rural Sector Performance Assessments (PBAS)Website: bit.ly/15QNUiZInternational Fund for Agricultural Development (IFAD)
Political Terror Scale (PTS)Website: www.politicalterrorscale.orgPolitical Terror Scale (PTS)
Sanctions in Africa 2000-2012 commissioned by the Mo Ibrahim FoundationWebsite: bit.ly/1b4q7NKCDD Ghana (CDD)
Social Institutions and Gender Index under Gender, Institutions and Development Database (GID-DB/SIGI)Website: www.genderindex.orgOrganisation for Economic Co-operation and Development (OECD)
Trafficking in Persons Report (TIP)Website: 1.usa.gov/wzUqOMU.S. Department of State - Office to Monitor and Combat Trafficking in Persons (USDS)
Armed Conflict Dataset v.4-2013, 1946-2012 (UCDP/PRIO)Website: bit.ly/Otux4VUppsala University, Department of Peace and Conflict Research - Uppsala Conflict Data Programme (UDCP)
UNHCR Statistical Online Population Database (Online Population Database)Website: bit.ly/1aBQWtmOffice of the United Nations High Commissioner for Refugees (UNHCR)
Joint Monitoring Programme for Water Supply and Sanitation Database (WHO/UNICEF JMP)Website: www.wssinfo.orgWorld Health Organization (WHO)
World Development Indicators (WDI)Website: bit.ly/ctqHsZWorld Bank (WB)
World Telecommunications / ICT Indicators Database (ICT Database)Website: bit.ly/1b4q7NKInternational Telecommunication Union (ITU)
Worldwide Governance Indicators (WGI)Website: bit.ly/15jcQgFWorld Bank (WB)
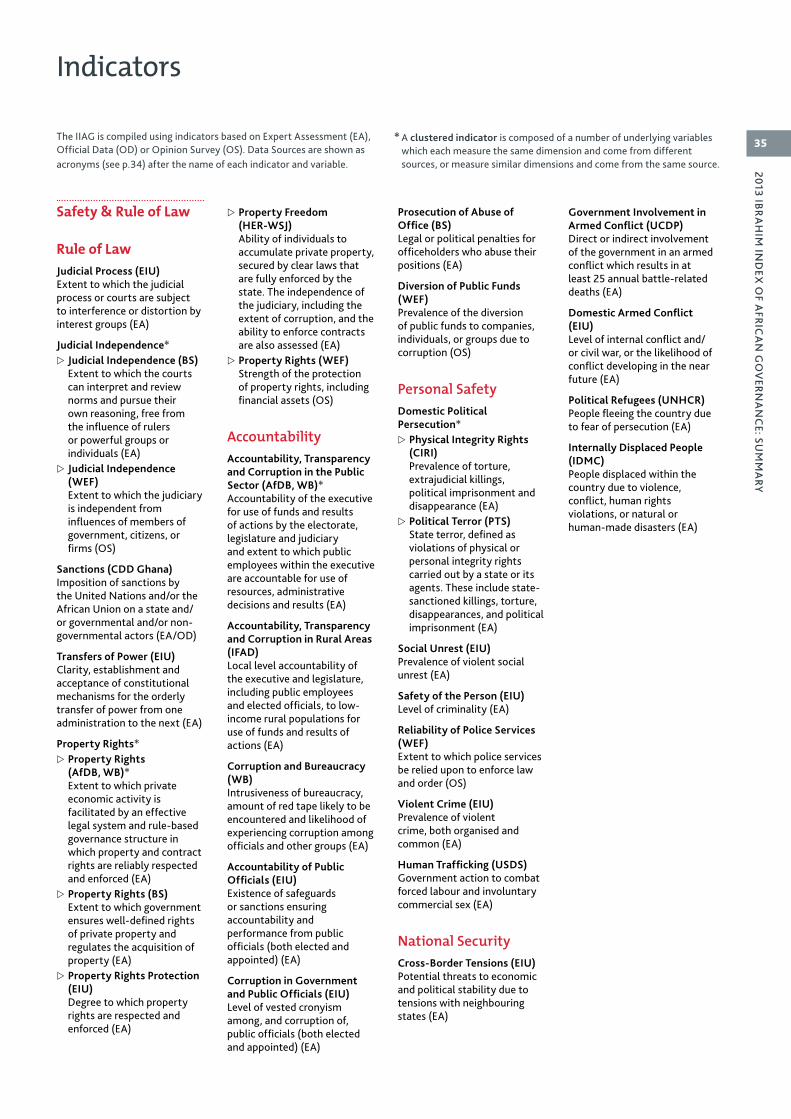
2013 IB
RA
HIM
IND
EX O
F AFR
ICA
N G
OV
ERN
AN
CE: SU
MM
ARY
35
Indicators
Safety & Rule of Law
Rule of LawJudicial Process (EIU)Extent to which the judicial process or courts are subject to interference or distortion by interest groups (EA)
Judicial Independence* Z Judicial Independence (BS)Extent to which the courts can interpret and review norms and pursue their own reasoning, free from the influence of rulers or powerful groups or individuals (EA)
Z Judicial Independence (WEF) Extent to which the judiciary is independent from influences of members of government, citizens, or firms (OS)
Sanctions (CDD Ghana)Imposition of sanctions by the United Nations and/or the African Union on a state and/or governmental and/or non-governmental actors (EA/OD)
Transfers of Power (EIU)Clarity, establishment and acceptance of constitutional mechanisms for the orderly transfer of power from one administration to the next (EA)
Property Rights* Z Property Rights (AfDB, WB)*Extent to which private economic activity is facilitated by an effective legal system and rule-based governance structure in which property and contract rights are reliably respected and enforced (EA)
Z Property Rights (BS)Extent to which government ensures well-defined rights of private property and regulates the acquisition of property (EA)
Z Property Rights Protection (EIU)Degree to which property rights are respected and enforced (EA)
Z Property Freedom (HER-WSJ)Ability of individuals to accumulate private property, secured by clear laws that are fully enforced by the state. The independence of the judiciary, including the extent of corruption, and the ability to enforce contracts are also assessed (EA)
Z Property Rights (WEF)Strength of the protection of property rights, including financial assets (OS)
AccountabilityAccountability, Transparency and Corruption in the Public Sector (AfDB, WB)* Accountability of the executive for use of funds and results of actions by the electorate, legislature and judiciary and extent to which public employees within the executive are accountable for use of resources, administrative decisions and results (EA)
Accountability, Transparency and Corruption in Rural Areas (IFAD)Local level accountability of the executive and legislature, including public employees and elected officials, to low-income rural populations for use of funds and results of actions (EA)
Corruption and Bureaucracy (WB)Intrusiveness of bureaucracy, amount of red tape likely to be encountered and likelihood of experiencing corruption among officials and other groups (EA)
Accountability of Public Officials (EIU)Existence of safeguards or sanctions ensuring accountability and performance from public officials (both elected and appointed) (EA)
Corruption in Government and Public Officials (EIU)Level of vested cronyism among, and corruption of, public officials (both elected and appointed) (EA)
Prosecution of Abuse of Office (BS)Legal or political penalties for officeholders who abuse their positions (EA)
Diversion of Public Funds (WEF)Prevalence of the diversion of public funds to companies, individuals, or groups due to corruption (OS)
Personal SafetyDomestic Political Persecution*
Z Physical Integrity Rights (CIRI)Prevalence of torture, extrajudicial killings, political imprisonment and disappearance (EA)
Z Political Terror (PTS)State terror, defined as violations of physical or personal integrity rights carried out by a state or its agents. These include state-sanctioned killings, torture, disappearances, and political imprisonment (EA)
Social Unrest (EIU)Prevalence of violent social unrest (EA)
Safety of the Person (EIU)Level of criminality (EA)
Reliability of Police Services (WEF)Extent to which police services be relied upon to enforce law and order (OS)
Violent Crime (EIU)Prevalence of violent crime, both organised and common (EA)
Human Trafficking (USDS)Government action to combat forced labour and involuntary commercial sex (EA)
National SecurityCross-Border Tensions (EIU) Potential threats to economic and political stability due to tensions with neighbouring states (EA)
Government Involvement in Armed Conflict (UCDP)Direct or indirect involvement of the government in an armed conflict which results in at least 25 annual battle-related deaths (EA)
Domestic Armed Conflict (EIU)Level of internal conflict and/or civil war, or the likelihood of conflict developing in the near future (EA)
Political Refugees (UNHCR)People fleeing the country due to fear of persecution (EA)
Internally Displaced People (IDMC)People displaced within the country due to violence, conflict, human rights violations, or natural or human-made disasters (EA)
The IIAG is compiled using indicators based on Expert Assessment (EA), Official Data (OD) or Opinion Survey (OS). Data Sources are shown as acronyms (see p.34) after the name of each indicator and variable.
* A clustered indicator is composed of a number of underlying variables which each measure the same dimension and come from different sources, or measure similar dimensions and come from the same source.

2013 IB
RA
HIM
IND
EX O
F AFR
ICA
N G
OV
ERN
AN
CE: SU
MM
ARY
36 Participation & Human Rights
ParticipationFree and Fair Executive Elections (IREEP)Freedom and fairness of executive elections across the campaign period and all aspects of the election process, including extent of opposition participation, adherence to electoral procedures, citizens’ access to information, levels of violence, acceptance of results and turnover of power (EA)
Free and Fair Elections (BS) Freedom and fairness of elections (EA)
Political Participation (EIU)Availability of relevant information for citizens and their freedom to participate in the political process (EA)
Electoral Self-Determination (CIRI)Extent to which citizens enjoy freedom of political choice, and the legal right and effective capacity to change laws and governing bodies through free and fair elections (EA)
Effective Power to Govern (BS)Extent to which democratically elected rulers have effective power to govern or to which there are veto powers and political enclaves (EA)
RightsCore International Human Rights Conventions (OHCHR)Whether a country has ratified the nine core international human rights conventions and, additionally, whether it has submitted the first of a number of regular reports to treaty bodies that monitor implementation (EA/OD)
Human Rights (EIU)Likelihood of a state being accused of serious human rights violations (EA)
Political Rights (FH)Freedom to participate in the political process including the right to vote freely for distinct alternatives in legitimate elections, compete for public office, join political parties and organisations, and elect accountable representatives (EA)
Workers’ Rights (CIRI)Extent to which workers enjoy internationally recognised rights at work, including freedom of association, the right to bargain collectively, a minimum age of employment and acceptable conditions with regards to minimum wages, hours of work, and occupational safety and health (EA)
Freedom of Expression* Z Freedom of Expression (BS)Extent to which citizens, organisations and mass media can express opinions freely (EA)
Z Freedom of Speech and Press (CIRI)Extent to which freedoms of speech and press are affected by government censorship, including ownership of media outlets (EA)
Z Press Freedom (FH)Print, broadcast and internet freedom (EA)
Freedom of Association and Assembly*
Z Freedom of Association and Assembly (BS)Extent to which independent political and/or civic groups can associate and assemble freely (EA)
Z Freedom of Assembly and Association (CIRI)Extent to which the internationally recognised right of citizens to associate freely with other persons in political parties, trade unions, cultural organisations or other special interest groups exists in practice (EA)
Z Freedom of Association (EIU)Extent to which freedom of association and the right to collective bargaining is respected (EA)
Civil Liberties* Z Protection of Civil Liberties (BS)Extent to which civil rights are guaranteed and protected and citizens can seek redress for violations of these liberties (EA)
Z Civil Liberties (EIU)Extent of various citizens’ freedoms including equality under the law, freedom from torture and freedom of expression (EA)
Z Civil Liberties (FH)Extent of civil liberties: freedom of expression and belief; associational and organisational rights; rule of law; and personal autonomy without interference from the state (EA)
GenderGender Equality (AfDB, WB)* Whether a country has enacted, and enforces, laws and policies that promote equal access for men and women to human capital development opportunities, and productive and economic resources; and give men and women equal status and protection under the law (EA)
Gender Balance in Primary and Secondary Education (WB)Ratio of girls to boys enrolled at primary and secondary levels in public and private schools (OD)
Women’s Participation in the Labour Force (WB)Female population, 15 and older, that is economically active (OD)
Equal Representation in Rural Areas (IFAD)Extent to which laws, policies, institutions and practices promote equal representation of men and women in local decision-making (EA)
Women in Parliament (WB)Parliamentary seats, in a single or lower chamber, held by women (OD)
Women’s Rights (CIRI)* Z Women’s Economic RightsExtent to which women enjoy internationally recognised rights at work (EA)
Z Women’s Political RightsExtent to which women enjoy internationally recognised rights to participate freely in the political process (EA)
Legislation on Violence against Women (OECD)Existence of laws against domestic violence, sexual assault or rape, and sexual harassment (EA)
Sustainable Economic Opportunity
Public ManagementStatistical Capacity (WB)Capacity of statistical systems in terms of methodology, data sources, periodicity and timeliness (EA)
Public Administration (AfDB, WB)* Extent to which civilian central government (including teachers, health workers and police) is structured to design and implement government policy and effectively deliver services (EA)
Inflation (IMF)Average change in consumer price index in local currency over the previous year (OD)
Diversification (AfDB-OECD)Extent to which exports are diversified (OD)
Reserves (EIU)Total international reserves in relation to imports of goods and non-factor services (OD)
Budget Management (AfDB, WB)* Extent to which the budget is comprehensive and credible, linked to policy priorities, with effective financial management systems and timely and accurate fiscal reporting (EA)
Ratio of Total Revenue to Total Expenditure (EIU)Total budget revenue as a proportion of total budget expenditure (OD)
Fiscal Policy (AfDB, WB)* Short and medium-term sustainability of fiscal policy (taking into account monetary and exchange rate policy and sustainability of public debt) and its impact on growth (EA)
Ratio of External Debt Service to Exports (EIU)Total external debt service due in relation to exports of goods, non-factor services, income and workers’ remittances (OD)
Revenue Collection (AfDB, WB)*Government revenue mobilisation from all sources, taking into account both tax structure on paper and actual tax collection (EA)
INDICATORSEA = Expert Assessment OD = Official Data OS = Opinion Survey * clustered indicator
2013 IB
RA
HIM
IND
EX O
F AFR
ICA
N G
OV
ERN
AN
CE: SU
MM
ARY
37Soundness of Banks (WEF)Soundness of banks, ranging from insolvent and may require a government bailout to generally healthy with sound balance sheets (OS)
Business EnvironmentCompetitive Environment*
Z Competitive Environment (AfDB, WB)*Extent to which the legal, regulatory, and policy environment helps or hinders private businesses in investing, creating jobs and becoming more productive (EA)
Z Competition (BS)Extent to which the fundamentals of market-based competition have developed and safeguards exist to prevent economic monopolies and cartels (EA)
Z Unfair Competitive Practices (EIU)Quality of the competitive framework in place including the likelihood that domestic or foreign corporations are subject to discriminatory prices, taxes and tariffs (EA)
Investment Climate (HER-WSJ) Economic freedom, based on constraints on the flow of investment capital (EA)
Investment Climate for Rural Businesses (IFAD)Extent to which the policy, legal and regulatory framework supports the emergence and development of private rural businesses (EA)
Rural Financial Services Development (IFAD)Extent to which the policy and institutional framework supports the development of a commercially based rural financial market that is rooted in the private sector and is efficient, equitable and accessible to low-income rural populations (EA)
Bureaucracy and Red Tape (EIU)Bureaucratic delay and complexity in obtaining the appropriate documentation or authorisation to engage in business activities (EA)
Customs Procedures (WEF)Level of efficiency of customs procedures, related to the entry and exit of merchandise (OS)
InfrastructureElectricity*
Z Access to Electricity (EIU)Risk that power shortages could disrupt business activties (EA)
Z Quality of Electricity Supply (WEF)Quality of the electricity supply, taking into account interruptions and voltage fluctuationss (OS)
Roads* Z Road Network (EIU)Risk that the road network will be inadequate for business needs in terms of obsolescence, maintenance, and sufficient supply to meet demand (EA)
Z Quality of Roads (WEF)Quality of roads, ranging from extremely underdeveloped to extensive and efficient by international standards (OS)
Rail Network (EIU)Risk that the rail network will be inadequate for business needs (EA)
Air Transport (EIU, WEF)* Z Air Transport Facilities (EIU)Risk that the air transport will be inadequate for business in terms of obsolescence, maintenance, and sufficient supply to meet demand (EA)
Z Quality of Air Transport Infrastructure (WEF)Quality of passenger air transport infrastructure, ranging from extremely underdeveloped to extensive and efficient by international standards (OS)
Telephone and IT Infrastructure (EIU)*
Z Telephone NetworkRisk that the telephone network will not be adequate for business needs in terms of obsolescence, maintenance and sufficient supply to meet demand (EA)
Z IT InfrastructureRisk that information technology infrastructure will be inadequate for business needs (EA)
Digital Connectivity (ITU)* Z Mobile Phone SubscribersSubscriptions to public mobile telephone services including the number of pre-paid SIM cards active during the past three months (OD)
Z Household computersHouseholds with a computer (desktop or laptop only) (OD)
Z Internet SubscribersTotal active (over the past three months) internet subscriptions with fixed (wired) internet access, which includes dial up and fixed broadband subscriptions (OD)
Rural SectorPublic Resources for Rural Development (IFAD)Government policies, strategies and investment programmes for the agricultural and rural development sector, and the efficiency, consistency and transparency with which resources are allocated, managed and accounted for (EA)
Land and Water for Low-Income Rural Populations (IFAD)*
Z Access to LandExtent to which the legal, institutional and market frameworks provide the basis for low-income rural populations to have secure access to land – both individually held and common property resources – and the extent to which they are able to benefit from these (EA)
Z Access to Water for AgricultureExtent to which the policy and institutional framework provides for rural populations to have equitable user rights over water resources for agriculture and to effectively manage those resources (EA)
Agricultural Research & Extension Services (IFAD)Accessibility of agricultural research and the extension system to low-income farmers, including women, and its responsiveness to their needs and priorities (EA)
Agricultural Input & Produce Markets (IFAD)Extent to which the policy and institutional framework supports the development of commercially based agricultural markets that are rooted in the private sector and are efficient, equitable and accessible to small farmers (EA)
Policy & Legal Framework for Rural Organisations (IFAD)Extent to which an enabling policy and legal environment is present for low-income rural populations to organise into autonomous groups and associations or engage in other forms of collective action (EA)
Dialogue between Government and Rural Organisations (IFAD)Extent to which rural populations are able to enter into dialogue with, and lobby, government and express their concerns and priorities, and extent of government responsiveness to low-income rural populations and consideration of their views in policy-making for the sector (EA)
Agricultural Policy Costs (WEF)Agricultural policy, ranging from excessively burdensome for the economy to balancing the interests of taxpayers, consumers, and producers. (OS)
INDICATORSEA = Expert Assessment OD = Official Data OS = Opinion Survey * clustered indicator
2013 IB
RA
HIM
IND
EX O
F AFR
ICA
N G
OV
ERN
AN
CE: SU
MM
ARY
38 Human Development
WelfareWelfare Regime (BS)Extent to which there is equality of opportunity and there are social safety nets which compensate for poverty and other risks, such as old age, illness, unemployment or disability (EA)
Social Protection and Labour (AfDB, WB)* Government policies in the area of social protection and labour market regulation, which reduce the risk of becoming poor, assist those who are poor to better manage further risks, and ensure a minimum level of welfare to all people (EA)
Social Exclusion (BS)Extent to which significant parts of the population are fundamentally excluded from society due to poverty and inequality combined (income gaps, gender, education, religion, ethnicity) (EA)
Welfare Services (Health and Education) (AfDB, WB)*National policies and public and private sector service delivery that affect access to and quality of: health and nutrition services, including population and reproductive health; education, early childhood development, training and literacy programmes; and prevention and treatment of HIV/AIDS, tuberculosis and malaria (EA)
Equity of Public Resource Use (AfDB, WB)* Extent to which the pattern of public expenditures and revenue collection affects the poor and is consistent with national poverty reduction priorities (EA)
Access to Water (WHO-UNICEF)*
Z Access to Piped WaterPopulation served with piped water into their dwelling, yard or plot (OD)
Z Access to Improved WaterPopulation that is served with a drinking water source that, by nature of its construction, adequately protects the source from outside contamination particularly with faecal matter (OD)
Access to Sanitation (WHO)* Z Access to Improved SanitationPopulation served with a sanitation facility that hygienically separates human excreta from human contact and which includes specified mechanisms for disposal and storage of that waste (OD)
Z Open Defecation SanitationPopulation forced to dispose of human faeces in outdoor spaces or alongside solid waste (OD)
Environmental Policy (BS)Extent to which environmental concerns are effectively taken into account in both macro and microeconomic policy-making (EA)
Environmental Sustainability (AfDB, WB)*Extent to which environmental policies foster the protection and sustainable use of natural resources and the management of pollution (EA)
EducationEducation Provision and Quality (BS)Extent to which there are solid institutions for basic, secondary and tertiary education as well as for research and development (EA)
Education System Quality (WEF)How well the educational system meets the needs of a competitive economy (OS)
Ratio of Pupils to Teachers in Primary School (WB)Pupils enrolled in primary school in relation to primary school teachers (OD)
Primary School Completion (WB)Students completing the last year of primary school (OD)
Progression to Secondary School (WB)New entrants to the first grade of secondary school in a given year, in relation to students enrolled in the final grade of primary school in the previous year (OD)
Tertiary Enrolment (WB)Total enrolment, regardless of age, in relation to the population of the age group for tertiary education (OD)
Literacy (UNESCO)Population aged 15 or over who can both read and write a short simple statement on their everyday life. Generally numeracy, the ability to make simple mathematical calculations, is also included (OD)
HealthMaternal Mortality (WHO)Female deaths from any cause related to or aggravated by pregnancy or its management (excluding accidental or incidental causes) (OD)
Child Mortality (IGME)Probability of a child born in a specified year dying before reaching the age of five if subject to current age-specific mortality rates (OD)
Immunisation (Measles and DPT) (WB)*
Z Immunisation against MeaslesChildren aged 12–23 months who have received appropriate vaccinations against measles before 12 months or anytime before the survey (OD)
Z Immunisation against DPTChildren aged 12–23 months who have received appropriate vaccinations against diphtheria, pertussis and tetanus before 12 months or anytime before the survey (OD)
Antiretroviral Treatment Provision (UNAIDS)*
Z Antiretroviral Treatment ProvisionAdults and children with advanced HIV infection receiving antiretroviral therapy (OD)
Z Antiretroviral Treatment Provision for Pregnant WomenHIV-positive pregnant women who receive antiretrovirals to reduce the risk of mother-to-child transmission (OD)
Disease (Malaria and TB) (WHO)*
Z MalariaDeaths due to malaria per 100,000 population per year (OD)
Z TuberculosisDeaths due to TB, including HIV-related TB deaths per 100,000 population per year (OD)
Undernourishment (WB)Population whose food intake is insufficient to meet dietary energy requirements continuously (OD)
INDICATORS
EA = Expert Assessment OD = Official Data OS = Opinion Survey * clustered indicator

2013 IB
RA
HIM
IND
EX O
F AFR
ICA
N G
OV
ERN
AN
CE: SU
MM
ARY
39
Project team
IIAG Advisory Council � Dr Abdalla Hamdok (Chair)United Nations Economic Commission for Africa (UNECA)
� Lord Simon CairnsMIF Board Member
� Nathalie DelapalmeMIF Board Member
� Dr Maurice EnguéléguéléAfrica Governance Institute (AGI)
� Hazel Feigenblatt*Global Integrity
� Dr E. Gyimah-Boadi*CDD Ghana
� Dr Ali HadiThe American University Cairo
� Dr Alcinda HonwanaOpen University (OU)
� Dr Abdoulie JannehMIF Board Member
� Dr Daniel KaufmannRevenue Watch Institute (RWI)
� Ambassador Mustaq MooradInternational Institute for Democracy and Electoral Assistance (IDEA Africa)
� Jide OlanrewajuSatya Capital
� Dr Joy PhumaphiAfrican Leaders Malaria Alliance (ALMA)
� Dr Vera SongweWorld Bank Group
� Dr Piero StanigHertie School of Governance
� Dr Daniel ZovattoInternational Institute for Democracy and Electoral Assistance (IDEA Latin America)
* Observer
IIAG Research Team � Nathalie DelapalmeExecutive Director (Research and Policy)
� Elizabeth McGrathDirector of the IIAG
� Christina NelsonSenior Programme Manager
� Dr Karl Håkan NordgrenSenior Quantitative Analyst
� Cirus Iniesta CarrerasQuantitative Analyst
2013 IB
RA
HIM
IND
EX O
F AFR
ICA
N G
OV
ERN
AN
CE: SU
MM
ARY
40
About the Mo Ibrahim Foundation
The Mo Ibrahim Foundation was established in 2006 with a focus on the critical importance of leadership and governance in Africa. By providing tools to support advancements in leadership and governance, the Foundation aims to bring about meaningful change on the continent.
The Foundation, which is a non-grant making organisation, helps to define, assess and enhance governance and leadership in Africa using the following tools:
� Ibrahim Index of African Governance (IIAG) � Ibrahim Prize for Achievement in African Leadership � Ibrahim Forum � Ibrahim Fellowships & Scholarships
Leadership and governance in AfricaAfrica has made considerable progress in recent years. However, the continent now faces a number of challenges. How can it translate its wealth of resources into improved quality of life for its citizens, in an equitable and sustainable way? What should governments do when their GDP growth is not matched by employment gains? Why are political and human rights still lagging in many areas, despite significant economic gains?
All of these challenges pose a threat to Africa’s success and potential transformation in the long-term. But all of these challenges can be met through good leadership and governance on the continent.
Leadership is about making choices, defining priorities, and taking risks. Governance is about implementing these choices.
Governments need to define a strategy – a ‘business plan’ – built on an inclusive vision which assesses and prioritises challenges and issues, makes the best use of human, natural and financial resources and closely monitors results and implementation.
The BoardThe Foundation is governed by a Board of Directors comprised of:
� Mo IbrahimFounder & Chair, Mo Ibrahim Foundation; Founder, Celtel International
� Lord CairnsFormer Chairman, Actis Capital LLP; Former Chief Executive Officer, SG Warburg
� Nathalie DelapalmeExecutive Director – Research and Policy, Mo Ibrahim Foundation; Former Advisor on Africa and Development issues to various French Foreign Ministers
� Hadeel IbrahimFounding Executive Director – Strategy and External Relations, Mo Ibrahim Foundation
� Abdoulie JannehExecutive Director – Liaison with Governments and Institutions in Africa, Mo Ibrahim Foundation; Former Under Secretary-General, UN; Executive Secretary of UNECA
� Sir Ketumile MasireCo-Chairperson, GCA; Former President of Botswana
� Jay NaidooChair of the Board and Partnership Council, GAIN; Founding General Secretary, COSATU
� Mary RobinsonUN Special Envoy for the Great Lakes Region of Africa; Former UN High Commissioner for Human Rights; Former President of Ireland
� Salim Ahmed SalimFormer Secretary-General, OAU; Former Prime Minister of Tanzania
2013 IB
RA
HIM
IND
EX O
F AFR
ICA
N G
OV
ERN
AN
CE: SU
MM
ARY
41
Tools
Ibrahim Index of African Governance Established in 2007, the IIAG is the most comprehensive collection of quantitative data on governance in Africa. Compiled in partnership with experts from a number of the continent’s institutions, it provides an annual assessment of governance in every African country. The IIAG provides a framework for citizens, governments, institutions and business to assess the delivery of public goods and services – and policy outcomes – across Africa.
Ibrahim Prize for Achievement in African LeadershipEstablished in 2007, the Ibrahim Prize celebrates excellence in African leadership. It is awarded to a former Executive Head of State or Government by an independent Prize Committee composed of eminent figures, including two Nobel Laureates. It celebrates African leaders who have developed their countries, lifted people out of poverty, and paved the way for sustainable and equitable prosperity. Previous Ibrahim Laureates include President Joaquim Chissano of Mozambique (2007), President Festus Mogae of Botswana (2008), President Pedro Pires of Cape Verde (2011) and President Nelson Mandela of South Africa (Honorary). The Laureates provide role models for the continent. The Prize Committee may choose not to award the Prize, as was the case in 2009, 2010 and 2012.
Ibrahim ForumEstablished in 2010, the Ibrahim Forum is an annual high-level discussion tackling issues of critical importance to Africa. Bringing together a diverse range of stakeholders, the Forum identifies specific policy challenges and priorities for action. Previous Forums have dealt with: African Youth (2012), African Agriculture (2011) and African Regional Economic Integration (2010). Data and research on Forum issues are compiled by the Foundation as the basis for informed and constructive debate.
Ibrahim Leadership FellowshipsEstablished in 2010, the Ibrahim Leadership Fellowships form a selective programme designed to identify and support potential African leaders of the future. The Fellows receive mentoring from the current leaders of key multilateral institutions. Ibrahim Leadership Fellows are currently hosted at AfDB, UNECA and WTO.
The Ibrahim ScholarshipsEstablished in 2007, and evolving to accommodate shifting African dynamics, the Ibrahim Scholarships support aspiring African leaders at a number of distinguished academic institutions. The scholarships develop the talent of outstanding young Africans in selected disciplines. Current partnerships are with AUC, LBS, SOAS and the University of Birmingham. The Foundation also endorses CEIBS.
published October 2013 2013 Ibrahim Index of African Governance: Summary copyright © 2013 Mo Ibrahim Foundation