index report - allafrica.comallafrica.com/download/resource/main/main/idatcs/... · 9 general...
TRANSCRIPT

IBRAHIM INDEX
OF AFRICAN
GOVERNANCE
MO IBRAHIM FOUNDATION
2017
INDEX REPORT


IBRAHIM INDEX
OF AFRICAN
GOVERNANCE
MO IBRAHIM FOUNDATION
2017
INDEX REPORT


General overview
Framework of the 2017 IIAG
Reading the results
Trend classifications
Indicators: definitions & sources
Data sources
Notes
Research Team & Advisory Council
Board of Directors
Overall Governance
Safety & Rule of Law
Participation & Human Rights
Sustainable Economic Opportunity
Human Development
African average scores over the last ten years, all indicators
Data tables
Human Development: a decade of progress for the majority, but already losing pace
Welfare: improvement is slackening
Education: progress has almost stopped in the last 5 years
Health: progress is slowing down
Data tables
Sustainable Economic Opportunity: Progress has slowed on average over the last five years, but is picking up pace again very recently
Public Management: decline is slowing
Business Environment: quickening deterioration over the last five years but recent signs of recovery
Infrastructure: progress but still low scoring
Rural Sector: concerning warning signs
Spotlight: Is the “Africa Rising” narrative an illusion?
Spotlight: Civil registration: a key tool for public policies, a key governance measure
Spotlight: Regional Integration: a new indicator in the IIAG
Data tables
Participation & Human Rights: stronger progress on average, masking some concerning recent trends
Participation: recently picking up pace, but some warning signs
Rights: losing momentum, while still low-scoring
Gender: progress is faltering
Spotlight: does a change in leadership result in improved governance?
Spotlight: Protection against Discrimination: a new indicator in the IIAG
Data tables
Safety & Rule of Law: mixed signs of hope within a decade long negative trend
Rule of Law: a static 10-year trend masking a recent upturn
Accountability: almost no progress
Personal Safety: a slowing deterioration
National Security: mounting concerns
Spotlight: Terrorism in Africa: a growing challenge for security
Data tables
Overall Governance: the long-term trajectory remains positive, but the pace of progress has slowed
Spotlight: five years post Arab Spring: mixed results
9
10
12
13
68
70
72
74
77
78
79
82
84
88
90
94
98
99
100
101
102
104
164
169
170
171
172
16
18
23
26
28
32
34
36
38
41
44
46
50
54
56
58
59
62
64
Overall Governance 15
25 81
97
107
163
43
61
Safety & Rule of Law
Participation & Human Rights
Sustainable Economic Opportunity
Human Development
2017 IIAG Summary Tables
Country Scorecards (listed alphabetically)
Annex
Contents


9
2017 IIAG: Index ReportGeneral overview
The Ibrahim Index of African Governance (IIAG) is a tool that measures and monitors governance performance in African countries.
The Mo Ibrahim Foundation defines governance as the provision of the political, social and economic public goods and services that every citizen has the right to expect from their state, and that a state has the responsibility to deliver to its citizens. In the IIAG, country performance in delivering governance is measured across four key components that effectively provide indicators of a country’s Overall Governance performance.
The key components that form the four categories of the IIAG as described in the diagram below are Safety & Rule of Law, Participation & Human Rights, Sustainable Economic Opportunity and Human Development. Each of these categories contains sub-categories under which we have organised various indicators that provide quantifiable measures of the overarching dimensions of governance. In total, the IIAG contains 100 indicators.
Published since 2007, the IIAG was created to provide a quantifiable tool to measure and monitor governance performance in African countries, to assess their progress over time and to support the development of effective and responsive policy solutions. The IIAG focuses on measuring outputs and outcomes of policy, rather than declarations of intent, de jure statutes and levels of expenditure.
The IIAG provides data measuring the governance performance across all the dimensions described above for all 54 African countries for the years from 2000-2017. In order to provide a broad, documented and impartial picture of governance performance in every African country, the indicators used to measure governance in Africa are collected from 36 independent
sources. For an indicator to be included in the IIAG, it has to meet certain criteria. For a full explanation of how the IIAG is constructed, please see the methodology on our website.
The entire Index time series is updated every year to ensure that each new IIAG provides the most accurate data available. This process ensures that the Index is the most robust and up-to-date dashboard of the state of governance in every African country.
The Mo Ibrahim Foundation is fully transparent. This report publishes only a summary of results and methodology. We publish all country scores, full details and all information regarding the construction of the IIAG on our website.
Cate
gorie
sSu
b-ca
tego
ries
OVERALLGOVERNANCE
SAFETY & RULE OF LAW
PARTICIPATION & HUMAN RIGHTS
SUSTAINABLE ECONOMIC OPPORTUNITY
HUMANDEVELOPMENT
Rule
of L
aw
Acc
ount
abili
ty
Pers
onal
Saf
ety
Nat
iona
l Sec
urit
y
Publ
ic M
anag
emen
t
Busi
ness
Env
ironm
ent
Infr
astr
uctu
re
Rura
l Sec
tor
Wel
fare
Educ
atio
n
Hea
lth
Part
icip
atio
n
Righ
ts
Gen
der
Num
ber o
f Ind
icat
ors
6 98 76 56 88 96 85 9

10
Framework of the 2017 IIAG
SAFETY & RULE OF LAW PARTICIPATION & HUMAN RIGHTS
OVERALL GOVERNANCE | 100 indicators
Rule of Law Accountability Personal Safety National Security Participation Rights Gender
26 indicators
8 indicators6 indicators 6 indicators 6 indicators 5 indicators 6 indicators
19 indicators
8 indicators
Safety of the PersonEIU/AFR
Police ServicesWEF/GI
Social UnrestEIU/ACLED
CrimeEIU/AFR
Political ViolenceACLED/PTS
Human TraffickingUSDS
Government Involvement in Armed ConflictUCDP
Domestic Armed ConflictEIU
Violence by Non-state ActorsACLED
Cross-border TensionsEIU
Internally Displaced PeopleIDMC
Political RefugeesUNHCR
Political ParticipationEIU/FH/V-Dem
Civil Society ParticipationBS/V-Dem/GI
Free & Fair ElectionsBS/CDD/V-Dem
Election Monitoring AgenciesV-Dem/GI
Legitimacy of Political ProcessBS
Gender EqualityAfDB/WB
Women’s Political ParticipationIPU/GI/WB
Gender Balance in EducationUNESCO
Women’s Labour Force ParticipationWB
Workplace Gender EqualityGI
Women in the JudiciaryGI
Laws on Violence against WomenOECD
Women’s Political EmpowermentV-Dem
Freedom of ExpressionBS/RSF/V-Dem/GI
Freedom of Association & AssemblyBS/GI
Civil LibertiesBS/FH
Human Rights ConventionsUNOLA/OHCHR
Human Rights ViolationsEIU
Protection against DiscriminationGI
Access to InformationGI
Online Public ServicesUNDESA
Public Sector Accountability & TransparencyV-Dem/AfDB/WB
Accountability of Public OfficialsEIU/BS
Corruption in Government & Public OfficialsEIU
Corruption & BureaucracyWB
Diversion of Public FundsWEF
Corruption InvestigationGI/AFR
Judicial IndependenceBS/WEF/V-Dem/GI
Judicial ProcessEIU/GI
Access to JusticeV-Dem
Property RightsBS/HER/WEF/AfDB/WB
Transfers of PowerEIU
Multilateral SanctionsCDD

11
2017 IIAG: Index Report
HUMAN DEVELOPMENTSUSTAINABLE ECONOMIC OPPORTUNITY
Public Management Business Environment Infrastructure Rural Sector Welfare Education Health
9 indicators 7 indicators
29 indicators
5 indicators 8 indicators 9 indicators
26 indicators
8 indicators 9 indicators
Governmental Statistical CapacityWB
Civil RegistrationGI
Public AdministrationAfDB/WB
DiversificationAfDB/OECD/UNDP
Budget ManagementAfDB/WB
Budget BalanceAfDB/AUC/UNECA
Fiscal PolicyAfDB/WB
Revenue MobilisationICTD/UNU-WIDER/AfDB/WB
Transparency of State-owned CompaniesGI
Investment Climate HER
CompetitionBS/GI/AfDB/WB
Business Bureaucracy & Red TapeEIU
Customs ProceduresWEF
Soundness of BanksWEF
Employment CreationAFR
Regional IntegrationAfDB
Basic Health ServicesAFR
Public Health CampaignsGI
Child MortalityIGME
Maternal MortalityMMEIG
Access to SanitationWHO/UNICEF
UndernourishmentWB
DiseaseWHO
ImmunisationWB/WHO
Antiretroviral Treatment (ART) ProvisionUNAIDS
Education ProvisionAFR
Education QualityBS
Educational System ManagementWEF
Human Resources in Primary SchoolsUNESCO
Primary School CompletionWB
Secondary School EnrolmentUNESCO
Tertiary Education EnrolmentUNESCO
LiteracyWB
Welfare Services AfDB/WB
Social Safety NetsBS
Social Protection & LabourAfDB/WB
Social ExclusionBS
PovertyAFR
Poverty Reduction PrioritiesAFR/AfDB/WB
Narrowing Income GapsAFR
Environmental PolicyBS
Environmental SustainabilityAfDB/WB
Rural Land & WaterIFAD
Rural Business ClimateIFAD
Rural Development ResourcesIFAD
Agricultural Support SystemIFAD
Agricultural Policy CostsWEF
Engagement with Rural OrganisationsIFAD
Gender Balance in Rural Decision-makingIFAD
Rural Accountability & Transparency IFAD
Transport InfrastructureWEF/AFR/EIU/GI
Electricity InfrastructureWEF/AFR
Digital & IT InfrastructureEIU/ITU
Access to Improved WaterWHO/UNICEF
Water & Sanitation ServicesAFR
IndicatorSource acronym
Key
For a full list of data sources used in the IIAG see the Annex.

12
Reading the results
The 2017 Ibrahim Index of African Governance (IIAG) covers 17 years’ worth of data from 2000-2016 inclusive for all 54 African countries. The construction method provides vast amounts of data. In total there are 211,889 data points.
To construct the 2017 IIAG, the Foundation’s Research Team collected 177 variables that measure governance concepts from 36 sources. These were combined to form 100 indicators, which are organised under the IIAG’s key governance dimensions; the 14 sub-categories and four categories that make up the Overall Governance score. Including all the data collected from source and the calculations made expressly for the IIAG, there are a total of 251 different measures of governance in Africa in the 2017 IIAG. These range from indicators that measure specific issues such as the Independence of the Judiciary, which is one part of the broader sub-category measure Rule of Law, which is in turn one part of the overarching category measure Safety & Rule of Law.
Structure & levels
To fully assess any country’s governance performance, it is vital to drill down beyond the broader measures such as the Overall Governance score to take into account country performances across the different governance dimensions encompassed by the categories, sub-categories and indicators of the IIAG. Country performance can vary across these dimensions. For example, in the 2017 IIAG Tunisia ranks 7th in Overall Governance, scoring 65.5 (out of 100.0). The country is in the top ten in each governance category in the IIAG except Safety & Rule of Law, where it ranks 14th and has shown the sixth largest deterioration on the continent in the sub-category Personal Safety over the last ten-year period. Meanwhile, in the same period, it is the most improved country in the category Participation & Human Rights, driven by an improvement of almost +60.0 in the Participation sub-category, the biggest improvement shown by any country on the continent over this period.
The benefit of the IIAG structure is that country or group performance can be assessed holistically through the broader measures but users can also drill down to assess performance in specific governance issues.
Scores, ranks & trends
IIAG results can be classified into three main types: score, rank and trend.
All three results must be considered when studying the Index, as each type of result gives context to the others. For example, looking only at rank or score without considering trends overlooks the important trajectories that countries follow. In the 2017 IIAG for example, Ghana ranks in the top ten highest scoring countries (8th) with a score of 65.0 (out of 100.0) in Overall Governance. In the last ten years however it is also the eighth most deteriorated country on the continent in Overall Governance having declined by -1.5 points in this period. In the same way that trends should be taken into account when looking at scores and ranks, when looking at trends it is important to take into account the level
of score and rank. Zimbabwe, for example, shows the third largest improvement on the continent in Overall Governance (+9.5) over ten years but still ranks in the bottom half (40th) on the continent with a score of 45.4 which is below the African average score of 50.8.
Group averages
By averaging the scores of countries, the IIAG provides group analysis for a variety of different group compositions. For this report, key findings are often provided for ‘Africa’. These results are the average of the scores of 54 African countries, at all levels of the IIAG. However, Africa is a diverse continent with vastly different countries, and readers of this report are advised not to over analyse the continental findings. This report focuses on presenting the top-level findings of the 2017 IIAG for Africa as well as other groups, such as regions. In-depth analysis of countries and other groupings are available via our other publications and tools on our website.

13
2017 IIAG: Index ReportTrend classifications
Country and group trends can vary drastically depending on the base year for analysis. Whilst a country can register improvement or decline over the last ten years, it may show the opposite trend in the last five years. The IIAG results reveal that governance performance is not linear. Countries regularly improve or decline between years. Since the start of the IIAG time series (2000), Rwanda is the only country in Africa to show year-on-year improvement of their Overall Governance score. No country registers year-on-year decline.
Due to the constantly moving nature of governance performance, the 2017 IIAG analysis focuses on assessing trends in the last five years (2012-2016), within the context of the last decade (2007-2016).
This analysis provides long-term findings as well as focusing on the short-term, in order to provide a more nuanced assessment of the performance and trajectories of countries, regions and groups.
The intention of this analysis is to illustrate that whilst the IIAG can be used to view long-term trends, due to the changing nature of governance performance, it is important to assess both the long-term and short-term alongside each other.
Whilst a country can either improve or deteriorate over the decade, the trend displayed in recent years shows important and useful characteristics for analysis.
Whilst registering improvement over the decade, a country can, over the last five years:
• Increase its rate of improvement;• Slow its rate of improvement;• Show recent decline.
Similarly, a country showing decline over the decade can, over the last five years:
• Increase its rate of decline;• Slow its rate of decline;• Show recent improvement.
In order to capture these ‘trends within trends’, countries are classified according to the direction and size of their annual average trend in the most recent five years, compared to the direction and size of their annual average trend shown over a decade.
The time periods used for analysis are:
Ten-year period: 2007-2016
Five-year period: 2012-2016
To determine whether progress/decline is quickening/slowing, the annual average trend for each period is calculated.
The annual average trend for the ten-year period is the total change in score between 2007 and 2016, divided by nine (the number of annual time periods experienced).
The annual average trend for the five-year period is the total change in score between 2012 and 2016, divided by four (the number of annual time periods experienced).
In total, there are six groups of trajectories: ‘Increasing Improvement’, ‘Slowing Improvement’, ‘Warning Signs’, ‘Bouncing Back’, ‘Slowing Deterioration’ or ‘Increasing Deterioration’.
These classifications are applied to all measures in the IIAG, and are used for groups as well as countries.
Classification Characteristic
Increasing Improvement Annual average improvement over both periods, accelerating in the last five years
Slowing Improvement Annual average improvement over both periods, losing momentum in the last five years
Warning Signs Annual average improvement over the decade, but decline in the last five years*
Bouncing Back Annual average decline over the decade, but improvement in the last five years*
Slowing Deterioration Annual average decline over both periods, decelerating in the last five years
Increasing Deterioration Annual average decline over both periods, worsening in the last five years
Annual Average Trend = Total change in score between years / Number of annual time periods
Score change between 2007-2016
Annual time periods
2007 2008 2009 2010 2011 2012 2013 2014 2015 2016
* Where trends are static (show no change), the following classifications are applied: Static (over ten years) to decline (over five years): ‘Warning Signs’ | Improve (over ten years) to static (over five years): ‘Warning Signs’ | Decline (over ten years) to static (over five years): ‘Bouncing Back’ | Static (over ten years) to improve (over five years): ‘Bouncing Back’
A ‘No Change’ classification is applied in three instances. 1. When the annual average trend is exactly the same in both periods (if annual average trend appears the same but a classification is given, differences will exist beyond the second decimal place). 2. When a country/group achieves the best possible score (100.0) in 2012 and in 2016. 3. When a country/group achieves the worst possible score (0.0) in 2012 and 2016. In these latter two, no classification can be applied as scores can not go higher or lower.


Overall Governance
Safety & Rule of Law
Participation & Human Rights
Sustainable Economic Opportunity
Human Development

16
Increasing Improvement Increasing Deterioration No ChangeSlowing Improvement Slowing DeteriorationWarning Signs Bouncing Back
2 Seychelles 73.4 +5.4 +0.60 +3.4 +0.855 Namibia 71.2 +3.8 +0.42 +4.0 +1.007 Tunisia 65.5 +5.5 +0.61 +3.6 +0.90
10 Senegal 61.6 +5.4 +0.60 +3.0 +0.7512 Morocco 60.1 +5.9 +0.66 +4.9 +1.2313 Kenya 59.3 +6.5 +0.72 +4.9 +1.2317 Tanzania 57.5 +0.2 +0.02 +2.2 +0.5519 Uganda 56.5 +3.0 +0.33 +2.3 +0.5820 Côte d'Ivoire 54.2 +12.6 +1.40 +8.2 +2.0522 Algeria 53.6 +0.4 +0.04 +0.3 +0.0826 Togo 51.7 +10.0 +1.11 +5.1 +1.2831 Egypt 49.4 +1.5 +0.17 +2.2 +0.5535 Nigeria 48.1 +3.4 +0.38 +3.3 +0.8340 Zimbabwe 45.4 +9.5 +1.06 +5.8 +1.4543 Guinea-Bissau 41.3 +1.2 +0.13 +3.2 +0.8048 Democratic Republic of Congo 35.0 +0.5 +0.06 +0.9 +0.2350 Sudan 32.5 +1.0 +0.11 +1.3 +0.3354 Somalia 11.6 +0.7 +0.08 +1.4 +0.35
9 Rwanda 63.9 +8.7 +0.97 +3.0 +0.7511 São Tomé & Príncipe 61.0 +2.1 +0.23 +0.5 +0.1314 Benin 59.0 +1.4 +0.16 +0.2 +0.0521 Burkina Faso 53.7 +1.1 +0.12 +0.3 +0.0823 Gabon 52.2 +3.3 +0.37 +0.1 +0.0328 Liberia 51.4 +6.5 +0.72 +0.7 +0.1829 Niger 50.1 +5.2 +0.58 +0.5 +0.1330 Comoros 50.0 +5.4 +0.60 +1.8 +0.4534 Swaziland 48.9 +1.1 +0.12 +0.3 +0.0836 Ethiopia 47.7 +5.3 +0.59 +1.8 +0.4539 Guinea 45.5 +4.9 +0.54 +0.7 +0.1846 Equatorial Guinea 36.8 +3.2 +0.36 +1.4 +0.3547 Chad 35.2 +3.5 +0.39 +0.6 +0.15
1 Mauritius 81.4 +3.1 +0.34 -0.5 -0.134 Cabo Verde 72.2 +0.7 +0.08 -1.2 -0.30
15 Lesotho 58.2 +0.4 +0.04 -0.4 -0.1016 Zambia 57.7 +2.9 +0.32 -1.4 -0.3518 Malawi 57.0 0.0 0.00 -0.9 -0.2326 Sierra Leone 51.7 +3.4 +0.38 -0.9 -0.2337 Cameroon 46.9 +0.5 +0.06 -0.6 -0.1538 Djibouti 46.4 +1.5 +0.17 -0.6 -0.1542 Congo 42.8 +3.3 +0.37 -0.2 -0.0545 Angola 39.4 +3.8 +0.42 -1.2 -0.30
6 South Africa 70.1 -1.3 -0.14 +0.6 +0.1525 Mali 51.9 -2.4 -0.27 +0.1 +0.0332 Madagascar 49.3 -6.6 -0.73 +3.3 +0.8352 Eritrea 29.2 -4.3 -0.48 -0.6 -0.15
3 Botswana 72.7 -0.8 -0.09 -2.5 -0.638 Ghana 65.0 -1.5 -0.17 -2.8 -0.70
23 Mozambique 52.2 -1.2 -0.13 -1.8 -0.4533 Gambia 49.2 -2.1 -0.23 -3.5 -0.8841 Mauritania 44.5 -2.5 -0.28 -1.6 -0.4044 Burundi 39.9 -6.5 -0.72 -6.0 -1.5049 Libya 33.3 -13.3 -1.48 -11.8 -2.9551 Central African Republic 30.5 -1.3 -0.14 -3.9 -0.9853 South Sudan 20.2 . . -8.5 -2.13
AFRICAN AVERAGE 50.8 +1.4 +0.16 +0.4 +0.10N/A
Overall Governance
2016 SCORE /100.0 ANNUAL AVERAGE TREND (2007-2016)
ANNUAL AVERAGE TREND (2012-2016)
5-YEAR TREND (2012-2016)
10-YEAR TREND (2007-2016)
2016 RANK /54
If Annual Average Trend appears the same in the two time periods, differences may exist beyond the 2nd decimal place.

17
2017 IIAG: Index Report
2016SCORE
AAT (2012-2016)
AAT* (2007-2016)
Côte d'IvoireTogoZimbabweRwandaKenyaLiberiaMoroccoTunisiaSenegalComorosSeychellesEthiopiaNigerGuineaNamibiaAngolaChadNigeriaSierra LeoneCongoGabonEquatorial GuineaMauritiusUgandaZambiaSão Tomé & PríncipeEgyptDjiboutiBeninGuinea-BissauBurkina FasoSwazilandSudanCabo VerdeSomaliaCameroonDRCAlgeriaLesothoTanzaniaMalawiBotswanaMozambiqueSouth AfricaCARGhanaGambiaMaliMauritaniaEritreaBurundiMadagascarLibyaSouth Sudan
+1.40 +2.05 54.2+1.11 +1.28 51.7+1.06 +1.45 45.4+0.97 +0.75 63.9+0.72 +1.23 59.3+0.72 +0.18 51.4+0.66 +1.23 60.1+0.61 +0.90 65.5+0.60 +0.75 61.6+0.60 +0.45 50.0+0.60 +0.85 73.4+0.59 +0.45 47.7+0.58 +0.13 50.1+0.54 +0.18 45.5+0.42 +1.00 71.2+0.42 -0.30 39.4+0.39 +0.15 35.2+0.38 +0.83 48.1+0.38 -0.23 51.7+0.37 -0.05 42.8+0.37 +0.03 52.2+0.36 +0.35 36.8+0.34 -0.13 81.4+0.33 +0.58 56.5+0.32 -0.35 57.7+0.23 +0.13 61.0+0.17 +0.55 49.4+0.17 -0.15 46.4+0.16 +0.05 59.0+0.13 +0.80 41.3+0.12 +0.08 53.7+0.12 +0.08 48.9+0.11 +0.33 32.5+0.08 -0.30 72.2+0.08 +0.35 11.6+0.06 -0.15 46.9+0.06 +0.23 35.0+0.04 +0.08 53.6+0.04 -0.10 58.2+0.02 +0.55 57.5
0.00 -0.23 57.0-0.09 -0.63 72.7-0.13 -0.45 52.2-0.14 +0.15 70.1-0.14 -0.98 30.5-0.17 -0.70 65.0-0.23 -0.88 49.2-0.27 +0.03 51.9-0.28 -0.40 44.5-0.48 -0.15 29.2-0.72 -1.50 39.9-0.73 +0.83 49.3-1.48 -2.95 33.3
. -2.13 20.2
10-year & 5-year annual average trends
0.00 +2.00-2.00-4.00-6.00 +4.00
As South Sudan does not have data prior to 2011, no trends over the ten-year period are available for that country.
Countries ordered by size of the 10-year trend.
* AAT: Annual Average Trend
ANNUAL AVERAGE TREND
Improvement since 2007Improvement since 2012
Deterioration since 2007Deterioration since 2012

18
The African continent has, on average, been improving in Overall Governance. Looking back over the last decade (2007-2016) the African average score has improved by +1.4 score points from 49.4 (out of 100.0) to 50.8, reaching in 2016 its highest score since the IIAG’s first data year (2000).
However, while Overall Governance has improved over the last decade at an average yearly rate of +0.16, over the latter part of this period (the last five years, 2012-2016) the pace of progress has slowed down, improving only at an average yearly rate of +0.10.
This slowing continental trend in the last five years at Overall Governance level is reflected by varying performances in the underlying governance categories.
Over the last decade, overall progress has been driven by improved performance in three of the four governance categories of the IIAG, Human Development (+4.4), Participation & Human Rights (+2.2) and Sustainable Economic Opportunity (+1.3).
However, further progress has been hindered by a decline, on average, in Safety & Rule of Law (-2.4).
Looking at the last five years within this period, varying trends appear. Human Development and Sustainable Economic Opportunity are still progressing, but at a slower pace. Participation & Human Rights is the only category to marginally pick up speed. Conversely, deterioration in Safety & Rule of Law, although still present, shows signs of abating.
Overall Governance: the long-term trajectory remains positive, but the pace of progress has slowed
Contrasting performance at category level
Africa: Overall Governance average score (2007-2016)
2007 2008 2009 2010 2011 2012 2013 2014 2015 2016 Year
49.4
49.8
49.9
50.3
50.2
50.4
50.3
50.2
50.5
50.8
Annual average trend (2007-2016), +0.16
Annual average trend (2012-2016), +0.10
48.0
0.0
49.0
50.0
51.0
100.0
52.0
Score
‘Slowing Improvement’
2007 2008 2009 2010 2011 2012 2013 2014 2015 2016 Trend 2007-2016
Annual average
trend
Trend 2012-2016
Annual average
trend
OVERALL GOVERNANCE 49.4 49.8 49.9 50.3 50.2 50.4 50.3 50.2 50.5 50.8 +1.4 +0.16 +0.4 +0.10 Slowing Improvement
SAFETY & RULE OF LAW 55.2 55.0 54.2 54.1 53.6 53.5 52.5 52.1 52.0 52.8 -2.4 -0.27 -0.7 -0.18 Slowing Deterioration
PARTICIPATION & HUMAN RIGHTS
47.2 47.1 46.9 47.5 48.0 48.4 48.8 48.8 49.4 49.4 +2.2 +0.24 +1.0 +0.25 Increasing Improvement
SUSTAINABLE ECONOMIC OPPORTUNITY
43.8 44.4 45.0 45.3 44.7 44.7 44.9 44.4 44.8 45.1 +1.3 +0.14 +0.4 +0.10 Slowing Improvement
HUMAN DEVELOPMENT 51.7 52.4 53.3 54.1 54.3 54.8 55.0 55.4 55.8 56.1 +4.4 +0.49 +1.3 +0.33 Slowing Improvement
Africa (Average scores)Score / 100.0; 100.0=best

19
2017 IIAG: Index Report
The positive trend over the last decade at continental level in Overall Governance is mirrored by 40 countries which improve over this period. Only 12 countries deteriorate and one (Malawi) shows no change.1
However, if for the vast majority of the continent performance in Overall Governance is on the up, several countries are showing signs of slowing or even reversing their performance. Looking closely at the latter five years of the last decade, only 34 countries are now improving while 20 countries are showing decline.
1 There is no ten-year trend for South Sudan.
Of the 40 countries that improve in Overall Governance in the last ten years, 18 are picking up pace over the last five years. In the last five years, their annual average increase in score is greater than that of the last ten years. This includes only four of the top ten highest scoring countries in Overall Governance in 2016: Seychelles (2nd), Namibia (5th), Tunisia (7th) and Senegal (10th).
Côte d’Ivoire, though still ranking 20th in 2016, and starting from a very low score, is the most impressive of this group, with an annual average trend of +2.05 in the last five years (compared to an annual average increase over the decade of +1.40).
‘Increasing Improvement’: 18 countries
Progress for the majority but no time for complacency
53 African countries 54 African countries, including South Sudan
10-year trend (2007-2016)
5-year trend (2012-2016)
Countries with an improved score 40 34
Countries with a deteriorated score 12 20
Countries with no score change 1 0
Overall Governance: countries’ recent trends
Classification # countries
Increasing Improvement 18
Slowing Improvement 13
Warning Signs 10
Bouncing Back 3
Slowing Deterioration 1
Increasing Deterioration 8
CÔte d’Ivoire: Overall Governance score (2007-2016)
2007 2008 2009 2010 2011 2012 2013 2014 2015 2016 Year
41.6 41.642.6 42.6 42.6
46.0
48.2
50.8
53.154.2
Annual average trend (2007-2016), +1.40
Annual average trend (2012-2016), +2.05
48.0
46.0
44.0
42.0
40.0
38.0
0.0
50.0
100.0
52.0
56.0
54.0
Score
‘Increasing Improvement’

20
Of the 40 countries to show improvement in Overall Governance over the last ten years, 13 are registering ‘Slowing Improvement’ (their rate of improvement is slower in the last five years compared to the last ten) while ten register ‘Warning Signs’ (despite maintaining an improvement over the decade or remaining static, they register deterioration in the last five years).
Thirteen countries are improving at a slower rate in the last five years than they have in the last ten. Rwanda, the fourth most
improved country on the continent over the decade, with an average annual increase of +0.97 points, has slowed down to a +0.75 average annual increase in the last five years. Likewise, Liberia, the joint fifth most improved country over the last ten years, is only increasing its score by +0.18 on average per year in the last five years, compared to +0.72 in the last ten.
More concerningly, ten countries, whilst still showing a positive (or static) trend over the decade, are registering decline in the latter half of this period. Two (Mauritius and Cabo Verde) are still currently in the top five highest scoring countries in 2016. These deteriorations threaten to reverse the improvements made in governance performance over a decade.
‘Slowing Improvement’ & ‘Warning Signs’: 23 countries
Countries showing ‘Warning Signs’
2016 Rank/54 2016 Score/100.0 10-year trend (2007-2016)
Annual average trend (2007-2016)
5-year trend (2012-2016)
Annual average trend (2012-2016)
1 Mauritius 81.4 +3.1 +0.34 -0.5 -0.13
4 Cabo Verde 72.2 +0.7 +0.08 -1.2 -0.30
15 Lesotho 58.2 +0.4 +0.04 -0.4 -0.10
16 Zambia 57.7 +2.9 +0.32 -1.4 -0.35
18 Malawi 57.0 0.0 0.00 -0.9 -0.23
26 Sierra Leone 51.7 +3.4 +0.38 -0.9 -0.23
37 Cameroon 46.9 +0.5 +0.06 -0.6 -0.15
38 Djibouti 46.4 +1.5 +0.17 -0.6 -0.15
42 Congo 42.8 +3.3 +0.37 -0.2 -0.05
45 Angola 39.4 +3.8 +0.42 -1.2 -0.30
Liberia: Overall Governance score (2007-2016)
2007 2008 2009 2010 2011 2012 2013 2014 2015 2016 Year
44.9
46.6
48.349.4
50.0
50.7
49.6 49.8
50.651.4
Annual average trend (2007-2016), +0.72
Annual average trend (2012-2016), +0.1854.0
52.0
50.0
48.0
46.0
42.0
44.0
0.0
100.0
Score
‘Slowing Improvement’

21
2017 IIAG: Index Report
At the other end of the rankings, Angola’s decline in the last five years (at an average annual rate of -0.30) also threatens to reverse the progress made over the decade. Having consistently ranked in the bottom ten since 2000 (the first data year in the IIAG), the country moved out of the bottom ten in 2012, but has since fallen back amongst the ten lowest ranking countries on the continent.
2007 2008 2009 2010 2011 2012 2013 2014 2015 2016 Year
42.0
40.0
38.0
34.0
36.0
0.0
100.0
Score Angola: Overall Governance score (2007-2016)
35.6
37.938.6
39.640.0
40.6
39.8 39.6 39.739.4
Annual average trend (2007-2016), +0.42
Annual average trend (2012-2016), -0.30‘Warning Signs’
Three countries — South Africa, Mali and Madagascar — though still registering a deterioration over the decade, show signs of ‘Bouncing Back’, potentially reversing decline over the decade by registering a positive trend in the last five years.
Madagascar is the most impressive of these, showing an annual average decline of -0.73 score points per year over the decade (the second most deteriorated country on the continent in this period) but an improvement of +0.83 in the last five years, which makes it the ninth most improved over this period.
‘Slowing Deterioration’ & ‘Bouncing Back’: 4 countries
Madagascar: Overall Governance score (2007-2016)
2007 2008 2009 2010 2011 2012 2013 2014 2015 2016 Year
55.955.1
50.5
48.9
46.946.0
47.047.7
48.249.3
Annual average trend (2007-2016), -0.73
Annual average trend (2012-2016), +0.83
50.0
48.0
46.0
44.0
42.0
40.0
0.0
52.0
100.0
54.0
58.0
56.0
Score
‘Bouncing Back’

22
Eight countries that register decline over the decade show no signs of turning things around, decreasing at a faster rate in the last five years.
Whilst countries such as Burundi, Libya and Central African Republic register the effects of ongoing crises, worryingly Botswana and Ghana, though still featuring among the top ten performing countries in 2016, are also the seventh and sixth most deteriorated countries in the last five years.
‘Increasing Deterioration’: 8 countries
2016 Rank /54 2016 Score/100.0 10-year trend (2007-2016)
Annual average trend (2007-2016)
5-year trend (2012-2016)
Annual average trend (2012-2016)
3 Botswana 72.7 -0.8 -0.09 -2.5 -0.63
8 Ghana 65.0 -1.5 -0.17 -2.8 -0.70
Ghana: Overall Governance score (2007-2016)
2007 2008 2009 2010 2011 2012 2013 2014 2015 2016 Year
66.567.5
68.1 68.168.6
67.8
67.1
64.9
63.6
65.0
Annual average trend (2007-2016), -0.17
Annual average trend (2012-2016), -0.70
Score
72.0
70.0
68.0
66.0
64.0
60.0
62.0
0.0
100.0
‘Increasing Deterioration’
2016 score
KEY
Warning Signs
Bouncing Back
Slowing ImprovementIncreasing Improvement
Slowing Deterioration Increasing Deterioration
1.00
-1.00
-2.00
-3.00
2.00
0.00 0.50 1.00-1.00-1.50 -0.50 1.50
5-ye
ar A
nnua
l Ave
rage
Tre
nd
10-year Annual Average Trend
Chart illustrates all country trend classifications and position of specified country in relation to the rest of the continent. Size of bubble indicates 2016 Overall Governance score (higher score = larger bubble).
African countries trend classifications

Five years post Arab Spring: mixed results
In 2011 protesters took to the streets in Egypt, Libya and Tunisia, pushing their leaders to leave office. Five years later, the IIAG results appear mixed.
At the Overall Governance level, Tunisia (7th) and Egypt (31st) show causes for optimism. Both countries have managed to show ‘Increasing Improvement’ over the last five years.
Egypt has more than tripled its annual pace of improvement (+0.55) when compared to the last ten years (+0.17).
Tunisia has also augmented its annual average trend from +0.61 over the last decade to +0.90 over the last five years. In 2016, Tunisia is the highest scoring Arab Spring country in all the categories and in ten of the 14 sub-categories (Rule of Law, Accountability, Personal Safety, National Security, Participation, Rights, Gender, Public Management, Welfare and Education).
Meanwhile, Libya (49th) shows concerning signs with an ‘Increasing Deterioration’ of its overall score. The country has almost doubled its average annual trend of deterioration in the last five years (-2.95) when compared to the last ten years (-1.48).
At the category level, Tunisia and Egypt have been displaying optimistic signs in Safety & Rule of Law, Sustainable Economic Opportunity and Human Development over the last five years:
In Safety & Rule of Law Tunisia is showing increasing improvement while Egypt is bouncing back from a negative ten-year trend.
In Sustainable Economic Opportunity Tunisia displays slowing deterioration while Egypt has more than doubled its rate of improvement (+1.93) when compared with the last ten years (+0.74). This is the only category where both countries are featured in the ten highest scoring countries.
Finally, in Human Development Tunisia is bouncing back from a negative ten-year trend while Egypt has more than doubled its rate of improvement (+1.75) when compared with the last ten years (+0.78).
However, the trend in Participation & Human Rights over the last five years could be concerning:
The largest improver of the continent over the past decade (+3.19 per year), Tunisia’s scores had been barely static until 2010. In one year only, between 2010 and 2011, the country grew by +13.8 points in Participation & Human Rights. However, Tunisia’s progress has been slowing down over the last five years (+2.73 per year), though still at striking levels.
More concerningly, within a positive ten-year trend, Egypt displays the second largest deterioration of the continent over the last five years (-1.55), pointing to ‘Warning Signs’.
Libya displays concerning signs across all categories.
Over the past five years, Libya has increasingly deteriorated in Safety & Rule of Law (50th), Sustainable Economic Opportunity (52nd) and Human Development (18th). The country has been the largest deteriorator of the continent in Sustainable Economic Opportunity and Human Development, and the third largest in Safety & Rule of Law.
Libya registers its sole category improvement over the last decade in Participation & Human Rights (+8.3). However, the country shows ‘Warning Signs’ by moving from the 8th largest improver in the category over the decade, to register the largest score fall on the continent over the last five years (-7.4).
At the sub-category level, Health, Gender and Participation are the only sub-categories where Tunisia, Egypt and Libya have all improved in the last decade. Conversely, in National Security and Personal Safety all three countries have deteriorated.
23
SPOTLIGHT
Increasing Improvement Increasing Deterioration No ChangeSlowing Improvement Slowing DeteriorationWarning Signs Bouncing Back
Overall Governance
2016 Score
Trend 2007-2016
Annual average
trend
Trend 2012-2016
Annual average
trend
7 Tunisia 65.5 +5.5 +0.61 +3.6 +0.90
31 Egypt 49.4 +1.5 +0.17 +2.2 +0.55
49 Libya 33.3 -13.3 -1.48 -11.8 -2.95
Safey & Rule of Law
2016 Score
Trend 2007-2016
Annual average
trend
Trend 2012-2016
Annual average
trend
14 Tunisia 62.9 +0.1 +0.01 +2.6 +0.65
33 Egypt 49.8 -9.1 -1.01 +0.2 +0.05
50 Libya 24.3 -23.1 -2.57 -16.2 -4.05
Human Development
2016 Score
Trend 2007-2016
Annual average
trend
Trend 2012-2016
Annual average
trend
9 Tunisia 70.5 -3.6 -0.40 +0.8 +0.20
15 Egypt 62.6 +7.0 +0.78 +7.0 +1.75
18 Libya 59.7 -14.9 -1.66 -7.5 -1.88
Sustainable Economic Opportunity
2016 Score
Trend 2007-2016
Annual average
trend
Trend 2012-2016
Annual average
trend
10 Egypt 57.8 +6.7 +0.74 +7.7 +1.93
9 Tunisia 58.2 -3.1 -0.34 -0.1 -0.03
52 Libya 21.5 -23.8 -2.64 -16.3 -4.08
Participation & Human Rights
2016 Score
Trend 2007-2016
Annual average
trend
Trend 2012-2016
Annual average
trend
7 Tunisia 70.2 +28.7 +3.19 +10.9 +2.73
47 Libya 27.6 +8.3 +0.92 -7.4 -1.85
48 Egypt 27.2 +1.2 +0.13 -6.2 -1.55


Safety & Rule of Law
Rule of Law
Accountability
Personal Safety
National Security

26
3 Namibia 78.1 +2.3 +0.26 +3.9 +0.9810 Senegal 65.2 +2.6 +0.29 +3.3 +0.8314 Tanzania 62.9 +1.2 +0.13 +4.4 +1.1014 Tunisia 62.9 +0.1 +0.01 +2.6 +0.6521 Togo 59.7 +5.0 +0.56 +3.3 +0.8322 Swaziland 59.4 +0.2 +0.02 +0.9 +0.2323 Côte d'Ivoire 58.9 +16.4 +1.82 +10.6 +2.6525 Uganda 57.5 +1.8 +0.20 +1.0 +0.2527 Kenya 56.8 +6.4 +0.71 +6.7 +1.6836 Ethiopia 49.0 +0.7 +0.08 +0.4 +0.1038 Zimbabwe 46.0 +5.8 +0.64 +5.2 +1.3019 Liberia 61.4 +12.1 +1.34 +2.5 +0.6320 Sierra Leone 60.6 +8.9 +0.99 +2.2 +0.5523 Comoros 58.9 +13.5 +1.50 +4.3 +1.0832 Guinea 51.0 +5.0 +0.56 +0.1 +0.0345 Chad 41.5 +5.5 +0.61 +2.3 +0.58
1 Mauritius 82.7 +2.0 +0.22 -0.6 -0.158 Lesotho 66.6 +0.2 +0.02 -2.2 -0.559 Zambia 66.4 +1.4 +0.16 -2.6 -0.65
39 Angola 45.9 +2.1 +0.23 0.0 0.005 Seychelles 74.0 -1.3 -0.14 +1.2 +0.307 South Africa 67.1 -3.3 -0.37 +2.6 +0.65
11 São Tomé & Príncipe 64.2 -1.9 -0.21 +0.4 +0.1012 Rwanda 64.1 -0.7 -0.08 +4.1 +1.0314 Morocco 62.9 -0.8 -0.09 +3.1 +0.7818 Burkina Faso 61.5 -0.3 -0.03 +1.1 +0.2828 Mali 56.2 -6.2 -0.69 +3.2 +0.8029 Madagascar 54.7 -8.6 -0.96 +7.4 +1.8533 Egypt 49.8 -9.1 -1.01 +0.2 +0.0537 Nigeria 46.4 -3.5 -0.39 +4.0 +1.0043 Guinea-Bissau 42.1 -5.6 -0.62 +3.2 +0.8048 Democratic Republic of Congo 28.2 -3.2 -0.36 +1.7 +0.4313 Benin 63.6 -5.2 -0.58 -1.3 -0.3317 Malawi 62.7 -7.1 -0.79 -2.1 -0.5335 Algeria 49.5 -5.4 -0.60 -1.8 -0.4540 Mauritania 45.3 -6.4 -0.71 -2.1 -0.5347 Eritrea 32.5 -7.5 -0.83 -3.2 -0.8052 Sudan 21.6 -6.8 -0.76 -0.8 -0.20
2 Botswana 81.6 -1.2 -0.13 -2.0 -0.504 Cabo Verde 76.1 -2.9 -0.32 -2.0 -0.506 Ghana 71.5 -2.1 -0.23 -2.6 -0.65
25 Gabon 57.5 -0.3 -0.03 -1.2 -0.3030 Niger 52.9 -0.4 -0.04 -4.2 -1.0531 Mozambique 52.7 -11.7 -1.30 -8.2 -2.0534 Djibouti 49.6 -4.9 -0.54 -2.4 -0.6041 Gambia 45.2 -12.3 -1.37 -8.8 -2.2042 Cameroon 44.5 -8.6 -0.96 -8.4 -2.1043 Congo 42.1 -0.6 -0.07 -3.0 -0.7546 Equatorial Guinea 40.7 -0.5 -0.06 -1.3 -0.3349 Burundi 26.2 -23.6 -2.62 -20.4 -5.1050 Libya 24.3 -23.1 -2.57 -16.2 -4.0551 Central African Republic 23.3 -7.0 -0.78 -7.2 -1.8054 Somalia 8.5 -0.3 -0.03 -0.6 -0.1553 South Sudan 14.0 . . -20.8 -5.20
AFRICAN AVERAGE 52.8 -2.4 -0.27 -0.7 -0.18N/A
2016 SCORE /100.0 ANNUAL AVERAGE TREND (2007-2016)
ANNUAL AVERAGE TREND (2012-2016)
5-YEAR TREND (2012-2016)
10-YEAR TREND (2007-2016)
2016 RANK /54
Safety & Rule of Law If Annual Average Trend appears the same in the two time periods, differences may exist beyond the 2nd decimal place.
Increasing Improvement Increasing Deterioration No ChangeSlowing Improvement Slowing DeteriorationWarning Signs Bouncing Back

27
2017 IIAG: Index Report
10-year & 5-year annual average trends
2016SCORE
AAT (2012-2016)
AAT* (2007-2016)
Côte d'IvoireComorosLiberiaSierra LeoneKenyaZimbabweChadTogoGuineaSenegalNamibiaAngolaMauritiusUgandaZambiaTanzaniaEthiopiaLesothoSwazilandTunisiaBurkina FasoGabonSomaliaNigerEquatorial GuineaCongoRwandaMoroccoBotswanaSeychellesSão Tomé & PríncipeGhanaCabo VerdeDRCSouth AfricaNigeriaDjiboutiBeninAlgeriaGuinea-BissauMaliMauritaniaSudanCARMalawiEritreaMadagascarCameroonEgyptMozambiqueGambiaLibyaBurundiSouth Sudan
+1.82 +2.65 58.9+1.50 +1.08 58.9+1.34 +0.63 61.4+0.99 +0.55 60.6+0.71 +1.68 56.8+0.64 +1.30 46.0+0.61 +0.58 41.5+0.56 +0.83 59.7+0.56 +0.03 51.0+0.29 +0.83 65.2+0.26 +0.98 78.1+0.23 0.00 45.9+0.22 -0.15 82.7+0.20 +0.25 57.5+0.16 -0.65 66.4+0.13 +1.10 62.9+0.08 +0.10 49.0+0.02 -0.55 66.6+0.02 +0.23 59.4+0.01 +0.65 62.9-0.03 +0.28 61.5-0.03 -0.30 57.5-0.03 -0.15 8.5-0.04 -1.05 52.9-0.06 -0.33 40.7-0.07 -0.75 42.1-0.08 +1.03 64.1-0.09 +0.78 62.9-0.13 -0.50 81.6-0.14 +0.30 74.0-0.21 +0.10 64.2-0.23 -0.65 71.5-0.32 -0.50 76.1-0.36 +0.43 28.2-0.37 +0.65 67.1-0.39 +1.00 46.4-0.54 -0.60 49.6-0.58 -0.33 63.6-0.60 -0.45 49.5-0.62 +0.80 42.1-0.69 +0.80 56.2-0.71 -0.53 45.3-0.76 -0.20 21.6-0.78 -1.80 23.3-0.79 -0.53 62.7-0.83 -0.80 32.5-0.96 +1.85 54.7-0.96 -2.10 44.5-1.01 +0.05 49.8-1.30 -2.05 52.7-1.37 -2.20 45.2-2.57 -4.05 24.3-2.62 -5.10 26.2
. -5.20 14.0
As South Sudan does not have data prior to 2011, no trends over the ten-year period are available for that country.
ANNUAL AVERAGE TREND
Improvement since 2007Improvement since 2012
Deterioration since 2007Deterioration since 2012
* AAT: Annual Average Trend
Countries ordered by size of the 10-year trend.
0.00 +2.00-2.00-4.00-6.00 +4.00

28
Safety & Rule of Law is the only governance category showing deterioration over the last ten years: the continental average score has deteriorated at an average pace of -0.27 score points per year, holding back greater progress at the Overall Governance level.
However, the pace of deterioration appears to be slowing. Looking at the last five years, Africa’s decline in this category has slowed down to an average pace of -0.18 points per year, less than the average pace of decline seen over ten years. Africa’s score has even improved by +0.8 between 2015 and 2016.
This ‘Slowing Deterioration’ is largely the result of several countries’ improving performance in the recent five-year period, especially in two of Safety & Rule of Law’s sub-categories.
The African average score for Rule of Law has bounced back to reach the same score as ten years ago, reversing decline seen in the first part of the last decade with an annual average improvement of +0.50 points within the last five years.
In the same period, although still declining, Personal Safety is doing so at less than half the average pace seen over the decade. The decline over ten years in Personal Safety is still, however, the
largest of the sub-category deteriorations seen in the IIAG over ten years.
However, concerningly, National Security shows ‘Increasing Deterioration’. Having declined by -3.7 points over the last ten years at an average yearly rate of -0.41, the pace of deterioration in the last five years has more than doubled, declining at an average rate of -0.95 per year.
Meanwhile, the progress registered over the last decade in Accountability, the lowest scoring sub-category in the IIAG with 35.8 points, remains marginal and is losing momentum.
Safety & Rule of Law: mixed signs of hope within a decade long negative trend
Africa: Safety & Rule of Law average score (2007-2016)
2007 2008 2009 2010 2011 2012 2013 2014 2015 2016 Year
55.2
55.0
54.2
54.1
53.6
53.5
52.5
52.1 52.0
52.8
Annual average trend (2007-2016), -0.27
Annual average trend (2012-2016), -0.18
Score
50.0
0.0
51.0
52.0
53.0
100.0
54.0
55.0
56.0
‘Slowing Deterioration’
2007 2008 2009 2010 2011 2012 2013 2014 2015 2016 Trend 2007-2016
Annual average
trend
Trend 2012-2016
Annual average
trend
SAFETY & RULE OF LAW 55.2 55.0 54.2 54.1 53.6 53.5 52.5 52.1 52.0 52.8 -2.4 -0.27 -0.7 -0.18 Slowing Deterioration
RULE OF LAW 53.2 52.9 51.9 51.7 51.4 51.2 50.6 51.7 52.6 53.2 0.0 0.00 +2.0 +0.50 Bouncing Back
ACCOUNTABILITY 35.2 36.0 35.2 34.4 35.0 35.7 34.9 33.2 34.6 35.8 +0.6 +0.07 +0.1 +0.03 Slowing Improvement
PERSONAL SAFETY 52.1 51.9 50.3 49.6 47.3 46.9 45.7 46.0 45.5 45.7 -6.4 -0.71 -1.2 -0.30 Slowing Deterioration
NATIONAL SECURITY 80.1 79.3 79.5 80.9 80.6 80.2 78.7 77.5 75.4 76.4 -3.7 -0.41 -3.8 -0.95 Increasing Deterioration
Africa (Average scores)Score / 100.0; 100.0=best

29
2017 IIAG: Index Report
The decelerating pace of deterioration on the continent in Safety & Rule of Law is also seen in the fact that in the last five years, fewer countries have deteriorated and more have improved. In the last five years, 28 countries have been able to register improvement, even though 25 are still showing deterioration, the largest number of countries deteriorating in any of the governance categories of the IIAG in this period.
Of the countries that have declined over the last decade, more than half (18) are showing signs of either ‘Bouncing Back’ with a positive recent five-year trend, or ‘Slowing Deterioration’.
Six countries — Algeria, Benin, Eritrea, Malawi, Mauritania and Sudan — register ‘Slowing Deterioration’ with an average annual rate of decline that is slower in the last five years than in the last ten.
Twelve countries — Burkina Faso, Democratic Republic of Congo, Egypt, Guinea-Bissau, Madagascar, Mali, Morocco, Nigeria, Rwanda, São Tomé & Príncipe, Seychelles and South Africa — are ‘Bouncing Back’, registering a positive trend in the last five years,
although this doesn’t allow them to fully change their ten-year negative trajectory.
As seen at the Overall Governance level, Madagascar displays the most notable result of this group. The sixth most deteriorated country over the last decade (with an average decline of -0.96 score points per year since 2007), Madagascar becomes the second most improved country in this category in the last five years with an average increase of +1.85 points per year.
‘Slowing Deterioration’ & ‘Bouncing Back’: 18 countries
Hopeful signs for some?
53 African countries 54 African countries, including South Sudan
10-year trend (2007-2016)
5-year trend (2012-2016)
Countries with an improved score 20 28
Countries with a deteriorated score 33 25
Countries with no score change 0 1
Safety & Rule of Law: countries’ recent trends
Classification # countries
Increasing Improvement 11
Slowing Improvement 5
Warning Signs 4
Bouncing Back 12
Slowing Deterioration 6
Increasing Deterioration 15
Madagascar: Safety & Rule of Law score (2007-2016)
2007 2008 2009 2010 2011 2012 2013 2014 2015 2016 Year
63.360.7
51.0
48.9
47.2 47.3
50.4 54.1 53.954.7
Annual average trend (2007-2016), -0.96
Annual average trend (2012-2016), +1.8557.0
55.0
53.0
51.0
49.0
47.0
0.0
59.0
100.0
61.0
65.0
63.0
Score
‘Bouncing Back’

30
The other 15 of the 33 declining countries over the last decade however have shown ‘Increasing Deterioration’ in the last five years, with the annual average pace of decline quickening over this period. Of these, Burundi, Cameroon, Central African Republic, Gambia, Libya and Mozambique show ‘Increasing Deterioration’
in three or all of the four sub-categories of Safety & Rule of Law. While Burundi, Central African Republic and Libya register the effects of on-going crises, the negative trends in Cameroon and Mozambique are concerning.
Eleven of the 20 countries that register improvement over the decade are accelerating progress in the last five years. Of these, three countries show ‘Increasing Improvement’ in three or all of Safety & Rule of Law’s sub-categories (Côte d’Ivoire, Tanzania and Zimbabwe). Zimbabwe is the lowest ranking of the countries showing ‘Increasing Improvement’ but has been improving by +1.30 points on average per year in the last five years.
‘Increasing Deterioration’: 15 countries
‘Increasing Improvement’: 11 countries
Zimbabwe: Safety & Rule of Law score (2007-2016)
2007 2008 2009 2010 2011 2012 2013 2014 2015 2016 Year
40.2
32.2
39.4
40.639.9
40.8
44.4 44.343.5
46.0
Annual average trend (2007-2016), +0.64
Annual average trend (2012-2016), +1.30
40.0
38.0
36.0
34.0
32.0
30.0
0.0
42.0
44.0
46.0
48.0
100.0
Score
‘Increasing Improvement’
Mozambique: Safety & Rule of Law score (2007-2016)
2007 2008 2009 2010 2011 2012 2013 2014 2015 2016 Year
64.4
62.2 62.5
61.1
62.8
60.9
56.555.7 55.7
52.7
Annual average trend (2007-2016), -1.30
Annual average trend (2012-2016), -2.05
60.0
58.0
56.0
54.0
52.0
50.0
0.0
62.0
64.0
66.0
100.0
Score
‘Increasing Deterioration’

31
2017 IIAG: Index Report
The long-term deterioration in the Safety & Rule of Law category remains a matter of concern, and attention still needs to be paid to some worrying trends. Whilst some recent improvements can be seen in countries showing long-term decline, nine of the 20 countries to have registered a positive ten-year trend are experiencing more recently a worrying negative trend.
Chad, Comoros, Guinea, Liberia and Sierra Leone, are registering ‘Slowing Improvement’, with an annual average rate of progression that is lower in the last five years than in the last ten.
More concerningly, Angola, Lesotho, Mauritius and Zambia are showing ‘Warning Signs’ by displaying a negative trend in the last five years, even though the trend over the last decade remains positive.
Mauritius, still the highest scoring country in Safety & Rule of Law (82.7), although improving at an average pace of +0.22 points per year during the past decade, has shown deterioration at an average pace of -0.15 points per year since 2012.
Angola, ranking a low 39th on the continent with a score of 45.9 in 2016, registers an improvement of +2.1 at a pace of +0.23 points on average per year over the last decade, but its score in 2016 is the same as it was in 2012.
Zambia shows the largest decline of this group in the last five years, with an annual average trend of -0.65 in this period, threatening to reverse progress made earlier in the decade.
‘Slowing Improvement’ & ‘Warning Signs’: 9 countries
Zambia: Safety & Rule of Law score (2007-2016)
2007 2008 2009 2010 2011 2012 2013 2014 2015 2016 Year
65.0
64.2
65.1
65.9
67.9
69.0
67.8
67.1
67.9
66.4
Annual average trend (2007-2016), +0.16
Annual average trend (2012-2016), -0.65
67.0
66.0
65.0
64.0
63.0
62.0
0.0
68.0
100.0
69.0
70.0
Score
‘Warning Signs’

32
1 South Africa 94.7 +2.7 +0.30 +2.7 +0.688 Zambia 74.9 +0.5 +0.06 +1.4 +0.359 Senegal 73.5 +6.4 +0.71 +6.3 +1.58
10 Malawi 73.2 +2.3 +0.26 +5.9 +1.4812 Tunisia 67.0 +18.3 +2.03 +11.7 +2.9314 Nigeria 63.1 +4.3 +0.48 +12.4 +3.1017 Mali 59.8 +0.5 +0.06 +8.0 +2.0018 Sierra Leone 59.2 +18.0 +2.00 +9.0 +2.2519 Burkina Faso 58.7 +2.4 +0.27 +6.5 +1.6319 Morocco 58.7 +1.2 +0.13 +1.1 +0.2822 Côte d'Ivoire 58.4 +23.0 +2.56 +19.6 +4.9023 Tanzania 56.3 +0.6 +0.07 +1.5 +0.3824 Comoros 55.9 +14.6 +1.62 +10.7 +2.6830 Niger 53.5 +1.0 +0.11 +2.4 +0.6034 Guinea 49.5 +11.1 +1.23 +9.0 +2.2538 Zimbabwe 42.5 +15.4 +1.71 +11.3 +2.8343 Chad 37.2 +4.5 +0.50 +9.1 +2.2849 Sudan 24.8 +4.8 +0.53 +4.2 +1.0554 Somalia 8.7 +0.9 +0.10 +0.9 +0.23
4 Ghana 88.7 +5.0 +0.56 +0.7 +0.1815 Liberia 62.1 +16.6 +1.84 +6.9 +1.7316 Kenya 60.7 +6.5 +0.72 +1.7 +0.4339 Angola 42.2 +6.9 +0.77 +0.7 +0.18
7 Seychelles 76.3 +0.3 +0.03 -0.3 -0.0846 Democratic Republic of Congo 32.1 +3.2 +0.36 -2.5 -0.63
5 Namibia 87.1 -0.6 -0.07 +5.3 +1.3325 Madagascar 55.8 -2.1 -0.23 +22.4 +5.6027 Rwanda 55.5 -5.5 -0.61 +2.2 +0.5532 Egypt 52.6 -1.1 -0.12 +8.5 +2.1337 Ethiopia 42.6 -1.1 -0.12 +4.4 +1.1045 Guinea-Bissau 32.6 -3.0 -0.33 +11.1 +2.7848 Equatorial Guinea 29.0 -0.3 -0.03 +1.5 +0.3853 Eritrea 15.8 -9.0 -1.00 +3.5 +0.8811 Benin 71.4 -1.1 -0.12 -0.1 -0.0321 São Tomé & Príncipe 58.6 -6.9 -0.77 -0.6 -0.1528 Uganda 55.0 -11.2 -1.24 -0.1 -0.0336 Cameroon 42.8 -4.2 -0.47 -0.7 -0.1841 Algeria 38.2 -9.8 -1.09 -0.8 -0.2044 Mauritania 34.7 -16.8 -1.87 -6.5 -1.63
2 Botswana 92.8 -2.2 -0.24 -2.5 -0.633 Mauritius 92.5 -1.0 -0.11 -2.5 -0.636 Cabo Verde 86.3 -2.7 -0.30 -3.7 -0.93
13 Lesotho 64.1 -3.7 -0.41 -3.9 -0.9825 Swaziland 55.8 -1.8 -0.20 -1.3 -0.3329 Mozambique 54.6 -5.7 -0.63 -7.6 -1.9031 Gabon 53.1 -0.1 -0.01 -0.5 -0.1333 Togo 51.6 -2.9 -0.32 -3.1 -0.7835 Gambia 43.0 -2.0 -0.22 -2.4 -0.6040 Djibouti 40.6 -5.8 -0.64 -5.8 -1.4542 Congo 37.4 -0.3 -0.03 -1.0 -0.2547 Central African Republic 30.4 -3.6 -0.40 -3.5 -0.8850 Burundi 24.5 -28.2 -3.13 -18.9 -4.7352 Libya 21.4 -7.5 -0.83 -8.7 -2.1851 South Sudan 23.7 . . -13.0 -3.25
AFRICAN AVERAGE 53.2 0.0 0.00 +2.0 +0.50N/A
2016 SCORE /100.0 ANNUAL AVERAGE TREND (2007-2016)
ANNUAL AVERAGE TREND (2012-2016)
5-YEAR TREND (2012-2016)
10-YEAR TREND (2007-2016)
2016 RANK /54
Rule of Law If Annual Average Trend appears the same in the two time periods, differences may exist beyond the 2nd decimal place.
Increasing Improvement Increasing Deterioration No ChangeSlowing Improvement Slowing DeteriorationWarning Signs Bouncing Back

33
2017 IIAG: Index Report
The African average score for Rule of Law has bounced back in the last five years, reversing decline seen earlier in the decade, to reach the same score in 2016 as it did a decade ago. The static trend over a decade in Rule of Law is reflected in Africa’s trajectory in underlying Rule of Law indicators; half of the six that make up Rule of Law have improved, while half have deteriorated. Of the latter, two are showing signs of reversing continental decline.
Rule of Law: a static 10-year trend masking a recent upturn
The increase in Transfers of Power in the last five years is driven by substantial gains registered by Egypt, Guinea and Madagascar (+66.7) as well as, to a lesser extent, by Nigeria and Senegal (+33.3), even if some countries still register substantial declines: Mozambique (-33.4), South Sudan and Burundi (-33.3). The continental average score for this indicator however remains low (38.3).
‘Bouncing Back’
Continental indicator performance
Half the countries on the continent (27) register ‘Increasing Improvement’ in Judicial Independence with the largest improvement in the last five years seen in Guinea-Bissau (+24.9). Meanwhile, of the nine most deteriorated countries over the decade, six are declining at an even faster pace in the last five years.
Average continental progress in Judicial Process masks the fact that over a third (23) of countries have shown no change in score in the last five years. It is the impressive gains registered by previously low scoring countries – Burkina Faso, Chad and Zimbabwe (+37.5) – that increase the African average score.
Average Property Rights results are driven by 28 countries displaying ‘Increasing Improvement’ including Kenya and Senegal. Sixteen countries are still showing decline in the last five years however, Libya (-13.0) the largest of these.
‘Increasing Improvement’
While the majority of countries improve in the indicator Access to Justice, the continental average score registers decline due to the magnitude of declines over the last five years. Whilst less than half the continent (21 countries) display deteriorating scores, 19 of these are ‘Increasing Deterioration’. The magnitude of recent declines in several countries drives down the continental average score in this measure. Burundi, Egypt, Kenya and Lesotho drop by more than -20.0 points in the last five years, Mauritania by -51.5.
‘Increasing Deterioration’
2007 2008 2009 2010 2011 2012 2013 2014 2015 2016 Year
48.0
0.0
49.0
50.0
51.0
100.0
52.0
53.0
54.0
‘Bouncing Back’
Africa: Rule of Law average score (2007-2016)
53.252.9
51.9
51.451.2
50.6
51.7
52.6
53.2
Annual average trend (2007-2016), 0.00
Annual average trend (2012-2016), +0.50
Score
51.7
Africa (average scores) 2016 Score
Trend 2007-2016
Annual average
trend
Trend 2012-2016
Annual average
trend
Transfers of Power 38.3 -3.5 -0.39 +4.7 +1.18
Multilateral Sanctions 82.1 -2.2 -0.24 0.0 0.00
Africa (average scores) 2016 Score
Trend 2007-2016
Annual average
trend
Trend 2012-2016
Annual average
trend
Property Rights 48.9 +1.6 +0.18 +4.0 +1.00
Judicial Independence 44.0 +2.6 +0.29 +3.4 +0.85
Judicial Process 46.2 +2.3 +0.26 +2.3 +0.58
Africa (average scores) 2016 Score
Trend 2007-2016
Annual average
trend
Trend 2012-2016
Annual average
trend
Access to Justice 60.0 -0.7 -0.08 -1.8 -0.45

34
1 Rwanda 72.1 +15.8 +1.76 +12.2 +3.052 Mauritius 70.4 +1.2 +0.13 +3.9 +0.988 Seychelles 59.6 +6.2 +0.69 +6.6 +1.659 Senegal 56.3 +13.1 +1.46 +9.8 +2.45
11 Ghana 54.7 +0.8 +0.09 +0.6 +0.1512 Morocco 53.4 +11.9 +1.32 +8.0 +2.0013 Ethiopia 52.3 +20.1 +2.23 +15.8 +3.9514 Burkina Faso 51.5 +4.7 +0.52 +8.9 +2.2315 Tanzania 45.5 +4.6 +0.51 +7.9 +1.9817 Kenya 43.6 +3.2 +0.36 +1.8 +0.4518 Côte d'Ivoire 43.3 +24.2 +2.69 +12.3 +3.0821 São Tomé & Príncipe 39.3 +4.0 +0.44 +1.9 +0.4823 Uganda 38.7 +4.4 +0.49 +6.4 +1.6024 Togo 37.9 +17.4 +1.93 +10.4 +2.6031 Nigeria 32.7 +6.5 +0.72 +5.2 +1.3045 Congo 16.5 +2.7 +0.30 +3.1 +0.7846 Central African Republic 16.3 +3.8 +0.42 +3.5 +0.88
5 Tunisia 61.9 +9.7 +1.08 +0.8 +0.2010 Lesotho 55.0 +1.7 +0.19 +0.1 +0.0316 Zambia 43.8 +7.1 +0.79 +0.3 +0.0819 Liberia 43.1 +13.7 +1.52 +4.2 +1.0542 Democratic Republic of Congo 18.6 +4.6 +0.51 +0.9 +0.2328 Sierra Leone 33.3 +5.2 +0.58 -5.0 -1.2534 Gabon 30.7 +2.5 +0.28 -1.9 -0.4835 Djibouti 27.4 +5.5 +0.61 -2.1 -0.5340 Zimbabwe 24.6 +0.8 +0.09 -3.6 -0.9043 Guinea 18.5 +2.5 +0.28 -5.9 -1.4820 Egypt 40.5 -2.0 -0.22 +3.7 +0.9326 Benin 36.1 -3.6 -0.40 +0.2 +0.0537 Mauritania 26.8 -2.8 -0.31 +1.1 +0.2850 Guinea-Bissau 10.8 -4.6 -0.51 +2.6 +0.65
5 South Africa 61.9 -8.8 -0.98 -0.4 -0.1025 Swaziland 37.4 -8.0 -0.89 -1.4 -0.3527 Madagascar 35.0 -9.1 -1.01 -3.7 -0.9341 Burundi 21.1 -1.5 -0.17 -0.4 -0.10
3 Botswana 66.3 -7.7 -0.86 -8.5 -2.134 Cabo Verde 64.4 -5.2 -0.58 -3.1 -0.787 Namibia 60.3 -1.3 -0.14 -2.1 -0.53
22 Mali 39.1 -10.9 -1.21 -9.3 -2.3328 Niger 33.3 -0.9 -0.10 -3.7 -0.9330 Malawi 33.2 -7.7 -0.86 -6.7 -1.6832 Algeria 32.6 -6.4 -0.71 -3.5 -0.8833 Comoros 30.8 -2.2 -0.24 -2.8 -0.7036 Cameroon 27.0 -2.0 -0.22 -5.5 -1.3838 Mozambique 26.4 -16.8 -1.87 -11.5 -2.8839 Gambia 25.8 -11.3 -1.26 -8.8 -2.2044 Chad 17.6 -2.0 -0.22 -3.9 -0.9847 Angola 13.5 -0.8 -0.09 -0.6 -0.1548 Libya 12.8 -5.8 -0.64 -6.2 -1.5549 Eritrea 12.2 -14.1 -1.57 -11.7 -2.9351 Sudan 10.0 -3.5 -0.39 -2.8 -0.7053 Equatorial Guinea 4.6 -3.3 -0.37 -4.4 -1.1054 Somalia 1.6 -1.7 -0.19 -5.1 -1.2852 South Sudan 8.4 . . -3.5 -0.88
AFRICAN AVERAGE 35.8 +0.6 +0.07 +0.1 +0.03N/A
Accountability
2016 SCORE /100.0 ANNUAL AVERAGE TREND (2007-2016)
ANNUAL AVERAGE TREND (2012-2016)
5-YEAR TREND (2012-2016)
10-YEAR TREND (2007-2016)
2016 RANK /54
If Annual Average Trend appears the same in the two time periods, differences may exist beyond the 2nd decimal place.
Increasing Improvement Increasing Deterioration No ChangeSlowing Improvement Slowing DeteriorationWarning Signs Bouncing Back

35
2017 IIAG: Index Report
The African average score in Accountability (35.8 out of 100.0) is the lowest across all of the sub-categories in the IIAG. Barely any progress has been made in the last five years (+0.1) as the average African score recovers from deterioration between 2012-2014. The inconsistency of progress in Accountability is reflected in underlying Accountability indicators which show contrasting trends. All eight underlying Accountability indicators feature in the bottom half of the 100 indicators in the IIAG in 2016.
Accountability: almost no progress
Progress in Accountability is held back by a large deterioration in Corruption & Bureaucracy and to a lesser extent in Accountability of Public Officials. Both these indicators are among the 20 lowest scoring indicators of the 100 in the IIAG. Thirty-five countries have declining scores in Corruption & Bureaucracy over the last decade and for 28 of these the pace of decline has increased in the last five years. Algeria and Mauritania show the sharpest
declines in this period (-38.1).
‘Increasing Deterioration’
Though the African average score for Online Public Services remains low, over the last decade 41 countries improve their score in this measure. Sixteen of these however show decline in the last five years, presenting ‘Warning Signs’ for future progress. Eleven countries decline over a decade and all of these are
deteriorating at an even quicker pace in the last five years.
‘Warning Signs’
Despite continental decline in Diversion of Public Funds, Corruption Investigation and Corruption in Government & Public Officials over a decade, in the last five years the African average score for the former two indicators is back on the rise. Half the countries that have worsened scores in Diversion of Public Funds over the decade are showing signs of turning things around with improvements in the last five years.
‘Bouncing Back’ & ‘Slowing Deterioration’
Driving the slight African average improvement in Accountability over the decade is progress in Access to Information (although this is one of Africa’s ten lowest scoring indicators) and Public Sector Accountability & Transparency. Both of these progress even faster in the last five years. Average progress in the latter is driven by ‘Increasing Improvement’ in the last five years in both low (Central African Republic, +26.7) and high (Senegal, +14.7)
scoring countries. However, there are still 22 countries displaying worsening scores in this measure.
‘Increasing Improvement’
Continental indicator performance
2007 2008 2009 2010 2011 2012 2013 2014 2015 2016 Year
31.0
0.0
32.0
33.0
34.0
100.0
35.0
36.0
37.0
Africa: Accountability average score (2007-2016)
35.2
36.0
35.2 35.0
35.7
34.9
33.2
34.6
35.8
Annual average trend (2007-2016), +0.07
Annual average trend (2012-2016), +0.03
Score
34.4
‘Slowing Improvement’
Africa (average scores) 2016 Score
Trend 2007-2016
Annual average
trend
Trend 2012-2016
Annual average
trend
Corruption & Bureaucracy 37.0 -8.8 -0.98 -6.9 -1.73
Accountability of Public Officials
36.7 -0.3 -0.03 -0.4 -0.10
Africa (average scores) 2016 Score
Trend 2007-2016
Annual average
trend
Trend 2012-2016
Annual average
trend
Online Public Services 34.7 +11.9 +1.32 0.0 0.00
Africa (average scores) 2016 Score
Trend 2007-2016
Annual average
trend
Trend 2012-2016
Annual average
trend
Diversion of Public Funds 37.4 -1.0 -0.11 +3.3 +0.83
Corruption Investigation 32.3 -1.6 -0.18 +0.4 +0.10
Corruption in Government & Public Officials
34.1 -1.1 -0.12 -0.2 -0.05
Africa (average scores) 2016 Score
Trend 2007-2016
Annual average
trend
Trend 2012-2016
Annual average
trend
Access to Information 31.2 +3.0 +0.33 +3.6 +0.90
Public Sector Accountability & Transparency
46.9 +1.5 +0.17 +1.4 +0.35

36
2 Botswana 67.2 +5.0 +0.56 +2.9 +0.733 Namibia 65.2 +2.6 +0.29 +8.4 +2.105 Rwanda 63.5 +4.0 +0.44 +5.9 +1.486 Sierra Leone 62.3 +1.2 +0.13 +6.5 +1.638 Togo 60.2 +6.6 +0.73 +7.3 +1.83
10 Tanzania 58.9 +0.1 +0.01 +4.9 +1.2316 Swaziland 54.6 +5.6 +0.62 +6.3 +1.5825 Côte d'Ivoire 51.2 +3.9 +0.43 +8.0 +2.0026 Kenya 50.8 +16.4 +1.82 +14.4 +3.6040 Chad 39.2 +3.7 +0.41 +5.2 +1.3044 Zimbabwe 38.0 +0.6 +0.07 +8.7 +2.18
9 Lesotho 59.8 +6.9 +0.77 +2.8 +0.7018 Comoros 54.2 +16.7 +1.86 +4.2 +1.05
1 Mauritius 67.8 +2.7 +0.30 -3.9 -0.9831 Guinea 47.0 0.0 0.00 -0.9 -0.2338 Congo 39.3 +0.8 +0.09 -3.3 -0.83
4 São Tomé & Príncipe 65.0 -5.0 -0.56 0.0 0.0012 Morocco 58.2 -10.2 -1.13 +5.1 +1.2815 Senegal 55.1 -2.9 -0.32 +3.7 +0.9320 Djibouti 53.3 -7.0 -0.78 +3.5 +0.8823 Mali 51.6 -9.4 -1.04 +1.0 +0.2538 Madagascar 39.3 -16.3 -1.81 +4.4 +1.1042 Egypt 38.4 -9.8 -1.09 +6.3 +1.5843 Nigeria 38.3 -1.7 -0.19 +8.0 +2.0047 South Africa 33.4 -3.2 -0.36 +1.1 +0.2850 Democratic Republic of Congo 17.3 -12.3 -1.37 +2.9 +0.73
7 Seychelles 60.3 -11.7 -1.30 -1.3 -0.3311 Niger 58.6 -1.2 -0.13 -0.2 -0.0513 Benin 57.4 -9.6 -1.07 -3.1 -0.7819 Cabo Verde 53.5 -3.8 -0.42 -1.6 -0.4028 Malawi 49.4 -18.0 -2.00 -2.8 -0.7033 Tunisia 42.1 -16.7 -1.86 -0.4 -0.1034 Gambia 41.2 -23.8 -2.64 -8.1 -2.0335 Angola 40.9 -4.7 -0.52 -0.1 -0.0336 Eritrea 39.5 -16.5 -1.83 -0.9 -0.2345 Mauritania 37.7 -4.4 -0.49 -1.2 -0.3046 Guinea-Bissau 35.6 -17.1 -1.90 -7.4 -1.8549 Sudan 19.2 -15.4 -1.71 -2.2 -0.5514 Ghana 55.5 -9.9 -1.10 -10.0 -2.5017 Gabon 54.5 -3.7 -0.41 -6.9 -1.7321 Zambia 53.0 -0.9 -0.10 -6.5 -1.6322 Uganda 52.1 -3.7 -0.41 -3.5 -0.8824 Liberia 51.4 -3.8 -0.42 -1.9 -0.4827 Mozambique 49.7 -8.8 -0.98 -6.9 -1.7329 Burkina Faso 48.8 -7.8 -0.87 -6.5 -1.6330 Algeria 47.7 -6.7 -0.74 -3.3 -0.8332 Cameroon 46.7 -2.8 -0.31 -1.6 -0.4037 Equatorial Guinea 39.4 -3.3 -0.37 -2.3 -0.5841 Ethiopia 39.0 -13.4 -1.49 -12.6 -3.1548 Burundi 25.8 -29.8 -3.31 -23.6 -5.9051 Central African Republic 15.3 -11.3 -1.26 -12.5 -3.1352 Libya 14.1 -44.8 -4.98 -20.5 -5.1354 Somalia 2.5 -7.1 -0.79 -4.3 -1.0853 South Sudan 5.7 . . -30.1 -7.53
AFRICAN AVERAGE 45.7 -6.4 -0.71 -1.2 -0.30N/A
Personal Safety
2016 SCORE /100.0 ANNUAL AVERAGE TREND (2007-2016)
ANNUAL AVERAGE TREND (2012-2016)
5-YEAR TREND (2012-2016)
10-YEAR TREND (2007-2016)
2016 RANK /54
If Annual Average Trend appears the same in the two time periods, differences may exist beyond the 2nd decimal place.
Increasing Improvement Increasing Deterioration No ChangeSlowing Improvement Slowing DeteriorationWarning Signs Bouncing Back

37
2017 IIAG: Index Report
Personal Safety remains Africa’s most deteriorated sub-category over the last ten years (2007-2016). However, looking closer at the last five years (2012-2016), the negative trajectory appears to be slowing, with the annual average trend declining more than two times slower (-0.30) than in the ten-year period (-0.71).
Personal Safety: a slowing deterioration
Deterioration in Social Unrest and mainly Safety of the Person over the decade has for the most part driven the decline of Personal Safety at the continental level. On average these are the second and sixth most deteriorated indicators of the entire IIAG over this period. However, decline in both has slowed over the last five years, more so for Safety of the Person in which a few countries (7) are even showing signs of reversing decline.
The slowing decline in Social Unrest is only marginal. Whilst countries like Tunisia, which deteriorated by more than -70.0 points in the first part of the last decade, show some
improvements over the last five years, some of the countries to improve over a decade register decline in the last five years. Côte d’Ivoire for example, improved by +10.5 over the decade but has declined by -4.4 over the last five years, threatening to reverse progress made.
‘Slowing Deterioration’
Concerningly, continental average decline in Crime, Political Violence and Human Trafficking is worsening in the last five years. In the latter, Africa’s fourth most deteriorated indicator over the last ten years and seventh worst scoring indicator, not a single country achieves a score of 100.0 in 2016. The majority (17) of the 26 countries that register worsening Human Trafficking scores over the decade show ‘Increasing Deterioration’ in the last five years. The trend in Political Violence is worrying. Whilst almost half the continent (25 countries) show improving scores, large declines in countries like Burundi and Egypt (both by more than -50.0) over the last five years result in average decline for this measure.
‘Increasing Deterioration’
Thirty-two countries show improving scores in Police Services over the last ten years, and 28 of these manage to improve at an even faster rate in the last five years. However, the African average score for this indicator remains low, and is Africa’s twelfth worst scoring indicator of the 100 in the IIAG. The majority of countries score below 50.0 and six score 0.0 in
2016 (Central African Republic, Equatorial Guinea, Eritrea, Somalia, South Sudan and Sudan).
‘Increasing Improvement’
2007 2008 2009 2010 2011 2012 2013 2014 2015 2016 Year
Score
42.0
0.0
44.0
45.0
43.0
46.0
47.0
48.0
49.0
100.0
50.0
52.0
51.0
53.0
Africa: Personal Safety average score (2007-2016)
52.1 51.9
50.3
47.346.9
46.0
45.545.7
Annual average trend (2007-2016), -0.71
Annual average trend (2012-2016), -0.30
49.6
45.7
‘Slowing Deterioration’
Continental indicator performance
Africa (average scores) 2016 Score
Trend 2007-2016
Annual average
trend
Trend 2012-2016
Annual average
trend
Social Unrest 52.9 -18.0 -2.00 -7.5 -1.88
Safety of the Person 42.9 -11.9 -1.32 -1.7 -0.43
Africa (average scores) 2016 Score
Trend 2007-2016
Annual average
trend
Trend 2012-2016
Annual average
trend
Police Services 34.3 +7.8 +0.87 +9.7 +2.43
Africa (average scores) 2016 Score
Trend 2007-2016
Annual average
trend
Trend 2012-2016
Annual average
trend
Human Trafficking 27.9 -12.1 -1.34 -5.8 -1.45
Crime 49.0 -2.5 -0.28 -1.2 -0.30
Political Violence 66.7 -2.2 -0.24 -1.2 -0.30

38
1 Botswana 100.0 0.0 0.00 0.0 0.001 Cabo Verde 100.0 0.0 0.00 0.0 0.001 Mauritius 100.0 +5.0 +0.56 0.0 0.001 Seychelles 100.0 +0.3 +0.03 +0.2 +0.055 Namibia 99.8 +8.4 +0.93 +4.2 +1.059 São Tomé & Príncipe 93.7 +0.1 +0.01 +0.1 +0.03
15 Guinea-Bissau 89.4 +2.3 +0.26 +6.4 +1.6032 Zimbabwe 78.9 +6.4 +0.71 +4.6 +1.1553 Somalia 21.1 +6.3 +0.70 +6.1 +1.53
7 Comoros 94.7 +24.8 +2.76 +5.0 +1.2518 Liberia 88.9 +21.6 +2.40 +0.5 +0.1322 Angola 87.2 +7.4 +0.82 +0.2 +0.0525 Uganda 84.1 +17.7 +1.97 +1.2 +0.3026 Côte d'Ivoire 82.7 +14.3 +1.59 +2.6 +0.6531 Algeria 79.4 +1.0 +0.11 +0.3 +0.0812 Equatorial Guinea 89.9 +5.1 +0.57 0.0 0.0012 Swaziland 89.9 +5.0 +0.56 -0.1 -0.0317 Guinea 89.2 +6.4 +0.71 -1.7 -0.4320 Sierra Leone 87.6 +11.0 +1.22 -1.8 -0.4539 Chad 71.9 +15.9 +1.77 -1.1 -0.2844 Eritrea 62.6 +9.7 +1.08 -3.7 -0.9310 Gabon 91.6 0.0 0.00 +4.2 +1.0511 Tanzania 91.1 -0.4 -0.04 +3.4 +0.8519 Madagascar 88.7 -7.1 -0.79 +6.6 +1.6533 South Africa 78.5 -3.7 -0.41 +7.0 +1.7537 Mali 74.2 -5.2 -0.58 +13.1 +3.2838 Kenya 72.1 -0.6 -0.07 +8.7 +2.1849 Democratic Republic of Congo 44.7 -8.5 -0.94 +5.6 +1.4014 Benin 89.7 -6.1 -0.68 -1.9 -0.4823 Ghana 86.9 -4.7 -0.52 -1.8 -0.4528 Morocco 81.3 -6.1 -0.68 -2.0 -0.5029 Tunisia 80.8 -10.8 -1.20 -1.4 -0.3530 Mozambique 80.2 -15.4 -1.71 -6.6 -1.6534 Djibouti 76.9 -12.6 -1.40 -5.4 -1.3543 Rwanda 65.4 -16.9 -1.88 -3.7 -0.9347 Nigeria 51.5 -23.0 -2.56 -9.6 -2.4051 Sudan 32.3 -13.4 -1.49 -2.5 -0.63
6 Malawi 95.0 -5.0 -0.56 -4.9 -1.238 Zambia 94.1 -1.1 -0.12 -5.2 -1.30
16 Togo 89.3 -0.8 -0.09 -1.1 -0.2821 Lesotho 87.4 -4.3 -0.48 -8.0 -2.0024 Burkina Faso 86.8 -0.7 -0.08 -4.8 -1.2027 Mauritania 82.2 -1.2 -0.13 -1.6 -0.4035 Senegal 76.1 -6.0 -0.67 -6.2 -1.5536 Congo 75.4 -5.6 -0.62 -10.7 -2.6840 Gambia 70.8 -12.2 -1.36 -16.0 -4.0041 Egypt 67.8 -23.5 -2.61 -17.8 -4.4542 Niger 66.1 -0.5 -0.06 -15.2 -3.8045 Ethiopia 62.0 -3.0 -0.33 -6.2 -1.5546 Cameroon 61.4 -25.6 -2.84 -25.8 -6.4548 Libya 48.9 -34.4 -3.82 -29.5 -7.3850 Burundi 33.5 -34.7 -3.86 -38.7 -9.6852 Central African Republic 31.4 -16.9 -1.88 -16.1 -4.0354 South Sudan 18.3 . . -36.5 -9.13
AFRICAN AVERAGE 76.4 -3.7 -0.41 -3.8 -0.95N/A
National Security
2016 SCORE /100.0 ANNUAL AVERAGE TREND (2007-2016)
ANNUAL AVERAGE TREND (2012-2016)
5-YEAR TREND (2012-2016)
10-YEAR TREND (2007-2016)
2016 RANK /54
If Annual Average Trend appears the same in the two time periods, differences may exist beyond the 2nd decimal place.
Increasing Improvement Increasing Deterioration No ChangeSlowing Improvement Slowing DeteriorationWarning Signs Bouncing Back

39
2017 IIAG: Index Report
Despite National Security being on average Africa’s highest performing governance sub-category in the IIAG, it is the second most deteriorated in the last ten years (after Personal Safety) with a score drop of -3.7 score points at an average rate of -0.41 score points per year.
Decline over the decade in National Security performance is largely due to the last five years. In this period National Security has become the most deteriorated sub-category, having more than doubled the average annual decline of the decade to -0.95 points.
National Security: mounting concerns
Number of countries with the best possible score of 100.0 in the indicator
Government Involvement in Armed Conflict, (2007-2016)Half of the indicators in this sub-category are ‘Increasing Deterioration’. Government Involvement in Armed Conflict shows a large deterioration (-12.1) over the last decade, with the pace of decline quickening in the last five years. Thirty-one countries have a worse score than a decade ago. For the vast majority of these (28), decline over the last decade is solely due to falls in scores in the last five years. Ten years ago, in 2007, 43 countries scored 100.0 (out of 100.0) in Government Involvement in Armed Conflict. Five years ago, in 2012, this number was down to 36 and in 2016 this number was halved to only 18.
Three of the ten most deteriorated countries over the last five years are West African: Cameroon, Niger and Nigeria. Over half of this group also form part of the ten most declined countries in the indicator Internally Displaced People.
The African average score for Internally Displaced People declined marginally over the decade but displays ‘Increasing Deterioration’ over the last five years. However, this is solely due to the magnitude of the deteriorations seen in a minority of countries. In total, only 13 countries show worsening scores in Internally Displaced People since 2012 and the vast majority of the continent (42 countries) achieve a score over 90.0 points (out of 100.0) in 2016.
‘Increasing Deterioration’
10 most deteriorated countries last 5 years Government Involvement in Armed Conflict
10 most deteriorated countries last 5 years Internally Displaced People
Country 2016 Score 5-Year Trend (2012-2016)
Cameroon 22.2 -77.8Nigeria 22.2 -44.5Egypt 55.6 -44.4Niger 55.6 -33.3Kenya 55.6 -33.3Ethiopia 11.1 -33.3Congo 66.7 -33.3Mozambique 77.8 -22.2Libya 77.8 -22.2Eritrea 77.8 -22.2
Country 2016 Score 5-Year Trend (2012-2016)
South Sudan 0.0 -68.2CAR 11.9 -59.2Libya 52.6 -39.5Nigeria 89.7 -10.3Côte d'Ivoire 87.5 -8.8Cameroon 92.6 -7.4Niger 93.5 -5.9Congo 93.7 -4.6Egypt 99.2 -0.8Mozambique 98.7 -0.5
2007
Score
72.0
0.0
74.0
75.0
73.0
76.0
77.0
78.0
79.0
100.0
80.0
82.0
81.0
80.179.3 79.5
80.6 80.2
78.7
77.5
75.4
76.4
80.9
2008 2009 2010 2011 2012 2013 2014 2015 2016 Year
Africa: National Security average score (2007-2016)
Annual average trend (2007-2016), -0.41
Annual average trend (2012-2016), -0.95
‘Increasing Deterioration’
4341 41
43
3936
24 2521
18
Number of countries
2007 2008 2009 2010 2011 2012 2013 2014 2015 2016 Year
4
14
24
34
44
54
Continental indicator performance
Grey highlighted countries feature in the five most deteriorated countries in both indicators.

40
Africa’s average score for Political Refugees has also declined at an accelerated pace in the last five years but again this is due to the magnitude of decline of a minority of countries. Burundi and South Sudan, still in crisis, drop by more than -70.0 points. Rwanda also falls by -37.3 points. Over the last five years the majority of countries either improve (21) or show no score change (13). All countries that register no change already score higher than 90.0 except Eritrea and Somalia (0.0). Liberia shows the largest improvement (+61.4) over the last decade and the last five years (+10.4).
Meanwhile, the trend of decline for Africa’s score in Violence by Non-state Actors is showing signs of slowing. Over the last five years the African average score has declined at an average annual pace of -1.20 points. This slowdown is driven by the fact that nine of the 28 countries declining over the decade manage to show positive trends in the last five years. However, the scope of decline in Burundi (-97.0) and South Sudan (-68.0) especially, but also Cameroon, Central African Republic, Libya and Sudan (all more than -20.0) continue to drive down the African average trend.
The indicator Domestic Armed Conflict, is the only indicator in National Security that has, on average, shown a positive trend in
the last five years. The African average score for Domestic Armed Conflict has declined by -4.8 over the last decade, yet is ‘Bouncing Back’ with an improvement of +0.48 points per year on average in the last five years, driven by improvements in Guinea-Bissau (+50.0) and others including Côte d’Ivoire, Kenya and Madagascar (+25.0).
‘Slowing Deterioration’ & ‘Bouncing Back’
Since 2007, all constituent indicators in National Security have shown continental average deterioration except for Cross-border Tensions (+6.4). Now, worryingly, in the last five years, this indicator displays ‘Warning Signs’, becoming the second largest deteriorating indicator in National Security in the last five years. A large majority of countries (37) show no change in the last five years in this measure, only five have shown improvement and
large declines in Cameroon, Gambia, Niger, (all -50.0) and Libya (-62.5) pull down the continental result.
‘Warning Signs’
A majority of countries on the continent show decline in National Security over a decade.
The quickening pace of decline of the African average score is due to the fact that of the 31 countries to decline over the last ten years, just over half (16) are ‘Increasing Deterioration’ in the last five years. All of these decline at more than double the pace except for Egypt.
Burundi is the most deteriorated country over the decade (-34.7) as well as over the last five years (-38.7). The country shows the largest annual average decline on the continent in the last five years (-9.68), almost tripling its annual pace of deterioration compared with the decade’s (annual average decline of -3.86).
On top of that, 12 of 19 countries registering a positive ten-year trend are showing concerning recent trends: six register ‘Slowing Improvement’ and six are showing ‘Warning Signs’.
Widespread deterioration at country level
53 African countries 54 African countries, including South Sudan
10-year Trend (2007-2016)
5-year Trend (2012-2016)
Countries with an improved score 19 19
Countries with a deteriorated score 31 31
Countries with no score change 3 4
National Security: countries’ recent trends
Classification # countries
Increasing Improvement 6
Slowing Improvement 6
Warning Signs 6
Bouncing Back 7
Slowing Deterioration 9
Increasing Deterioration 16
Africa (average scores) 2016 Score
Trend 2007-2016
Annual average
trend
Trend 2012-2016
Annual average
trend
Government Involvement in Armed Conflict
82.7 -12.1 -1.34 -8.7 -2.18
Political Refugees 86.5 -1.7 -0.19 -3.5 -0.88
Internally Displaced People 90.2 -0.2 -0.02 -2.9 -0.73
Africa (average scores) 2016 Score
Trend 2007-2016
Annual average
trend
Trend 2012-2016
Annual average
trend
Domestic Armed Conflict 55.6 -4.8 -0.53 +1.9 +0.48
Violence by Non-state Actors
81.2 -11.8 -1.31 -4.8 -1.20
Africa (average scores) 2016 Score
Trend 2007-2016
Annual average
trend
Trend 2012-2016
Annual average
trend
Cross-border Tensions 60.6 +6.4 +0.71 -5.8 -1.45

Terrorism in Africa: a growing challenge for security
The Global Terrorism Index1 (GTI) measures the total number of terrorist incidents, fatalities and injuries and of property damaged by a terrorist incident in a given year. The GTI assesses 50 African countries.
The ten African countries with the highest terrorism levels on the GTI (in order of highest first) are Nigeria, Somalia, Egypt, Libya, Cameroon, Niger, Democratic Republic of Congo, Sudan, Kenya and Central African Republic.
In 2015, the latest data year for the GTI, National Security and the GTI show a correlation coefficient of -0.80, pointing to a strong correlation between low National Security levels and high terrorism levels.2
Seven of the ten lowest scoring countries in National Security in 2015 (Cameroon, Central African Republic, Democratic Republic of Congo, Libya, Nigeria, Somalia, Sudan) also feature in the ten African countries with the highest terrorism levels on the GTI.
At the indicator level, the IIAG scores in Government Involvement in Armed Conflict (r = -0.67) and in Domestic Armed Conflict (r = -0.82) are also strongly correlated with the GTI results.
1 The Global Terrorism Index ranks 163 countries based on four indicators. The GTI score for a country in a given year is based on a unique scoring system to account for the relative impact of incidents in the year. The four factors counted in each country’s yearly score are (i) total number of terrorist incidents in a given year, (ii) total number of fatalities caused by terrorists in a given year, (iii) total number of injuries caused by terrorists in a given year, (iv) a measure of the total property damage from terrorist incidents in a given year. Global Terrorism Index, Institute for Economics & Peace - http://visionofhumanity.org/app/uploads/2017/02/Global-Terrorism-Index-2016.pdf2 On the Global Terrorism Index, a higher score is worse. In National Security, a higher score is better.
Correlation between National Security and the Global Terrorism Index (2015)
MauritaniaCongoGhana
Lesotho
Morocco
Gambia
Madagascar
Djibouti
Côte d’IvoireSenegal
NamibiaBotswanaMauritius
Togo
Burkina Faso
Eritrea
Mozambique
Tanzania
Rwanda
Ethiopia
South AfricaAlgeria
Cameroon
Niger
KenyaChad
MaliEgypt
SomaliaSouth Sudan
Sudan
Central African Republic
LibyaBurundi
Democratic Republic of Congo
Nigeria
GTI (2015)
IIAG National Security (2015)
80.0
90.0
100.0
40.0
60.0
20.0
70.0
30.0
50.0
10.0
0.0
0 1 2 3 4 5 6 7 8 9 10
SPOTLIGHT
41
10 worst scoring African countries on the GTI


Participation & Human Rights
Participation
Rights
Gender

44
3 Namibia 75.5 +5.6 +0.62 +5.5 +1.386 Benin 70.8 +4.1 +0.46 +3.6 +0.908 Seychelles 69.5 +9.0 +1.00 +7.3 +1.839 Senegal 68.3 +4.8 +0.53 +2.8 +0.70
12 Lesotho 64.6 +0.8 +0.09 +0.7 +0.1814 Sierra Leone 63.4 +7.1 +0.79 +4.8 +1.2015 Madagascar 61.8 +1.0 +0.11 +11.0 +2.7522 Kenya 56.2 +2.2 +0.24 +3.0 +0.7523 Côte d'Ivoire 54.1 +13.5 +1.50 +6.9 +1.7331 Guinea-Bissau 46.3 +4.6 +0.51 +7.4 +1.8533 Morocco 44.2 +4.6 +0.51 +4.1 +1.0334 Algeria 42.8 +5.2 +0.58 +3.1 +0.7834 Zimbabwe 42.8 +11.6 +1.29 +8.0 +2.0036 Ethiopia 40.1 +8.9 +0.99 +6.3 +1.5837 Cameroon 39.4 +1.0 +0.11 +1.2 +0.3049 Sudan 26.1 +7.9 +0.88 +4.3 +1.0854 Somalia 14.6 +3.8 +0.42 +2.8 +0.70
7 Tunisia 70.2 +28.7 +3.19 +10.9 +2.7313 Malawi 64.2 +5.1 +0.57 +1.4 +0.3517 Uganda 58.5 +3.0 +0.33 +0.7 +0.1818 Liberia 57.7 +1.8 +0.20 +0.6 +0.1525 Nigeria 52.5 +6.9 +0.77 +2.5 +0.6326 Togo 51.6 +10.2 +1.13 +3.3 +0.8327 Rwanda 51.5 +7.8 +0.87 +2.2 +0.5530 Guinea 47.9 +10.6 +1.18 +1.4 +0.3532 Gabon 45.8 +3.0 +0.33 +0.7 +0.1839 Congo 38.7 +4.7 +0.52 +1.9 +0.48
2 Mauritius 77.5 +0.4 +0.04 -0.7 -0.1824 Niger 53.7 +4.0 +0.44 -3.3 -0.8342 Angola 37.0 +2.9 +0.32 -0.8 -0.2044 Djibouti 34.8 +1.6 +0.18 -0.9 -0.2346 Chad 31.0 +0.5 +0.06 -0.2 -0.0547 Libya 27.6 +8.3 +0.92 -7.4 -1.8548 Egypt 27.2 +1.2 +0.13 -6.2 -1.5551 Equatorial Guinea 22.8 +2.6 +0.29 -0.3 -0.08
4 South Africa 74.7 -1.6 -0.18 +0.8 +0.2016 Tanzania 61.5 -1.3 -0.14 +0.1 +0.0321 Burkina Faso 56.4 -2.7 -0.30 +0.3 +0.0839 Central African Republic 38.7 -0.4 -0.04 +0.4 +0.1041 Gambia 37.6 -3.9 -0.43 +0.7 +0.1820 Mozambique 56.5 -0.5 -0.06 -0.2 -0.0528 Mali 50.8 -8.6 -0.96 -3.4 -0.8543 Mauritania 36.9 -7.8 -0.87 -2.8 -0.70
1 Cabo Verde 78.0 -1.4 -0.16 -2.8 -0.705 Ghana 72.0 -1.4 -0.16 -2.4 -0.60
10 Botswana 66.9 -3.3 -0.37 -2.6 -0.6511 São Tomé & Príncipe 64.7 -0.6 -0.07 -2.2 -0.5518 Zambia 57.7 -0.9 -0.10 -2.8 -0.7029 Comoros 48.2 -2.3 -0.26 -2.7 -0.6838 Burundi 38.8 -8.5 -0.94 -4.5 -1.1345 Democratic Republic of Congo 32.7 -3.9 -0.43 -2.9 -0.7350 Swaziland 24.6 -3.6 -0.40 -3.6 -0.9053 Eritrea 17.9 -3.3 -0.37 -1.7 -0.4352 South Sudan 20.7 . . -5.2 -1.30
AFRICAN AVERAGE 49.4 +2.2 +0.24 +1.0 +0.25N/A
2016 SCORE /100.0 ANNUAL AVERAGE TREND (2007-2016)
ANNUAL AVERAGE TREND (2012-2016)
5-YEAR TREND (2012-2016)
10-YEAR TREND (2007-2016)
2016 RANK /54
Participation & Human Rights If Annual Average Trend appears the same in the two time periods, differences may exist beyond the 2nd decimal place.
Increasing Improvement Increasing Deterioration No ChangeSlowing Improvement Slowing DeteriorationWarning Signs Bouncing Back

45
2017 IIAG: Index Report
2016SCORE
AAT (2012-2016)
AAT* (2007-2016)
TunisiaCôte d'IvoireZimbabweGuineaTogoSeychellesEthiopiaLibyaSudanRwandaSierra LeoneNigeriaNamibiaAlgeriaMalawiSenegalCongoGuinea-BissauMoroccoBeninNigerSomaliaUgandaGabonAngolaEquatorial GuineaKenyaLiberiaDjiboutiEgyptMadagascarCameroonLesothoChadMauritiusCARMozambiqueSão Tomé & PríncipeZambiaTanzaniaCabo VerdeGhanaSouth AfricaComorosBurkina FasoBotswanaEritreaSwazilandGambiaDRCMauritaniaBurundiMaliSouth Sudan
+3.19 +2.73 70.2+1.50 +1.73 54.1+1.29 +2.00 42.8+1.18 +0.35 47.9+1.13 +0.83 51.6+1.00 +1.83 69.5+0.99 +1.58 40.1+0.92 -1.85 27.6+0.88 +1.08 26.1+0.87 +0.55 51.5+0.79 +1.20 63.4+0.77 +0.63 52.5+0.62 +1.38 75.5+0.58 +0.78 42.8+0.57 +0.35 64.2+0.53 +0.70 68.3+0.52 +0.48 38.7+0.51 +1.85 46.3+0.51 +1.03 44.2+0.46 +0.90 70.8+0.44 -0.83 53.7+0.42 +0.70 14.6+0.33 +0.18 58.5+0.33 +0.18 45.8+0.32 -0.20 37.0+0.29 -0.08 22.8+0.24 +0.75 56.2+0.20 +0.15 57.7+0.18 -0.23 34.8+0.13 -1.55 27.2+0.11 +2.75 61.8+0.11 +0.30 39.4+0.09 +0.18 64.6+0.06 -0.05 31.0+0.04 -0.18 77.5-0.04 +0.10 38.7-0.06 -0.05 56.5-0.07 -0.55 64.7-0.10 -0.70 57.7-0.14 +0.03 61.5-0.16 -0.70 78.0-0.16 -0.60 72.0-0.18 +0.20 74.7-0.26 -0.68 48.2-0.30 +0.08 56.4-0.37 -0.65 66.9-0.37 -0.43 17.9-0.40 -0.90 24.6-0.43 +0.18 37.6-0.43 -0.73 32.7-0.87 -0.70 36.9-0.94 -1.13 38.8-0.96 -0.85 50.8
. -1.30 20.7
10-year & 5-year annual average trends
As South Sudan does not have data prior to 2011, no trends over the ten-year period are available for that country.
ANNUAL AVERAGE TREND
Improvement since 2007Improvement since 2012
Deterioration since 2007Deterioration since 2012
* AAT: Annual Average Trend
Countries ordered by size of the 10-year trend.
0.00 +2.00-2.00-4.00-6.00 +4.00

46
The Participation & Human Rights category in 2016 displays its highest average continental score (49.4 out of 100.0) since the first data year of the IIAG (2000), a score that was first reached in 2015.
Having risen at an annual average rate of +0.24 score points over the last decade, which represents the second largest IIAG governance category improvement over this period, the African average improvement for Participation & Human Rights is
marginally picking up speed in the last five years, with an average progress of +0.25 points per year. Participation & Human Rights is the only governance category in the IIAG to be registering ‘Increasing Improvement’ over the last five years.
Participation & Human Rights: stronger progress on average, masking some concerning recent trends
Over the decade, progress has been mostly bolstered by Gender (average increase of +0.43 per year), followed by Participation (average increase of +0.18 per year) and Rights (average increase of +0.11 per year).
However, over the last five years, the average annual trend appears to be slowing down in Gender and marginally so in Rights. It is the quickening average improvement in Participation that is driving the ‘Increasing Improvement’ at category level.
Although Gender still shows the largest improvement in Participation & Human Rights over the last five years, reaching its highest average score (55.1) in 2016, it also registers the biggest slowdown over the last five years.
Over the last ten years, 35 countries improved their Participation & Human Rights score, while 18 countries registered a decline. In the latter half of the decade although fewer countries (32) improved their score, the large improvements registered by countries such as Madagascar (+11.0) and Tunisia (+10.9) contribute to the African average progress of +1.0 over this period.
53 African countries 54 African countries, including South Sudan
10-year trend (2007-2016)
5-year trend (2012-2016)
Countries with an improved score 35 32
Countries with a deteriorated score 18 22
Countries with no score change 0 0
Africa: Participation & Human Rights average score (2007-2016)
2007 2008 2009 2010 2011 2012 2013 2014 2015 2016 Year
47.2 47.146.9
47.5
48.0
48.4
48.8 48.8
49.4 49.4
Annual average trend (2007-2016), +0.24
Annual average trend (2012-2016), +0.25
46.0
0.0
47.0
48.0
49.0
100.0
50.0
Score
‘Increasing Improvement’
2007 2008 2009 2010 2011 2012 2013 2014 2015 2016 Trend 2007-2016
Annual average
trend
Trend 2012-2016
Annual average
trend
PARTICIPATION & HUMAN RIGHTS
47.2 47.1 46.9 47.5 48.0 48.4 48.8 48.8 49.4 49.4 +2.2 +0.24 +1.0 +0.25 Increasing Improvement
PARTICIPATION 48.0 47.1 46.0 46.4 47.7 48.5 49.1 49.6 49.8 49.6 +1.6 +0.18 +1.1 +0.28 Increasing Improvement
RIGHTS 42.4 42.8 42.4 42.6 42.8 43.0 43.1 42.4 43.4 43.4 +1.0 +0.11 +0.4 +0.10 Slowing Improvement
GENDER 51.2 51.5 52.4 53.4 53.6 53.8 54.1 54.5 55.0 55.1 +3.9 +0.43 +1.3 +0.33 Slowing Improvement
Africa (Average scores)Score / 100.0; 100.0=best

47
2017 IIAG: Index Report
Seventeen countries are ‘Increasing Improvement’, contributing to the uptick in improvement seen at category level, the largest number of countries showing this trend of all four governance categories in the IIAG.
Madagascar registers the largest gains in the last five years. Having reached its worst ever score in 2012, it has since achieved year-on-year improvement at an impressive average rate of +2.75 points per year, thus climbing ten rank places (to 15th position) in five years.
Sitting at different rungs in the rankings table, Seychelles (8th), Sierra Leone (14th), Algeria and Zimbabwe (tied 34th), and Somalia (54th) are the only five countries that are ‘Increasing Improvement’ in Participation & Human Rights and in all three constituent sub-categories.
Namibia is the highest-ranking country (3rd) in Participation & Human Rights to show ‘Increasing Improvement’. Along with Madagascar, Kenya, Guinea-Bissau, Morocco and Cameroon, it has more than doubled its annual average pace of improvement in the last five years as compared to the rate registered over the decade.
‘Increasing Improvement’: 17 countries
Participation & Human Rights: countries’ recent trends
Classification # countries
Increasing Improvement 17
Slowing Improvement 10
Warning Signs 8
Bouncing Back 5
Slowing Deterioration 3
Increasing Deterioration 10
Namibia: Participation & Human Rights score (2007-2016)
2007 2008 2009 2010 2011 2012 2013 2014 2015 2016 Year
69.9
68.7
67.8
69.1
70.0 70.070.5
74.4
75.3 75.5
Annual average trend (2007-2016), +0.62
Annual average trend (2012-2016), +1.38
66.0
0.0
68.0
70.0
72.0
100.0
74.0
76.0
Score
‘Increasing Improvement’

48
Eight countries are showing ‘Warning Signs’, threatening to reverse the progress they have made over the decade, displaying a negative trend in the last five years, despite an overall positive trend over the last decade. Half of these countries already rank in
the bottom ten on the continent in Participation & Human Rights.
Of these, Libya is the only country that registers deterioration in all three sub-categories in the most recent five years.
Countries in the bottom 10 in Participation & Human Rights showing ‘Warning Signs’
2016 Rank/54 2016 Score/100.0 10-year trend (2007-2016)
Annual average trend (2007-2016)
5-year trend (2012-2016)
Annual average trend (2012-2016)
46 Chad 31.0 +0.5 +0.06 -0.2 -0.05
47 Libya 27.6 +8.3 +0.92 -7.4 -1.85
48 Egypt 27.2 +1.2 +0.13 -6.2 -1.55
51 Equatorial Guinea 22.8 +2.6 +0.29 -0.3 -0.08
Ten countries — Tunisia, Malawi, Uganda, Liberia, Nigeria, Togo, Rwanda, Guinea, Gabon and Congo — register ‘Slowing Improvement’. Guinea is the only country of this group in which progress has slowed by more than half in the last five years, compared to its rate of improvement over ten.
Tunisia is the highest ranked country of this group (7th). Having showed the largest country improvement over ten years in Participation & Human Rights (at an annual average speed of +3.19 points per year), the country appears to lose some momentum over the last five years with a reduced annual average speed of +2.73 points per year. It is still however the second most improved country over the last five years.
‘Slowing Improvement’ & ‘Warning Signs’: 18 countries
Tunisia: Participation & Human Rights score (2007-2016)
2007 2008 2009 2010 2011 2012 2013 2014 2015 2016 Year
41.5 42.0 41.8
41.7
55.5
59.3
63.669.0 69.3
70.2
Annual average trend (2007-2016), +3.19
Annual average trend (2012-2016), +2.73
50.0
60.0
70.0
48.0
46.0
44.0
42.0
40.0
38.0
0.0
52.0
62.0
72.0
100.0
54.0
64.0
58.0
68.0
56.0
66.0
Score
‘Slowing Improvement’

49
2017 IIAG: Index Report
Three countries in the bottom ten in Participation & Human Rights are ‘Increasing Deterioration’: Democratic Republic of Congo, Swaziland and Eritrea.
Of these, Swaziland’s pace of deterioration has more than doubled. Swaziland, from an already low base, drops to its lowest ever score in Participation & Human Rights in 2016
(24.6), and in two constituent sub-categories (Participation, 15.1, first reached in 2014, and Gender, 35.1).
Worryingly, three of the top ten scoring countries in Participation & Human Rights also feature in this group. Cabo Verde and Ghana’s pace of deterioration has more than tripled, and Botswana also shows ‘Increasing Deterioration’.
‘Increasing Deterioration’: 10 countries
Ghana: Participation & Human Rights score (2007-2016)
2007 2008 2009 2010 2011 2012 2013 2014 2015 2016 Year
73.4 73.674.1
74.875.1
74.4 74.4 74.372.2
72.0
Annual average trend (2007-2016), -0.16
Annual average trend (2012-2016), -0.60
0.0
70.0
72.0
100.0
74.0
76.0
Score
‘Increasing Deterioration’

50
4 Botswana 83.3 +0.1 +0.01 +1.2 +0.304 Namibia 83.3 +2.2 +0.24 +5.6 +1.406 Benin 82.1 +6.1 +0.68 +6.3 +1.589 Senegal 76.9 +1.3 +0.14 +2.1 +0.53
11 Seychelles 74.3 +8.2 +0.91 +11.4 +2.8514 Sierra Leone 65.9 +1.3 +0.14 +3.4 +0.8517 Nigeria 62.7 +11.5 +1.28 +9.9 +2.4819 Côte d'Ivoire 62.2 +28.0 +3.11 +12.7 +3.1820 Kenya 61.0 +5.3 +0.59 +6.5 +1.6321 Guinea-Bissau 60.3 +4.2 +0.47 +21.1 +5.2830 Gambia 45.2 +7.0 +0.78 +14.4 +3.6032 Morocco 39.9 +5.2 +0.58 +5.4 +1.3534 Djibouti 36.0 +6.0 +0.67 +8.0 +2.0036 Algeria 34.1 +2.5 +0.28 +2.4 +0.6037 Rwanda 33.8 +2.5 +0.28 +1.9 +0.4840 Zimbabwe 31.7 +4.4 +0.49 +3.6 +0.9041 Cameroon 31.1 +3.1 +0.34 +2.2 +0.5551 Equatorial Guinea 16.4 +5.3 +0.59 +2.6 +0.6553 Somalia 14.9 +3.4 +0.38 +2.2 +0.55
3 Tunisia 85.7 +57.8 +6.42 +15.7 +3.9313 Liberia 67.5 +2.9 +0.32 +0.9 +0.2328 Guinea 52.7 +27.6 +3.07 +5.7 +1.4331 Togo 44.2 +7.8 +0.87 +0.9 +0.2349 Sudan 21.8 +7.6 +0.84 +1.0 +0.25
2 Cabo Verde 87.8 +3.3 +0.37 -3.7 -0.9312 Lesotho 68.8 +5.0 +0.56 -2.7 -0.6833 Gabon 37.9 +3.1 +0.34 -1.8 -0.4538 Libya 33.2 +20.4 +2.27 -11.7 -2.9343 Angola 26.3 +2.5 +0.28 -6.8 -1.7043 Egypt 26.3 +5.7 +0.63 -11.6 -2.90
7 Ghana 81.2 -0.4 -0.04 +0.1 +0.038 South Africa 80.1 -4.1 -0.46 +3.1 +0.78
16 Madagascar 63.1 -3.0 -0.33 +25.5 +6.3817 Comoros 62.7 -2.4 -0.27 +0.5 +0.1322 Mali 59.5 -10.7 -1.19 +4.2 +1.0526 Burkina Faso 54.5 -9.4 -1.04 +1.0 +0.2535 Central African Republic 35.2 -3.5 -0.39 +2.1 +0.5345 Ethiopia 25.3 -0.2 -0.02 +1.2 +0.3054 Eritrea 2.6 -1.8 -0.20 +0.9 +0.23
1 Mauritius 88.1 -2.3 -0.26 -0.1 -0.0339 Mauritania 32.1 -17.6 -1.96 -5.7 -1.4310 São Tomé & Príncipe 76.0 -0.1 -0.01 -3.1 -0.7815 Malawi 64.8 -0.1 -0.01 -3.1 -0.7823 Zambia 58.8 -6.0 -0.67 -9.5 -2.3824 Tanzania 57.4 -5.4 -0.60 -4.0 -1.0025 Niger 56.7 -12.9 -1.43 -16.3 -4.0827 Mozambique 53.8 -7.9 -0.88 -3.7 -0.9329 Uganda 47.2 -0.2 -0.02 -1.6 -0.4042 Congo 29.1 -1.6 -0.18 -2.8 -0.7045 Democratic Republic of Congo 25.3 -12.9 -1.43 -7.8 -1.9547 Burundi 24.6 -27.9 -3.10 -12.8 -3.2048 Chad 22.5 -0.4 -0.04 -3.3 -0.8352 Swaziland 15.1 -3.0 -0.33 -1.6 -0.4050 South Sudan 16.7 . . -9.3 -2.33
AFRICAN AVERAGE 49.6 +1.6 +0.18 +1.1 +0.28N/A
Participation
2016 SCORE /100.0 ANNUAL AVERAGE TREND (2007-2016)
ANNUAL AVERAGE TREND (2012-2016)
5-YEAR TREND (2012-2016)
10-YEAR TREND (2007-2016)
2016 RANK /54
If Annual Average Trend appears the same in the two time periods, differences may exist beyond the 2nd decimal place.
Increasing Improvement Increasing Deterioration No ChangeSlowing Improvement Slowing DeteriorationWarning Signs Bouncing Back
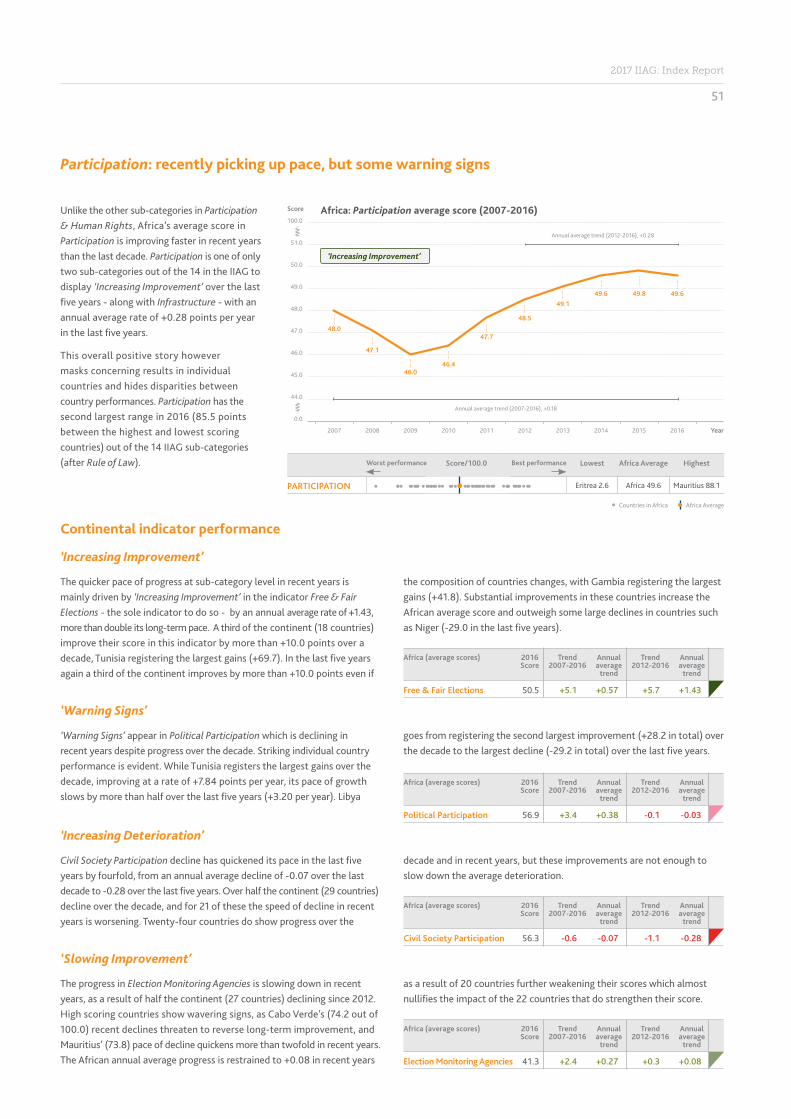
51
2017 IIAG: Index Report
Unlike the other sub-categories in Participation & Human Rights, Africa’s average score in Participation is improving faster in recent years than the last decade. Participation is one of only two sub-categories out of the 14 in the IIAG to display ‘Increasing Improvement’ over the last five years - along with Infrastructure - with an annual average rate of +0.28 points per year in the last five years.
This overall positive story however masks concerning results in individual countries and hides disparities between country performances. Participation has the second largest range in 2016 (85.5 points between the highest and lowest scoring countries) out of the 14 IIAG sub-categories (after Rule of Law).
Participation: recently picking up pace, but some warning signs
‘Warning Signs’ appear in Political Participation which is declining in recent years despite progress over the decade. Striking individual country performance is evident. While Tunisia registers the largest gains over the decade, improving at a rate of +7.84 points per year, its pace of growth slows by more than half over the last five years (+3.20 per year). Libya
goes from registering the second largest improvement (+28.2 in total) over the decade to the largest decline (-29.2 in total) over the last five years.
‘Warning Signs’
Civil Society Participation decline has quickened its pace in the last five years by fourfold, from an annual average decline of -0.07 over the last decade to -0.28 over the last five years. Over half the continent (29 countries) decline over the decade, and for 21 of these the speed of decline in recent years is worsening. Twenty-four countries do show progress over the
decade and in recent years, but these improvements are not enough to slow down the average deterioration.
‘Increasing Deterioration’
The progress in Election Monitoring Agencies is slowing down in recent years, as a result of half the continent (27 countries) declining since 2012. High scoring countries show wavering signs, as Cabo Verde’s (74.2 out of 100.0) recent declines threaten to reverse long-term improvement, and Mauritius’ (73.8) pace of decline quickens more than twofold in recent years. The African annual average progress is restrained to +0.08 in recent years
as a result of 20 countries further weakening their scores which almost nullifies the impact of the 22 countries that do strengthen their score.
‘Slowing Improvement’
The quicker pace of progress at sub-category level in recent years is mainly driven by ‘Increasing Improvement’ in the indicator Free & Fair Elections - the sole indicator to do so - by an annual average rate of +1.43, more than double its long-term pace. A third of the continent (18 countries) improve their score in this indicator by more than +10.0 points over a decade, Tunisia registering the largest gains (+69.7). In the last five years again a third of the continent improves by more than +10.0 points even if
the composition of countries changes, with Gambia registering the largest gains (+41.8). Substantial improvements in these countries increase the African average score and outweigh some large declines in countries such as Niger (-29.0 in the last five years).
‘Increasing Improvement’
2007 2008 2009 2010 2011 2012 2013 2014 2015 2016 Year
‘Increasing Improvement’
Africa: Participation average score (2007-2016)
48.0
47.1
46.0
47.7
48.5
49.149.6 49.8 49.6
Annual average trend (2007-2016), +0.18
Annual average trend (2012-2016), +0.28
Score
46.4
44.0
0.0
45.0
46.0
47.0
100.0
48.0
49.0
51.0
50.0
Continental indicator performance
Worst performance Score/100.0 Best performance Lowest Africa Average Highest
PARTICIPATION Eritrea 2.6 Africa 49.6 Mauritius 88.1
Countries in Africa Africa Average
Africa (average scores) 2016 Score
Trend 2007-2016
Annual average
trend
Trend 2012-2016
Annual average
trend
Free & Fair Elections 50.5 +5.1 +0.57 +5.7 +1.43
Africa (average scores) 2016 Score
Trend 2007-2016
Annual average
trend
Trend 2012-2016
Annual average
trend
Political Participation 56.9 +3.4 +0.38 -0.1 -0.03
Africa (average scores) 2016 Score
Trend 2007-2016
Annual average
trend
Trend 2012-2016
Annual average
trend
Civil Society Participation 56.3 -0.6 -0.07 -1.1 -0.28
Africa (average scores) 2016 Score
Trend 2007-2016
Annual average
trend
Trend 2012-2016
Annual average
trend
Election Monitoring Agencies 41.3 +2.4 +0.27 +0.3 +0.08

52
The faster sub-category level progress in the latter part of the decade is a result of 33 countries improving their Participation scores in this period.
In the most recent five years, Madagascar is ‘Bouncing Back’ from its decade-long negative trajectory, registering the largest improvement on the continent and climbing 18 rank places from 34th to the 16th. Madagascar is also the largest improver in Legitimacy of Political Process (+55.6), Civil Society Participation (+25.5) and Political Participation (+16.8), and the third largest improver in Free & Fair Elections (+34.0) since 2012.
Participation has the largest number of countries (19) classified as ‘Increasing Improvement’ compared to the other two constituent sub-categories in Participation & Human Rights. Botswana (83.3), Namibia (83.3), Benin (82.1) and Senegal (76.9) are both top ten scoring countries as well as countries displaying ‘Increasing Improvement’. Botswana and Benin also achieve their highest ever score in 2016.
Although low ranking, Djibouti - unlike any other African country – displays ‘Increasing Improvement’ at the sub-category level and in every available underlying indicator. This progress is notable as the annual average change of each indicator has more than doubled in the last five years – resulting in the eighth largest improvement and a climb of 12 rank places from 46th in 2012 to 34th in 2016.
However, only six of the top ten improvers over the last decade maintain top ten improver status in the last five years. Tunisia, having registered the largest gains over the decade (+57.8) is slowing in recent years. The country displays ‘Slowing Improvement’ in all but one indicator, Legitimacy of Political Process, where it exhibits ‘Increasing Improvement’. Ranked 3rd
in 2016, Tunisia falls from the most improved country with an annual rate of +6.42 points per year over the past decade to the third most improved in the latter part of the decade at almost half the growth rate (+3.93).
Of the 30 countries that register improvement over the decade, 11 are on a concerning path; with five ‘Slowing Improvement’ and six exhibiting ‘Warning Signs’.
Concerningly, of the 23 countries that are deteriorating since 2007, more than half (12) show ‘Increasing Deterioration’. Of these 12 countries, Burundi, Chad, Democratic Republic of Congo and Swaziland are in the bottom ten ranking countries in 2016.
Particularly concerning are Burundi and Democratic Republic of Congo as their performances weaken in every single underlying indicator both over the decade and in the last five years. Burundi (+27.9) declines the most over the last ten years and accelerates its pace of decline in recent years, along with 11 other countries. Burundi’s score worsens every single year over the last decade.
There are signs of improvement even at the bottom end of the rankings table, with Equatorial Guinea and Somalia, registering ‘Increasing Improvement’. Equatorial Guinea achieves its highest ever Participation score in 2016 but it is still very low (16.4).
Mixed country results
The continental score for Legitimacy of Political Process (+0.2) is a result of several countries showing signs of stopping the decline registered over the decade. A handful of countries (Côte d’Ivoire, Guinea, Madagascar, Nigeria and Tunisia) are showing rapid improvements in the last five years, but many countries (18) display no change at all over a decade and many of these (10) score a low 11.0 out of 100.0. Only seven countries increase
their scores since 2012, compared to eight since 2007. On the other hand, fewer countries (14) decline in recent years compared to 17 over the decade.
‘Bouncing Back’
Top 10 improvers, 2007-2016
Top 10 improvers, 2012-2016
Tunisia MadagascarCôte d'Ivoire Guinea-BissauGuinea TunisiaLibya GambiaNigeria Côte d'IvoireSeychelles SeychellesTogo NigeriaSudan DjiboutiGambia KenyaBenin Benin
Participation: countries’ recent trends
Classification # countries
Increasing Improvement 19
Slowing Improvement 5
Warning Signs 6
Bouncing Back 9
Slowing Deterioration 2
Increasing Deterioration 12
53 African countries 54 African countries, including South Sudan
10-year trend (2007-2016)
5-year trend (2012-2016)
Countries with an improved score 30 33
Countries with a deteriorated score 23 21
Countries with no score change 0 0
Africa (average scores) 2016 Score
Trend 2007-2016
Annual average
trend
Trend 2012-2016
Annual average
trend
Legitimacy of Political Process 41.2 -3.5 -0.39 +0.2 +0.05
Djibouti 2016 Score
Rank Trend 2007-2016
Annual average
trend
Trend 2012-2016
Annual average
trend
PARTICIPATION 36.0 34 +6.0 +0.67 +8.0 +2.00
Political Participation 40.7 41 +6.7 +0.74 +6.5 +1.63
Civil Society Participation
47.8 34 +6.6 +0.73 +6.3 +1.58
Free & Fair Elections 31.0 40 +3.0 +0.33 +11.6 +2.90
Election Monitoring Agencies
24.3 44 +7.3 +0.81 +7.3 +1.83
Legitimacy of Political Process
. . . . . .
Grey highlighted countries feature in both the ten most improved countries over the last ten and five years.


54
6 Senegal 65.2 +7.6 +0.84 +5.7 +1.438 Malawi 63.1 +11.5 +1.28 +9.2 +2.30
10 Tanzania 58.2 +2.2 +0.24 +2.1 +0.5313 Seychelles 56.6 +6.3 +0.70 +4.2 +1.0514 Sierra Leone 56.3 +6.5 +0.72 +4.0 +1.0015 Tunisia 55.7 +23.0 +2.56 +13.7 +3.4319 Uganda 52.2 +1.0 +0.11 +3.6 +0.9022 Côte d'Ivoire 49.1 +15.9 +1.77 +8.7 +2.1827 Liberia 46.8 +1.9 +0.21 +4.6 +1.1529 Algeria 44.9 +4.6 +0.51 +3.1 +0.7831 Guinea 42.1 +10.8 +1.20 +5.3 +1.3336 Ethiopia 34.4 +7.2 +0.80 +6.9 +1.7339 Central African Republic 30.6 +0.3 +0.03 +0.4 +0.1043 Zimbabwe 28.5 +13.7 +1.52 +9.6 +2.4052 Somalia 10.9 +1.1 +0.12 +1.6 +0.40
9 Niger 59.9 +13.1 +1.46 +3.3 +0.8316 Togo 52.7 +13.1 +1.46 +4.0 +1.0025 Morocco 48.1 +9.8 +1.09 +4.3 +1.0830 Guinea-Bissau 43.6 +7.4 +0.82 +3.2 +0.80
1 Mauritius 78.8 +0.8 +0.09 -0.7 -0.1811 Burkina Faso 57.8 +2.2 +0.24 0.0 0.0032 Nigeria 41.4 +2.1 +0.23 -3.8 -0.9537 Rwanda 33.6 +1.7 +0.19 0.0 0.0041 Angola 29.6 +2.2 +0.24 -0.1 -0.0345 Djibouti 24.3 +3.1 +0.34 -3.1 -0.7848 Libya 22.2 +2.8 +0.31 -7.4 -1.85
2 Cabo Verde 76.8 -3.1 -0.34 +1.8 +0.453 South Africa 70.3 -1.6 -0.18 +0.8 +0.207 Benin 63.4 -3.3 -0.37 +0.7 +0.18
17 Lesotho 52.6 -2.5 -0.28 +1.7 +0.4321 Mozambique 50.8 -5.5 -0.61 +1.1 +0.2823 Madagascar 48.8 -6.4 -0.71 +3.3 +0.8326 Kenya 47.7 -1.2 -0.13 +0.1 +0.0335 Cameroon 35.6 -1.0 -0.11 +3.0 +0.7554 Eritrea 8.1 -0.5 -0.06 +0.9 +0.2338 Democratic Republic of Congo 32.1 -1.3 -0.14 -0.2 -0.0549 Gambia 21.3 -5.6 -0.62 -1.6 -0.4053 Equatorial Guinea 9.8 -3.8 -0.42 -1.0 -0.25
4 Namibia 68.8 -0.8 -0.09 -0.9 -0.235 Ghana 68.6 -2.7 -0.30 -3.9 -0.98
12 São Tomé & Príncipe 57.3 -2.3 -0.26 -2.4 -0.6018 Mali 52.5 -8.4 -0.93 -4.5 -1.1320 Botswana 52.1 -5.1 -0.57 -5.8 -1.4523 Zambia 48.8 -6.5 -0.72 -6.8 -1.7028 Comoros 45.4 -1.1 -0.12 -4.8 -1.2033 Gabon 41.2 -4.6 -0.51 -3.4 -0.8534 Mauritania 40.4 -3.1 -0.34 -2.5 -0.6340 Congo 29.9 -2.4 -0.27 -4.4 -1.1041 Chad 29.6 -0.3 -0.03 -1.5 -0.3844 Egypt 24.4 -5.7 -0.63 -10.8 -2.7046 Swaziland 23.5 -2.9 -0.32 -1.6 -0.4047 Burundi 23.0 -13.2 -1.47 -9.9 -2.4851 Sudan 15.5 -0.9 -0.10 -2.0 -0.5050 South Sudan 16.6 . . -8.7 -2.18
AFRICAN AVERAGE 43.4 +1.0 +0.11 +0.4 +0.10N/A
Rights
2016 SCORE /100.0 ANNUAL AVERAGE TREND (2007-2016)
ANNUAL AVERAGE TREND (2012-2016)
5-YEAR TREND (2012-2016)
10-YEAR TREND (2007-2016)
2016 RANK /54
If Annual Average Trend appears the same in the two time periods, differences may exist beyond the 2nd decimal place.
Increasing Improvement Increasing Deterioration No ChangeSlowing Improvement Slowing DeteriorationWarning Signs Bouncing Back

55
2017 IIAG: Index Report
Rights is the lowest scoring sub- category (43.4 out of 100.0), on average, in Participation & Human Rights. Recovering from a drop in score in 2014, Rights registers its highest sub-category score in 2015 and 2016. In the recent five years, Rights registers a very slight slowdown in progress with an annual average rate of +0.10 compared to +0.11 over the decade.
Rights: losing momentum, while still low-scoring
is mainly driven by 12 countries that bounce back from longer-term negative trends and four countries that are speeding up progress.
Human Rights Violations still remains in Africa’s ten lowest scoring IIAG indicators (out of 100) in 2016 despite bouncing back with gains over the last five years. However, for two thirds of the continent (36 countries), scores remain unchanged in the last five years. The average increase
‘Bouncing Back’
Africa (75.0). Concerningly, 19 countries still score 0.0 in 2016, including Angola, Botswana, Eritrea and Zimbabwe.
Protection against Discrimination registers the fifth largest indicator-level improvement since 2012. However, it is one of Africa’s ten lowest scoring IIAG indicators in 2016. The average improvement masks many static scores as 23 countries display no change in the two-time periods – amongst these are the highest scoring countries Mauritius and South
‘Increasing Improvement’
deteriorating at an even faster pace in the last five years. Botswana, Libya, Mali and Zambia do so by a magnitude of more than -10.0 points.
Despite being one of Africa’s top 20 scoring indicators on average, Human Rights Conventions sees many countries slipping. Of the 45 countries that improved over the decade, 17 display a slowdown in progress, with seven halting progress as their trajectories display no change since 2012. This is further compounded by some countries that decline over the decade
‘Slowing Improvement’
Uganda, Ghana and Mozambique. Only ten countries show improving Civil Liberties scores in the last five years.
In Civil Liberties, decline has slowed in the last five years. The largest faller of the decade, Gambia (-33.3) shows signs of halting its decline along with eight other countries. While some countries are showing signs of ‘Bouncing Back’ with better trends over the last five years, there are still 12 countries showing increasing decline in Civil Liberties, including Angola,
‘Slowing Deterioration’
signs of reversing their decade positive performance (Guinea, Libya, Senegal and Zimbabwe). Libya, the second largest improver over the decade has become one of the 20 most deteriorated countries over the last five years.
The further weakening of Freedom of Association & Assembly in the last five years is driven by ‘Increasing Deterioration’ in 23 countries, 15 of which decline by more than -10.0 points. Comoros registers the largest declines at the fastest pace in both time periods.
In Freedom of Expression, over half of the countries on the continent (29) register a deterioration over a decade that worsens in the last five years. Burundi, which is among the ten lowest scoring countries in 2016, registers the largest decline in both time periods. Four countries display
‘Increasing Deterioration’
2007 2008 2009 2010 2011 2012 2013 2014 2015 2016 Year
41.0
0.0
42.0
43.0
44.0
100.0
‘Slowing Improvement’
Africa: Rights average score (2007-2016)
42.4
42.8
42.4
42.843.0 43.1
42.4 43.4 43.4
Annual average trend (2007-2016), +0.11
Annual average trend (2012-2016), +0.10
Score
42.6
Continental indicator performance
Africa (average scores) 2016 Score
Trend 2007-2016
Annual average
trend
Trend 2012-2016
Annual average
trend
Freedom of Association & Assembly
43.4 -6.0 -0.67 -5.4 -1.35
Freedom of Expression 56.6 -3.1 -0.34 -3.5 -0.88
Africa (average scores) 2016 Score
Trend 2007-2016
Annual average
trend
Trend 2012-2016
Annual average
trend
Protection against Discrimination
22.0 +7.4 +0.82 +7.4 +1.85
Africa (average scores) 2016 Score
Trend 2007-2016
Annual average
trend
Trend 2012-2016
Annual average
trend
Human Rights Violations 31.0 -2.7 -0.30 +0.2 +0.05
Africa (average scores) 2016 Score
Trend 2007-2016
Annual average
trend
Trend 2012-2016
Annual average
trend
Human Rights Conventions 63.1 +14.9 +1.66 +5.1 +1.28
Africa (average scores) 2016 Score
Trend 2007-2016
Annual average
trend
Trend 2012-2016
Annual average
trend
Civil Liberties 44.1 -4.8 -0.53 -1.7 -0.43

56
2 Seychelles 77.5 +12.4 +1.38 +6.2 +1.554 Namibia 74.3 +15.3 +1.70 +11.6 +2.909 Tunisia 69.3 +5.4 +0.60 +3.4 +0.85
10 Burundi 69.0 +15.8 +1.76 +9.3 +2.3312 Zimbabwe 68.3 +16.8 +1.87 +10.9 +2.7313 Sierra Leone 68.1 +13.5 +1.50 +7.2 +1.8016 Zambia 65.6 +9.9 +1.10 +7.8 +1.9523 Ethiopia 60.6 +19.7 +2.19 +10.6 +2.6524 Kenya 59.8 +2.5 +0.28 +2.5 +0.6326 Gabon 58.3 +10.5 +1.17 +7.2 +1.8027 Togo 57.7 +9.6 +1.07 +4.9 +1.2328 Congo 57.2 +18.3 +2.03 +13.1 +3.2830 Angola 55.1 +4.1 +0.46 +4.6 +1.1535 Algeria 49.3 +8.5 +0.94 +3.8 +0.9543 Chad 40.9 +2.1 +0.23 +4.1 +1.0344 Sudan 40.8 +16.9 +1.88 +13.7 +3.4351 Egypt 30.9 +3.6 +0.40 +3.7 +0.9354 Somalia 18.2 +6.9 +0.77 +4.8 +1.20
1 Rwanda 87.3 +19.3 +2.14 +4.8 +1.203 Uganda 76.0 +8.1 +0.90 +0.1 +0.036 Madagascar 73.4 +12.2 +1.36 +3.9 +0.98
14 Benin 66.7 +9.2 +1.02 +3.7 +0.9319 Mozambique 64.8 +11.9 +1.32 +2.0 +0.5021 Senegal 62.7 +5.3 +0.59 +0.5 +0.1331 Nigeria 53.4 +7.1 +0.79 +1.4 +0.3539 Niger 44.6 +11.9 +1.32 +3.3 +0.83
5 South Africa 73.8 +0.9 +0.10 -1.4 -0.3517 Mauritius 65.4 +2.4 +0.27 -1.4 -0.3520 Malawi 64.6 +3.8 +0.42 -2.2 -0.5522 São Tomé & Príncipe 60.9 +0.8 +0.09 -1.1 -0.2825 Liberia 58.8 +0.6 +0.07 -3.7 -0.9332 Cameroon 51.3 +0.7 +0.08 -1.8 -0.4534 Central African Republic 50.4 +2.1 +0.23 -1.2 -0.3042 Equatorial Guinea 42.2 +6.3 +0.70 -2.3 -0.5845 Democratic Republic of Congo 40.5 +2.4 +0.27 -1.0 -0.2550 Guinea-Bissau 35.0 +2.2 +0.24 -2.1 -0.5353 Libya 27.3 +1.6 +0.18 -3.3 -0.83
7 Lesotho 72.4 -0.3 -0.03 +3.2 +0.8011 Tanzania 68.9 -0.6 -0.07 +2.2 +0.5529 Burkina Faso 56.9 -0.9 -0.10 0.0 0.0038 Morocco 44.7 -1.2 -0.13 +2.5 +0.6333 Côte d'Ivoire 51.0 -3.4 -0.38 -0.7 -0.1847 Mauritania 38.1 -2.9 -0.32 -0.5 -0.13
8 Cabo Verde 69.4 -4.4 -0.49 -6.5 -1.6315 Ghana 66.1 -1.2 -0.13 -3.4 -0.8518 Botswana 65.2 -5.0 -0.56 -3.2 -0.8036 Guinea 48.9 -6.5 -0.72 -6.8 -1.7037 Gambia 46.4 -13.0 -1.44 -10.7 -2.6840 Djibouti 44.0 -4.4 -0.49 -7.7 -1.9341 Eritrea 43.0 -7.7 -0.86 -6.9 -1.7345 Mali 40.5 -6.5 -0.72 -9.7 -2.4348 Comoros 36.4 -3.6 -0.40 -4.0 -1.0049 Swaziland 35.1 -5.1 -0.57 -7.6 -1.9052 South Sudan 28.7 . . +2.2 +0.55
AFRICAN AVERAGE 55.1 +3.9 +0.43 +1.3 +0.33N/A
Gender
2016 SCORE /100.0 ANNUAL AVERAGE TREND (2007-2016)
ANNUAL AVERAGE TREND (2012-2016)
5-YEAR TREND (2012-2016)
10-YEAR TREND (2007-2016)
2016 RANK /54
If Annual Average Trend appears the same in the two time periods, differences may exist beyond the 2nd decimal place.
Increasing Improvement Increasing Deterioration No ChangeSlowing Improvement Slowing DeteriorationWarning Signs Bouncing Back

57
2017 IIAG: Index Report
Despite Laws on Violence against Women being on average the eighth largest improver of all indicators in the IIAG over the past ten years, Africa’s score has declined in the last five. While over the decade 28 countries improve, the same number of countries decline in the recent five years. ‘Warning Signs’ emerge in 18 countries, which despite improving over ten years have declined in the last five.
‘Warning Signs’
Malawi, Mauritius, Rwanda, Seychelles, Zambia and Zimbabwe decline in the last five years, contributing the ‘Slowing Improvement’ of the African average score.
Women’s Political Participation progress is slowing down, driven by declines in almost half the continent (26 countries) in recent years. Declines of more than -10.0 points in Benin, Cabo Verde, Central African Republic, Comoros, Lesotho, Malawi, Nigeria and Seychelles drive down the African average. Eight countries, including Tanzania and Senegal, though still improving over the decade register decline in the last five years, contributing to the average slowing progress.
In Gender Balance in Education, 38 countries manage to improve scores over the decade. However, eight of these; Ethiopia, Kenya,
‘Slowing Improvement’
(28 countries) remains static. Sudan displays a stand out performance, receiving the best possible score of 100.0 in 2016 having strengthened its scores at the fastest rate in both time periods.
Gender Equality and Women in the Judiciary register an overall decline over the decade which worsens over the last five years. In the former, large and increasing declines in Guinea-Bissau, Eritrea, Mauritania and Mali outweigh the notable gains made in countries like Zimbabwe and Rwanda.
In Women in the Judiciary, polarising performance is evident with 16 countries displaying ‘Increasing Deterioration’ and nine countries displaying ‘Increasing Improvement’, while over half of the continent
‘Increasing Deterioration’
improvement in the IIAG since 2012, driven by 20 countries that display ‘Increasing Improvement’. However, this masks the fact that almost half of the continent (26 countries) show no change over the two time-periods.
In Women’s Political Empowerment, just over half the continent (28 countries) increase their pace of progress over the last five years, with the largest improvement seen in Algeria (+32.7). However, this indicator-level progress masks some concerning trends among the ten countries declining over a decade, as nine of these show increasing decline in the last five years, Egypt (-15.3) being the largest of these.
In Women’s Labour Force Participation 10 countries show signs of reversing a decade decline, which along with seven countries that register ‘Increasing Improvement’ drive the average indicator-level improvement.
Workplace Gender Equality registers the third largest indicator-level
‘Increasing Improvement’
The continental average score for Gender (55.1 out of 100.0) still makes it the highest scoring sub-category in Participation & Human Rights in 2016. Since the first year of the IIAG time-series (2000) Gender score, on average, has gone from strength-to-strength, improving each year and reaching its peak in 2016. Looking at the recent trend in the last five years, Gender is still showing the largest improvement, yet progress looks to be slowing. Five out of eight underlying indicators are holding up further progress at sub-category level.
Gender: progress is faltering
2007 2008 2009 2010 2011 2012 2013 2014 2015 2016 Year
‘Slowing Improvement’
Africa: Gender average score (2007-2016)
51.251.5
52.4
53.6 53.854.1
54.5
55.0 55.1
Annual average trend (2007-2016), +0.43
Annual average trend (2012-2016), +0.33
Score
53.4
49.0
0.0
50.0
51.0
52.0
100.0
53.0
54.0
56.0
55.0
Continental indicator performance
Africa (average scores) 2016 Score
Trend 2007-2016
Annual average
trend
Trend 2012-2016
Annual average
trend
Workplace Gender Equality 43.1 +8.2 +0.91 +8.4 +2.10
Women's Political Empowerment
67.2 +5.5 +0.61 +2.6 +0.65
Women's Labour Force Participation
60.3 +1.2 +0.13 +0.7 +0.18
Africa (average scores) 2016 Score
Trend 2007-2016
Annual average
trend
Trend 2012-2016
Annual average
trend
Gender Balance in Education 71.1 +7.0 +0.78 +1.8 +0.45
Women's Political Participation
40.6 +5.8 +0.64 +1.6 +0.40
Africa (average scores) 2016 Score
Trend 2007-2016
Annual average
trend
Trend 2012-2016
Annual average
trend
Laws on Violence against Women
44.4 +9.5 +1.06 -2.7 -0.68
Africa (average scores) 2016 Score
Trend 2007-2016
Annual average
trend
Trend 2012-2016
Annual average
trend
Women in the Judiciary 58.3 -3.0 -0.33 -1.9 -0.48
Gender Equality 57.0 -0.3 -0.03 -0.4 -0.10

Does a change in leadership result in improved governance?
The majority of countries where leadership has changed show strengthened Overall Governance scores. However some countries show concerning trends.
Over the past decade, 33 African countries have seen a change of leadership. The majority of these (20) score higher than the continental average score in 2016 for Overall Governance (50.8). Eight out of the top ten scoring countries in 2016 have changed leadership since 2007. Conversely, of the ten lowest scoring countries at the Overall Governance level, only three have had a change in leadership over the past decade: Central African Republic, Libya and Somalia.
Twenty-three countries that have had a change of leadership since 2007 (out of 33), have seen advances in Overall Governance during this period. Further, of the 18 countries on the continent that have shown ‘Increasing Improvement’ over the last five years at the Overall Governance level, the majority (ten countries) have had a change of leadership since 2007: Côte d’Ivoire, Egypt, Guinea-Bissau, Kenya, Namibia, Nigeria, Senegal, Somalia, Tanzania and Tunisia. Amongst these are five of the most improved countries on the continent since 2012: Côte d’Ivoire (+8.2), Kenya (+4.9), Namibia (+4.0), Tunisia (+3.6) and Nigeria (+3.3).
All three countries that are ‘Bouncing Back’ (showing a positive trend in the last five years despite still registering decline over the last ten) at the Overall Governance level have seen a change of leadership over the past decade.
However, five out of the ten countries on the continent showing ‘Warning Signs’ (decline in the last five years despite improvement over ten) have seen a change in leadership: Mauritius, Cabo Verde, Zambia, Sierra Leone and Malawi.
Out of the eight countries on the continent that have shown ‘Increasing Deterioration’, countries that have changed leaders dominate this list (seven out of eight): Botswana, Central African Republic, Gambia, Ghana, Libya, Mauritania and Mozambique. Although in Gambia and Ghana, change has been too recent to fully evaluate results, whilst Central African Republic and Libya remain in deep crises.
Overall Governance, top ten scoring countries (2016)
Number of countries per classification at Overall Governance level
Countries ScoreMauritius 81.4Seychelles 73.4Botswana 72.7Cabo Verde 72.2Namibia 71.2South Africa 70.1Tunisia 65.5Ghana 65.0Rwanda 63.9Senegal 61.6
Countries that have seen a change in leader between 2007 to 2016.
Classification Changed Leadership (2007-2016)
Same Leadership (2007-2016)
Total
Increasing Improvement 10 8 18
Slowing Improvement 8 5 13
Warning Signs 5 5 10
Bouncing Back 3 0 3
Slowing Deterioration 0 1 1
Increasing Deterioration 7 1 8
Three countries whose leaders became Ibrahim Prize laureates, President Festus Mogae from Botswana (2008), President Pedro De Verona Rodrigues Pires from Cabo Verde (2011) and President Joaquim Alberto Chissano from Mozambique (2007), now show wavering signs in their Overall Governance performance. This signals the need for both quality leadership and good governance to secure sustained progress.
58
SPOTLIGHT #01

Protection against Discrimination: a new indicator in the IIAG
For the first time since its inception, the IIAG includes a measure capturing the extent to which governments protect citizens and minorities against discrimination. This new indicator, Protection against Discrimination, sits in the sub-category Rights, and aims to reinforce the human rights component of this sub-category.
Protection against Discrimination is composed of two different variables compiled using data from Global Integrity’s Africa Integrity Indicators (AII), Protection against Ethnic Discrimination and Protection against Religious Discrimination. Both variables measure whether governments protect minorities from discrimination, including the existence of official mechanisms that receive and investigate complaints of discrimination, of programmes to reduce and combat discrimination, and whether these are accessible by minority groups.
The data are available from source from 2013 to 2016. Registering an average continental score of 22.0 out of 100.0 points in 2016, Protection against Discrimination is the lowest scoring indicator in Participation & Human Rights and the fifth lowest of the 100 indicators in the IIAG. However, the indicator has shown the fourth largest improvement (+7.4) in Participation & Human Rights since 2013.
Mauritius and South Africa are the two highest scoring countries in Protection against Discrimination, both registering 75.0 points in 2016. They are also the only two countries registering a score higher than 50.0. Conversely, 19 countries obtain a score of 0.0 in 2016. Of these, five have deteriorated to that score in the past five years: Burundi, Congo, Gabon, Guinea and Guinea-Bissau.
Of the two sub-indicators, the average continental score in Protection against Ethnic Discrimination is slightly lower (20.4) than in Protection against Religious Discrimination (23.6).
The Mo Ibrahim Foundation looks forward to the strengthening and extension of data measuring the whole spectrum of human rights for future inclusion in the IIAG.
59
SPOTLIGHT #02


SustainableEconomic Opportunity
Public Management
Business Environment
Infrastructure
Rural Sector

62
2 Morocco 68.2 +10.9 +1.21 +9.3 +2.337 Namibia 64.2 +4.6 +0.51 +3.5 +0.88
10 Egypt 57.8 +6.7 +0.74 +7.7 +1.9311 Kenya 57.2 +6.1 +0.68 +4.1 +1.0316 Uganda 50.9 +1.2 +0.13 +2.4 +0.6017 Côte d'Ivoire 50.0 +8.9 +0.99 +7.9 +1.9825 Niger 46.7 +8.4 +0.93 +6.0 +1.5031 Cameroon 44.3 +1.1 +0.12 +1.5 +0.3832 São Tomé & Príncipe 44.1 +2.7 +0.30 +3.3 +0.8334 Nigeria 42.3 +4.1 +0.46 +2.1 +0.5335 Togo 41.4 +11.2 +1.24 +7.6 +1.9041 Zimbabwe 37.2 +12.2 +1.36 +9.9 +2.4842 Sudan 37.0 +0.1 +0.01 +1.2 +0.3044 Comoros 35.6 +3.4 +0.38 +3.3 +0.8345 Democratic Republic of Congo 31.4 +1.6 +0.18 +1.3 +0.3350 Equatorial Guinea 28.3 +2.6 +0.29 +3.3 +0.83
1 Mauritius 79.4 +9.9 +1.10 +0.6 +0.153 Rwanda 67.7 +10.8 +1.20 +2.7 +0.685 Seychelles 65.0 +7.6 +0.84 +1.4 +0.358 Cabo Verde 60.6 +2.9 +0.32 +0.1 +0.03
12 Senegal 54.9 +3.7 +0.41 +0.6 +0.1521 Swaziland 48.8 +2.8 +0.31 +0.3 +0.0829 Gabon 44.7 +6.0 +0.67 +1.1 +0.2836 Liberia 39.6 +7.2 +0.80 +2.6 +0.6537 Congo 39.2 +4.7 +0.52 +1.2 +0.3049 Guinea-Bissau 28.8 +1.8 +0.20 +0.5 +0.1313 Gambia 51.8 +2.6 +0.29 -3.7 -0.9318 Mali 49.7 +3.2 +0.36 0.0 0.0020 Zambia 48.9 +1.2 +0.13 -1.9 -0.4822 Mozambique 48.1 +1.7 +0.19 0.0 0.0023 Burkina Faso 47.8 +0.2 +0.02 -2.5 -0.6324 Benin 47.4 +0.6 +0.07 -0.5 -0.1330 Djibouti 44.4 +1.9 +0.21 -0.4 -0.1039 Burundi 38.0 +0.2 +0.02 -0.9 -0.2346 Chad 30.8 +1.6 +0.18 -0.5 -0.1347 Central African Republic 30.0 +1.3 +0.14 -5.3 -1.3348 Angola 29.4 +1.0 +0.11 -3.3 -0.8354 Somalia 6.6 +2.4 +0.27 -0.4 -0.1019 Tanzania 49.5 -1.3 -0.14 +3.4 +0.8542 Guinea 37.0 -0.9 -0.10 +0.8 +0.2051 Eritrea 21.6 -4.8 -0.53 +0.5 +0.13
4 South Africa 67.6 -0.7 -0.08 -0.1 -0.039 Tunisia 58.2 -3.1 -0.34 -0.1 -0.03
14 Algeria 51.1 -4.2 -0.47 -0.5 -0.1340 Madagascar 37.9 -8.8 -0.98 -2.5 -0.63
6 Botswana 64.6 -2.8 -0.31 -3.5 -0.8814 Ghana 51.1 -2.0 -0.22 -2.2 -0.5526 Lesotho 46.5 -0.7 -0.08 -2.4 -0.6027 Malawi 45.9 -3.7 -0.41 -3.1 -0.7828 Ethiopia 45.0 -2.7 -0.30 -2.7 -0.6833 Mauritania 43.1 -1.7 -0.19 -5.0 -1.2538 Sierra Leone 38.5 -2.9 -0.32 -6.5 -1.6352 Libya 21.5 -23.8 -2.64 -16.3 -4.0853 South Sudan 17.8 . . -6.6 -1.65
AFRICAN AVERAGE 45.1 +1.3 +0.14 +0.4 +0.10N/A
2016 SCORE /100.0 ANNUAL AVERAGE TREND (2007-2016)
ANNUAL AVERAGE TREND (2012-2016)
5-YEAR TREND (2012-2016)
10-YEAR TREND (2007-2016)
2016 RANK /54
Sustainable Economic Opportunity If Annual Average Trend appears the same in the two time periods, differences may exist beyond the 2nd decimal place.
Increasing Improvement Increasing Deterioration No ChangeSlowing Improvement Slowing DeteriorationWarning Signs Bouncing Back

63
2017 IIAG: Index Report
2016SCORE
AAT (2012-2016)
AAT* (2007-2016)
ZimbabweTogoMoroccoRwandaMauritiusCôte d'IvoireNigerSeychellesLiberiaEgyptKenyaGabonCongoNamibiaNigeriaSenegalComorosMaliCabo VerdeSwazilandSão Tomé & PríncipeEquatorial GuineaGambiaSomaliaDjiboutiGuinea-BissauMozambiqueDRCChadCARUgandaZambiaCameroonAngolaBeninBurkina FasoBurundiSudanSouth AfricaLesothoGuineaTanzaniaMauritaniaGhanaEthiopiaBotswanaSierra LeoneTunisiaMalawiAlgeriaEritreaMadagascarLibyaSouth Sudan
+1.36 +2.48 37.2+1.24 +1.90 41.4+1.21 +2.33 68.2+1.20 +0.68 67.7+1.10 +0.15 79.4+0.99 +1.98 50.0+0.93 +1.50 46.7+0.84 +0.35 65.0+0.80 +0.65 39.6+0.74 +1.93 57.8+0.68 +1.03 57.2+0.67 +0.28 44.7+0.52 +0.30 39.2+0.51 +0.88 64.2+0.46 +0.53 42.3+0.41 +0.15 54.9+0.38 +0.83 35.6+0.36 0.00 49.7+0.32 +0.03 60.6+0.31 +0.08 48.8+0.30 +0.83 44.1+0.29 +0.83 28.3+0.29 -0.93 51.8+0.27 -0.10 6.6+0.21 -0.10 44.4+0.20 +0.13 28.8+0.19 0.00 48.1+0.18 +0.33 31.4+0.18 -0.13 30.8+0.14 -1.33 30.0+0.13 +0.60 50.9+0.13 -0.48 48.9+0.12 +0.38 44.3+0.11 -0.83 29.4+0.07 -0.13 47.4+0.02 -0.63 47.8+0.02 -0.23 38.0+0.01 +0.30 37.0-0.08 -0.03 67.6-0.08 -0.60 46.5-0.10 +0.20 37.0-0.14 +0.85 49.5-0.19 -1.25 43.1-0.22 -0.55 51.1-0.30 -0.68 45.0-0.31 -0.88 64.6-0.32 -1.63 38.5-0.34 -0.03 58.2-0.41 -0.78 45.9-0.47 -0.13 51.1-0.53 +0.13 21.6-0.98 -0.63 37.9-2.64 -4.08 21.5
. -1.65 17.8
10-year & 5-year annual average trends
As South Sudan does not have data prior to 2011, no trends over the ten-year period are available for that country.
ANNUAL AVERAGE TREND
Improvement since 2007Improvement since 2012
Deterioration since 2007Deterioration since 2012
* AAT: Annual Average Trend
Countries ordered by size of the 10-year trend.
0.00 +2.00-2.00-4.00-6.00 +4.00

64
Sustainable Economic Opportunity: progress has slowed on average over the last five years, but is picking up pace again very recently
The African average score for Sustainable Economic Opportunity has improved by +1.3 score points over the past ten years, increasing from 43.8 (out of 100.0) in 2007 to 45.1 in 2016. However, Africa’s average score in 2016 remains slightly lower that its 2010 peak of 45.3.
Although over the last decade, the continent has improved at an annual average rate of +0.14 points in the last five years, the pace has somewhat slackened, with improvement falling to an annual pace of +0.10. The slower progress over the last five years is mainly due to a drop in score between 2012 and 2014. Progress appears to be back on track since 2014.
Over the decade, the continental improvement has been largely driven by Infrastructure (at an annual average trend of +0.61) and, to a lesser extent, Rural Sector (at an annual average trend of +0.23). Public Management and Business Environment have held back the continental average progress, declining at average annual rates of -0.19 and -0.07, respectively.
Over the past five years, the ‘Slowing Improvement’ in Sustainable Economic Opportunity appears mostly due to concerning trends in Rural Sector and Business Environment. Rural Sector displays ‘Warning Signs’, with an average yearly decline of -0.13 points in the last five years, while Business Environment is ‘Increasing Deterioration’, at an average yearly rate of -0.10 in the last five years compared to -0.07 in the longer term.
Meanwhile, positively, Infrastructure displays ‘Increasing Improvement’, at an average annual rate that is slightly larger (+0.65) than over the decade, and Public Management registers ‘Slowing Deterioration’ with an annual average trend of -0.08, less than half the pace of decline seen over the decade.
Africa: Sustainable Economic Opportunity average score (2007-2016)
2007 2008 2009 2010 2011 2012 2013 2014 2015 2016 Year
43.8
44.4
45.045.3
44.7 44.744.9
44.4
44.845.1
Annual average trend (2007-2016), +0.14
Annual average trend (2012-2016), +0.10
42.0
0.0
43.0
44.0
45.0
100.0
46.0
Score
‘Slowing Improvement’
2007 2008 2009 2010 2011 2012 2013 2014 2015 2016 Trend 2007-2016
Annual average
trend
Trend 2012-2016
Annual average
trend
SUSTAINABLE ECONOMIC OPPORTUNITY
43.8 44.4 45.0 45.3 44.7 44.7 44.9 44.4 44.8 45.1 +1.3 +0.14 +0.4 +0.10 Slowing Improvement
PUBLIC MANAGEMENT 46.6 46.3 46.0 46.1 45.0 45.2 45.6 44.8 44.8 44.9 -1.7 -0.19 -0.3 -0.08 Slowing Deterioration
BUSINESS ENVIRONMENT 44.1 44.3 44.4 44.9 44.5 43.9 43.6 42.8 43.1 43.5 -0.6 -0.07 -0.4 -0.10 Increasing Deterioration
INFRASTRUCTURE 35.8 36.9 37.9 38.3 38.1 38.7 39.0 40.1 40.8 41.3 +5.5 +0.61 +2.6 +0.65 Increasing Improvement
RURAL SECTOR 49.4 51.2 52.6 52.7 52.2 52.0 52.3 50.6 51.5 51.5 +2.1 +0.23 -0.5 -0.13 Warning Signs
Africa (Average scores)Score / 100.0; 100.0=best

65
2017 IIAG: Index Report
Over the past ten years, 38 countries have improved their score for Sustainable Economic Opportunity, while 15 countries have deteriorated. However, in the last five-year period only 29 countries were able to register improvement, despite more countries (35) showing gains since 2014, mirroring the African average improvement since then.
Of the 38 countries that improved over the past ten years, only 16 managed to accelerate their pace of improvement in the past five. The other 22 are either ‘Slowing Improvement’ (10) or showing ‘Warning Signs’ (12).
53 African countries 54 African countries, including South Sudan
10-year trend (2007-2016)
5-year trend (2012-2016)
Countries with an improved score 38 29
Countries with a deteriorated score 15 23
Countries with no score change 0 2
Sustainable Economic Opportunity: countries’ recent trends
Classification # countries
Increasing Improvement 16
Slowing Improvement 10
Warning Signs 12
Bouncing Back 3
Slowing Deterioration 4
Increasing Deterioration 8
In the group of countries showing ‘Increasing Improvement’ over the last five years, Morocco and Zimbabwe are both picking up speed at an impressive rate of more than +2.00 points per year on average, although they achieve vastly different scores. Zimbabwe
scores 37.2, below the African average and ranking 41st, whilst Morocco ranks 2nd with a score of 68.2. Morocco, Namibia (7th) and Egypt (10th) are in fact the only top ten performing countries to be increasing their rate of improvement over the past five years.
‘Increasing Improvement’: 16 countries
Morocco: Sustainable Economic Opportunity score (2007-2016)
2007 2008 2009 2010 2011 2012 2013 2014 2015 2016 Year
57.356.5
57.6 57.6 57.8
58.964.3
67.0 68.1 68.2
Annual average trend (2007-2016), +1.21
Annual average trend (2012-2016), +2.33
Score
70.0
68.0
66.0
64.0
62.0
60.0
58.0
56.0
0.0
100.0
‘Increasing Improvement’

66
Rather concerning is the fact that almost half of the ten highest scoring countries in Sustainable Economic Opportunity are registering ‘Slowing Improvement’: Mauritius (1st), Rwanda (3rd), Seychelles (5th) and Cabo Verde (8th). Rwanda, the fourth largest improver over the past ten years (an average annual rate of +1.20), slows down to nearly half that rate over the past five years (+0.68).
Meanwhile, despite maintaining an improved performance over the last decade, 12 countries display ‘Warning Signs’, showing a decline in the latest five years.
This group includes Angola, one of Africa’s ten largest economies in terms of Gross Domestic Product (GDP). The country has marginally increased its Sustainable Economic Opportunity score over the last decade but in the last five years has declined by -0.83 points per year on average, almost completely reversing any gains made earlier in the past decade.
‘Slowing Improvement’ & ‘Warning Signs’: 22 countries
Three out of the 15 countries with a deteriorated score over the last ten years have managed to display a positive trend over the last five years: Tanzania, Guinea and Eritrea.
Tanzania exhibits a robust performance over the recent five-year period. Within an average annual deterioration over the last ten years of -0.14, the magnitude of Tanzania’s positive five-year
average annual trend is more than six times larger (+0.85) than that of the decade.
Of the 12 countries that have experienced a decline both during the past ten and five years, four have also managed to slow their pace of deterioration over the past five: Algeria, Madagascar, South Africa and Tunisia.
‘Bouncing Back’ & ‘Slowing Deterioration’: 7 countries
Tanzania: Sustainable Economic Opportunity score (2007-2016)
2007 2008 2009 2010 2011 2012 2013 2014 2015 2016 Year
50.8
52.5
51.4
50.7
49.2
46.148.6
48.9
48.6
49.5
Annual average trend (2007-2016), -0.14
Annual average trend (2012-2016), +0.8554.0
52.0
50.0
48.0
46.0
44.0
0.0
100.0
Score
‘Bouncing Back’

67
2017 IIAG: Index Report
More worrying still, is the fact that eight of the countries to show decline over the last decade have increased their annual pace of deterioration even further over the last five years: Botswana, Ethiopia, Ghana, Lesotho, Libya, Malawi, Mauritania and Sierra Leone.
Ethiopia, another of Africa’s ten largest economies in terms of GDP, shows the tenth largest decline on the continent in Sustainable Economic Opportunity in the last five years. Ethiopia’s score showed early gains in the first part of this period yet has declined to such an extent in recent years that its annual average trend over the last five years is -0.68.
‘Increasing Deterioration’: 8 countries
Angola: Sustainable Economic Opportunity score (2007-2016)
2007 2008 2009 2010 2011 2012 2013 2014 2015 2016 Year
28.4
29.1 31.5
32.5 32.332.7
30.630.1
30.6
29.4
Annual average trend (2007-2016), +0.11
Annual average trend (2012-2016), -0.83
26.0
0.0
28.0
30.0
32.0
100.0
34.0
Score
‘Warning Signs’
Ethiopia: Sustainable Economic Opportunity score (2007-2016)
2007 2008 2009 2010 2011 2012 2013 2014 2015 2016 Year
47.7
49.2
47.0
47.848.4
47.7
51.9
45.9
46.4
45.0
Annual average trend (2007-2016), -0.30
Annual average trend (2012-2016), -0.68
Score
44.0
0.0
46.0
48.0
50.0
100.0
54.0
52.0
‘Increasing Deterioration’

68
3 Tunisia 67.2 +0.1 +0.01 +1.3 +0.339 Rwanda 59.0 +3.6 +0.40 +2.0 +0.50
13 Seychelles 52.2 +16.6 +1.84 +9.1 +2.2814 Ethiopia 52.1 +5.7 +0.63 +2.7 +0.6816 Mali 50.8 +2.7 +0.30 +1.9 +0.4818 Guinea 49.9 +2.6 +0.29 +3.4 +0.8519 Côte d'Ivoire 49.1 +6.5 +0.72 +3.9 +0.9829 Togo 46.4 +8.5 +0.94 +4.5 +1.1338 Liberia 39.9 +1.2 +0.13 +0.6 +0.1541 Sudan 38.3 +3.7 +0.41 +4.5 +1.1343 Chad 36.7 +1.7 +0.19 +1.7 +0.43
2 Mauritius 68.2 +6.6 +0.73 +1.0 +0.2535 Zimbabwe 42.2 +19.4 +2.16 +7.0 +1.7536 Democratic Republic of Congo 41.9 +3.4 +0.38 +0.4 +0.1010 Burkina Faso 56.3 0.0 0.00 -3.7 -0.9312 Lesotho 54.9 +2.9 +0.32 -0.3 -0.0817 Mozambique 50.1 +0.7 +0.08 -2.6 -0.6519 Mauritania 49.1 +5.7 +0.63 -0.5 -0.1337 Djibouti 40.1 +0.7 +0.08 -1.9 -0.4847 Comoros 30.2 +2.6 +0.29 -2.8 -0.70
4 Morocco 65.1 -3.1 -0.34 +4.6 +1.155 Senegal 61.3 -1.0 -0.11 +3.6 +0.908 Cabo Verde 59.8 -6.2 -0.69 +0.8 +0.20
11 Kenya 55.7 -1.0 -0.11 +1.1 +0.2822 Uganda 47.9 -2.8 -0.31 +2.0 +0.5023 Tanzania 47.8 -3.9 -0.43 +1.0 +0.2525 Egypt 47.7 -2.9 -0.32 +4.7 +1.1826 Ghana 47.6 -4.3 -0.48 +1.3 +0.3327 Benin 47.4 -1.8 -0.20 +1.3 +0.3331 Cameroon 44.0 -4.0 -0.44 +2.0 +0.5032 Sierra Leone 43.8 -0.2 -0.02 +1.9 +0.4834 Madagascar 43.2 -8.1 -0.90 +1.1 +0.2850 Equatorial Guinea 23.9 -4.1 -0.46 +2.3 +0.5854 Somalia 5.7 -0.5 -0.06 +0.5 +0.13
1 South Africa 72.0 -11.6 -1.29 -1.9 -0.486 Namibia 60.9 -1.5 -0.17 -0.3 -0.08
21 Malawi 48.8 -3.7 -0.41 -0.7 -0.1823 Algeria 47.8 -6.4 -0.71 -2.8 -0.7039 Swaziland 39.0 -14.1 -1.57 -4.5 -1.1340 São Tomé & Príncipe 38.9 -5.8 -0.64 -0.2 -0.0551 Eritrea 21.8 -4.6 -0.51 -0.9 -0.23
7 Botswana 60.3 -11.4 -1.27 -7.0 -1.7515 Zambia 51.9 -1.1 -0.12 -1.1 -0.2827 Nigeria 47.4 -0.2 -0.02 -0.6 -0.1530 Niger 45.6 -1.3 -0.14 -5.4 -1.3532 Gambia 43.8 -3.2 -0.36 -3.1 -0.7842 Burundi 38.2 -1.4 -0.16 -2.0 -0.5044 Congo 34.6 -4.1 -0.46 -7.3 -1.8345 Gabon 34.1 -7.1 -0.79 -4.5 -1.1346 Central African Republic 32.9 -4.9 -0.54 -8.5 -2.1347 Angola 30.2 -1.0 -0.11 -4.7 -1.1849 Guinea-Bissau 26.9 -3.1 -0.34 -3.1 -0.7853 Libya 15.5 -27.2 -3.02 -13.0 -3.2552 South Sudan 19.6 . . -4.7 -1.18
AFRICAN AVERAGE 44.9 -1.7 -0.19 -0.3 -0.08N/A
Public Management
2016 SCORE /100.0 ANNUAL AVERAGE TREND (2007-2016)
ANNUAL AVERAGE TREND (2012-2016)
5-YEAR TREND (2012-2016)
10-YEAR TREND (2007-2016)
2016 RANK /54
If Annual Average Trend appears the same in the two time periods, differences may exist beyond the 2nd decimal place.
Increasing Improvement Increasing Deterioration No ChangeSlowing Improvement Slowing DeteriorationWarning Signs Bouncing Back

69
2017 IIAG: Index Report
Public Management: decline is slowing
Albeit still declining, the African average score for Public Management has more than halved its pace of deterioration over the past five years. This slowing deterioration is reflected in Africa’s trajectory in the Public Management indicators. Over the last five years, three out of the nine underlying indicators have started to bounce back, one has slowed its deterioration and three more have increased their pace of improvement.
While registering decline over the decade, the three indicators Civil Registration, Public Administration and Diversification all manage to improve at African average level over the past five years. Despite ‘Bouncing Back’, Diversification remains Africa’s lowest scoring indicator of the 100 in the IIAG. In the case of Civil Registration, improvement has been driven by five countries: Burundi, Ghana, Guinea, Mali and Togo. All other countries have either deteriorated (three countries) or shown no score change (46 countries) in the five-year period.
Governmental Statistical Capacity, Budget Management and Transparency of State-owned Companies have all managed to quicken their pace of improvement over the last five years, thus contributing to the slowing deterioration of Public Management on the continent over the past five years. Transparency of State-owned Companies has been the most improved indicator in Public Management in the five-year period (+1.9). Despite this, the African average score for this indicator is still the second lowest in the IIAG in 2016 (with a score of 14.4 out of 100.0). Only 11 countries have shown a positive trend in the recent period, while
A slowing positive trend for Revenue Mobilisation and increasing decline in Fiscal Policy prevent further progress in Public Management. The Fiscal Policy trend is concerning, with 11 countries having increased their deterioration in the five- year period, the worst being Nigeria (-43.6), Gambia (-38.0) and Mozambique (-32.6).
‘Bouncing Back’ & ‘Slowing Deterioration’
‘Increasing Improvement’
‘Slowing Improvement’ & ‘Increasing Deterioration’
Africa: Public Management average score (2007-2016)
2007 2008 2009 2010 2011 2012 2013 2014 2015 2016 Year
46.646.3
46.0 46.1
45.045.2
45.6
44.8 44.8 44.9
Annual average trend (2007-2016), -0.19
Annual average trend (2012-2016), -0.08
Score
43.0
0.0
44.0
45.0
46.0
100.0
47.0
‘Slowing Deterioration’
On the other hand, although Budget Balance has slowed its deterioration, 29 countries still register a deteriorating score in the most recent period.
35 countries have experienced no score change. Of those 35 countries, 26 scored 0.0 in 2016.
Continental indicator performance
If Annual Average Trend appears the same in the two time periods, differences may exist beyond the 2nd decimal place.
Africa (average scores) 2016 Score
Trend 2007-2016
Annual average
trend
Trend 2012-2016
Annual average
trend
Civil Registration 59.7 0.0 0.00 +0.4 +0.10
Diversification 9.4 -2.8 -0.31 +0.4 +0.10
Public Administration 57.2 -1.9 -0.21 +0.3 +0.08
Budget Balance 43.4 -16.0 -1.78 -4.5 -1.13
Africa (average scores) 2016 Score
Trend 2007-2016
Annual average
trend
Trend 2012-2016
Annual average
trend
Governmental Statistical Capacity
56.4 +2.5 +0.28 +1.2 +0.30
Budget Management 57.7 +1.7 +0.19 +1.0 +0.25
Transparency of State-owned Companies
14.4 +1.7 +0.19 +1.9 +0.48
Africa (average scores) 2016 Score
Trend 2007-2016
Annual average
trend
Trend 2012-2016
Annual average
trend
Revenue Mobilisation 46.9 +3.4 +0.38 +1.5 +0.38
Fiscal Policy 60.0 -3.7 -0.41 -4.9 -1.23

70
3 South Africa 70.5 +4.0 +0.44 +4.0 +1.005 Namibia 66.4 +3.6 +0.40 +5.0 +1.257 Morocco 60.4 +6.8 +0.76 +3.5 +0.888 Niger 58.6 +17.7 +1.97 +10.1 +2.53
11 Côte d'Ivoire 57.3 +12.5 +1.39 +9.9 +2.4812 Kenya 56.5 +7.3 +0.81 +8.4 +2.1022 São Tomé & Príncipe 47.7 +7.5 +0.83 +4.5 +1.1330 Togo 42.5 +11.5 +1.28 +9.5 +2.3831 Liberia 41.7 +3.6 +0.40 +3.8 +0.9533 Algeria 40.2 +0.6 +0.07 +10.0 +2.5034 Nigeria 39.6 +2.0 +0.22 +2.3 +0.5843 Democratic Republic of Congo 32.1 +2.0 +0.22 +5.1 +1.2844 Guinea-Bissau 30.8 +8.1 +0.90 +6.4 +1.6045 Comoros 30.1 +10.9 +1.21 +12.1 +3.0347 Zimbabwe 23.6 +1.1 +0.12 +3.0 +0.7548 Equatorial Guinea 23.1 +3.7 +0.41 +5.5 +1.38
1 Rwanda 83.0 +16.8 +1.87 +0.7 +0.186 Uganda 60.5 +6.0 +0.67 +2.6 +0.65
13 Benin 53.5 +1.8 +0.20 +0.2 +0.0519 Mali 49.7 +2.3 +0.26 +0.2 +0.0525 Djibouti 46.8 +5.8 +0.64 +0.8 +0.2029 Central African Republic 43.3 +3.4 +0.38 +1.0 +0.2510 Senegal 57.6 +4.3 +0.48 -0.5 -0.1317 Burkina Faso 52.1 +1.8 +0.20 -2.6 -0.6518 Zambia 50.7 +0.7 +0.08 -6.2 -1.5524 Gabon 46.9 +3.4 +0.38 0.0 0.0036 Guinea 38.3 +0.2 +0.02 -0.7 -0.1840 Chad 35.2 +2.4 +0.27 -0.6 -0.15
9 Ghana 58.5 -1.7 -0.19 +1.1 +0.2816 Tanzania 52.2 -2.2 -0.24 +1.4 +0.3521 Egypt 48.0 0.0 0.00 +9.1 +2.2823 Cameroon 47.1 -5.2 -0.58 0.0 0.0038 Burundi 37.8 -1.0 -0.11 +2.5 +0.6341 Congo 35.0 -1.3 -0.14 +2.0 +0.5053 Eritrea 7.3 -2.4 -0.27 +0.4 +0.1054 Somalia 0.7 0.0 0.00 +0.3 +0.0832 Tunisia 40.9 -18.7 -2.08 -7.5 -1.8842 Madagascar 34.3 -13.6 -1.51 -3.9 -0.98
2 Mauritius 77.9 -3.6 -0.40 -8.5 -2.134 Botswana 68.7 -0.7 -0.08 -4.1 -1.03
14 Gambia 52.9 -2.9 -0.32 -4.1 -1.0315 Seychelles 52.6 -7.5 -0.83 -6.4 -1.6020 Cabo Verde 48.7 -4.8 -0.53 -7.9 -1.9826 Swaziland 46.6 -3.0 -0.33 -2.1 -0.5327 Malawi 45.9 -6.2 -0.69 -3.8 -0.9528 Mozambique 44.3 -2.3 -0.26 -3.9 -0.9835 Sierra Leone 38.8 -3.7 -0.41 -8.7 -2.1837 Lesotho 38.2 -10.7 -1.19 -14.3 -3.5839 Mauritania 35.3 -13.1 -1.46 -9.7 -2.4345 Ethiopia 30.1 -16.9 -1.88 -13.7 -3.4349 Sudan 20.4 -9.7 -1.08 -10.0 -2.5050 Angola 19.9 -4.0 -0.44 -11.2 -2.8052 Libya 11.7 -22.2 -2.47 -14.4 -3.6051 South Sudan 16.3 . . -0.8 -0.20
AFRICAN AVERAGE 43.5 -0.6 -0.07 -0.4 -0.10N/A
Business Environment
2016 SCORE /100.0 ANNUAL AVERAGE TREND (2007-2016)
ANNUAL AVERAGE TREND (2012-2016)
5-YEAR TREND (2012-2016)
10-YEAR TREND (2007-2016)
2016 RANK /54
If Annual Average Trend appears the same in the two time periods, differences may exist beyond the 2nd decimal place.
Increasing Improvement Increasing Deterioration No ChangeSlowing Improvement Slowing DeteriorationWarning Signs Bouncing Back

71
2017 IIAG: Index Report
Business Environment: quickening deterioration over the last five years but recent signs of recovery
The African average for Business Environment registers decline in both time periods, with an increasing pace of deterioration over the past five years (at an annual average rate of -0.10 compared to -0.07 over the decade). Over the last five years, two out of the seven underlying indicators of this sub-category have increased their deterioration and one has shown ‘Warning Signs’, threatening to reverse a sizeable ten-year positive trend.
Business Environment accelerates its pace of decline over the past five years, driven by the negative trajectories of Business Bureaucracy & Red Tape and Soundness of Banks. Particularly, Soundness of Banks has been the most deteriorated indicator in the entire IIAG both over the last ten and five years (at an annual average rate of -3.40 compared to -2.57 in the ten-year period).
More positively, further deterioration in Business Environment is stopped by stronger progress in Investment Climate, Employment Creation and Regional Integration. Thirty-eight countries improve their Investment Climate scores over the last decade and 21 of these even increase their rate of improvement in the last five years.
Meanwhile, Competition shows signs of reversing its ten-year negative trajectory.
Despite keeping a positive trajectory over the past ten years, Customs Procedures registers a deterioration over the past five, hence contributing to the ‘Increasing Deterioration’ of Business Environment. While only ten countries have deteriorated in Customs Procedures over the decade, the number of countries showing a deterioration went up to 21 in the five-year period. Of the 30 countries improving over the decade, 11 show ‘Warning
‘Increasing Deterioration’
‘Bouncing Back’ & ‘Increasing Improvement’
‘Warning Signs’
Africa: Business Environment average score (2007-2016)
2007 2008 2009 2010 2011 2012 2013 2014 2015 2016 Year
44.144.3 44.4
44.9
44.5
43.943.6
42.843.1
43.5
Annual average trend (2007-2016), -0.07
Annual average trend (2012-2016), -0.10
Score
41.0
0.0
42.0
43.0
44.0
45.0
100.0
46.0
‘Increasing Deterioration’
Signs’, threatening to reverse their positive trajectories over the decade. All of the ten countries deteriorating over the decade have increased their pace of deterioration.
Continental indicator performance
Africa (average scores) 2016 Score
Trend 2007-2016
Annual average
trend
Trend 2012-2016
Annual average
trend
Soundness of Banks 43.1 -23.1 -2.57 -13.6 -3.40
Business Bureaucracy & Red Tape
25.5 -2.6 -0.29 -2.6 -0.65
Africa (average scores) 2016 Score
Trend 2007-2016
Annual average
trend
Trend 2012-2016
Annual average
trend
Investment Climate 57.4 +11.8 +1.31 +7.5 +1.88
Employment Creation 37.9 +0.9 +0.10 +4.1 +1.03
Regional Integration 58.8 +1.6 +0.18 +2.4 +0.60
Competition 48.2 -0.5 -0.06 +0.1 +0.03
Africa (average scores) 2016 Score
Trend 2007-2016
Annual average
trend
Trend 2012-2016
Annual average
trend
Customs Procedures 46.8 +4.6 +0.51 -3.7 -0.93

72
1 Mauritius 91.6 +14.1 +1.57 +10.9 +2.733 Namibia 69.1 +9.1 +1.01 +8.6 +2.154 Morocco 68.6 +21.6 +2.40 +10.5 +2.636 Egypt 63.7 +18.0 +2.00 +15.6 +3.908 Tunisia 63.0 +12.1 +1.34 +9.7 +2.43
10 Cabo Verde 61.2 +17.7 +1.97 +10.7 +2.6811 Côte d'Ivoire 54.2 +9.0 +1.00 +10.3 +2.5812 Swaziland 53.0 +8.5 +0.94 +5.2 +1.3018 São Tomé & Príncipe 45.0 +9.9 +1.10 +7.1 +1.7825 Lesotho 39.9 +5.0 +0.56 +6.4 +1.6026 Togo 39.6 +17.4 +1.93 +13.3 +3.3330 Cameroon 37.5 +11.3 +1.26 +6.0 +1.5033 Mozambique 36.2 +2.1 +0.23 +2.9 +0.7334 Tanzania 36.1 +8.2 +0.91 +6.3 +1.5835 Guinea-Bissau 36.0 +17.2 +1.91 +10.0 +2.5037 Uganda 35.4 +13.0 +1.44 +9.4 +2.3539 Niger 33.9 +16.3 +1.81 +14.8 +3.7041 Nigeria 33.2 +11.4 +1.27 +7.4 +1.8543 Equatorial Guinea 26.5 +6.5 +0.72 +5.3 +1.3345 Guinea 24.5 +4.0 +0.44 +1.9 +0.48
2 Seychelles 85.5 +10.6 +1.18 +3.1 +0.7813 Kenya 52.4 +18.3 +2.03 +5.7 +1.4314 Gabon 50.3 +10.9 +1.21 +4.6 +1.1517 Rwanda 45.3 +4.2 +0.47 +1.3 +0.3319 Senegal 44.1 +10.2 +1.13 +4.5 +1.1320 Djibouti 43.6 +4.3 +0.48 +1.8 +0.4521 Congo 42.3 +15.6 +1.73 +6.2 +1.5523 Comoros 41.0 +4.1 +0.46 +1.2 +0.3027 Zambia 39.3 +6.9 +0.77 +2.0 +0.5029 Sudan 37.7 +11.7 +1.30 +2.5 +0.6330 Ethiopia 37.5 +2.9 +0.32 +0.7 +0.1838 Benin 34.4 +4.7 +0.52 +0.1 +0.0340 Liberia 33.7 +4.1 +0.46 +1.7 +0.4342 Burundi 32.4 +1.3 +0.14 +0.1 +0.0345 Angola 24.5 +2.8 +0.31 +1.2 +0.3050 Chad 19.2 +9.0 +1.00 +0.7 +0.18
7 South Africa 63.4 +3.5 +0.39 -4.3 -1.0815 Gambia 50.2 +6.0 +0.67 -2.4 -0.6022 Mali 41.4 +5.4 +0.60 -0.5 -0.1332 Mauritania 36.6 +0.9 +0.10 -6.2 -1.5548 Central African Republic 21.1 +1.5 +0.17 -2.5 -0.6353 Somalia 13.4 +7.7 +0.86 -2.0 -0.5035 Zimbabwe 36.0 -2.0 -0.22 +4.8 +1.2052 Democratic Republic of Congo 15.4 -2.0 -0.22 0.0 0.00
5 Botswana 64.3 -0.7 -0.08 -0.3 -0.0854 Eritrea 6.2 -5.4 -0.60 -1.3 -0.33
9 Algeria 62.6 -7.4 -0.82 -9.0 -2.2516 Libya 45.8 -11.5 -1.28 -11.2 -2.8024 Ghana 40.1 -10.6 -1.18 -8.9 -2.2328 Malawi 38.6 -1.7 -0.19 -3.0 -0.7544 Burkina Faso 24.6 -4.5 -0.50 -3.2 -0.8047 Sierra Leone 22.4 -12.2 -1.36 -14.6 -3.6549 Madagascar 20.7 -6.8 -0.76 -5.5 -1.3851 South Sudan 15.5 . . +2.9 +0.73
AFRICAN AVERAGE 41.3 +5.5 +0.61 +2.6 +0.65N/A
Infrastructure
2016 SCORE /100.0 ANNUAL AVERAGE TREND (2007-2016)
ANNUAL AVERAGE TREND (2012-2016)
5-YEAR TREND (2012-2016)
10-YEAR TREND (2007-2016)
2016 RANK /54
If Annual Average Trend appears the same in the two time periods, differences may exist beyond the 2nd decimal place.
Increasing Improvement Increasing Deterioration No ChangeSlowing Improvement Slowing DeteriorationWarning Signs Bouncing Back

73
2017 IIAG: Index Report
Infrastructure: progress but still low scoring
Despite ‘Increasing Improvement’ over the past five years, Infrastructure still only scores 41.3 (out of 100.0) in 2016, making it the second lowest scoring sub-category in the IIAG, only ahead of Accountability. Although the majority of Infrastructure indicators show positive trends, they come from low bases.
The increase in the average score for Transport Infrastructure in both time periods has contributed to the positive trajectory at the sub-category level. Of the 35 countries that have experienced an improvement in the ten-year period, 21 have managed to increase their pace of progress over the past five years. Moreover, two countries (Gabon and Democratic Republic of Congo) have shown
The improvement in Water & Sanitation Services over the past five years may be an early sign of Africa reversing its ten-year negative trend in this measure, and has contributed to the positive trajectory of Infrastructure in the most recent period. Despite this, the average score for Water & Sanitation Services in 2016 (40.9) is still lower than its 2007 score (43.2). Of the 33 countries for which trends are available for this indicator less than half improve over a decade. Of the 16 countries that have shown a positive
Further progress has been prevented by the recent trajectories of Digital & IT Infrastructure, Access to Improved Water and, mostly, Electricity Infrastructure. While the first two have slowed their improvement in the five-year period, the latter has increased its deterioration.
Of the 50 countries experiencing an improvement in Digital & IT Infrastructure over the decade, 32 have slowed their improvement and four (Burundi, Central African Republic, Chad, Somalia) exhibit ‘Warning Signs’ over the last five years.
Electricity Infrastructure is on average registering increasing decline in the most recent period. However, of the 23 countries
‘Bouncing Back’
‘Increasing Improvement’
‘Slowing Improvement’ & ‘Increasing Deterioration’
signs of ‘Bouncing Back’, registering a five-year positive trend after a ten-year negative trajectory.
trajectory, 14 have increased their pace of improvement in the five-year period, one has slowed its improvement (Kenya) and one displays ‘Warning Signs’ (Zambia).
managing improvement over the decade, 20 have accelerated their pace of improvement over the last five years.
Africa: Infrastructure average score (2007-2016)
2007 2008 2009 2010 2011 2012 2013 2014 2015 2016 Year
35.8
36.9
37.938.3 38.1
38.739.0
40.1
40.841.3
Annual average trend (2007-2016), +0.61
Annual average trend (2012-2016), +0.65
Score
34.0
0.0
36.0
35.0
38.0
37.0
40.0
39.0
100.0
42.0
41.0
‘Increasing Improvement’
Continental indicator performance
Africa (average scores) 2016 Score
Trend 2007-2016
Annual average
trend
Trend 2012-2016
Annual average
trend
Digital & IT Infrastructure 34.9 +18.0 +2.00 +5.5 +1.38
Access to Improved Water 59.9 +5.8 +0.64 +2.3 +0.58
Electricity Infrastructure 37.4 -2.2 -0.24 -1.0 -0.25
Africa (average scores) 2016 Score
Trend 2007-2016
Annual average
trend
Trend 2012-2016
Annual average
trend
Transport Infrastructure 37.1 +3.6 +0.40 +2.8 +0.70
Africa (average scores) 2016 Score
Trend 2007-2016
Annual average
trend
Trend 2012-2016
Annual average
trend
Water & Sanitation Services 40.9 -2.3 -0.26 +3.0 +0.75
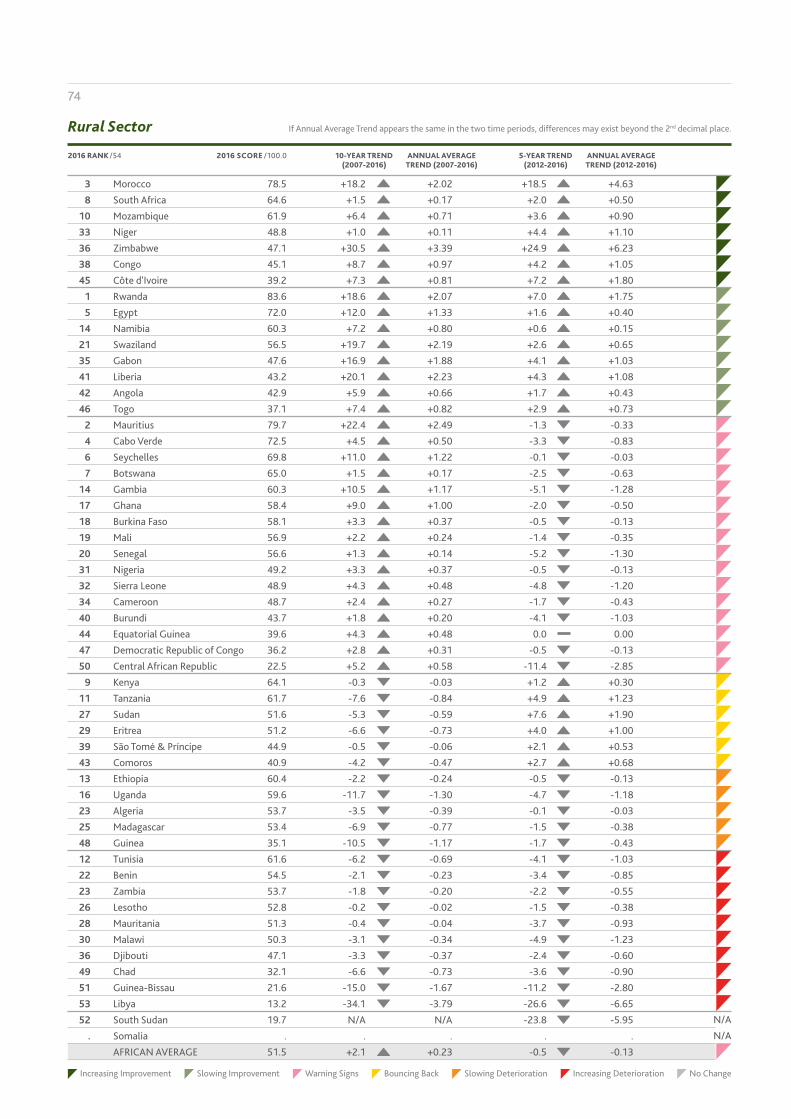
74
3 Morocco 78.5 +18.2 +2.02 +18.5 +4.638 South Africa 64.6 +1.5 +0.17 +2.0 +0.50
10 Mozambique 61.9 +6.4 +0.71 +3.6 +0.9033 Niger 48.8 +1.0 +0.11 +4.4 +1.1036 Zimbabwe 47.1 +30.5 +3.39 +24.9 +6.2338 Congo 45.1 +8.7 +0.97 +4.2 +1.0545 Côte d'Ivoire 39.2 +7.3 +0.81 +7.2 +1.80
1 Rwanda 83.6 +18.6 +2.07 +7.0 +1.755 Egypt 72.0 +12.0 +1.33 +1.6 +0.40
14 Namibia 60.3 +7.2 +0.80 +0.6 +0.1521 Swaziland 56.5 +19.7 +2.19 +2.6 +0.6535 Gabon 47.6 +16.9 +1.88 +4.1 +1.0341 Liberia 43.2 +20.1 +2.23 +4.3 +1.0842 Angola 42.9 +5.9 +0.66 +1.7 +0.4346 Togo 37.1 +7.4 +0.82 +2.9 +0.73
2 Mauritius 79.7 +22.4 +2.49 -1.3 -0.334 Cabo Verde 72.5 +4.5 +0.50 -3.3 -0.836 Seychelles 69.8 +11.0 +1.22 -0.1 -0.037 Botswana 65.0 +1.5 +0.17 -2.5 -0.63
14 Gambia 60.3 +10.5 +1.17 -5.1 -1.2817 Ghana 58.4 +9.0 +1.00 -2.0 -0.5018 Burkina Faso 58.1 +3.3 +0.37 -0.5 -0.1319 Mali 56.9 +2.2 +0.24 -1.4 -0.3520 Senegal 56.6 +1.3 +0.14 -5.2 -1.3031 Nigeria 49.2 +3.3 +0.37 -0.5 -0.1332 Sierra Leone 48.9 +4.3 +0.48 -4.8 -1.2034 Cameroon 48.7 +2.4 +0.27 -1.7 -0.4340 Burundi 43.7 +1.8 +0.20 -4.1 -1.0344 Equatorial Guinea 39.6 +4.3 +0.48 0.0 0.0047 Democratic Republic of Congo 36.2 +2.8 +0.31 -0.5 -0.1350 Central African Republic 22.5 +5.2 +0.58 -11.4 -2.85
9 Kenya 64.1 -0.3 -0.03 +1.2 +0.3011 Tanzania 61.7 -7.6 -0.84 +4.9 +1.2327 Sudan 51.6 -5.3 -0.59 +7.6 +1.9029 Eritrea 51.2 -6.6 -0.73 +4.0 +1.0039 São Tomé & Príncipe 44.9 -0.5 -0.06 +2.1 +0.5343 Comoros 40.9 -4.2 -0.47 +2.7 +0.6813 Ethiopia 60.4 -2.2 -0.24 -0.5 -0.1316 Uganda 59.6 -11.7 -1.30 -4.7 -1.1823 Algeria 53.7 -3.5 -0.39 -0.1 -0.0325 Madagascar 53.4 -6.9 -0.77 -1.5 -0.3848 Guinea 35.1 -10.5 -1.17 -1.7 -0.4312 Tunisia 61.6 -6.2 -0.69 -4.1 -1.0322 Benin 54.5 -2.1 -0.23 -3.4 -0.8523 Zambia 53.7 -1.8 -0.20 -2.2 -0.5526 Lesotho 52.8 -0.2 -0.02 -1.5 -0.3828 Mauritania 51.3 -0.4 -0.04 -3.7 -0.9330 Malawi 50.3 -3.1 -0.34 -4.9 -1.2336 Djibouti 47.1 -3.3 -0.37 -2.4 -0.6049 Chad 32.1 -6.6 -0.73 -3.6 -0.9051 Guinea-Bissau 21.6 -15.0 -1.67 -11.2 -2.8053 Libya 13.2 -34.1 -3.79 -26.6 -6.6552 South Sudan 19.7 N/A N/A -23.8 -5.95
. Somalia . . . . .AFRICAN AVERAGE 51.5 +2.1 +0.23 -0.5 -0.13
N/AN/A
Rural Sector
2016 SCORE /100.0 ANNUAL AVERAGE TREND (2007-2016)
ANNUAL AVERAGE TREND (2012-2016)
5-YEAR TREND (2012-2016)
10-YEAR TREND (2007-2016)
2016 RANK /54
If Annual Average Trend appears the same in the two time periods, differences may exist beyond the 2nd decimal place.
Increasing Improvement Increasing Deterioration No ChangeSlowing Improvement Slowing DeteriorationWarning Signs Bouncing Back

75
2017 IIAG: Index Report
Rural Sector: concerning warning signs
Despite being the highest scoring sub-category in Sustainable Economic Opportunity in 2016, Rural Sector registers deterioration over the past five years (at an annual average rate of -0.13), showing signs of reversing the positive trend over the past ten years (at an annual average rate of +0.23).
At country level, the number of countries with an improved score is considerably smaller in the latter period (21 over the past five years compared to 31 over the past ten).
Of the 31 countries progressing over the decade, only seven manage to accelerate their pace of improvement over the last five years. Eight countries have slowed improvement and 16 exhibit ‘Warning Signs’, registering a decline that threatens to reverse their ten-year positive trajectory. Of the 21 countries experiencing a decline over the ten years, nearly half (ten) have increased their deterioration in the latter period.
At the continental level, Agricultural Policy Costs and Gender Balance in Rural Decision-making are the main drivers of deterioration of the Rural Sector sub-category. In the case of Agricultural Policy Costs, which assesses the nature of a country’s agricultural policy (ranging from excessively burdensome for the economy to balancing the interest of taxpayers, consumers and producers), the pace of deterioration has nearly doubled (at an annual average rate of -1.43 in the five-year period compared to -0.81 over the decade). Half the continent (27 countries) have experienced a deterioration in this indicator in the past decade. Over the past five years, this number has gone up to 30.
‘Increasing Deterioration’
Five countries feature in the ten most deteriorated countries both over ten and five years (Burundi, Gabon, Libya, Sierra Leone, Zambia). For all five the pace of deterioration has increased in the five-year period.
52 African countries (excluding Somalia)
53 African countries, including South Sudan
10-year trend (2007-2016)
5-year trend (2012-2016)
Countries with an improved score 31 21
Countries with a deteriorated score 21 31
Countries with no score change 0 1
Rural Sector: countries’ recent trends
Classification # countries
Increasing Improvement 7
Slowing Improvement 8
Warning Signs 16
Bouncing Back 6
Slowing Deterioration 5
Increasing Deterioration 10
Africa: Rural Sector average score (2007-2016)
2007 2008 2009 2010 2011 2012 2013 2014 2015 2016 Year
49.4
51.2
52.6 52.7
52.252.0
52.3
50.6
51.5 51.5
Annual average trend (2007-2016), +0.23
Annual average trend (2012-2016), -0.13
Score
47.0
0.0
48.0
49.0
50.0
51.0
52.0
53.0
100.0
54.0 ‘Warning Signs’
Continental indicator performance
Africa (average scores) 2016 Score
Trend 2007-2016
Annual average
trend
Trend 2012-2016
Annual average
trend
Agricultural Policy Costs 51.5 -7.3 -0.81 -5.7 -1.43
Gender Balance in Rural Decision-making
45.6 -4.0 -0.44 -2.0 -0.50

76
Gender Balance in Rural Decision-making, which assesses whether a country’s institutional and policy framework promotes equal representation of men and women in local decision-making, has also accelerated its deterioration in the latter period (at an annual average rate of -0.50 compared to -0.44 over the past
ten years). Despite this, the number of countries experiencing a deterioration has decreased from 26 in the ten-year period to 18 over the five years. However, the number of countries that have not experienced a score change has increased (from five in the ten-year period to 22 over the five years).
Grey highlighted countries feature in both the ten most deteriorated countries over the last ten and five years.
10 most deteriorated countries last 10 years (2007-2016) Agricultural Policy Costs
10 most deteriorated countries last 5 years (2012-2016) Agricultural Policy Costs
Albeit still displaying trajectories on the rise, Africa’s average scores for Rural Land & Water, Agricultural Support System and Engagement with Rural Organisations have slowed their improvement over the past five years. The difference is starker in the case of Engagement with Rural Organisations, which captures the extent to which the rural poor can organise for collective action and engage in dialogue with the government. Its five-year annual average improvement has decreased six-fold compared to the one registered over the decade. While the majority of countries (40) have experienced an improvement in the ten-year period, only 17 countries do so over the past five years. Thirteen countries experienced declines in the five-year period compared to ten over the decade. Among those, South Sudan (-21.8), Central African Republic (-20.0) and Democratic Republic of Congo (-11.4) have experienced the largest declines over the last five years.
The trajectory of Rural Development Resources, which assesses government policies for the rural sector as well as the efficiency, consistency and transparency with which the allocation and
‘Slowing Improvement’ & ‘Warning Signs’
management of resources takes place, has also contributed to the trend at the sub-category level. Even though the indicator has, on average, experienced an improvement during the last ten years, it has shown a decline during the last five, threatening to reverse the gains previously made. After reaching its highest ever score in 2009 (56.5 out of 100.0), the African average for Rural Development Resources is only 52.9 in 2016, slightly above its 2007 score (52.2). The fifth most deteriorated country over the decade, Sudan (-19.8) is the seventh most improved country over the past five years (+15.7).
‘Increasing Improvement’
Further decline in Rural Sector has only been held back by the performance of Rural Business Climate and Rural Accountability & Transparency. Both indicators have increased improvement over the past five years.
Of the 27 countries showing an improvement over the decade in Rural Accountability & Transparency, which assesses how accountable and transparent the government is regarding its use of public funds for the rural poor, eight have increased improvement and 16 have shown ‘Warning Signs’ during the last five years, including 11 with no score change. Moreover, seven countries are ‘Bouncing Back’ in the latter period after registering declines or no change over the decade. Although Guinea and
Sudan have been the third and ninth most deteriorated countries over the decade (-24.2 and -15.5, respectively), they both exhibit an impressive performance in the last five-years (+12.1 for the two countries) – becoming the eighth and tenth most improved countries in this period.
Country 2016 Score Annual Average Trend (2007-2016)
Tunisia 46.3 -4.60Malawi 43.6 -4.20Libya 13.2 -3.79Algeria 41.5 -3.04Zambia 55.8 -2.53Gabon 39.1 -2.47Burundi 25.9 -2.44Sierra Leone 41.0 -2.43Egypt 34.1 -2.33South Africa 55.0 -2.32
Country 2016 Score Annual Average Trend (2012-2016)
Libya 13.2 -6.65Gabon 39.1 -5.55Sierra Leone 41.0 -5.48Zimbabwe 17.4 -5.28Burundi 25.9 -4.73Zambia 55.8 -4.40Liberia 47.9 -4.40Chad 36.6 -4.23Guinea 44.8 -3.50Botswana 63.3 -3.35
Africa (average scores) 2016 Score
Trend 2007-2016
Annual average
trend
Trend 2012-2016
Annual average
trend
Rural Land & Water 54.0 +9.3 +1.03 +2.2 +0.55
Agricultural Support System 56.5 +11.4 +1.27 +1.9 +0.48
Engagement with Rural Organisations
57.0 +8.1 +0.90 +0.6 +0.15
Rural Development Resources
52.9 +0.7 +0.08 -0.8 -0.20
Africa (average scores) 2016 Score
Trend 2007-2016
Annual average
trend
Trend 2012-2016
Annual average
trend
Rural Business Climate 53.4 +0.9 +0.10 +0.5 +0.13
Rural Accountability & Transparency
49.0 +1.0 +0.11 +1.3 +0.33

Is the “Africa Rising” narrative an illusion?
Since 2014 Africa’s economic performance has weakened, leading to increased criticism of the so-called “Africa Rising” narrative, namely the expectation of an unprecedented growth across sub-Saharan Africa starting from the early 2000s1.
During the period 2000-2014, sub-Saharan Africa’s Gross Domestic Product (GDP) was growing at a fast pace (at an annual average growth rate of 5.2%)2. In 2004, the peak year, sub-Saharan Africa’s GDP growth rate reached 11.7%.
In recent years, however, the sub-continent’s growth has slowed down considerably (the annual average growth rate was 2.1% in the period 2015-2016). This has happened alongside a sizeable commodity price decline (oil, gold, copper etc.). The fall in oil prices has been particularly dramatic, with the price per barrel halved from $105 in January 2013 to $53 in December 20163.
However, if the growth slowdown has been severe for three of the continent’s largest economies (Angola, Nigeria and South Africa), when looking at individual African countries the picture is more diverse, suggesting that it may be too soon for the “African Rising” narrative to be deemed dead. For many second-tier economies, such as Côte d’Ivoire, Kenya, Rwanda, Senegal and Togo, recent economic performance has been solid enough to tell a very positive story.
Such diversity in economic trajectories is well reflected in the countries’ scores in the IIAG category Sustainable Economic Opportunity. While Angola, accounting for 4.1% of the total African GDP in 2016, has displayed ‘Warning Signs’ over the past five years (at an annual average rate of -0.83 compared to +0.11 over the decade), South Africa, accounting for 13.6% of the total African GDP, has decreased its pace of deterioration (at an annual average rate of -0.03 compared to -0.08 over the decade). Rwanda and Senegal, accounting for only 1.1% of the total African GDP in 2016, present a decreasing pace of improvement in the five-year period (at annual average rates of +0.68 and +0.15 compared to +1.20 and +0.41 over the past ten years). Meanwhile, Côte d’Ivoire, Kenya, Nigeria and Togo, accounting for almost a quarter (23.7%) of the total African GDP in 2016, manage to accelerate their improvement in the most recent years (at annual average rates of +1.98, +1.03, +0.53 and +1.90 respectively) as opposed to their ten-year trend (at annual average rates of +0.99, +0.68, +0.46 and +1.24 respectively). These different paths show that there is not one single story when it comes to African development.
1 The term “Africa Rising” was mostly referred to when discussing the high growth rates of sub-Saharan African countries from the early 2000s to the end of the commodity super cycle in 2014. Only the GDP growth rate of sub-Saharan Africa is mentioned because the World Bank does not provide a GDP growth average for North Africa. It only provides one for North Africa and the Middle East altogether.2 GDP growth rates are taken from “GDP growth (annual %)” from the World Development Indicators (https://data.worldbank.org/indicator/NY.GDP.MKTP.KD.ZG). 3 Oil price data are sourced from International Monetary Fund (IMF) Primary Commodity Prices, Monthly Data. Commodity name: POILAPSP (Simple average of three crude oil spot prices: Dated Brent, West Texas Intermediate and the Dubai Fateh).
Country Annual Average GDP growth 2000-2014 (%)
Annual Average GDP growth 2015-2016 (%)
Côte d'Ivoire 2.2 9.0
Kenya 4.4 5.8
Rwanda 8.0 7.4
Senegal 3.9 6.6
Togo 2.7 5.1
Country Annual Average GDP growth 2000-2014 (%)
Annual Average GDP growth 2015-2016 (%)
Angola 7.9 1.5
Nigeria 7.9 0.6
South Africa 3.2 0.8
Country Annual average trend (2007-2016)
Annual average trend (2012-2016)
Togo +1.24 +1.90 Increasing Improvement
Côte d'Ivoire +0.99 +1.98 Increasing Improvement
Kenya +0.68 +1.03 Increasing Improvement
Nigeria +0.46 +0.53 Increasing Improvement
Rwanda +1.20 +0.68 Slowing Improvement
Senegal +0.41 +0.15 Slowing Improvement
Angola +0.11 -0.83 Warning Signs
South Africa -0.08 -0.03 Slowing Deterioration
Sustainable Economic Opportunity
77
SPOTLIGHT #01

Civil registration: a key tool for public policies, a key governance measure
“Less than one in five known births occurs in a country with a complete birth registration system. In Africa, 87% of deaths occur in countries without a complete death registration system”
- From ‘Strength in Numbers: Africa’s Data Revolution’ – Mo Ibrahim Foundation, 2016 Report
The indicator Civil Registration is included in the IIAG for the first time in 2017. It consists of two variables drawn from Global Integrity’s Africa Integrity Indicators (AII): Birth Registration and Death Registration. This clustered indicator sits within the Public Management sub-category.
Civil Registration assesses the existence of a functioning birth and death registration system and the ability of citizens to obtain birth and death certificates in a reasonable period of time and at no charge. The civil registry is key across various sectors of government, including participation, human rights, access to education and health.
The data for the two Civil Registration variables are available from source from 2013 to 2016. The African average score for Civil Registration is 59.7 (out of 100.0) in 2016, the second highest indicator score in the Public Management sub-category.
However, this average covers a wide range of results. In 2016, North Africa has the highest performance in this indicator, with an average score of 77.1, while Central Africa is the lowest scoring region, with an average score of 32.8.
At country level, Algeria, Malawi, Namibia and Zambia are the highest scoring countries, scoring 100.0 (the best possible score), while Equatorial Guinea and Somalia are the lowest scoring countries, scoring 0.0.
The presence of a functioning birth and death registration system is vital for citizens to exercise their individual rights and benefit from the public services they are entitled to. The 2017 IIAG findings show positive linear correlations between the 2016 African average scores of the Civil Registration indicator and the sub-categories Rights, Participation, Welfare and Health (+0.38, +0.35, +0.33 and +0.31, respectively). Civil registration is also a key element of the government’s capacity to produce vital statistics, and a positive correlation also exists between Civil Registration and the Governmental Statistical Capacity indicator (+0.37).
The positive linear correlation between Civil Registration and Overall Governance is +0.42.
Rank Region 2016 Score
1 North Africa 77.1
2 Southern Africa 72.9
3 West Africa 64.2
4 East Africa 51.0
5 Central Africa 32.8
Regional average Civil Registration scores, 2016 (Rank/5; Score/100.0)
78
SPOTLIGHT #02

Regional Integration: a new indicator in the IIAG
The indicator Regional Integration is included for the first time in the IIAG in 2017, and is drawn from the African Development Bank (AfDB)1. As a part of the Business Environment sub-category, Regional Integration assesses the government’s actions and efforts to promote free movement of persons and labour and easy right of establishment, and its actions and efforts to contribute to regional financial integration. The data are available from source from 2013 to 2016.
The Regional Economic Communities (RECs) are eight sub-regional groupings of African states considered as the building
EAC and ECOWAS rank 1st and 2nd (out of eight RECs) in Regional Integration in 2016 (scoring 76.1 and 65.0 respectively). On the other hand, AMU and IGAD are the two lowest scoring RECs in 2016 (with scores of 50.0 and 46.9, respectively). AMU is also the only region whose Regional Integration score has been the same over the past decade. Contrary to this, ECOWAS, EAC and COMESA have experienced the largest annual average improvements over the past five years (+0.93, +0.80 and +0.78, respectively).
At the country level, Uganda, Rwanda and Burkina Faso present the highest scores in 2016 (100.0, 93.8 and 87.5, respectively). The positive results of Uganda and Rwanda, together with Kenya, which ranks 7th with a score of 81.3 in 2016, are the main drivers behind the performance of the EAC in this indicator. The Northern Corridor Integration Project set up by Kenya, Rwanda and Uganda reflects their role as pioneers in advancing regional integration.
On the contrary, Eritrea, Somalia and South Sudan4, all IGAD member states, are the lowest scoring countries in 2016 (with scores of 25.0, 25.0 and 0.0, respectively).
Since 2007, Zimbabwe has been the most improved country (+18.8, at an annual average rate of +2.09). However, the country has come from a low base and ranks 29th with a score of 43.8 in 2016. On the other hand, Central African Republic has experienced the largest deterioration over the last ten years (-12.5, at an annual average rate of -1.39), while scoring 50.0 and ranking 25th.
blocks of the African Union (AU). The RECs’ main mandate is to facilitate regional economic integration and to contribute to implementing the continental agenda from development to peace and security.
The application of the Regional Integration indicator to RECs’ groupings is intended to shed light on the strength of regional linkages across the continent and to compare the degree of regional progress on issues such as free movement of persons and capital.2
REC Member States (2016)
Arab Maghreb Union (AMU) Algeria, Libya, Mauritania, Morocco, Tunisia
Community of Sahel-Saharan States (CEN-SAD)
Benin, Burkina Faso, Cabo Verde, CAR, Chad, Comoros, Côte d’Ivoire, Djibouti, Egypt, Eritrea, Gambia, Ghana, Guinea, Guinea-Bissau, Kenya, Liberia, Libya, Mali, Mauritania, Morocco, Niger, Nigeria, São Tomé & Príncipe, Senegal, Sierra Leone, Somalia, Sudan, Togo, Tunisia
Common Market for Eastern and Southern Africa (COMESA)
Burundi, Comoros, DRC, Djibouti, Egypt, Eritrea, Ethiopia, Kenya, Libya, Madagascar, Malawi, Mauritius, Rwanda, Seychelles, Sudan, Swaziland, Uganda, Zambia, Zimbabwe
East African Community (EAC) Burundi, Kenya, Rwanda, South Sudan, Tanzania, Uganda
Economic Community of Central African States (ECCAS)
Angola, Burundi, Cameroon, CAR, Chad, Congo, DRC, Equatorial Guinea, Gabon, Rwanda, São Tomé & Príncipe
Economic Community of West African States (ECOWAS)
Benin, Burkina Faso, Cabo Verde, Côte d’Ivoire, Gambia, Ghana, Guinea, Guinea-Bissau, Liberia, Mali, Niger, Nigeria, Senegal, Sierra Leone, Togo
Intergovernmental Authority on Development (IGAD)
Djibouti, Eritrea, Ethiopia, Kenya, Somalia, South Sudan, Sudan, Uganda
Southern African Development Community (SADC)
Angola, Botswana, DRC, Lesotho, Madagascar, Malawi, Mauritius, Mozambique, Namibia, Seychelles, South Africa, Swaziland, Tanzania, Zambia, Zimbabwe
1 The AfDB does not include raw data for the following countries: Algeria, Angola, Botswana, Egypt, Equatorial Guinea, Gabon, Libya, Mauritius, Morocco, Namibia, Seychelles, South Africa, Swaziland, Tunisia.2 Due to overlapping membership, care should be taken when comparing the scores of two or more RECs. 3 Although recognised by the AU, UMA is not a signatory to the Protocol on Relations between the RECs and the AU.4 South Sudan is also part of the Northern Corridor Integration Project.
Average scores for Regional Integration, RECs
EAC ECOWAS SADCECCAS CEN-SAD COMESA IGADAMU
80.0
90.0
100.0
40.0
60.0
20.0
70.0
30.0
50.0
10.0
0.0
76.1
65.057.8
61.856.8 56.7
46.950.0
79
SPOTLIGHT #03


HumanDevelopment
Welfare
Education
Health

82
2 Seychelles 84.9 +6.1 +0.68 +3.4 +0.8510 Kenya 67.1 +11.6 +1.29 +5.9 +1.4811 Namibia 67.0 +2.8 +0.31 +3.1 +0.7814 Swaziland 62.9 +5.3 +0.59 +3.7 +0.9315 Egypt 62.6 +7.0 +0.78 +7.0 +1.7520 Uganda 59.3 +6.1 +0.68 +5.3 +1.3321 Senegal 58.0 +10.4 +1.16 +5.3 +1.3329 Equatorial Guinea 55.3 +7.9 +0.88 +3.9 +0.9831 Lesotho 55.1 +1.5 +0.17 +2.1 +0.5332 Togo 54.2 +13.5 +1.50 +6.3 +1.5834 Côte d'Ivoire 53.9 +11.8 +1.31 +7.4 +1.8535 Mauritania 52.6 +5.7 +0.63 +3.4 +0.8537 Nigeria 51.1 +5.9 +0.66 +4.4 +1.1041 Guinea-Bissau 48.1 +4.0 +0.44 +1.9 +0.48
5 Rwanda 72.4 +16.8 +1.87 +2.9 +0.736 Algeria 71.0 +6.1 +0.68 +0.5 +0.137 São Tomé & Príncipe 70.9 +8.2 +0.91 +0.3 +0.08
13 Morocco 65.1 +8.8 +0.98 +3.2 +0.8019 Cameroon 59.5 +8.4 +0.93 +3.3 +0.8322 Zambia 57.7 +9.7 +1.08 +1.5 +0.3823 Comoros 57.3 +6.9 +0.77 +2.3 +0.5824 Djibouti 56.7 +7.5 +0.83 +1.4 +0.3524 Ethiopia 56.7 +14.3 +1.59 +3.4 +0.8526 Burundi 56.6 +6.1 +0.68 +1.8 +0.4527 Tanzania 56.1 +2.0 +0.22 +0.8 +0.2030 Malawi 55.2 +5.6 +0.62 +0.2 +0.0536 Mozambique 51.5 +5.5 +0.61 +1.0 +0.2539 Mali 51.0 +1.9 +0.21 +0.6 +0.1540 Burkina Faso 49.3 +7.4 +0.82 +2.4 +0.6042 Democratic Republic of Congo 47.6 +7.5 +0.83 +3.3 +0.8343 Niger 47.1 +8.8 +0.98 +3.7 +0.9345 Guinea 45.9 +4.7 +0.52 +0.3 +0.0846 Sudan 45.5 +2.9 +0.32 +0.7 +0.1851 Chad 37.7 +6.6 +0.73 +1.0 +0.25
1 Mauritius 86.1 0.0 0.00 -1.1 -0.283 Botswana 78.0 +4.3 +0.48 -1.6 -0.404 Cabo Verde 74.0 +4.0 +0.44 -0.3 -0.088 South Africa 70.7 +0.2 +0.02 -1.0 -0.25
16 Gambia 62.0 +4.8 +0.53 -2.5 -0.6317 Gabon 60.7 +4.4 +0.49 -0.1 -0.0328 Zimbabwe 55.5 +8.1 +0.90 -0.2 -0.0533 Benin 54.0 +6.0 +0.67 -1.3 -0.3337 Congo 51.1 +4.3 +0.48 -0.9 -0.2344 Liberia 47.0 +5.2 +0.58 -2.6 -0.6546 Angola 45.5 +9.5 +1.06 -0.6 -0.1549 Sierra Leone 44.5 +0.8 +0.09 -3.8 -0.9552 Central African Republic 29.9 +0.7 +0.08 -3.6 -0.90
9 Tunisia 70.5 -3.6 -0.40 +0.8 +0.2048 Eritrea 44.8 -1.4 -0.16 +2.0 +0.5054 Somalia 16.6 -3.0 -0.33 +3.8 +0.9550 Madagascar 42.8 -9.8 -1.09 -2.8 -0.7012 Ghana 65.2 -0.9 -0.10 -4.1 -1.0318 Libya 59.7 -14.9 -1.66 -7.5 -1.8853 South Sudan 28.2 . . -1.5 -0.38
AFRICAN AVERAGE 56.1 +4.4 +0.49 +1.3 +0.33N/A
2016 SCORE /100.0 ANNUAL AVERAGE TREND (2007-2016)
ANNUAL AVERAGE TREND (2012-2016)
5-YEAR TREND (2012-2016)
10-YEAR TREND (2007-2016)
2016 RANK /54
Human Development If Annual Average Trend appears the same in the two time periods, differences may exist beyond the 2nd decimal place.
Increasing Improvement Increasing Deterioration No ChangeSlowing Improvement Slowing DeteriorationWarning Signs Bouncing Back

83
2017 IIAG: Index Report
2016SCORE
AAT (2012-2016)
AAT* (2007-2016)
RwandaEthiopiaTogoCôte d'IvoireKenyaSenegalZambiaAngolaMoroccoNigerCameroonSão Tomé & PríncipeZimbabweEquatorial GuineaDjiboutiDRCBurkina FasoEgyptComorosChadSeychellesAlgeriaUgandaBurundiBeninNigeriaMauritaniaMalawiMozambiqueSwazilandLiberiaGambiaGuineaGabonBotswanaCongoCabo VerdeGuinea-BissauSudanNamibiaTanzaniaMaliLesothoSierra LeoneCARSouth AfricaMauritiusGhanaEritreaSomaliaTunisiaMadagascarLibyaSouth Sudan
+1.87 +0.73 72.4+1.59 +0.85 56.7+1.50 +1.58 54.2+1.31 +1.85 53.9+1.29 +1.48 67.1+1.16 +1.33 58.0+1.08 +0.38 57.7+1.06 -0.15 45.5+0.98 +0.80 65.1+0.98 +0.93 47.1+0.93 +0.83 59.5+0.91 +0.08 70.9+0.90 -0.05 55.5+0.88 +0.98 55.3+0.83 +0.35 56.7+0.83 +0.83 47.6+0.82 +0.60 49.3+0.78 +1.75 62.6+0.77 +0.58 57.3+0.73 +0.25 37.7+0.68 +0.85 84.9+0.68 +0.13 71.0+0.68 +1.33 59.3+0.68 +0.45 56.6+0.67 -0.33 54.0+0.66 +1.10 51.1+0.63 +0.85 52.6+0.62 +0.05 55.2+0.61 +0.25 51.5+0.59 +0.93 62.9+0.58 -0.65 47.0+0.53 -0.63 62.0+0.52 +0.08 45.9+0.49 -0.03 60.7+0.48 -0.40 78.0+0.48 -0.23 51.1+0.44 -0.08 74.0+0.44 +0.48 48.1+0.32 +0.18 45.5+0.31 +0.78 67.0+0.22 +0.20 56.1+0.21 +0.15 51.0+0.17 +0.53 55.1+0.09 -0.95 44.5+0.08 -0.90 29.9+0.02 -0.25 70.7
0.00 -0.28 86.1-0.10 -1.03 65.2-0.16 +0.50 44.8-0.33 +0.95 16.6-0.40 +0.20 70.5-1.09 -0.70 42.8-1.66 -1.88 59.7
. -0.38 28.2
10-year & 5-year annual average trends
As South Sudan does not have data prior to 2011, no trends over the ten-year period are available for that country.
ANNUAL AVERAGE TREND
Improvement since 2007Improvement since 2012
Deterioration since 2007Deterioration since 2012
* AAT: Annual Average Trend
Countries ordered by size of the 10-year trend.
0.00 +2.00-2.00-4.00-6.00 +4.00
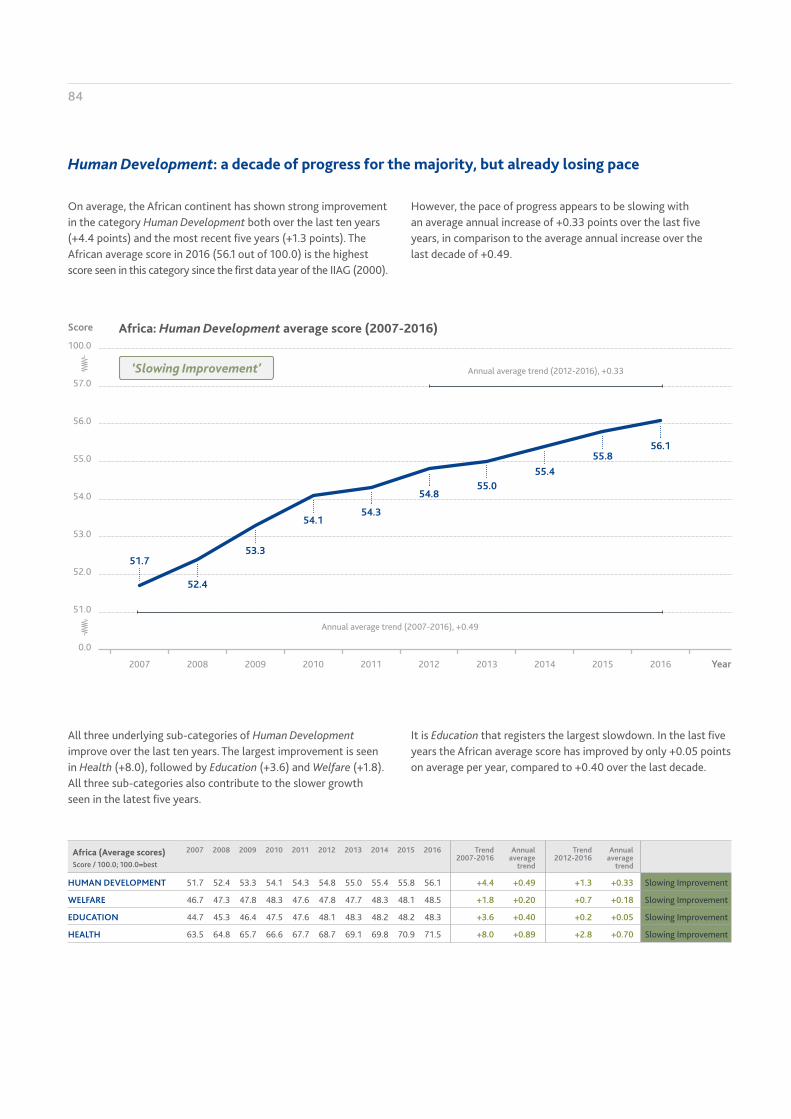
84
On average, the African continent has shown strong improvement in the category Human Development both over the last ten years (+4.4 points) and the most recent five years (+1.3 points). The African average score in 2016 (56.1 out of 100.0) is the highest score seen in this category since the first data year of the IIAG (2000).
All three underlying sub-categories of Human Development improve over the last ten years. The largest improvement is seen in Health (+8.0), followed by Education (+3.6) and Welfare (+1.8). All three sub-categories also contribute to the slower growth seen in the latest five years.
It is Education that registers the largest slowdown. In the last five years the African average score has improved by only +0.05 points on average per year, compared to +0.40 over the last decade.
Africa: Human Development average score (2007-2016)
2007 2008 2009 2010 2011 2012 2013 2014 2015 2016 Year
51.7
52.4
53.3
54.154.3
54.855.0
55.455.8
56.1
Annual average trend (2007-2016), +0.49
Annual average trend (2012-2016), +0.33
51.0
0.0
53.0
54.0
55.0
56.0
57.0
100.0
52.0
Score
‘Slowing Improvement’
However, the pace of progress appears to be slowing with an average annual increase of +0.33 points over the last five years, in comparison to the average annual increase over the last decade of +0.49.
Human Development: a decade of progress for the majority, but already losing pace
2007 2008 2009 2010 2011 2012 2013 2014 2015 2016 Trend 2007-2016
Annual average
trend
Trend 2012-2016
Annual average
trend
HUMAN DEVELOPMENT 51.7 52.4 53.3 54.1 54.3 54.8 55.0 55.4 55.8 56.1 +4.4 +0.49 +1.3 +0.33 Slowing Improvement
WELFARE 46.7 47.3 47.8 48.3 47.6 47.8 47.7 48.3 48.1 48.5 +1.8 +0.20 +0.7 +0.18 Slowing Improvement
EDUCATION 44.7 45.3 46.4 47.5 47.6 48.1 48.3 48.2 48.2 48.3 +3.6 +0.40 +0.2 +0.05 Slowing Improvement
HEALTH 63.5 64.8 65.7 66.6 67.7 68.7 69.1 69.8 70.9 71.5 +8.0 +0.89 +2.8 +0.70 Slowing Improvement
Africa (Average scores)Score / 100.0; 100.0=best

85
2017 IIAG: Index Report
Over the last decade, most countries (46) have registered a positive trend, mirroring that of the continental average improvement. Over the last five years, 37 countries are still able to continue to show a positive trend yet the number of countries declining more than doubles.
The long-term story for Africa in Human Development remains a positive one, with 14 countries ‘Increasing Improvement’ in the last five years.
Côte d’Ivoire, Egypt and Togo display the largest gains.
Ranking in the bottom ten countries in Human Development ten years ago (2007), Togo has since climbed 15 rank places to the 32nd position with an annual average trend of +1.50 over the decade, accelerating to +1.58 over the last five years.
‘Increasing Improvement’: 14 countries
53 African countries 54 African countries, including South Sudan
10-year trend (2007-2016)
5-year trend (2012-2016)
Countries with an improved score 46 37
Countries with a deteriorated score 6 17
Countries with no score change 1 0
Human Development: countries’ recent trends
Classification # countries
Increasing Improvement 14
Slowing Improvement 20
Warning Signs 13
Bouncing Back 3
Slowing Deterioration 1
Increasing Deterioration 2
Togo: Human Development score (2007-2016)
2007 2008 2009 2010 2011 2012 2013 2014 2015 2016 Year
40.7 40.8
42.8
44.6
46.5
47.9
49.3
51.8
53.554.2
Annual average trend (2007-2016), +1.50
Annual average trend (2012-2016), +1.58
48.0
46.0
44.0
42.0
40.0
38.0
0.0
50.0
100.0
52.0
56.0
54.0
Score
‘Increasing Improvement’

86
Three countries — Eritrea, Somalia and Tunisia — demonstrate that they are going some way to reversing their long-term negative trends. Within negative trends over the past decade, they display positive trends over the last five years; they are ‘Bouncing Back’.
To a lesser extent, Madagascar is showing steps towards diminishing its negative trend, displaying ‘Slowing Deterioration’.
Over the last five years, of the countries to show progress over a decade, the majority are either showing ‘Slowing Improvement’, or ‘Warning Signs’ in this period.
Twenty countries maintain a positive trajectory over the decade, but at a slower average rate over the last five years. For Malawi and São Tomé & Príncipe, rates of improvement have slowed by
Despite maintaining a positive average trend over the decade, thirteen countries show a negative annual average trend in the last five years, displaying ‘Warning Signs’ for the upcoming performance of these countries in this category.
This includes four of the top ten ranking countries in Human Development in 2016; Mauritius (1st), Botswana (3rd), Cabo Verde
(4th) and South Africa (8th), as well as low-ranking countries; Sierra Leone (49th) and Central African Republic (52nd).
Sierra Leone is the third most deteriorated country in Human Development in the last five years declining by almost -1.0 on average each year in this period.
more than ten times their longer-term rates of improvement. Mozambique, Rwanda and Zambia, have dropped to less than half their ten-year average rates. Cameroon, Democratic Republic of Congo, Niger and Tanzania register smaller or marginal drops in their rates of improvement.
‘Bouncing Back’ & ‘Slowing Deterioration’: 4 countries
‘Slowing Improvement’ & ‘Warning Signs’: 33 countries
Mozambique: Human Development score (2007-2016)
2007 2008 2009 2010 2011 2012 2013 2014 2015 2016 Year
46.0
49.3
51.2 51.250.8 50.5 50.3 50.4 50.5
51.5
Annual average trend (2007-2016), +0.61
Annual average trend (2012-2016), +0.25
44.0
0.0
48.0
50.0
52.0
54.0
100.0
46.0
Score
‘Slowing Improvement’

87
2017 IIAG: Index Report
Of the six countries that show decline over a decade, two — Libya and Ghana — are deteriorating at an even quicker pace in the last five years. Libya and Ghana are also the most deteriorated countries of the continent in Human Development in the last five
years. Ghana’s downward trajectory over the past decade has seen it fall from the 8th rank to 12th while Libya’s substantial decline in the same period has seen the country drop 15 rank places from 3rd in 2007 to 18th in 2016.
‘Increasing Deterioration’: 2 countries
Sierra Leone: Human Development score (2007-2016)
2007 2008 2009 2010 2011 2012 2013 2014 2015 2016 Year
43.7
45.2
46.045.7
47.3
48.3
46.6
45.645.3
44.5
Annual average trend (2007-2016), +0.09
Annual average trend (2012-2016), -0.95
42.0
0.0
46.0
48.0
50.0
100.0
44.0
Score
‘Warning Signs’
2007 2008 2009 2010 2011 2012 2013 2014 2015 2016 Year
74.675.3 75.3
73.8
68.8
67.2
65.0
60.2
58.359.7
Annual average trend (2007-2016), -1.66
Annual average trend (2012-2016), -1.88
66.0
64.0
62.0
60.0
58.0
56.0
0.0
68.0
100.0
70.0
74.0
76.0
72.0
Score Libya: Human Development score (2007-2016)
‘Increasing Deterioration’

88
12 Uganda 60.0 +5.1 +0.57 +6.1 +1.5314 Kenya 57.6 +13.9 +1.54 +8.7 +2.1815 Morocco 57.2 +7.7 +0.86 +4.8 +1.2017 Mauritania 55.1 +0.7 +0.08 +2.8 +0.7018 Tanzania 54.6 +3.7 +0.41 +6.6 +1.6519 Senegal 54.2 +10.7 +1.19 +5.2 +1.3022 Egypt 51.5 +7.2 +0.80 +9.9 +2.4823 Cameroon 50.6 +7.0 +0.78 +5.9 +1.4825 Niger 49.2 +10.6 +1.18 +7.2 +1.8028 Nigeria 48.9 +4.3 +0.48 +4.8 +1.2031 Lesotho 46.6 +1.6 +0.18 +4.9 +1.2333 Swaziland 46.3 +1.9 +0.21 +3.7 +0.9336 Côte d'Ivoire 43.4 +14.8 +1.64 +11.0 +2.7540 Togo 42.6 +14.0 +1.56 +7.4 +1.8541 Zimbabwe 39.8 +6.1 +0.68 +5.1 +1.2848 Democratic Republic of Congo 34.8 +5.3 +0.59 +3.5 +0.8849 Sudan 30.7 +2.8 +0.31 +1.5 +0.3854 Somalia 2.9 +2.9 +0.32 +2.0 +0.50
1 Rwanda 79.2 +22.3 +2.48 +3.9 +0.983 Botswana 76.8 +7.5 +0.83 +0.7 +0.188 Algeria 61.6 +8.1 +0.90 +1.7 +0.43
11 São Tomé & Príncipe 60.7 +6.8 +0.76 +0.6 +0.1529 Burkina Faso 47.7 +1.9 +0.21 +0.5 +0.1334 Burundi 44.5 +4.8 +0.53 +1.3 +0.3335 Guinea 44.2 +9.7 +1.08 +3.5 +0.88
2 Seychelles 78.2 +8.6 +0.96 0.0 0.0013 Ethiopia 59.2 +7.9 +0.88 -0.1 -0.0316 Gambia 57.1 +4.0 +0.44 -2.6 -0.6521 Gabon 52.3 +5.6 +0.62 0.0 0.0024 Malawi 50.0 +1.2 +0.13 -1.2 -0.3027 Zambia 49.0 +7.2 +0.80 -1.4 -0.3530 Benin 47.5 +1.8 +0.20 -3.6 -0.9036 Comoros 43.4 +0.4 +0.04 -1.1 -0.2838 Congo 43.1 +2.6 +0.29 -2.3 -0.5839 Angola 42.8 +10.1 +1.12 -3.2 -0.8043 Liberia 39.1 +6.5 +0.72 -3.5 -0.8845 Chad 36.5 +1.0 +0.11 -0.1 -0.0347 Equatorial Guinea 35.4 +9.3 +1.03 0.0 0.00
7 Namibia 62.7 -1.8 -0.20 +2.3 +0.589 Tunisia 61.5 -5.6 -0.62 +2.5 +0.63
32 Mali 46.4 -3.0 -0.33 +1.8 +0.4544 Madagascar 37.5 -13.7 -1.52 +4.4 +1.1050 Eritrea 25.8 -16.3 -1.81 +1.9 +0.48
4 Mauritius 76.5 -3.6 -0.40 -1.5 -0.385 South Africa 69.3 -2.5 -0.28 -0.4 -0.10
42 Guinea-Bissau 39.5 -9.5 -1.06 -4.1 -1.036 Cabo Verde 63.1 -2.6 -0.29 -4.3 -1.08
10 Ghana 60.8 -8.1 -0.90 -8.6 -2.1520 Djibouti 53.0 -0.6 -0.07 -5.3 -1.3326 Mozambique 49.1 -2.0 -0.22 -1.6 -0.4046 Sierra Leone 36.2 -9.2 -1.02 -11.2 -2.8051 Libya 25.2 -36.3 -4.03 -16.5 -4.1352 Central African Republic 22.6 -4.5 -0.50 -10.1 -2.5353 South Sudan 16.7 . . -4.6 -1.15
AFRICAN AVERAGE 48.5 +1.8 +0.20 +0.7 +0.18N/A
Welfare
2016 SCORE /100.0 ANNUAL AVERAGE TREND (2007-2016)
ANNUAL AVERAGE TREND (2012-2016)
5-YEAR TREND (2012-2016)
10-YEAR TREND (2007-2016)
2016 RANK /54
If Annual Average Trend appears the same in the two time periods, differences may exist beyond the 2nd decimal place.
Increasing Improvement Increasing Deterioration No ChangeSlowing Improvement Slowing DeteriorationWarning Signs Bouncing Back

89
2017 IIAG: Index Report
Welfare: improvement is slackening
Whilst the African average score for Welfare has improved over the last decade, progress registers a slight slowdown in the last five years. Improvements can be seen in the vast majority of countries and indicators, but not sufficiently to accelerate progress at the sub-category level. Twenty of the 38 countries that have improved in Welfare since 2007 show ‘Slowing Improvement’ or ‘Warning Signs’ in the last five years.
Africa: Welfare average score (2007-2016)
2007 2008 2009 2010 2011 2012 2013 2014 2015 2016 Year
46.7
47.3
47.8
48.3
47.647.8 47.7
48.348.1
48.5
Annual average trend (2007-2016), +0.20
Annual average trend (2012-2016), +0.18
Score
46.0
0.0
47.0
48.0
100.0
49.0
‘Slowing Improvement’
Continental indicator performance
Four of the nine underlying Welfare indicators show ‘Increasing Improvement’. Between 2012 and 2016, Africa’s score for Narrowing Income Gaps has increased its pace of improvement fivefold, albeit coming from a low average score, while Poverty improvement has almost doubled. For both indicators, which are public opinion data, more than half of the assessed countries display ‘Increasing Improvement’, namely Egypt, Niger and Senegal.
Also contributing to the sub-category’s improvement are Poverty Reduction Priorities and Environmental Policy. Whilst registering negative ten-year trends, both have stopped declining in the last five years and show a static trend. Poverty Reduction Priorities has seen 14 countries ‘Increasing Improvement’ and ten ‘Bouncing Back’, with the largest improvements seen in Egypt (+17.2) and
Social Exclusion is dragging the sub-category further down, driving its ‘Slowing Improvement’. While only seven countries deteriorate between 2012 and 2016, the magnitudes of recent declines in Libya (-35.7), Benin (-14.3) and Ghana (-14.2) drive down the average continental scores and trends.
Driving Welfare’s slowdown are two indicators showing worsening recent performance compared to a decade’s progress. The pace of improvement of Environmental Sustainability in the last five years is more than nine times slower than the last decade. Almost half of the continent (26 countries) is showing either ‘Slowing Improvement’ or ‘Warning Signs’. Meanwhile, Social Safety Nets has declined at an average of -0.38 points per year
‘Bouncing Back’
‘Increasing Improvement’
‘Increasing Deterioration’
‘Slowing Improvement’ & ‘Warning Signs’
Uganda (+16.2). However, improvements at indicator level are not sufficient to accelerate progress at the sub-category level.
since 2012. This deterioration is mainly driven by Libya, which has declined from a score of 88.5 in 2012 to 15.4 in 2016 at an average annual trend of -18.28 points.
Africa (average scores) 2016 Score
Trend 2007-2016
Annual average
trend
Trend 2012-2016
Annual average
trend
Poverty 55.5 +8.0 +0.89 +6.4 +1.60
Narrowing Income Gaps 37.0 +2.2 +0.24 +4.9 +1.23
Welfare Services 65.2 +4.9 +0.54 +2.4 +0.60
Social Protection & Labour 52.9 +1.2 +0.13 +1.1 +0.28
Africa (average scores) 2016 Score
Trend 2007-2016
Annual average
trend
Trend 2012-2016
Annual average
trend
Poverty Reduction Priorities 50.5 -1.9 -0.21 0.0 0.00
Environmental Policy 40.9 -0.3 -0.03 0.0 0.00
Africa (average scores) 2016 Score
Trend 2007-2016
Annual average
trend
Trend 2012-2016
Annual average
trend
Environmental Sustainability 62.8 +4.1 +0.46 +0.2 +0.05
Social Safety Nets 43.5 +3.4 +0.38 -1.5 -0.38
Africa (average scores) 2016 Score
Trend 2007-2016
Annual average
trend
Trend 2012-2016
Annual average
trend
Social Exclusion 20.8 -2.5 -0.28 -1.3 -0.33

90
2 Seychelles 77.0 +4.5 +0.50 +5.4 +1.358 Kenya 66.0 +6.7 +0.74 +5.7 +1.43
10 Namibia 64.0 +5.8 +0.64 +4.3 +1.0813 Swaziland 61.1 +4.4 +0.49 +2.1 +0.5315 Egypt 59.1 +7.5 +0.83 +5.2 +1.3021 Gabon 53.0 +2.5 +0.28 +1.4 +0.3529 Côte d'Ivoire 45.2 +10.5 +1.17 +7.0 +1.7548 Niger 32.7 +10.0 +1.11 +5.9 +1.48
4 Cabo Verde 72.2 +9.0 +1.00 +0.7 +0.185 Algeria 68.7 +7.7 +0.86 +2.0 +0.506 São Tomé & Príncipe 68.1 +16.5 +1.83 +2.0 +0.50
14 Equatorial Guinea 60.8 +4.3 +0.48 +1.0 +0.2516 Comoros 57.9 +8.5 +0.94 +1.7 +0.4318 Morocco 56.8 +8.0 +0.89 +0.1 +0.0319 Cameroon 55.2 +11.0 +1.22 +3.1 +0.7822 Togo 51.4 +10.8 +1.20 +4.5 +1.1323 Rwanda 51.3 +14.1 +1.57 +1.5 +0.3831 Djibouti 44.1 +13.5 +1.50 +5.9 +1.4836 Senegal 42.0 +6.2 +0.69 +1.2 +0.3040 Ethiopia 39.1 +10.5 +1.17 +0.2 +0.0542 Guinea-Bissau 37.5 +6.3 +0.70 +0.9 +0.2346 Mauritania 35.0 +5.2 +0.58 +0.7 +0.1849 Burkina Faso 32.1 +6.7 +0.74 +0.3 +0.0851 Chad 24.5 +7.3 +0.81 +1.4 +0.35
1 Mauritius 84.2 +4.7 +0.52 -0.3 -0.083 Botswana 72.5 +1.7 +0.19 -3.8 -0.95
12 Ghana 61.2 +5.4 +0.60 -1.4 -0.3517 Zimbabwe 56.9 +5.0 +0.56 -3.3 -0.8320 Zambia 54.7 +7.1 +0.79 -0.5 -0.1325 Gambia 50.0 +2.1 +0.23 -2.2 -0.5526 Congo 47.0 +4.2 +0.47 -0.2 -0.0527 Burundi 45.9 +4.8 +0.53 -0.7 -0.1832 Nigeria 43.7 +0.9 +0.10 -0.7 -0.1833 Liberia 43.6 +0.1 +0.01 -6.5 -1.6334 Benin 43.4 +9.1 +1.01 -2.8 -0.7035 Democratic Republic of Congo 42.7 +6.5 +0.72 -1.5 -0.3837 Malawi 41.6 +4.5 +0.50 -0.5 -0.1339 Sierra Leone 40.3 +0.9 +0.10 -1.0 -0.2543 Mali 35.6 +4.0 +0.44 -0.2 -0.0544 Angola 35.4 +6.5 +0.72 -1.9 -0.4845 Mozambique 35.2 +4.7 +0.52 -2.2 -0.5547 Eritrea 34.3 +2.2 +0.24 -0.4 -0.1050 Guinea 31.2 +0.6 +0.07 -1.8 -0.4524 Lesotho 50.9 -1.8 -0.20 +2.2 +0.5527 Uganda 45.9 -0.6 -0.07 +1.1 +0.28
7 Tunisia 66.5 -9.1 -1.01 -2.8 -0.709 Libya 64.4 -11.5 -1.28 -9.0 -2.25
11 South Africa 63.9 -3.0 -0.33 -1.9 -0.4830 Tanzania 44.5 -1.8 -0.20 -2.7 -0.6838 Sudan 40.8 -0.6 -0.07 -1.5 -0.3841 Madagascar 38.6 -3.5 -0.39 -4.0 -1.0053 Central African Republic 15.7 -0.1 -0.01 -2.8 -0.7054 Somalia 0.0 -25.0 -2.78 0.0 0.0052 South Sudan 21.4 . . +1.0 +0.25
AFRICAN AVERAGE 48.3 +3.6 +0.40 +0.2 +0.05N/A
Education
2016 SCORE /100.0 ANNUAL AVERAGE TREND (2007-2016)
ANNUAL AVERAGE TREND (2012-2016)
5-YEAR TREND (2012-2016)
10-YEAR TREND (2007-2016)
2016 RANK /54
If Annual Average Trend appears the same in the two time periods, differences may exist beyond the 2nd decimal place.
Increasing Improvement Increasing Deterioration No ChangeSlowing Improvement Slowing DeteriorationWarning Signs Bouncing Back

91
2017 IIAG: Index Report
Over the last decade the African continent has managed to gain +3.6 points in Education. Although the sub-category still registers a positive story of growth, progress has almost stopped in the latter half of the decade with an annual average trend of only +0.05 points, eight times slower than over the decade (+0.40). Education remains the lowest scoring sub-category in Human Development with a score of 48.3.
This slowdown is reflected at both indicator and country level. All eight underlying Education indicators have, in some way, contributed to the general slackening of the sub-category score in the last five years: one (Education Provision) even registers ‘Increasing Deterioration’, while all the others register either ‘Slowing Improvement’ or ‘Warning Signs’.
At the country level, most of the continent is either showing ‘Slowing Improvement’ (16 countries) or ‘Warning Signs’ (19 countries) between 2012 and 2016. The number of countries showing ‘Slowing Improvement’ is a cause for concern, Morocco showing the most extreme slowdown. The country’s annual pace of improvement over the last five years is almost 30 times
Five Education underlying indicators present a slackening progress between 2012 and 2016, contributing to the sub-category’s ‘Slowing Improvement’.
Primary School Completion shows the biggest slowdown with an average pace of improvement almost three times slower in the last five years compared with the last ten years. Although 37 countries have improved over the last decade, almost half of these (18 countries) display ‘Slowing Improvement’ in the last five years. Burundi, which has registered the third largest improvement since 2007, has been progressing more than eight times slower in the last five years than over the last decade. Also driving the indicator average slowdown are large recent declines in countries such as São Tomé & Príncipe (-22.5 in total) and Rwanda (-7.9 in total), which had progressed over the decade.
‘Slowing Improvement’
Africa: Education average score (2007-2016)
2007 2008 2009 2010 2011 2012 2013 2014 2015 2016 Year
44.7
45.3
46.4
47.5 47.6
48.148.3 48.2 48.2 48.3
Annual average trend (2007-2016), +0.40
Annual average trend (2012-2016), +0.05
Score
44.0
0.0
45.0
46.0
47.0
100.0
49.0
48.0
‘Slowing Improvement’
slower. Among the 19 countries displaying ‘Warning Signs’, high ranking Botswana is presenting a worrying average decline of -0.95 points per year.
Increasing Improvement
Increasing Deterioration
Slowing Improvement
Slowing Deterioration
Warning Signs
Bouncing Back
Increasing Improvement
Increasing Deterioration
No change
Slowing Improvement
Slowing Deterioration
Warning Signs
Bouncing Back
Number of countries per
classification16
21
19
86
Primary School Completion
(2007-2016)Countries per classification 18
7
2
1
12
74
Education: progress has almost stopped in the last 5 years
Continental indicator performance
Africa (average scores) 2016 Score
Trend 2007-2016
Annual average
trend
Trend 2012-2016
Annual average
trend
Human Resources in Primary Schools
71.2 +4.3 +0.48 +1.6 +0.40
Primary School Completion 58.1 +7.6 +0.84 +1.2 +0.30
Secondary School Enrolment 45.1 +9.3 +1.03 +2.3 +0.58
Tertiary Education Enrolment 19.5 +6.4 +0.71 +2.1 +0.53
Literacy 67.0 +8.0 +0.89 +2.9 +0.73

92
‘Increasing Deterioration’
Education Provision average score (2007-2016)
2007 2008 2009 2010 2011 2012 2013 2014 2015 2016 Year
58.858.1
57.4 57.2 57.0
55.8
52.8
48.4
47.3 47.5
Annual average trend (2007-2016), -1.26
Annual average trend (2012-2016), -2.08
Score
44.0
0.0
48.0
46.0
52.0
50.0
56.0
54.0
100.0
60.0
58.0
‘Increasing Deterioration’
Two indicators - Education Quality and Educational System Management - present ‘Warning Signs’, threatening to reverse the progress achieved during the last decade at the indicator and at the sub-category level. Both measures assess education institutions and systems.
Fourteen countries are showing ‘Warning Signs’ in the last five years in Education Quality. Angola, although growing at an annual average pace of +1.84 points between 2007 and 2016, has been declining at by -4.18 points per year since 2012. Also driving down the score of Education Quality is the fact that five of the eight countries that have deteriorated over the decade show ‘Increased Deterioration’ in the last five years, namely Libya which has almost doubled its average pace of decline from -5.56 to -10.43.
The Education Provision indicator only covers 37 African countries and for four of these there is no trend classification.
The Education Quality indicator only covers 44 African countries, one of which is South Sudan for which there is no trend classification.
Education Provision hinders further progress in the Education sub-category. The indicator assesses the extent to which the public is satisfied with how the government is addressing educational needs. The data is taken from a public attitude survey developed in 37 African countries.
Over the last ten years, Education Provision has declined by -11.3 points. Besides being the most deteriorated indicator in the Human Development category, it is also the eighth most deteriorated indicator of the IIAG. Most of the decline has occurred in the latter half of the decade, with the annual average pace of decline increasing from -1.26 to -2.08. In the last five years it is the third most deteriorated.
‘Warning Signs’
Increasing Improvement
Increasing Deterioration
No change
Slowing Improvement
Slowing Deterioration
Warning Signs
Bouncing BackEducation Quality (2007-2016)Countries per classification 14
3
40
14
3
5
Increasing Improvement
Increasing Deterioration
Slowing Improvement
Slowing Deterioration
Warning Signs
Bouncing Back
Education Provision (2007-2016)Countries per classification
2
2
2
3
5
19
Quickening decline at the indicator level is driven by the fact that half of the assessed countries (19 out of 37 countries) shows ‘Increasing Deterioration’. Amongst these, it is of a concern that eight countries register an annual average pace of deterioration larger than -5.00 points: Ghana (-8.03), Burundi (-7.48), Liberia (-7.38), Burkina Faso (-6.65), Madagascar (-6.38), Zimbabwe (-6.13), Algeria (-5.88) and Malawi (-5.10).
Africa (average scores) 2016 Score
Trend 2007-2016
Annual average
trend
Trend 2012-2016
Annual average
trend
Education Quality 42.0 +2.1 +0.23 -2.9 -0.73
Educational System Management
40.8 +1.7 +0.19 -1.3 -0.33
Africa (average scores) 2016 Score
Trend 2007-2016
Annual average
trend
Trend 2012-2016
Annual average
trend
Education Provision 47.5 -11.3 -1.26 -8.3 -2.08


94
1 Seychelles 99.7 +5.3 +0.59 +5.1 +1.283 Libya 89.5 +3.1 +0.34 +3.1 +0.784 Cabo Verde 86.7 +5.7 +0.63 +2.8 +0.708 Tunisia 83.4 +3.6 +0.40 +2.6 +0.65
10 Swaziland 81.4 +9.6 +1.07 +5.4 +1.3511 Morocco 81.2 +10.5 +1.17 +4.8 +1.2012 Burundi 79.5 +8.7 +0.97 +4.9 +1.2315 Senegal 77.7 +14.3 +1.59 +9.3 +2.3317 Egypt 77.1 +6.2 +0.69 +5.6 +1.4019 Eritrea 74.3 +9.8 +1.09 +4.5 +1.1319 Namibia 74.3 +4.2 +0.47 +2.7 +0.6826 Uganda 72.2 +13.9 +1.54 +8.8 +2.2030 Comoros 70.7 +11.7 +1.30 +6.2 +1.5531 Mozambique 70.1 +13.6 +1.51 +6.7 +1.6832 Equatorial Guinea 69.7 +10.2 +1.13 +10.6 +2.6537 Burkina Faso 68.0 +13.5 +1.50 +6.2 +1.5538 Mauritania 67.9 +11.3 +1.26 +6.8 +1.7040 Guinea-Bissau 67.3 +15.0 +1.67 +8.8 +2.2041 Democratic Republic of Congo 65.5 +10.9 +1.21 +8.2 +2.0545 Nigeria 60.7 +12.5 +1.39 +9.1 +2.2853 Somalia 47.0 +13.1 +1.46 +9.5 +2.38
4 Rwanda 86.7 +14.1 +1.57 +3.4 +0.8515 Kenya 77.7 +14.0 +1.56 +3.1 +0.7821 Malawi 73.9 +11.0 +1.22 +2.3 +0.5823 Côte d'Ivoire 73.2 +10.4 +1.16 +4.4 +1.1024 Djibouti 73.1 +9.8 +1.09 +3.7 +0.9325 Cameroon 72.6 +7.0 +0.78 +0.7 +0.1827 Ethiopia 71.9 +24.8 +2.76 +10.0 +2.5028 Benin 71.2 +7.0 +0.78 +2.5 +0.6329 Mali 71.0 +4.9 +0.54 +0.2 +0.0534 Zambia 69.4 +14.9 +1.66 +6.3 +1.5836 Togo 68.6 +15.7 +1.74 +6.9 +1.7342 Sudan 65.1 +6.7 +0.74 +2.1 +0.5347 Angola 58.2 +11.8 +1.31 +3.0 +0.7547 Liberia 58.2 +8.8 +0.98 +2.1 +0.5349 Sierra Leone 57.0 +10.8 +1.20 +0.7 +0.1851 Chad 52.2 +11.7 +1.30 +1.9 +0.4852 Central African Republic 51.3 +6.7 +0.74 +2.1 +0.53
6 Botswana 84.6 +3.8 +0.42 -1.9 -0.487 São Tomé & Príncipe 83.8 +1.3 +0.14 -1.9 -0.489 Algeria 82.6 +2.4 +0.27 -2.2 -0.55
13 South Africa 79.1 +6.2 +0.69 -0.7 -0.1814 Gambia 79.0 +8.5 +0.94 -2.7 -0.6818 Gabon 76.9 +5.1 +0.57 -1.5 -0.3822 Ghana 73.7 +0.3 +0.03 -2.3 -0.5832 Zimbabwe 69.7 +13.3 +1.48 -2.4 -0.6034 Tanzania 69.4 +4.3 +0.48 -1.4 -0.3538 Lesotho 67.9 +4.8 +0.53 -0.7 -0.1843 Congo 63.3 +6.2 +0.69 -0.1 -0.0344 Guinea 62.2 +3.7 +0.41 -0.9 -0.2346 Niger 59.5 +5.7 +0.63 -1.9 -0.48
2 Mauritius 97.6 -1.1 -0.12 -1.3 -0.3350 Madagascar 52.4 -12.0 -1.33 -8.7 -2.1854 South Sudan 46.4 . . -1.0 -0.25
AFRICAN AVERAGE 71.5 +8.0 +0.89 +2.8 +0.70N/A
Health
2016 SCORE /100.0 ANNUAL AVERAGE TREND (2007-2016)
ANNUAL AVERAGE TREND (2012-2016)
5-YEAR TREND (2012-2016)
10-YEAR TREND (2007-2016)
2016 RANK /54
If Annual Average Trend appears the same in the two time periods, differences may exist beyond the 2nd decimal place.
Increasing Improvement Increasing Deterioration No ChangeSlowing Improvement Slowing DeteriorationWarning Signs Bouncing Back
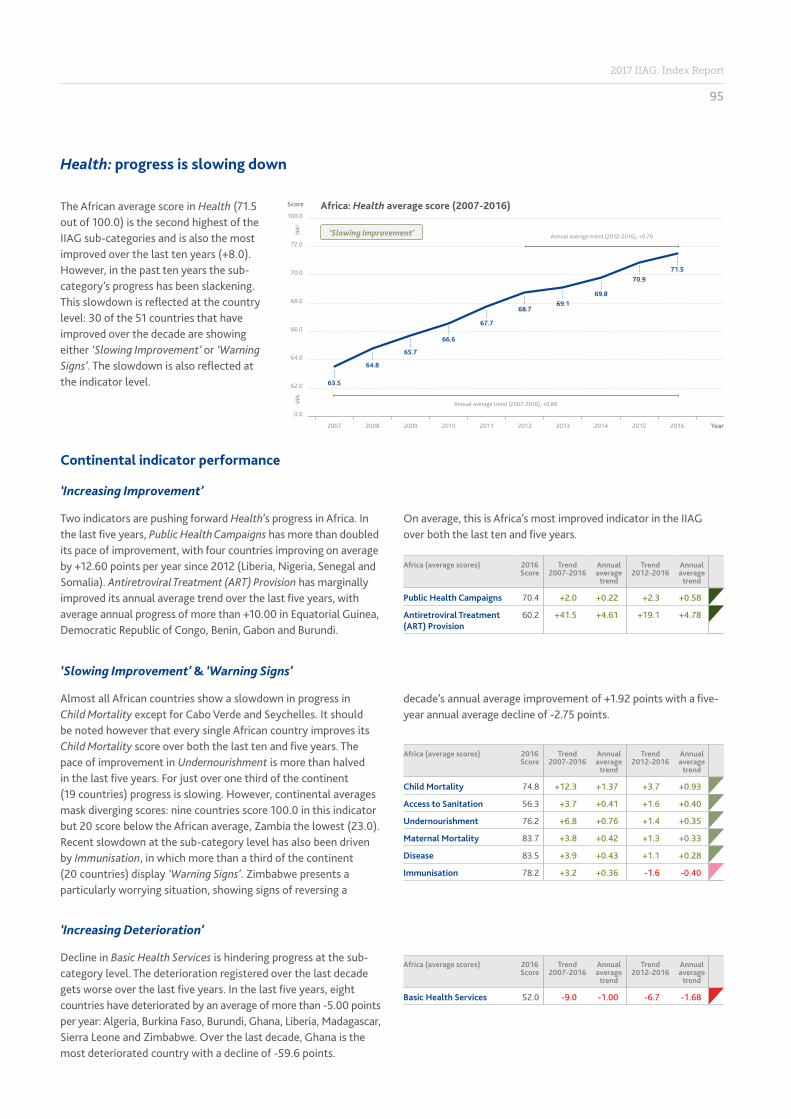
95
2017 IIAG: Index Report
Health: progress is slowing down
The African average score in Health (71.5 out of 100.0) is the second highest of the IIAG sub-categories and is also the most improved over the last ten years (+8.0). However, in the past ten years the sub-category’s progress has been slackening. This slowdown is reflected at the country level: 30 of the 51 countries that have improved over the decade are showing either ‘Slowing Improvement’ or ‘Warning Signs’. The slowdown is also reflected at the indicator level.
Two indicators are pushing forward Health’s progress in Africa. In the last five years, Public Health Campaigns has more than doubled its pace of improvement, with four countries improving on average by +12.60 points per year since 2012 (Liberia, Nigeria, Senegal and Somalia). Antiretroviral Treatment (ART) Provision has marginally improved its annual average trend over the last five years, with average annual progress of more than +10.00 in Equatorial Guinea, Democratic Republic of Congo, Benin, Gabon and Burundi.
Decline in Basic Health Services is hindering progress at the sub-category level. The deterioration registered over the last decade gets worse over the last five years. In the last five years, eight countries have deteriorated by an average of more than -5.00 points per year: Algeria, Burkina Faso, Burundi, Ghana, Liberia, Madagascar, Sierra Leone and Zimbabwe. Over the last decade, Ghana is the most deteriorated country with a decline of -59.6 points.
Almost all African countries show a slowdown in progress in Child Mortality except for Cabo Verde and Seychelles. It should be noted however that every single African country improves its Child Mortality score over both the last ten and five years. The pace of improvement in Undernourishment is more than halved in the last five years. For just over one third of the continent (19 countries) progress is slowing. However, continental averages mask diverging scores: nine countries score 100.0 in this indicator but 20 score below the African average, Zambia the lowest (23.0). Recent slowdown at the sub-category level has also been driven by Immunisation, in which more than a third of the continent (20 countries) display ‘Warning Signs’. Zimbabwe presents a particularly worrying situation, showing signs of reversing a
‘Increasing Improvement’
‘Increasing Deterioration’
‘Slowing Improvement’ & ‘Warning Signs’
Africa: Health average score (2007-2016)
2007 2008 2009 2010 2011 2012 2013 2014 2015 2016 Year
63.5
64.8
65.7
66.6
67.7
68.769.1
69.8
70.971.5
Annual average trend (2007-2016), +0.89
Annual average trend (2012-2016), +0.70
Score
62.0
0.0
66.0
64.0
68.0
70.0
100.0
72.0
‘Slowing Improvement’
decade’s annual average improvement of +1.92 points with a five-year annual average decline of -2.75 points.
On average, this is Africa’s most improved indicator in the IIAG over both the last ten and five years.
Continental indicator performance
Africa (average scores) 2016 Score
Trend 2007-2016
Annual average
trend
Trend 2012-2016
Annual average
trend
Child Mortality 74.8 +12.3 +1.37 +3.7 +0.93
Access to Sanitation 56.3 +3.7 +0.41 +1.6 +0.40
Undernourishment 76.2 +6.8 +0.76 +1.4 +0.35
Maternal Mortality 83.7 +3.8 +0.42 +1.3 +0.33
Disease 83.5 +3.9 +0.43 +1.1 +0.28
Immunisation 78.2 +3.2 +0.36 -1.6 -0.40
Africa (average scores) 2016 Score
Trend 2007-2016
Annual average
trend
Trend 2012-2016
Annual average
trend
Basic Health Services 52.0 -9.0 -1.00 -6.7 -1.68
Africa (average scores) 2016 Score
Trend 2007-2016
Annual average
trend
Trend 2012-2016
Annual average
trend
Public Health Campaigns 70.4 +2.0 +0.22 +2.3 +0.58
Antiretroviral Treatment (ART) Provision
60.2 +41.5 +4.61 +19.1 +4.78


2017 IIAG Summary Tables

98
Overall Governance
2007-2016 2012-2016
Top 10 most improved countries
Top 10 most deteriorated countries
Top 10 countries
Bottom 10 countries
Country 2016 Score
Trend Annual average
trend
Côte d'Ivoire 54.2 +12.6 +1.40
Togo 51.7 +10.0 +1.11
Zimbabwe 45.4 +9.5 +1.06
Rwanda 63.9 +8.7 +0.97
Kenya 59.3 +6.5 +0.72
Liberia 51.4 +6.5 +0.72
Morocco 60.1 +5.9 +0.66
Tunisia 65.5 +5.5 +0.61
Comoros* 50.0 +5.4 +0.60
Senegal* 61.6 +5.4 +0.60
Last 10 Years: 2007-2016
Country 2016 Score
Trend Annual average
trend
Libya 33.3 -13.3 -1.48
Madagascar 49.3 -6.6 -0.73
Burundi 39.9 -6.5 -0.72
Eritrea 29.2 -4.3 -0.48
Mauritania 44.5 -2.5 -0.28
Mali 51.9 -2.4 -0.27
Gambia 49.2 -2.1 -0.23
Ghana 65.0 -1.5 -0.17
South Africa 70.1 -1.3 -0.14
CAR 30.5 -1.3 -0.14
Last 10 Years: 2007-2016
Country 2016 Score
Trend Annual average
trend
Côte d'Ivoire 54.2 +8.2 +2.05
Zimbabwe 45.4 +5.8 +1.45
Togo 51.7 +5.1 +1.28
Kenya 59.3 +4.9 +1.23
Morocco 60.1 +4.9 +1.23
Namibia 71.2 +4.0 +1.00
Tunisia 65.5 +3.6 +0.90
Seychelles 73.4 +3.4 +0.85
Madagascar 49.3 +3.3 +0.83
Nigeria 48.1 +3.3 +0.83
Last 5 Years: 2012-2016
Country 2016 Score
Trend Annual average
trend
Libya 33.3 -11.8 -2.95
South Sudan 20.2 -8.5 -2.13
Burundi 39.9 -6.0 -1.50
CAR 30.5 -3.9 -0.98
Gambia 49.2 -3.5 -0.88
Ghana 65.0 -2.8 -0.70
Botswana 72.7 -2.5 -0.63
Mozambique 52.2 -1.8 -0.45
Mauritania 44.5 -1.6 -0.40
Zambia 57.7 -1.4 -0.35
Last 5 Years: 2012-2016
Country 2016 Score
Mauritius 81.4
Seychelles 73.4
Botswana 72.7
Cabo Verde 72.2
Namibia 71.2
South Africa 70.1
Tunisia 65.5
Ghana 65.0
Rwanda 63.9
Senegal 61.6
Country 2016 Score
Angola 39.4
Equatorial Guinea 36.8
Chad 35.2
DRC 35.0
Libya 33.3
Sudan 32.5
CAR 30.5
Eritrea 29.2
South Sudan 20.2
Somalia 11.6
* One other country (Seychelles) also improved by +5.4
Number of countries to have improved/deteriorated: Overall Governance
6
54
48
42
36
30
24
18
12
0
Improved Deteriorated No score change
4034
12
201 0
Top 10/Bottom 10 Tables

99
2017 IIAG: Index Report
2007-2016 2012-2016
Safety & Rule of Law
Top 10 most improved countries
Top 10 most deteriorated countries
Top 10 countries
Bottom 10 countries
Country 2016 Score
Trend Annual average
trend
Côte d'Ivoire 58.9 +16.4 +1.82
Comoros 58.9 +13.5 +1.50
Liberia 61.4 +12.1 +1.34
Sierra Leone 60.6 +8.9 +0.99
Kenya 56.8 +6.4 +0.71
Zimbabwe 46.0 +5.8 +0.64
Chad 41.5 +5.5 +0.61
Guinea 51.0 +5.0 +0.56
Togo 59.7 +5.0 +0.56
Senegal 65.2 +2.6 +0.29
Last 10 Years: 2007-2016
Country 2016 Score
Trend Annual average
trend
Burundi 26.2 -23.6 -2.62
Libya 24.3 -23.1 -2.57
Gambia 45.2 -12.3 -1.37
Mozambique 52.7 -11.7 -1.30
Egypt 49.8 -9.1 -1.01
Madagascar 54.7 -8.6 -0.96
Cameroon 44.5 -8.6 -0.96
Eritrea 32.5 -7.5 -0.83
Malawi 62.7 -7.1 -0.79
CAR 23.3 -7.0 -0.78
Last 10 Years: 2007-2016
Country 2016 Score
Trend Annual average
trend
Côte d'Ivoire 58.9 +10.6 +2.65
Madagascar 54.7 +7.4 +1.85
Kenya 56.8 +6.7 +1.68
Zimbabwe 46.0 +5.2 +1.30
Tanzania 62.9 +4.4 +1.10
Comoros 58.9 +4.3 +1.08
Rwanda 64.1 +4.1 +1.03
Nigeria 46.4 +4.0 +1.00
Namibia 78.1 +3.9 +0.98
Senegal* 65.2 +3.3 +0.83
Last 5 Years: 2012-2016
Country 2016 Score
Trend Annual average
trend
South Sudan 14.0 -20.8 -5.20
Burundi 26.2 -20.4 -5.10
Libya 24.3 -16.2 -4.05
Gambia 45.2 -8.8 -2.20
Cameroon 44.5 -8.4 -2.10
Mozambique 52.7 -8.2 -2.05
CAR 23.3 -7.2 -1.80
Niger 52.9 -4.2 -1.05
Eritrea 32.5 -3.2 -0.80
Congo 42.1 -3.0 -0.75
Last 5 Years: 2012-2016
Country 2016 Score
Mauritius 82.7
Botswana 81.6
Namibia 78.1
Cabo Verde 76.1
Seychelles 74.0
Ghana 71.5
South Africa 67.1
Lesotho 66.6
Zambia 66.4
Senegal 65.2
Country 2016 Score
Chad 41.5
Equatorial Guinea 40.7
Eritrea 32.5
DRC 28.2
Burundi 26.2
Libya 24.3
CAR 23.3
Sudan 21.6
South Sudan 14.0
Somalia 8.5
* One other country (Togo) also improved by +3.3
Number of countries to have improved/deteriorated: Safety & Rule of Law
6
54
48
42
36
30
24
18
12
0
Improved Deteriorated No score change
20
3328
25
0 1

100
Participation & Human Rights
Top 10 most improved countries
Top 10 most deteriorated countries
Top 10 countries
Bottom 10 countries
Country 2016 Score
Trend Annual average
trend
Tunisia 70.2 +28.7 +3.19
Côte d'Ivoire 54.1 +13.5 +1.50
Zimbabwe 42.8 +11.6 +1.29
Guinea 47.9 +10.6 +1.18
Togo 51.6 +10.2 +1.13
Seychelles 69.5 +9.0 +1.00
Ethiopia 40.1 +8.9 +0.99
Libya 27.6 +8.3 +0.92
Sudan 26.1 +7.9 +0.88
Rwanda 51.5 +7.8 +0.87
Last 10 Years: 2007-2016
Country 2016 Score
Trend Annual average
trend
Mali 50.8 -8.6 -0.96
Burundi 38.8 -8.5 -0.94
Mauritania 36.9 -7.8 -0.87
Gambia 37.6 -3.9 -0.43
DRC 32.7 -3.9 -0.43
Swaziland 24.6 -3.6 -0.40
Eritrea 17.9 -3.3 -0.37
Botswana 66.9 -3.3 -0.37
Burkina Faso 56.4 -2.7 -0.30
Comoros 48.2 -2.3 -0.26
Last 10 Years: 2007-2016
Country 2016 Score
Trend Annual average
trend
Madagascar 61.8 +11.0 +2.75
Tunisia 70.2 +10.9 +2.73
Zimbabwe 42.8 +8.0 +2.00
Guinea-Bissau 46.3 +7.4 +1.85
Seychelles 69.5 +7.3 +1.83
Côte d'Ivoire 54.1 +6.9 +1.73
Ethiopia 40.1 +6.3 +1.58
Namibia 75.5 +5.5 +1.38
Sierra Leone 63.4 +4.8 +1.20
Sudan 26.1 +4.3 +1.08
Last 5 Years: 2012-2016
Country 2016 Score
Trend Annual average
trend
Libya 27.6 -7.4 -1.85
Egypt 27.2 -6.2 -1.55
South Sudan 20.7 -5.2 -1.30
Burundi 38.8 -4.5 -1.13
Swaziland 24.6 -3.6 -0.90
Mali 50.8 -3.4 -0.85
Niger 53.7 -3.3 -0.83
DRC 32.7 -2.9 -0.73
Zambia* 57.7 -2.8 -0.70
Mauritania* 36.9 -2.8 -0.70
Last 5 Years: 2012-2016
Country 2016 Score
Cabo Verde 78.0
Mauritius 77.5
Namibia 75.5
South Africa 74.7
Ghana 72.0
Benin 70.8
Tunisia 70.2
Seychelles 69.5
Senegal 68.3
Botswana 66.9
Country 2016 Score
DRC 32.7
Chad 31.0
Libya 27.6
Egypt 27.2
Sudan 26.1
Swaziland 24.6
Equatorial Guinea 22.8
South Sudan 20.7
Eritrea 17.9
Somalia 14.6
* One other country (Cabo Verde) also deteriorated by -2.8
Number of countries to have improved/deteriorated: Participation & Human Rights
6
54
48
42
36
30
24
18
12
0
Improved Deteriorated No score change
3532
1822
0 0
2007-2016 2012-2016
Top 10/Bottom 10 Tables

101
2017 IIAG: Index Report
Sustainable Economic Opportunity
Top 10 most improved countries
Top 10 most deteriorated countries
Top 10 countries
Bottom 10 countries
Country 2016 Score
Trend Annual average
trend
Zimbabwe 37.2 +12.2 +1.36
Togo 41.4 +11.2 +1.24
Morocco 68.2 +10.9 +1.21
Rwanda 67.7 +10.8 +1.20
Mauritius 79.4 +9.9 +1.10
Côte d'Ivoire 50.0 +8.9 +0.99
Niger 46.7 +8.4 +0.93
Seychelles 65.0 +7.6 +0.84
Liberia 39.6 +7.2 +0.80
Egypt 57.8 +6.7 +0.74
Last 10 Years: 2007-2016
Country 2016 Score
Trend Annual average
trend
Libya 21.5 -23.8 -2.64
Madagascar 37.9 -8.8 -0.98
Eritrea 21.6 -4.8 -0.53
Algeria 51.1 -4.2 -0.47
Malawi 45.9 -3.7 -0.41
Tunisia 58.2 -3.1 -0.34
Sierra Leone 38.5 -2.9 -0.32
Botswana 64.6 -2.8 -0.31
Ethiopia 45.0 -2.7 -0.30
Ghana 51.1 -2.0 -0.22
Last 10 Years: 2007-2016
Country 2016 Score
Trend Annual average
trend
Zimbabwe 37.2 +9.9 +2.48
Morocco 68.2 +9.3 +2.33
Côte d'Ivoire 50.0 +7.9 +1.98
Egypt 57.8 +7.7 +1.93
Togo 41.4 +7.6 +1.90
Niger 46.7 +6.0 +1.50
Kenya 57.2 +4.1 +1.03
Namibia 64.2 +3.5 +0.88
Tanzania 49.5 +3.4 +0.85
Comoros* 35.6 +3.3 +0.83
Last 5 Years: 2012-2016
Country 2016 Score
Trend Annual average
trend
Libya 21.5 -16.3 -4.08
South Sudan 17.8 -6.6 -1.65
Sierra Leone 38.5 -6.5 -1.63
CAR 30.0 -5.3 -1.33
Mauritania 43.1 -5.0 -1.25
Gambia 51.8 -3.7 -0.93
Botswana 64.6 -3.5 -0.88
Angola 29.4 -3.3 -0.83
Malawi 45.9 -3.1 -0.78
Ethiopia 45.0 -2.7 -0.68
Last 5 Years: 2012-2016
Country 2016 Score
Mauritius 79.4
Morocco 68.2
Rwanda 67.7
South Africa 67.6
Seychelles 65.0
Botswana 64.6
Namibia 64.2
Cabo Verde 60.6
Tunisia 58.2
Egypt 57.8
Country 2016 Score
DRC 31.4
Chad 30.8
CAR 30.0
Angola 29.4
Guinea-Bissau 28.8
Equatorial Guinea 28.3
Eritrea 21.6
Libya 21.5
South Sudan 17.8
Somalia 6.6
* Two other countries (Equatorial Guinea and São Tomé & PrÍncipe) also improved by +3.3
Number of countries to have improved/deteriorated: Sustainable Economic Opportunity
6
54
48
42
36
30
24
18
12
0
Improved Deteriorated No score change
38
29
15
23
0 2
2007-2016 2012-2016

102
Human Development
Top 10 most improved countries
Top 10 most deteriorated countries
Top 10 countries
Bottom 10 countries
Country 2016 Score
Trend Annual average
trend
Rwanda 72.4 +16.8 +1.87
Ethiopia 56.7 +14.3 +1.59
Togo 54.2 +13.5 +1.50
Côte d'Ivoire
53.9 +11.8 +1.31
Kenya 67.1 +11.6 +1.29
Senegal 58.0 +10.4 +1.16
Zambia 57.7 +9.7 +1.08
Angola 45.5 +9.5 +1.06
Morocco 65.1 +8.8 +0.98
Niger 47.1 +8.8 +0.98
Last 10 Years: 2007-2016
Country 2016 Score
Trend Annual average
trend
Libya 59.7 -14.9 -1.66
Madagascar 42.8 -9.8 -1.09
Tunisia 70.5 -3.6 -0.40
Somalia 16.6 -3.0 -0.33
Eritrea 44.8 -1.4 -0.16
Ghana 65.2 -0.9 -0.10
Last 10 Years: 2007-2016
Country 2016 Score
Trend Annual average
trend
Côte d'Ivoire 53.9 +7.4 +1.85
Egypt 62.6 +7.0 +1.75
Togo 54.2 +6.3 +1.58
Kenya 67.1 +5.9 +1.48
Senegal 58.0 +5.3 +1.33
Uganda 59.3 +5.3 +1.33
Nigeria 51.1 +4.4 +1.10
Equatorial Guinea
55.3 +3.9 +0.98
Somalia 16.6 +3.8 +0.95
Niger* 47.1 +3.7 +0.93
Last 5 Years: 2012-2016
Country 2016 Score
Trend Annual average
trend
Libya 59.7 -7.5 -1.88
Ghana 65.2 -4.1 -1.03
Sierra Leone 44.5 -3.8 -0.95
CAR 29.9 -3.6 -0.90
Madagascar 42.8 -2.8 -0.70
Liberia 47.0 -2.6 -0.65
Gambia 62.0 -2.5 -0.63
Botswana 78.0 -1.6 -0.40
South Sudan 28.2 -1.5 -0.38
Benin 54.0 -1.3 -0.33
Last 5 Years: 2012-2016
Country 2016 Score
Mauritius 86.1
Seychelles 84.9
Botswana 78.0
Cabo Verde 74.0
Rwanda 72.4
Algeria 71.0
São Tomé & Príncipe
70.9
South Africa 70.7
Tunisia 70.5
Kenya 67.1
Country 2016 Score
Guinea 45.9
Angola 45.5
Sudan 45.5
Eritrea 44.8
Sierra Leone 44.5
Madagascar 42.8
Chad 37.7
CAR 29.9
South Sudan 28.2
Somalia 16.6
* One other country (Swaziland) also improved by +3.7
Only six countries deteriorate in this period
Number of countries to have improved/deteriorated: Human Development
6
54
48
42
36
30
24
18
12
0
Improved Deteriorated No score change
46
37
6
171 0
2007-2016 2012-2016
Top 10/Bottom 10 Tables


104
African average scores over the last ten years, all indicators
2007 2008 2009 2010 2011 2012 2013 2014 2015 2016 Trend 2007
-2016
Annual average
trend
Trend 2012
-2016
Annual average
trend
Africa (Average scores)Score / 100.0; 100.0=best
OVERALL GOVERNANCE 49.4 49.8 49.9 50.3 50.2 50.4 50.3 50.2 50.5 50.8 +1.4 +0.16 +0.4 +0.10
SAFETY & RULE OF LAW 55.2 55.0 54.2 54.1 53.6 53.5 52.5 52.1 52.0 52.8 -2.4 -0.27 -0.7 -0.18
RULE OF LAW 53.2 52.9 51.9 51.7 51.4 51.2 50.6 51.7 52.6 53.2 0.0 0.00 +2.0 +0.50
Judicial Independence (BS/WEF/V-Dem/GI) 41.4 41.8 41.5 41.3 40.8 40.6 41.0 42.1 43.8 44.0 +2.6 +0.29 +3.4 +0.85
Judicial Process (EIU/GI) 43.9 44.6 44.5 44.7 44.3 43.9 44.2 45.3 48.3 46.2 +2.3 +0.26 +2.3 +0.58
Access to Justice (V-Dem) 60.7 60.7 60.4 61.6 61.3 61.8 60.0 59.9 59.7 60.0 -0.7 -0.08 -1.8 -0.45
Property Rights (BS/HER/WEF/AfDB/WB) 47.3 47.3 46.6 46.4 45.4 44.9 44.2 44.0 44.8 48.9 +1.6 +0.18 +4.0 +1.00
Transfers of Power (EIU) 41.8 39.6 36.3 33.0 33.2 33.6 34.7 38.1 39.3 38.3 -3.5 -0.39 +4.7 +1.18
Multilateral Sanctions (CDD) 84.3 83.7 82.4 83.0 83.3 82.1 79.6 80.9 79.6 82.1 -2.2 -0.24 0.0 0.00
ACCOUNTABILITY 35.2 36.0 35.2 34.4 35.0 35.7 34.9 33.2 34.6 35.8 +0.6 +0.07 +0.1 +0.03
Access to Information (GI) 28.2 28.2 28.2 28.2 27.6 27.6 27.6 26.8 29.4 31.2 +3.0 +0.33 +3.6 +0.90
Online Public Services (UNDESA) 22.8 23.9 21.1 18.4 26.6 34.7 31.0 27.2 31.0 34.7 +11.9 +1.32 0.0 0.00
Public Sector Accountability & Transparency (V-Dem/AfDB/WB)
45.4 44.5 44.0 43.9 45.3 45.5 46.3 46.6 46.7 46.9 +1.5 +0.17 +1.4 +0.35
Accountability of Public Officials (EIU/BS) 37.0 39.1 38.4 37.3 37.3 37.1 36.9 36.4 36.4 36.7 -0.3 -0.03 -0.4 -0.10
Corruption in Government & Public Officials (EIU) 35.2 37.1 36.4 35.7 35.1 34.3 33.0 33.2 32.6 34.1 -1.1 -0.12 -0.2 -0.05
Corruption & Bureaucracy (WB) 45.8 46.5 45.2 44.7 43.9 43.9 43.4 36.0 37.0 37.0 -8.8 -0.98 -6.9 -1.73
Diversion of Public Funds (WEF) 38.4 39.4 39.6 38.1 35.4 34.1 32.6 33.4 36.2 37.4 -1.0 -0.11 +3.3 +0.83
Corruption Investigation (GI/AFR) 33.9 33.8 33.5 33.2 32.4 31.9 31.8 29.6 32.1 32.3 -1.6 -0.18 +0.4 +0.10
PERSONAL SAFETY 52.1 51.9 50.3 49.6 47.3 46.9 45.7 46.0 45.5 45.7 -6.4 -0.71 -1.2 -0.30
Safety of the Person (EIU/AFR) 54.8 53.6 44.3 43.6 44.3 44.6 46.0 45.7 44.8 42.9 -11.9 -1.32 -1.7 -0.43
Police Services (WEF/GI) 26.5 27.2 26.4 25.8 24.8 24.6 24.6 28.2 31.2 34.3 +7.8 +0.87 +9.7 +2.43
Social Unrest (EIU/ACLED) 70.9 70.8 70.4 68.6 62.6 60.4 57.5 54.3 52.0 52.9 -18.0 -2.00 -7.5 -1.88
Crime (EIU/AFR) 51.5 53.9 54.0 52.3 50.3 50.2 48.1 48.9 48.0 49.0 -2.5 -0.28 -1.2 -0.30
Political Violence (ACLED/PTS) 68.9 69.5 71.5 71.0 67.2 67.9 66.8 66.7 66.0 66.7 -2.2 -0.24 -1.2 -0.30
Human Trafficking (USDS) 40.0 36.4 34.8 36.8 34.4 33.7 31.3 32.2 30.8 27.9 -12.1 -1.34 -5.8 -1.45
NATIONAL SECURITY 80.1 79.3 79.5 80.9 80.6 80.2 78.7 77.5 75.4 76.4 -3.7 -0.41 -3.8 -0.95
Government Involvement in Armed Conflict (UCDP) 94.8 93.5 93.5 94.8 91.6 91.4 88.1 87.9 76.8 82.7 -12.1 -1.34 -8.7 -2.18
Domestic Armed Conflict (EIU) 60.4 60.8 59.0 59.4 54.6 53.7 54.2 54.6 56.0 55.6 -4.8 -0.53 +1.9 +0.48
Violence by Non-state Actors (ACLED) 93.0 90.2 91.8 90.5 90.2 86.0 81.8 80.8 80.4 81.2 -11.8 -1.31 -4.8 -1.20
Cross-border Tensions (EIU) 54.2 51.9 51.4 59.0 64.1 66.4 65.3 62.3 61.8 60.6 +6.4 +0.71 -5.8 -1.45
Internally Displaced People (IDMC) 90.4 90.7 92.4 92.4 93.6 93.1 91.9 89.6 89.1 90.2 -0.2 -0.02 -2.9 -0.73
Political Refugees (UNHCR) 88.2 88.6 89.5 89.7 89.7 90.0 89.9 88.6 86.9 86.5 -1.7 -0.19 -3.5 -0.88
PARTICIPATION & HUMAN RIGHTS 47.2 47.1 46.9 47.5 48.0 48.4 48.8 48.8 49.4 49.4 +2.2 +0.24 +1.0 +0.25
PARTICIPATION 48.0 47.1 46.0 46.4 47.7 48.5 49.1 49.6 49.8 49.6 +1.6 +0.18 +1.1 +0.28
Political Participation (EIU/FH/V-Dem) 53.5 53.4 53.3 53.5 56.2 57.0 57.6 57.2 57.1 56.9 +3.4 +0.38 -0.1 -0.03
Civil Society Participation (BS/V-Dem/GI) 56.9 56.3 55.8 56.4 57.0 57.4 57.3 56.3 56.4 56.3 -0.6 -0.07 -1.1 -0.28
Free & Fair Elections (BS/CDD/V-Dem) 45.4 44.4 42.6 42.3 43.7 44.8 45.9 48.4 49.9 50.5 +5.1 +0.57 +5.7 +1.43
Election Monitoring Agencies (V-Dem/GI) 38.9 39.1 39.0 39.4 40.3 41.0 41.4 43.1 42.6 41.3 +2.4 +0.27 +0.3 +0.08
Legitimacy of Political Process (BS) 44.7 41.1 37.5 38.9 39.9 41.0 42.2 41.7 41.2 41.2 -3.5 -0.39 +0.2 +0.05
RIGHTS 42.4 42.8 42.4 42.6 42.8 43.0 43.1 42.4 43.4 43.4 +1.0 +0.11 +0.4 +0.10
Freedom of Expression (BS/RSF/V-Dem/GI) 59.7 59.5 59.2 59.2 59.8 60.1 60.6 59.6 58.3 56.6 -3.1 -0.34 -3.5 -0.88
Freedom of Association & Assembly (BS/GI) 49.4 48.6 47.9 48.3 48.6 48.8 49.0 42.5 45.2 43.4 -6.0 -0.67 -5.4 -1.35
Civil Liberties (BS/FH) 48.9 48.4 46.9 46.8 46.8 45.8 46.0 45.0 44.3 44.1 -4.8 -0.53 -1.7 -0.43
Human Rights Conventions (UNOLA/OHCHR) 48.2 49.7 51.8 54.5 55.0 58.0 58.8 60.5 62.2 63.1 +14.9 +1.66 +5.1 +1.28
Human Rights Violations (EIU) 33.7 35.7 34.0 32.4 31.9 30.8 29.7 30.6 30.4 31.0 -2.7 -0.30 +0.2 +0.05
Protection against Discrimination (GI) 14.6 14.6 14.6 14.6 14.6 14.6 14.6 16.0 19.7 22.0 +7.4 +0.82 +7.4 +1.85
GENDER 51.2 51.5 52.4 53.4 53.6 53.8 54.1 54.5 55.0 55.1 +3.9 +0.43 +1.3 +0.33
Gender Equality (AfDB/WB) 57.3 57.3 57.7 58.5 56.9 57.4 57.1 58.1 57.4 57.0 -0.3 -0.03 -0.4 -0.10
Women's Political Participation (IPU/GI/WB) 34.8 35.6 36.1 37.0 37.8 39.0 40.4 40.1 40.7 40.6 +5.8 +0.64 +1.6 +0.40
Gender Balance in Education (UNESCO) 64.1 66.6 67.8 68.7 67.9 69.3 70.7 70.6 71.0 71.1 +7.0 +0.78 +1.8 +0.45
Women's Labour Force Participation (WB) 59.1 59.3 59.4 59.5 59.5 59.6 60.0 60.1 60.2 60.3 +1.2 +0.13 +0.7 +0.18
Workplace Gender Equality (GI) 34.9 34.9 34.9 34.9 34.7 34.7 34.7 37.0 43.1 43.1 +8.2 +0.91 +8.4 +2.10
Women in the Judiciary (GI) 61.3 61.3 61.3 61.3 60.2 60.2 60.2 59.7 56.5 58.3 -3.0 -0.33 -1.9 -0.48
Laws on Violence against Women (OECD) 34.9 34.9 39.8 44.8 49.7 47.1 44.4 44.4 44.4 44.4 +9.5 +1.06 -2.7 -0.68
Women's Political Empowerment (V-Dem) 61.7 61.8 62.0 63.1 63.8 64.6 66.8 67.2 67.6 67.2 +5.5 +0.61 +2.6 +0.65
SUSTAINABLE ECONOMIC OPPORTUNITY 43.8 44.4 45.0 45.3 44.7 44.7 44.9 44.4 44.8 45.1 +1.3 +0.14 +0.4 +0.10
PUBLIC MANAGEMENT 46.6 46.3 46.0 46.1 45.0 45.2 45.6 44.8 44.8 44.9 -1.7 -0.19 -0.3 -0.08
Governmental Statistical Capacity (WB) 53.9 52.8 53.9 55.4 55.2 55.2 55.5 54.7 56.3 56.4 +2.5 +0.28 +1.2 +0.30
Civil Registration (GI) 59.7 59.7 59.7 59.7 59.3 59.3 59.3 59.3 59.3 59.7 0.0 0.00 +0.4 +0.10
Public Administration (AfDB/WB) 59.1 58.0 58.4 59.0 56.3 56.9 60.6 57.4 57.1 57.2 -1.9 -0.21 +0.3 +0.08
If Annual Average Trend appears the same in the two time periods, differences may exist beyond the 2nd decimal place.

105
2017 IIAG: Index Report
Increasing Improvement Increasing Deterioration No ChangeSlowing Improvement Slowing DeteriorationWarning Signs Bouncing Back
2007 2008 2009 2010 2011 2012 2013 2014 2015 2016 Trend 2007
-2016
Annual average
trend
Trend 2012
-2016
Annual average
trend
Africa (Average scores)Score / 100.0; 100.0=best
Diversification (AfDB/OECD/UNDP) 12.2 11.3 13.7 12.0 9.2 9.0 8.7 8.8 9.4 9.4 -2.8 -0.31 +0.4 +0.10
Budget Management (AfDB/WB) 56.0 56.7 57.9 58.5 56.7 56.7 58.0 57.3 57.5 57.7 +1.7 +0.19 +1.0 +0.25
Budget Balance (AfDB/AUC/UNECA) 59.4 56.3 47.6 48.8 48.2 47.9 47.2 44.2 43.1 43.4 -16.0 -1.78 -4.5 -1.13
Fiscal Policy (AfDB/WB) 63.7 64.7 65.0 64.7 63.9 64.9 65.8 62.2 61.3 60.0 -3.7 -0.41 -4.9 -1.23
Revenue Mobilisation (ICTD/AfDB/WB) 43.5 45.2 45.8 44.7 44.7 45.4 44.0 46.2 46.9 46.9 +3.4 +0.38 +1.5 +0.38
Transparency of State-owned Companies (GI) 12.7 12.7 12.7 12.7 12.5 12.5 12.5 14.4 13.0 14.4 +1.7 +0.19 +1.9 +0.48
BUSINESS ENVIRONMENT 44.1 44.3 44.4 44.9 44.5 43.9 43.6 42.8 43.1 43.5 -0.6 -0.07 -0.4 -0.10
Investment Climate (HER) 45.6 46.3 45.6 46.7 48.3 49.9 53.1 52.6 54.2 57.4 +11.8 +1.31 +7.5 +1.88
Competition (BS/GI/AfDB/WB) 48.7 48.8 49.0 48.8 47.9 48.1 48.0 47.9 48.5 48.2 -0.5 -0.06 +0.1 +0.03
Business Bureaucracy & Red Tape (EIU) 28.1 28.6 28.9 28.3 29.0 28.1 27.9 27.6 27.0 25.5 -2.6 -0.29 -2.6 -0.65
Customs Procedures (WEF) 42.2 41.7 48.0 54.9 53.7 50.5 47.0 44.7 44.8 46.8 +4.6 +0.51 -3.7 -0.93
Soundness of Banks (WEF) 66.2 66.0 62.0 59.4 58.3 56.7 52.1 48.0 45.7 43.1 -23.1 -2.57 -13.6 -3.40
Employment Creation (AFR) 37.0 37.4 36.9 35.8 34.8 33.8 35.8 36.7 37.8 37.9 +0.9 +0.10 +4.1 +1.03
Regional Integration (AfDB) 57.2 57.2 57.2 57.2 56.4 56.4 56.4 57.2 58.0 58.8 +1.6 +0.18 +2.4 +0.60
INFRASTRUCTURE 35.8 36.9 37.9 38.3 38.1 38.7 39.0 40.1 40.8 41.3 +5.5 +0.61 +2.6 +0.65
Transport Infrastructure (WEF/AFR/EIU/GI) 33.5 34.4 34.9 35.0 34.3 34.3 33.8 36.1 35.7 37.1 +3.6 +0.40 +2.8 +0.70
Electricity Infrastructure (WEF/AFR) 39.6 40.3 40.7 39.4 38.2 38.4 37.6 37.3 38.3 37.4 -2.2 -0.24 -1.0 -0.25
Digital & IT Infrastructure (EIU/ITU) 16.9 19.2 22.6 25.2 26.9 29.4 30.8 32.4 34.3 34.9 +18.0 +2.00 +5.5 +1.38
Access to Improved Water (WHO/UNICEF) 54.1 54.9 55.7 56.5 56.8 57.6 58.4 59.1 59.9 59.9 +5.8 +0.64 +2.3 +0.58
Water & Sanitation Services (AFR) 43.2 43.2 42.1 40.8 39.5 37.9 38.7 39.8 40.8 40.9 -2.3 -0.26 +3.0 +0.75
RURAL SECTOR 49.4 51.2 52.6 52.7 52.2 52.0 52.3 50.6 51.5 51.5 +2.1 +0.23 -0.5 -0.13
Rural Land & Water (IFAD) 44.7 48.4 51.2 51.2 51.7 51.8 52.2 53.3 54.0 54.0 +9.3 +1.03 +2.2 +0.55
Rural Business Climate (IFAD) 52.5 53.0 53.9 54.1 53.3 52.9 53.3 51.9 53.4 53.4 +0.9 +0.10 +0.5 +0.13
Rural Development Resources (IFAD) 52.2 54.8 56.5 56.1 54.9 53.7 54.3 51.9 52.9 52.9 +0.7 +0.08 -0.8 -0.20
Agricultural Support System (IFAD) 45.1 48.3 52.9 53.4 53.6 54.6 57.0 56.1 56.5 56.5 +11.4 +1.27 +1.9 +0.48
Agricultural Policy Costs (WEF) 58.8 59.7 57.8 58.3 57.7 57.2 54.9 52.2 52.3 51.5 -7.3 -0.81 -5.7 -1.43
Engagement with Rural Organisations (IFAD) 48.9 51.5 54.8 54.8 55.2 56.4 56.7 56.2 57.0 57.0 +8.1 +0.90 +0.6 +0.15
Gender Balance in Rural Decision-making (IFAD) 49.6 48.5 48.7 49.1 48.1 47.6 48.9 44.0 45.6 45.6 -4.0 -0.44 -2.0 -0.50
Rural Accountability & Transparency (IFAD) 48.0 50.0 50.2 48.2 48.0 47.7 48.8 48.0 49.0 49.0 +1.0 +0.11 +1.3 +0.33
HUMAN DEVELOPMENT 51.7 52.4 53.3 54.1 54.3 54.8 55.0 55.4 55.8 56.1 +4.4 +0.49 +1.3 +0.33
WELFARE 46.7 47.3 47.8 48.3 47.6 47.8 47.7 48.3 48.1 48.5 +1.8 +0.20 +0.7 +0.18
Welfare Services (AfDB/WB) 60.3 61.0 61.3 62.0 61.5 62.8 62.9 64.2 64.7 65.2 +4.9 +0.54 +2.4 +0.60
Social Safety Nets (BS) 40.1 42.0 44.0 45.0 45.5 45.0 44.6 44.1 43.5 43.5 +3.4 +0.38 -1.5 -0.38
Social Protection & Labour (AfDB/WB) 51.7 52.7 53.3 53.3 51.4 51.8 51.6 52.3 52.6 52.9 +1.2 +0.13 +1.1 +0.28
Social Exclusion (BS) 23.3 23.3 23.3 22.9 22.1 22.1 22.1 21.4 20.8 20.8 -2.5 -0.28 -1.3 -0.33
Poverty (AFR) 47.5 47.4 47.6 48.0 48.4 49.1 51.1 54.1 54.8 55.5 +8.0 +0.89 +6.4 +1.60
Poverty Reduction Priorities (AFR/AfDB/WB) 52.4 53.1 53.0 52.6 51.1 50.5 49.7 50.0 49.8 50.5 -1.9 -0.21 0.0 0.00
Narrowing Income Gaps (AFR) 34.8 33.8 34.1 33.5 33.0 32.1 33.9 35.1 36.3 37.0 +2.2 +0.24 +4.9 +1.23
Environmental Policy (BS) 41.2 41.5 41.9 41.7 40.6 40.9 41.2 41.1 40.9 40.9 -0.3 -0.03 0.0 0.00
Environmental Sustainability (AfDB/WB) 58.7 58.4 59.0 60.7 61.2 62.6 62.0 62.7 63.3 62.8 +4.1 +0.46 +0.2 +0.05
EDUCATION 44.7 45.3 46.4 47.5 47.6 48.1 48.3 48.2 48.2 48.3 +3.6 +0.40 +0.2 +0.05
Education Provision (AFR) 58.8 58.1 57.4 57.2 57.0 55.8 52.8 48.4 47.3 47.5 -11.3 -1.26 -8.3 -2.08
Education Quality (BS) 39.9 41.7 43.4 44.6 44.7 44.9 45.1 43.6 42.0 42.0 +2.1 +0.23 -2.9 -0.73
Educational System Management (WEF) 39.1 39.9 42.4 44.4 43.6 42.1 41.5 42.0 41.2 40.8 +1.7 +0.19 -1.3 -0.33
Human Resources in Primary Schools (UNESCO) 66.9 67.4 67.6 68.7 68.8 69.6 70.4 70.8 71.1 71.2 +4.3 +0.48 +1.6 +0.40
Primary School Completion (WB) 50.5 52.7 54.1 55.2 55.5 56.9 57.1 57.8 58.1 58.1 +7.6 +0.84 +1.2 +0.30
Secondary School Enrolment (UNESCO) 35.8 37.7 39.3 40.8 41.4 42.8 43.8 44.4 45.0 45.1 +9.3 +1.03 +2.3 +0.58
Tertiary Education Enrolment (UNESCO) 13.1 14.0 15.2 15.9 16.5 17.4 18.3 18.9 19.7 19.5 +6.4 +0.71 +2.1 +0.53
Literacy (WB) 59.0 59.8 60.8 62.0 63.2 64.1 64.9 66.0 66.1 67.0 +8.0 +0.89 +2.9 +0.73
HEALTH 63.5 64.8 65.7 66.6 67.7 68.7 69.1 69.8 70.9 71.5 +8.0 +0.89 +2.8 +0.70
Basic Health Services (AFR) 61.0 60.2 59.8 59.8 59.7 58.7 56.1 52.5 52.1 52.0 -9.0 -1.00 -6.7 -1.68
Public Health Campaigns (GI) 68.4 68.4 68.4 68.4 68.1 68.1 68.1 67.1 70.4 70.4 +2.0 +0.22 +2.3 +0.58
Child Mortality (IGME) 62.5 64.3 66.2 68.1 69.5 71.1 72.5 73.7 74.8 74.8 +12.3 +1.37 +3.7 +0.93
Maternal Mortality (MMEIG) 79.9 80.6 81.1 81.7 81.9 82.4 82.9 83.3 83.7 83.7 +3.8 +0.42 +1.3 +0.33
Access to Sanitation (WHO/UNICEF) 52.6 53.2 53.7 54.3 54.1 54.7 55.2 55.8 56.3 56.3 +3.7 +0.41 +1.6 +0.40
Undernourishment (WB) 69.4 70.5 71.7 72.8 73.9 74.8 75.4 75.8 76.2 76.2 +6.8 +0.76 +1.4 +0.35
Disease (WHO) 79.6 80.0 79.1 79.8 81.7 82.4 81.9 83.6 83.5 83.5 +3.9 +0.43 +1.1 +0.28
Immunisation (WB/WHO) 75.0 76.1 78.1 78.8 79.1 79.8 78.6 78.4 78.3 78.2 +3.2 +0.36 -1.6 -0.40
Antiretroviral Treatment (ART) Provision (UNAIDS) 18.7 24.6 28.4 30.6 36.8 41.1 45.8 50.8 55.5 60.2 +41.5 +4.61 +19.1 +4.78


Country Scorecards

108
2017 IIAG Algeria Scores, Ranks & Trends
SAFETY & RULE OF LAW 49.5 35 -0.60 -0.45
RULE OF LAW 38.2 41 -1.09 -0.20
Judicial Independence (BS/WEF/V-Dem/GI) 28.5 39 -0.41 +0.73
Judicial Process (EIU/GI) 29.2 36 -2.78 -6.25
Access to Justice (V-Dem) 59.6 32 +0.87 +1.95
Property Rights (BS/HER/WEF/AfDB/WB) 45.5 33 -0.48 +2.43
Transfers of Power (EIU) 0.0 38 -3.70 0.00
Multilateral Sanctions (CDD) 66.7 31 0.00 0.00
ACCOUNTABILITY 32.6 32 -0.71 -0.88
Access to Information (GI) 41.7 13 +1.86 +4.18
Online Public Services (UNDESA) 8.8 46 -2.50 -6.43
Public Sector Accountability & Transparency (V-Dem/AfDB/WB)
55.7 20 +0.53 +1.20
Accountability of Public Officials (EIU/BS) 38.1 17 0.00 0.00
Corruption in Government & Public Officials (EIU) 40.0 17 0.00 0.00
Corruption & Bureaucracy (WB) 19.0 33 -4.23 -9.53
Diversion of Public Funds (WEF) 41.5 17 -0.06 +6.38
Corruption Investigation (GI/AFR) 16.0 39 -1.29 -2.90
PERSONAL SAFETY 47.7 30 -0.74 -0.83
Safety of the Person (EIU/AFR) 56.2 19 -0.27 -0.60
Police Services (WEF/GI) 55.0 7 -0.23 +4.55
Social Unrest (EIU/ACLED) 25.0 45 -5.46 -7.78
Crime (EIU/AFR) 70.7 9 +0.20 +0.45
Political Violence (ACLED/PTS) 79.4 17 +1.29 -1.58
Human Trafficking (USDS) 0.0 39 0.00 0.00
NATIONAL SECURITY 79.4 31 +0.11 +0.08
Government Involvement in Armed Conflict (UCDP) 77.8 33 0.00 0.00
Domestic Armed Conflict (EIU) 50.0 25 0.00 0.00
Violence by Non-state Actors (ACLED) 98.7 20 +0.43 +0.33
Cross-border Tensions (EIU) 50.0 31 0.00 0.00
Internally Displaced People (IDMC) 99.9 28 +0.16 -0.03
Political Refugees (UNHCR) 99.8 12 +0.07 +0.05
SAFETY & RULE OF LAW
SCORE 2016
RANK 2016
10 -YEAR AAT
5-YEAR AAT
SCORE 2016
RANK 2016
10 -YEAR AAT
5-YEAR AAT
PARTICIPATION & HUMAN RIGHTS 42.8 34 +0.58 +0.78
PARTICIPATION 34.1 36 +0.28 +0.60
Political Participation (EIU/FH/V-Dem) 44.0 35 +1.12 +0.40
Civil Society Participation (BS/V-Dem/GI) 34.3 42 -0.01 -0.15
Free & Fair Elections (BS/CDD/V-Dem) 55.2 25 +1.86 +5.38
Election Monitoring Agencies (V-Dem/GI) 25.7 43 -1.58 -2.68
Legitimacy of Political Process (BS) 11.1 25 0.00 0.00
RIGHTS 44.9 29 +0.51 +0.78
Freedom of Expression (BS/RSF/V-Dem/GI) 56.1 32 +0.09 +1.10
Freedom of Association & Assembly (BS/GI) 28.5 34 0.00 -0.70
Civil Liberties (BS/FH ) 41.7 29 0.00 0.00
Human Rights Conventions (UNOLA/OHCHR) 81.0 6 +1.59 +1.20
Human Rights Violations (EIU) 50.0 7 0.00 0.00
Protection against Discrimination (GI) 12.5 30 +1.39 +3.13
GENDER 49.3 35 +0.94 +0.95
Gender Equality (AfDB/WB) 62.5 20 0.00 0.00
Women's Political Participation (IPU/GI/WB) 37.3 27 +2.22 +1.20
Gender Balance in Education (UNESCO) 69.2 31 -0.30 0.00
Women's Labour Force Participation (WB) 6.5 52 +0.50 +0.25
Workplace Gender Equality (GI) 50.0 4 +2.78 +6.25
Women in the Judiciary (GI) 50.0 31 -2.78 -6.25
Laws on Violence against Women (OECD) 33.3 29 +0.92 -2.10
Women's Political Empowerment (V-Dem) 85.6 12 +4.21 +8.18
PARTICIPATION & HUMAN RIGHTS
SCORE 2016
RANK 2016
10 -YEAR AAT
5-YEAR AAT
SUSTAINABLE ECONOMIC OPPORTUNITY 51.1 14 -0.47 -0.13
PUBLIC MANAGEMENT 47.8 23 -0.71 -0.70
Governmental Statistical Capacity (WB) 50.7 34 -0.64 -1.10
Civil Registration (GI) 100.0 1 0.00 0.00
Public Administration (AfDB/WB) 50.0 33 0.00 0.00
Diversification (AfDB/OECD/UNDP) 5.7 27 +0.42 +0.55
Budget Management (AfDB/WB) 55.6 31 0.00 0.00
Budget Balance (AfDB/AUC/UNECA) 24.0 51 -5.51 -6.25
Fiscal Policy (AfDB/WB) 77.8 10 -1.23 0.00
Revenue Mobilisation (ICTD/UNU-WIDER/AfDB/WB) 41.6 37 +0.61 +0.48
Transparency of State-owned Companies (GI) 25.0 7 0.00 0.00
BUSINESS ENVIRONMENT 40.2 33 +0.07 +2.50
Investment Climate (HER) 38.9 41 -0.61 +4.18
Competition (BS/GI/AfDB/WB) 50.8 22 0.00 +0.55
Business Bureaucracy & Red Tape (EIU) 33.3 10 0.00 0.00
Customs Procedures (WEF) 40.3 28 +1.92 +5.58
Soundness of Banks (WEF) 29.5 32 -1.37 +3.68
Employment Creation (AFR) 48.6 9 +0.48 +1.08
Regional Integration (AfDB) . . . .
INFRASTRUCTURE 62.6 9 -0.82 -2.25
Transport Infrastructure (WEF/AFR/EIU/GI) 39.1 22 -1.78 -2.70
Electricity Infrastructure (WEF/AFR) 57.2 9 -1.94 -4.28
Digital & IT Infrastructure (EIU/ITU) 57.1 9 +2.63 +2.98
Access to Improved Water (WHO/UNICEF) 92.3 6 +0.24 +0.20
Water & Sanitation Services (AFR) 67.1 4 -3.32 -7.48
RURAL SECTOR 53.7 23 -0.39 -0.03
Rural Land & Water (IFAD) 41.2 42 0.00 0.00
Rural Business Climate (IFAD) 65.0 8 0.00 0.00
Rural Development Resources (IFAD) 83.3 5 0.00 0.00
Agricultural Support System (IFAD) 37.2 41 0.00 0.00
Agricultural Policy Costs (WEF) 41.5 30 -3.04 -0.20
Engagement with Rural Organisations (IFAD) 56.6 28 0.00 0.00
Gender Balance in Rural Decision-making (IFAD) 50.0 13 0.00 0.00
Rural Accountability & Transparency (IFAD) 55.2 21 0.00 0.00
SUSTAINABLE ECONOMIC OPPORTUNITY
SCORE 2016
RANK 2016
10 -YEAR AAT
5-YEAR AAT
HUMAN DEVELOPMENT 71.0 6 +0.68 +0.13
WELFARE 61.6 8 +0.90 +0.43
Welfare Services (AfDB/WB) 72.0 16 0.00 0.00
Social Safety Nets (BS) 76.9 4 +2.57 +1.93
Social Protection & Labour (AfDB/WB) 55.6 24 +1.24 0.00
Social Exclusion (BS) 57.1 2 0.00 0.00
Poverty (AFR) 78.7 4 -0.89 -2.00
Poverty Reduction Priorities (AFR/AfDB/WB) 51.2 25 +1.73 +2.35
Narrowing Income Gaps (AFR) 53.1 5 +2.20 +4.95
Environmental Policy (BS) 42.9 14 0.00 -3.55
Environmental Sustainability (AfDB/WB) 66.7 23 +1.23 0.00
EDUCATION 68.7 5 +0.86 +0.50
Education Provision (AFR) 44.4 19 -2.61 -5.88
Education Quality (BS) 50.0 11 0.00 0.00
Educational System Management (WEF) 44.9 17 +1.71 +6.45
Human Resources in Primary Schools (UNESCO) 87.0 9 +0.01 -0.20
Primary School Completion (WB) 90.7 2 +1.27 +1.05
Secondary School Enrolment (UNESCO) 91.8 2 +3.22 0.00
Tertiary Education Enrolment (UNESCO) 60.2 2 +2.46 +1.93
Literacy (WB) 80.6 17 +0.79 +0.60
HEALTH 82.6 9 +0.27 -0.55
Basic Health Services (AFR) 46.7 21 -2.99 -6.73
Public Health Campaigns (GI) 50.0 33 -2.78 -6.25
Child Mortality (IGME) 94.6 7 +0.27 +0.08
Maternal Mortality (MMEIG) 95.0 9 +0.03 +0.05
Access to Sanitation (WHO/UNICEF) 93.1 6 +0.27 +0.20
Undernourishment (WB) 100.0 1 +0.28 0.00
Disease (WHO) 97.4 8 +0.01 -0.03
Immunisation (WB/WHO) 95.5 9 +0.34 0.00
Antiretroviral Treatment (ART) Provision (UNAIDS) 71.6 21 +7.09 +7.80
HUMAN DEVELOPMENT
For a full list of data sources see Annex.
*AAT: Annual Average TrendOVERALL GOVERNANCE
53.6 22nd2016 SCORE 2016 RANK
+0.04 +0.0810 -YEAR AAT* 5-YEAR AAT
N/A
If AAT appears the same in the two time periods, differences exist beyond the 2nd decimal place.
Increasing Improvement Slowing Improvement Warning Signs Bouncing Back Slowing Deterioration Increasing Deterioration No Change

109
2017 IIAG: Index Report2017 IIAG Angola Scores, Ranks & Trends
OVERALL GOVERNANCE
39.4 45th2016 SCORE 2016 RANK
+0.42 -0.3010 -YEAR AAT* 5-YEAR AAT
SAFETY & RULE OF LAW 45.9 39 +0.23 0.00
RULE OF LAW 42.2 39 +0.77 +0.18
Judicial Independence (BS/WEF/V-Dem/GI) 23.4 44 +0.04 -0.63
Judicial Process (EIU/GI) 12.5 45 0.00 0.00
Access to Justice (V-Dem) 50.7 35 +0.22 0.00
Property Rights (BS/HER/WEF/AfDB/WB) 33.0 45 +0.58 +1.55
Transfers of Power (EIU) 33.3 20 +3.70 0.00
Multilateral Sanctions (CDD) 100.0 1 0.00 0.00
ACCOUNTABILITY 13.5 47 -0.09 -0.15
Access to Information (GI) 0.0 44 0.00 0.00
Online Public Services (UNDESA) 47.1 17 +0.01 +0.50
Public Sector Accountability & Transparency (V-Dem/AfDB/WB)
28.8 40 +0.81 +0.25
Accountability of Public Officials (EIU/BS) 7.1 47 -0.80 -1.80
Corruption in Government & Public Officials (EIU) 0.0 38 0.00 0.00
Corruption & Bureaucracy (WB) 19.0 33 +0.52 +1.18
Diversion of Public Funds (WEF) 6.2 40 -1.24 -1.35
Corruption Investigation (GI/AFR) 0.0 49 0.00 0.00
PERSONAL SAFETY 40.9 35 -0.52 -0.03
Safety of the Person (EIU/AFR) 0.0 47 0.00 0.00
Police Services (WEF/GI) 9.4 47 -1.24 -1.23
Social Unrest (EIU/ACLED) 71.0 14 -1.11 -3.65
Crime (EIU/AFR) 50.0 29 -0.70 0.00
Political Violence (ACLED/PTS) 64.9 40 -0.12 -1.60
Human Trafficking (USDS) 50.0 1 0.00 +6.25
NATIONAL SECURITY 87.2 22 +0.82 +0.05
Government Involvement in Armed Conflict (UCDP) 100.0 1 +2.47 0.00
Domestic Armed Conflict (EIU) 75.0 9 0.00 0.00
Violence by Non-state Actors (ACLED) 98.7 20 -0.04 0.00
Cross-border Tensions (EIU) 50.0 31 0.00 0.00
Internally Displaced People (IDMC) 100.0 1 +0.10 0.00
Political Refugees (UNHCR) 99.3 25 +2.38 +0.30
SAFETY & RULE OF LAW
SCORE 2016
RANK 2016
10 -YEAR AAT
5-YEAR AAT
SCORE 2016
RANK 2016
10 -YEAR AAT
5-YEAR AAT
PARTICIPATION & HUMAN RIGHTS 37.0 42 +0.32 -0.20
PARTICIPATION 26.3 43 +0.28 -1.70
Political Participation (EIU/FH/V-Dem) 58.1 29 +1.53 +0.60
Civil Society Participation (BS/V-Dem/GI) 17.8 46 -2.41 -3.88
Free & Fair Elections (BS/CDD/V-Dem) 30.0 41 +2.29 -1.85
Election Monitoring Agencies (V-Dem/GI) 14.2 48 -0.06 -0.75
Legitimacy of Political Process (BS) 11.1 25 0.00 -2.78
RIGHTS 29.6 41 +0.24 -0.03
Freedom of Expression (BS/RSF/V-Dem/GI) 39.9 40 -0.47 -1.18
Freedom of Association & Assembly (BS/GI) 23.6 39 -0.47 +0.35
Civil Liberties (BS/FH ) 27.1 40 -0.23 -2.85
Human Rights Conventions (UNOLA/OHCHR) 61.9 31 +2.64 +3.58
Human Rights Violations (EIU) 25.0 25 0.00 0.00
Protection against Discrimination (GI) 0.0 36 0.00 0.00
GENDER 55.1 30 +0.46 +1.15
Gender Equality (AfDB/WB) 51.3 31 +0.70 0.00
Women's Political Participation (IPU/GI/WB) 59.1 7 +2.86 0.00
Gender Balance in Education (UNESCO) 18.1 50 -4.22 0.00
Women's Labour Force Participation (WB) 62.2 28 +0.10 +0.08
Workplace Gender Equality (GI) 25.0 37 +2.78 +6.25
Women in the Judiciary (GI) 100.0 1 0.00 0.00
Laws on Violence against Women (OECD) 58.3 12 +0.92 +4.15
Women's Political Empowerment (V-Dem) 66.9 32 +0.51 -1.38
PARTICIPATION & HUMAN RIGHTS
SCORE 2016
RANK 2016
10 -YEAR AAT
5-YEAR AAT
SUSTAINABLE ECONOMIC OPPORTUNITY 29.4 48 +0.11 -0.83
PUBLIC MANAGEMENT 30.2 47 -0.11 -1.18
Governmental Statistical Capacity (WB) 33.3 45 0.00 -2.55
Civil Registration (GI) 12.5 52 0.00 0.00
Public Administration (AfDB/WB) 41.7 43 -0.23 0.00
Diversification (AfDB/OECD/UNDP) 0.3 53 +0.02 +0.03
Budget Management (AfDB/WB) 47.8 41 +0.46 0.00
Budget Balance (AfDB/AUC/UNECA) 36.0 41 -3.86 -8.63
Fiscal Policy (AfDB/WB) 73.0 18 +2.47 0.00
Revenue Mobilisation (ICTD/UNU-WIDER/AfDB/WB) 27.6 47 +0.19 +0.58
Transparency of State-owned Companies (GI) 0.0 26 0.00 0.00
BUSINESS ENVIRONMENT 19.9 50 -0.44 -2.80
Investment Climate (HER) 33.3 45 +1.23 -1.40
Competition (BS/GI/AfDB/WB) 24.8 49 +0.56 0.00
Business Bureaucracy & Red Tape (EIU) 0.0 31 0.00 -8.33
Customs Procedures (WEF) 0.0 41 -2.72 -3.95
Soundness of Banks (WEF) 41.6 23 -1.26 -0.28
Employment Creation (AFR) . . . .
Regional Integration (AfDB) . . . .
INFRASTRUCTURE 24.5 45 +0.31 +0.30
Transport Infrastructure (WEF/AFR/EIU/GI) 26.6 39 -0.33 -0.23
Electricity Infrastructure (WEF/AFR) 9.9 40 +0.43 +0.95
Digital & IT Infrastructure (EIU/ITU) 32.3 28 +0.96 +0.25
Access to Improved Water (WHO/UNICEF) 29.2 50 +0.21 +0.18
Water & Sanitation Services (AFR) . . . .
RURAL SECTOR 42.9 42 +0.66 +0.43
Rural Land & Water (IFAD) 54.8 26 +3.73 +7.00
Rural Business Climate (IFAD) 43.6 38 +1.02 +0.20
Rural Development Resources (IFAD) 56.3 21 +3.48 +4.70
Agricultural Support System (IFAD) 37.2 41 -0.77 -2.30
Agricultural Policy Costs (WEF) 41.2 33 -2.04 -2.43
Engagement with Rural Organisations (IFAD) 40.6 44 -0.13 -1.13
Gender Balance in Rural Decision-making (IFAD) 33.3 42 -1.86 -4.18
Rural Accountability & Transparency (IFAD) 36.3 35 +1.80 +1.50
SUSTAINABLE ECONOMIC OPPORTUNITY
SCORE 2016
RANK 2016
10 -YEAR AAT
5-YEAR AAT
HUMAN DEVELOPMENT 45.5 46 +1.06 -0.15
WELFARE 42.8 39 +1.12 -0.80
Welfare Services (AfDB/WB) 62.6 35 +2.58 0.00
Social Safety Nets (BS) 38.5 22 +2.57 -1.93
Social Protection & Labour (AfDB/WB) 47.0 38 +0.37 0.00
Social Exclusion (BS) 14.3 20 0.00 -1.78
Poverty (AFR) . . . .
Poverty Reduction Priorities (AFR/AfDB/WB) 50.6 27 +0.47 0.00
Narrowing Income Gaps (AFR) . . . .
Environmental Policy (BS) 28.6 26 +1.59 -1.78
Environmental Sustainability (AfDB/WB) 58.3 37 +0.30 0.00
EDUCATION 35.4 44 +0.72 -0.48
Education Provision (AFR) . . . .
Education Quality (BS) 33.3 21 +1.84 -4.18
Educational System Management (WEF) 7.7 38 +0.50 +0.35
Human Resources in Primary Schools (UNESCO) 65.7 35 -0.20 0.00
Primary School Completion (WB) 33.9 47 +0.86 0.00
Secondary School Enrolment (UNESCO) 22.4 46 +0.71 0.00
Tertiary Education Enrolment (UNESCO) 14.9 23 +1.06 +0.38
Literacy (WB) 70.2 30 +0.29 +0.23
HEALTH 58.2 47 +1.31 +0.75
Basic Health Services (AFR) . . . .
Public Health Campaigns (GI) 50.0 33 0.00 0.00
Child Mortality (IGME) 35.5 54 +1.98 +1.73
Maternal Mortality (MMEIG) 82.3 31 +0.69 +0.48
Access to Sanitation (WHO/UNICEF) 50.0 37 +1.21 +1.03
Undernourishment (WB) 83.5 22 +2.88 +1.50
Disease (WHO) 70.6 47 +2.39 +0.75
Immunisation (WB/WHO) 57.1 46 -1.43 -3.68
Antiretroviral Treatment (ART) Provision (UNAIDS) 36.4 40 +2.78 +4.25
HUMAN DEVELOPMENT
N/A
N/A
N/A
N/A
N/A
N/A
N/A
For a full list of data sources see Annex.
*AAT: Annual Average Trend
If AAT appears the same in the two time periods, differences exist beyond the 2nd decimal place.
Increasing Improvement Slowing Improvement Warning Signs Bouncing Back Slowing Deterioration Increasing Deterioration No Change

110
2017 IIAG Benin Scores, Ranks & Trends
OVERALL GOVERNANCE
59.0 14th2016 SCORE 2016 RANK
+0.16 +0.0510 -YEAR AAT* 5-YEAR AAT
SAFETY & RULE OF LAW 63.6 13 -0.58 -0.33
RULE OF LAW 71.4 11 -0.12 -0.03
Judicial Independence (BS/WEF/V-Dem/GI) 56.4 17 -0.90 -0.23
Judicial Process (EIU/GI) 54.2 19 -1.39 -3.13
Access to Justice (V-Dem) 97.5 3 +0.97 +2.18
Property Rights (BS/HER/WEF/AfDB/WB) 53.7 21 +0.59 +1.10
Transfers of Power (EIU) 66.7 8 0.00 0.00
Multilateral Sanctions (CDD) 100.0 1 0.00 0.00
ACCOUNTABILITY 36.1 26 -0.40 +0.05
Access to Information (GI) 12.5 41 -1.86 -4.18
Online Public Services (UNDESA) 19.6 34 -0.26 -1.73
Public Sector Accountability & Transparency (V-Dem/AfDB/WB)
70.7 10 +1.39 +3.38
Accountability of Public Officials (EIU/BS) 38.1 17 -1.59 0.00
Corruption in Government & Public Officials (EIU) 40.0 17 0.00 +5.00
Corruption & Bureaucracy (WB) 38.1 17 -0.53 -1.20
Diversion of Public Funds (WEF) 31.2 26 +1.00 +1.78
Corruption Investigation (GI/AFR) 38.5 23 -1.41 -2.60
PERSONAL SAFETY 57.4 13 -1.07 -0.78
Safety of the Person (EIU/AFR) 57.1 17 -3.36 -0.88
Police Services (WEF/GI) 48.5 14 +2.61 +5.23
Social Unrest (EIU/ACLED) 71.7 12 -1.76 +0.05
Crime (EIU/AFR) 54.6 22 -1.12 -1.20
Political Violence (ACLED/PTS) 87.5 6 0.00 -1.58
Human Trafficking (USDS) 25.0 21 -2.78 -6.25
NATIONAL SECURITY 89.7 14 -0.68 -0.48
Government Involvement in Armed Conflict (UCDP) 88.9 19 -1.23 -2.78
Domestic Armed Conflict (EIU) 100.0 1 0.00 0.00
Violence by Non-state Actors (ACLED) 99.1 17 -0.09 -0.23
Cross-border Tensions (EIU) 50.0 31 -2.78 0.00
Internally Displaced People (IDMC) 100.0 1 0.00 0.00
Political Refugees (UNHCR) 99.9 8 0.00 0.00
SAFETY & RULE OF LAW
SCORE 2016
RANK 2016
10 -YEAR AAT
5-YEAR AAT
SCORE 2016
RANK 2016
10 -YEAR AAT
5-YEAR AAT
PARTICIPATION & HUMAN RIGHTS 70.8 6 +0.46 +0.90
PARTICIPATION 82.1 6 +0.68 +1.58
Political Participation (EIU/FH/V-Dem) 84.9 6 +0.56 +0.45
Civil Society Participation (BS/V-Dem/GI) 77.2 14 -0.88 -3.03
Free & Fair Elections (BS/CDD/V-Dem) 83.7 6 -0.24 +4.05
Election Monitoring Agencies (V-Dem/GI) 76.0 4 +2.74 +6.43
Legitimacy of Political Process (BS) 88.9 3 +1.23 0.00
RIGHTS 63.4 7 -0.37 +0.18
Freedom of Expression (BS/RSF/V-Dem/GI) 77.7 7 -0.73 -1.38
Freedom of Association & Assembly (BS/GI) 75.7 7 -0.62 -0.70
Civil Liberties (BS/FH ) 85.4 2 0.00 0.00
Human Rights Conventions (UNOLA/OHCHR) 66.7 22 +0.53 0.00
Human Rights Violations (EIU) 50.0 7 -2.78 0.00
Protection against Discrimination (GI) 25.0 17 +1.39 +3.13
GENDER 66.7 14 +1.02 +0.93
Gender Equality (AfDB/WB) 61.3 22 -0.69 -1.03
Women's Political Participation (IPU/GI/WB) 24.8 47 -1.37 -3.75
Gender Balance in Education (UNESCO) 62.2 38 +2.61 +1.98
Women's Labour Force Participation (WB) 75.4 21 +0.24 +0.10
Workplace Gender Equality (GI) 50.0 4 0.00 0.00
Women in the Judiciary (GI) 100.0 1 +2.78 +6.25
Laws on Violence against Women (OECD) 66.7 6 +4.63 +4.18
Women's Political Empowerment (V-Dem) 93.6 2 +0.01 -0.30
PARTICIPATION & HUMAN RIGHTS
SCORE 2016
RANK 2016
10 -YEAR AAT
5-YEAR AAT
SUSTAINABLE ECONOMIC OPPORTUNITY 47.4 24 +0.07 -0.13
PUBLIC MANAGEMENT 47.4 27 -0.20 +0.33
Governmental Statistical Capacity (WB) 73.9 9 +2.26 +5.08
Civil Registration (GI) 50.0 32 0.00 0.00
Public Administration (AfDB/WB) 64.6 18 -0.69 -0.78
Diversification (AfDB/OECD/UNDP) 7.0 23 -0.27 +0.08
Budget Management (AfDB/WB) 71.8 13 +0.31 -0.70
Budget Balance (AfDB/AUC/UNECA) 42.1 30 -1.98 -2.03
Fiscal Policy (AfDB/WB) 67.5 22 -1.58 +1.40
Revenue Mobilisation (ICTD/UNU-WIDER/AfDB/WB) 49.9 23 +0.16 +0.05
Transparency of State-owned Companies (GI) 0.0 26 0.00 0.00
BUSINESS ENVIRONMENT 53.5 13 +0.20 +0.05
Investment Climate (HER) 88.9 1 +4.94 +2.78
Competition (BS/GI/AfDB/WB) 61.3 12 -1.34 -1.88
Business Bureaucracy & Red Tape (EIU) 33.3 10 0.00 0.00
Customs Procedures (WEF) 39.5 30 +0.79 +1.28
Soundness of Banks (WEF) 47.2 21 -3.52 -3.35
Employment Creation (AFR) 29.0 23 -0.89 -1.65
Regional Integration (AfDB) 75.0 8 +1.39 +3.13
INFRASTRUCTURE 34.4 38 +0.52 +0.03
Transport Infrastructure (WEF/AFR/EIU/GI) 30.0 34 +1.46 +1.98
Electricity Infrastructure (WEF/AFR) 12.1 38 -1.73 -3.58
Digital & IT Infrastructure (EIU/ITU) 32.5 27 +2.23 +0.43
Access to Improved Water (WHO/UNICEF) 60.5 30 +0.49 +0.40
Water & Sanitation Services (AFR) 36.9 20 +0.16 +0.93
RURAL SECTOR 54.5 22 -0.23 -0.85
Rural Land & Water (IFAD) 49.1 33 +1.38 0.00
Rural Business Climate (IFAD) 50.7 32 -2.44 -2.90
Rural Development Resources (IFAD) 50.0 25 -1.44 -1.58
Agricultural Support System (IFAD) 79.1 5 +2.64 0.00
Agricultural Policy Costs (WEF) 41.3 32 -0.93 +1.45
Engagement with Rural Organisations (IFAD) 67.2 13 +0.41 -0.75
Gender Balance in Rural Decision-making (IFAD) 50.0 13 +0.33 -3.13
Rural Accountability & Transparency (IFAD) 48.4 26 -1.89 0.00
SUSTAINABLE ECONOMIC OPPORTUNITY
SCORE 2016
RANK 2016
10 -YEAR AAT
5-YEAR AAT
HUMAN DEVELOPMENT 54.0 33 +0.67 -0.33
WELFARE 47.5 30 +0.20 -0.90
Welfare Services (AfDB/WB) 69.7 24 -0.22 +1.50
Social Safety Nets (BS) 38.5 22 0.00 -3.83
Social Protection & Labour (AfDB/WB) 59.7 18 +0.38 -0.28
Social Exclusion (BS) 14.3 20 0.00 -3.58
Poverty (AFR) 40.6 29 +0.63 -1.13
Poverty Reduction Priorities (AFR/AfDB/WB) 52.0 20 -0.60 +0.70
Narrowing Income Gaps (AFR) 34.6 18 0.00 +0.33
Environmental Policy (BS) 42.9 14 +1.59 -1.78
Environmental Sustainability (AfDB/WB) 75.0 11 0.00 0.00
EDUCATION 43.4 34 +1.01 -0.70
Education Provision (AFR) 51.1 13 -0.41 -3.75
Education Quality (BS) 50.0 11 +3.70 +2.08
Educational System Management (WEF) 16.3 35 -1.93 -8.88
Human Resources in Primary Schools (UNESCO) 62.9 41 -0.12 -0.25
Primary School Completion (WB) 62.5 19 +2.11 +1.90
Secondary School Enrolment (UNESCO) 49.7 19 +2.20 +1.45
Tertiary Education Enrolment (UNESCO) 24.8 13 +1.37 +0.80
Literacy (WB) 29.7 46 +1.19 +1.00
HEALTH 71.2 28 +0.78 +0.63
Basic Health Services (AFR) 55.3 11 -0.59 -2.48
Public Health Campaigns (GI) 75.0 14 -2.78 -6.25
Child Mortality (IGME) 61.3 47 +0.98 +0.85
Maternal Mortality (MMEIG) 85.0 28 +0.32 +0.23
Access to Sanitation (WHO/UNICEF) 24.2 50 +0.56 +0.48
Undernourishment (WB) 95.5 14 +1.30 +1.48
Disease (WHO) 84.1 31 -0.18 +0.95
Immunisation (WB/WHO) 75.9 38 -0.02 -0.38
Antiretroviral Treatment (ART) Provision (UNAIDS) 84.3 7 +7.43 +10.63
HUMAN DEVELOPMENT
*AAT: Annual Average Trend
If AAT appears the same in the two time periods, differences exist beyond the 2nd decimal place.
For a full list of data sources see Annex.
Increasing Improvement Slowing Improvement Warning Signs Bouncing Back Slowing Deterioration Increasing Deterioration No Change

111
2017 IIAG: Index Report2017 IIAG Botswana Scores, Ranks & Trends
OVERALL GOVERNANCE
72.7 3rd2016 SCORE 2016 RANK
-0.09 -0.6310 -YEAR AAT* 5-YEAR AAT
SAFETY & RULE OF LAW 81.6 2 -0.13 -0.50
RULE OF LAW 92.8 2 -0.24 -0.63
Judicial Independence (BS/WEF/V-Dem/GI) 74.0 6 -1.71 -4.15
Judicial Process (EIU/GI) 100.0 1 0.00 0.00
Access to Justice (V-Dem) 97.9 2 +0.60 +1.18
Property Rights (BS/HER/WEF/AfDB/WB) 85.0 2 -0.37 -0.80
Transfers of Power (EIU) 100.0 1 0.00 0.00
Multilateral Sanctions (CDD) 100.0 1 0.00 0.00
ACCOUNTABILITY 66.3 3 -0.86 -2.13
Access to Information (GI) 25.0 31 -1.39 -3.13
Online Public Services (UNDESA) 38.2 19 +0.21 -2.60
Public Sector Accountability & Transparency (V-Dem/AfDB/WB)
90.1 2 -0.36 -0.30
Accountability of Public Officials (EIU/BS) 76.2 1 -0.79 -0.90
Corruption in Government & Public Officials (EIU) 100.0 1 0.00 0.00
Corruption & Bureaucracy (WB) 76.2 2 -1.06 -2.38
Diversion of Public Funds (WEF) 66.6 2 -0.73 -2.28
Corruption Investigation (GI/AFR) 58.1 5 -2.70 -5.33
PERSONAL SAFETY 67.2 2 +0.56 +0.73
Safety of the Person (EIU/AFR) 66.8 7 -0.08 -0.18
Police Services (WEF/GI) 32.1 32 +0.68 -0.35
Social Unrest (EIU/ACLED) 99.3 1 -0.08 -0.13
Crime (EIU/AFR) 55.2 20 +0.06 -1.23
Political Violence (ACLED/PTS) 100.0 1 +2.78 +6.25
Human Trafficking (USDS) 50.0 1 0.00 0.00
NATIONAL SECURITY 100.0 1 0.00 0.00
Government Involvement in Armed Conflict (UCDP) 100.0 1 0.00 0.00
Domestic Armed Conflict (EIU) 100.0 1 0.00 0.00
Violence by Non-state Actors (ACLED) 100.0 1 0.00 0.00
Cross-border Tensions (EIU) 100.0 1 0.00 0.00
Internally Displaced People (IDMC) 100.0 1 0.00 0.00
Political Refugees (UNHCR) 99.7 16 -0.03 -0.03
SAFETY & RULE OF LAW
SCORE 2016
RANK 2016
10 -YEAR AAT
5-YEAR AAT
SCORE 2016
RANK 2016
10 -YEAR AAT
5-YEAR AAT
PARTICIPATION & HUMAN RIGHTS 66.9 10 -0.37 -0.65
PARTICIPATION 83.3 4 +0.01 +0.30
Political Participation (EIU/FH/V-Dem) 77.7 12 +0.29 -0.50
Civil Society Participation (BS/V-Dem/GI) 91.4 4 -0.11 +0.65
Free & Fair Elections (BS/CDD/V-Dem) 76.6 8 -0.69 -0.13
Election Monitoring Agencies (V-Dem/GI) 70.9 8 +0.58 +1.45
Legitimacy of Political Process (BS) 100.0 1 0.00 0.00
RIGHTS 52.1 20 -0.57 -1.45
Freedom of Expression (BS/RSF/V-Dem/GI) 69.0 19 -0.99 -2.13
Freedom of Association & Assembly (BS/GI) 70.1 10 -1.31 -2.95
Civil Liberties (BS/FH ) 85.4 2 0.00 0.00
Human Rights Conventions (UNOLA/OHCHR) 38.1 49 -1.06 -3.58
Human Rights Violations (EIU) 50.0 7 0.00 0.00
Protection against Discrimination (GI) 0.0 36 0.00 0.00
GENDER 65.2 18 -0.56 -0.80
Gender Equality (AfDB/WB) 100.0 1 0.00 0.00
Women's Political Participation (IPU/GI/WB) 21.1 51 -1.44 -0.83
Gender Balance in Education (UNESCO) 79.8 22 -0.24 -0.18
Women's Labour Force Participation (WB) 80.0 15 +0.26 +0.15
Workplace Gender Equality (GI) 100.0 1 +2.78 +6.25
Women in the Judiciary (GI) 0.0 44 -5.56 -12.50
Laws on Violence against Women (OECD) 58.3 12 -0.97 -1.05
Women's Political Empowerment (V-Dem) 82.1 16 +0.67 +1.60
PARTICIPATION & HUMAN RIGHTS
SCORE 2016
RANK 2016
10 -YEAR AAT
5-YEAR AAT
SUSTAINABLE ECONOMIC OPPORTUNITY 64.6 6 -0.31 -0.88
PUBLIC MANAGEMENT 60.3 7 -1.27 -1.75
Governmental Statistical Capacity (WB) 33.3 45 -2.90 -6.90
Civil Registration (GI) 87.5 5 0.00 0.00
Public Administration (AfDB/WB) 100.0 1 0.00 0.00
Diversification (AfDB/OECD/UNDP) 1.0 48 -0.14 -0.10
Budget Management (AfDB/WB) 88.9 1 0.00 0.00
Budget Balance (AfDB/AUC/UNECA) 51.5 13 -5.39 -1.80
Fiscal Policy (AfDB/WB) 88.9 1 0.00 0.00
Revenue Mobilisation (ICTD/UNU-WIDER/AfDB/WB) 66.6 6 -0.14 -0.70
Transparency of State-owned Companies (GI) 25.0 7 -2.78 -6.25
BUSINESS ENVIRONMENT 68.7 4 -0.08 -1.03
Investment Climate (HER) 72.2 11 -0.62 -1.40
Competition (BS/GI/AfDB/WB) 78.9 4 -1.39 -4.18
Business Bureaucracy & Red Tape (EIU) 66.7 4 0.00 0.00
Customs Procedures (WEF) 69.9 3 +2.47 +0.63
Soundness of Banks (WEF) 58.4 7 -3.28 -3.80
Employment Creation (AFR) 65.9 2 +2.33 +2.50
Regional Integration (AfDB) . . . .
INFRASTRUCTURE 64.3 5 -0.08 -0.08
Transport Infrastructure (WEF/AFR/EIU/GI) 58.1 6 -0.18 -0.53
Electricity Infrastructure (WEF/AFR) 52.0 11 -2.43 -1.45
Digital & IT Infrastructure (EIU/ITU) 66.2 7 +4.16 +3.75
Access to Improved Water (WHO/UNICEF) 75.1 14 +0.13 +0.10
Water & Sanitation Services (AFR) 70.2 3 -2.08 -2.28
RURAL SECTOR 65.0 7 +0.17 -0.63
Rural Land & Water (IFAD) 64.1 17 -0.14 0.00
Rural Business Climate (IFAD) 55.3 26 -0.03 0.00
Rural Development Resources (IFAD) 87.5 3 +1.39 0.00
Agricultural Support System (IFAD) 37.2 41 +0.78 -1.73
Agricultural Policy Costs (WEF) 63.3 10 +0.73 -3.35
Engagement with Rural Organisations (IFAD) 64.9 15 -0.18 0.00
Gender Balance in Rural Decision-making (IFAD) 75.0 2 -1.39 0.00
Rural Accountability & Transparency (IFAD) 72.6 6 +0.16 0.00
SUSTAINABLE ECONOMIC OPPORTUNITY
SCORE 2016
RANK 2016
10 -YEAR AAT
5-YEAR AAT
HUMAN DEVELOPMENT 78.0 3 +0.48 -0.40
WELFARE 76.8 3 +0.83 +0.18
Welfare Services (AfDB/WB) 84.0 5 +1.33 0.00
Social Safety Nets (BS) 92.3 1 +0.86 0.00
Social Protection & Labour (AfDB/WB) 77.8 2 +1.23 0.00
Social Exclusion (BS) 57.1 2 0.00 +1.78
Poverty (AFR) 52.8 17 +0.41 +0.78
Poverty Reduction Priorities (AFR/AfDB/WB) 88.5 3 +1.11 -1.33
Narrowing Income Gaps (AFR) 86.7 1 +2.59 +0.40
Environmental Policy (BS) 85.7 1 0.00 0.00
Environmental Sustainability (AfDB/WB) 66.7 23 0.00 0.00
EDUCATION 72.5 3 +0.19 -0.95
Education Provision (AFR) 70.2 5 -1.80 -3.65
Education Quality (BS) 83.3 2 0.00 -4.18
Educational System Management (WEF) 55.2 12 -0.14 -1.63
Human Resources in Primary Schools (UNESCO) 88.4 6 +0.32 +0.23
Primary School Completion (WB) 84.4 10 +0.56 +0.23
Secondary School Enrolment (UNESCO) 69.3 10 -0.49 0.00
Tertiary Education Enrolment (UNESCO) 38.1 7 +2.42 +0.98
Literacy (WB) 91.2 9 +0.63 +0.53
HEALTH 84.6 6 +0.42 -0.48
Basic Health Services (AFR) 81.4 3 -1.26 -3.58
Public Health Campaigns (GI) 75.0 14 -2.78 -6.25
Child Mortality (IGME) 86.4 11 +0.94 +0.65
Maternal Mortality (MMEIG) 95.4 7 +0.36 +0.23
Access to Sanitation (WHO/UNICEF) 69.7 13 +0.27 +0.13
Undernourishment (WB) 65.6 30 +1.66 +1.30
Disease (WHO) 91.0 19 +0.23 -0.23
Immunisation (WB/WHO) 96.3 8 +0.13 0.00
Antiretroviral Treatment (ART) Provision (UNAIDS) 100.0 1 +4.13 +3.33
HUMAN DEVELOPMENT
N/A
*AAT: Annual Average Trend
If AAT appears the same in the two time periods, differences exist beyond the 2nd decimal place.
For a full list of data sources see Annex.
Increasing Improvement Slowing Improvement Warning Signs Bouncing Back Slowing Deterioration Increasing Deterioration No Change

112
2017 IIAG Burkina Faso Scores, Ranks & Trends
OVERALL GOVERNANCE
53.7 21st2016 SCORE 2016 RANK
+0.12 +0.0810 -YEAR AAT* 5-YEAR AAT
SAFETY & RULE OF LAW 61.5 18 -0.03 +0.28
RULE OF LAW 58.7 19 +0.27 +1.63
Judicial Independence (BS/WEF/V-Dem/GI) 40.2 27 +0.78 +2.15
Judicial Process (EIU/GI) 54.2 19 +4.17 +9.38
Access to Justice (V-Dem) 71.7 23 -0.31 -0.78
Property Rights (BS/HER/WEF/AfDB/WB) 53.1 24 -0.22 -0.88
Transfers of Power (EIU) 33.3 20 -2.78 0.00
Multilateral Sanctions (CDD) 100.0 1 0.00 0.00
ACCOUNTABILITY 51.5 14 +0.52 +2.23
Access to Information (GI) 70.8 2 +3.23 +7.28
Online Public Services (UNDESA) 25.5 30 -0.28 -3.58
Public Sector Accountability & Transparency (V-Dem/AfDB/WB)
77.5 6 +1.36 +2.48
Accountability of Public Officials (EIU/BS) 38.1 17 +0.92 +0.90
Corruption in Government & Public Officials (EIU) 60.0 9 +2.22 +10.00
Corruption & Bureaucracy (WB) 57.1 8 -1.59 0.00
Diversion of Public Funds (WEF) 12.7 36 -2.54 -2.60
Corruption Investigation (GI/AFR) 70.4 1 +0.88 +3.33
PERSONAL SAFETY 48.8 29 -0.87 -1.63
Safety of the Person (EIU/AFR) 40.6 35 +0.17 -2.75
Police Services (WEF/GI) 35.7 28 -0.56 +0.78
Social Unrest (EIU/ACLED) 43.6 38 -3.49 -2.58
Crime (EIU/AFR) 47.9 35 -1.69 -0.93
Political Violence (ACLED/PTS) 75.0 22 +0.36 -4.35
Human Trafficking (USDS) 50.0 1 0.00 0.00
NATIONAL SECURITY 86.8 24 -0.08 -1.20
Government Involvement in Armed Conflict (UCDP) 88.9 19 -1.23 -2.78
Domestic Armed Conflict (EIU) 50.0 25 -2.78 -6.25
Violence by Non-state Actors (ACLED) 94.8 29 -0.58 -1.20
Cross-border Tensions (EIU) 87.5 8 +4.17 +3.13
Internally Displaced People (IDMC) 100.0 1 0.00 0.00
Political Refugees (UNHCR) 99.7 16 -0.02 -0.03
SAFETY & RULE OF LAW
SCORE 2016
RANK 2016
10 -YEAR AAT
5-YEAR AAT
SCORE 2016
RANK 2016
10 -YEAR AAT
5-YEAR AAT
PARTICIPATION & HUMAN RIGHTS 56.4 21 -0.30 +0.08
PARTICIPATION 54.5 26 -1.04 +0.25
Political Participation (EIU/FH/V-Dem) 67.7 20 +1.04 +2.83
Civil Society Participation (BS/V-Dem/GI) 75.9 15 -0.27 +0.88
Free & Fair Elections (BS/CDD/V-Dem) 62.2 20 +0.70 +1.83
Election Monitoring Agencies (V-Dem/GI) 66.6 10 +0.67 +1.30
Legitimacy of Political Process (BS) 0.0 40 -7.41 -5.55
RIGHTS 57.8 11 +0.24 0.00
Freedom of Expression (BS/RSF/V-Dem/GI) 73.2 11 -0.32 -0.50
Freedom of Association & Assembly (BS/GI) 40.3 28 -0.69 -1.55
Civil Liberties (BS/FH ) 58.3 14 0.00 -1.58
Human Rights Conventions (UNOLA/OHCHR) 100.0 1 +5.29 +3.58
Human Rights Violations (EIU) 50.0 7 -2.78 0.00
Protection against Discrimination (GI) 25.0 17 0.00 0.00
GENDER 56.9 29 -0.10 0.00
Gender Equality (AfDB/WB) 59.2 25 -0.92 -2.08
Women's Political Participation (IPU/GI/WB) 33.5 38 +0.24 +0.78
Gender Balance in Education (UNESCO) 75.8 28 +2.76 +1.85
Women's Labour Force Participation (WB) 84.0 12 +0.01 0.00
Workplace Gender Equality (GI) 25.0 37 0.00 0.00
Women in the Judiciary (GI) 75.0 19 0.00 0.00
Laws on Violence against Women (OECD) 33.3 29 -1.86 +2.08
Women's Political Empowerment (V-Dem) 69.6 30 -0.98 -2.55
PARTICIPATION & HUMAN RIGHTS
SCORE 2016
RANK 2016
10 -YEAR AAT
5-YEAR AAT
SUSTAINABLE ECONOMIC OPPORTUNITY 47.8 23 +0.02 -0.63
PUBLIC MANAGEMENT 56.3 10 0.00 -0.93
Governmental Statistical Capacity (WB) 75.4 7 +1.46 +1.10
Civil Registration (GI) 75.0 10 0.00 0.00
Public Administration (AfDB/WB) 80.7 7 +0.87 +0.38
Diversification (AfDB/OECD/UNDP) 1.2 47 +0.01 +0.05
Budget Management (AfDB/WB) 81.7 6 0.00 -1.80
Budget Balance (AfDB/AUC/UNECA) 44.2 27 +0.84 -0.65
Fiscal Policy (AfDB/WB) 74.6 14 -0.97 -1.78
Revenue Mobilisation (ICTD/UNU-WIDER/AfDB/WB) 48.8 25 +0.61 +0.63
Transparency of State-owned Companies (GI) 25.0 7 -2.78 -6.25
BUSINESS ENVIRONMENT 52.1 17 +0.20 -0.65
Investment Climate (HER) 77.8 8 +3.71 +4.18
Competition (BS/GI/AfDB/WB) 53.4 21 -0.09 -2.38
Business Bureaucracy & Red Tape (EIU) 33.3 10 +3.70 0.00
Customs Procedures (WEF) 47.3 19 -0.80 -1.40
Soundness of Banks (WEF) 40.9 25 -4.36 -2.88
Employment Creation (AFR) 24.7 28 -0.74 -1.95
Regional Integration (AfDB) 87.5 3 0.00 0.00
INFRASTRUCTURE 24.6 44 -0.50 -0.80
Transport Infrastructure (WEF/AFR/EIU/GI) 31.5 31 +0.62 +0.80
Electricity Infrastructure (WEF/AFR) 10.2 39 -1.86 -2.03
Digital & IT Infrastructure (EIU/ITU) 26.2 34 +0.79 +0.20
Access to Improved Water (WHO/UNICEF) 44.7 41 +0.54 +0.48
Water & Sanitation Services (AFR) 10.5 31 -2.57 -3.50
RURAL SECTOR 58.1 18 +0.37 -0.13
Rural Land & Water (IFAD) 52.3 29 +1.69 -1.50
Rural Business Climate (IFAD) 53.1 30 -1.42 0.00
Rural Development Resources (IFAD) 62.5 12 +0.02 0.00
Agricultural Support System (IFAD) 79.1 5 +3.27 0.00
Agricultural Policy Costs (WEF) 53.4 18 -1.11 +0.45
Engagement with Rural Organisations (IFAD) 78.2 3 +1.48 0.00
Gender Balance in Rural Decision-making (IFAD) 37.5 36 -0.50 0.00
Rural Accountability & Transparency (IFAD) 48.4 26 -0.49 0.00
SUSTAINABLE ECONOMIC OPPORTUNITY
SCORE 2016
RANK 2016
10 -YEAR AAT
5-YEAR AAT
HUMAN DEVELOPMENT 49.3 40 +0.82 +0.60
WELFARE 47.7 29 +0.21 +0.13
Welfare Services (AfDB/WB) 80.9 9 +1.02 +2.30
Social Safety Nets (BS) 30.8 31 0.00 0.00
Social Protection & Labour (AfDB/WB) 61.9 17 -0.18 -1.78
Social Exclusion (BS) 0.0 33 0.00 0.00
Poverty (AFR) 43.0 24 +0.51 +1.60
Poverty Reduction Priorities (AFR/AfDB/WB) 50.0 30 -0.20 -1.15
Narrowing Income Gaps (AFR) 22.2 29 -0.16 -1.95
Environmental Policy (BS) 57.1 7 0.00 +3.55
Environmental Sustainability (AfDB/WB) 83.3 5 +0.92 -1.40
EDUCATION 32.1 49 +0.74 +0.08
Education Provision (AFR) 34.4 26 -2.11 -6.65
Education Quality (BS) 16.7 35 0.00 0.00
Educational System Management (WEF) 29.5 29 +0.72 +0.65
Human Resources in Primary Schools (UNESCO) 66.1 34 +0.69 +1.73
Primary School Completion (WB) 45.9 38 +3.00 +1.10
Secondary School Enrolment (UNESCO) 27.0 40 +1.90 +1.88
Tertiary Education Enrolment (UNESCO) 8.7 34 +0.53 +0.43
Literacy (WB) 28.9 47 +1.24 +1.50
HEALTH 68.0 37 +1.50 +1.55
Basic Health Services (AFR) 35.9 27 -1.77 -5.10
Public Health Campaigns (GI) 75.0 14 +2.78 +6.25
Child Mortality (IGME) 66.2 38 +2.57 +1.45
Maternal Mortality (MMEIG) 86.3 25 +0.32 +0.28
Access to Sanitation (WHO/UNICEF) 32.7 47 +1.21 +1.00
Undernourishment (WB) 71.8 25 +0.82 +0.23
Disease (WHO) 74.4 44 +1.12 +2.88
Immunisation (WB/WHO) 89.8 19 -0.11 +0.28
Antiretroviral Treatment (ART) Provision (UNAIDS) 79.8 15 +6.59 +6.70
HUMAN DEVELOPMENT
*AAT: Annual Average Trend
If AAT appears the same in the two time periods, differences exist beyond the 2nd decimal place.
For a full list of data sources see Annex.
Increasing Improvement Slowing Improvement Warning Signs Bouncing Back Slowing Deterioration Increasing Deterioration No Change

113
2017 IIAG: Index Report2017 IIAG Burundi Scores, Ranks & Trends
OVERALL GOVERNANCE
39.9 44th2016 SCORE 2016 RANK
-0.72 -1.5010 -YEAR AAT* 5-YEAR AAT
SAFETY & RULE OF LAW 26.2 49 -2.62 -5.10
RULE OF LAW 24.5 50 -3.13 -4.73
Judicial Independence (BS/WEF/V-Dem/GI) 11.9 50 -1.70 -2.00
Judicial Process (EIU/GI) 12.5 45 -3.70 -4.18
Access to Justice (V-Dem) 22.5 49 -1.99 -6.50
Property Rights (BS/HER/WEF/AfDB/WB) 33.1 44 -0.31 +0.95
Transfers of Power (EIU) 0.0 38 -7.41 -8.33
Multilateral Sanctions (CDD) 66.7 31 -3.70 -8.33
ACCOUNTABILITY 21.1 41 -0.17 -0.10
Access to Information (GI) 37.5 22 +0.92 +2.08
Online Public Services (UNDESA) 20.6 32 +1.97 +0.08
Public Sector Accountability & Transparency (V-Dem/AfDB/WB)
21.5 49 -0.73 -1.50
Accountability of Public Officials (EIU/BS) 31.0 39 -0.79 -1.78
Corruption in Government & Public Officials (EIU) 0.0 38 -2.22 -1.25
Corruption & Bureaucracy (WB) 19.0 33 +0.52 +1.18
Diversion of Public Funds (WEF) 11.6 38 -0.51 +1.55
Corruption Investigation (GI/AFR) 27.4 32 -0.51 -1.15
PERSONAL SAFETY 25.8 48 -3.31 -5.90
Safety of the Person (EIU/AFR) 47.2 28 -3.41 -1.43
Police Services (WEF/GI) 15.1 44 -1.71 +0.65
Social Unrest (EIU/ACLED) 22.8 48 -5.80 -12.88
Crime (EIU/AFR) 57.2 18 -0.70 -1.58
Political Violence (ACLED/PTS) 12.5 50 -5.46 -13.95
Human Trafficking (USDS) 0.0 39 -2.78 -6.25
NATIONAL SECURITY 33.5 50 -3.86 -9.68
Government Involvement in Armed Conflict (UCDP) 77.8 33 -2.47 -2.78
Domestic Armed Conflict (EIU) 0.0 49 -8.33 -6.25
Violence by Non-state Actors (ACLED) 0.0 46 -10.72 -24.25
Cross-border Tensions (EIU) 25.0 42 -2.78 -6.25
Internally Displaced People (IDMC) 94.5 38 +0.77 +0.70
Political Refugees (UNHCR) 3.5 50 +0.39 -19.23
SAFETY & RULE OF LAW
SCORE 2016
RANK 2016
10 -YEAR AAT
5-YEAR AAT
SCORE 2016
RANK 2016
10 -YEAR AAT
5-YEAR AAT
PARTICIPATION & HUMAN RIGHTS 38.8 38 -0.94 -1.13
PARTICIPATION 24.6 47 -3.10 -3.20
Political Participation (EIU/FH/V-Dem) 33.1 48 -2.84 -4.00
Civil Society Participation (BS/V-Dem/GI) 15.0 51 -2.50 -3.40
Free & Fair Elections (BS/CDD/V-Dem) 29.6 42 -3.34 -0.63
Election Monitoring Agencies (V-Dem/GI) 22.8 45 -1.92 -3.83
Legitimacy of Political Process (BS) 22.2 24 -4.94 -4.18
RIGHTS 23.0 47 -1.47 -2.48
Freedom of Expression (BS/RSF/V-Dem/GI) 28.2 45 -3.20 -5.85
Freedom of Association & Assembly (BS/GI) 22.2 44 -3.32 -5.40
Civil Liberties (BS/FH ) 20.8 42 -3.01 -2.88
Human Rights Conventions (UNOLA/OHCHR) 66.7 22 +2.12 +2.40
Human Rights Violations (EIU) 0.0 39 0.00 0.00
Protection against Discrimination (GI) 0.0 36 -1.39 -3.13
GENDER 69.0 10 +1.76 +2.33
Gender Equality (AfDB/WB) 67.1 17 -0.47 0.00
Women's Political Participation (IPU/GI/WB) 57.9 8 -0.21 -1.83
Gender Balance in Education (UNESCO) 83.1 11 +2.33 +2.08
Women's Labour Force Participation (WB) 94.4 2 +0.12 +0.10
Workplace Gender Equality (GI) 50.0 4 0.00 0.00
Women in the Judiciary (GI) 75.0 19 +8.33 +18.75
Laws on Violence against Women (OECD) 75.0 3 +5.56 +3.13
Women's Political Empowerment (V-Dem) 49.4 43 -1.61 -3.63
PARTICIPATION & HUMAN RIGHTS
SCORE 2016
RANK 2016
10 -YEAR AAT
5-YEAR AAT
SUSTAINABLE ECONOMIC OPPORTUNITY 38.0 39 +0.02 -0.23
PUBLIC MANAGEMENT 38.2 42 -0.16 -0.50
Governmental Statistical Capacity (WB) 59.4 27 +1.93 +3.25
Civil Registration (GI) 75.0 10 +1.39 +3.13
Public Administration (AfDB/WB) 42.2 42 -0.87 -0.40
Diversification (AfDB/OECD/UNDP) 1.9 42 -0.10 -0.05
Budget Management (AfDB/WB) 46.4 43 +0.13 -3.53
Budget Balance (AfDB/AUC/UNECA) 35.2 42 -1.50 +0.95
Fiscal Policy (AfDB/WB) 45.2 42 -2.64 -5.95
Revenue Mobilisation (ICTD/UNU-WIDER/AfDB/WB) 38.3 40 +0.29 -2.00
Transparency of State-owned Companies (GI) 0.0 26 0.00 0.00
BUSINESS ENVIRONMENT 37.8 38 -0.11 +0.63
Investment Climate (HER) 61.1 21 +3.09 0.00
Competition (BS/GI/AfDB/WB) 48.6 29 +0.34 +0.18
Business Bureaucracy & Red Tape (EIU) 0.0 31 -3.70 -2.08
Customs Procedures (WEF) 37.8 32 +1.54 +4.18
Soundness of Banks (WEF) 19.2 38 -3.07 -0.15
Employment Creation (AFR) 29.4 22 +0.36 +0.80
Regional Integration (AfDB) 68.8 10 +0.70 +1.58
INFRASTRUCTURE 32.4 42 +0.14 +0.03
Transport Infrastructure (WEF/AFR/EIU/GI) 34.3 30 +0.09 -0.70
Electricity Infrastructure (WEF/AFR) 20.0 32 +0.43 +1.45
Digital & IT Infrastructure (EIU/ITU) 9.3 48 +0.04 -0.63
Access to Improved Water (WHO/UNICEF) 47.2 39 +0.26 +0.20
Water & Sanitation Services (AFR) 51.2 11 -0.10 -0.23
RURAL SECTOR 43.7 40 +0.20 -1.03
Rural Land & Water (IFAD) 51.9 31 +1.46 -1.53
Rural Business Climate (IFAD) 40.9 41 +0.28 -0.13
Rural Development Resources (IFAD) 43.8 32 -0.22 -3.13
Agricultural Support System (IFAD) 46.4 35 +1.02 0.00
Agricultural Policy Costs (WEF) 25.9 39 -2.44 -4.73
Engagement with Rural Organisations (IFAD) 50.6 39 +0.72 -1.80
Gender Balance in Rural Decision-making (IFAD) 41.8 30 -0.22 0.00
Rural Accountability & Transparency (IFAD) 48.4 26 +1.04 +3.03
SUSTAINABLE ECONOMIC OPPORTUNITY
SCORE 2016
RANK 2016
10 -YEAR AAT
5-YEAR AAT
HUMAN DEVELOPMENT 56.6 26 +0.68 +0.45
WELFARE 44.5 34 +0.53 +0.33
Welfare Services (AfDB/WB) 76.9 13 +2.03 -0.50
Social Safety Nets (BS) 46.2 17 +1.71 0.00
Social Protection & Labour (AfDB/WB) 51.9 28 +0.12 +0.83
Social Exclusion (BS) 14.3 20 -1.59 0.00
Poverty (AFR) 35.5 31 +1.77 +3.98
Poverty Reduction Priorities (AFR/AfDB/WB) 43.7 40 -0.21 -2.15
Narrowing Income Gaps (AFR) 28.0 27 +0.31 +0.70
Environmental Policy (BS) 42.9 14 0.00 0.00
Environmental Sustainability (AfDB/WB) 61.1 34 +0.61 0.00
EDUCATION 45.9 27 +0.53 -0.18
Education Provision (AFR) 68.0 6 -3.32 -7.48
Education Quality (BS) 33.3 21 0.00 -4.18
Educational System Management (WEF) 23.8 33 +0.02 +4.95
Human Resources in Primary Schools (UNESCO) 65.0 38 +1.11 +1.13
Primary School Completion (WB) 46.0 37 +2.67 +0.33
Secondary School Enrolment (UNESCO) 35.6 33 +3.00 +3.55
Tertiary Education Enrolment (UNESCO) 7.7 37 +0.48 +0.53
Literacy (WB) 87.9 12 +0.28 -0.18
HEALTH 79.5 12 +0.97 +1.23
Basic Health Services (AFR) 74.3 6 -2.86 -6.43
Public Health Campaigns (GI) 100.0 1 +2.78 +6.25
Child Mortality (IGME) 69.3 35 +1.64 +1.08
Maternal Mortality (MMEIG) 73.4 46 +0.58 +0.65
Access to Sanitation (WHO/UNICEF) 72.6 11 +0.23 +0.15
Undernourishment (WB) . . . .
Disease (WHO) 71.1 46 -1.91 -1.03
Immunisation (WB/WHO) 94.0 11 -0.18 -0.35
Antiretroviral Treatment (ART) Provision (UNAIDS) 81.0 13 +7.44 +9.50
HUMAN DEVELOPMENT
N/A
*AAT: Annual Average Trend
If AAT appears the same in the two time periods, differences exist beyond the 2nd decimal place.
For a full list of data sources see Annex.
Increasing Improvement Slowing Improvement Warning Signs Bouncing Back Slowing Deterioration Increasing Deterioration No Change

114
2017 IIAG Cabo Verde Scores, Ranks & Trends
OVERALL GOVERNANCE
72.2 4th2016 SCORE 2016 RANK
+0.08 -0.3010 -YEAR AAT* 5-YEAR AAT
SAFETY & RULE OF LAW 76.1 4 -0.32 -0.50
RULE OF LAW 86.3 6 -0.30 -0.93
Judicial Independence (BS/WEF/V-Dem/GI) 87.5 4 +0.62 +1.20
Judicial Process (EIU/GI) 70.8 9 -1.39 -3.13
Access to Justice (V-Dem) 89.8 9 -0.59 -1.33
Property Rights (BS/HER/WEF/AfDB/WB) 69.8 6 -0.44 -2.23
Transfers of Power (EIU) 100.0 1 0.00 0.00
Multilateral Sanctions (CDD) 100.0 1 0.00 0.00
ACCOUNTABILITY 64.4 4 -0.58 -0.78
Access to Information (GI) 29.2 24 -2.78 -6.25
Online Public Services (UNDESA) 61.8 10 +2.11 +0.65
Public Sector Accountability & Transparency (V-Dem/AfDB/WB)
92.0 1 -0.57 -1.30
Accountability of Public Officials (EIU/BS) 66.7 5 -3.70 0.00
Corruption in Government & Public Officials (EIU) 100.0 1 0.00 0.00
Corruption & Bureaucracy (WB) 76.2 2 +2.12 +4.78
Diversion of Public Funds (WEF) 56.9 8 -1.53 -2.68
Corruption Investigation (GI/AFR) 32.5 28 -0.29 -1.33
PERSONAL SAFETY 53.5 19 -0.42 -0.40
Safety of the Person (EIU/AFR) 60.7 12 +0.24 +1.40
Police Services (WEF/GI) 38.2 25 +1.36 +2.53
Social Unrest (EIU/ACLED) 50.0 34 -2.78 0.00
Crime (EIU/AFR) 47.2 36 -1.34 -0.08
Political Violence (ACLED/PTS) 100.0 1 +2.78 0.00
Human Trafficking (USDS) 25.0 21 -2.78 -6.25
NATIONAL SECURITY 100.0 1 0.00 0.00
Government Involvement in Armed Conflict (UCDP) 100.0 1 0.00 0.00
Domestic Armed Conflict (EIU) 100.0 1 0.00 0.00
Violence by Non-state Actors (ACLED) . . . .
Cross-border Tensions (EIU) 100.0 1 0.00 0.00
Internally Displaced People (IDMC) 100.0 1 0.00 0.00
Political Refugees (UNHCR) 100.0 1 +0.02 +0.03
SAFETY & RULE OF LAW
SCORE 2016
RANK 2016
10 -YEAR AAT
5-YEAR AAT
SCORE 2016
RANK 2016
10 -YEAR AAT
5-YEAR AAT
PARTICIPATION & HUMAN RIGHTS 78.0 1 -0.16 -0.70
PARTICIPATION 87.8 2 +0.37 -0.93
Political Participation (EIU/FH/V-Dem) 90.9 3 +0.33 -0.63
Civil Society Participation (BS/V-Dem/GI) 99.7 1 -0.03 -0.03
Free & Fair Elections (BS/CDD/V-Dem) 86.7 4 +0.76 -2.80
Election Monitoring Agencies (V-Dem/GI) 74.2 5 +0.44 -0.15
Legitimacy of Political Process (BS) . . . .
RIGHTS 76.8 2 -0.34 +0.45
Freedom of Expression (BS/RSF/V-Dem/GI) 96.2 1 -0.12 -0.40
Freedom of Association & Assembly (BS/GI) 100.0 1 0.00 0.00
Civil Liberties (BS/FH ) 100.0 1 0.00 0.00
Human Rights Conventions (UNOLA/OHCHR) 52.4 38 -0.52 0.00
Human Rights Violations (EIU) 75.0 1 -2.78 0.00
Protection against Discrimination (GI) 37.5 12 +1.39 +3.13
GENDER 69.4 8 -0.49 -1.63
Gender Equality (AfDB/WB) 90.0 6 -0.42 -0.95
Women's Political Participation (IPU/GI/WB) 49.0 15 -0.48 -3.60
Gender Balance in Education (UNESCO) 78.2 25 -0.62 -1.00
Women's Labour Force Participation (WB) 54.0 32 +0.63 +0.53
Workplace Gender Equality (GI) 50.0 4 0.00 0.00
Women in the Judiciary (GI) 75.0 19 -2.78 -6.25
Laws on Violence against Women (OECD) . . . .
Women's Political Empowerment (V-Dem) 89.4 7 +0.18 -0.25
PARTICIPATION & HUMAN RIGHTS
SCORE 2016
RANK 2016
10 -YEAR AAT
5-YEAR AAT
SUSTAINABLE ECONOMIC OPPORTUNITY 60.6 8 +0.32 +0.03
PUBLIC MANAGEMENT 59.8 8 -0.69 +0.20
Governmental Statistical Capacity (WB) 68.1 16 -0.81 0.00
Civil Registration (GI) 75.0 10 0.00 0.00
Public Administration (AfDB/WB) 96.9 4 +1.04 +2.35
Diversification (AfDB/OECD/UNDP) 13.5 11 -0.54 +0.28
Budget Management (AfDB/WB) 68.8 18 -1.43 -3.23
Budget Balance (AfDB/AUC/UNECA) 57.3 5 +0.16 +7.08
Fiscal Policy (AfDB/WB) 74.6 14 -2.20 0.00
Revenue Mobilisation (ICTD/UNU-WIDER/AfDB/WB) 59.2 10 +0.39 +1.58
Transparency of State-owned Companies (GI) 25.0 7 -2.78 -6.25
BUSINESS ENVIRONMENT 48.7 20 -0.53 -1.98
Investment Climate (HER) 83.3 5 +1.84 +2.78
Competition (BS/GI/AfDB/WB) 60.6 14 -1.50 -4.15
Business Bureaucracy & Red Tape (EIU) 33.3 10 -3.71 -8.35
Customs Procedures (WEF) 47.8 17 +1.63 +1.60
Soundness of Banks (WEF) 49.8 15 -2.27 -3.48
Employment Creation (AFR) 22.6 30 +0.31 -2.10
Regional Integration (AfDB) 43.8 29 0.00 0.00
INFRASTRUCTURE 61.2 10 +1.97 +2.68
Transport Infrastructure (WEF/AFR/EIU/GI) 51.0 12 +0.88 +1.58
Electricity Infrastructure (WEF/AFR) 39.8 16 +1.23 +3.08
Digital & IT Infrastructure (EIU/ITU) 71.5 5 +5.20 +5.88
Access to Improved Water (WHO/UNICEF) 83.9 8 +0.69 +0.45
Water & Sanitation Services (AFR) 59.7 5 +1.83 +2.30
RURAL SECTOR 72.5 4 +0.50 -0.83
Rural Land & Water (IFAD) 80.3 2 +2.12 0.00
Rural Business Climate (IFAD) 71.9 5 +0.77 0.00
Rural Development Resources (IFAD) 62.5 12 -1.61 -3.13
Agricultural Support System (IFAD) 74.3 7 +0.62 0.00
Agricultural Policy Costs (WEF) 63.5 9 +0.62 -0.38
Engagement with Rural Organisations (IFAD) 92.5 2 +2.67 0.00
Gender Balance in Rural Decision-making (IFAD) 62.5 8 -0.70 0.00
Rural Accountability & Transparency (IFAD) 72.6 6 -0.47 -3.03
SUSTAINABLE ECONOMIC OPPORTUNITY
SCORE 2016
RANK 2016
10 -YEAR AAT
5-YEAR AAT
HUMAN DEVELOPMENT 74.0 4 +0.44 -0.08
WELFARE 63.1 6 -0.29 -1.08
Welfare Services (AfDB/WB) 92.0 3 0.00 0.00
Social Safety Nets (BS) . . . .
Social Protection & Labour (AfDB/WB) 76.2 5 -0.79 0.00
Social Exclusion (BS) . . . .
Poverty (AFR) 72.8 8 +1.80 +3.43
Poverty Reduction Priorities (AFR/AfDB/WB) 51.1 26 -1.18 -4.20
Narrowing Income Gaps (AFR) 19.9 30 -0.63 -4.30
Environmental Policy (BS) . . . .
Environmental Sustainability (AfDB/WB) 66.7 23 -0.92 -1.38
EDUCATION 72.2 4 +1.00 +0.18
Education Provision (AFR) 54.9 11 -0.08 -3.28
Education Quality (BS) . . . .
Educational System Management (WEF) 62.8 9 +0.76 +1.45
Human Resources in Primary Schools (UNESCO) 89.2 5 +0.37 +0.30
Primary School Completion (WB) 87.0 6 +1.47 +0.80
Secondary School Enrolment (UNESCO) 85.0 5 +1.39 +0.35
Tertiary Education Enrolment (UNESCO) 35.2 8 +2.27 +0.65
Literacy (WB) 91.5 8 +0.88 +0.95
HEALTH 86.7 4 +0.63 +0.70
Basic Health Services (AFR) 52.7 14 +0.39 -2.50
Public Health Campaigns (GI) 100.0 1 0.00 0.00
Child Mortality (IGME) 95.0 6 +0.18 +0.23
Maternal Mortality (MMEIG) 98.7 3 +0.07 +0.05
Access to Sanitation (WHO/UNICEF) 66.1 17 +0.66 +0.43
Undernourishment (WB) 92.1 15 +0.82 +0.90
Disease (WHO) 98.0 6 +0.08 -0.18
Immunisation (WB/WHO) 92.9 13 -0.44 -0.08
Antiretroviral Treatment (ART) Provision (UNAIDS) 84.3 7 +3.87 +7.28
HUMAN DEVELOPMENTN/A
N/A
N/A
N/A
N/A
N/A
N/A
*AAT: Annual Average Trend
If AAT appears the same in the two time periods, differences exist beyond the 2nd decimal place.
For a full list of data sources see Annex.
Increasing Improvement Slowing Improvement Warning Signs Bouncing Back Slowing Deterioration Increasing Deterioration No Change

115
2017 IIAG: Index Report2017 IIAG Cameroon Scores, Ranks & Trends
OVERALL GOVERNANCE
46.9 37th2016 SCORE 2016 RANK
+0.06 -0.1510 -YEAR AAT* 5-YEAR AAT
SAFETY & RULE OF LAW 44.5 42 -0.96 -2.10
RULE OF LAW 42.8 36 -0.47 -0.18
Judicial Independence (BS/WEF/V-Dem/GI) 24.8 43 +1.13 +1.93
Judicial Process (EIU/GI) 25.0 41 0.00 0.00
Access to Justice (V-Dem) 60.0 31 -0.93 -4.35
Property Rights (BS/HER/WEF/AfDB/WB) 47.1 29 +0.72 +1.45
Transfers of Power (EIU) 0.0 38 -3.70 0.00
Multilateral Sanctions (CDD) 100.0 1 0.00 0.00
ACCOUNTABILITY 27.0 36 -0.22 -1.38
Access to Information (GI) 12.5 41 0.00 0.00
Online Public Services (UNDESA) 29.4 25 +1.41 -2.83
Public Sector Accountability & Transparency (V-Dem/AfDB/WB)
27.4 41 -0.13 -0.25
Accountability of Public Officials (EIU/BS) 38.1 17 +0.92 0.00
Corruption in Government & Public Officials (EIU) 20.0 31 -2.22 -1.25
Corruption & Bureaucracy (WB) 38.1 17 +1.06 +2.38
Diversion of Public Funds (WEF) 17.6 34 +1.53 +0.73
Corruption Investigation (GI/AFR) 32.6 27 -4.40 -9.90
PERSONAL SAFETY 46.7 32 -0.31 -0.40
Safety of the Person (EIU/AFR) 34.3 37 +0.08 +0.18
Police Services (WEF/GI) 51.5 10 +3.56 +7.60
Social Unrest (EIU/ACLED) 52.6 30 -2.43 -2.05
Crime (EIU/AFR) 44.4 41 -0.07 -0.15
Political Violence (ACLED/PTS) 72.2 30 -0.21 -1.80
Human Trafficking (USDS) 25.0 21 -2.78 -6.25
NATIONAL SECURITY 61.4 46 -2.84 -6.45
Government Involvement in Armed Conflict (UCDP) 22.2 52 -8.64 -19.45
Domestic Armed Conflict (EIU) 50.0 25 -2.78 0.00
Violence by Non-state Actors (ACLED) 79.5 37 -2.09 -5.13
Cross-border Tensions (EIU) 25.0 42 -2.78 -12.50
Internally Displaced People (IDMC) 92.6 41 -0.82 -1.85
Political Refugees (UNHCR) 98.9 26 +0.06 +0.13
SAFETY & RULE OF LAW
SCORE 2016
RANK 2016
10 -YEAR AAT
5-YEAR AAT
SCORE 2016
RANK 2016
10 -YEAR AAT
5-YEAR AAT
PARTICIPATION & HUMAN RIGHTS 39.4 37 +0.11 +0.30
PARTICIPATION 31.1 41 +0.34 +0.55
Political Participation (EIU/FH/V-Dem) 42.5 39 -0.13 +0.25
Civil Society Participation (BS/V-Dem/GI) 42.0 36 -0.03 -0.85
Free & Fair Elections (BS/CDD/V-Dem) 26.8 43 +0.47 +0.60
Election Monitoring Agencies (V-Dem/GI) 33.2 34 +1.44 +2.80
Legitimacy of Political Process (BS) 11.1 25 0.00 0.00
RIGHTS 35.6 35 -0.11 +0.75
Freedom of Expression (BS/RSF/V-Dem/GI) 52.5 35 -0.86 -2.08
Freedom of Association & Assembly (BS/GI) 22.2 44 -1.39 -3.13
Civil Liberties (BS/FH ) 27.1 40 0.00 +0.78
Human Rights Conventions (UNOLA/OHCHR) 61.9 31 +1.59 +1.20
Human Rights Violations (EIU) 25.0 25 -2.78 +1.55
Protection against Discrimination (GI) 25.0 17 +2.78 +6.25
GENDER 51.3 32 +0.08 -0.45
Gender Equality (AfDB/WB) 59.6 24 +0.23 +0.53
Women's Political Participation (IPU/GI/WB) 44.9 19 +1.79 +3.73
Gender Balance in Education (UNESCO) 62.6 37 +0.96 +0.70
Women's Labour Force Participation (WB) 76.8 19 +0.38 +0.13
Workplace Gender Equality (GI) 50.0 4 0.00 0.00
Women in the Judiciary (GI) 25.0 36 -2.78 -6.25
Laws on Violence against Women (OECD) 16.7 42 -0.92 -3.13
Women's Political Empowerment (V-Dem) 75.0 26 +1.01 +0.73
PARTICIPATION & HUMAN RIGHTS
SCORE 2016
RANK 2016
10 -YEAR AAT
5-YEAR AAT
SUSTAINABLE ECONOMIC OPPORTUNITY 44.3 31 +0.12 +0.38
PUBLIC MANAGEMENT 44.0 31 -0.44 +0.50
Governmental Statistical Capacity (WB) 68.1 16 +0.80 +2.90
Civil Registration (GI) 25.0 47 0.00 0.00
Public Administration (AfDB/WB) 64.6 18 0.00 0.00
Diversification (AfDB/OECD/UNDP) 6.1 26 +0.28 +0.23
Budget Management (AfDB/WB) 69.0 15 0.00 +1.78
Budget Balance (AfDB/AUC/UNECA) 45.9 23 -4.61 -1.25
Fiscal Policy (AfDB/WB) 67.5 22 -0.97 -0.38
Revenue Mobilisation (ICTD/UNU-WIDER/AfDB/WB) 49.4 24 +0.46 +1.15
Transparency of State-owned Companies (GI) 0.0 26 0.00 0.00
BUSINESS ENVIRONMENT 47.1 23 -0.58 0.00
Investment Climate (HER) 38.9 41 -1.86 0.00
Competition (BS/GI/AfDB/WB) 50.8 22 +1.69 +4.00
Business Bureaucracy & Red Tape (EIU) 0.0 31 -3.70 0.00
Customs Procedures (WEF) 41.3 26 +1.08 -5.25
Soundness of Banks (WEF) 47.9 19 -2.39 -1.43
Employment Creation (AFR) 63.6 3 +0.49 +1.10
Regional Integration (AfDB) 87.5 3 +0.69 +1.55
INFRASTRUCTURE 37.5 30 +1.26 +1.50
Transport Infrastructure (WEF/AFR/EIU/GI) 31.1 33 +0.14 -1.80
Electricity Infrastructure (WEF/AFR) 27.9 30 +0.07 +0.58
Digital & IT Infrastructure (EIU/ITU) 35.5 20 +2.41 +1.45
Access to Improved Water (WHO/UNICEF) 58.4 32 +0.69 +0.58
Water & Sanitation Services (AFR) 34.7 22 +2.97 +6.68
RURAL SECTOR 48.7 34 +0.27 -0.43
Rural Land & Water (IFAD) 55.1 23 +1.46 0.00
Rural Business Climate (IFAD) 49.3 34 -0.33 0.00
Rural Development Resources (IFAD) 53.3 23 +1.11 0.00
Agricultural Support System (IFAD) 67.3 15 +2.20 0.00
Agricultural Policy Costs (WEF) 53.4 18 -0.64 -3.25
Engagement with Rural Organisations (IFAD) 61.9 22 +1.44 0.00
Gender Balance in Rural Decision-making (IFAD) 37.5 36 +0.36 0.00
Rural Accountability & Transparency (IFAD) 12.1 50 -3.42 0.00
SUSTAINABLE ECONOMIC OPPORTUNITY
SCORE 2016
RANK 2016
10 -YEAR AAT
5-YEAR AAT
HUMAN DEVELOPMENT 59.5 19 +0.93 +0.83
WELFARE 50.6 23 +0.78 +1.48
Welfare Services (AfDB/WB) 79.7 12 +1.56 +3.78
Social Safety Nets (BS) 53.8 9 +0.84 0.00
Social Protection & Labour (AfDB/WB) 56.3 21 0.00 0.00
Social Exclusion (BS) 28.6 7 0.00 0.00
Poverty (AFR) 40.7 28 +1.04 +2.35
Poverty Reduction Priorities (AFR/AfDB/WB) 47.0 34 +0.77 +1.73
Narrowing Income Gaps (AFR) 34.2 20 +0.96 +2.15
Environmental Policy (BS) 42.9 14 0.00 +1.80
Environmental Sustainability (AfDB/WB) 72.2 15 +1.84 +1.38
EDUCATION 55.2 19 +1.22 +0.78
Education Provision (AFR) 61.2 8 +0.57 +1.28
Education Quality (BS) 50.0 11 0.00 0.00
Educational System Management (WEF) 50.7 13 +1.12 -1.03
Human Resources in Primary Schools (UNESCO) 67.0 30 +0.38 +1.18
Primary School Completion (WB) 58.3 23 +2.39 +0.23
Secondary School Enrolment (UNESCO) 50.9 17 +2.86 +1.85
Tertiary Education Enrolment (UNESCO) 28.3 10 +1.88 +1.88
Literacy (WB) 74.9 25 +0.59 +0.70
HEALTH 72.6 25 +0.78 +0.18
Basic Health Services (AFR) 59.9 8 +0.91 +2.05
Public Health Campaigns (GI) 75.0 14 -2.78 -6.25
Child Mortality (IGME) 66.5 37 +1.43 +1.08
Maternal Mortality (MMEIG) 77.7 39 +0.48 +0.33
Access to Sanitation (WHO/UNICEF) 64.4 20 -0.01 0.00
Undernourishment (WB) 91.2 17 +1.78 +0.40
Disease (WHO) 76.4 40 -0.26 -0.33
Immunisation (WB/WHO) 81.1 30 +0.38 -0.50
Antiretroviral Treatment (ART) Provision (UNAIDS) 61.2 28 +5.03 +4.88
HUMAN DEVELOPMENT
*AAT: Annual Average Trend
If AAT appears the same in the two time periods, differences exist beyond the 2nd decimal place.
For a full list of data sources see Annex.
Increasing Improvement Slowing Improvement Warning Signs Bouncing Back Slowing Deterioration Increasing Deterioration No Change

116
2017 IIAG Central African Republic Scores, Ranks & Trends
OVERALL GOVERNANCE
30.5 51st2016 SCORE 2016 RANK
-0.14 -0.9810 -YEAR AAT* 5-YEAR AAT
SAFETY & RULE OF LAW 23.3 51 -0.78 -1.80
RULE OF LAW 30.4 47 -0.40 -0.88
Judicial Independence (BS/WEF/V-Dem/GI) 38.4 29 +2.07 +4.10
Judicial Process (EIU/GI) 41.7 26 +2.78 +6.25
Access to Justice (V-Dem) 26.2 48 -1.64 -3.70
Property Rights (BS/HER/WEF/AfDB/WB) 18.0 52 -0.93 -1.53
Transfers of Power (EIU) 25.0 36 +2.78 +6.25
Multilateral Sanctions (CDD) 33.3 50 -7.41 -16.68
ACCOUNTABILITY 16.3 46 +0.42 +0.88
Access to Information (GI) 29.2 24 +3.24 +7.30
Online Public Services (UNDESA) 0.0 54 0.00 0.00
Public Sector Accountability & Transparency (V-Dem/AfDB/WB)
53.7 22 +3.19 +6.68
Accountability of Public Officials (EIU/BS) 31.0 39 +1.86 +4.18
Corruption in Government & Public Officials (EIU) 0.0 38 -2.22 -5.00
Corruption & Bureaucracy (WB) 0.0 50 -3.18 -7.15
Diversion of Public Funds (WEF) . . . .
Corruption Investigation (GI/AFR) 0.0 49 0.00 0.00
PERSONAL SAFETY 15.3 51 -1.26 -3.13
Safety of the Person (EIU/AFR) 0.0 47 0.00 0.00
Police Services (WEF/GI) 0.0 49 0.00 0.00
Social Unrest (EIU/ACLED) 36.8 41 -5.61 -8.60
Crime (EIU/AFR) 0.0 51 -2.78 -9.38
Political Violence (ACLED/PTS) 55.1 43 +3.66 -0.70
Human Trafficking (USDS) 0.0 39 -2.78 0.00
NATIONAL SECURITY 31.4 52 -1.88 -4.03
Government Involvement in Armed Conflict (UCDP) 100.0 1 0.00 +5.55
Domestic Armed Conflict (EIU) 0.0 49 0.00 0.00
Violence by Non-state Actors (ACLED) 51.2 42 -4.56 -6.55
Cross-border Tensions (EIU) 25.0 42 +2.78 -6.25
Internally Displaced People (IDMC) 11.9 49 -4.76 -14.80
Political Refugees (UNHCR) 0.0 51 -4.77 -2.20
SAFETY & RULE OF LAW
SCORE 2016
RANK 2016
10 -YEAR AAT
5-YEAR AAT
SCORE 2016
RANK 2016
10 -YEAR AAT
5-YEAR AAT
PARTICIPATION & HUMAN RIGHTS 38.7 39 -0.04 +0.10
PARTICIPATION 35.2 35 -0.39 +0.53
Political Participation (EIU/FH/V-Dem) 34.8 45 -0.59 -1.88
Civil Society Participation (BS/V-Dem/GI) 69.1 23 +0.86 +2.40
Free & Fair Elections (BS/CDD/V-Dem) 46.0 32 +0.43 +5.20
Election Monitoring Agencies (V-Dem/GI) 25.9 42 -0.19 -0.43
Legitimacy of Political Process (BS) 0.0 40 -2.47 -2.78
RIGHTS 30.6 39 +0.03 +0.10
Freedom of Expression (BS/RSF/V-Dem/GI) 72.3 12 +0.63 +2.38
Freedom of Association & Assembly (BS/GI) 46.5 22 0.00 0.00
Civil Liberties (BS/FH ) 12.5 48 -2.54 -4.18
Human Rights Conventions (UNOLA/OHCHR) 52.4 38 +2.12 +2.38
Human Rights Violations (EIU) 0.0 39 0.00 0.00
Protection against Discrimination (GI) 0.0 36 0.00 0.00
GENDER 50.4 34 +0.23 -0.30
Gender Equality (AfDB/WB) 37.1 44 +0.92 +1.58
Women's Political Participation (IPU/GI/WB) 27.4 44 -0.57 -2.73
Gender Balance in Education (UNESCO) 29.1 48 +0.37 0.00
Women's Labour Force Participation (WB) 77.7 17 +0.29 +0.55
Workplace Gender Equality (GI) 50.0 4 0.00 0.00
Women in the Judiciary (GI) 100.0 1 0.00 0.00
Laws on Violence against Women (OECD) 25.0 37 0.00 -3.13
Women's Political Empowerment (V-Dem) 57.1 36 +0.84 +1.35
PARTICIPATION & HUMAN RIGHTS
SCORE 2016
RANK 2016
10 -YEAR AAT
5-YEAR AAT
SUSTAINABLE ECONOMIC OPPORTUNITY 30.0 47 +0.14 -1.33
PUBLIC MANAGEMENT 32.9 46 -0.54 -2.13
Governmental Statistical Capacity (WB) 31.9 48 -0.48 -5.43
Civil Registration (GI) 50.0 32 0.00 0.00
Public Administration (AfDB/WB) 40.6 44 +0.34 +0.78
Diversification (AfDB/OECD/UNDP) 4.2 31 -0.06 -0.20
Budget Management (AfDB/WB) 31.0 48 -0.61 -3.18
Budget Balance (AfDB/AUC/UNECA) 54.9 7 -1.42 -1.08
Fiscal Policy (AfDB/WB) 56.3 30 0.00 -1.80
Revenue Mobilisation (ICTD/UNU-WIDER/AfDB/WB) 26.8 49 +0.09 -2.15
Transparency of State-owned Companies (GI) 0.0 26 -2.78 -6.25
BUSINESS ENVIRONMENT 43.3 29 +0.38 +0.25
Investment Climate (HER) 88.9 1 +6.18 +6.95
Competition (BS/GI/AfDB/WB) 34.5 43 +0.44 +1.35
Business Bureaucracy & Red Tape (EIU) 0.0 31 -3.70 -4.18
Customs Procedures (WEF) . . . .
Soundness of Banks (WEF) . . . .
Employment Creation (AFR) . . . .
Regional Integration (AfDB) 50.0 25 -1.39 -3.13
INFRASTRUCTURE 21.1 48 +0.17 -0.63
Transport Infrastructure (WEF/AFR/EIU/GI) 12.5 49 0.00 0.00
Electricity Infrastructure (WEF/AFR) . . . .
Digital & IT Infrastructure (EIU/ITU) 5.8 53 +0.36 -2.00
Access to Improved Water (WHO/UNICEF) 45.0 40 +0.14 +0.08
Water & Sanitation Services (AFR) . . . .
RURAL SECTOR 22.5 50 +0.58 -2.85
Rural Land & Water (IFAD) 13.5 52 -0.67 -6.05
Rural Business Climate (IFAD) 19.6 52 +0.36 -2.85
Rural Development Resources (IFAD) 25.0 46 +0.79 -3.13
Agricultural Support System (IFAD) 37.2 41 +0.92 +0.58
Agricultural Policy Costs (WEF) . . . .
Engagement with Rural Organisations (IFAD) 25.6 51 +0.42 -5.00
Gender Balance in Rural Decision-making (IFAD) 12.5 49 +1.19 -1.58
Rural Accountability & Transparency (IFAD) 24.2 46 +1.01 -1.88
SUSTAINABLE ECONOMIC OPPORTUNITY
SCORE 2016
RANK 2016
10 -YEAR AAT
5-YEAR AAT
HUMAN DEVELOPMENT 29.9 52 +0.08 -0.90
WELFARE 22.6 52 -0.50 -2.53
Welfare Services (AfDB/WB) 29.4 53 -0.32 -3.50
Social Safety Nets (BS) 15.4 39 -0.86 -1.93
Social Protection & Labour (AfDB/WB) 24.3 50 -0.12 -1.10
Social Exclusion (BS) 0.0 33 0.00 0.00
Poverty (AFR) . . . .
Poverty Reduction Priorities (AFR/AfDB/WB) 33.0 47 0.00 -4.10
Narrowing Income Gaps (AFR) . . . .
Environmental Policy (BS) 14.3 38 -1.59 -3.58
Environmental Sustainability (AfDB/WB) 41.7 48 -0.61 -3.48
EDUCATION 15.7 53 -0.01 -0.70
Education Provision (AFR) . . . .
Education Quality (BS) 0.0 42 -3.70 -4.18
Educational System Management (WEF) . . . .
Human Resources in Primary Schools (UNESCO) 22.9 52 +2.06 0.00
Primary School Completion (WB) 28.5 49 +1.51 0.00
Secondary School Enrolment (UNESCO) 11.1 51 +0.46 0.00
Tertiary Education Enrolment (UNESCO) 4.1 46 +0.19 0.00
Literacy (WB) 27.6 48 -0.58 0.00
HEALTH 51.3 52 +0.74 +0.53
Basic Health Services (AFR) . . . .
Public Health Campaigns (GI) 50.0 33 0.00 0.00
Child Mortality (IGME) 47.5 51 +1.56 +1.35
Maternal Mortality (MMEIG) 66.9 52 +0.46 -0.05
Access to Sanitation (WHO/UNICEF) 47.7 38 +0.24 +0.08
Undernourishment (WB) 23.2 43 -1.73 -5.58
Disease (WHO) 75.7 41 +1.23 +3.43
Immunisation (WB/WHO) 42.4 51 -0.28 0.00
Antiretroviral Treatment (ART) Provision (UNAIDS) 57.1 30 +4.50 +4.95
HUMAN DEVELOPMENT
N/A
N/A
N/A
N/A
N/A
N/A
N/A
N/A
N/A
N/A
N/A
N/A
*AAT: Annual Average Trend
If AAT appears the same in the two time periods, differences exist beyond the 2nd decimal place.
For a full list of data sources see Annex.
Increasing Improvement Slowing Improvement Warning Signs Bouncing Back Slowing Deterioration Increasing Deterioration No Change

117
2017 IIAG: Index Report2017 IIAG Chad Scores, Ranks & Trends
OVERALL GOVERNANCE
35.2 47th2016 SCORE 2016 RANK
+0.39 +0.1510 -YEAR AAT* 5-YEAR AAT
SAFETY & RULE OF LAW 41.5 45 +0.61 +0.58
RULE OF LAW 37.2 43 +0.50 +2.28
Judicial Independence (BS/WEF/V-Dem/GI) 12.5 49 +0.43 +0.83
Judicial Process (EIU/GI) 50.0 25 +4.17 +9.38
Access to Justice (V-Dem) 27.7 44 +1.01 +1.25
Property Rights (BS/HER/WEF/AfDB/WB) 33.0 45 +1.06 +2.25
Transfers of Power (EIU) 0.0 38 -3.70 0.00
Multilateral Sanctions (CDD) 100.0 1 0.00 0.00
ACCOUNTABILITY 17.6 44 -0.22 -0.98
Access to Information (GI) 37.5 22 -0.47 -1.05
Online Public Services (UNDESA) 18.6 35 +1.89 +1.33
Public Sector Accountability & Transparency (V-Dem/AfDB/WB)
22.2 48 +0.94 +0.90
Accountability of Public Officials (EIU/BS) 31.0 39 +0.80 0.00
Corruption in Government & Public Officials (EIU) 0.0 38 -2.22 0.00
Corruption & Bureaucracy (WB) 19.0 33 -1.07 -2.40
Diversion of Public Funds (WEF) 0.3 41 -0.27 -3.50
Corruption Investigation (GI/AFR) 12.5 40 -1.39 -3.13
PERSONAL SAFETY 39.2 40 +0.41 +1.30
Safety of the Person (EIU/AFR) 0.0 47 0.00 0.00
Police Services (WEF/GI) 22.6 42 +2.17 +4.35
Social Unrest (EIU/ACLED) 66.2 19 -0.98 -2.20
Crime (EIU/AFR) 25.0 45 -2.78 0.00
Political Violence (ACLED/PTS) 71.3 32 +1.29 -0.70
Human Trafficking (USDS) 50.0 1 +2.78 +6.25
NATIONAL SECURITY 71.9 39 +1.77 -0.28
Government Involvement in Armed Conflict (UCDP) 66.7 45 -1.23 -2.78
Domestic Armed Conflict (EIU) 25.0 41 +2.78 0.00
Violence by Non-state Actors (ACLED) 99.6 11 +1.36 -0.10
Cross-border Tensions (EIU) 50.0 31 +5.56 0.00
Internally Displaced People (IDMC) 92.6 41 +0.99 -0.10
Political Refugees (UNHCR) 97.6 33 +1.17 +1.35
SAFETY & RULE OF LAW
SCORE 2016
RANK 2016
10 -YEAR AAT
5-YEAR AAT
SCORE 2016
RANK 2016
10 -YEAR AAT
5-YEAR AAT
PARTICIPATION & HUMAN RIGHTS 31.0 46 +0.06 -0.05
PARTICIPATION 22.5 48 -0.04 -0.83
Political Participation (EIU/FH/V-Dem) 28.0 49 +0.48 +0.48
Civil Society Participation (BS/V-Dem/GI) 40.1 40 +0.72 +1.48
Free & Fair Elections (BS/CDD/V-Dem) 26.4 45 +1.22 +0.80
Election Monitoring Agencies (V-Dem/GI) 7.2 51 -3.87 -8.15
Legitimacy of Political Process (BS) 11.1 25 +1.23 +1.38
RIGHTS 29.6 41 -0.03 -0.38
Freedom of Expression (BS/RSF/V-Dem/GI) 48.3 37 +0.12 +0.80
Freedom of Association & Assembly (BS/GI) 22.9 43 -1.39 -3.13
Civil Liberties (BS/FH ) 14.6 46 0.00 0.00
Human Rights Conventions (UNOLA/OHCHR) 66.7 22 +1.07 0.00
Human Rights Violations (EIU) 0.0 39 0.00 0.00
Protection against Discrimination (GI) 25.0 17 0.00 0.00
GENDER 40.9 43 +0.23 +1.03
Gender Equality (AfDB/WB) 28.8 50 0.00 0.00
Women's Political Participation (IPU/GI/WB) 35.5 34 +0.61 -0.15
Gender Balance in Education (UNESCO) 31.7 47 +1.41 0.00
Women's Labour Force Participation (WB) 67.6 26 -0.03 -0.03
Workplace Gender Equality (GI) 25.0 37 0.00 0.00
Women in the Judiciary (GI) 75.0 19 +2.78 +6.25
Laws on Violence against Women (OECD) 8.3 44 -4.63 -2.10
Women's Political Empowerment (V-Dem) 55.3 39 +1.71 +4.28
PARTICIPATION & HUMAN RIGHTS
SCORE 2016
RANK 2016
10 -YEAR AAT
5-YEAR AAT
SUSTAINABLE ECONOMIC OPPORTUNITY 30.8 46 +0.18 -0.13
PUBLIC MANAGEMENT 36.7 43 +0.19 +0.43
Governmental Statistical Capacity (WB) 49.3 39 +0.32 -3.25
Civil Registration (GI) 37.5 42 0.00 0.00
Public Administration (AfDB/WB) 45.3 40 +0.17 -0.40
Diversification (AfDB/OECD/UNDP) 0.3 53 +0.02 -0.08
Budget Management (AfDB/WB) 53.6 37 +1.28 +4.28
Budget Balance (AfDB/AUC/UNECA) 30.7 47 -4.39 -7.63
Fiscal Policy (AfDB/WB) 56.3 30 +0.79 +3.15
Revenue Mobilisation (ICTD/UNU-WIDER/AfDB/WB) 32.5 45 +0.73 +1.48
Transparency of State-owned Companies (GI) 25.0 7 +2.78 +6.25
BUSINESS ENVIRONMENT 35.2 40 +0.27 -0.15
Investment Climate (HER) 66.7 15 +2.48 +2.78
Competition (BS/GI/AfDB/WB) 47.7 31 +0.92 +2.25
Business Bureaucracy & Red Tape (EIU) 0.0 31 0.00 0.00
Customs Procedures (WEF) 14.0 40 +1.09 -2.65
Soundness of Banks (WEF) 20.3 37 -2.88 -3.33
Employment Creation (AFR) . . . .
Regional Integration (AfDB) 62.5 16 0.00 0.00
INFRASTRUCTURE 19.2 50 +1.00 +0.18
Transport Infrastructure (WEF/AFR/EIU/GI) 24.0 45 +1.47 +0.23
Electricity Infrastructure (WEF/AFR) 12.9 37 +1.43 +1.75
Digital & IT Infrastructure (EIU/ITU) 8.8 50 +0.82 -1.58
Access to Improved Water (WHO/UNICEF) 31.0 48 +0.26 +0.23
Water & Sanitation Services (AFR) . . . .
RURAL SECTOR 32.1 49 -0.73 -0.90
Rural Land & Water (IFAD) 39.8 43 -0.83 +0.03
Rural Business Climate (IFAD) 37.4 44 -0.76 +0.98
Rural Development Resources (IFAD) 25.0 46 -0.48 -2.38
Agricultural Support System (IFAD) 41.9 38 +1.30 +1.18
Agricultural Policy Costs (WEF) 36.6 36 -2.12 -4.23
Engagement with Rural Organisations (IFAD) 38.9 47 -0.60 -0.63
Gender Balance in Rural Decision-making (IFAD) 25.0 45 0.00 +2.05
Rural Accountability & Transparency (IFAD) 12.1 50 -2.40 -4.18
SUSTAINABLE ECONOMIC OPPORTUNITY
SCORE 2016
RANK 2016
10 -YEAR AAT
5-YEAR AAT
HUMAN DEVELOPMENT 37.7 51 +0.73 +0.25
WELFARE 36.5 45 +0.11 -0.03
Welfare Services (AfDB/WB) 49.4 45 -0.22 0.00
Social Safety Nets (BS) 23.1 35 0.00 0.00
Social Protection & Labour (AfDB/WB) 50.8 31 +1.41 +2.08
Social Exclusion (BS) 0.0 33 0.00 0.00
Poverty (AFR) . . . .
Poverty Reduction Priorities (AFR/AfDB/WB) 50.6 27 -1.02 +0.53
Narrowing Income Gaps (AFR) . . . .
Environmental Policy (BS) 28.6 26 0.00 0.00
Environmental Sustainability (AfDB/WB) 52.8 42 +0.62 -2.78
EDUCATION 24.5 51 +0.81 +0.35
Education Provision (AFR) . . . .
Education Quality (BS) 33.3 21 +1.84 +4.15
Educational System Management (WEF) 19.8 34 +1.28 -3.65
Human Resources in Primary Schools (UNESCO) 43.1 50 -0.26 -0.33
Primary School Completion (WB) 22.1 51 +0.89 +0.85
Secondary School Enrolment (UNESCO) 16.0 49 +0.42 0.00
Tertiary Education Enrolment (UNESCO) 5.2 44 +0.30 +0.33
Literacy (WB) 31.7 45 +1.16 +0.98
HEALTH 52.2 51 +1.30 +0.48
Basic Health Services (AFR) . . . .
Public Health Campaigns (GI) 50.0 33 -2.78 -6.25
Child Mortality (IGME) 43.7 53 +1.64 +1.45
Maternal Mortality (MMEIG) 67.9 51 +1.04 +0.70
Access to Sanitation (WHO/UNICEF) 14.9 52 +0.11 +0.13
Undernourishment (WB) 47.1 41 +1.18 +2.08
Disease (WHO) 83.7 33 -0.40 -0.50
Immunisation (WB/WHO) 53.4 47 +4.01 +1.60
Antiretroviral Treatment (ART) Provision (UNAIDS) 56.7 31 +5.54 +4.48
HUMAN DEVELOPMENT
N/A
N/A
N/A
N/A
N/A
N/A
*AAT: Annual Average Trend
If AAT appears the same in the two time periods, differences exist beyond the 2nd decimal place.
For a full list of data sources see Annex.
Increasing Improvement Slowing Improvement Warning Signs Bouncing Back Slowing Deterioration Increasing Deterioration No Change

118
2017 IIAG Comoros Scores, Ranks & Trends
OVERALL GOVERNANCE
50.0 30th2016 SCORE 2016 RANK
+0.60 +0.4510 -YEAR AAT* 5-YEAR AAT
SAFETY & RULE OF LAW 58.9 23 +1.50 +1.08
RULE OF LAW 55.9 24 +1.62 +2.68
Judicial Independence (BS/WEF/V-Dem/GI) 35.4 33 +0.68 +1.83
Judicial Process (EIU/GI) 29.2 36 +0.47 -3.13
Access to Justice (V-Dem) 90.9 6 +0.44 +2.38
Property Rights (BS/HER/WEF/AfDB/WB) 46.8 30 +0.79 +2.55
Transfers of Power (EIU) 66.7 8 +7.41 +12.50
Multilateral Sanctions (CDD) 66.7 31 0.00 0.00
ACCOUNTABILITY 30.8 33 -0.24 -0.70
Access to Information (GI) 29.2 24 +1.86 +4.18
Online Public Services (UNDESA) 6.9 48 +0.23 -0.93
Public Sector Accountability & Transparency (V-Dem/AfDB/WB)
39.4 29 -0.12 +0.15
Accountability of Public Officials (EIU/BS) 33.3 33 0.00 0.00
Corruption in Government & Public Officials (EIU) 0.0 38 -2.22 -5.00
Corruption & Bureaucracy (WB) 57.1 8 0.00 0.00
Diversion of Public Funds (WEF) . . . .
Corruption Investigation (GI/AFR) 50.0 12 -1.39 -3.13
PERSONAL SAFETY 54.2 18 +1.86 +1.05
Safety of the Person (EIU/AFR) 75.0 3 0.00 0.00
Police Services (WEF/GI) 25.0 37 +2.78 +6.25
Social Unrest (EIU/ACLED) 50.0 34 +2.78 0.00
Crime (EIU/AFR) 75.0 2 +2.78 0.00
Political Violence (ACLED/PTS) 100.0 1 +5.56 +6.25
Human Trafficking (USDS) 0.0 39 -2.78 -6.25
NATIONAL SECURITY 94.7 7 +2.76 +1.25
Government Involvement in Armed Conflict (UCDP) 100.0 1 0.00 0.00
Domestic Armed Conflict (EIU) 75.0 9 +8.33 +6.25
Violence by Non-state Actors (ACLED) . . . .
Cross-border Tensions (EIU) 100.0 1 +5.56 0.00
Internally Displaced People (IDMC) 100.0 1 0.00 0.00
Political Refugees (UNHCR) 98.3 30 -0.14 -0.03
SAFETY & RULE OF LAW
SCORE 2016
RANK 2016
10 -YEAR AAT
5-YEAR AAT
SCORE 2016
RANK 2016
10 -YEAR AAT
5-YEAR AAT
PARTICIPATION & HUMAN RIGHTS 48.2 29 -0.26 -0.68
PARTICIPATION 62.7 17 -0.27 +0.13
Political Participation (EIU/FH/V-Dem) 70.0 18 +0.68 +0.35
Civil Society Participation (BS/V-Dem/GI) 81.1 11 +1.04 +2.65
Free & Fair Elections (BS/CDD/V-Dem) 60.3 22 -2.89 -1.80
Election Monitoring Agencies (V-Dem/GI) 39.3 25 +0.10 -0.75
Legitimacy of Political Process (BS) . . . .
RIGHTS 45.4 28 -0.12 -1.20
Freedom of Expression (BS/RSF/V-Dem/GI) 68.8 21 +0.16 +1.00
Freedom of Association & Assembly (BS/GI) 25.0 36 -5.56 -12.50
Civil Liberties (BS/FH ) 50.0 20 0.00 0.00
Human Rights Conventions (UNOLA/OHCHR) 28.6 51 +0.53 +1.20
Human Rights Violations (EIU) 75.0 1 +2.78 0.00
Protection against Discrimination (GI) 25.0 17 +1.39 +3.13
GENDER 36.4 48 -0.40 -1.00
Gender Equality (AfDB/WB) 36.7 45 -0.92 +1.98
Women's Political Participation (IPU/GI/WB) 4.8 54 -1.81 -6.43
Gender Balance in Education (UNESCO) 75.6 29 +1.93 +1.75
Women's Labour Force Participation (WB) 30.7 44 +0.38 +0.30
Workplace Gender Equality (GI) 50.0 4 -2.78 -6.25
Women in the Judiciary (GI) 0.0 44 0.00 0.00
Laws on Violence against Women (OECD) . . . .
Women's Political Empowerment (V-Dem) 56.9 37 +0.42 +1.63
PARTICIPATION & HUMAN RIGHTS
SCORE 2016
RANK 2016
10 -YEAR AAT
5-YEAR AAT
SUSTAINABLE ECONOMIC OPPORTUNITY 35.6 44 +0.38 +0.83
PUBLIC MANAGEMENT 30.2 47 +0.29 -0.70
Governmental Statistical Capacity (WB) 23.2 51 -3.06 -2.18
Civil Registration (GI) 50.0 32 0.00 0.00
Public Administration (AfDB/WB) 32.8 50 +0.40 +0.38
Diversification (AfDB/OECD/UNDP) 3.0 35 -0.31 -0.05
Budget Management (AfDB/WB) 35.5 46 +1.91 +0.40
Budget Balance (AfDB/AUC/UNECA) 75.5 1 +2.83 +0.75
Fiscal Policy (AfDB/WB) 27.0 51 +0.97 -4.55
Revenue Mobilisation (ICTD/UNU-WIDER/AfDB/WB) 24.7 50 -0.16 -1.05
Transparency of State-owned Companies (GI) 0.0 26 0.00 0.00
BUSINESS ENVIRONMENT 30.1 45 +1.21 +3.03
Investment Climate (HER) 50.0 37 +3.09 +8.33
Competition (BS/GI/AfDB/WB) 33.0 44 +1.78 +3.75
Business Bureaucracy & Red Tape (EIU) 0.0 31 0.00 0.00
Customs Procedures (WEF) . . . .
Soundness of Banks (WEF) . . . .
Employment Creation (AFR) . . . .
Regional Integration (AfDB) 37.5 35 0.00 0.00
INFRASTRUCTURE 41.0 23 +0.46 +0.30
Transport Infrastructure (WEF/AFR/EIU/GI) 25.0 40 0.00 0.00
Electricity Infrastructure (WEF/AFR) . . . .
Digital & IT Infrastructure (EIU/ITU) 17.6 43 +1.56 +1.03
Access to Improved Water (WHO/UNICEF) 80.6 10 -0.17 -0.10
Water & Sanitation Services (AFR) . . . .
RURAL SECTOR 40.9 43 -0.47 +0.68
Rural Land & Water (IFAD) 42.4 40 -0.54 +0.80
Rural Business Climate (IFAD) 45.6 36 -0.76 +0.73
Rural Development Resources (IFAD) 43.8 32 +0.22 0.00
Agricultural Support System (IFAD) 27.9 50 -1.03 +1.18
Agricultural Policy Costs (WEF) . . . .
Engagement with Rural Organisations (IFAD) 40.6 44 +0.41 +0.13
Gender Balance in Rural Decision-making (IFAD) 50.0 13 0.00 +2.05
Rural Accountability & Transparency (IFAD) 36.3 35 -1.51 0.00
SUSTAINABLE ECONOMIC OPPORTUNITY
SCORE 2016
RANK 2016
10 -YEAR AAT
5-YEAR AAT
HUMAN DEVELOPMENT 57.3 23 +0.77 +0.58
WELFARE 43.4 36 +0.04 -0.28
Welfare Services (AfDB/WB) 53.7 43 +0.12 0.00
Social Safety Nets (BS) . . . .
Social Protection & Labour (AfDB/WB) 38.1 46 0.00 0.00
Social Exclusion (BS) . . . .
Poverty (AFR) . . . .
Poverty Reduction Priorities (AFR/AfDB/WB) 31.8 49 -2.42 -1.05
Narrowing Income Gaps (AFR) . . . .
Environmental Policy (BS) . . . .
Environmental Sustainability (AfDB/WB) 50.0 44 +2.47 0.00
EDUCATION 57.9 16 +0.94 +0.43
Education Provision (AFR) . . . .
Education Quality (BS) . . . .
Educational System Management (WEF) . . . .
Human Resources in Primary Schools (UNESCO) 82.5 12 +0.44 -0.03
Primary School Completion (WB) 60.9 21 +1.44 +0.78
Secondary School Enrolment (UNESCO) 53.1 16 +1.27 +0.68
Tertiary Education Enrolment (UNESCO) 14.2 26 +0.89 +0.13
Literacy (WB) 78.8 20 +0.70 +0.58
HEALTH 70.7 30 +1.30 +1.55
Basic Health Services (AFR) . . . .
Public Health Campaigns (GI) 50.0 33 +2.78 +6.25
Child Mortality (IGME) 73.0 32 +1.00 +0.85
Maternal Mortality (MMEIG) 87.6 19 +0.33 +0.28
Access to Sanitation (WHO/UNICEF) 65.7 18 +0.22 +0.15
Undernourishment (WB) . . . .
Disease (WHO) 97.5 7 +0.22 +0.43
Immunisation (WB/WHO) 79.1 32 +1.12 -1.48
Antiretroviral Treatment (ART) Provision (UNAIDS) 42.2 38 +3.49 +4.53
HUMAN DEVELOPMENT
N/A
N/AN/A
N/A
N/A
N/A
N/A
N/A
N/AN/A
N/A
N/A
N/A
N/A
N/AN/A
N/A
N/A
N/A
N/A
*AAT: Annual Average Trend
If AAT appears the same in the two time periods, differences exist beyond the 2nd decimal place.
For a full list of data sources see Annex.
Increasing Improvement Slowing Improvement Warning Signs Bouncing Back Slowing Deterioration Increasing Deterioration No Change

119
2017 IIAG: Index Report2017 IIAG Congo Scores, Ranks & Trends
OVERALL GOVERNANCE
42.8 42nd2016 SCORE 2016 RANK
+0.37 -0.0510 -YEAR AAT* 5-YEAR AAT
SAFETY & RULE OF LAW 42.1 43 -0.07 -0.75
RULE OF LAW 37.4 42 -0.03 -0.25
Judicial Independence (BS/WEF/V-Dem/GI) 16.4 48 +0.68 +1.60
Judicial Process (EIU/GI) 25.0 41 -2.78 -6.25
Access to Justice (V-Dem) 43.9 37 +0.72 +0.15
Property Rights (BS/HER/WEF/AfDB/WB) 38.8 39 +1.14 +2.95
Transfers of Power (EIU) 0.0 38 0.00 0.00
Multilateral Sanctions (CDD) 100.0 1 0.00 0.00
ACCOUNTABILITY 16.5 45 +0.30 +0.78
Access to Information (GI) 0.0 44 0.00 0.00
Online Public Services (UNDESA) 5.9 49 -0.72 -1.18
Public Sector Accountability & Transparency (V-Dem/AfDB/WB)
39.0 33 +1.17 +2.73
Accountability of Public Officials (EIU/BS) 14.3 46 0.00 0.00
Corruption in Government & Public Officials (EIU) 0.0 38 0.00 0.00
Corruption & Bureaucracy (WB) 19.0 33 -1.07 -2.40
Diversion of Public Funds (WEF) . . . .
Corruption Investigation (GI/AFR) 37.5 25 +2.78 +6.25
PERSONAL SAFETY 39.3 38 +0.09 -0.83
Safety of the Person (EIU/AFR) 25.0 39 +2.78 0.00
Police Services (WEF/GI) 25.0 37 0.00 0.00
Social Unrest (EIU/ACLED) 73.6 10 -0.16 -0.18
Crime (EIU/AFR) 25.0 45 0.00 0.00
Political Violence (ACLED/PTS) 62.5 42 -2.03 -4.70
Human Trafficking (USDS) 25.0 21 0.00 0.00
NATIONAL SECURITY 75.4 36 -0.62 -2.68
Government Involvement in Armed Conflict (UCDP) 66.7 45 -3.70 -8.33
Domestic Armed Conflict (EIU) 50.0 25 +2.78 0.00
Violence by Non-state Actors (ACLED) 98.3 22 -0.19 -0.33
Cross-border Tensions (EIU) 50.0 31 -2.78 -6.25
Internally Displaced People (IDMC) 93.7 39 -0.49 -1.15
Political Refugees (UNHCR) 93.6 43 +0.67 +0.03
SAFETY & RULE OF LAW
SCORE 2016
RANK 2016
10 -YEAR AAT
5-YEAR AAT
SCORE 2016
RANK 2016
10 -YEAR AAT
5-YEAR AAT
PARTICIPATION & HUMAN RIGHTS 38.7 39 +0.52 +0.48
PARTICIPATION 29.1 42 -0.18 -0.70
Political Participation (EIU/FH/V-Dem) 41.9 40 -0.13 -0.33
Civil Society Participation (BS/V-Dem/GI) 41.0 38 -1.86 -4.18
Free & Fair Elections (BS/CDD/V-Dem) 21.6 49 +0.39 -0.65
Election Monitoring Agencies (V-Dem/GI) 30.0 39 +0.74 +1.68
Legitimacy of Political Process (BS) 11.1 25 0.00 0.00
RIGHTS 29.9 40 -0.27 -1.10
Freedom of Expression (BS/RSF/V-Dem/GI) 39.9 40 -1.52 -2.88
Freedom of Association & Assembly (BS/GI) 23.6 39 -1.31 -2.95
Civil Liberties (BS/FH ) 29.2 38 0.00 0.00
Human Rights Conventions (UNOLA/OHCHR) 61.9 31 +2.64 +2.38
Human Rights Violations (EIU) 25.0 25 0.00 0.00
Protection against Discrimination (GI) 0.0 36 -1.39 -3.13
GENDER 57.2 28 +2.03 +3.28
Gender Equality (AfDB/WB) 45.0 38 0.00 0.00
Women's Political Participation (IPU/GI/WB) 35.3 36 +1.88 +4.23
Gender Balance in Education (UNESCO) 92.9 3 +2.03 0.00
Women's Labour Force Participation (WB) 71.6 24 -0.08 -0.10
Workplace Gender Equality (GI) 50.0 4 +5.56 +12.50
Women in the Judiciary (GI) 75.0 19 +2.78 +6.25
Laws on Violence against Women (OECD) 41.7 22 +1.86 0.00
Women's Political Empowerment (V-Dem) 46.1 46 +2.23 +3.33
PARTICIPATION & HUMAN RIGHTS
SCORE 2016
RANK 2016
10 -YEAR AAT
5-YEAR AAT
SUSTAINABLE ECONOMIC OPPORTUNITY 39.2 37 +0.52 +0.30
PUBLIC MANAGEMENT 34.6 44 -0.46 -1.83
Governmental Statistical Capacity (WB) 43.5 43 -0.32 0.00
Civil Registration (GI) 25.0 47 -2.78 -6.25
Public Administration (AfDB/WB) 54.7 28 -0.18 -0.40
Diversification (AfDB/OECD/UNDP) 1.7 44 +0.11 +0.28
Budget Management (AfDB/WB) 52.0 38 +1.54 0.00
Budget Balance (AfDB/AUC/UNECA) 40.1 34 -6.06 -9.30
Fiscal Policy (AfDB/WB) 56.3 30 +2.81 -1.80
Revenue Mobilisation (ICTD/UNU-WIDER/AfDB/WB) 37.9 41 +0.71 +1.05
Transparency of State-owned Companies (GI) 0.0 26 0.00 0.00
BUSINESS ENVIRONMENT 35.0 41 -0.14 +0.50
Investment Climate (HER) 55.6 31 +2.48 +8.35
Competition (BS/GI/AfDB/WB) 28.4 46 -3.01 -6.25
Business Bureaucracy & Red Tape (EIU) 0.0 31 0.00 0.00
Customs Procedures (WEF) . . . .
Soundness of Banks (WEF) . . . .
Employment Creation (AFR) . . . .
Regional Integration (AfDB) 56.3 22 0.00 0.00
INFRASTRUCTURE 42.3 21 +1.73 +1.55
Transport Infrastructure (WEF/AFR/EIU/GI) 37.5 24 +2.78 +3.13
Electricity Infrastructure (WEF/AFR) . . . .
Digital & IT Infrastructure (EIU/ITU) 27.2 33 +1.49 +0.75
Access to Improved Water (WHO/UNICEF) 62.1 25 +0.91 +0.73
Water & Sanitation Services (AFR) . . . .
RURAL SECTOR 45.1 38 +0.97 +1.05
Rural Land & Water (IFAD) 53.4 28 +1.78 +2.68
Rural Business Climate (IFAD) 56.1 25 +0.10 +3.58
Rural Development Resources (IFAD) 37.5 39 -0.33 0.00
Agricultural Support System (IFAD) 41.9 38 +2.94 +1.18
Agricultural Policy Costs (WEF) . . . .
Engagement with Rural Organisations (IFAD) 51.5 37 +2.14 0.00
Gender Balance in Rural Decision-making (IFAD) 41.8 30 +1.31 +2.13
Rural Accountability & Transparency (IFAD) 33.4 42 -1.21 -2.25
SUSTAINABLE ECONOMIC OPPORTUNITY
SCORE 2016
RANK 2016
10 -YEAR AAT
5-YEAR AAT
HUMAN DEVELOPMENT 51.1 37 +0.48 -0.23
WELFARE 43.1 38 +0.29 -0.58
Welfare Services (AfDB/WB) 63.7 33 +0.57 +0.50
Social Safety Nets (BS) 23.1 35 -0.86 0.00
Social Protection & Labour (AfDB/WB) 47.0 38 +0.37 0.00
Social Exclusion (BS) 28.6 7 0.00 0.00
Poverty (AFR) . . . .
Poverty Reduction Priorities (AFR/AfDB/WB) 57.7 15 +1.26 +1.03
Narrowing Income Gaps (AFR) . . . .
Environmental Policy (BS) 28.6 26 0.00 -3.58
Environmental Sustainability (AfDB/WB) 52.8 42 +0.62 -2.08
EDUCATION 47.0 26 +0.47 -0.05
Education Provision (AFR) . . . .
Education Quality (BS) 16.7 35 0.00 0.00
Educational System Management (WEF) . . . .
Human Resources in Primary Schools (UNESCO) 63.6 40 +1.78 0.00
Primary School Completion (WB) 58.7 22 -0.31 0.00
Secondary School Enrolment (UNESCO) 47.4 22 +0.58 0.00
Tertiary Education Enrolment (UNESCO) 15.5 22 +0.73 -0.30
Literacy (WB) 80.2 19 0.00 0.00
HEALTH 63.3 43 +0.69 -0.03
Basic Health Services (AFR) . . . .
Public Health Campaigns (GI) 50.0 33 0.00 0.00
Child Mortality (IGME) 85.8 12 +1.74 +0.85
Maternal Mortality (MMEIG) 83.6 29 +0.48 +0.40
Access to Sanitation (WHO/UNICEF) 51.5 31 +0.09 +0.08
Undernourishment (WB) 54.1 34 +0.56 -1.00
Disease (WHO) 80.5 37 -0.24 +0.45
Immunisation (WB/WHO) 78.7 35 +1.91 +0.70
Antiretroviral Treatment (ART) Provision (UNAIDS) 22.3 46 +1.01 -1.68
HUMAN DEVELOPMENT
N/A
N/AN/A
N/A
N/A
N/A
N/A
N/A
N/A
N/A
N/A
N/A
*AAT: Annual Average Trend
If AAT appears the same in the two time periods, differences exist beyond the 2nd decimal place.
For a full list of data sources see Annex.
Increasing Improvement Slowing Improvement Warning Signs Bouncing Back Slowing Deterioration Increasing Deterioration No Change

120
2017 IIAG Côte d’Ivoire Scores, Ranks & Trends
OVERALL GOVERNANCE
54.2 20th2016 SCORE 2016 RANK
+1.40 +2.0510 -YEAR AAT* 5-YEAR AAT
SAFETY & RULE OF LAW 58.9 23 +1.82 +2.65
RULE OF LAW 58.4 22 +2.56 +4.90
Judicial Independence (BS/WEF/V-Dem/GI) 33.5 34 +0.33 +0.15
Judicial Process (EIU/GI) 54.2 19 +3.24 +3.13
Access to Justice (V-Dem) 70.8 24 +1.62 +3.78
Property Rights (BS/HER/WEF/AfDB/WB) 58.5 15 +2.69 +5.68
Transfers of Power (EIU) 33.3 20 0.00 0.00
Multilateral Sanctions (CDD) 100.0 1 +7.41 +16.68
ACCOUNTABILITY 43.3 18 +2.69 +3.08
Access to Information (GI) 41.7 13 +4.63 +10.43
Online Public Services (UNDESA) 25.5 30 +1.92 -4.90
Public Sector Accountability & Transparency (V-Dem/AfDB/WB)
57.4 18 +3.46 +2.38
Accountability of Public Officials (EIU/BS) 31.0 39 +0.80 0.00
Corruption in Government & Public Officials (EIU) 40.0 17 +2.22 0.00
Corruption & Bureaucracy (WB) 57.1 8 +3.17 +7.13
Diversion of Public Funds (WEF) 41.4 18 +3.49 +5.45
Corruption Investigation (GI/AFR) 52.8 10 +1.90 +4.28
PERSONAL SAFETY 51.2 25 +0.43 +2.00
Safety of the Person (EIU/AFR) 45.1 31 +0.73 +4.78
Police Services (WEF/GI) 48.2 15 +1.63 +3.53
Social Unrest (EIU/ACLED) 60.3 25 +1.17 -1.10
Crime (EIU/AFR) 53.7 24 +0.42 +3.03
Political Violence (ACLED/PTS) 75.0 22 +1.46 +7.95
Human Trafficking (USDS) 25.0 21 -2.78 -6.25
NATIONAL SECURITY 82.7 26 +1.59 +0.65
Government Involvement in Armed Conflict (UCDP) 88.9 19 -1.23 -2.78
Domestic Armed Conflict (EIU) 50.0 25 +5.56 +6.25
Violence by Non-state Actors (ACLED) 99.6 11 -0.04 +0.88
Cross-border Tensions (EIU) 75.0 9 +2.78 0.00
Internally Displaced People (IDMC) 87.5 44 +2.67 -2.20
Political Refugees (UNHCR) 95.1 42 -0.22 +1.70
SAFETY & RULE OF LAW
SCORE 2016
RANK 2016
10 -YEAR AAT
5-YEAR AAT
SCORE 2016
RANK 2016
10 -YEAR AAT
5-YEAR AAT
PARTICIPATION & HUMAN RIGHTS 54.1 23 +1.50 +1.73
PARTICIPATION 62.2 19 +3.11 +3.18
Political Participation (EIU/FH/V-Dem) 59.2 28 +1.30 +0.28
Civil Society Participation (BS/V-Dem/GI) 75.8 16 +1.86 +2.75
Free & Fair Elections (BS/CDD/V-Dem) 65.2 16 +5.33 +4.75
Election Monitoring Agencies (V-Dem/GI) 44.0 20 +0.87 -0.30
Legitimacy of Political Process (BS) 66.7 12 +6.18 +8.35
RIGHTS 49.1 22 +1.77 +2.18
Freedom of Expression (BS/RSF/V-Dem/GI) 65.7 27 +0.08 +0.25
Freedom of Association & Assembly (BS/GI) 57.6 20 +1.77 +0.50
Civil Liberties (BS/FH ) 43.8 28 +1.62 +3.65
Human Rights Conventions (UNOLA/OHCHR) 52.4 38 +1.59 +2.38
Human Rights Violations (EIU) 25.0 25 +2.78 0.00
Protection against Discrimination (GI) 50.0 3 +2.78 +6.25
GENDER 51.0 33 -0.38 -0.18
Gender Equality (AfDB/WB) 47.1 36 +1.34 +3.03
Women's Political Participation (IPU/GI/WB) 37.6 26 +1.28 +2.60
Gender Balance in Education (UNESCO) 54.2 43 +0.26 +0.58
Women's Labour Force Participation (WB) 52.7 33 +0.20 +0.15
Workplace Gender Equality (GI) 25.0 37 -2.78 -6.25
Women in the Judiciary (GI) 75.0 19 -2.78 -6.25
Laws on Violence against Women (OECD) 41.7 22 -1.81 +2.10
Women's Political Empowerment (V-Dem) 74.5 28 +1.26 +2.63
PARTICIPATION & HUMAN RIGHTS
SCORE 2016
RANK 2016
10 -YEAR AAT
5-YEAR AAT
SUSTAINABLE ECONOMIC OPPORTUNITY 50.0 17 +0.99 +1.98
PUBLIC MANAGEMENT 49.1 19 +0.72 +0.98
Governmental Statistical Capacity (WB) 66.7 21 -0.48 +1.45
Civil Registration (GI) 50.0 32 0.00 0.00
Public Administration (AfDB/WB) 66.1 15 +2.71 +3.25
Diversification (AfDB/OECD/UNDP) 6.8 25 -0.40 -1.00
Budget Management (AfDB/WB) 67.7 19 +3.47 +3.18
Budget Balance (AfDB/AUC/UNECA) 42.2 29 -2.03 -0.65
Fiscal Policy (AfDB/WB) 69.0 20 +3.43 +1.38
Revenue Mobilisation (ICTD/UNU-WIDER/AfDB/WB) 48.6 26 -0.14 +1.18
Transparency of State-owned Companies (GI) 25.0 7 0.00 0.00
BUSINESS ENVIRONMENT 57.3 11 +1.39 +2.48
Investment Climate (HER) 83.3 5 +4.32 +9.73
Competition (BS/GI/AfDB/WB) 49.8 26 +0.71 +1.43
Business Bureaucracy & Red Tape (EIU) 33.3 10 0.00 0.00
Customs Procedures (WEF) 59.1 10 +3.69 +0.73
Soundness of Banks (WEF) 58.9 6 -1.54 -0.28
Employment Creation (AFR) 48.1 10 +1.18 +2.65
Regional Integration (AfDB) 68.8 10 +1.39 +3.13
INFRASTRUCTURE 54.2 11 +1.00 +2.58
Transport Infrastructure (WEF/AFR/EIU/GI) 64.0 5 +1.57 +4.58
Electricity Infrastructure (WEF/AFR) 52.6 10 -0.92 +0.90
Digital & IT Infrastructure (EIU/ITU) 46.6 13 +2.61 +3.65
Access to Improved Water (WHO/UNICEF) 67.8 20 +0.11 +0.10
Water & Sanitation Services (AFR) 39.8 16 +1.62 +3.65
RURAL SECTOR 39.2 45 +0.81 +1.80
Rural Land & Water (IFAD) 36.4 45 +0.86 +3.05
Rural Business Climate (IFAD) 38.3 43 +0.71 0.00
Rural Development Resources (IFAD) 25.0 46 +0.18 0.00
Agricultural Support System (IFAD) 37.2 41 0.00 0.00
Agricultural Policy Costs (WEF) 78.0 4 +2.69 +5.33
Engagement with Rural Organisations (IFAD) 37.6 48 -0.84 0.00
Gender Balance in Rural Decision-making (IFAD) 25.0 45 +1.40 +3.13
Rural Accountability & Transparency (IFAD) 36.3 35 +1.51 +3.03
SUSTAINABLE ECONOMIC OPPORTUNITY
SCORE 2016
RANK 2016
10 -YEAR AAT
5-YEAR AAT
HUMAN DEVELOPMENT 53.9 34 +1.31 +1.85
WELFARE 43.4 36 +1.64 +2.75
Welfare Services (AfDB/WB) 70.9 23 +4.17 +3.80
Social Safety Nets (BS) 38.5 22 +1.71 +5.78
Social Protection & Labour (AfDB/WB) 49.7 33 +1.29 +2.63
Social Exclusion (BS) 14.3 20 0.00 0.00
Poverty (AFR) 48.8 20 +1.94 +4.38
Poverty Reduction Priorities (AFR/AfDB/WB) 42.6 42 +2.33 +2.70
Narrowing Income Gaps (AFR) 36.4 15 +1.82 +4.10
Environmental Policy (BS) 28.6 26 0.00 0.00
Environmental Sustainability (AfDB/WB) 61.1 34 +1.54 +1.38
EDUCATION 45.2 29 +1.17 +1.75
Education Provision (AFR) 60.2 9 +1.32 +2.98
Education Quality (BS) 33.3 21 +1.84 0.00
Educational System Management (WEF) 66.9 6 +4.10 +6.38
Human Resources in Primary Schools (UNESCO) 66.3 32 -0.13 -0.10
Primary School Completion (WB) 47.4 34 +1.94 +1.80
Secondary School Enrolment (UNESCO) 37.0 28 +0.40 +0.90
Tertiary Education Enrolment (UNESCO) 14.6 25 -0.04 +1.25
Literacy (WB) 35.7 44 -0.13 +0.70
HEALTH 73.2 23 +1.16 +1.10
Basic Health Services (AFR) 56.0 10 +0.66 +1.48
Public Health Campaigns (GI) 100.0 1 0.00 0.00
Child Mortality (IGME) 64.4 40 +1.42 +1.13
Maternal Mortality (MMEIG) 75.9 42 +0.42 +0.68
Access to Sanitation (WHO/UNICEF) 50.4 35 +0.66 +0.55
Undernourishment (WB) 85.1 21 +0.12 +0.38
Disease (WHO) 86.5 25 +0.10 -0.28
Immunisation (WB/WHO) 77.6 37 +0.79 -0.03
Antiretroviral Treatment (ART) Provision (UNAIDS) 63.1 24 +6.21 +6.15
HUMAN DEVELOPMENT
*AAT: Annual Average Trend
If AAT appears the same in the two time periods, differences exist beyond the 2nd decimal place.
For a full list of data sources see Annex.
Increasing Improvement Slowing Improvement Warning Signs Bouncing Back Slowing Deterioration Increasing Deterioration No Change

121
2017 IIAG: Index Report2017 IIAG Democratic Republic of Congo Scores, Ranks & Trends
OVERALL GOVERNANCE
35.0 48th2016 SCORE 2016 RANK
+0.06 +0.2310 -YEAR AAT* 5-YEAR AAT
SAFETY & RULE OF LAW 28.2 48 -0.36 +0.43
RULE OF LAW 32.1 46 +0.36 -0.63
Judicial Independence (BS/WEF/V-Dem/GI) 20.0 47 -0.44 -1.15
Judicial Process (EIU/GI) 41.7 26 0.00 0.00
Access to Justice (V-Dem) 16.9 51 -0.29 -0.80
Property Rights (BS/HER/WEF/AfDB/WB) 39.0 38 +1.93 +4.48
Transfers of Power (EIU) 8.3 37 -2.78 -6.25
Multilateral Sanctions (CDD) 66.7 31 +3.71 0.00
ACCOUNTABILITY 18.6 42 +0.51 +0.23
Access to Information (GI) 25.0 31 +1.39 +3.13
Online Public Services (UNDESA) 11.8 42 +0.44 -3.03
Public Sector Accountability & Transparency (V-Dem/AfDB/WB)
25.8 44 +0.03 -0.50
Accountability of Public Officials (EIU/BS) 31.0 39 +0.80 0.00
Corruption in Government & Public Officials (EIU) 0.0 38 0.00 0.00
Corruption & Bureaucracy (WB) 19.0 33 -1.07 -2.40
Diversion of Public Funds (WEF) 24.1 29 . .
Corruption Investigation (GI/AFR) 12.5 40 +1.39 +3.13
PERSONAL SAFETY 17.3 50 -1.37 +0.73
Safety of the Person (EIU/AFR) 0.0 47 -2.78 -6.25
Police Services (WEF/GI) 31.5 33 +3.50 +7.88
Social Unrest (EIU/ACLED) 0.0 53 -6.47 -9.18
Crime (EIU/AFR) 25.0 45 +2.78 0.00
Political Violence (ACLED/PTS) 22.2 48 -2.48 +5.55
Human Trafficking (USDS) 25.0 21 -2.78 +6.25
NATIONAL SECURITY 44.7 49 -0.94 +1.40
Government Involvement in Armed Conflict (UCDP) 77.8 33 +2.47 +2.78
Domestic Armed Conflict (EIU) 0.0 49 0.00 0.00
Violence by Non-state Actors (ACLED) 10.3 44 -7.50 +2.58
Cross-border Tensions (EIU) 25.0 42 0.00 0.00
Internally Displaced People (IDMC) 72.2 45 -0.47 +2.68
Political Refugees (UNHCR) 83.0 45 -0.13 +0.35
SAFETY & RULE OF LAW
SCORE 2016
RANK 2016
10 -YEAR AAT
5-YEAR AAT
SCORE 2016
RANK 2016
10 -YEAR AAT
5-YEAR AAT
PARTICIPATION & HUMAN RIGHTS 32.7 45 -0.43 -0.73
PARTICIPATION 25.3 45 -1.43 -1.95
Political Participation (EIU/FH/V-Dem) 34.7 46 -0.73 -1.18
Civil Society Participation (BS/V-Dem/GI) 30.0 44 -0.30 -0.63
Free & Fair Elections (BS/CDD/V-Dem) 20.8 50 -2.40 -1.40
Election Monitoring Agencies (V-Dem/GI) 29.9 40 -2.47 -5.10
Legitimacy of Political Process (BS) 11.1 25 -1.23 -1.40
RIGHTS 32.1 38 -0.14 -0.05
Freedom of Expression (BS/RSF/V-Dem/GI) 44.1 39 -1.11 -1.53
Freedom of Association & Assembly (BS/GI) 23.6 39 -3.24 -3.83
Civil Liberties (BS/FH ) 20.8 42 +0.69 0.00
Human Rights Conventions (UNOLA/OHCHR) 66.7 22 0.00 -1.18
Human Rights Violations (EIU) 0.0 39 0.00 0.00
Protection against Discrimination (GI) 37.5 12 +2.78 +6.25
GENDER 40.5 45 +0.27 -0.25
Gender Equality (AfDB/WB) 30.8 48 -0.89 +0.50
Women's Political Participation (IPU/GI/WB) 24.9 46 +0.01 +0.03
Gender Balance in Education (UNESCO) 58.9 41 +1.77 +0.88
Women's Labour Force Participation (WB) 76.0 20 -0.06 -0.08
Workplace Gender Equality (GI) 50.0 4 0.00 0.00
Women in the Judiciary (GI) 0.0 44 -2.78 -6.25
Laws on Violence against Women (OECD) 50.0 19 +2.78 +1.05
Women's Political Empowerment (V-Dem) 33.5 49 +1.26 +1.90
PARTICIPATION & HUMAN RIGHTS
SCORE 2016
RANK 2016
10 -YEAR AAT
5-YEAR AAT
SUSTAINABLE ECONOMIC OPPORTUNITY 31.4 45 +0.18 +0.33
PUBLIC MANAGEMENT 41.9 36 +0.38 +0.10
Governmental Statistical Capacity (WB) 44.9 42 +1.93 +2.53
Civil Registration (GI) 75.0 10 -1.39 -3.13
Public Administration (AfDB/WB) 45.3 40 +0.87 +3.25
Diversification (AfDB/OECD/UNDP) 2.7 38 -0.71 -0.30
Budget Management (AfDB/WB) 55.0 35 +1.26 +2.15
Budget Balance (AfDB/AUC/UNECA) 58.5 4 +0.13 -3.15
Fiscal Policy (AfDB/WB) 61.9 27 +0.44 -1.78
Revenue Mobilisation (ICTD/UNU-WIDER/AfDB/WB) 33.4 44 +0.86 +1.25
Transparency of State-owned Companies (GI) 0.0 26 0.00 0.00
BUSINESS ENVIRONMENT 32.1 43 +0.22 +1.28
Investment Climate (HER) 33.3 45 0.00 +2.78
Competition (BS/GI/AfDB/WB) 48.7 28 +1.31 +3.20
Business Bureaucracy & Red Tape (EIU) 0.0 31 0.00 0.00
Customs Procedures (WEF) 40.9 27 . .
Soundness of Banks (WEF) 26.2 34 . .
Employment Creation (AFR) . . . .
Regional Integration (AfDB) 43.8 29 -0.69 -1.55
INFRASTRUCTURE 15.4 52 -0.22 0.00
Transport Infrastructure (WEF/AFR/EIU/GI) 15.6 48 -1.04 +0.78
Electricity Infrastructure (WEF/AFR) 8.0 41 . .
Digital & IT Infrastructure (EIU/ITU) 7.6 51 +0.64 +0.60
Access to Improved Water (WHO/UNICEF) 30.2 49 +0.53 +0.45
Water & Sanitation Services (AFR) . . . .
RURAL SECTOR 36.2 47 +0.31 -0.13
Rural Land & Water (IFAD) 33.0 48 -1.11 -1.68
Rural Business Climate (IFAD) 35.3 46 -0.79 +1.43
Rural Development Resources (IFAD) 25.0 46 -0.44 -4.70
Agricultural Support System (IFAD) 51.1 31 +3.88 +3.48
Agricultural Policy Costs (WEF) 36.0 37 . .
Engagement with Rural Organisations (IFAD) 46.0 42 +0.63 -2.85
Gender Balance in Rural Decision-making (IFAD) 33.3 42 +0.22 +2.08
Rural Accountability & Transparency (IFAD) 30.3 44 -0.13 +1.53
SUSTAINABLE ECONOMIC OPPORTUNITY
SCORE 2016
RANK 2016
10 -YEAR AAT
5-YEAR AAT
HUMAN DEVELOPMENT 47.6 42 +0.83 +0.83
WELFARE 34.8 48 +0.59 +0.88
Welfare Services (AfDB/WB) 61.7 36 +1.01 0.00
Social Safety Nets (BS) 0.0 43 0.00 0.00
Social Protection & Labour (AfDB/WB) 41.4 42 -0.42 +0.28
Social Exclusion (BS) 0.0 33 0.00 0.00
Poverty (AFR) . . . .
Poverty Reduction Priorities (AFR/AfDB/WB) 64.9 9 +1.96 +2.30
Narrowing Income Gaps (AFR) . . . .
Environmental Policy (BS) 14.3 38 0.00 0.00
Environmental Sustainability (AfDB/WB) 61.1 34 +1.54 +3.48
EDUCATION 42.7 35 +0.72 -0.38
Education Provision (AFR) . . . .
Education Quality (BS) 16.7 35 0.00 0.00
Educational System Management (WEF) 32.1 26 . .
Human Resources in Primary Schools (UNESCO) 74.0 23 +0.38 -0.15
Primary School Completion (WB) 51.1 31 +1.56 -0.25
Secondary School Enrolment (UNESCO) 36.7 29 +0.92 +0.55
Tertiary Education Enrolment (UNESCO) 10.5 32 +0.41 -0.53
Literacy (WB) 77.6 22 +2.19 +0.68
HEALTH 65.5 41 +1.21 +2.05
Basic Health Services (AFR) . . . .
Public Health Campaigns (GI) 75.0 14 0.00 0.00
Child Mortality (IGME) 61.8 46 +1.52 +1.15
Maternal Mortality (MMEIG) 74.1 44 +0.47 +0.75
Access to Sanitation (WHO/UNICEF) 51.7 30 -0.13 -0.10
Undernourishment (WB) . . . .
Disease (WHO) 54.5 53 -1.10 -0.73
Immunisation (WB/WHO) 79.0 34 +1.38 +1.80
Antiretroviral Treatment (ART) Provision (UNAIDS) 62.1 25 +6.34 +11.40
HUMAN DEVELOPMENT
N/A
N/A
N/A
N/A
N/A
N/A
N/A
N/A
N/A
N/A
N/A
N/A
N/A
*AAT: Annual Average Trend
If AAT appears the same in the two time periods, differences exist beyond the 2nd decimal place.
For a full list of data sources see Annex.
Increasing Improvement Slowing Improvement Warning Signs Bouncing Back Slowing Deterioration Increasing Deterioration No Change

122
2017 IIAG Djibouti Scores, Ranks & Trends
OVERALL GOVERNANCE
46.4 38th2016 SCORE 2016 RANK
+0.17 -0.1510 -YEAR AAT* 5-YEAR AAT
SAFETY & RULE OF LAW 49.6 34 -0.54 -0.60
RULE OF LAW 40.6 40 -0.64 -1.45
Judicial Independence (BS/WEF/V-Dem/GI) 25.1 42 +0.11 +0.25
Judicial Process (EIU/GI) 12.5 45 0.00 0.00
Access to Justice (V-Dem) 75.2 20 +1.09 +2.45
Property Rights (BS/HER/WEF/AfDB/WB) 31.0 49 -1.32 -2.98
Transfers of Power (EIU) 0.0 38 -3.70 -8.33
Multilateral Sanctions (CDD) 100.0 1 0.00 0.00
ACCOUNTABILITY 27.4 35 +0.61 -0.53
Access to Information (GI) 25.0 31 +1.39 +3.13
Online Public Services (UNDESA) 2.9 51 -1.69 -5.90
Public Sector Accountability & Transparency (V-Dem/AfDB/WB)
40.9 27 -0.51 -0.38
Accountability of Public Officials (EIU/BS) 33.3 33 +3.70 0.00
Corruption in Government & Public Officials (EIU) 20.0 31 0.00 0.00
Corruption & Bureaucracy (WB) 57.1 8 0.00 -3.58
Diversion of Public Funds (WEF) . . . .
Corruption Investigation (GI/AFR) 12.5 40 +1.39 +3.13
PERSONAL SAFETY 53.3 20 -0.78 +0.88
Safety of the Person (EIU/AFR) 50.0 24 -5.56 0.00
Police Services (WEF/GI) 50.0 11 +5.56 +12.50
Social Unrest (EIU/ACLED) 71.9 11 -1.72 -0.50
Crime (EIU/AFR) 75.0 2 0.00 0.00
Political Violence (ACLED/PTS) 73.2 29 -0.10 -0.45
Human Trafficking (USDS) 0.0 39 -2.78 -6.25
NATIONAL SECURITY 76.9 34 -1.40 -1.35
Government Involvement in Armed Conflict (UCDP) 88.9 19 -1.23 0.00
Domestic Armed Conflict (EIU) 25.0 41 -5.56 -6.25
Violence by Non-state Actors (ACLED) 99.6 11 0.00 0.00
Cross-border Tensions (EIU) 75.0 9 0.00 0.00
Internally Displaced People (IDMC) . . . .
Political Refugees (UNHCR) 96.3 40 -0.19 -0.48
SAFETY & RULE OF LAW
SCORE 2016
RANK 2016
10 -YEAR AAT
5-YEAR AAT
SCORE 2016
RANK 2016
10 -YEAR AAT
5-YEAR AAT
PARTICIPATION & HUMAN RIGHTS 34.8 44 +0.18 -0.23
PARTICIPATION 36.0 34 +0.67 +2.00
Political Participation (EIU/FH/V-Dem) 40.7 41 +0.74 +1.63
Civil Society Participation (BS/V-Dem/GI) 47.8 34 +0.73 +1.58
Free & Fair Elections (BS/CDD/V-Dem) 31.0 40 +0.33 +2.90
Election Monitoring Agencies (V-Dem/GI) 24.3 44 +0.81 +1.83
Legitimacy of Political Process (BS) . . . .
RIGHTS 24.3 45 +0.34 -0.78
Freedom of Expression (BS/RSF/V-Dem/GI) 23.9 47 -0.46 -0.75
Freedom of Association & Assembly (BS/GI) 12.5 48 0.00 0.00
Civil Liberties (BS/FH ) 33.3 34 0.00 0.00
Human Rights Conventions (UNOLA/OHCHR) 76.2 11 +5.29 +2.38
Human Rights Violations (EIU) 0.0 39 -2.78 -6.25
Protection against Discrimination (GI) 0.0 36 0.00 0.00
GENDER 44.0 40 -0.49 -1.93
Gender Equality (AfDB/WB) 47.1 36 +0.64 -1.05
Women's Political Participation (IPU/GI/WB) 23.6 48 -0.38 -1.45
Gender Balance in Education (UNESCO) 59.0 40 +1.02 +0.45
Women's Labour Force Participation (WB) 32.0 43 +0.37 +0.15
Workplace Gender Equality (GI) 50.0 4 0.00 0.00
Women in the Judiciary (GI) 50.0 31 -5.56 -12.50
Laws on Violence against Women (OECD) . . . .
Women's Political Empowerment (V-Dem) 46.3 45 +0.46 +0.85
PARTICIPATION & HUMAN RIGHTS
SCORE 2016
RANK 2016
10 -YEAR AAT
5-YEAR AAT
SUSTAINABLE ECONOMIC OPPORTUNITY 44.4 30 +0.21 -0.10
PUBLIC MANAGEMENT 40.1 37 +0.08 -0.48
Governmental Statistical Capacity (WB) 47.8 40 +1.44 +2.18
Civil Registration (GI) 62.5 25 0.00 0.00
Public Administration (AfDB/WB) 48.4 37 -0.18 -0.40
Diversification (AfDB/OECD/UNDP) 9.3 15 +0.28 -1.20
Budget Management (AfDB/WB) 50.6 39 -0.02 +2.48
Budget Balance (AfDB/AUC/UNECA) 28.8 50 -2.60 -5.73
Fiscal Policy (AfDB/WB) 61.9 27 +2.02 -1.40
Revenue Mobilisation (ICTD/UNU-WIDER/AfDB/WB) 51.4 20 -0.29 -0.18
Transparency of State-owned Companies (GI) 0.0 26 0.00 0.00
BUSINESS ENVIRONMENT 46.8 25 +0.64 +0.20
Investment Climate (HER) 88.9 1 +3.70 +4.18
Competition (BS/GI/AfDB/WB) 35.7 41 -1.83 -4.93
Business Bureaucracy & Red Tape (EIU) 0.0 31 0.00 0.00
Customs Procedures (WEF) . . . .
Soundness of Banks (WEF) . . . .
Employment Creation (AFR) . . . .
Regional Integration (AfDB) 62.5 16 +0.69 +1.55
INFRASTRUCTURE 43.6 20 +0.48 +0.45
Transport Infrastructure (WEF/AFR/EIU/GI) 25.0 40 0.00 0.00
Electricity Infrastructure (WEF/AFR) . . . .
Digital & IT Infrastructure (EIU/ITU) 33.5 26 +1.30 +1.30
Access to Improved Water (WHO/UNICEF) 72.4 17 +0.14 +0.10
Water & Sanitation Services (AFR) . . . .
RURAL SECTOR 47.1 36 -0.37 -0.60
Rural Land & Water (IFAD) 55.0 25 +1.27 0.00
Rural Business Climate (IFAD) 64.9 9 -0.14 -0.58
Rural Development Resources (IFAD) 37.5 39 -2.31 -0.83
Agricultural Support System (IFAD) 37.2 41 0.00 0.00
Agricultural Policy Costs (WEF) . . . .
Engagement with Rural Organisations (IFAD) 49.0 40 +0.52 -0.73
Gender Balance in Rural Decision-making (IFAD) 50.0 13 -0.70 -2.08
Rural Accountability & Transparency (IFAD) 36.3 35 -1.19 0.00
SUSTAINABLE ECONOMIC OPPORTUNITY
SCORE 2016
RANK 2016
10 -YEAR AAT
5-YEAR AAT
HUMAN DEVELOPMENT 56.7 24 +0.83 +0.35
WELFARE 53.0 20 -0.07 -1.33
Welfare Services (AfDB/WB) 65.7 30 0.00 0.00
Social Safety Nets (BS) . . . .
Social Protection & Labour (AfDB/WB) 47.5 37 +0.87 -1.50
Social Exclusion (BS) . . . .
Poverty (AFR) . . . .
Poverty Reduction Priorities (AFR/AfDB/WB) 51.5 22 -0.23 -1.05
Narrowing Income Gaps (AFR) . . . .
Environmental Policy (BS) . . . .
Environmental Sustainability (AfDB/WB) 47.2 45 -0.93 -2.78
EDUCATION 44.1 31 +1.50 +1.48
Education Provision (AFR) . . . .
Education Quality (BS) . . . .
Educational System Management (WEF) . . . .
Human Resources in Primary Schools (UNESCO) 78.8 18 +0.56 +1.10
Primary School Completion (WB) 48.7 33 +2.61 +3.53
Secondary School Enrolment (UNESCO) 41.3 26 +2.44 +1.28
Tertiary Education Enrolment (UNESCO) 7.7 37 +0.40 0.00
Literacy (WB) . . . .
HEALTH 73.1 24 +1.09 +0.93
Basic Health Services (AFR) . . . .
Public Health Campaigns (GI) 75.0 14 0.00 0.00
Child Mortality (IGME) 76.7 27 +0.91 +0.73
Maternal Mortality (MMEIG) 91.6 12 +0.38 +0.25
Access to Sanitation (WHO/UNICEF) 61.9 21 -0.31 -0.18
Undernourishment (WB) 80.4 23 +2.68 +2.08
Disease (WHO) 86.2 26 +0.14 +0.53
Immunisation (WB/WHO) 79.1 32 +2.30 -0.38
Antiretroviral Treatment (ART) Provision (UNAIDS) 34.1 43 +2.62 +4.45
HUMAN DEVELOPMENT
N/A
N/A
N/A
N/A
N/A
N/A
N/A
N/A
N/A
N/A
N/A
N/A
N/A
N/A
N/A
N/A
N/A
N/A
N/A
N/A
*AAT: Annual Average Trend
If AAT appears the same in the two time periods, differences exist beyond the 2nd decimal place.
For a full list of data sources see Annex.
Increasing Improvement Slowing Improvement Warning Signs Bouncing Back Slowing Deterioration Increasing Deterioration No Change

123
2017 IIAG: Index Report2017 IIAG Egypt Scores, Ranks & Trends
OVERALL GOVERNANCE
49.4 31st2016 SCORE 2016 RANK
+0.17 +0.5510 -YEAR AAT* 5-YEAR AAT
SAFETY & RULE OF LAW 49.8 33 -1.01 +0.05
RULE OF LAW 52.6 32 -0.12 +2.13
Judicial Independence (BS/WEF/V-Dem/GI) 53.8 19 +0.51 +2.63
Judicial Process (EIU/GI) 58.3 14 -1.39 0.00
Access to Justice (V-Dem) 21.1 50 -1.94 -5.73
Property Rights (BS/HER/WEF/AfDB/WB) 49.3 25 -1.60 -0.78
Transfers of Power (EIU) 66.7 8 +3.71 +16.68
Multilateral Sanctions (CDD) 66.7 31 0.00 0.00
ACCOUNTABILITY 40.5 20 -0.22 +0.93
Access to Information (GI) 16.7 39 +0.47 +1.05
Online Public Services (UNDESA) 63.7 9 -1.22 -4.43
Public Sector Accountability & Transparency (V-Dem/AfDB/WB)
25.1 45 -0.46 -2.13
Accountability of Public Officials (EIU/BS) 54.8 8 0.00 +3.13
Corruption in Government & Public Officials (EIU) 50.0 16 +1.11 +2.50
Corruption & Bureaucracy (WB) 19.0 33 -4.23 -5.98
Diversion of Public Funds (WEF) 47.5 13 -0.68 +5.93
Corruption Investigation (GI/AFR) 46.9 16 +3.21 +7.23
PERSONAL SAFETY 38.4 42 -1.09 +1.58
Safety of the Person (EIU/AFR) 53.8 21 +1.27 +5.98
Police Services (WEF/GI) 27.7 36 -1.37 -0.50
Social Unrest (EIU/ACLED) 25.0 45 -5.53 +6.25
Crime (EIU/AFR) 61.4 14 +2.56 +12.00
Political Violence (ACLED/PTS) 12.5 50 -6.26 -14.25
Human Trafficking (USDS) 50.0 1 +2.78 0.00
NATIONAL SECURITY 67.8 41 -2.61 -4.45
Government Involvement in Armed Conflict (UCDP) 55.6 49 -4.93 -11.10
Domestic Armed Conflict (EIU) 25.0 41 -5.56 -6.25
Violence by Non-state Actors (ACLED) 77.8 39 -2.24 -2.73
Cross-border Tensions (EIU) 50.0 31 -2.78 -6.25
Internally Displaced People (IDMC) 99.2 31 -0.09 -0.20
Political Refugees (UNHCR) 99.5 24 -0.03 -0.05
SAFETY & RULE OF LAW
SCORE 2016
RANK 2016
10 -YEAR AAT
5-YEAR AAT
SCORE 2016
RANK 2016
10 -YEAR AAT
5-YEAR AAT
PARTICIPATION & HUMAN RIGHTS 27.2 48 +0.13 -1.55
PARTICIPATION 26.3 43 +0.63 -2.90
Political Participation (EIU/FH/V-Dem) 34.7 46 +0.22 -6.80
Civil Society Participation (BS/V-Dem/GI) 17.8 46 -1.14 -3.90
Free & Fair Elections (BS/CDD/V-Dem) 36.2 35 +1.56 -4.30
Election Monitoring Agencies (V-Dem/GI) 31.6 36 +2.54 +1.95
Legitimacy of Political Process (BS) 11.1 25 0.00 -1.40
RIGHTS 24.4 44 -0.63 -2.70
Freedom of Expression (BS/RSF/V-Dem/GI) 23.9 47 -1.67 -5.58
Freedom of Association & Assembly (BS/GI) 17.4 46 -1.92 -4.33
Civil Liberties (BS/FH ) 29.2 38 -0.69 0.00
Human Rights Conventions (UNOLA/OHCHR) 76.2 11 +0.53 0.00
Human Rights Violations (EIU) 0.0 39 0.00 -6.25
Protection against Discrimination (GI) 0.0 36 0.00 0.00
GENDER 30.9 51 +0.40 +0.93
Gender Equality (AfDB/WB) 37.5 42 -2.78 0.00
Women's Political Participation (IPU/GI/WB) 23.5 49 +0.73 +1.15
Gender Balance in Education (UNESCO) 82.4 14 +0.59 +0.53
Women's Labour Force Participation (WB) 14.3 51 +0.03 +0.28
Workplace Gender Equality (GI) 50.0 4 +5.56 +12.50
Women in the Judiciary (GI) 0.0 44 0.00 0.00
Laws on Violence against Women (OECD) 25.0 37 0.00 -3.13
Women's Political Empowerment (V-Dem) 14.7 54 -0.89 -3.83
PARTICIPATION & HUMAN RIGHTS
SCORE 2016
RANK 2016
10 -YEAR AAT
5-YEAR AAT
SUSTAINABLE ECONOMIC OPPORTUNITY 57.8 10 +0.74 +1.93
PUBLIC MANAGEMENT 47.7 25 -0.32 +1.18
Governmental Statistical Capacity (WB) 92.8 2 0.00 +0.38
Civil Registration (GI) 75.0 10 0.00 0.00
Public Administration (AfDB/WB) 37.5 47 -2.78 0.00
Diversification (AfDB/OECD/UNDP) 25.8 5 -0.33 +1.90
Budget Management (AfDB/WB) 44.4 44 -1.24 0.00
Budget Balance (AfDB/AUC/UNECA) 29.9 48 -0.92 +1.70
Fiscal Policy (AfDB/WB) 55.6 34 0.00 0.00
Revenue Mobilisation (ICTD/UNU-WIDER/AfDB/WB) 43.0 35 -0.50 +0.20
Transparency of State-owned Companies (GI) 25.0 7 +2.78 +6.25
BUSINESS ENVIRONMENT 48.0 21 0.00 +2.28
Investment Climate (HER) 61.1 21 +0.61 +1.38
Competition (BS/GI/AfDB/WB) 42.8 37 -0.46 +1.53
Business Bureaucracy & Red Tape (EIU) 33.3 10 -3.71 0.00
Customs Procedures (WEF) 52.2 13 +0.22 +0.73
Soundness of Banks (WEF) 57.0 8 +0.12 +2.90
Employment Creation (AFR) 41.8 13 +3.20 +7.20
Regional Integration (AfDB) . . . .
INFRASTRUCTURE 63.7 6 +2.00 +3.90
Transport Infrastructure (WEF/AFR/EIU/GI) 51.0 12 +1.62 +4.03
Electricity Infrastructure (WEF/AFR) 47.3 13 -0.27 +1.15
Digital & IT Infrastructure (EIU/ITU) 69.9 6 +3.31 +2.35
Access to Improved Water (WHO/UNICEF) 98.2 2 +0.01 0.00
Water & Sanitation Services (AFR) 52.1 8 +5.31 +11.95
RURAL SECTOR 72.0 5 +1.33 +0.40
Rural Land & Water (IFAD) 82.8 1 +1.13 0.00
Rural Business Climate (IFAD) 83.1 2 +1.64 +0.23
Rural Development Resources (IFAD) 75.0 9 +1.61 -2.38
Agricultural Support System (IFAD) 83.8 2 +2.08 +3.50
Agricultural Policy Costs (WEF) 34.1 38 -2.33 -1.68
Engagement with Rural Organisations (IFAD) 75.7 5 +2.73 +0.40
Gender Balance in Rural Decision-making (IFAD) 62.5 8 +1.02 0.00
Rural Accountability & Transparency (IFAD) 78.7 4 +2.77 +3.03
SUSTAINABLE ECONOMIC OPPORTUNITY
SCORE 2016
RANK 2016
10 -YEAR AAT
5-YEAR AAT
HUMAN DEVELOPMENT 62.6 15 +0.78 +1.75
WELFARE 51.5 22 +0.80 +2.48
Welfare Services (AfDB/WB) 60.0 38 -1.33 0.00
Social Safety Nets (BS) 46.2 17 0.00 +1.93
Social Protection & Labour (AfDB/WB) 55.6 24 0.00 0.00
Social Exclusion (BS) 28.6 7 -1.59 0.00
Poverty (AFR) 79.7 3 +3.49 +7.85
Poverty Reduction Priorities (AFR/AfDB/WB) 56.3 16 +2.61 +4.30
Narrowing Income Gaps (AFR) 38.8 11 +3.64 +8.20
Environmental Policy (BS) 42.9 14 +1.59 0.00
Environmental Sustainability (AfDB/WB) 55.6 38 -1.23 0.00
EDUCATION 59.1 15 +0.83 +1.30
Education Provision (AFR) 25.3 28 +2.81 +6.33
Education Quality (BS) 50.0 11 0.00 0.00
Educational System Management (WEF) 7.7 38 -1.23 -1.00
Human Resources in Primary Schools (UNESCO) 87.8 7 +0.50 +0.45
Primary School Completion (WB) 88.7 4 +0.98 -0.03
Secondary School Enrolment (UNESCO) 78.3 8 +1.36 +0.60
Tertiary Education Enrolment (UNESCO) 59.1 4 +1.19 +3.55
Literacy (WB) 75.9 24 +1.10 +0.60
HEALTH 77.1 17 +0.69 +1.40
Basic Health Services (AFR) 34.2 29 +3.80 +8.55
Public Health Campaigns (GI) 50.0 33 0.00 0.00
Child Mortality (IGME) 95.2 5 +0.43 +0.30
Maternal Mortality (MMEIG) 99.1 2 +0.07 +0.05
Access to Sanitation (WHO/UNICEF) 96.4 3 +0.07 +0.03
Undernourishment (WB) 100.0 1 0.00 0.00
Disease (WHO) 99.9 2 +0.02 +0.03
Immunisation (WB/WHO) 92.9 13 -0.62 -0.10
Antiretroviral Treatment (ART) Provision (UNAIDS) 25.7 45 +2.34 +3.68
HUMAN DEVELOPMENT
N/A
*AAT: Annual Average Trend
If AAT appears the same in the two time periods, differences exist beyond the 2nd decimal place.
For a full list of data sources see Annex.
Increasing Improvement Slowing Improvement Warning Signs Bouncing Back Slowing Deterioration Increasing Deterioration No Change
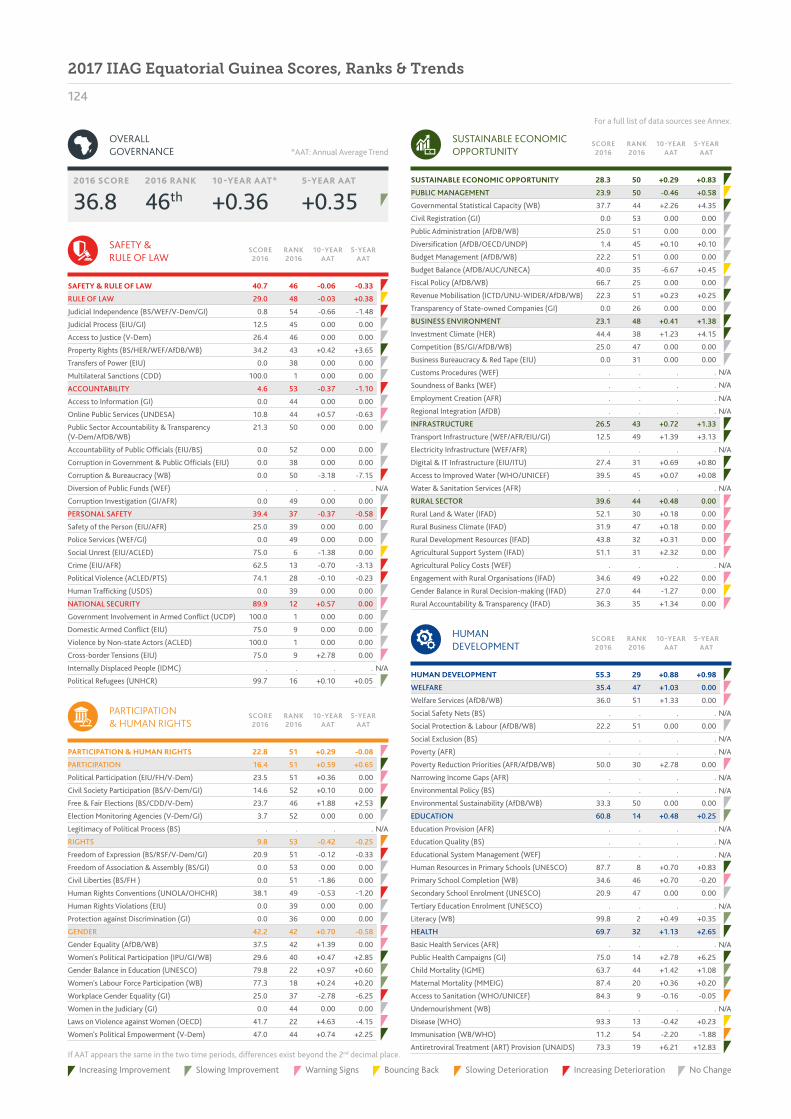
124
2017 IIAG Equatorial Guinea Scores, Ranks & Trends
OVERALL GOVERNANCE
36.8 46th2016 SCORE 2016 RANK
+0.36 +0.3510 -YEAR AAT* 5-YEAR AAT
SAFETY & RULE OF LAW 40.7 46 -0.06 -0.33
RULE OF LAW 29.0 48 -0.03 +0.38
Judicial Independence (BS/WEF/V-Dem/GI) 0.8 54 -0.66 -1.48
Judicial Process (EIU/GI) 12.5 45 0.00 0.00
Access to Justice (V-Dem) 26.4 46 0.00 0.00
Property Rights (BS/HER/WEF/AfDB/WB) 34.2 43 +0.42 +3.65
Transfers of Power (EIU) 0.0 38 0.00 0.00
Multilateral Sanctions (CDD) 100.0 1 0.00 0.00
ACCOUNTABILITY 4.6 53 -0.37 -1.10
Access to Information (GI) 0.0 44 0.00 0.00
Online Public Services (UNDESA) 10.8 44 +0.57 -0.63
Public Sector Accountability & Transparency (V-Dem/AfDB/WB)
21.3 50 0.00 0.00
Accountability of Public Officials (EIU/BS) 0.0 52 0.00 0.00
Corruption in Government & Public Officials (EIU) 0.0 38 0.00 0.00
Corruption & Bureaucracy (WB) 0.0 50 -3.18 -7.15
Diversion of Public Funds (WEF) . . . .
Corruption Investigation (GI/AFR) 0.0 49 0.00 0.00
PERSONAL SAFETY 39.4 37 -0.37 -0.58
Safety of the Person (EIU/AFR) 25.0 39 0.00 0.00
Police Services (WEF/GI) 0.0 49 0.00 0.00
Social Unrest (EIU/ACLED) 75.0 6 -1.38 0.00
Crime (EIU/AFR) 62.5 13 -0.70 -3.13
Political Violence (ACLED/PTS) 74.1 28 -0.10 -0.23
Human Trafficking (USDS) 0.0 39 0.00 0.00
NATIONAL SECURITY 89.9 12 +0.57 0.00
Government Involvement in Armed Conflict (UCDP) 100.0 1 0.00 0.00
Domestic Armed Conflict (EIU) 75.0 9 0.00 0.00
Violence by Non-state Actors (ACLED) 100.0 1 0.00 0.00
Cross-border Tensions (EIU) 75.0 9 +2.78 0.00
Internally Displaced People (IDMC) . . . .
Political Refugees (UNHCR) 99.7 16 +0.10 +0.05
SAFETY & RULE OF LAW
SCORE 2016
RANK 2016
10 -YEAR AAT
5-YEAR AAT
SCORE 2016
RANK 2016
10 -YEAR AAT
5-YEAR AAT
PARTICIPATION & HUMAN RIGHTS 22.8 51 +0.29 -0.08
PARTICIPATION 16.4 51 +0.59 +0.65
Political Participation (EIU/FH/V-Dem) 23.5 51 +0.36 0.00
Civil Society Participation (BS/V-Dem/GI) 14.6 52 +0.10 0.00
Free & Fair Elections (BS/CDD/V-Dem) 23.7 46 +1.88 +2.53
Election Monitoring Agencies (V-Dem/GI) 3.7 52 0.00 0.00
Legitimacy of Political Process (BS) . . . .
RIGHTS 9.8 53 -0.42 -0.25
Freedom of Expression (BS/RSF/V-Dem/GI) 20.9 51 -0.12 -0.33
Freedom of Association & Assembly (BS/GI) 0.0 53 0.00 0.00
Civil Liberties (BS/FH ) 0.0 51 -1.86 0.00
Human Rights Conventions (UNOLA/OHCHR) 38.1 49 -0.53 -1.20
Human Rights Violations (EIU) 0.0 39 0.00 0.00
Protection against Discrimination (GI) 0.0 36 0.00 0.00
GENDER 42.2 42 +0.70 -0.58
Gender Equality (AfDB/WB) 37.5 42 +1.39 0.00
Women's Political Participation (IPU/GI/WB) 29.6 40 +0.47 +2.85
Gender Balance in Education (UNESCO) 79.8 22 +0.97 +0.60
Women's Labour Force Participation (WB) 77.3 18 +0.24 +0.20
Workplace Gender Equality (GI) 25.0 37 -2.78 -6.25
Women in the Judiciary (GI) 0.0 44 0.00 0.00
Laws on Violence against Women (OECD) 41.7 22 +4.63 -4.15
Women's Political Empowerment (V-Dem) 47.0 44 +0.74 +2.25
PARTICIPATION & HUMAN RIGHTS
SCORE 2016
RANK 2016
10 -YEAR AAT
5-YEAR AAT
SUSTAINABLE ECONOMIC OPPORTUNITY 28.3 50 +0.29 +0.83
PUBLIC MANAGEMENT 23.9 50 -0.46 +0.58
Governmental Statistical Capacity (WB) 37.7 44 +2.26 +4.35
Civil Registration (GI) 0.0 53 0.00 0.00
Public Administration (AfDB/WB) 25.0 51 0.00 0.00
Diversification (AfDB/OECD/UNDP) 1.4 45 +0.10 +0.10
Budget Management (AfDB/WB) 22.2 51 0.00 0.00
Budget Balance (AfDB/AUC/UNECA) 40.0 35 -6.67 +0.45
Fiscal Policy (AfDB/WB) 66.7 25 0.00 0.00
Revenue Mobilisation (ICTD/UNU-WIDER/AfDB/WB) 22.3 51 +0.23 +0.25
Transparency of State-owned Companies (GI) 0.0 26 0.00 0.00
BUSINESS ENVIRONMENT 23.1 48 +0.41 +1.38
Investment Climate (HER) 44.4 38 +1.23 +4.15
Competition (BS/GI/AfDB/WB) 25.0 47 0.00 0.00
Business Bureaucracy & Red Tape (EIU) 0.0 31 0.00 0.00
Customs Procedures (WEF) . . . .
Soundness of Banks (WEF) . . . .
Employment Creation (AFR) . . . .
Regional Integration (AfDB) . . . .
INFRASTRUCTURE 26.5 43 +0.72 +1.33
Transport Infrastructure (WEF/AFR/EIU/GI) 12.5 49 +1.39 +3.13
Electricity Infrastructure (WEF/AFR) . . . .
Digital & IT Infrastructure (EIU/ITU) 27.4 31 +0.69 +0.80
Access to Improved Water (WHO/UNICEF) 39.5 45 +0.07 +0.08
Water & Sanitation Services (AFR) . . . .
RURAL SECTOR 39.6 44 +0.48 0.00
Rural Land & Water (IFAD) 52.1 30 +0.18 0.00
Rural Business Climate (IFAD) 31.9 47 +0.18 0.00
Rural Development Resources (IFAD) 43.8 32 +0.31 0.00
Agricultural Support System (IFAD) 51.1 31 +2.32 0.00
Agricultural Policy Costs (WEF) . . . .
Engagement with Rural Organisations (IFAD) 34.6 49 +0.22 0.00
Gender Balance in Rural Decision-making (IFAD) 27.0 44 -1.27 0.00
Rural Accountability & Transparency (IFAD) 36.3 35 +1.34 0.00
SUSTAINABLE ECONOMIC OPPORTUNITY
SCORE 2016
RANK 2016
10 -YEAR AAT
5-YEAR AAT
HUMAN DEVELOPMENT 55.3 29 +0.88 +0.98
WELFARE 35.4 47 +1.03 0.00
Welfare Services (AfDB/WB) 36.0 51 +1.33 0.00
Social Safety Nets (BS) . . . .
Social Protection & Labour (AfDB/WB) 22.2 51 0.00 0.00
Social Exclusion (BS) . . . .
Poverty (AFR) . . . .
Poverty Reduction Priorities (AFR/AfDB/WB) 50.0 30 +2.78 0.00
Narrowing Income Gaps (AFR) . . . .
Environmental Policy (BS) . . . .
Environmental Sustainability (AfDB/WB) 33.3 50 0.00 0.00
EDUCATION 60.8 14 +0.48 +0.25
Education Provision (AFR) . . . .
Education Quality (BS) . . . .
Educational System Management (WEF) . . . .
Human Resources in Primary Schools (UNESCO) 87.7 8 +0.70 +0.83
Primary School Completion (WB) 34.6 46 +0.70 -0.20
Secondary School Enrolment (UNESCO) 20.9 47 0.00 0.00
Tertiary Education Enrolment (UNESCO) . . . .
Literacy (WB) 99.8 2 +0.49 +0.35
HEALTH 69.7 32 +1.13 +2.65
Basic Health Services (AFR) . . . .
Public Health Campaigns (GI) 75.0 14 +2.78 +6.25
Child Mortality (IGME) 63.7 44 +1.42 +1.08
Maternal Mortality (MMEIG) 87.4 20 +0.36 +0.20
Access to Sanitation (WHO/UNICEF) 84.3 9 -0.16 -0.05
Undernourishment (WB) . . . .
Disease (WHO) 93.3 13 -0.42 +0.23
Immunisation (WB/WHO) 11.2 54 -2.20 -1.88
Antiretroviral Treatment (ART) Provision (UNAIDS) 73.3 19 +6.21 +12.83
HUMAN DEVELOPMENT
N/A
N/A
N/A
N/A
N/A
N/A
N/A
N/A
N/A
N/A
N/A
N/A
N/A
N/A
N/A
N/A
N/A
N/A
N/A
N/A
N/A
*AAT: Annual Average Trend
If AAT appears the same in the two time periods, differences exist beyond the 2nd decimal place.
For a full list of data sources see Annex.
Increasing Improvement Slowing Improvement Warning Signs Bouncing Back Slowing Deterioration Increasing Deterioration No Change

125
2017 IIAG: Index Report2017 IIAG Eritrea Scores, Ranks & Trends
OVERALL GOVERNANCE
29.2 52nd2016 SCORE 2016 RANK
-0.48 -0.1510 -YEAR AAT* 5-YEAR AAT
SAFETY & RULE OF LAW 32.5 47 -0.83 -0.80
RULE OF LAW 15.8 53 -1.00 +0.88
Judicial Independence (BS/WEF/V-Dem/GI) 4.3 53 +0.01 +1.08
Judicial Process (EIU/GI) 12.5 45 0.00 0.00
Access to Justice (V-Dem) 10.0 54 +0.44 +1.00
Property Rights (BS/HER/WEF/AfDB/WB) 34.9 42 +0.93 +3.28
Transfers of Power (EIU) 0.0 38 0.00 0.00
Multilateral Sanctions (CDD) 33.3 50 -7.41 0.00
ACCOUNTABILITY 12.2 49 -1.57 -2.93
Access to Information (GI) 0.0 44 0.00 0.00
Online Public Services (UNDESA) 2.9 51 -0.60 -6.35
Public Sector Accountability & Transparency (V-Dem/AfDB/WB)
24.6 47 -0.20 +1.05
Accountability of Public Officials (EIU/BS) 7.1 47 -3.44 0.00
Corruption in Government & Public Officials (EIU) 0.0 38 -4.44 -10.00
Corruption & Bureaucracy (WB) 38.1 17 -3.70 -8.33
Diversion of Public Funds (WEF) . . . .
Corruption Investigation (GI/AFR) 12.5 40 +1.39 +3.13
PERSONAL SAFETY 39.5 36 -1.83 -0.23
Safety of the Person (EIU/AFR) 25.0 39 -8.33 0.00
Police Services (WEF/GI) 0.0 49 0.00 0.00
Social Unrest (EIU/ACLED) 87.0 3 -1.41 -0.13
Crime (EIU/AFR) 75.0 2 0.00 0.00
Political Violence (ACLED/PTS) 50.0 45 -1.29 -1.15
Human Trafficking (USDS) 0.0 39 0.00 0.00
NATIONAL SECURITY 62.6 44 +1.08 -0.93
Government Involvement in Armed Conflict (UCDP) 77.8 33 -2.47 -5.55
Domestic Armed Conflict (EIU) 75.0 9 +5.56 0.00
Violence by Non-state Actors (ACLED) 100.0 1 +0.02 0.00
Cross-border Tensions (EIU) 25.0 42 +2.78 0.00
Internally Displaced People (IDMC) 97.9 35 +0.61 +0.03
Political Refugees (UNHCR) 0.0 51 0.00 0.00
SAFETY & RULE OF LAW
SCORE 2016
RANK 2016
10 -YEAR AAT
5-YEAR AAT
SCORE 2016
RANK 2016
10 -YEAR AAT
5-YEAR AAT
PARTICIPATION & HUMAN RIGHTS 17.9 53 -0.37 -0.43
PARTICIPATION 2.6 54 -0.20 +0.23
Political Participation (EIU/FH/V-Dem) 6.8 54 +0.03 +0.60
Civil Society Participation (BS/V-Dem/GI) 2.8 54 +0.24 +0.55
Free & Fair Elections (BS/CDD/V-Dem) 3.1 53 0.00 0.00
Election Monitoring Agencies (V-Dem/GI) 0.0 54 -0.08 -0.05
Legitimacy of Political Process (BS) 0.0 40 -1.23 0.00
RIGHTS 8.1 54 -0.06 +0.23
Freedom of Expression (BS/RSF/V-Dem/GI) 1.1 54 +0.11 +0.23
Freedom of Association & Assembly (BS/GI) 0.0 53 0.00 0.00
Civil Liberties (BS/FH ) 0.0 51 -0.92 0.00
Human Rights Conventions (UNOLA/OHCHR) 47.6 42 +0.52 +1.18
Human Rights Violations (EIU) 0.0 39 0.00 0.00
Protection against Discrimination (GI) 0.0 36 0.00 0.00
GENDER 43.0 41 -0.86 -1.73
Gender Equality (AfDB/WB) 39.2 41 -2.46 -3.43
Women's Political Participation (IPU/GI/WB) 43.8 21 -0.04 -0.80
Gender Balance in Education (UNESCO) 57.0 42 +0.88 +0.88
Women's Labour Force Participation (WB) 85.5 10 +0.11 +0.08
Workplace Gender Equality (GI) 25.0 37 0.00 0.00
Women in the Judiciary (GI) 50.0 31 -2.78 -6.25
Laws on Violence against Women (OECD) 25.0 37 -2.78 -4.70
Women's Political Empowerment (V-Dem) 18.6 53 +0.20 +0.35
PARTICIPATION & HUMAN RIGHTS
SCORE 2016
RANK 2016
10 -YEAR AAT
5-YEAR AAT
SUSTAINABLE ECONOMIC OPPORTUNITY 21.6 51 -0.53 +0.13
PUBLIC MANAGEMENT 21.8 51 -0.51 -0.23
Governmental Statistical Capacity (WB) 15.9 52 -1.29 -1.10
Civil Registration (GI) 50.0 32 0.00 0.00
Public Administration (AfDB/WB) 39.1 46 -0.74 -1.68
Diversification (AfDB/OECD/UNDP) 0.5 51 -0.11 +0.05
Budget Management (AfDB/WB) 24.0 50 -0.94 +1.38
Budget Balance (AfDB/AUC/UNECA) 8.6 52 -1.24 -0.83
Fiscal Policy (AfDB/WB) 18.3 52 -0.17 0.00
Revenue Mobilisation (ICTD/UNU-WIDER/AfDB/WB) 39.6 39 -0.13 0.00
Transparency of State-owned Companies (GI) 0.0 26 0.00 0.00
BUSINESS ENVIRONMENT 7.3 53 -0.27 +0.10
Investment Climate (HER) 0.0 52 -1.23 0.00
Competition (BS/GI/AfDB/WB) 4.2 53 -0.52 -1.18
Business Bureaucracy & Red Tape (EIU) 0.0 31 0.00 0.00
Customs Procedures (WEF) . . . .
Soundness of Banks (WEF) . . . .
Employment Creation (AFR) . . . .
Regional Integration (AfDB) 25.0 38 +0.69 +1.55
INFRASTRUCTURE 6.2 54 -0.60 -0.33
Transport Infrastructure (WEF/AFR/EIU/GI) 12.5 49 -1.39 -1.58
Electricity Infrastructure (WEF/AFR) . . . .
Digital & IT Infrastructure (EIU/ITU) 3.1 54 -0.62 +0.35
Access to Improved Water (WHO/UNICEF) 3.1 54 +0.22 +0.25
Water & Sanitation Services (AFR) . . . .
RURAL SECTOR 51.2 29 -0.73 +1.00
Rural Land & Water (IFAD) 73.3 8 +1.41 +1.20
Rural Business Climate (IFAD) 30.4 48 -0.78 +1.93
Rural Development Resources (IFAD) 43.8 32 -1.28 -1.15
Agricultural Support System (IFAD) 55.9 24 +0.80 +1.80
Agricultural Policy Costs (WEF) . . . .
Engagement with Rural Organisations (IFAD) 53.5 34 -0.04 +0.45
Gender Balance in Rural Decision-making (IFAD) 50.0 13 -1.73 0.00
Rural Accountability & Transparency (IFAD) 51.6 25 -3.50 +2.88
SUSTAINABLE ECONOMIC OPPORTUNITY
SCORE 2016
RANK 2016
10 -YEAR AAT
5-YEAR AAT
HUMAN DEVELOPMENT 44.8 48 -0.16 +0.50
WELFARE 25.8 50 -1.81 +0.48
Welfare Services (AfDB/WB) 64.6 32 -0.12 +1.23
Social Safety Nets (BS) 7.7 42 -1.71 -0.95
Social Protection & Labour (AfDB/WB) 27.6 49 -3.19 +1.10
Social Exclusion (BS) 0.0 33 -1.59 0.00
Poverty (AFR) . . . .
Poverty Reduction Priorities (AFR/AfDB/WB) 27.7 51 -2.88 +0.53
Narrowing Income Gaps (AFR) . . . .
Environmental Policy (BS) 14.3 38 -3.18 0.00
Environmental Sustainability (AfDB/WB) 38.9 49 0.00 +1.40
EDUCATION 34.3 47 +0.24 -0.10
Education Provision (AFR) . . . .
Education Quality (BS) 16.7 35 0.00 0.00
Educational System Management (WEF) . . . .
Human Resources in Primary Schools (UNESCO) 64.8 39 +0.57 -0.70
Primary School Completion (WB) 23.2 50 -1.21 +0.15
Secondary School Enrolment (UNESCO) 24.0 44 +0.17 -1.45
Tertiary Education Enrolment (UNESCO) 3.8 47 +0.19 +0.05
Literacy (WB) 73.5 26 +1.77 +1.38
HEALTH 74.3 19 +1.09 +1.13
Basic Health Services (AFR) . . . .
Public Health Campaigns (GI) 100.0 1 +2.78 +6.25
Child Mortality (IGME) 85.1 14 +0.83 +0.58
Maternal Mortality (MMEIG) 81.4 34 +0.50 +0.38
Access to Sanitation (WHO/UNICEF) 10.9 54 +0.44 +0.13
Undernourishment (WB) . . . .
Disease (WHO) 96.0 9 +0.34 +0.55
Immunisation (WB/WHO) 91.5 16 -0.21 -1.13
Antiretroviral Treatment (ART) Provision (UNAIDS) 55.0 32 +2.92 +1.13
HUMAN DEVELOPMENT
N/A
N/AN/A
N/A
N/A
N/A
N/A
N/A
N/A
N/A
N/A
N/A
N/A
*AAT: Annual Average Trend
If AAT appears the same in the two time periods, differences exist beyond the 2nd decimal place.
For a full list of data sources see Annex.
Increasing Improvement Slowing Improvement Warning Signs Bouncing Back Slowing Deterioration Increasing Deterioration No Change

126
2017 IIAG Ethiopia Scores, Ranks & Trends
OVERALL GOVERNANCE
47.7 36th2016 SCORE 2016 RANK
+0.59 +0.4510 -YEAR AAT* 5-YEAR AAT
SAFETY & RULE OF LAW 49.0 36 +0.08 +0.10
RULE OF LAW 42.6 37 -0.12 +1.10
Judicial Independence (BS/WEF/V-Dem/GI) 36.6 32 +1.04 +2.53
Judicial Process (EIU/GI) 54.2 19 +1.39 +3.13
Access to Justice (V-Dem) 53.9 34 +0.64 +1.20
Property Rights (BS/HER/WEF/AfDB/WB) 44.5 35 -0.07 -0.18
Transfers of Power (EIU) 0.0 38 -3.70 0.00
Multilateral Sanctions (CDD) 66.7 31 0.00 0.00
ACCOUNTABILITY 52.3 13 +2.23 +3.95
Access to Information (GI) 29.2 24 +3.24 +7.30
Online Public Services (UNDESA) 71.6 7 +6.13 +1.98
Public Sector Accountability & Transparency (V-Dem/AfDB/WB)
66.1 13 +1.24 +1.65
Accountability of Public Officials (EIU/BS) 38.1 17 +0.79 +1.78
Corruption in Government & Public Officials (EIU) 55.0 15 +1.67 +3.75
Corruption & Bureaucracy (WB) 38.1 17 -0.53 +2.38
Diversion of Public Funds (WEF) 57.6 7 +1.17 +3.38
Corruption Investigation (GI/AFR) 62.5 3 +4.17 +9.38
PERSONAL SAFETY 39.0 41 -1.49 -3.15
Safety of the Person (EIU/AFR) 25.0 39 -2.78 -6.25
Police Services (WEF/GI) 46.3 17 +2.39 +6.00
Social Unrest (EIU/ACLED) 18.8 49 -4.86 -12.10
Crime (EIU/AFR) 75.0 2 0.00 0.00
Political Violence (ACLED/PTS) 18.8 49 -3.73 -6.50
Human Trafficking (USDS) 50.0 1 0.00 0.00
NATIONAL SECURITY 62.0 45 -0.33 -1.55
Government Involvement in Armed Conflict (UCDP) 11.1 54 -3.70 -8.33
Domestic Armed Conflict (EIU) 25.0 41 0.00 -6.25
Violence by Non-state Actors (ACLED) 90.4 33 -1.02 -1.30
Cross-border Tensions (EIU) 50.0 31 +2.78 +6.25
Internally Displaced People (IDMC) 97.5 36 -0.01 +0.30
Political Refugees (UNHCR) 98.0 31 -0.02 0.00
SAFETY & RULE OF LAW
SCORE 2016
RANK 2016
10 -YEAR AAT
5-YEAR AAT
SCORE 2016
RANK 2016
10 -YEAR AAT
5-YEAR AAT
PARTICIPATION & HUMAN RIGHTS 40.1 36 +0.99 +1.58
PARTICIPATION 25.3 45 -0.02 +0.30
Political Participation (EIU/FH/V-Dem) 35.9 43 -0.88 -1.00
Civil Society Participation (BS/V-Dem/GI) 16.5 49 -2.03 -2.40
Free & Fair Elections (BS/CDD/V-Dem) 23.0 48 -0.43 +0.63
Election Monitoring Agencies (V-Dem/GI) 39.7 24 +3.21 +4.20
Legitimacy of Political Process (BS) 11.1 25 0.00 0.00
RIGHTS 34.4 36 +0.80 +1.73
Freedom of Expression (BS/RSF/V-Dem/GI) 23.3 49 -0.63 -1.68
Freedom of Association & Assembly (BS/GI) 17.4 46 +0.08 +2.28
Civil Liberties (BS/FH ) 14.6 46 -1.62 0.00
Human Rights Conventions (UNOLA/OHCHR) 76.2 11 +4.23 +3.58
Human Rights Violations (EIU) 25.0 25 0.00 0.00
Protection against Discrimination (GI) 50.0 3 +2.78 +6.25
GENDER 60.6 23 +2.19 +2.65
Gender Equality (AfDB/WB) 55.4 26 +1.16 +0.53
Women's Political Participation (IPU/GI/WB) 47.6 16 +2.26 +3.75
Gender Balance in Education (UNESCO) 67.5 33 +1.53 -0.30
Women's Labour Force Participation (WB) 84.6 11 -0.14 0.00
Workplace Gender Equality (GI) 25.0 37 0.00 0.00
Women in the Judiciary (GI) 100.0 1 +8.33 +18.75
Laws on Violence against Women (OECD) 50.0 19 +2.78 -3.13
Women's Political Empowerment (V-Dem) 55.0 40 +1.67 +1.75
PARTICIPATION & HUMAN RIGHTS
SCORE 2016
RANK 2016
10 -YEAR AAT
5-YEAR AAT
SUSTAINABLE ECONOMIC OPPORTUNITY 45.0 28 -0.30 -0.68
PUBLIC MANAGEMENT 52.1 14 +0.63 +0.68
Governmental Statistical Capacity (WB) 69.6 13 +0.32 +1.45
Civil Registration (GI) 50.0 32 0.00 0.00
Public Administration (AfDB/WB) 77.6 11 +1.44 +0.78
Diversification (AfDB/OECD/UNDP) 9.6 14 +0.30 +0.63
Budget Management (AfDB/WB) 83.1 5 +0.77 +3.18
Budget Balance (AfDB/AUC/UNECA) 46.1 22 +1.93 -1.48
Fiscal Policy (AfDB/WB) 80.2 9 +0.44 +1.40
Revenue Mobilisation (ICTD/UNU-WIDER/AfDB/WB) 53.2 18 +0.54 +0.30
Transparency of State-owned Companies (GI) 0.0 26 0.00 0.00
BUSINESS ENVIRONMENT 30.1 45 -1.88 -3.43
Investment Climate (HER) 22.2 49 -2.47 -1.40
Competition (BS/GI/AfDB/WB) 37.9 39 +0.04 -0.98
Business Bureaucracy & Red Tape (EIU) 0.0 31 -7.41 -16.68
Customs Procedures (WEF) 47.5 18 +0.62 +2.55
Soundness of Banks (WEF) 35.3 29 -2.08 -4.10
Employment Creation (AFR) . . . .
Regional Integration (AfDB) 37.5 35 0.00 0.00
INFRASTRUCTURE 37.5 30 +0.32 +0.18
Transport Infrastructure (WEF/AFR/EIU/GI) 54.9 10 +0.52 -2.00
Electricity Infrastructure (WEF/AFR) 45.2 14 -1.52 +1.08
Digital & IT Infrastructure (EIU/ITU) 23.0 38 +0.67 +0.28
Access to Improved Water (WHO/UNICEF) 26.9 52 +1.63 +1.35
Water & Sanitation Services (AFR) . . . .
RURAL SECTOR 60.4 13 -0.24 -0.13
Rural Land & Water (IFAD) 73.6 7 +2.46 +2.25
Rural Business Climate (IFAD) 60.6 16 -0.62 -1.43
Rural Development Resources (IFAD) 62.5 12 -3.70 0.00
Agricultural Support System (IFAD) 65.1 16 0.00 -2.30
Agricultural Policy Costs (WEF) 64.6 7 +1.59 +0.78
Engagement with Rural Organisations (IFAD) 46.5 41 -1.11 -2.38
Gender Balance in Rural Decision-making (IFAD) 50.0 13 0.00 +2.05
Rural Accountability & Transparency (IFAD) 60.5 12 -0.60 0.00
SUSTAINABLE ECONOMIC OPPORTUNITY
SCORE 2016
RANK 2016
10 -YEAR AAT
5-YEAR AAT
HUMAN DEVELOPMENT 56.7 24 +1.59 +0.85
WELFARE 59.2 13 +0.88 -0.03
Welfare Services (AfDB/WB) 96.0 2 +2.57 +2.00
Social Safety Nets (BS) 23.1 35 0.00 -4.80
Social Protection & Labour (AfDB/WB) 72.4 9 +1.61 +1.40
Social Exclusion (BS) 14.3 20 +1.59 +1.80
Poverty (AFR) . . . .
Poverty Reduction Priorities (AFR/AfDB/WB) 88.7 2 +0.13 0.00
Narrowing Income Gaps (AFR) . . . .
Environmental Policy (BS) 28.6 26 -1.59 -1.78
Environmental Sustainability (AfDB/WB) 91.7 3 +1.86 +1.40
EDUCATION 39.1 40 +1.17 +0.05
Education Provision (AFR) . . . .
Education Quality (BS) 50.0 11 +1.86 -2.08
Educational System Management (WEF) 49.6 15 +1.93 +0.93
Human Resources in Primary Schools (UNESCO) 51.5 48 +1.00 0.00
Primary School Completion (WB) 38.6 43 +0.79 +0.98
Secondary School Enrolment (UNESCO) 28.5 39 +0.34 -0.63
Tertiary Education Enrolment (UNESCO) 12.9 29 +0.89 0.00
Literacy (WB) 42.8 41 +1.38 +1.15
HEALTH 71.9 27 +2.76 +2.50
Basic Health Services (AFR) . . . .
Public Health Campaigns (GI) 75.0 14 +2.78 +6.25
Child Mortality (IGME) 79.4 22 +1.73 +0.95
Maternal Mortality (MMEIG) 87.0 22 +1.27 +0.90
Access to Sanitation (WHO/UNICEF) 36.6 44 +1.90 +1.58
Undernourishment (WB) 51.4 37 +2.08 +1.30
Disease (WHO) 91.6 18 +1.21 +0.93
Immunisation (WB/WHO) 82.2 28 +4.31 +4.38
Antiretroviral Treatment (ART) Provision (UNAIDS) 71.9 20 +6.72 +3.78
HUMAN DEVELOPMENT
N/A
N/A
N/A
N/A
N/A
N/A
*AAT: Annual Average Trend
If AAT appears the same in the two time periods, differences exist beyond the 2nd decimal place.
For a full list of data sources see Annex.
Increasing Improvement Slowing Improvement Warning Signs Bouncing Back Slowing Deterioration Increasing Deterioration No Change

127
2017 IIAG: Index Report2017 IIAG Gabon Scores, Ranks & Trends
OVERALL GOVERNANCE
52.2 23rd2016 SCORE 2016 RANK
+0.37 +0.0310 -YEAR AAT* 5-YEAR AAT
SAFETY & RULE OF LAW 57.5 25 -0.03 -0.30
RULE OF LAW 53.1 31 -0.01 -0.13
Judicial Independence (BS/WEF/V-Dem/GI) 31.2 36 -0.42 -0.10
Judicial Process (EIU/GI) 29.2 36 +0.47 0.00
Access to Justice (V-Dem) 76.1 17 +0.79 +1.48
Property Rights (BS/HER/WEF/AfDB/WB) 48.6 26 -0.94 -2.13
Transfers of Power (EIU) 33.3 20 0.00 0.00
Multilateral Sanctions (CDD) 100.0 1 0.00 0.00
ACCOUNTABILITY 30.7 34 +0.28 -0.48
Access to Information (GI) 29.2 24 -1.39 -3.13
Online Public Services (UNDESA) 20.6 32 +1.06 -1.25
Public Sector Accountability & Transparency (V-Dem/AfDB/WB)
38.9 34 +0.18 +1.35
Accountability of Public Officials (EIU/BS) 33.3 33 +3.70 +2.08
Corruption in Government & Public Officials (EIU) 40.0 17 0.00 0.00
Corruption & Bureaucracy (WB) 38.1 17 -0.53 -1.20
Diversion of Public Funds (WEF) 32.7 25 +0.58 +1.30
Corruption Investigation (GI/AFR) 12.5 40 -1.39 -3.13
PERSONAL SAFETY 54.5 17 -0.41 -1.73
Safety of the Person (EIU/AFR) 50.0 24 0.00 0.00
Police Services (WEF/GI) 34.5 30 +0.34 +0.78
Social Unrest (EIU/ACLED) 55.9 28 -2.11 -4.60
Crime (EIU/AFR) 75.0 2 +0.69 0.00
Political Violence (ACLED/PTS) 86.6 10 +1.39 -0.23
Human Trafficking (USDS) 25.0 21 -2.78 -6.25
NATIONAL SECURITY 91.6 10 0.00 +1.05
Government Involvement in Armed Conflict (UCDP) 100.0 1 0.00 0.00
Domestic Armed Conflict (EIU) 75.0 9 0.00 +6.25
Violence by Non-state Actors (ACLED) 100.0 1 0.00 +0.10
Cross-border Tensions (EIU) 75.0 9 0.00 0.00
Internally Displaced People (IDMC) 100.0 1 0.00 0.00
Political Refugees (UNHCR) 99.8 12 0.00 +0.03
SAFETY & RULE OF LAW
SCORE 2016
RANK 2016
10 -YEAR AAT
5-YEAR AAT
SCORE 2016
RANK 2016
10 -YEAR AAT
5-YEAR AAT
PARTICIPATION & HUMAN RIGHTS 45.8 32 +0.33 +0.18
PARTICIPATION 37.9 33 +0.34 -0.45
Political Participation (EIU/FH/V-Dem) 48.6 34 +0.33 +0.03
Civil Society Participation (BS/V-Dem/GI) 60.8 27 -0.01 +0.33
Free & Fair Elections (BS/CDD/V-Dem) 32.2 39 +1.27 +0.63
Election Monitoring Agencies (V-Dem/GI) 10.2 50 -0.20 -2.70
Legitimacy of Political Process (BS) . . . .
RIGHTS 41.2 33 -0.51 -0.85
Freedom of Expression (BS/RSF/V-Dem/GI) 70.2 16 -0.28 -0.48
Freedom of Association & Assembly (BS/GI) 12.5 48 -2.78 -6.25
Civil Liberties (BS/FH ) 33.3 34 -1.86 0.00
Human Rights Conventions (UNOLA/OHCHR) 81.0 6 +3.18 +4.78
Human Rights Violations (EIU) 50.0 7 0.00 0.00
Protection against Discrimination (GI) 0.0 36 -1.39 -3.13
GENDER 58.3 26 +1.17 +1.80
Gender Equality (AfDB/WB) 62.5 20 0.00 0.00
Women's Political Participation (IPU/GI/WB) 40.5 23 +1.57 +3.80
Gender Balance in Education (UNESCO) . . . .
Women's Labour Force Participation (WB) 36.9 40 -1.11 +0.35
Workplace Gender Equality (GI) 50.0 4 +2.78 +6.25
Women in the Judiciary (GI) 100.0 1 0.00 0.00
Laws on Violence against Women (OECD) 41.7 22 +4.63 +1.05
Women's Political Empowerment (V-Dem) 76.3 24 +0.31 +1.08
PARTICIPATION & HUMAN RIGHTS
SCORE 2016
RANK 2016
10 -YEAR AAT
5-YEAR AAT
SUSTAINABLE ECONOMIC OPPORTUNITY 44.7 29 +0.67 +0.28
PUBLIC MANAGEMENT 34.1 45 -0.79 -1.13
Governmental Statistical Capacity (WB) 26.1 50 -0.48 0.00
Civil Registration (GI) 25.0 47 0.00 0.00
Public Administration (AfDB/WB) 50.0 33 0.00 0.00
Diversification (AfDB/OECD/UNDP) 1.3 46 -0.01 +0.10
Budget Management (AfDB/WB) 55.6 31 +1.24 0.00
Budget Balance (AfDB/AUC/UNECA) 49.3 17 -5.63 -3.90
Fiscal Policy (AfDB/WB) 55.6 34 0.00 0.00
Revenue Mobilisation (ICTD/UNU-WIDER/AfDB/WB) 44.5 33 +0.60 +0.05
Transparency of State-owned Companies (GI) 0.0 26 -2.78 -6.25
BUSINESS ENVIRONMENT 46.9 24 +0.38 0.00
Investment Climate (HER) 61.1 21 +1.86 0.00
Competition (BS/GI/AfDB/WB) 43.8 33 +1.39 +3.13
Business Bureaucracy & Red Tape (EIU) 33.3 10 0.00 0.00
Customs Procedures (WEF) 48.0 16 +0.21 +0.48
Soundness of Banks (WEF) 48.5 18 -1.56 -3.50
Employment Creation (AFR) . . . .
Regional Integration (AfDB) . . . .
INFRASTRUCTURE 50.3 14 +1.21 +1.15
Transport Infrastructure (WEF/AFR/EIU/GI) 27.5 37 -0.56 +0.85
Electricity Infrastructure (WEF/AFR) 34.9 21 +0.99 +2.23
Digital & IT Infrastructure (EIU/ITU) 53.5 10 +3.90 +1.15
Access to Improved Water (WHO/UNICEF) 85.2 7 +0.52 +0.40
Water & Sanitation Services (AFR) . . . .
RURAL SECTOR 47.6 35 +1.88 +1.03
Rural Land & Water (IFAD) 48.6 36 -0.06 -0.10
Rural Business Climate (IFAD) 51.4 31 +2.76 +3.10
Rural Development Resources (IFAD) 43.8 32 +3.48 +5.88
Agricultural Support System (IFAD) 37.2 41 +3.11 -1.73
Agricultural Policy Costs (WEF) 39.1 35 -2.47 -5.55
Engagement with Rural Organisations (IFAD) 51.5 37 +2.98 +0.98
Gender Balance in Rural Decision-making (IFAD) 66.8 5 +1.87 +3.15
Rural Accountability & Transparency (IFAD) 42.4 32 +3.37 +2.55
SUSTAINABLE ECONOMIC OPPORTUNITY
SCORE 2016
RANK 2016
10 -YEAR AAT
5-YEAR AAT
HUMAN DEVELOPMENT 60.7 17 +0.49 -0.03
WELFARE 52.3 21 +0.62 0.00
Welfare Services (AfDB/WB) 48.0 46 0.00 0.00
Social Safety Nets (BS) . . . .
Social Protection & Labour (AfDB/WB) 44.4 40 0.00 0.00
Social Exclusion (BS) . . . .
Poverty (AFR) . . . .
Poverty Reduction Priorities (AFR/AfDB/WB) 50.0 30 0.00 0.00
Narrowing Income Gaps (AFR) . . . .
Environmental Policy (BS) . . . .
Environmental Sustainability (AfDB/WB) 66.7 23 +2.48 0.00
EDUCATION 53.0 21 +0.28 +0.35
Education Provision (AFR) . . . .
Education Quality (BS) . . . .
Educational System Management (WEF) 30.4 28 +0.77 +1.73
Human Resources in Primary Schools (UNESCO) 86.3 10 +0.73 0.00
Primary School Completion (WB) 56.3 26 0.00 0.00
Secondary School Enrolment (UNESCO) 46.2 24 0.00 0.00
Tertiary Education Enrolment (UNESCO) 13.4 27 0.00 0.00
Literacy (WB) 85.1 14 +0.17 +0.30
HEALTH 76.9 18 +0.57 -0.38
Basic Health Services (AFR) . . . .
Public Health Campaigns (GI) 50.0 33 -5.56 -12.50
Child Mortality (IGME) 83.2 20 +1.06 +0.78
Maternal Mortality (MMEIG) 89.3 14 +0.24 +0.20
Access to Sanitation (WHO/UNICEF) 67.8 15 +0.02 +0.03
Undernourishment (WB) 100.0 1 0.00 0.00
Disease (WHO) 73.3 45 +1.29 -0.95
Immunisation (WB/WHO) 73.8 40 +0.43 -0.68
Antiretroviral Treatment (ART) Provision (UNAIDS) 78.0 16 +7.04 +10.10
HUMAN DEVELOPMENT
N/A
N/A
N/A
N/A
N/A
N/A
N/A
N/A
N/A
N/A
N/A
N/A
N/A
*AAT: Annual Average Trend
If AAT appears the same in the two time periods, differences exist beyond the 2nd decimal place.
For a full list of data sources see Annex.
Increasing Improvement Slowing Improvement Warning Signs Bouncing Back Slowing Deterioration Increasing Deterioration No Change

128
2017 IIAG Gambia Scores, Ranks & Trends
OVERALL GOVERNANCE
49.2 33rd2016 SCORE 2016 RANK
-0.23 -0.8810 -YEAR AAT* 5-YEAR AAT
SAFETY & RULE OF LAW 45.2 41 -1.37 -2.20
RULE OF LAW 43.0 35 -0.22 -0.60
Judicial Independence (BS/WEF/V-Dem/GI) 25.3 41 -0.41 -1.30
Judicial Process (EIU/GI) 12.5 45 -1.39 -3.13
Access to Justice (V-Dem) 66.6 27 +0.50 +1.13
Property Rights (BS/HER/WEF/AfDB/WB) 53.5 22 -0.01 -0.38
Transfers of Power (EIU) 0.0 38 0.00 0.00
Multilateral Sanctions (CDD) 100.0 1 0.00 0.00
ACCOUNTABILITY 25.8 39 -1.26 -2.20
Access to Information (GI) 0.0 44 -1.39 -3.13
Online Public Services (UNDESA) 26.5 29 +0.72 -4.20
Public Sector Accountability & Transparency (V-Dem/AfDB/WB)
26.8 42 -0.12 -0.28
Accountability of Public Officials (EIU/BS) 33.3 33 -3.71 0.00
Corruption in Government & Public Officials (EIU) 20.0 31 -2.22 0.00
Corruption & Bureaucracy (WB) 38.1 17 -0.53 -1.20
Diversion of Public Funds (WEF) 62.0 3 +0.04 -2.43
Corruption Investigation (GI/AFR) 0.0 49 -2.78 -6.25
PERSONAL SAFETY 41.2 34 -2.64 -2.03
Safety of the Person (EIU/AFR) 0.0 47 -11.11 -6.25
Police Services (WEF/GI) 45.6 18 +0.63 -0.05
Social Unrest (EIU/ACLED) 86.3 4 +1.26 -0.30
Crime (EIU/AFR) 50.0 29 -2.78 +3.13
Political Violence (ACLED/PTS) 65.1 37 -1.10 -2.48
Human Trafficking (USDS) 0.0 39 -2.78 -6.25
NATIONAL SECURITY 70.8 40 -1.36 -4.00
Government Involvement in Armed Conflict (UCDP) 88.9 19 -1.23 -2.78
Domestic Armed Conflict (EIU) 50.0 25 -2.78 -6.25
Violence by Non-state Actors (ACLED) 100.0 1 +0.02 0.00
Cross-border Tensions (EIU) 0.0 54 -2.78 -12.50
Internally Displaced People (IDMC) 100.0 1 0.00 0.00
Political Refugees (UNHCR) 85.9 44 -1.34 -2.48
SAFETY & RULE OF LAW
SCORE 2016
RANK 2016
10 -YEAR AAT
5-YEAR AAT
SCORE 2016
RANK 2016
10 -YEAR AAT
5-YEAR AAT
PARTICIPATION & HUMAN RIGHTS 37.6 41 -0.43 +0.18
PARTICIPATION 45.2 30 +0.78 +3.60
Political Participation (EIU/FH/V-Dem) 43.8 36 -1.62 +0.55
Civil Society Participation (BS/V-Dem/GI) 28.8 45 +0.06 +0.13
Free & Fair Elections (BS/CDD/V-Dem) 74.6 11 +3.27 +10.45
Election Monitoring Agencies (V-Dem/GI) 33.4 33 +1.41 +3.18
Legitimacy of Political Process (BS) . . . .
RIGHTS 21.3 49 -0.62 -0.40
Freedom of Expression (BS/RSF/V-Dem/GI) 25.9 46 -0.26 -0.50
Freedom of Association & Assembly (BS/GI) 25.0 36 0.00 0.00
Civil Liberties (BS/FH ) 16.7 45 -3.70 0.00
Human Rights Conventions (UNOLA/OHCHR) 47.6 42 +1.59 +1.18
Human Rights Violations (EIU) 0.0 39 0.00 0.00
Protection against Discrimination (GI) 12.5 30 -1.39 -3.13
GENDER 46.4 37 -1.44 -2.68
Gender Equality (AfDB/WB) 55.0 29 -0.70 -1.58
Women's Political Participation (IPU/GI/WB) 36.0 29 -0.91 -2.40
Gender Balance in Education (UNESCO) 95.1 2 +0.97 +1.30
Women's Labour Force Participation (WB) 78.3 16 +0.06 0.00
Workplace Gender Equality (GI) 25.0 37 0.00 0.00
Women in the Judiciary (GI) 0.0 44 -8.33 -18.75
Laws on Violence against Women (OECD) 25.0 37 -2.78 -1.05
Women's Political Empowerment (V-Dem) 56.6 38 +0.10 +1.08
PARTICIPATION & HUMAN RIGHTS
SCORE 2016
RANK 2016
10 -YEAR AAT
5-YEAR AAT
SUSTAINABLE ECONOMIC OPPORTUNITY 51.8 13 +0.29 -0.93
PUBLIC MANAGEMENT 43.8 32 -0.36 -0.78
Governmental Statistical Capacity (WB) 62.3 24 +0.32 -1.10
Civil Registration (GI) 75.0 10 0.00 0.00
Public Administration (AfDB/WB) 52.1 32 -0.69 -1.55
Diversification (AfDB/OECD/UNDP) 3.2 34 -0.81 -0.28
Budget Management (AfDB/WB) 55.0 35 +0.47 -1.43
Budget Balance (AfDB/AUC/UNECA) 70.9 2 +1.27 +6.68
Fiscal Policy (AfDB/WB) 31.0 50 -3.61 -9.50
Revenue Mobilisation (ICTD/UNU-WIDER/AfDB/WB) 45.1 31 -0.07 +0.33
Transparency of State-owned Companies (GI) 0.0 26 0.00 0.00
BUSINESS ENVIRONMENT 52.9 14 -0.32 -1.03
Investment Climate (HER) 83.3 5 +3.08 +2.78
Competition (BS/GI/AfDB/WB) 55.4 17 +2.43 +6.53
Business Bureaucracy & Red Tape (EIU) 0.0 31 -3.70 -6.25
Customs Procedures (WEF) 68.3 5 -0.36 -3.50
Soundness of Banks (WEF) 54.1 9 -2.69 -4.10
Employment Creation (AFR) . . . .
Regional Integration (AfDB) 56.3 22 -0.69 -1.55
INFRASTRUCTURE 50.2 15 +0.67 -0.60
Transport Infrastructure (WEF/AFR/EIU/GI) 41.7 18 +0.26 -1.70
Electricity Infrastructure (WEF/AFR) 47.5 12 +0.01 -3.53
Digital & IT Infrastructure (EIU/ITU) 35.5 20 +1.96 +2.48
Access to Improved Water (WHO/UNICEF) 76.2 12 +0.43 +0.35
Water & Sanitation Services (AFR) . . . .
RURAL SECTOR 60.3 14 +1.17 -1.28
Rural Land & Water (IFAD) 67.4 13 +1.98 +0.03
Rural Business Climate (IFAD) 62.1 12 +0.38 -3.30
Rural Development Resources (IFAD) 53.3 23 +1.83 -2.00
Agricultural Support System (IFAD) 73.5 13 +3.58 0.00
Agricultural Policy Costs (WEF) 86.8 2 +1.89 +1.23
Engagement with Rural Organisations (IFAD) 67.4 8 +1.31 +0.50
Gender Balance in Rural Decision-making (IFAD) 46.8 29 -0.91 -3.93
Rural Accountability & Transparency (IFAD) 25.4 45 -0.70 -2.73
SUSTAINABLE ECONOMIC OPPORTUNITY
SCORE 2016
RANK 2016
10 -YEAR AAT
5-YEAR AAT
HUMAN DEVELOPMENT 62.0 16 +0.53 -0.63
WELFARE 57.1 16 +0.44 -0.65
Welfare Services (AfDB/WB) 72.9 14 +1.47 0.00
Social Safety Nets (BS) . . . .
Social Protection & Labour (AfDB/WB) 40.3 44 -0.38 -0.28
Social Exclusion (BS) . . . .
Poverty (AFR) . . . .
Poverty Reduction Priorities (AFR/AfDB/WB) 51.5 22 -0.23 -2.30
Narrowing Income Gaps (AFR) . . . .
Environmental Policy (BS) . . . .
Environmental Sustainability (AfDB/WB) 63.9 31 +0.92 0.00
EDUCATION 50.0 25 +0.23 -0.55
Education Provision (AFR) . . . .
Education Quality (BS) . . . .
Educational System Management (WEF) 72.9 2 +1.39 -2.28
Human Resources in Primary Schools (UNESCO) 66.2 33 -0.88 -2.35
Primary School Completion (WB) 55.0 27 -0.69 +0.20
Secondary School Enrolment (UNESCO) 50.3 18 -0.04 0.00
Tertiary Education Enrolment (UNESCO) 4.7 45 +0.27 0.00
Literacy (WB) 50.9 39 +1.37 +1.15
HEALTH 79.0 14 +0.94 -0.68
Basic Health Services (AFR) . . . .
Public Health Campaigns (GI) 75.0 14 -2.78 -6.25
Child Mortality (IGME) 75.0 28 +1.08 +0.80
Maternal Mortality (MMEIG) 73.6 45 +0.34 +0.35
Access to Sanitation (WHO/UNICEF) 69.6 14 -0.22 -0.18
Undernourishment (WB) 99.5 10 +1.87 +0.38
Disease (WHO) 87.3 24 +1.68 +1.25
Immunisation (WB/WHO) 97.8 7 +0.49 +0.03
Antiretroviral Treatment (ART) Provision (UNAIDS) 54.4 33 +5.09 -1.75
HUMAN DEVELOPMENT
N/A
N/A
N/A
N/A
N/A
N/A
N/A
N/A
N/A
N/A
N/A
*AAT: Annual Average Trend
If AAT appears the same in the two time periods, differences exist beyond the 2nd decimal place.
For a full list of data sources see Annex.
Increasing Improvement Slowing Improvement Warning Signs Bouncing Back Slowing Deterioration Increasing Deterioration No Change

129
2017 IIAG: Index Report2017 IIAG Ghana Scores, Ranks & Trends
OVERALL GOVERNANCE
65.0 8th2016 SCORE 2016 RANK
-0.17 -0.7010 -YEAR AAT* 5-YEAR AAT
SAFETY & RULE OF LAW 71.5 6 -0.23 -0.65
RULE OF LAW 88.7 4 +0.56 +0.18
Judicial Independence (BS/WEF/V-Dem/GI) 83.3 5 +0.26 +0.30
Judicial Process (EIU/GI) 83.3 5 0.00 0.00
Access to Justice (V-Dem) 91.8 5 -0.81 -0.55
Property Rights (BS/HER/WEF/AfDB/WB) 73.6 5 +0.19 +1.30
Transfers of Power (EIU) 100.0 1 +3.70 0.00
Multilateral Sanctions (CDD) 100.0 1 0.00 0.00
ACCOUNTABILITY 54.7 11 +0.09 +0.15
Access to Information (GI) 66.7 4 +1.86 +4.18
Online Public Services (UNDESA) 60.8 12 +2.87 +5.03
Public Sector Accountability & Transparency (V-Dem/AfDB/WB)
56.7 19 -1.24 -2.80
Accountability of Public Officials (EIU/BS) 45.2 12 -0.80 -1.80
Corruption in Government & Public Officials (EIU) 75.0 8 +1.67 +3.75
Corruption & Bureaucracy (WB) 38.1 17 -3.70 -8.33
Diversion of Public Funds (WEF) 36.3 22 +0.08 -0.63
Corruption Investigation (GI/AFR) 58.8 4 -0.03 +1.73
PERSONAL SAFETY 55.5 14 -1.10 -2.50
Safety of the Person (EIU/AFR) 66.0 9 -0.57 -1.28
Police Services (WEF/GI) 55.4 6 +1.12 +0.38
Social Unrest (EIU/ACLED) 52.3 31 -2.51 -4.80
Crime (EIU/AFR) 53.4 25 -1.93 -3.48
Political Violence (ACLED/PTS) 81.3 12 +0.12 +0.48
Human Trafficking (USDS) 25.0 21 -2.78 -6.25
NATIONAL SECURITY 86.9 23 -0.52 -0.45
Government Involvement in Armed Conflict (UCDP) 77.8 33 -2.47 -2.78
Domestic Armed Conflict (EIU) 75.0 9 0.00 0.00
Violence by Non-state Actors (ACLED) 95.2 28 -0.53 -0.10
Cross-border Tensions (EIU) 75.0 9 0.00 0.00
Internally Displaced People (IDMC) 100.0 1 0.00 0.00
Political Refugees (UNHCR) 98.6 27 -0.09 +0.25
SAFETY & RULE OF LAW
SCORE 2016
RANK 2016
10 -YEAR AAT
5-YEAR AAT
SCORE 2016
RANK 2016
10 -YEAR AAT
5-YEAR AAT
PARTICIPATION & HUMAN RIGHTS 72.0 5 -0.16 -0.60
PARTICIPATION 81.2 7 -0.04 +0.03
Political Participation (EIU/FH/V-Dem) 86.1 4 +0.71 +0.78
Civil Society Participation (BS/V-Dem/GI) 94.6 2 +0.03 +0.03
Free & Fair Elections (BS/CDD/V-Dem) 75.9 10 +0.16 +1.80
Election Monitoring Agencies (V-Dem/GI) 60.7 14 -1.10 -2.45
Legitimacy of Political Process (BS) 88.9 3 0.00 0.00
RIGHTS 68.6 5 -0.30 -0.98
Freedom of Expression (BS/RSF/V-Dem/GI) 90.2 2 -0.42 -0.85
Freedom of Association & Assembly (BS/GI) 81.9 4 +0.69 +0.85
Civil Liberties (BS/FH ) 72.9 9 -1.39 -3.13
Human Rights Conventions (UNOLA/OHCHR) 66.7 22 +2.12 +3.58
Human Rights Violations (EIU) 50.0 7 -2.78 -6.25
Protection against Discrimination (GI) 50.0 3 0.00 0.00
GENDER 66.1 15 -0.13 -0.85
Gender Equality (AfDB/WB) 79.6 9 +0.23 +0.53
Women's Political Participation (IPU/GI/WB) 30.6 39 -0.39 -1.08
Gender Balance in Education (UNESCO) 83.8 9 +0.89 +1.20
Women's Labour Force Participation (WB) 82.7 13 +1.12 +0.50
Workplace Gender Equality (GI) 50.0 4 0.00 0.00
Women in the Judiciary (GI) 75.0 19 -2.78 -6.25
Laws on Violence against Women (OECD) 41.7 22 -0.03 -2.08
Women's Political Empowerment (V-Dem) 85.7 11 -0.03 +0.40
PARTICIPATION & HUMAN RIGHTS
SCORE 2016
RANK 2016
10 -YEAR AAT
5-YEAR AAT
SUSTAINABLE ECONOMIC OPPORTUNITY 51.1 14 -0.22 -0.55
PUBLIC MANAGEMENT 47.6 26 -0.48 +0.33
Governmental Statistical Capacity (WB) 68.1 16 +1.93 +3.25
Civil Registration (GI) 37.5 42 +1.39 +3.13
Public Administration (AfDB/WB) 76.0 12 -0.36 -0.40
Diversification (AfDB/OECD/UNDP) 4.5 29 -0.03 -0.25
Budget Management (AfDB/WB) 73.2 12 -0.94 0.00
Budget Balance (AfDB/AUC/UNECA) 39.0 37 +0.24 +0.15
Fiscal Policy (AfDB/WB) 49.2 40 -2.38 -3.18
Revenue Mobilisation (ICTD/UNU-WIDER/AfDB/WB) 80.5 2 -1.38 +6.33
Transparency of State-owned Companies (GI) 0.0 26 -2.78 -6.25
BUSINESS ENVIRONMENT 58.5 9 -0.19 +0.28
Investment Climate (HER) 77.8 8 +2.47 0.00
Competition (BS/GI/AfDB/WB) 65.5 9 -0.48 -1.45
Business Bureaucracy & Red Tape (EIU) 66.7 4 +3.71 +8.35
Customs Procedures (WEF) 52.2 13 +1.28 +2.68
Soundness of Banks (WEF) 49.7 16 -3.37 -3.33
Employment Creation (AFR) 29.0 23 -4.94 -4.25
Regional Integration (AfDB) 68.8 10 0.00 0.00
INFRASTRUCTURE 40.1 24 -1.18 -2.23
Transport Infrastructure (WEF/AFR/EIU/GI) 36.2 27 -1.36 -1.95
Electricity Infrastructure (WEF/AFR) 19.6 33 -2.73 -5.45
Digital & IT Infrastructure (EIU/ITU) 48.0 12 +2.72 +2.18
Access to Improved Water (WHO/UNICEF) 73.5 16 +0.93 +0.78
Water & Sanitation Services (AFR) 23.1 26 -5.47 -6.65
RURAL SECTOR 58.4 17 +1.00 -0.50
Rural Land & Water (IFAD) 67.5 12 +2.59 +3.10
Rural Business Climate (IFAD) 63.4 11 +0.30 -1.90
Rural Development Resources (IFAD) 50.0 25 +0.47 -1.58
Agricultural Support System (IFAD) 65.1 16 +2.33 0.00
Agricultural Policy Costs (WEF) 53.4 18 -0.34 -3.10
Engagement with Rural Organisations (IFAD) 56.9 26 +1.49 -0.63
Gender Balance in Rural Decision-making (IFAD) 50.0 13 -0.70 0.00
Rural Accountability & Transparency (IFAD) 60.5 12 +1.80 0.00
SUSTAINABLE ECONOMIC OPPORTUNITY
SCORE 2016
RANK 2016
10 -YEAR AAT
5-YEAR AAT
HUMAN DEVELOPMENT 65.2 12 -0.10 -1.03
WELFARE 60.8 10 -0.90 -2.15
Welfare Services (AfDB/WB) 82.9 7 -0.34 -1.78
Social Safety Nets (BS) 61.5 8 -0.86 -3.85
Social Protection & Labour (AfDB/WB) 76.2 5 +0.80 0.00
Social Exclusion (BS) 42.9 6 -1.58 -3.55
Poverty (AFR) 66.5 9 -0.06 -1.80
Poverty Reduction Priorities (AFR/AfDB/WB) 43.8 39 -3.20 -3.13
Narrowing Income Gaps (AFR) 33.1 22 -3.20 -3.80
Environmental Policy (BS) 57.1 7 0.00 0.00
Environmental Sustainability (AfDB/WB) 83.3 5 +0.30 -1.40
EDUCATION 61.2 12 +0.60 -0.35
Education Provision (AFR) 24.4 29 -6.16 -8.03
Education Quality (BS) 83.3 2 +1.84 0.00
Educational System Management (WEF) 58.9 10 +1.52 +0.28
Human Resources in Primary Schools (UNESCO) 79.4 16 +0.18 +0.70
Primary School Completion (WB) 85.9 7 +2.67 +0.75
Secondary School Enrolment (UNESCO) 54.8 14 +1.71 +0.90
Tertiary Education Enrolment (UNESCO) 26.2 12 +1.77 +1.65
Literacy (WB) 76.8 23 +1.26 +0.93
HEALTH 73.7 22 +0.03 -0.58
Basic Health Services (AFR) 30.8 30 -6.62 -9.00
Public Health Campaigns (GI) 100.0 1 0.00 0.00
Child Mortality (IGME) 78.3 24 +1.02 +0.85
Maternal Mortality (MMEIG) 88.2 18 +0.11 +0.03
Access to Sanitation (WHO/UNICEF) 45.1 40 +0.20 +0.18
Undernourishment (WB) 100.0 1 +0.88 0.00
Disease (WHO) 82.4 36 +1.49 +0.68
Immunisation (WB/WHO) 88.0 22 -0.76 -0.63
Antiretroviral Treatment (ART) Provision (UNAIDS) 50.0 34 +3.94 +2.58
HUMAN DEVELOPMENT
*AAT: Annual Average Trend
If AAT appears the same in the two time periods, differences exist beyond the 2nd decimal place.
For a full list of data sources see Annex.
Increasing Improvement Slowing Improvement Warning Signs Bouncing Back Slowing Deterioration Increasing Deterioration No Change

130
2017 IIAG Guinea Scores, Ranks & Trends
OVERALL GOVERNANCE
45.5 39th2016 SCORE 2016 RANK
+0.54 +0.1810 -YEAR AAT* 5-YEAR AAT
SAFETY & RULE OF LAW 51.0 32 +0.56 +0.03
RULE OF LAW 49.5 34 +1.23 +2.25
Judicial Independence (BS/WEF/V-Dem/GI) 30.1 38 +0.19 -1.23
Judicial Process (EIU/GI) 41.7 26 0.00 0.00
Access to Justice (V-Dem) 27.3 45 -0.26 -1.48
Property Rights (BS/HER/WEF/AfDB/WB) 31.2 48 +0.04 -0.43
Transfers of Power (EIU) 66.7 8 +7.41 +16.68
Multilateral Sanctions (CDD) 100.0 1 0.00 0.00
ACCOUNTABILITY 18.5 43 +0.28 -1.48
Access to Information (GI) 12.5 41 -1.86 -4.18
Online Public Services (UNDESA) 11.8 42 +0.41 +2.95
Public Sector Accountability & Transparency (V-Dem/AfDB/WB)
34.7 38 +1.37 -1.68
Accountability of Public Officials (EIU/BS) 38.1 17 +4.23 -0.90
Corruption in Government & Public Officials (EIU) 0.0 38 0.00 0.00
Corruption & Bureaucracy (WB) 19.0 33 +0.52 -2.40
Diversion of Public Funds (WEF) 10.4 39 -2.18 -4.90
Corruption Investigation (GI/AFR) 21.2 37 -0.32 -0.73
PERSONAL SAFETY 47.0 31 0.00 -0.23
Safety of the Person (EIU/AFR) 48.4 27 -0.78 +1.38
Police Services (WEF/GI) 24.4 41 +0.01 +0.03
Social Unrest (EIU/ACLED) 65.3 20 +1.10 +1.83
Crime (EIU/AFR) 44.0 42 +0.26 +0.58
Political Violence (ACLED/PTS) 75.0 22 +2.21 +1.15
Human Trafficking (USDS) 25.0 21 -2.78 -6.25
NATIONAL SECURITY 89.2 17 +0.71 -0.43
Government Involvement in Armed Conflict (UCDP) 88.9 19 -1.23 -2.78
Domestic Armed Conflict (EIU) 75.0 9 0.00 0.00
Violence by Non-state Actors (ACLED) 100.0 1 0.00 +0.33
Cross-border Tensions (EIU) 75.0 9 +5.56 0.00
Internally Displaced People (IDMC) 100.0 1 +0.14 0.00
Political Refugees (UNHCR) 96.5 37 -0.17 -0.10
SAFETY & RULE OF LAW
SCORE 2016
RANK 2016
10 -YEAR AAT
5-YEAR AAT
SCORE 2016
RANK 2016
10 -YEAR AAT
5-YEAR AAT
PARTICIPATION & HUMAN RIGHTS 47.9 30 +1.18 +0.35
PARTICIPATION 52.7 28 +3.07 +1.43
Political Participation (EIU/FH/V-Dem) 63.4 23 +2.44 +1.63
Civil Society Participation (BS/V-Dem/GI) 70.4 21 +1.92 +0.18
Free & Fair Elections (BS/CDD/V-Dem) 42.9 33 +3.13 -1.08
Election Monitoring Agencies (V-Dem/GI) 31.2 37 +2.91 +2.25
Legitimacy of Political Process (BS) 55.6 16 +4.94 +4.18
RIGHTS 42.1 31 +1.20 +1.33
Freedom of Expression (BS/RSF/V-Dem/GI) 68.2 23 +0.56 -1.48
Freedom of Association & Assembly (BS/GI) 46.5 22 +0.69 +0.85
Civil Liberties (BS/FH ) 41.7 29 +1.39 +0.80
Human Rights Conventions (UNOLA/OHCHR) 71.4 16 +3.17 +4.75
Human Rights Violations (EIU) 25.0 25 +2.78 +6.25
Protection against Discrimination (GI) 0.0 36 -1.39 -3.13
GENDER 48.9 36 -0.72 -1.70
Gender Equality (AfDB/WB) 51.3 31 -0.41 0.00
Women's Political Participation (IPU/GI/WB) 46.8 18 +2.01 +4.43
Gender Balance in Education (UNESCO) 47.3 45 +0.56 +0.13
Women's Labour Force Participation (WB) 87.7 8 +2.22 +3.98
Workplace Gender Equality (GI) 50.0 4 0.00 0.00
Women in the Judiciary (GI) 25.0 36 -8.33 -18.75
Laws on Violence against Women (OECD) 33.3 29 -1.86 -3.65
Women's Political Empowerment (V-Dem) 49.6 42 +0.04 +0.23
PARTICIPATION & HUMAN RIGHTS
SCORE 2016
RANK 2016
10 -YEAR AAT
5-YEAR AAT
SUSTAINABLE ECONOMIC OPPORTUNITY 37.0 42 -0.10 +0.20
PUBLIC MANAGEMENT 49.9 18 +0.29 +0.85
Governmental Statistical Capacity (WB) 50.7 34 -0.81 -0.73
Civil Registration (GI) 87.5 5 +2.78 +6.25
Public Administration (AfDB/WB) 53.6 29 -0.52 +0.38
Diversification (AfDB/OECD/UNDP) 3.6 33 -0.01 -0.23
Budget Management (AfDB/WB) 59.1 28 +0.31 +0.70
Budget Balance (AfDB/AUC/UNECA) 53.4 9 -1.01 +1.83
Fiscal Policy (AfDB/WB) 69.0 20 +0.61 -1.40
Revenue Mobilisation (ICTD/UNU-WIDER/AfDB/WB) 46.9 29 +1.20 +0.68
Transparency of State-owned Companies (GI) 25.0 7 0.00 0.00
BUSINESS ENVIRONMENT 38.3 36 +0.02 -0.18
Investment Climate (HER) 55.6 31 +1.24 +1.40
Competition (BS/GI/AfDB/WB) 43.1 36 -0.28 -0.78
Business Bureaucracy & Red Tape (EIU) 0.0 31 0.00 0.00
Customs Procedures (WEF) 39.3 31 +0.01 +0.03
Soundness of Banks (WEF) 29.1 33 -1.08 -2.43
Employment Creation (AFR) 26.1 26 +0.29 +0.65
Regional Integration (AfDB) 75.0 8 0.00 0.00
INFRASTRUCTURE 24.5 45 +0.44 +0.48
Transport Infrastructure (WEF/AFR/EIU/GI) 22.9 47 +0.20 +0.45
Electricity Infrastructure (WEF/AFR) 6.7 43 +0.07 +0.15
Digital & IT Infrastructure (EIU/ITU) 15.8 44 +1.40 +1.88
Access to Improved Water (WHO/UNICEF) 60.9 27 +0.92 +0.78
Water & Sanitation Services (AFR) 16.3 30 -0.37 -0.83
RURAL SECTOR 35.1 48 -1.17 -0.43
Rural Land & Water (IFAD) 14.7 51 -3.21 0.00
Rural Business Climate (IFAD) 29.2 49 -2.64 +0.28
Rural Development Resources (IFAD) 25.0 46 -0.03 -3.13
Agricultural Support System (IFAD) 55.9 24 -0.12 0.00
Agricultural Policy Costs (WEF) 44.8 26 -1.56 -3.50
Engagement with Rural Organisations (IFAD) 62.4 19 +0.63 0.00
Gender Balance in Rural Decision-making (IFAD) 25.0 45 +0.30 0.00
Rural Accountability & Transparency (IFAD) 24.2 46 -2.69 +3.03
SUSTAINABLE ECONOMIC OPPORTUNITY
SCORE 2016
RANK 2016
10 -YEAR AAT
5-YEAR AAT
HUMAN DEVELOPMENT 45.9 45 +0.52 +0.08
WELFARE 44.2 35 +1.08 +0.88
Welfare Services (AfDB/WB) 61.7 36 +1.01 0.00
Social Safety Nets (BS) 46.2 17 +2.57 +0.98
Social Protection & Labour (AfDB/WB) 53.0 27 +0.24 0.00
Social Exclusion (BS) 0.0 33 0.00 0.00
Poverty (AFR) 42.8 26 +0.53 +1.20
Poverty Reduction Priorities (AFR/AfDB/WB) 44.9 38 +0.70 +0.78
Narrowing Income Gaps (AFR) 42.8 9 +0.66 +1.48
Environmental Policy (BS) 42.9 14 +1.59 0.00
Environmental Sustainability (AfDB/WB) 63.9 31 +2.47 +3.48
EDUCATION 31.2 50 +0.07 -0.45
Education Provision (AFR) 39.3 23 -0.52 -1.18
Education Quality (BS) 16.7 35 0.00 -2.08
Educational System Management (WEF) 16.3 35 -0.80 -1.80
Human Resources in Primary Schools (UNESCO) 62.3 42 -0.02 -0.58
Primary School Completion (WB) 46.1 36 +0.32 +0.40
Secondary School Enrolment (UNESCO) 32.1 35 +0.59 +0.30
Tertiary Education Enrolment (UNESCO) 17.4 17 +0.56 +0.40
Literacy (WB) 19.9 50 +0.46 +0.95
HEALTH 62.2 44 +0.41 -0.23
Basic Health Services (AFR) 41.1 26 +0.64 +1.45
Public Health Campaigns (GI) 75.0 14 -2.78 -6.25
Child Mortality (IGME) 63.9 43 +1.61 +1.15
Maternal Mortality (MMEIG) 74.6 43 +0.38 +0.15
Access to Sanitation (WHO/UNICEF) 51.0 33 +0.80 +0.68
Undernourishment (WB) 79.5 24 +0.86 +0.50
Disease (WHO) 84.7 29 +0.12 +0.03
Immunisation (WB/WHO) 46.5 50 -0.93 -2.88
Antiretroviral Treatment (ART) Provision (UNAIDS) 43.7 37 +3.06 +3.23
HUMAN DEVELOPMENT
*AAT: Annual Average Trend
If AAT appears the same in the two time periods, differences exist beyond the 2nd decimal place.
For a full list of data sources see Annex.
Increasing Improvement Slowing Improvement Warning Signs Bouncing Back Slowing Deterioration Increasing Deterioration No Change
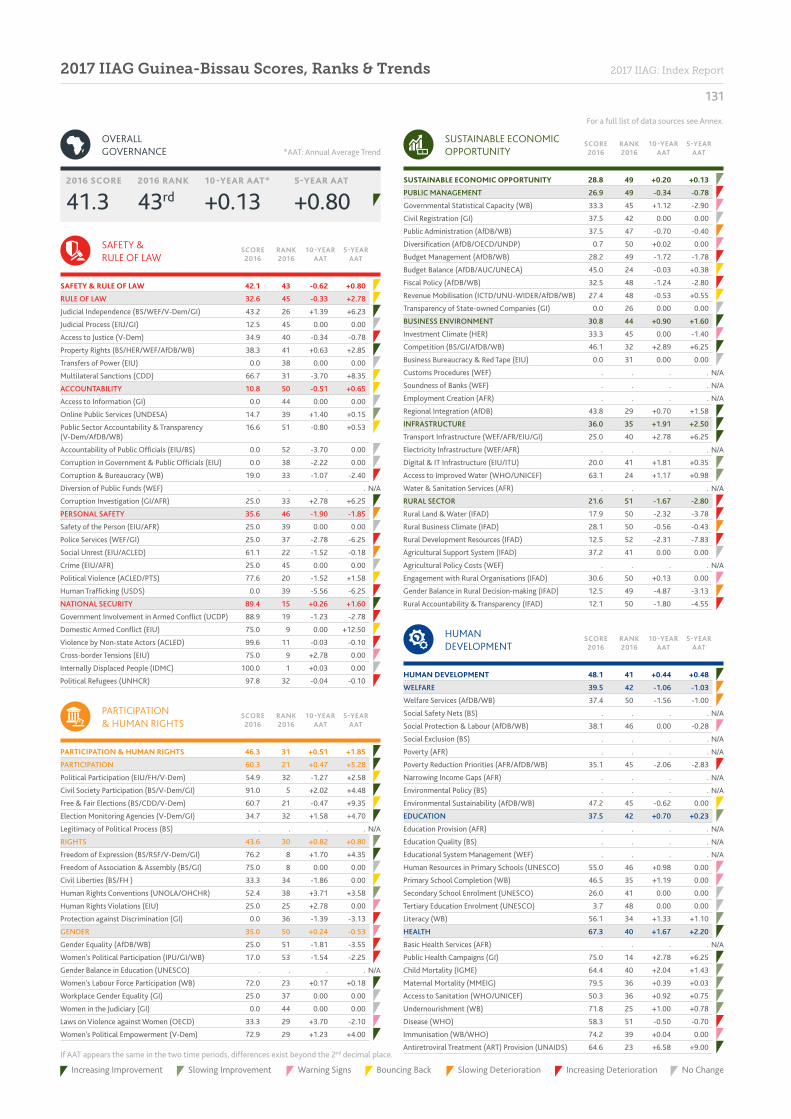
131
2017 IIAG: Index Report2017 IIAG Guinea-Bissau Scores, Ranks & Trends
OVERALL GOVERNANCE
41.3 43rd2016 SCORE 2016 RANK
+0.13 +0.8010 -YEAR AAT* 5-YEAR AAT
SAFETY & RULE OF LAW 42.1 43 -0.62 +0.80
RULE OF LAW 32.6 45 -0.33 +2.78
Judicial Independence (BS/WEF/V-Dem/GI) 43.2 26 +1.39 +6.23
Judicial Process (EIU/GI) 12.5 45 0.00 0.00
Access to Justice (V-Dem) 34.9 40 -0.34 -0.78
Property Rights (BS/HER/WEF/AfDB/WB) 38.3 41 +0.63 +2.85
Transfers of Power (EIU) 0.0 38 0.00 0.00
Multilateral Sanctions (CDD) 66.7 31 -3.70 +8.35
ACCOUNTABILITY 10.8 50 -0.51 +0.65
Access to Information (GI) 0.0 44 0.00 0.00
Online Public Services (UNDESA) 14.7 39 +1.40 +0.15
Public Sector Accountability & Transparency (V-Dem/AfDB/WB)
16.6 51 -0.80 +0.53
Accountability of Public Officials (EIU/BS) 0.0 52 -3.70 0.00
Corruption in Government & Public Officials (EIU) 0.0 38 -2.22 0.00
Corruption & Bureaucracy (WB) 19.0 33 -1.07 -2.40
Diversion of Public Funds (WEF) . . . .
Corruption Investigation (GI/AFR) 25.0 33 +2.78 +6.25
PERSONAL SAFETY 35.6 46 -1.90 -1.85
Safety of the Person (EIU/AFR) 25.0 39 0.00 0.00
Police Services (WEF/GI) 25.0 37 -2.78 -6.25
Social Unrest (EIU/ACLED) 61.1 22 -1.52 -0.18
Crime (EIU/AFR) 25.0 45 0.00 0.00
Political Violence (ACLED/PTS) 77.6 20 -1.52 +1.58
Human Trafficking (USDS) 0.0 39 -5.56 -6.25
NATIONAL SECURITY 89.4 15 +0.26 +1.60
Government Involvement in Armed Conflict (UCDP) 88.9 19 -1.23 -2.78
Domestic Armed Conflict (EIU) 75.0 9 0.00 +12.50
Violence by Non-state Actors (ACLED) 99.6 11 -0.03 -0.10
Cross-border Tensions (EIU) 75.0 9 +2.78 0.00
Internally Displaced People (IDMC) 100.0 1 +0.03 0.00
Political Refugees (UNHCR) 97.8 32 -0.04 -0.10
SAFETY & RULE OF LAW
SCORE 2016
RANK 2016
10 -YEAR AAT
5-YEAR AAT
SCORE 2016
RANK 2016
10 -YEAR AAT
5-YEAR AAT
PARTICIPATION & HUMAN RIGHTS 46.3 31 +0.51 +1.85
PARTICIPATION 60.3 21 +0.47 +5.28
Political Participation (EIU/FH/V-Dem) 54.9 32 -1.27 +2.58
Civil Society Participation (BS/V-Dem/GI) 91.0 5 +2.02 +4.48
Free & Fair Elections (BS/CDD/V-Dem) 60.7 21 -0.47 +9.35
Election Monitoring Agencies (V-Dem/GI) 34.7 32 +1.58 +4.70
Legitimacy of Political Process (BS) . . . .
RIGHTS 43.6 30 +0.82 +0.80
Freedom of Expression (BS/RSF/V-Dem/GI) 76.2 8 +1.70 +4.35
Freedom of Association & Assembly (BS/GI) 75.0 8 0.00 0.00
Civil Liberties (BS/FH ) 33.3 34 -1.86 0.00
Human Rights Conventions (UNOLA/OHCHR) 52.4 38 +3.71 +3.58
Human Rights Violations (EIU) 25.0 25 +2.78 0.00
Protection against Discrimination (GI) 0.0 36 -1.39 -3.13
GENDER 35.0 50 +0.24 -0.53
Gender Equality (AfDB/WB) 25.0 51 -1.81 -3.55
Women's Political Participation (IPU/GI/WB) 17.0 53 -1.54 -2.25
Gender Balance in Education (UNESCO) . . . .
Women's Labour Force Participation (WB) 72.0 23 +0.17 +0.18
Workplace Gender Equality (GI) 25.0 37 0.00 0.00
Women in the Judiciary (GI) 0.0 44 0.00 0.00
Laws on Violence against Women (OECD) 33.3 29 +3.70 -2.10
Women's Political Empowerment (V-Dem) 72.9 29 +1.23 +4.00
PARTICIPATION & HUMAN RIGHTS
SCORE 2016
RANK 2016
10 -YEAR AAT
5-YEAR AAT
SUSTAINABLE ECONOMIC OPPORTUNITY 28.8 49 +0.20 +0.13
PUBLIC MANAGEMENT 26.9 49 -0.34 -0.78
Governmental Statistical Capacity (WB) 33.3 45 +1.12 -2.90
Civil Registration (GI) 37.5 42 0.00 0.00
Public Administration (AfDB/WB) 37.5 47 -0.70 -0.40
Diversification (AfDB/OECD/UNDP) 0.7 50 +0.02 0.00
Budget Management (AfDB/WB) 28.2 49 -1.72 -1.78
Budget Balance (AfDB/AUC/UNECA) 45.0 24 -0.03 +0.38
Fiscal Policy (AfDB/WB) 32.5 48 -1.24 -2.80
Revenue Mobilisation (ICTD/UNU-WIDER/AfDB/WB) 27.4 48 -0.53 +0.55
Transparency of State-owned Companies (GI) 0.0 26 0.00 0.00
BUSINESS ENVIRONMENT 30.8 44 +0.90 +1.60
Investment Climate (HER) 33.3 45 0.00 -1.40
Competition (BS/GI/AfDB/WB) 46.1 32 +2.89 +6.25
Business Bureaucracy & Red Tape (EIU) 0.0 31 0.00 0.00
Customs Procedures (WEF) . . . .
Soundness of Banks (WEF) . . . .
Employment Creation (AFR) . . . .
Regional Integration (AfDB) 43.8 29 +0.70 +1.58
INFRASTRUCTURE 36.0 35 +1.91 +2.50
Transport Infrastructure (WEF/AFR/EIU/GI) 25.0 40 +2.78 +6.25
Electricity Infrastructure (WEF/AFR) . . . .
Digital & IT Infrastructure (EIU/ITU) 20.0 41 +1.81 +0.35
Access to Improved Water (WHO/UNICEF) 63.1 24 +1.17 +0.98
Water & Sanitation Services (AFR) . . . .
RURAL SECTOR 21.6 51 -1.67 -2.80
Rural Land & Water (IFAD) 17.9 50 -2.32 -3.78
Rural Business Climate (IFAD) 28.1 50 -0.56 -0.43
Rural Development Resources (IFAD) 12.5 52 -2.31 -7.83
Agricultural Support System (IFAD) 37.2 41 0.00 0.00
Agricultural Policy Costs (WEF) . . . .
Engagement with Rural Organisations (IFAD) 30.6 50 +0.13 0.00
Gender Balance in Rural Decision-making (IFAD) 12.5 49 -4.87 -3.13
Rural Accountability & Transparency (IFAD) 12.1 50 -1.80 -4.55
SUSTAINABLE ECONOMIC OPPORTUNITY
SCORE 2016
RANK 2016
10 -YEAR AAT
5-YEAR AAT
HUMAN DEVELOPMENT 48.1 41 +0.44 +0.48
WELFARE 39.5 42 -1.06 -1.03
Welfare Services (AfDB/WB) 37.4 50 -1.56 -1.00
Social Safety Nets (BS) . . . .
Social Protection & Labour (AfDB/WB) 38.1 46 0.00 -0.28
Social Exclusion (BS) . . . .
Poverty (AFR) . . . .
Poverty Reduction Priorities (AFR/AfDB/WB) 35.1 45 -2.06 -2.83
Narrowing Income Gaps (AFR) . . . .
Environmental Policy (BS) . . . .
Environmental Sustainability (AfDB/WB) 47.2 45 -0.62 0.00
EDUCATION 37.5 42 +0.70 +0.23
Education Provision (AFR) . . . .
Education Quality (BS) . . . .
Educational System Management (WEF) . . . .
Human Resources in Primary Schools (UNESCO) 55.0 46 +0.98 0.00
Primary School Completion (WB) 46.5 35 +1.19 0.00
Secondary School Enrolment (UNESCO) 26.0 41 0.00 0.00
Tertiary Education Enrolment (UNESCO) 3.7 48 0.00 0.00
Literacy (WB) 56.1 34 +1.33 +1.10
HEALTH 67.3 40 +1.67 +2.20
Basic Health Services (AFR) . . . .
Public Health Campaigns (GI) 75.0 14 +2.78 +6.25
Child Mortality (IGME) 64.4 40 +2.04 +1.43
Maternal Mortality (MMEIG) 79.5 36 +0.39 +0.03
Access to Sanitation (WHO/UNICEF) 50.3 36 +0.92 +0.75
Undernourishment (WB) 71.8 25 +1.00 +0.78
Disease (WHO) 58.3 51 -0.50 -0.70
Immunisation (WB/WHO) 74.2 39 +0.04 0.00
Antiretroviral Treatment (ART) Provision (UNAIDS) 64.6 23 +6.58 +9.00
HUMAN DEVELOPMENT
N/A
N/A
N/A
N/A
N/A
N/A
N/A
N/A
N/A
N/A
N/A
N/A
N/A
N/A
N/A
N/A
N/A
N/A
*AAT: Annual Average Trend
If AAT appears the same in the two time periods, differences exist beyond the 2nd decimal place.
For a full list of data sources see Annex.
Increasing Improvement Slowing Improvement Warning Signs Bouncing Back Slowing Deterioration Increasing Deterioration No Change
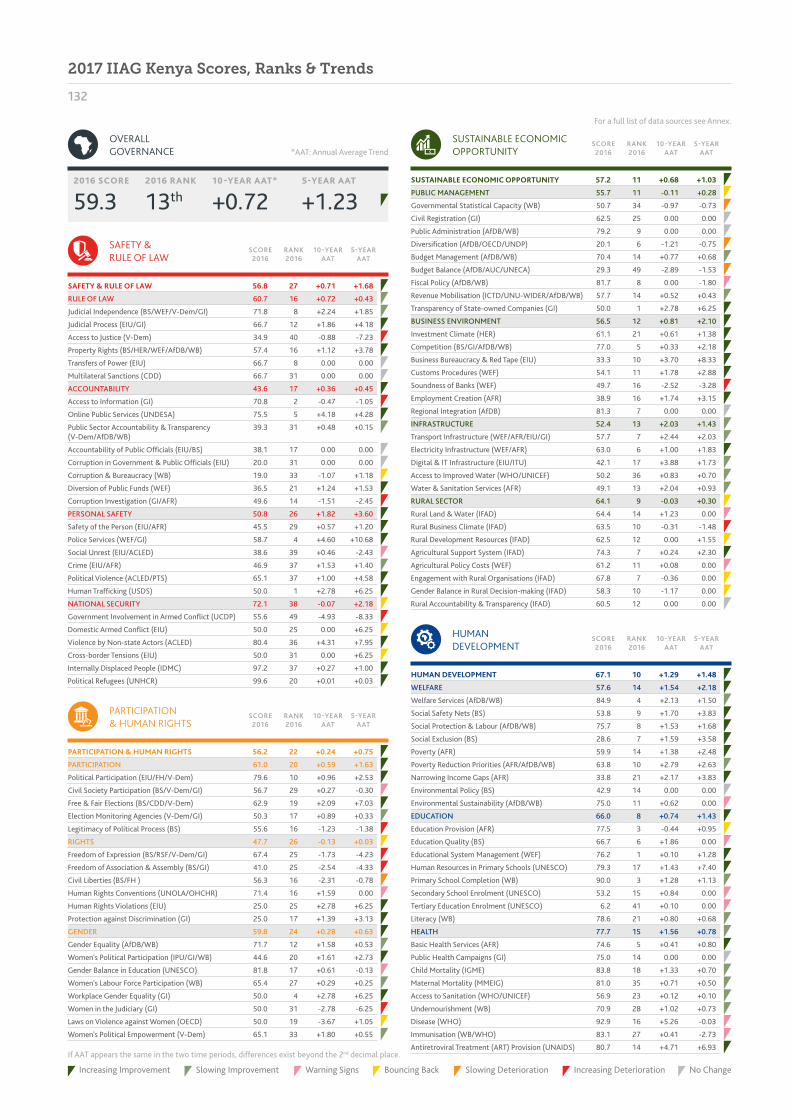
132
2017 IIAG Kenya Scores, Ranks & Trends
OVERALL GOVERNANCE
59.3 13th2016 SCORE 2016 RANK
+0.72 +1.2310 -YEAR AAT* 5-YEAR AAT
SAFETY & RULE OF LAW 56.8 27 +0.71 +1.68
RULE OF LAW 60.7 16 +0.72 +0.43
Judicial Independence (BS/WEF/V-Dem/GI) 71.8 8 +2.24 +1.85
Judicial Process (EIU/GI) 66.7 12 +1.86 +4.18
Access to Justice (V-Dem) 34.9 40 -0.88 -7.23
Property Rights (BS/HER/WEF/AfDB/WB) 57.4 16 +1.12 +3.78
Transfers of Power (EIU) 66.7 8 0.00 0.00
Multilateral Sanctions (CDD) 66.7 31 0.00 0.00
ACCOUNTABILITY 43.6 17 +0.36 +0.45
Access to Information (GI) 70.8 2 -0.47 -1.05
Online Public Services (UNDESA) 75.5 5 +4.18 +4.28
Public Sector Accountability & Transparency (V-Dem/AfDB/WB)
39.3 31 +0.48 +0.15
Accountability of Public Officials (EIU/BS) 38.1 17 0.00 0.00
Corruption in Government & Public Officials (EIU) 20.0 31 0.00 0.00
Corruption & Bureaucracy (WB) 19.0 33 -1.07 +1.18
Diversion of Public Funds (WEF) 36.5 21 +1.24 +1.53
Corruption Investigation (GI/AFR) 49.6 14 -1.51 -2.45
PERSONAL SAFETY 50.8 26 +1.82 +3.60
Safety of the Person (EIU/AFR) 45.5 29 +0.57 +1.20
Police Services (WEF/GI) 58.7 4 +4.60 +10.68
Social Unrest (EIU/ACLED) 38.6 39 +0.46 -2.43
Crime (EIU/AFR) 46.9 37 +1.53 +1.40
Political Violence (ACLED/PTS) 65.1 37 +1.00 +4.58
Human Trafficking (USDS) 50.0 1 +2.78 +6.25
NATIONAL SECURITY 72.1 38 -0.07 +2.18
Government Involvement in Armed Conflict (UCDP) 55.6 49 -4.93 -8.33
Domestic Armed Conflict (EIU) 50.0 25 0.00 +6.25
Violence by Non-state Actors (ACLED) 80.4 36 +4.31 +7.95
Cross-border Tensions (EIU) 50.0 31 0.00 +6.25
Internally Displaced People (IDMC) 97.2 37 +0.27 +1.00
Political Refugees (UNHCR) 99.6 20 +0.01 +0.03
SAFETY & RULE OF LAW
SCORE 2016
RANK 2016
10 -YEAR AAT
5-YEAR AAT
SCORE 2016
RANK 2016
10 -YEAR AAT
5-YEAR AAT
PARTICIPATION & HUMAN RIGHTS 56.2 22 +0.24 +0.75
PARTICIPATION 61.0 20 +0.59 +1.63
Political Participation (EIU/FH/V-Dem) 79.6 10 +0.96 +2.53
Civil Society Participation (BS/V-Dem/GI) 56.7 29 +0.27 -0.30
Free & Fair Elections (BS/CDD/V-Dem) 62.9 19 +2.09 +7.03
Election Monitoring Agencies (V-Dem/GI) 50.3 17 +0.89 +0.33
Legitimacy of Political Process (BS) 55.6 16 -1.23 -1.38
RIGHTS 47.7 26 -0.13 +0.03
Freedom of Expression (BS/RSF/V-Dem/GI) 67.4 25 -1.73 -4.23
Freedom of Association & Assembly (BS/GI) 41.0 25 -2.54 -4.33
Civil Liberties (BS/FH ) 56.3 16 -2.31 -0.78
Human Rights Conventions (UNOLA/OHCHR) 71.4 16 +1.59 0.00
Human Rights Violations (EIU) 25.0 25 +2.78 +6.25
Protection against Discrimination (GI) 25.0 17 +1.39 +3.13
GENDER 59.8 24 +0.28 +0.63
Gender Equality (AfDB/WB) 71.7 12 +1.58 +0.53
Women's Political Participation (IPU/GI/WB) 44.6 20 +1.61 +2.73
Gender Balance in Education (UNESCO) 81.8 17 +0.61 -0.13
Women's Labour Force Participation (WB) 65.4 27 +0.29 +0.25
Workplace Gender Equality (GI) 50.0 4 +2.78 +6.25
Women in the Judiciary (GI) 50.0 31 -2.78 -6.25
Laws on Violence against Women (OECD) 50.0 19 -3.67 +1.05
Women's Political Empowerment (V-Dem) 65.1 33 +1.80 +0.55
PARTICIPATION & HUMAN RIGHTS
SCORE 2016
RANK 2016
10 -YEAR AAT
5-YEAR AAT
SUSTAINABLE ECONOMIC OPPORTUNITY 57.2 11 +0.68 +1.03
PUBLIC MANAGEMENT 55.7 11 -0.11 +0.28
Governmental Statistical Capacity (WB) 50.7 34 -0.97 -0.73
Civil Registration (GI) 62.5 25 0.00 0.00
Public Administration (AfDB/WB) 79.2 9 0.00 0.00
Diversification (AfDB/OECD/UNDP) 20.1 6 -1.21 -0.75
Budget Management (AfDB/WB) 70.4 14 +0.77 +0.68
Budget Balance (AfDB/AUC/UNECA) 29.3 49 -2.89 -1.53
Fiscal Policy (AfDB/WB) 81.7 8 0.00 -1.80
Revenue Mobilisation (ICTD/UNU-WIDER/AfDB/WB) 57.7 14 +0.52 +0.43
Transparency of State-owned Companies (GI) 50.0 1 +2.78 +6.25
BUSINESS ENVIRONMENT 56.5 12 +0.81 +2.10
Investment Climate (HER) 61.1 21 +0.61 +1.38
Competition (BS/GI/AfDB/WB) 77.0 5 +0.33 +2.18
Business Bureaucracy & Red Tape (EIU) 33.3 10 +3.70 +8.33
Customs Procedures (WEF) 54.1 11 +1.78 +2.88
Soundness of Banks (WEF) 49.7 16 -2.52 -3.28
Employment Creation (AFR) 38.9 16 +1.74 +3.15
Regional Integration (AfDB) 81.3 7 0.00 0.00
INFRASTRUCTURE 52.4 13 +2.03 +1.43
Transport Infrastructure (WEF/AFR/EIU/GI) 57.7 7 +2.44 +2.03
Electricity Infrastructure (WEF/AFR) 63.0 6 +1.00 +1.83
Digital & IT Infrastructure (EIU/ITU) 42.1 17 +3.88 +1.73
Access to Improved Water (WHO/UNICEF) 50.2 36 +0.83 +0.70
Water & Sanitation Services (AFR) 49.1 13 +2.04 +0.93
RURAL SECTOR 64.1 9 -0.03 +0.30
Rural Land & Water (IFAD) 64.4 14 +1.23 0.00
Rural Business Climate (IFAD) 63.5 10 -0.31 -1.48
Rural Development Resources (IFAD) 62.5 12 0.00 +1.55
Agricultural Support System (IFAD) 74.3 7 +0.24 +2.30
Agricultural Policy Costs (WEF) 61.2 11 +0.08 0.00
Engagement with Rural Organisations (IFAD) 67.8 7 -0.36 0.00
Gender Balance in Rural Decision-making (IFAD) 58.3 10 -1.17 0.00
Rural Accountability & Transparency (IFAD) 60.5 12 0.00 0.00
SUSTAINABLE ECONOMIC OPPORTUNITY
SCORE 2016
RANK 2016
10 -YEAR AAT
5-YEAR AAT
HUMAN DEVELOPMENT 67.1 10 +1.29 +1.48
WELFARE 57.6 14 +1.54 +2.18
Welfare Services (AfDB/WB) 84.9 4 +2.13 +1.50
Social Safety Nets (BS) 53.8 9 +1.70 +3.83
Social Protection & Labour (AfDB/WB) 75.7 8 +1.53 +1.68
Social Exclusion (BS) 28.6 7 +1.59 +3.58
Poverty (AFR) 59.9 14 +1.38 +2.48
Poverty Reduction Priorities (AFR/AfDB/WB) 63.8 10 +2.79 +2.63
Narrowing Income Gaps (AFR) 33.8 21 +2.17 +3.83
Environmental Policy (BS) 42.9 14 0.00 0.00
Environmental Sustainability (AfDB/WB) 75.0 11 +0.62 0.00
EDUCATION 66.0 8 +0.74 +1.43
Education Provision (AFR) 77.5 3 -0.44 +0.95
Education Quality (BS) 66.7 6 +1.86 0.00
Educational System Management (WEF) 76.2 1 +0.10 +1.28
Human Resources in Primary Schools (UNESCO) 79.3 17 +1.43 +7.40
Primary School Completion (WB) 90.0 3 +1.28 +1.13
Secondary School Enrolment (UNESCO) 53.2 15 +0.84 0.00
Tertiary Education Enrolment (UNESCO) 6.2 41 +0.10 0.00
Literacy (WB) 78.6 21 +0.80 +0.68
HEALTH 77.7 15 +1.56 +0.78
Basic Health Services (AFR) 74.6 5 +0.41 +0.80
Public Health Campaigns (GI) 75.0 14 0.00 0.00
Child Mortality (IGME) 83.8 18 +1.33 +0.70
Maternal Mortality (MMEIG) 81.0 35 +0.71 +0.50
Access to Sanitation (WHO/UNICEF) 56.9 23 +0.12 +0.10
Undernourishment (WB) 70.9 28 +1.02 +0.73
Disease (WHO) 92.9 16 +5.26 -0.03
Immunisation (WB/WHO) 83.1 27 +0.41 -2.73
Antiretroviral Treatment (ART) Provision (UNAIDS) 80.7 14 +4.71 +6.93
HUMAN DEVELOPMENT
*AAT: Annual Average Trend
If AAT appears the same in the two time periods, differences exist beyond the 2nd decimal place.
For a full list of data sources see Annex.
Increasing Improvement Slowing Improvement Warning Signs Bouncing Back Slowing Deterioration Increasing Deterioration No Change

133
2017 IIAG: Index Report2017 IIAG Lesotho Scores, Ranks & Trends
OVERALL GOVERNANCE
58.2 15th2016 SCORE 2016 RANK
+0.04 -0.1010 -YEAR AAT* 5-YEAR AAT
SAFETY & RULE OF LAW 66.6 8 +0.02 -0.55
RULE OF LAW 64.1 13 -0.41 -0.98
Judicial Independence (BS/WEF/V-Dem/GI) 64.6 11 +0.81 +2.70
Judicial Process (EIU/GI) 58.3 14 -2.78 -6.25
Access to Justice (V-Dem) 60.9 30 -2.18 -5.45
Property Rights (BS/HER/WEF/AfDB/WB) 67.7 9 +1.73 +3.20
Transfers of Power (EIU) 33.3 20 0.00 0.00
Multilateral Sanctions (CDD) 100.0 1 0.00 0.00
ACCOUNTABILITY 55.0 10 +0.19 +0.03
Access to Information (GI) 41.7 13 +1.86 +4.18
Online Public Services (UNDESA) 18.6 35 -2.58 -5.53
Public Sector Accountability & Transparency (V-Dem/AfDB/WB)
60.3 17 -0.11 -0.80
Accountability of Public Officials (EIU/BS) 52.4 11 -1.06 0.00
Corruption in Government & Public Officials (EIU) 80.0 3 0.00 0.00
Corruption & Bureaucracy (WB) 76.2 2 +0.53 -2.38
Diversion of Public Funds (WEF) 56.7 9 +3.19 +5.65
Corruption Investigation (GI/AFR) 54.1 9 -0.31 -1.00
PERSONAL SAFETY 59.8 9 +0.77 +0.70
Safety of the Person (EIU/AFR) 58.0 16 -1.99 -1.35
Police Services (WEF/GI) 54.1 8 +4.19 +9.35
Social Unrest (EIU/ACLED) 75.0 6 0.00 +0.30
Crime (EIU/AFR) 46.8 38 -0.59 -2.03
Political Violence (ACLED/PTS) 75.0 22 +0.19 -1.98
Human Trafficking (USDS) 50.0 1 +2.78 0.00
NATIONAL SECURITY 87.4 21 -0.48 -2.00
Government Involvement in Armed Conflict (UCDP) 100.0 1 0.00 0.00
Domestic Armed Conflict (EIU) 50.0 25 -5.56 -6.25
Violence by Non-state Actors (ACLED) 99.1 17 -0.10 +0.43
Cross-border Tensions (EIU) 75.0 9 +2.78 -6.25
Internally Displaced People (IDMC) 100.0 1 0.00 0.00
Political Refugees (UNHCR) 100.0 1 0.00 0.00
SAFETY & RULE OF LAW
SCORE 2016
RANK 2016
10 -YEAR AAT
5-YEAR AAT
SCORE 2016
RANK 2016
10 -YEAR AAT
5-YEAR AAT
PARTICIPATION & HUMAN RIGHTS 64.6 12 +0.09 +0.18
PARTICIPATION 68.8 12 +0.56 -0.68
Political Participation (EIU/FH/V-Dem) 80.9 9 +0.86 -0.25
Civil Society Participation (BS/V-Dem/GI) 67.0 24 -0.56 -1.25
Free & Fair Elections (BS/CDD/V-Dem) 82.9 7 +2.21 +0.35
Election Monitoring Agencies (V-Dem/GI) 80.0 3 +2.77 +6.15
Legitimacy of Political Process (BS) 33.3 23 -2.48 -8.35
RIGHTS 52.6 17 -0.28 +0.43
Freedom of Expression (BS/RSF/V-Dem/GI) 63.8 29 -0.51 -1.65
Freedom of Association & Assembly (BS/GI) 58.3 18 +0.61 +0.68
Civil Liberties (BS/FH ) 64.6 12 0.00 0.00
Human Rights Conventions (UNOLA/OHCHR) 66.7 22 +1.07 +3.58
Human Rights Violations (EIU) 50.0 7 -2.78 0.00
Protection against Discrimination (GI) 12.5 30 0.00 0.00
GENDER 72.4 7 -0.03 +0.80
Gender Equality (AfDB/WB) 81.7 8 +0.47 +1.05
Women's Political Participation (IPU/GI/WB) 46.9 17 -0.50 -2.50
Gender Balance in Education (UNESCO) 89.9 4 -0.26 -0.05
Women's Labour Force Participation (WB) 61.7 29 -0.02 +0.23
Workplace Gender Equality (GI) 75.0 2 +2.78 +6.25
Women in the Judiciary (GI) 100.0 1 0.00 0.00
Laws on Violence against Women (OECD) 41.7 22 -3.70 0.00
Women's Political Empowerment (V-Dem) 82.5 14 +1.01 +1.45
PARTICIPATION & HUMAN RIGHTS
SCORE 2016
RANK 2016
10 -YEAR AAT
5-YEAR AAT
SUSTAINABLE ECONOMIC OPPORTUNITY 46.5 26 -0.08 -0.60
PUBLIC MANAGEMENT 54.9 12 +0.32 -0.08
Governmental Statistical Capacity (WB) 53.6 32 -0.49 -4.73
Civil Registration (GI) 87.5 5 0.00 0.00
Public Administration (AfDB/WB) 66.1 15 +0.87 0.00
Diversification (AfDB/OECD/UNDP) 7.4 21 -0.01 -0.43
Budget Management (AfDB/WB) 57.7 29 +0.16 -1.80
Budget Balance (AfDB/AUC/UNECA) 54.1 8 -3.41 +0.45
Fiscal Policy (AfDB/WB) 60.3 29 -1.77 -0.40
Revenue Mobilisation (ICTD/UNU-WIDER/AfDB/WB) 82.1 1 +4.79 -0.05
Transparency of State-owned Companies (GI) 25.0 7 +2.78 +6.25
BUSINESS ENVIRONMENT 38.2 37 -1.19 -3.58
Investment Climate (HER) 55.6 31 +2.48 +1.40
Competition (BS/GI/AfDB/WB) 42.5 38 -2.68 -6.00
Business Bureaucracy & Red Tape (EIU) 33.3 10 -3.71 -8.35
Customs Procedures (WEF) 42.5 25 +2.09 -0.03
Soundness of Banks (WEF) 0.0 41 -6.84 -14.73
Employment Creation (AFR) 25.1 27 +0.34 +2.78
Regional Integration (AfDB) 68.8 10 0.00 0.00
INFRASTRUCTURE 39.9 25 +0.56 +1.60
Transport Infrastructure (WEF/AFR/EIU/GI) 31.5 31 +1.02 +0.45
Electricity Infrastructure (WEF/AFR) 34.1 24 +0.51 -0.18
Digital & IT Infrastructure (EIU/ITU) 45.0 14 +2.60 +3.38
Access to Improved Water (WHO/UNICEF) 66.0 21 +0.37 +0.33
Water & Sanitation Services (AFR) 22.8 27 -1.73 +3.95
RURAL SECTOR 52.8 26 -0.02 -0.38
Rural Land & Water (IFAD) 42.3 41 -0.14 +0.80
Rural Business Climate (IFAD) 55.1 27 +0.71 -0.70
Rural Development Resources (IFAD) 50.0 25 -0.48 -1.58
Agricultural Support System (IFAD) 55.9 24 -0.24 0.00
Agricultural Policy Costs (WEF) 52.4 22 +2.19 +4.80
Engagement with Rural Organisations (IFAD) 56.5 29 +0.28 0.00
Gender Balance in Rural Decision-making (IFAD) 50.0 13 -2.78 -6.25
Rural Accountability & Transparency (IFAD) 60.5 12 +0.29 0.00
SUSTAINABLE ECONOMIC OPPORTUNITY
SCORE 2016
RANK 2016
10 -YEAR AAT
5-YEAR AAT
HUMAN DEVELOPMENT 55.1 31 +0.17 +0.53
WELFARE 46.6 31 +0.18 +1.23
Welfare Services (AfDB/WB) 71.7 21 0.00 +0.50
Social Safety Nets (BS) 53.8 9 +0.84 +1.90
Social Protection & Labour (AfDB/WB) 57.5 20 +0.13 +0.30
Social Exclusion (BS) 14.3 20 0.00 0.00
Poverty (AFR) 38.1 30 +0.32 +2.60
Poverty Reduction Priorities (AFR/AfDB/WB) 47.5 33 +0.16 +1.10
Narrowing Income Gaps (AFR) 29.8 25 +0.77 +4.55
Environmental Policy (BS) 42.9 14 0.00 0.00
Environmental Sustainability (AfDB/WB) 63.9 31 -0.61 0.00
EDUCATION 50.9 24 -0.20 +0.55
Education Provision (AFR) 35.3 25 -5.86 +0.18
Education Quality (BS) 33.3 21 -1.86 -2.10
Educational System Management (WEF) 57.7 11 +3.03 +4.60
Human Resources in Primary Schools (UNESCO) 76.5 21 +0.52 +0.28
Primary School Completion (WB) 61.3 20 +0.21 +1.10
Secondary School Enrolment (UNESCO) 46.7 23 +1.30 +0.13
Tertiary Education Enrolment (UNESCO) 15.7 21 +0.88 -0.40
Literacy (WB) 80.3 18 +0.17 +0.55
HEALTH 67.9 38 +0.53 -0.18
Basic Health Services (AFR) 47.2 20 -2.03 +1.58
Public Health Campaigns (GI) 50.0 33 -2.78 -6.25
Child Mortality (IGME) 65.5 39 +1.46 +0.45
Maternal Mortality (MMEIG) 81.9 32 +0.93 +0.58
Access to Sanitation (WHO/UNICEF) 53.9 28 +1.62 +1.35
Undernourishment (WB) 88.8 19 -0.09 -0.05
Disease (WHO) 65.0 50 +0.78 0.00
Immunisation (WB/WHO) 92.1 15 +0.72 -0.45
Antiretroviral Treatment (ART) Provision (UNAIDS) 66.7 22 +4.19 +1.23
HUMAN DEVELOPMENT
*AAT: Annual Average Trend
If AAT appears the same in the two time periods, differences exist beyond the 2nd decimal place.
For a full list of data sources see Annex.
Increasing Improvement Slowing Improvement Warning Signs Bouncing Back Slowing Deterioration Increasing Deterioration No Change

134
2017 IIAG Liberia Scores, Ranks & Trends
OVERALL GOVERNANCE
51.4 28th2016 SCORE 2016 RANK
+0.72 +0.1810 -YEAR AAT* 5-YEAR AAT
SAFETY & RULE OF LAW 61.4 19 +1.34 +0.63
RULE OF LAW 62.1 15 +1.84 +1.73
Judicial Independence (BS/WEF/V-Dem/GI) 52.1 20 +0.27 +0.25
Judicial Process (EIU/GI) 66.7 12 +1.86 0.00
Access to Justice (V-Dem) 67.3 26 +0.39 +0.88
Property Rights (BS/HER/WEF/AfDB/WB) 53.3 23 +1.18 +0.98
Transfers of Power (EIU) 33.3 20 0.00 0.00
Multilateral Sanctions (CDD) 100.0 1 +7.41 +8.33
ACCOUNTABILITY 43.1 19 +1.52 +1.05
Access to Information (GI) 41.7 13 +4.63 +10.43
Online Public Services (UNDESA) 32.4 23 +2.49 +1.70
Public Sector Accountability & Transparency (V-Dem/AfDB/WB)
53.9 21 -0.22 -1.00
Accountability of Public Officials (EIU/BS) 53.6 10 +3.58 +2.10
Corruption in Government & Public Officials (EIU) 20.0 31 +2.22 -5.00
Corruption & Bureaucracy (WB) 38.1 17 -0.53 -1.20
Diversion of Public Funds (WEF) 58.7 5 -1.18 -2.65
Corruption Investigation (GI/AFR) 46.4 17 +1.22 +4.15
PERSONAL SAFETY 51.4 24 -0.42 -0.48
Safety of the Person (EIU/AFR) 44.4 32 -1.56 -3.50
Police Services (WEF/GI) 42.9 20 +2.22 +5.00
Social Unrest (EIU/ACLED) 51.6 32 -2.52 -5.20
Crime (EIU/AFR) 48.0 34 -0.37 -1.58
Political Violence (ACLED/PTS) 71.3 32 -0.31 -3.93
Human Trafficking (USDS) 50.0 1 0.00 +6.25
NATIONAL SECURITY 88.9 18 +2.40 +0.13
Government Involvement in Armed Conflict (UCDP) 88.9 19 -1.23 -2.78
Domestic Armed Conflict (EIU) 75.0 9 +2.78 0.00
Violence by Non-state Actors (ACLED) 98.3 22 -0.14 -0.43
Cross-border Tensions (EIU) 75.0 9 +5.56 0.00
Internally Displaced People (IDMC) 100.0 1 +0.67 +1.35
Political Refugees (UNHCR) 96.5 37 +6.82 +2.60
SAFETY & RULE OF LAW
SCORE 2016
RANK 2016
10 -YEAR AAT
5-YEAR AAT
SCORE 2016
RANK 2016
10 -YEAR AAT
5-YEAR AAT
PARTICIPATION & HUMAN RIGHTS 57.7 18 +0.20 +0.15
PARTICIPATION 67.5 13 +0.32 +0.23
Political Participation (EIU/FH/V-Dem) 78.2 11 +1.91 +0.63
Civil Society Participation (BS/V-Dem/GI) 82.6 10 -0.77 -1.70
Free & Fair Elections (BS/CDD/V-Dem) 65.6 15 -1.53 0.00
Election Monitoring Agencies (V-Dem/GI) 55.4 15 +0.72 +2.20
Legitimacy of Political Process (BS) 55.6 16 +1.24 0.00
RIGHTS 46.8 27 +0.21 +1.15
Freedom of Expression (BS/RSF/V-Dem/GI) 75.3 10 +0.36 +0.18
Freedom of Association & Assembly (BS/GI) 82.6 3 0.00 0.00
Civil Liberties (BS/FH ) 50.0 20 -0.70 -0.78
Human Rights Conventions (UNOLA/OHCHR) 47.6 42 +1.59 +1.18
Human Rights Violations (EIU) 25.0 25 0.00 +6.25
Protection against Discrimination (GI) 0.0 36 0.00 0.00
GENDER 58.8 25 +0.07 -0.93
Gender Equality (AfDB/WB) 49.2 35 +0.88 0.00
Women's Political Participation (IPU/GI/WB) 35.8 32 -0.12 -0.55
Gender Balance in Education (UNESCO) 61.4 39 -0.22 -0.70
Women's Labour Force Participation (WB) 59.8 30 -0.02 +0.03
Workplace Gender Equality (GI) 50.0 4 -2.78 -6.25
Women in the Judiciary (GI) 100.0 1 0.00 0.00
Laws on Violence against Women (OECD) 25.0 37 +2.78 0.00
Women's Political Empowerment (V-Dem) 89.1 9 +0.04 +0.08
PARTICIPATION & HUMAN RIGHTS
SCORE 2016
RANK 2016
10 -YEAR AAT
5-YEAR AAT
SUSTAINABLE ECONOMIC OPPORTUNITY 39.6 36 +0.80 +0.65
PUBLIC MANAGEMENT 39.9 38 +0.13 +0.15
Governmental Statistical Capacity (WB) 53.6 32 +5.16 +4.70
Civil Registration (GI) 25.0 47 0.00 0.00
Public Administration (AfDB/WB) 48.4 37 -0.18 0.00
Diversification (AfDB/OECD/UNDP) 7.4 21 +0.46 -1.23
Budget Management (AfDB/WB) 57.7 29 +0.32 +0.38
Budget Balance (AfDB/AUC/UNECA) 52.6 10 -3.34 +0.83
Fiscal Policy (AfDB/WB) 63.5 26 -1.23 -2.78
Revenue Mobilisation (ICTD/UNU-WIDER/AfDB/WB) 50.7 21 +0.02 -0.55
Transparency of State-owned Companies (GI) 0.0 26 0.00 0.00
BUSINESS ENVIRONMENT 41.7 31 +0.40 +0.95
Investment Climate (HER) 55.6 31 +2.48 +8.35
Competition (BS/GI/AfDB/WB) 67.4 7 +4.53 +8.98
Business Bureaucracy & Red Tape (EIU) 0.0 31 0.00 0.00
Customs Procedures (WEF) 48.5 15 -2.61 -5.88
Soundness of Banks (WEF) 38.1 28 -3.03 -6.83
Employment Creation (AFR) 32.6 18 +0.07 -1.03
Regional Integration (AfDB) 50.0 25 +1.39 +3.13
INFRASTRUCTURE 33.7 40 +0.46 +0.43
Transport Infrastructure (WEF/AFR/EIU/GI) 29.2 36 +0.63 -0.58
Electricity Infrastructure (WEF/AFR) 33.4 26 +0.93 +2.10
Digital & IT Infrastructure (EIU/ITU) 22.0 40 +2.12 +1.18
Access to Improved Water (WHO/UNICEF) 64.0 22 +0.58 +0.50
Water & Sanitation Services (AFR) 19.9 29 -1.98 -1.00
RURAL SECTOR 43.2 41 +2.23 +1.08
Rural Land & Water (IFAD) 32.5 49 +2.33 -0.18
Rural Business Climate (IFAD) 48.5 35 +3.60 +2.18
Rural Development Resources (IFAD) 31.3 44 +2.09 0.00
Agricultural Support System (IFAD) 41.9 38 +3.63 +2.38
Agricultural Policy Costs (WEF) 47.9 24 -1.96 -4.40
Engagement with Rural Organisations (IFAD) 39.5 46 +2.04 0.00
Gender Balance in Rural Decision-making (IFAD) 37.5 36 +2.08 +2.63
Rural Accountability & Transparency (IFAD) 66.6 8 +4.03 +6.05
SUSTAINABLE ECONOMIC OPPORTUNITY
SCORE 2016
RANK 2016
10 -YEAR AAT
5-YEAR AAT
HUMAN DEVELOPMENT 47.0 44 +0.58 -0.65
WELFARE 39.1 43 +0.72 -0.88
Welfare Services (AfDB/WB) 56.6 40 +1.24 -0.50
Social Safety Nets (BS) 38.5 22 +3.42 0.00
Social Protection & Labour (AfDB/WB) 41.4 42 -0.26 -0.28
Social Exclusion (BS) 0.0 33 0.00 0.00
Poverty (AFR) 31.2 33 -2.29 -5.13
Poverty Reduction Priorities (AFR/AfDB/WB) 40.4 43 -0.92 -3.55
Narrowing Income Gaps (AFR) 30.9 24 +0.26 +1.25
Environmental Policy (BS) 57.1 7 +3.17 +1.78
Environmental Sustainability (AfDB/WB) 55.6 38 +1.86 -1.38
EDUCATION 43.6 33 +0.01 -1.63
Education Provision (AFR) 43.6 20 -2.34 -7.38
Education Quality (BS) 50.0 11 +5.56 +2.08
Educational System Management (WEF) 42.4 20 -2.13 -4.80
Human Resources in Primary Schools (UNESCO) 79.5 15 -0.54 -1.08
Primary School Completion (WB) 43.1 40 -0.47 -1.08
Secondary School Enrolment (UNESCO) 30.6 37 -0.46 -1.33
Tertiary Education Enrolment (UNESCO) 18.7 16 -0.12 0.00
Literacy (WB) 41.0 43 +0.63 +0.53
HEALTH 58.2 47 +0.98 +0.53
Basic Health Services (AFR) 50.5 17 -1.19 -5.28
Public Health Campaigns (GI) 100.0 1 +5.56 +12.50
Child Mortality (IGME) 74.6 29 +1.89 +1.18
Maternal Mortality (MMEIG) 72.9 47 +0.70 +0.60
Access to Sanitation (WHO/UNICEF) 33.1 46 +0.53 +0.45
Undernourishment (WB) 51.6 36 +1.18 +1.03
Disease (WHO) 40.8 54 -3.58 -3.75
Immunisation (WB/WHO) 52.0 48 -1.31 -6.68
Antiretroviral Treatment (ART) Provision (UNAIDS) 48.3 35 +5.04 +4.75
HUMAN DEVELOPMENT
*AAT: Annual Average Trend
If AAT appears the same in the two time periods, differences exist beyond the 2nd decimal place.
For a full list of data sources see Annex.
Increasing Improvement Slowing Improvement Warning Signs Bouncing Back Slowing Deterioration Increasing Deterioration No Change

135
2017 IIAG: Index Report2017 IIAG Libya Scores, Ranks & Trends
OVERALL GOVERNANCE
33.3 49th2016 SCORE 2016 RANK
-1.48 -2.9510 -YEAR AAT* 5-YEAR AAT
SAFETY & RULE OF LAW 24.3 50 -2.57 -4.05
RULE OF LAW 21.4 52 -0.83 -2.18
Judicial Independence (BS/WEF/V-Dem/GI) 32.9 35 +1.23 +1.63
Judicial Process (EIU/GI) 25.0 41 0.00 0.00
Access to Justice (V-Dem) 27.9 43 +0.52 -3.03
Property Rights (BS/HER/WEF/AfDB/WB) 9.3 53 -3.03 -3.25
Transfers of Power (EIU) 0.0 38 0.00 -8.33
Multilateral Sanctions (CDD) 33.3 50 -3.71 0.00
ACCOUNTABILITY 12.8 48 -0.64 -1.55
Access to Information (GI) 0.0 44 -1.39 -3.13
Online Public Services (UNDESA) 14.7 39 +0.83 +3.68
Public Sector Accountability & Transparency (V-Dem/AfDB/WB)
26.2 43 -0.43 +0.30
Accountability of Public Officials (EIU/BS) 23.8 44 +0.27 -2.68
Corruption in Government & Public Officials (EIU) 0.0 38 0.00 -5.00
Corruption & Bureaucracy (WB) 0.0 50 -4.77 -7.15
Diversion of Public Funds (WEF) 12.4 37 -2.49 -4.85
Corruption Investigation (GI/AFR) 25.0 33 +2.78 +6.25
PERSONAL SAFETY 14.1 52 -4.98 -5.13
Safety of the Person (EIU/AFR) 0.0 47 -11.11 -6.25
Police Services (WEF/GI) 0.4 48 -1.80 -3.70
Social Unrest (EIU/ACLED) 36.2 42 -5.61 -4.68
Crime (EIU/AFR) 0.0 51 -5.56 -12.50
Political Violence (ACLED/PTS) 48.2 46 -2.98 -3.58
Human Trafficking (USDS) 0.0 39 -2.78 0.00
NATIONAL SECURITY 48.9 48 -3.82 -7.38
Government Involvement in Armed Conflict (UCDP) 77.8 33 -2.47 -5.55
Domestic Armed Conflict (EIU) 0.0 49 -8.33 -6.25
Violence by Non-state Actors (ACLED) 53.8 41 -5.13 -6.65
Cross-border Tensions (EIU) 12.5 53 -4.17 -15.63
Internally Displaced People (IDMC) 52.6 46 -2.56 -9.88
Political Refugees (UNHCR) 96.5 37 -0.30 -0.35
SAFETY & RULE OF LAW
SCORE 2016
RANK 2016
10 -YEAR AAT
5-YEAR AAT
SCORE 2016
RANK 2016
10 -YEAR AAT
5-YEAR AAT
PARTICIPATION & HUMAN RIGHTS 27.6 47 +0.92 -1.85
PARTICIPATION 33.2 38 +2.27 -2.93
Political Participation (EIU/FH/V-Dem) 35.8 44 +3.13 -7.30
Civil Society Participation (BS/V-Dem/GI) 44.1 35 +3.04 -0.45
Free & Fair Elections (BS/CDD/V-Dem) 49.8 31 +4.36 -1.68
Election Monitoring Agencies (V-Dem/GI) 36.3 30 +0.81 -2.45
Legitimacy of Political Process (BS) 0.0 40 0.00 -2.78
RIGHTS 22.2 48 +0.31 -1.85
Freedom of Expression (BS/RSF/V-Dem/GI) 48.3 37 +3.26 -1.63
Freedom of Association & Assembly (BS/GI) 29.2 33 +1.23 -1.38
Civil Liberties (BS/FH ) 8.3 50 -0.47 -4.43
Human Rights Conventions (UNOLA/OHCHR) 47.6 42 -2.12 -3.58
Human Rights Violations (EIU) 0.0 39 0.00 0.00
Protection against Discrimination (GI) 0.0 36 0.00 0.00
GENDER 27.3 53 +0.18 -0.83
Gender Equality (AfDB/WB) 25.0 51 -1.39 0.00
Women's Political Participation (IPU/GI/WB) 26.7 45 +1.60 +0.90
Gender Balance in Education (UNESCO) 77.1 27 0.00 0.00
Women's Labour Force Participation (WB) 20.7 47 -0.21 -0.38
Workplace Gender Equality (GI) 25.0 37 +2.78 +6.25
Women in the Judiciary (GI) 0.0 44 -5.56 -12.50
Laws on Violence against Women (OECD) 8.3 44 +0.92 -1.05
Women's Political Empowerment (V-Dem) 35.7 48 +3.32 +0.20
PARTICIPATION & HUMAN RIGHTS
SCORE 2016
RANK 2016
10 -YEAR AAT
5-YEAR AAT
SUSTAINABLE ECONOMIC OPPORTUNITY 21.5 52 -2.64 -4.08
PUBLIC MANAGEMENT 15.5 53 -3.02 -3.25
Governmental Statistical Capacity (WB) 7.2 53 -2.74 -4.73
Civil Registration (GI) 75.0 10 0.00 0.00
Public Administration (AfDB/WB) 0.0 53 -5.56 0.00
Diversification (AfDB/OECD/UNDP) 2.2 40 +0.19 +0.45
Budget Management (AfDB/WB) 0.0 54 -3.70 0.00
Budget Balance (AfDB/AUC/UNECA) 0.0 53 -11.11 -25.00
Fiscal Policy (AfDB/WB) 44.4 44 -2.48 0.00
Revenue Mobilisation (ICTD/UNU-WIDER/AfDB/WB) 10.5 54 -1.78 0.00
Transparency of State-owned Companies (GI) 0.0 26 0.00 0.00
BUSINESS ENVIRONMENT 11.7 52 -2.47 -3.60
Investment Climate (HER) 5.6 51 -3.08 -1.38
Competition (BS/GI/AfDB/WB) 15.0 52 -1.18 -1.68
Business Bureaucracy & Red Tape (EIU) 8.3 30 -2.78 -6.25
Customs Procedures (WEF) 21.2 39 -1.29 -4.53
Soundness of Banks (WEF) 8.3 39 -4.00 -4.15
Employment Creation (AFR) . . . .
Regional Integration (AfDB) . . . .
INFRASTRUCTURE 45.8 16 -1.28 -2.80
Transport Infrastructure (WEF/AFR/EIU/GI) 10.1 52 -4.91 -3.60
Electricity Infrastructure (WEF/AFR) 34.2 22 -3.12 -7.78
Digital & IT Infrastructure (EIU/ITU) 42.6 16 +2.91 +0.13
Access to Improved Water (WHO/UNICEF) 96.3 3 0.00 0.00
Water & Sanitation Services (AFR) . . . .
RURAL SECTOR 13.2 53 -3.79 -6.65
Rural Land & Water (IFAD) . . . .
Rural Business Climate (IFAD) . . . .
Rural Development Resources (IFAD) . . . .
Agricultural Support System (IFAD) . . . .
Agricultural Policy Costs (WEF) 13.2 41 -3.79 -6.65
Engagement with Rural Organisations (IFAD) . . . .
Gender Balance in Rural Decision-making (IFAD) . . . .
Rural Accountability & Transparency (IFAD) . . . .
SUSTAINABLE ECONOMIC OPPORTUNITY
SCORE 2016
RANK 2016
10 -YEAR AAT
5-YEAR AAT
HUMAN DEVELOPMENT 59.7 18 -1.66 -1.88
WELFARE 25.2 51 -4.03 -4.13
Welfare Services (AfDB/WB) 48.0 46 -1.33 0.00
Social Safety Nets (BS) 15.4 39 -7.69 -18.28
Social Protection & Labour (AfDB/WB) 22.2 51 -2.47 0.00
Social Exclusion (BS) 28.6 7 -4.76 -8.93
Poverty (AFR) . . . .
Poverty Reduction Priorities (AFR/AfDB/WB) 0.0 54 -8.33 0.00
Narrowing Income Gaps (AFR) . . . .
Environmental Policy (BS) 28.6 26 0.00 -1.78
Environmental Sustainability (AfDB/WB) 33.3 50 -3.71 0.00
EDUCATION 64.4 9 -1.28 -2.25
Education Provision (AFR) . . . .
Education Quality (BS) 33.3 21 -5.56 -10.43
Educational System Management (WEF) 0.0 41 -1.43 -1.28
Human Resources in Primary Schools (UNESCO) . . . .
Primary School Completion (WB) . . . .
Secondary School Enrolment (UNESCO) 93.4 1 0.00 0.00
Tertiary Education Enrolment (UNESCO) 100.0 1 0.00 0.00
Literacy (WB) 95.1 5 +0.59 +0.45
HEALTH 89.5 3 +0.34 +0.78
Basic Health Services (AFR) . . . .
Public Health Campaigns (GI) 50.0 33 +2.78 +6.25
Child Mortality (IGME) 100.0 1 +0.34 +0.20
Maternal Mortality (MMEIG) 100.0 1 0.00 0.00
Access to Sanitation (WHO/UNICEF) 99.8 2 0.00 0.00
Undernourishment (WB) . . . .
Disease (WHO) 93.0 14 -0.56 -0.68
Immunisation (WB/WHO) 94.0 11 -0.54 -1.23
Antiretroviral Treatment (ART) Provision (UNAIDS) . . . .
HUMAN DEVELOPMENT
N/A
N/A
N/A
N/A
N/A
N/A
N/A
N/A
N/A
N/A
N/A
N/A
N/A
N/A
N/A
N/A
N/A
N/A
*AAT: Annual Average Trend
If AAT appears the same in the two time periods, differences exist beyond the 2nd decimal place.
For a full list of data sources see Annex.
Increasing Improvement Slowing Improvement Warning Signs Bouncing Back Slowing Deterioration Increasing Deterioration No Change

136
2017 IIAG Madagascar Scores, Ranks & Trends
OVERALL GOVERNANCE
49.3 32nd2016 SCORE 2016 RANK
-0.73 +0.8310 -YEAR AAT* 5-YEAR AAT
SAFETY & RULE OF LAW 54.7 29 -0.96 +1.85
RULE OF LAW 55.8 25 -0.23 +5.60
Judicial Independence (BS/WEF/V-Dem/GI) 30.6 37 -0.37 +0.95
Judicial Process (EIU/GI) 58.3 14 +1.84 0.00
Access to Justice (V-Dem) 38.1 39 -1.30 -1.45
Property Rights (BS/HER/WEF/AfDB/WB) 41.1 37 -1.57 +0.75
Transfers of Power (EIU) 66.7 8 0.00 +16.68
Multilateral Sanctions (CDD) 100.0 1 0.00 +16.68
ACCOUNTABILITY 35.0 27 -1.01 -0.93
Access to Information (GI) 41.7 13 +3.24 +7.30
Online Public Services (UNDESA) 30.4 24 +0.04 -3.23
Public Sector Accountability & Transparency (V-Dem/AfDB/WB)
30.8 39 -2.30 +1.73
Accountability of Public Officials (EIU/BS) 38.1 17 -3.18 -0.90
Corruption in Government & Public Officials (EIU) 60.0 9 +2.22 -5.00
Corruption & Bureaucracy (WB) 38.1 17 -3.70 -4.75
Diversion of Public Funds (WEF) 24.6 28 -0.93 +0.73
Corruption Investigation (GI/AFR) 16.7 38 -3.41 -3.25
PERSONAL SAFETY 39.3 38 -1.81 +1.10
Safety of the Person (EIU/AFR) 25.0 39 -1.54 -0.35
Police Services (WEF/GI) 10.6 46 -2.56 -1.50
Social Unrest (EIU/ACLED) 60.8 23 -1.27 -1.13
Crime (EIU/AFR) 23.5 49 -3.23 -2.65
Political Violence (ACLED/PTS) 66.0 36 -2.29 -0.23
Human Trafficking (USDS) 50.0 1 0.00 +12.50
NATIONAL SECURITY 88.7 19 -0.79 +1.65
Government Involvement in Armed Conflict (UCDP) 88.9 19 -1.23 -2.78
Domestic Armed Conflict (EIU) 75.0 9 0.00 +6.25
Violence by Non-state Actors (ACLED) 93.5 31 -0.72 +0.23
Cross-border Tensions (EIU) 75.0 9 -2.78 +6.25
Internally Displaced People (IDMC) 100.0 1 0.00 0.00
Political Refugees (UNHCR) 100.0 1 0.00 0.00
SAFETY & RULE OF LAW
SCORE 2016
RANK 2016
10 -YEAR AAT
5-YEAR AAT
SCORE 2016
RANK 2016
10 -YEAR AAT
5-YEAR AAT
PARTICIPATION & HUMAN RIGHTS 61.8 15 +0.11 +2.75
PARTICIPATION 63.1 16 -0.33 +6.38
Political Participation (EIU/FH/V-Dem) 74.2 14 +0.54 +4.20
Civil Society Participation (BS/V-Dem/GI) 81.0 13 +1.31 +6.38
Free & Fair Elections (BS/CDD/V-Dem) 55.0 26 -0.39 +8.50
Election Monitoring Agencies (V-Dem/GI) 38.7 27 -0.64 -1.03
Legitimacy of Political Process (BS) 66.7 12 -2.47 +13.90
RIGHTS 48.8 23 -0.71 +0.83
Freedom of Expression (BS/RSF/V-Dem/GI) 64.4 28 -0.79 +0.53
Freedom of Association & Assembly (BS/GI) 34.7 31 -3.86 -3.83
Civil Liberties (BS/FH ) 50.0 20 -2.31 +0.78
Human Rights Conventions (UNOLA/OHCHR) 81.0 6 +2.66 +1.20
Human Rights Violations (EIU) 50.0 7 0.00 +6.25
Protection against Discrimination (GI) 12.5 30 0.00 0.00
GENDER 73.4 6 +1.36 +0.98
Gender Equality (AfDB/WB) 71.3 14 +0.42 +1.48
Women's Political Participation (IPU/GI/WB) 42.2 22 +1.38 -0.68
Gender Balance in Education (UNESCO) 81.8 17 +0.63 +0.63
Women's Labour Force Participation (WB) 93.4 3 -0.24 -0.03
Workplace Gender Equality (GI) 50.0 4 0.00 0.00
Women in the Judiciary (GI) 100.0 1 +2.78 +6.25
Laws on Violence against Women (OECD) 66.7 6 +4.63 -1.03
Women's Political Empowerment (V-Dem) 81.9 17 +1.30 +1.28
PARTICIPATION & HUMAN RIGHTS
SCORE 2016
RANK 2016
10 -YEAR AAT
5-YEAR AAT
SUSTAINABLE ECONOMIC OPPORTUNITY 37.9 40 -0.98 -0.63
PUBLIC MANAGEMENT 43.2 34 -0.90 +0.28
Governmental Statistical Capacity (WB) 59.4 27 -0.49 -0.73
Civil Registration (GI) 75.0 10 0.00 0.00
Public Administration (AfDB/WB) 46.9 39 -2.89 +0.40
Diversification (AfDB/OECD/UNDP) 14.3 9 -2.28 -3.25
Budget Management (AfDB/WB) 49.4 40 -2.18 +3.93
Budget Balance (AfDB/AUC/UNECA) 51.4 14 +0.76 +3.00
Fiscal Policy (AfDB/WB) 50.8 37 -1.23 -1.38
Revenue Mobilisation (ICTD/UNU-WIDER/AfDB/WB) 41.2 38 +0.16 +0.43
Transparency of State-owned Companies (GI) 0.0 26 0.00 0.00
BUSINESS ENVIRONMENT 34.3 42 -1.51 -0.98
Investment Climate (HER) 61.1 21 -1.86 0.00
Competition (BS/GI/AfDB/WB) 43.8 33 -0.77 +1.10
Business Bureaucracy & Red Tape (EIU) 0.0 31 -3.70 -8.33
Customs Procedures (WEF) 36.4 33 +0.71 -0.35
Soundness of Banks (WEF) 43.6 22 -3.22 -1.30
Employment Creation (AFR) 11.2 33 -2.48 +0.35
Regional Integration (AfDB) 43.8 29 +0.70 +1.58
INFRASTRUCTURE 20.7 49 -0.76 -1.38
Transport Infrastructure (WEF/AFR/EIU/GI) 34.8 29 +0.03 +0.78
Electricity Infrastructure (WEF/AFR) 7.3 42 -0.50 -1.53
Digital & IT Infrastructure (EIU/ITU) 10.8 47 -0.88 -3.38
Access to Improved Water (WHO/UNICEF) 40.8 42 +1.06 +0.90
Water & Sanitation Services (AFR) 9.7 32 -3.49 -3.75
RURAL SECTOR 53.4 25 -0.77 -0.38
Rural Land & Water (IFAD) 61.3 19 +1.23 +0.75
Rural Business Climate (IFAD) 55.1 27 -1.78 -0.93
Rural Development Resources (IFAD) 37.5 39 -4.17 -3.13
Agricultural Support System (IFAD) 74.3 7 -0.53 0.00
Agricultural Policy Costs (WEF) 41.4 31 -2.04 -0.13
Engagement with Rural Organisations (IFAD) 59.4 23 +0.36 +2.50
Gender Balance in Rural Decision-making (IFAD) 50.0 13 +0.69 -2.08
Rural Accountability & Transparency (IFAD) 48.4 26 +0.16 0.00
SUSTAINABLE ECONOMIC OPPORTUNITY
SCORE 2016
RANK 2016
10 -YEAR AAT
5-YEAR AAT
HUMAN DEVELOPMENT 42.8 50 -1.09 -0.70
WELFARE 37.5 44 -1.52 +1.10
Welfare Services (AfDB/WB) 55.7 41 -1.78 +2.78
Social Safety Nets (BS) 38.5 22 +0.86 0.00
Social Protection & Labour (AfDB/WB) 51.9 28 -1.29 +3.58
Social Exclusion (BS) 14.3 20 -1.59 0.00
Poverty (AFR) 27.1 34 -1.69 -0.43
Poverty Reduction Priorities (AFR/AfDB/WB) 27.6 52 -2.66 -0.35
Narrowing Income Gaps (AFR) 9.4 32 -1.51 +0.63
Environmental Policy (BS) 57.1 7 -1.59 +3.55
Environmental Sustainability (AfDB/WB) 55.6 38 -2.47 0.00
EDUCATION 38.6 41 -0.39 -1.00
Education Provision (AFR) 22.8 31 -6.43 -6.38
Education Quality (BS) 33.3 21 0.00 -2.10
Educational System Management (WEF) 30.7 27 +0.03 -0.40
Human Resources in Primary Schools (UNESCO) 67.3 29 +0.96 +0.55
Primary School Completion (WB) 53.7 28 +0.94 -0.05
Secondary School Enrolment (UNESCO) 31.7 36 +1.30 +0.10
Tertiary Education Enrolment (UNESCO) 7.4 39 +0.27 +0.28
Literacy (WB) 62.1 33 -0.17 +0.03
HEALTH 52.4 50 -1.33 -2.18
Basic Health Services (AFR) 23.9 33 -6.41 -7.15
Public Health Campaigns (GI) 50.0 33 -5.56 -12.50
Child Mortality (IGME) 83.7 19 +1.06 +0.65
Maternal Mortality (MMEIG) 87.0 22 +0.54 +0.48
Access to Sanitation (WHO/UNICEF) 28.4 48 -0.02 0.00
Undernourishment (WB) 49.6 39 0.00 -0.45
Disease (WHO) 82.7 35 +0.34 +0.25
Immunisation (WB/WHO) 61.9 45 -2.22 -0.48
Antiretroviral Treatment (ART) Provision (UNAIDS) 4.6 50 +0.27 -0.33
HUMAN DEVELOPMENT
*AAT: Annual Average Trend
If AAT appears the same in the two time periods, differences exist beyond the 2nd decimal place.
For a full list of data sources see Annex.
Increasing Improvement Slowing Improvement Warning Signs Bouncing Back Slowing Deterioration Increasing Deterioration No Change

137
2017 IIAG: Index Report2017 IIAG Malawi Scores, Ranks & Trends
OVERALL GOVERNANCE
57.0 18th2016 SCORE 2016 RANK
0.00 -0.2310 -YEAR AAT* 5-YEAR AAT
SAFETY & RULE OF LAW 62.7 17 -0.79 -0.53
RULE OF LAW 73.2 10 +0.26 +1.48
Judicial Independence (BS/WEF/V-Dem/GI) 60.8 16 -1.09 -0.78
Judicial Process (EIU/GI) 83.3 5 +2.78 +6.25
Access to Justice (V-Dem) 72.9 22 +0.18 +1.45
Property Rights (BS/HER/WEF/AfDB/WB) 55.5 17 -0.34 -0.15
Transfers of Power (EIU) 66.7 8 0.00 +2.10
Multilateral Sanctions (CDD) 100.0 1 0.00 0.00
ACCOUNTABILITY 33.2 30 -0.86 -1.68
Access to Information (GI) 41.7 13 0.00 0.00
Online Public Services (UNDESA) 29.4 25 +0.19 +0.05
Public Sector Accountability & Transparency (V-Dem/AfDB/WB)
37.8 36 -0.68 -1.03
Accountability of Public Officials (EIU/BS) 45.2 12 0.00 -1.80
Corruption in Government & Public Officials (EIU) 0.0 38 -2.22 -5.00
Corruption & Bureaucracy (WB) 38.1 17 +1.06 -1.20
Diversion of Public Funds (WEF) 21.2 32 -4.13 -3.80
Corruption Investigation (GI/AFR) 52.3 11 -1.08 -0.60
PERSONAL SAFETY 49.4 28 -2.00 -0.70
Safety of the Person (EIU/AFR) 51.0 23 -0.24 -0.55
Police Services (WEF/GI) 20.1 43 -2.23 -3.23
Social Unrest (EIU/ACLED) 50.9 33 -2.58 -4.95
Crime (EIU/AFR) 36.8 43 -2.16 -3.30
Political Violence (ACLED/PTS) 87.5 6 +0.72 +1.55
Human Trafficking (USDS) 50.0 1 -5.56 +6.25
NATIONAL SECURITY 95.0 6 -0.56 -1.23
Government Involvement in Armed Conflict (UCDP) 100.0 1 0.00 0.00
Domestic Armed Conflict (EIU) 100.0 1 0.00 0.00
Violence by Non-state Actors (ACLED) 94.8 29 -0.58 -1.20
Cross-border Tensions (EIU) 75.0 9 -2.78 -6.25
Internally Displaced People (IDMC) 100.0 1 0.00 0.00
Political Refugees (UNHCR) 99.9 8 -0.01 -0.03
SAFETY & RULE OF LAW
SCORE 2016
RANK 2016
10 -YEAR AAT
5-YEAR AAT
SCORE 2016
RANK 2016
10 -YEAR AAT
5-YEAR AAT
PARTICIPATION & HUMAN RIGHTS 64.2 13 +0.57 +0.35
PARTICIPATION 64.8 15 -0.01 -0.78
Political Participation (EIU/FH/V-Dem) 72.6 16 +0.78 -0.75
Civil Society Participation (BS/V-Dem/GI) 70.8 20 -0.93 -3.30
Free & Fair Elections (BS/CDD/V-Dem) 60.1 23 +1.89 +1.70
Election Monitoring Agencies (V-Dem/GI) 42.9 22 -0.56 -1.45
Legitimacy of Political Process (BS) 77.8 6 -1.23 0.00
RIGHTS 63.1 8 +1.28 +2.30
Freedom of Expression (BS/RSF/V-Dem/GI) 71.2 15 +0.12 +0.25
Freedom of Association & Assembly (BS/GI) 76.4 5 +0.70 +2.95
Civil Liberties (BS/FH ) 64.6 12 +0.92 +2.08
Human Rights Conventions (UNOLA/OHCHR) 66.7 22 +3.18 +2.40
Human Rights Violations (EIU) 50.0 7 0.00 0.00
Protection against Discrimination (GI) 50.0 3 +2.78 +6.25
GENDER 64.6 20 +0.42 -0.55
Gender Equality (AfDB/WB) 61.3 22 0.00 +0.53
Women's Political Participation (IPU/GI/WB) 36.0 29 -0.29 -2.53
Gender Balance in Education (UNESCO) 82.3 15 +0.08 -0.33
Women's Labour Force Participation (WB) 90.0 6 -0.20 -0.30
Workplace Gender Equality (GI) 25.0 37 0.00 0.00
Women in the Judiciary (GI) 100.0 1 0.00 0.00
Laws on Violence against Women (OECD) 58.3 12 +3.70 0.00
Women's Political Empowerment (V-Dem) 63.8 35 +0.04 -1.78
PARTICIPATION & HUMAN RIGHTS
SCORE 2016
RANK 2016
10 -YEAR AAT
5-YEAR AAT
SUSTAINABLE ECONOMIC OPPORTUNITY 45.9 27 -0.41 -0.78
PUBLIC MANAGEMENT 48.8 21 -0.41 -0.18
Governmental Statistical Capacity (WB) 75.4 7 -0.16 0.00
Civil Registration (GI) 100.0 1 0.00 0.00
Public Administration (AfDB/WB) 56.3 26 -1.84 -2.08
Diversification (AfDB/OECD/UNDP) 2.8 37 -0.13 -0.15
Budget Management (AfDB/WB) 64.9 24 +1.57 +0.75
Budget Balance (AfDB/AUC/UNECA) 37.5 39 -1.97 -0.15
Fiscal Policy (AfDB/WB) 49.2 40 -1.59 -0.40
Revenue Mobilisation (ICTD/UNU-WIDER/AfDB/WB) 53.0 19 +0.41 +0.38
Transparency of State-owned Companies (GI) 0.0 26 0.00 0.00
BUSINESS ENVIRONMENT 45.9 27 -0.69 -0.95
Investment Climate (HER) 61.1 21 +0.61 +1.38
Competition (BS/GI/AfDB/WB) 36.3 40 -1.78 -3.13
Business Bureaucracy & Red Tape (EIU) 33.3 10 0.00 0.00
Customs Procedures (WEF) 43.8 24 +0.09 +1.30
Soundness of Banks (WEF) 47.8 20 -3.86 -5.95
Employment Creation (AFR) 48.7 8 +0.09 -0.23
Regional Integration (AfDB) 50.0 25 0.00 0.00
INFRASTRUCTURE 38.6 28 -0.19 -0.75
Transport Infrastructure (WEF/AFR/EIU/GI) 36.3 26 +0.22 -1.23
Electricity Infrastructure (WEF/AFR) 31.7 28 -0.13 +0.93
Digital & IT Infrastructure (EIU/ITU) 12.4 45 -0.92 -3.00
Access to Improved Water (WHO/UNICEF) 60.7 29 +1.11 +0.93
Water & Sanitation Services (AFR) 52.0 9 -1.21 -1.43
RURAL SECTOR 50.3 30 -0.34 -1.23
Rural Land & Water (IFAD) 58.2 22 +0.61 +0.80
Rural Business Climate (IFAD) 41.8 39 +0.40 -1.40
Rural Development Resources (IFAD) 43.8 32 -1.17 -4.68
Agricultural Support System (IFAD) 55.9 24 +1.31 0.00
Agricultural Policy Costs (WEF) 43.6 27 -4.20 -1.10
Engagement with Rural Organisations (IFAD) 54.4 30 +1.12 0.00
Gender Balance in Rural Decision-making (IFAD) 50.0 13 -1.39 -2.08
Rural Accountability & Transparency (IFAD) 54.5 22 +0.51 -1.50
SUSTAINABLE ECONOMIC OPPORTUNITY
SCORE 2016
RANK 2016
10 -YEAR AAT
5-YEAR AAT
HUMAN DEVELOPMENT 55.2 30 +0.62 +0.05
WELFARE 50.0 24 +0.13 -0.30
Welfare Services (AfDB/WB) 71.7 21 +1.46 +1.00
Social Safety Nets (BS) 46.2 17 +1.71 0.00
Social Protection & Labour (AfDB/WB) 65.7 16 -0.37 +0.55
Social Exclusion (BS) 14.3 20 +1.59 -1.78
Poverty (AFR) 41.0 27 -0.03 -1.95
Poverty Reduction Priorities (AFR/AfDB/WB) 57.8 14 -2.18 +0.38
Narrowing Income Gaps (AFR) 55.2 4 -0.97 -1.03
Environmental Policy (BS) 28.6 26 0.00 0.00
Environmental Sustainability (AfDB/WB) 69.4 18 0.00 0.00
EDUCATION 41.6 37 +0.50 -0.13
Education Provision (AFR) 42.1 21 -2.37 -5.10
Education Quality (BS) 50.0 11 +1.86 +2.08
Educational System Management (WEF) 40.4 22 -1.16 -3.85
Human Resources in Primary Schools (UNESCO) 35.0 51 +1.09 +1.30
Primary School Completion (WB) 63.9 17 +2.29 +1.45
Secondary School Enrolment (UNESCO) 36.5 30 +1.58 +2.18
Tertiary Education Enrolment (UNESCO) 0.9 51 +0.06 0.00
Literacy (WB) 63.7 32 +0.63 +0.85
HEALTH 73.9 21 +1.22 +0.58
Basic Health Services (AFR) 49.2 19 -2.68 -4.93
Public Health Campaigns (GI) 75.0 14 0.00 0.00
Child Mortality (IGME) 77.2 25 +2.03 +1.48
Maternal Mortality (MMEIG) 76.3 41 -0.09 -0.10
Access to Sanitation (WHO/UNICEF) 67.2 16 +0.59 +0.50
Undernourishment (WB) 71.8 25 +0.79 +0.15
Disease (WHO) 77.2 39 +2.58 +1.88
Immunisation (WB/WHO) 87.2 23 +0.26 -1.75
Antiretroviral Treatment (ART) Provision (UNAIDS) 84.0 9 +7.49 +7.98
HUMAN DEVELOPMENT
*AAT: Annual Average Trend
If AAT appears the same in the two time periods, differences exist beyond the 2nd decimal place.
For a full list of data sources see Annex.
Increasing Improvement Slowing Improvement Warning Signs Bouncing Back Slowing Deterioration Increasing Deterioration No Change

138
2017 IIAG Mali Scores, Ranks & Trends
OVERALL GOVERNANCE
51.9 25th2016 SCORE 2016 RANK
-0.27 +0.0310 -YEAR AAT* 5-YEAR AAT
SAFETY & RULE OF LAW 56.2 28 -0.69 +0.80
RULE OF LAW 59.8 17 +0.06 +2.00
Judicial Independence (BS/WEF/V-Dem/GI) 49.5 22 -0.42 +0.83
Judicial Process (EIU/GI) 41.7 26 +1.39 +3.13
Access to Justice (V-Dem) 86.8 10 +0.60 +1.35
Property Rights (BS/HER/WEF/AfDB/WB) 47.3 28 -1.26 +0.38
Transfers of Power (EIU) 66.7 8 0.00 +6.25
Multilateral Sanctions (CDD) 66.7 31 0.00 0.00
ACCOUNTABILITY 39.1 22 -1.21 -2.33
Access to Information (GI) 58.3 6 -2.78 -6.25
Online Public Services (UNDESA) 12.7 41 -0.68 -7.65
Public Sector Accountability & Transparency (V-Dem/AfDB/WB)
45.8 24 -0.37 +0.05
Accountability of Public Officials (EIU/BS) 38.1 17 0.00 +0.90
Corruption in Government & Public Officials (EIU) 40.0 17 -2.22 0.00
Corruption & Bureaucracy (WB) 38.1 17 -2.11 -4.75
Diversion of Public Funds (WEF) 44.3 16 +1.53 +5.25
Corruption Investigation (GI/AFR) 35.8 26 -3.02 -6.00
PERSONAL SAFETY 51.6 23 -1.04 +0.25
Safety of the Person (EIU/AFR) 57.1 17 -1.01 -2.28
Police Services (WEF/GI) 43.0 19 +1.49 +6.28
Social Unrest (EIU/ACLED) 70.7 15 -0.48 +3.98
Crime (EIU/AFR) 45.8 39 -1.29 -2.35
Political Violence (ACLED/PTS) 67.8 35 -2.19 +2.08
Human Trafficking (USDS) 25.0 21 -2.78 -6.25
NATIONAL SECURITY 74.2 37 -0.58 +3.28
Government Involvement in Armed Conflict (UCDP) 77.8 33 0.00 +5.55
Domestic Armed Conflict (EIU) 25.0 41 -2.78 +6.25
Violence by Non-state Actors (ACLED) 90.9 32 -0.93 +4.38
Cross-border Tensions (EIU) 75.0 9 +2.78 0.00
Internally Displaced People (IDMC) 98.0 34 -0.22 +3.03
Political Refugees (UNHCR) 78.4 47 -2.31 +0.43
SAFETY & RULE OF LAW
SCORE 2016
RANK 2016
10 -YEAR AAT
5-YEAR AAT
SCORE 2016
RANK 2016
10 -YEAR AAT
5-YEAR AAT
PARTICIPATION & HUMAN RIGHTS 50.8 28 -0.96 -0.85
PARTICIPATION 59.5 22 -1.19 +1.05
Political Participation (EIU/FH/V-Dem) 63.1 24 -0.10 +1.68
Civil Society Participation (BS/V-Dem/GI) 66.5 25 -1.81 -2.68
Free & Fair Elections (BS/CDD/V-Dem) 63.7 18 -0.71 +6.15
Election Monitoring Agencies (V-Dem/GI) 48.4 19 -0.89 -1.35
Legitimacy of Political Process (BS) 55.6 16 -2.47 +1.40
RIGHTS 52.5 18 -0.93 -1.13
Freedom of Expression (BS/RSF/V-Dem/GI) 68.7 22 -1.72 -2.28
Freedom of Association & Assembly (BS/GI) 70.1 10 -1.93 -1.58
Civil Liberties (BS/FH ) 56.3 16 -2.31 +2.10
Human Rights Conventions (UNOLA/OHCHR) 57.1 36 -1.07 -3.58
Human Rights Violations (EIU) 50.0 7 +2.78 +1.55
Protection against Discrimination (GI) 12.5 30 -1.39 -3.13
GENDER 40.5 45 -0.72 -2.43
Gender Equality (AfDB/WB) 30.8 48 -4.08 -6.15
Women's Political Participation (IPU/GI/WB) 37.0 28 +1.40 +4.08
Gender Balance in Education (UNESCO) 64.1 35 +2.03 +1.68
Women's Labour Force Participation (WB) 49.8 34 +1.06 +0.03
Workplace Gender Equality (GI) 25.0 37 -2.78 -6.25
Women in the Judiciary (GI) 25.0 36 -5.56 -12.50
Laws on Violence against Women (OECD) 16.7 42 +1.86 -1.03
Women's Political Empowerment (V-Dem) 75.4 25 +0.28 +0.70
PARTICIPATION & HUMAN RIGHTS
SCORE 2016
RANK 2016
10 -YEAR AAT
5-YEAR AAT
SUSTAINABLE ECONOMIC OPPORTUNITY 49.7 18 +0.36 0.00
PUBLIC MANAGEMENT 50.8 16 +0.30 +0.48
Governmental Statistical Capacity (WB) 63.8 23 -0.32 -0.35
Civil Registration (GI) 75.0 10 +1.39 +3.13
Public Administration (AfDB/WB) 60.9 22 -0.41 0.00
Diversification (AfDB/OECD/UNDP) 0.4 52 -0.11 -0.15
Budget Management (AfDB/WB) 69.0 15 0.00 -0.70
Budget Balance (AfDB/AUC/UNECA) 40.2 33 +0.22 -4.43
Fiscal Policy (AfDB/WB) 74.6 14 -0.79 -0.40
Revenue Mobilisation (ICTD/UNU-WIDER/AfDB/WB) 48.1 27 -0.06 +0.83
Transparency of State-owned Companies (GI) 25.0 7 +2.78 +6.25
BUSINESS ENVIRONMENT 49.7 19 +0.26 +0.05
Investment Climate (HER) 72.2 11 +1.84 +5.55
Competition (BS/GI/AfDB/WB) 54.5 19 0.00 -0.80
Business Bureaucracy & Red Tape (EIU) 33.3 10 +3.70 0.00
Customs Procedures (WEF) 40.0 29 -1.34 -5.05
Soundness of Banks (WEF) 33.7 30 -3.37 -3.75
Employment Creation (AFR) 45.6 12 +0.31 +2.85
Regional Integration (AfDB) 68.8 10 +0.70 +1.58
INFRASTRUCTURE 41.4 22 +0.60 -0.13
Transport Infrastructure (WEF/AFR/EIU/GI) 40.0 20 +0.69 -0.98
Electricity Infrastructure (WEF/AFR) 28.4 29 -0.84 -1.83
Digital & IT Infrastructure (EIU/ITU) 29.6 29 +1.96 +1.45
Access to Improved Water (WHO/UNICEF) 69.2 19 +1.77 +1.48
Water & Sanitation Services (AFR) 39.6 17 -0.57 -0.85
RURAL SECTOR 56.9 19 +0.24 -0.35
Rural Land & Water (IFAD) 53.7 27 +1.80 0.00
Rural Business Climate (IFAD) 58.4 22 -0.69 -0.93
Rural Development Resources (IFAD) 62.5 12 -0.03 +1.55
Agricultural Support System (IFAD) 55.9 24 +0.31 0.00
Agricultural Policy Costs (WEF) 53.1 21 -1.80 -1.85
Engagement with Rural Organisations (IFAD) 67.4 8 +0.81 0.00
Gender Balance in Rural Decision-making (IFAD) 41.8 30 +1.53 -2.05
Rural Accountability & Transparency (IFAD) 63.0 11 +0.11 +0.63
SUSTAINABLE ECONOMIC OPPORTUNITY
SCORE 2016
RANK 2016
10 -YEAR AAT
5-YEAR AAT
HUMAN DEVELOPMENT 51.0 39 +0.21 +0.15
WELFARE 46.4 32 -0.33 +0.45
Welfare Services (AfDB/WB) 54.6 42 -1.23 -0.50
Social Safety Nets (BS) 38.5 22 -1.70 -0.95
Social Protection & Labour (AfDB/WB) 51.9 28 -1.29 -1.10
Social Exclusion (BS) 0.0 33 -1.59 0.00
Poverty (AFR) 65.0 11 +2.04 +3.30
Poverty Reduction Priorities (AFR/AfDB/WB) 50.3 29 -0.12 -0.15
Narrowing Income Gaps (AFR) 44.7 7 +0.89 +3.28
Environmental Policy (BS) 42.9 14 0.00 0.00
Environmental Sustainability (AfDB/WB) 69.4 18 0.00 0.00
EDUCATION 35.6 43 +0.44 -0.05
Education Provision (AFR) 41.9 22 -1.62 -2.33
Education Quality (BS) 33.3 21 0.00 0.00
Educational System Management (WEF) 40.3 23 +1.44 +2.13
Human Resources in Primary Schools (UNESCO) 65.5 36 +1.13 +0.60
Primary School Completion (WB) 35.1 45 +0.13 -0.80
Secondary School Enrolment (UNESCO) 34.5 34 +1.23 +0.08
Tertiary Education Enrolment (UNESCO) 10.9 31 +0.39 0.00
Literacy (WB) 23.1 49 +0.78 -0.10
HEALTH 71.0 29 +0.54 +0.05
Basic Health Services (AFR) 51.1 16 -1.79 -1.75
Public Health Campaigns (GI) 100.0 1 0.00 0.00
Child Mortality (IGME) 54.5 49 +2.02 +1.40
Maternal Mortality (MMEIG) 78.1 38 +0.47 +0.28
Access to Sanitation (WHO/UNICEF) 59.9 22 +0.79 +0.65
Undernourishment (WB) 100.0 1 +0.54 0.00
Disease (WHO) 87.4 23 +0.01 -0.10
Immunisation (WB/WHO) 68.4 43 -0.03 +0.10
Antiretroviral Treatment (ART) Provision (UNAIDS) 39.5 39 +2.83 -0.20
HUMAN DEVELOPMENT
*AAT: Annual Average Trend
If AAT appears the same in the two time periods, differences exist beyond the 2nd decimal place.
For a full list of data sources see Annex.
Increasing Improvement Slowing Improvement Warning Signs Bouncing Back Slowing Deterioration Increasing Deterioration No Change

139
2017 IIAG: Index Report2017 IIAG Mauritania Scores, Ranks & Trends
OVERALL GOVERNANCE
44.5 41st2016 SCORE 2016 RANK
-0.28 -0.4010 -YEAR AAT* 5-YEAR AAT
SAFETY & RULE OF LAW 45.3 40 -0.71 -0.53
RULE OF LAW 34.7 44 -1.87 -1.63
Judicial Independence (BS/WEF/V-Dem/GI) 25.5 40 -0.13 +0.60
Judicial Process (EIU/GI) 12.5 45 -0.47 +3.13
Access to Justice (V-Dem) 32.0 42 -5.72 -12.88
Property Rights (BS/HER/WEF/AfDB/WB) 38.4 40 -1.18 -0.63
Transfers of Power (EIU) 33.3 20 -3.71 0.00
Multilateral Sanctions (CDD) 66.7 31 0.00 0.00
ACCOUNTABILITY 26.8 37 -0.31 +0.28
Access to Information (GI) 25.0 31 +2.78 +6.25
Online Public Services (UNDESA) 8.8 46 +0.02 -0.45
Public Sector Accountability & Transparency (V-Dem/AfDB/WB)
52.1 23 -0.39 -0.15
Accountability of Public Officials (EIU/BS) 21.4 45 -1.07 0.00
Corruption in Government & Public Officials (EIU) 40.0 17 0.00 0.00
Corruption & Bureaucracy (WB) 19.0 33 -5.82 -9.53
Diversion of Public Funds (WEF) 35.3 23 +0.51 +2.78
Corruption Investigation (GI/AFR) 12.5 40 +1.39 +3.13
PERSONAL SAFETY 37.7 45 -0.49 -0.30
Safety of the Person (EIU/AFR) 25.0 39 0.00 0.00
Police Services (WEF/GI) 14.3 45 -0.91 +0.98
Social Unrest (EIU/ACLED) 56.8 27 -2.00 +2.60
Crime (EIU/AFR) 50.0 29 +2.78 0.00
Political Violence (ACLED/PTS) 80.3 14 0.00 +0.93
Human Trafficking (USDS) 0.0 39 -2.78 -6.25
NATIONAL SECURITY 82.2 27 -0.13 -0.40
Government Involvement in Armed Conflict (UCDP) 88.9 19 -1.23 -2.78
Domestic Armed Conflict (EIU) 50.0 25 0.00 0.00
Violence by Non-state Actors (ACLED) 100.0 1 0.00 +0.10
Cross-border Tensions (EIU) 75.0 9 0.00 0.00
Internally Displaced People (IDMC) 100.0 1 0.00 0.00
Political Refugees (UNHCR) 79.0 46 +0.43 +0.23
SAFETY & RULE OF LAW
SCORE 2016
RANK 2016
10 -YEAR AAT
5-YEAR AAT
SCORE 2016
RANK 2016
10 -YEAR AAT
5-YEAR AAT
PARTICIPATION & HUMAN RIGHTS 36.9 43 -0.87 -0.70
PARTICIPATION 32.1 39 -1.96 -1.43
Political Participation (EIU/FH/V-Dem) 36.7 42 -2.56 -3.10
Civil Society Participation (BS/V-Dem/GI) 40.9 39 -1.41 +0.28
Free & Fair Elections (BS/CDD/V-Dem) 35.4 36 -2.79 -0.35
Election Monitoring Agencies (V-Dem/GI) 36.6 29 -1.78 -3.88
Legitimacy of Political Process (BS) 11.1 25 -1.23 0.00
RIGHTS 40.4 34 -0.34 -0.63
Freedom of Expression (BS/RSF/V-Dem/GI) 71.9 13 -1.00 -1.63
Freedom of Association & Assembly (BS/GI) 40.3 28 -0.69 -3.65
Civil Liberties (BS/FH ) 41.7 29 -1.62 -1.55
Human Rights Conventions (UNOLA/OHCHR) 76.2 11 +2.64 0.00
Human Rights Violations (EIU) 0.0 39 -2.78 0.00
Protection against Discrimination (GI) 12.5 30 +1.39 +3.13
GENDER 38.1 47 -0.32 -0.13
Gender Equality (AfDB/WB) 55.0 29 -2.50 -4.58
Women's Political Participation (IPU/GI/WB) 52.9 12 +1.99 +4.43
Gender Balance in Education (UNESCO) 88.1 5 +0.42 +0.38
Women's Labour Force Participation (WB) 22.4 46 +0.16 +0.08
Workplace Gender Equality (GI) 25.0 37 +2.78 +6.25
Women in the Judiciary (GI) 0.0 44 0.00 0.00
Laws on Violence against Women (OECD) 8.3 44 -4.63 -5.23
Women's Political Empowerment (V-Dem) 52.7 41 -0.80 -2.33
PARTICIPATION & HUMAN RIGHTS
SCORE 2016
RANK 2016
10 -YEAR AAT
5-YEAR AAT
SUSTAINABLE ECONOMIC OPPORTUNITY 43.1 33 -0.19 -1.25
PUBLIC MANAGEMENT 49.1 19 +0.63 -0.13
Governmental Statistical Capacity (WB) 55.1 30 -0.32 +0.73
Civil Registration (GI) 62.5 25 -1.39 -3.13
Public Administration (AfDB/WB) 55.2 27 -0.34 -1.58
Diversification (AfDB/OECD/UNDP) 8.1 19 +0.39 +0.75
Budget Management (AfDB/WB) 69.0 15 +2.20 +2.48
Budget Balance (AfDB/AUC/UNECA) 48.6 18 +0.54 -4.60
Fiscal Policy (AfDB/WB) 87.3 5 +3.44 +3.18
Revenue Mobilisation (ICTD/UNU-WIDER/AfDB/WB) 55.8 16 +1.16 +0.95
Transparency of State-owned Companies (GI) 0.0 26 0.00 0.00
BUSINESS ENVIRONMENT 35.3 39 -1.46 -2.43
Investment Climate (HER) 55.6 31 -1.23 +1.40
Competition (BS/GI/AfDB/WB) 43.3 35 +0.19 +2.60
Business Bureaucracy & Red Tape (EIU) 33.3 10 0.00 0.00
Customs Procedures (WEF) 27.0 38 -1.83 -7.38
Soundness of Banks (WEF) 3.0 40 -5.79 -11.10
Employment Creation (AFR) . . . .
Regional Integration (AfDB) 50.0 25 0.00 0.00
INFRASTRUCTURE 36.6 32 +0.10 -1.55
Transport Infrastructure (WEF/AFR/EIU/GI) 23.7 46 +0.32 -0.15
Electricity Infrastructure (WEF/AFR) 24.4 31 -2.20 -7.05
Digital & IT Infrastructure (EIU/ITU) 34.8 23 +1.23 +0.18
Access to Improved Water (WHO/UNICEF) 63.6 23 +1.07 +0.85
Water & Sanitation Services (AFR) . . . .
RURAL SECTOR 51.3 28 -0.04 -0.93
Rural Land & Water (IFAD) 49.1 33 -0.18 -2.35
Rural Business Climate (IFAD) 41.8 39 -2.56 -1.15
Rural Development Resources (IFAD) 62.5 12 +0.24 +4.68
Agricultural Support System (IFAD) 65.1 16 +2.51 -2.30
Agricultural Policy Costs (WEF) 43.5 28 +0.14 -1.05
Engagement with Rural Organisations (IFAD) 64.9 15 +2.61 0.00
Gender Balance in Rural Decision-making (IFAD) 50.0 13 -0.70 -3.13
Rural Accountability & Transparency (IFAD) 33.4 42 -2.42 -2.25
SUSTAINABLE ECONOMIC OPPORTUNITY
SCORE 2016
RANK 2016
10 -YEAR AAT
5-YEAR AAT
HUMAN DEVELOPMENT 52.6 35 +0.63 +0.85
WELFARE 55.1 17 +0.08 +0.70
Welfare Services (AfDB/WB) 68.9 27 -0.31 +2.30
Social Safety Nets (BS) 38.5 22 0.00 0.00
Social Protection & Labour (AfDB/WB) 54.1 26 -0.24 +0.10
Social Exclusion (BS) 28.6 7 0.00 0.00
Poverty (AFR) . . . .
Poverty Reduction Priorities (AFR/AfDB/WB) 80.4 4 +0.80 -1.03
Narrowing Income Gaps (AFR) . . . .
Environmental Policy (BS) 42.9 14 0.00 0.00
Environmental Sustainability (AfDB/WB) 72.2 15 +0.31 +3.48
EDUCATION 35.0 46 +0.58 +0.18
Education Provision (AFR) . . . .
Education Quality (BS) 33.3 21 0.00 0.00
Educational System Management (WEF) 6.5 40 -0.60 -1.85
Human Resources in Primary Schools (UNESCO) 73.4 24 +0.84 +1.23
Primary School Completion (WB) 52.7 30 +1.53 +0.05
Secondary School Enrolment (UNESCO) 24.0 44 +1.04 +0.98
Tertiary Education Enrolment (UNESCO) 8.3 35 +0.29 +0.05
Literacy (WB) 46.6 40 +0.90 +0.75
HEALTH 67.9 38 +1.26 +1.70
Basic Health Services (AFR) . . . .
Public Health Campaigns (GI) 50.0 33 +2.78 +6.25
Child Mortality (IGME) 67.9 36 +1.03 +0.90
Maternal Mortality (MMEIG) 77.5 40 +0.60 +0.75
Access to Sanitation (WHO/UNICEF) 54.3 26 +1.28 +1.08
Undernourishment (WB) 98.9 11 +0.98 +0.68
Disease (WHO) 93.0 14 +0.59 +0.40
Immunisation (WB/WHO) 69.6 42 +0.01 -1.75
Antiretroviral Treatment (ART) Provision (UNAIDS) 31.8 44 +2.72 +5.33
HUMAN DEVELOPMENT
N/A
N/A
N/A
N/A
N/A
N/A
*AAT: Annual Average Trend
If AAT appears the same in the two time periods, differences exist beyond the 2nd decimal place.
For a full list of data sources see Annex.
Increasing Improvement Slowing Improvement Warning Signs Bouncing Back Slowing Deterioration Increasing Deterioration No Change

140
2017 IIAG Mauritius Scores, Ranks & Trends
OVERALL GOVERNANCE
81.4 1st2016 SCORE 2016 RANK
+0.34 -0.1310 -YEAR AAT* 5-YEAR AAT
SAFETY & RULE OF LAW 82.7 1 +0.22 -0.15
RULE OF LAW 92.5 3 -0.11 -0.63
Judicial Independence (BS/WEF/V-Dem/GI) 88.4 3 +0.14 +0.45
Judicial Process (EIU/GI) 100.0 1 0.00 0.00
Access to Justice (V-Dem) 85.7 13 -0.51 -3.00
Property Rights (BS/HER/WEF/AfDB/WB) 80.9 3 -0.30 -1.18
Transfers of Power (EIU) 100.0 1 0.00 0.00
Multilateral Sanctions (CDD) 100.0 1 0.00 0.00
ACCOUNTABILITY 70.4 2 +0.13 +0.98
Access to Information (GI) 66.7 4 0.00 0.00
Online Public Services (UNDESA) 95.1 3 +2.69 +9.18
Public Sector Accountability & Transparency (V-Dem/AfDB/WB)
64.9 15 +0.36 +0.73
Accountability of Public Officials (EIU/BS) 76.2 1 0.00 0.00
Corruption in Government & Public Officials (EIU) 60.0 9 -2.22 -5.00
Corruption & Bureaucracy (WB) 76.2 2 +0.53 +1.20
Diversion of Public Funds (WEF) 55.7 10 -0.92 +0.25
Corruption Investigation (GI/AFR) 68.7 2 +0.68 +1.53
PERSONAL SAFETY 67.8 1 +0.30 -0.98
Safety of the Person (EIU/AFR) 85.5 1 -1.42 -0.08
Police Services (WEF/GI) 56.1 5 +3.34 +6.95
Social Unrest (EIU/ACLED) 75.0 6 0.00 0.00
Crime (EIU/AFR) 65.5 12 -0.08 -0.18
Political Violence (ACLED/PTS) 75.0 22 0.00 0.00
Human Trafficking (USDS) 50.0 1 0.00 -12.50
NATIONAL SECURITY 100.0 1 +0.56 0.00
Government Involvement in Armed Conflict (UCDP) 100.0 1 0.00 0.00
Domestic Armed Conflict (EIU) 100.0 1 0.00 0.00
Violence by Non-state Actors (ACLED) . . . .
Cross-border Tensions (EIU) 100.0 1 +2.78 0.00
Internally Displaced People (IDMC) 100.0 1 0.00 0.00
Political Refugees (UNHCR) 99.8 12 -0.01 -0.03
SAFETY & RULE OF LAW
SCORE 2016
RANK 2016
10 -YEAR AAT
5-YEAR AAT
SCORE 2016
RANK 2016
10 -YEAR AAT
5-YEAR AAT
PARTICIPATION & HUMAN RIGHTS 77.5 2 +0.04 -0.18
PARTICIPATION 88.1 1 -0.26 -0.03
Political Participation (EIU/FH/V-Dem) 85.4 5 +0.09 +0.20
Civil Society Participation (BS/V-Dem/GI) 87.8 7 -0.18 -1.03
Free & Fair Elections (BS/CDD/V-Dem) 93.7 1 -0.52 +2.60
Election Monitoring Agencies (V-Dem/GI) 73.8 6 -0.64 -1.88
Legitimacy of Political Process (BS) 100.0 1 0.00 0.00
RIGHTS 78.8 1 +0.09 -0.18
Freedom of Expression (BS/RSF/V-Dem/GI) 77.9 6 -0.23 -0.20
Freedom of Association & Assembly (BS/GI) 88.2 2 -1.31 -0.88
Civil Liberties (BS/FH ) 85.4 2 0.00 0.00
Human Rights Conventions (UNOLA/OHCHR) 71.4 16 +2.11 0.00
Human Rights Violations (EIU) 75.0 1 0.00 0.00
Protection against Discrimination (GI) 75.0 1 0.00 0.00
GENDER 65.4 17 +0.27 -0.35
Gender Equality (AfDB/WB) 75.0 10 0.00 0.00
Women's Political Participation (IPU/GI/WB) 20.0 52 -0.44 -1.18
Gender Balance in Education (UNESCO) 82.9 12 +0.03 -0.13
Women's Labour Force Participation (WB) 45.3 36 +0.89 +1.13
Workplace Gender Equality (GI) 50.0 4 0.00 0.00
Women in the Judiciary (GI) 100.0 1 0.00 0.00
Laws on Violence against Women (OECD) 66.7 6 +0.97 -2.08
Women's Political Empowerment (V-Dem) 83.5 13 +0.69 -0.40
PARTICIPATION & HUMAN RIGHTS
SCORE 2016
RANK 2016
10 -YEAR AAT
5-YEAR AAT
SUSTAINABLE ECONOMIC OPPORTUNITY 79.4 1 +1.10 +0.15
PUBLIC MANAGEMENT 68.2 2 +0.73 +0.25
Governmental Statistical Capacity (WB) 97.1 1 +3.38 +3.63
Civil Registration (GI) 75.0 10 0.00 0.00
Public Administration (AfDB/WB) 100.0 1 0.00 0.00
Diversification (AfDB/OECD/UNDP) 31.1 4 +1.52 +1.03
Budget Management (AfDB/WB) 77.8 7 0.00 0.00
Budget Balance (AfDB/AUC/UNECA) 45.0 24 -0.33 -2.35
Fiscal Policy (AfDB/WB) 77.8 10 +1.23 0.00
Revenue Mobilisation (ICTD/UNU-WIDER/AfDB/WB) 60.0 9 +0.83 -0.05
Transparency of State-owned Companies (GI) 50.0 1 0.00 0.00
BUSINESS ENVIRONMENT 77.9 2 -0.40 -2.13
Investment Climate (HER) 88.9 1 +1.23 -2.78
Competition (BS/GI/AfDB/WB) 85.3 3 -0.43 -1.53
Business Bureaucracy & Red Tape (EIU) 100.0 1 0.00 0.00
Customs Procedures (WEF) 77.1 2 +0.82 +1.05
Soundness of Banks (WEF) 65.5 3 -2.38 -5.73
Employment Creation (AFR) 50.4 7 -1.68 -3.78
Regional Integration (AfDB) . . . .
INFRASTRUCTURE 91.6 1 +1.57 +2.73
Transport Infrastructure (WEF/AFR/EIU/GI) 72.7 3 +0.13 +0.55
Electricity Infrastructure (WEF/AFR) 92.3 1 -0.18 +0.53
Digital & IT Infrastructure (EIU/ITU) 93.3 1 +4.38 +4.78
Access to Improved Water (WHO/UNICEF) 100.0 1 +0.03 +0.03
Water & Sanitation Services (AFR) 100.0 1 +3.49 +7.85
RURAL SECTOR 79.7 2 +2.49 -0.33
Rural Land & Water (IFAD) 76.6 4 +2.59 0.00
Rural Business Climate (IFAD) 96.3 1 +3.70 0.00
Rural Development Resources (IFAD) 100.0 1 +4.17 0.00
Agricultural Support System (IFAD) 65.1 16 +3.88 0.00
Agricultural Policy Costs (WEF) 64.2 8 -0.36 -2.68
Engagement with Rural Organisations (IFAD) 67.4 8 +0.68 0.00
Gender Balance in Rural Decision-making (IFAD) 83.3 1 +2.31 0.00
Rural Accountability & Transparency (IFAD) 84.7 1 +2.98 0.00
SUSTAINABLE ECONOMIC OPPORTUNITY
SCORE 2016
RANK 2016
10 -YEAR AAT
5-YEAR AAT
HUMAN DEVELOPMENT 86.1 1 0.00 -0.28
WELFARE 76.5 4 -0.40 -0.38
Welfare Services (AfDB/WB) 72.0 16 0.00 0.00
Social Safety Nets (BS) 92.3 1 0.00 0.00
Social Protection & Labour (AfDB/WB) 66.7 12 0.00 0.00
Social Exclusion (BS) 85.7 1 -1.59 0.00
Poverty (AFR) 93.6 1 +0.68 +1.53
Poverty Reduction Priorities (AFR/AfDB/WB) 70.9 6 -0.04 -1.68
Narrowing Income Gaps (AFR) 47.0 6 -0.70 -1.58
Environmental Policy (BS) 71.4 3 -3.18 -1.80
Environmental Sustainability (AfDB/WB) 88.9 4 +1.23 0.00
EDUCATION 84.2 1 +0.52 -0.08
Education Provision (AFR) 83.1 2 -1.43 -3.23
Education Quality (BS) 100.0 1 0.00 0.00
Educational System Management (WEF) 69.9 5 +1.42 +0.73
Human Resources in Primary Schools (UNESCO) 92.8 4 +0.34 +0.63
Primary School Completion (WB) 85.9 7 +0.41 +1.43
Secondary School Enrolment (UNESCO) 87.7 4 +0.79 +0.95
Tertiary Education Enrolment (UNESCO) 59.8 3 +2.20 -0.83
Literacy (WB) 94.2 7 +0.43 -0.35
HEALTH 97.6 2 -0.12 -0.33
Basic Health Services (AFR) 88.6 1 -1.16 -2.60
Public Health Campaigns (GI) 100.0 1 0.00 0.00
Child Mortality (IGME) 100.0 1 +0.13 +0.13
Maternal Mortality (MMEIG) 98.3 4 -0.03 0.00
Access to Sanitation (WHO/UNICEF) 96.4 3 +0.04 +0.03
Undernourishment (WB) 100.0 1 +0.06 0.00
Disease (WHO) 99.0 3 -0.02 -0.05
Immunisation (WB/WHO) 98.6 4 +0.04 -0.18
Antiretroviral Treatment (ART) Provision (UNAIDS) . . . .
HUMAN DEVELOPMENTN/A
N/A
N/A
*AAT: Annual Average Trend
If AAT appears the same in the two time periods, differences exist beyond the 2nd decimal place.
For a full list of data sources see Annex.
Increasing Improvement Slowing Improvement Warning Signs Bouncing Back Slowing Deterioration Increasing Deterioration No Change

141
2017 IIAG: Index Report2017 IIAG Morocco Scores, Ranks & Trends
OVERALL GOVERNANCE
60.1 12th2016 SCORE 2016 RANK
+0.66 +1.2310 -YEAR AAT* 5-YEAR AAT
SAFETY & RULE OF LAW 62.9 14 -0.09 +0.78
RULE OF LAW 58.7 19 +0.13 +0.28
Judicial Independence (BS/WEF/V-Dem/GI) 39.2 28 -0.09 +0.65
Judicial Process (EIU/GI) 58.3 14 0.00 0.00
Access to Justice (V-Dem) 90.2 7 +0.03 +0.25
Property Rights (BS/HER/WEF/AfDB/WB) 64.2 13 +0.82 +0.73
Transfers of Power (EIU) 33.3 20 0.00 0.00
Multilateral Sanctions (CDD) 66.7 31 0.00 0.00
ACCOUNTABILITY 53.4 12 +1.32 +2.00
Access to Information (GI) 54.2 7 +3.24 +7.30
Online Public Services (UNDESA) 100.0 1 +7.83 +6.65
Public Sector Accountability & Transparency (V-Dem/AfDB/WB)
70.5 11 +0.21 +0.58
Accountability of Public Officials (EIU/BS) 38.1 17 0.00 0.00
Corruption in Government & Public Officials (EIU) 40.0 17 0.00 0.00
Corruption & Bureaucracy (WB) 38.1 17 -3.70 -4.75
Diversion of Public Funds (WEF) 58.3 6 +0.81 +1.48
Corruption Investigation (GI/AFR) 27.8 31 +2.12 +4.78
PERSONAL SAFETY 58.2 12 -1.13 +1.28
Safety of the Person (EIU/AFR) 55.2 20 -1.52 -3.43
Police Services (WEF/GI) 67.8 2 +3.81 +10.33
Social Unrest (EIU/ACLED) 48.3 37 -4.04 -1.88
Crime (EIU/AFR) 55.9 19 +0.87 +1.95
Political Violence (ACLED/PTS) 72.0 31 -0.33 +0.63
Human Trafficking (USDS) 50.0 1 -5.56 0.00
NATIONAL SECURITY 81.3 28 -0.68 -0.50
Government Involvement in Armed Conflict (UCDP) 88.9 19 -1.23 -2.78
Domestic Armed Conflict (EIU) 50.0 25 -2.78 0.00
Violence by Non-state Actors (ACLED) 99.1 17 -0.10 -0.23
Cross-border Tensions (EIU) 50.0 31 0.00 0.00
Internally Displaced People (IDMC) 100.0 1 0.00 0.00
Political Refugees (UNHCR) 99.8 12 +0.01 0.00
SAFETY & RULE OF LAW
SCORE 2016
RANK 2016
10 -YEAR AAT
5-YEAR AAT
SCORE 2016
RANK 2016
10 -YEAR AAT
5-YEAR AAT
PARTICIPATION & HUMAN RIGHTS 44.2 33 +0.51 +1.03
PARTICIPATION 39.9 32 +0.58 +1.35
Political Participation (EIU/FH/V-Dem) 60.9 27 +1.03 +2.58
Civil Society Participation (BS/V-Dem/GI) 50.0 32 +0.89 +1.45
Free & Fair Elections (BS/CDD/V-Dem) 33.6 37 -0.16 +0.20
Election Monitoring Agencies (V-Dem/GI) 44.0 20 +1.11 +2.55
Legitimacy of Political Process (BS) 11.1 25 0.00 0.00
RIGHTS 48.1 25 +1.09 +1.08
Freedom of Expression (BS/RSF/V-Dem/GI) 51.7 36 +0.17 +0.65
Freedom of Association & Assembly (BS/GI) 41.7 24 -0.61 0.00
Civil Liberties (BS/FH ) 50.0 20 -0.70 -1.58
Human Rights Conventions (UNOLA/OHCHR) 95.2 2 +2.11 +1.18
Human Rights Violations (EIU) 25.0 25 +2.78 0.00
Protection against Discrimination (GI) 25.0 17 +2.78 +6.25
GENDER 44.7 38 -0.13 +0.63
Gender Equality (AfDB/WB) 75.0 10 0.00 0.00
Women's Political Participation (IPU/GI/WB) 34.7 37 +2.17 +4.95
Gender Balance in Education (UNESCO) 68.1 32 +0.51 +0.33
Women's Labour Force Participation (WB) 17.6 48 -0.22 +0.13
Workplace Gender Equality (GI) 25.0 37 +2.78 +6.25
Women in the Judiciary (GI) 25.0 36 -2.78 -6.25
Laws on Violence against Women (OECD) 33.3 29 -4.63 -1.05
Women's Political Empowerment (V-Dem) 78.9 22 +1.14 +0.70
PARTICIPATION & HUMAN RIGHTS
SCORE 2016
RANK 2016
10 -YEAR AAT
5-YEAR AAT
SUSTAINABLE ECONOMIC OPPORTUNITY 68.2 2 +1.21 +2.33
PUBLIC MANAGEMENT 65.1 4 -0.34 +1.15
Governmental Statistical Capacity (WB) 88.4 3 +0.32 +3.98
Civil Registration (GI) 75.0 10 0.00 0.00
Public Administration (AfDB/WB) 75.0 13 0.00 0.00
Diversification (AfDB/OECD/UNDP) 58.4 2 -4.00 -0.83
Budget Management (AfDB/WB) 77.8 7 0.00 0.00
Budget Balance (AfDB/AUC/UNECA) 41.7 32 -1.89 +1.68
Fiscal Policy (AfDB/WB) 77.8 10 0.00 0.00
Revenue Mobilisation (ICTD/UNU-WIDER/AfDB/WB) 67.3 5 -0.26 -0.58
Transparency of State-owned Companies (GI) 25.0 7 +2.78 +6.25
BUSINESS ENVIRONMENT 60.4 7 +0.76 +0.88
Investment Climate (HER) 77.8 8 +1.23 0.00
Competition (BS/GI/AfDB/WB) 63.6 10 +0.24 +0.28
Business Bureaucracy & Red Tape (EIU) 66.7 4 +3.71 +8.35
Customs Procedures (WEF) 64.6 7 -0.34 -1.90
Soundness of Banks (WEF) 63.5 5 -0.60 -2.18
Employment Creation (AFR) 26.2 25 +0.28 +0.63
Regional Integration (AfDB) . . . .
INFRASTRUCTURE 68.6 4 +2.40 +2.63
Transport Infrastructure (WEF/AFR/EIU/GI) 56.7 9 +2.29 +2.58
Electricity Infrastructure (WEF/AFR) 75.5 3 +1.14 +2.35
Digital & IT Infrastructure (EIU/ITU) 80.8 3 +5.86 +3.93
Access to Improved Water (WHO/UNICEF) 79.7 11 +1.30 +1.05
Water & Sanitation Services (AFR) 50.6 12 +1.44 +3.25
RURAL SECTOR 78.5 3 +2.02 +4.63
Rural Land & Water (IFAD) 75.3 5 +1.10 +3.53
Rural Business Climate (IFAD) 78.1 4 +1.07 +1.10
Rural Development Resources (IFAD) 84.5 4 +1.52 +3.93
Agricultural Support System (IFAD) 83.8 2 +3.63 +6.98
Agricultural Policy Costs (WEF) 80.6 3 +3.33 +5.93
Engagement with Rural Organisations (IFAD) 94.1 1 +3.13 +6.48
Gender Balance in Rural Decision-making (IFAD) 50.0 13 0.00 +3.13
Rural Accountability & Transparency (IFAD) 81.8 3 +2.37 +6.05
SUSTAINABLE ECONOMIC OPPORTUNITY
SCORE 2016
RANK 2016
10 -YEAR AAT
5-YEAR AAT
HUMAN DEVELOPMENT 65.1 13 +0.98 +0.80
WELFARE 57.2 15 +0.86 +1.20
Welfare Services (AfDB/WB) 72.0 16 0.00 0.00
Social Safety Nets (BS) 53.8 9 +1.70 +1.90
Social Protection & Labour (AfDB/WB) 66.7 12 0.00 0.00
Social Exclusion (BS) 28.6 7 0.00 0.00
Poverty (AFR) 77.3 6 +0.03 +0.08
Poverty Reduction Priorities (AFR/AfDB/WB) 52.0 20 +0.49 +1.10
Narrowing Income Gaps (AFR) 29.5 26 +1.07 +2.40
Environmental Policy (BS) 57.1 7 +3.17 +5.35
Environmental Sustainability (AfDB/WB) 77.8 9 +1.23 0.00
EDUCATION 56.8 18 +0.89 +0.03
Education Provision (AFR) 9.0 33 -1.37 -3.08
Education Quality (BS) 66.7 6 0.00 0.00
Educational System Management (WEF) 27.7 31 -0.89 -2.30
Human Resources in Primary Schools (UNESCO) 84.7 11 +0.19 -0.03
Primary School Completion (WB) 87.8 5 +2.34 +0.75
Secondary School Enrolment (UNESCO) 61.7 11 +1.47 0.00
Tertiary Education Enrolment (UNESCO) 45.8 6 +2.98 +3.65
Literacy (WB) 70.8 28 +2.37 +1.08
HEALTH 81.2 11 +1.17 +1.20
Basic Health Services (AFR) 24.2 32 +0.28 +0.63
Public Health Campaigns (GI) 75.0 14 +2.78 +6.25
Child Mortality (IGME) 93.6 8 +0.48 +0.35
Maternal Mortality (MMEIG) 95.7 6 +0.23 +0.15
Access to Sanitation (WHO/UNICEF) 87.2 7 +0.91 +0.55
Undernourishment (WB) 100.0 1 +0.08 0.00
Disease (WHO) 94.0 12 +0.18 -0.15
Immunisation (WB/WHO) 100.0 1 +0.50 0.00
Antiretroviral Treatment (ART) Provision (UNAIDS) 61.5 26 +5.06 +3.05
HUMAN DEVELOPMENT
N/A
*AAT: Annual Average Trend
If AAT appears the same in the two time periods, differences exist beyond the 2nd decimal place.
For a full list of data sources see Annex.
Increasing Improvement Slowing Improvement Warning Signs Bouncing Back Slowing Deterioration Increasing Deterioration No Change

142
2017 IIAG Mozambique Scores, Ranks & Trends
OVERALL GOVERNANCE
52.2 23rd2016 SCORE 2016 RANK
-0.13 -0.4510 -YEAR AAT* 5-YEAR AAT
SAFETY & RULE OF LAW 52.7 31 -1.30 -2.05
RULE OF LAW 54.6 29 -0.63 -1.90
Judicial Independence (BS/WEF/V-Dem/GI) 38.1 30 +0.27 +0.63
Judicial Process (EIU/GI) 41.7 26 -2.78 -6.25
Access to Justice (V-Dem) 68.3 25 +0.24 +1.93
Property Rights (BS/HER/WEF/AfDB/WB) 46.1 31 +0.32 +0.65
Transfers of Power (EIU) 33.3 20 -1.86 -8.35
Multilateral Sanctions (CDD) 100.0 1 0.00 0.00
ACCOUNTABILITY 26.4 38 -1.87 -2.88
Access to Information (GI) 25.0 31 -3.24 -7.30
Online Public Services (UNDESA) 27.5 28 -1.46 -5.50
Public Sector Accountability & Transparency (V-Dem/AfDB/WB)
40.9 27 -0.53 -0.43
Accountability of Public Officials (EIU/BS) 38.1 17 -0.79 0.00
Corruption in Government & Public Officials (EIU) 20.0 31 -4.44 -3.75
Corruption & Bureaucracy (WB) 19.0 33 -2.66 -5.98
Diversion of Public Funds (WEF) 18.8 33 -0.66 +0.18
Corruption Investigation (GI/AFR) 22.2 36 -1.12 -0.28
PERSONAL SAFETY 49.7 27 -0.98 -1.73
Safety of the Person (EIU/AFR) 40.8 34 -3.22 -4.13
Police Services (WEF/GI) 33.7 31 +1.17 +1.25
Social Unrest (EIU/ACLED) 71.5 13 -1.78 -0.28
Crime (EIU/AFR) 49.6 33 -2.30 -2.73
Political Violence (ACLED/PTS) 77.6 20 +0.29 +1.80
Human Trafficking (USDS) 25.0 21 0.00 -6.25
NATIONAL SECURITY 80.2 30 -1.71 -1.65
Government Involvement in Armed Conflict (UCDP) 77.8 33 -2.47 -5.55
Domestic Armed Conflict (EIU) 50.0 25 -5.56 0.00
Violence by Non-state Actors (ACLED) 79.1 38 -2.18 -4.25
Cross-border Tensions (EIU) 75.0 9 0.00 0.00
Internally Displaced People (IDMC) 99.5 30 -0.06 -0.13
Political Refugees (UNHCR) 100.0 1 0.00 0.00
SAFETY & RULE OF LAW
SCORE 2016
RANK 2016
10 -YEAR AAT
5-YEAR AAT
SCORE 2016
RANK 2016
10 -YEAR AAT
5-YEAR AAT
PARTICIPATION & HUMAN RIGHTS 56.5 20 -0.06 -0.05
PARTICIPATION 53.8 27 -0.88 -0.93
Political Participation (EIU/FH/V-Dem) 68.4 19 -0.47 +0.03
Civil Society Participation (BS/V-Dem/GI) 55.9 30 -0.52 -2.43
Free & Fair Elections (BS/CDD/V-Dem) 53.6 27 -0.99 +0.40
Election Monitoring Agencies (V-Dem/GI) 35.4 31 +0.07 +0.15
Legitimacy of Political Process (BS) 55.6 16 -2.47 -2.78
RIGHTS 50.8 21 -0.61 +0.28
Freedom of Expression (BS/RSF/V-Dem/GI) 69.9 18 +0.29 +0.40
Freedom of Association & Assembly (BS/GI) 59.0 17 +0.08 +0.18
Civil Liberties (BS/FH ) 50.0 20 -1.62 -3.65
Human Rights Conventions (UNOLA/OHCHR) 57.1 36 +1.06 0.00
Human Rights Violations (EIU) 31.3 24 -4.86 +1.58
Protection against Discrimination (GI) 37.5 12 +1.39 +3.13
GENDER 64.8 19 +1.32 +0.50
Gender Equality (AfDB/WB) 67.5 15 0.00 0.00
Women's Political Participation (IPU/GI/WB) 60.9 6 +0.52 -0.38
Gender Balance in Education (UNESCO) 67.2 34 +1.21 +0.50
Women's Labour Force Participation (WB) 91.5 4 -0.53 -0.13
Workplace Gender Equality (GI) 25.0 37 0.00 0.00
Women in the Judiciary (GI) 25.0 36 0.00 0.00
Laws on Violence against Women (OECD) 100.0 1 +8.33 +2.08
Women's Political Empowerment (V-Dem) 81.6 18 +1.08 +2.03
PARTICIPATION & HUMAN RIGHTS
SCORE 2016
RANK 2016
10 -YEAR AAT
5-YEAR AAT
SUSTAINABLE ECONOMIC OPPORTUNITY 48.1 22 +0.19 0.00
PUBLIC MANAGEMENT 50.1 17 +0.08 -0.65
Governmental Statistical Capacity (WB) 71.0 11 +0.32 -2.18
Civil Registration (GI) 50.0 32 0.00 0.00
Public Administration (AfDB/WB) 59.9 23 -0.52 -0.78
Diversification (AfDB/OECD/UNDP) 13.8 10 +1.17 +0.78
Budget Management (AfDB/WB) 76.2 10 +1.41 +0.70
Budget Balance (AfDB/AUC/UNECA) 52.2 11 +0.40 +3.45
Fiscal Policy (AfDB/WB) 45.2 42 -3.44 -8.15
Revenue Mobilisation (ICTD/UNU-WIDER/AfDB/WB) 57.9 13 +1.39 +0.43
Transparency of State-owned Companies (GI) 25.0 7 0.00 0.00
BUSINESS ENVIRONMENT 44.3 28 -0.26 -0.98
Investment Climate (HER) 38.9 41 -1.86 -4.18
Competition (BS/GI/AfDB/WB) 35.5 42 -0.20 -0.98
Business Bureaucracy & Red Tape (EIU) 33.3 10 0.00 0.00
Customs Procedures (WEF) 45.4 21 +1.81 +0.18
Soundness of Banks (WEF) 40.4 27 -1.37 -5.55
Employment Creation (AFR) 53.9 4 -0.18 +3.60
Regional Integration (AfDB) 62.5 16 0.00 0.00
INFRASTRUCTURE 36.2 33 +0.23 +0.73
Transport Infrastructure (WEF/AFR/EIU/GI) 35.3 28 +0.17 +0.58
Electricity Infrastructure (WEF/AFR) 36.3 19 -0.48 -0.60
Digital & IT Infrastructure (EIU/ITU) 34.4 24 +2.48 +2.25
Access to Improved Water (WHO/UNICEF) 36.7 46 +1.82 +1.55
Water & Sanitation Services (AFR) 38.3 19 -2.80 -0.20
RURAL SECTOR 61.9 10 +0.71 +0.90
Rural Land & Water (IFAD) 64.2 15 +2.21 +1.55
Rural Business Climate (IFAD) 60.5 21 -0.24 +2.08
Rural Development Resources (IFAD) 62.5 12 -1.39 0.00
Agricultural Support System (IFAD) 83.8 2 +3.63 +2.38
Agricultural Policy Costs (WEF) 43.4 29 -0.99 +1.80
Engagement with Rural Organisations (IFAD) 62.4 19 +0.93 +0.75
Gender Balance in Rural Decision-making (IFAD) 58.3 10 +1.61 -4.18
Rural Accountability & Transparency (IFAD) 60.5 12 0.00 +3.03
SUSTAINABLE ECONOMIC OPPORTUNITY
SCORE 2016
RANK 2016
10 -YEAR AAT
5-YEAR AAT
HUMAN DEVELOPMENT 51.5 36 +0.61 +0.25
WELFARE 49.1 26 -0.22 -0.40
Welfare Services (AfDB/WB) 64.9 31 +0.58 -0.50
Social Safety Nets (BS) 38.5 22 +0.86 -1.93
Social Protection & Labour (AfDB/WB) 49.7 33 -0.12 -2.33
Social Exclusion (BS) 14.3 20 0.00 -1.78
Poverty (AFR) 43.0 24 -1.08 -1.85
Poverty Reduction Priorities (AFR/AfDB/WB) 53.8 19 -2.07 +0.30
Narrowing Income Gaps (AFR) 65.8 2 -0.41 +4.65
Environmental Policy (BS) 42.9 14 0.00 0.00
Environmental Sustainability (AfDB/WB) 69.4 18 +0.30 0.00
EDUCATION 35.2 45 +0.52 -0.55
Education Provision (AFR) 48.2 15 -3.21 -4.58
Education Quality (BS) 33.3 21 +1.84 -2.10
Educational System Management (WEF) 25.2 32 +0.30 -0.98
Human Resources in Primary Schools (UNESCO) 51.9 47 +1.28 +0.05
Primary School Completion (WB) 32.0 48 +0.49 -0.60
Secondary School Enrolment (UNESCO) 25.8 42 +1.59 +1.95
Tertiary Education Enrolment (UNESCO) 10.1 33 +0.62 +0.55
Literacy (WB) 54.9 36 +1.24 +1.28
HEALTH 70.1 31 +1.51 +1.68
Basic Health Services (AFR) 51.3 15 -3.49 -4.03
Public Health Campaigns (GI) 100.0 1 +2.78 +6.25
Child Mortality (IGME) 70.7 34 +2.08 +1.38
Maternal Mortality (MMEIG) 81.8 33 +0.96 +0.70
Access to Sanitation (WHO/UNICEF) 40.1 42 +1.06 +0.90
Undernourishment (WB) 63.5 31 +2.14 +1.45
Disease (WHO) 68.0 48 +1.48 -0.65
Immunisation (WB/WHO) 80.7 31 +0.86 +1.03
Antiretroviral Treatment (ART) Provision (UNAIDS) 74.6 18 +5.72 +8.08
HUMAN DEVELOPMENT
*AAT: Annual Average Trend
If AAT appears the same in the two time periods, differences exist beyond the 2nd decimal place.
For a full list of data sources see Annex.
Increasing Improvement Slowing Improvement Warning Signs Bouncing Back Slowing Deterioration Increasing Deterioration No Change

143
2017 IIAG: Index Report2017 IIAG Namibia Scores, Ranks & Trends
OVERALL GOVERNANCE
71.2 5th2016 SCORE 2016 RANK
+0.42 +1.0010 -YEAR AAT* 5-YEAR AAT
SAFETY & RULE OF LAW 78.1 3 +0.26 +0.98
RULE OF LAW 87.1 5 -0.07 +1.33
Judicial Independence (BS/WEF/V-Dem/GI) 94.0 2 +0.72 +1.73
Judicial Process (EIU/GI) 100.0 1 +1.39 +3.13
Access to Justice (V-Dem) 92.4 4 +0.07 +0.68
Property Rights (BS/HER/WEF/AfDB/WB) 69.5 7 +1.13 +2.38
Transfers of Power (EIU) 66.7 8 -3.70 0.00
Multilateral Sanctions (CDD) 100.0 1 0.00 0.00
ACCOUNTABILITY 60.3 7 -0.14 -0.53
Access to Information (GI) 54.2 7 -1.84 -4.15
Online Public Services (UNDESA) 38.2 19 +1.68 -0.63
Public Sector Accountability & Transparency (V-Dem/AfDB/WB)
71.9 9 0.00 0.00
Accountability of Public Officials (EIU/BS) 69.0 3 0.00 0.00
Corruption in Government & Public Officials (EIU) 80.0 3 0.00 0.00
Corruption & Bureaucracy (WB) 76.2 2 -1.06 -2.38
Diversion of Public Funds (WEF) 53.7 11 +1.14 +4.00
Corruption Investigation (GI/AFR) 38.9 22 -1.11 -1.20
PERSONAL SAFETY 65.2 3 +0.29 +2.10
Safety of the Person (EIU/AFR) 61.4 11 -0.26 -0.58
Police Services (WEF/GI) 52.6 9 +2.73 +3.90
Social Unrest (EIU/ACLED) 76.4 5 -0.87 +3.63
Crime (EIU/AFR) 59.6 16 -0.31 -1.78
Political Violence (ACLED/PTS) 91.0 5 +0.39 +1.10
Human Trafficking (USDS) 50.0 1 0.00 +6.25
NATIONAL SECURITY 99.8 5 +0.93 +1.05
Government Involvement in Armed Conflict (UCDP) 100.0 1 0.00 0.00
Domestic Armed Conflict (EIU) 100.0 1 +2.78 +6.25
Violence by Non-state Actors (ACLED) 100.0 1 +0.04 0.00
Cross-border Tensions (EIU) 100.0 1 +2.78 0.00
Internally Displaced People (IDMC) 100.0 1 0.00 0.00
Political Refugees (UNHCR) 98.6 27 0.00 -0.05
SAFETY & RULE OF LAW
SCORE 2016
RANK 2016
10 -YEAR AAT
5-YEAR AAT
SCORE 2016
RANK 2016
10 -YEAR AAT
5-YEAR AAT
PARTICIPATION & HUMAN RIGHTS 75.5 3 +0.62 +1.38
PARTICIPATION 83.3 4 +0.24 +1.40
Political Participation (EIU/FH/V-Dem) 81.5 8 -0.18 +0.13
Civil Society Participation (BS/V-Dem/GI) 83.4 9 -0.02 0.00
Free & Fair Elections (BS/CDD/V-Dem) 89.9 2 +1.86 +6.40
Election Monitoring Agencies (V-Dem/GI) 73.1 7 +0.81 +1.90
Legitimacy of Political Process (BS) 88.9 3 -1.23 -1.38
RIGHTS 68.8 4 -0.09 -0.23
Freedom of Expression (BS/RSF/V-Dem/GI) 85.6 4 -0.82 -1.55
Freedom of Association & Assembly (BS/GI) 76.4 5 -1.31 -2.25
Civil Liberties (BS/FH ) 79.2 6 0.00 0.00
Human Rights Conventions (UNOLA/OHCHR) 71.4 16 +1.59 +2.38
Human Rights Violations (EIU) 50.0 7 0.00 0.00
Protection against Discrimination (GI) 50.0 3 0.00 0.00
GENDER 74.3 4 +1.70 +2.90
Gender Equality (AfDB/WB) 100.0 1 +1.39 0.00
Women's Political Participation (IPU/GI/WB) 62.4 4 +1.31 +3.48
Gender Balance in Education (UNESCO) 82.6 13 -0.48 -0.15
Women's Labour Force Participation (WB) 57.3 31 -0.24 +0.58
Workplace Gender Equality (GI) 50.0 4 0.00 0.00
Women in the Judiciary (GI) 75.0 19 +8.33 +18.75
Laws on Violence against Women (OECD) 75.0 3 +2.78 -1.05
Women's Political Empowerment (V-Dem) 92.2 3 +0.51 +1.65
PARTICIPATION & HUMAN RIGHTS
SCORE 2016
RANK 2016
10 -YEAR AAT
5-YEAR AAT
SUSTAINABLE ECONOMIC OPPORTUNITY 64.2 7 +0.51 +0.88
PUBLIC MANAGEMENT 60.9 6 -0.17 -0.08
Governmental Statistical Capacity (WB) 55.1 30 0.00 +0.73
Civil Registration (GI) 100.0 1 0.00 0.00
Public Administration (AfDB/WB) 75.0 13 0.00 0.00
Diversification (AfDB/OECD/UNDP) 8.4 18 -0.40 -1.33
Budget Management (AfDB/WB) 88.9 1 +2.47 0.00
Budget Balance (AfDB/AUC/UNECA) 38.9 38 -3.89 -0.35
Fiscal Policy (AfDB/WB) 88.9 1 0.00 0.00
Revenue Mobilisation (ICTD/UNU-WIDER/AfDB/WB) 67.7 4 +0.30 +0.25
Transparency of State-owned Companies (GI) 25.0 7 0.00 0.00
BUSINESS ENVIRONMENT 66.4 5 +0.40 +1.25
Investment Climate (HER) 72.2 11 +4.32 +4.15
Competition (BS/GI/AfDB/WB) 66.1 8 -0.92 -2.08
Business Bureaucracy & Red Tape (EIU) 66.7 4 0.00 0.00
Customs Procedures (WEF) 66.4 6 +1.49 +3.25
Soundness of Banks (WEF) 75.8 2 -1.39 -1.55
Employment Creation (AFR) 51.4 5 -1.04 +3.73
Regional Integration (AfDB) . . . .
INFRASTRUCTURE 69.1 3 +1.01 +2.15
Transport Infrastructure (WEF/AFR/EIU/GI) 73.9 2 -0.09 -0.78
Electricity Infrastructure (WEF/AFR) 73.4 4 +1.38 +2.38
Digital & IT Infrastructure (EIU/ITU) 50.7 11 +2.54 +2.58
Access to Improved Water (WHO/UNICEF) 74.6 15 +0.13 +0.10
Water & Sanitation Services (AFR) 72.6 2 +1.02 +6.35
RURAL SECTOR 60.3 14 +0.80 +0.15
Rural Land & Water (IFAD) 42.9 38 -0.34 -1.13
Rural Business Climate (IFAD) 60.9 15 +0.60 +0.40
Rural Development Resources (IFAD) 81.3 6 +2.78 +2.35
Agricultural Support System (IFAD) 74.3 7 +2.58 +1.15
Agricultural Policy Costs (WEF) 66.6 5 +2.27 -0.53
Engagement with Rural Organisations (IFAD) 54.0 31 +0.40 0.00
Gender Balance in Rural Decision-making (IFAD) 41.8 30 -2.30 -1.03
Rural Accountability & Transparency (IFAD) 60.5 12 +0.44 0.00
SUSTAINABLE ECONOMIC OPPORTUNITY
SCORE 2016
RANK 2016
10 -YEAR AAT
5-YEAR AAT
HUMAN DEVELOPMENT 67.0 11 +0.31 +0.78
WELFARE 62.7 7 -0.20 +0.58
Welfare Services (AfDB/WB) 72.0 16 0.00 0.00
Social Safety Nets (BS) 76.9 4 +0.86 0.00
Social Protection & Labour (AfDB/WB) 66.7 12 0.00 0.00
Social Exclusion (BS) 28.6 7 -1.59 0.00
Poverty (AFR) 84.9 2 +3.20 +4.60
Poverty Reduction Priorities (AFR/AfDB/WB) 59.7 13 +0.04 +1.00
Narrowing Income Gaps (AFR) 37.3 14 -2.72 +1.33
Environmental Policy (BS) 71.4 3 -1.59 -1.80
Environmental Sustainability (AfDB/WB) 66.7 23 0.00 0.00
EDUCATION 64.0 10 +0.64 +1.08
Education Provision (AFR) 83.9 1 +1.63 +1.30
Education Quality (BS) 66.7 6 -1.84 +2.10
Educational System Management (WEF) 42.9 19 +2.43 +4.48
Human Resources in Primary Schools (UNESCO) 80.3 14 +0.02 0.00
Primary School Completion (WB) 71.1 13 +0.67 +0.28
Secondary School Enrolment (UNESCO) 57.5 13 0.00 0.00
Tertiary Education Enrolment (UNESCO) 14.9 23 +0.26 0.00
Literacy (WB) 94.4 6 +1.97 +0.33
HEALTH 74.3 19 +0.47 +0.68
Basic Health Services (AFR) 81.4 3 +0.31 -0.88
Public Health Campaigns (GI) 75.0 14 0.00 0.00
Child Mortality (IGME) 85.6 13 +0.93 +0.50
Maternal Mortality (MMEIG) 90.3 13 +0.33 +0.33
Access to Sanitation (WHO/UNICEF) 37.5 43 +0.38 +0.30
Undernourishment (WB) 32.9 42 -2.94 -0.95
Disease (WHO) 88.0 22 +0.70 -0.43
Immunisation (WB/WHO) 89.3 20 +1.32 +2.35
Antiretroviral Treatment (ART) Provision (UNAIDS) 88.6 6 +3.21 +4.80
HUMAN DEVELOPMENT
N/A
*AAT: Annual Average Trend
If AAT appears the same in the two time periods, differences exist beyond the 2nd decimal place.
For a full list of data sources see Annex.
Increasing Improvement Slowing Improvement Warning Signs Bouncing Back Slowing Deterioration Increasing Deterioration No Change

144
2017 IIAG Niger Scores, Ranks & Trends
OVERALL GOVERNANCE
50.1 29th2016 SCORE 2016 RANK
+0.58 +0.1310 -YEAR AAT* 5-YEAR AAT
SAFETY & RULE OF LAW 52.9 30 -0.04 -1.05
RULE OF LAW 53.5 30 +0.11 +0.60
Judicial Independence (BS/WEF/V-Dem/GI) 45.9 23 -0.84 -0.23
Judicial Process (EIU/GI) 41.7 26 +1.39 +3.13
Access to Justice (V-Dem) 90.0 8 +0.04 +0.58
Property Rights (BS/HER/WEF/AfDB/WB) 43.2 36 +0.08 +0.05
Transfers of Power (EIU) 33.3 20 0.00 0.00
Multilateral Sanctions (CDD) 66.7 31 0.00 0.00
ACCOUNTABILITY 33.3 28 -0.10 -0.93
Access to Information (GI) 16.7 39 +0.47 +1.05
Online Public Services (UNDESA) 9.8 45 +0.29 -4.18
Public Sector Accountability & Transparency (V-Dem/AfDB/WB)
39.1 32 -0.12 -1.55
Accountability of Public Officials (EIU/BS) 45.2 12 0.00 0.00
Corruption in Government & Public Officials (EIU) 40.0 17 0.00 +1.25
Corruption & Bureaucracy (WB) 38.1 17 -0.53 -1.20
Diversion of Public Funds (WEF) . . . .
Corruption Investigation (GI/AFR) 44.3 20 -0.82 -1.85
PERSONAL SAFETY 58.6 11 -0.13 -0.05
Safety of the Person (EIU/AFR) 59.8 13 -2.37 -2.20
Police Services (WEF/GI) 50.0 11 +2.78 +6.25
Social Unrest (EIU/ACLED) 67.4 18 +0.62 -1.85
Crime (EIU/AFR) 80.5 1 +0.93 +2.10
Political Violence (ACLED/PTS) 68.8 34 0.00 -4.68
Human Trafficking (USDS) 25.0 21 -2.78 0.00
NATIONAL SECURITY 66.1 42 -0.06 -3.80
Government Involvement in Armed Conflict (UCDP) 55.6 49 -2.47 -8.33
Domestic Armed Conflict (EIU) 25.0 41 +2.78 0.00
Violence by Non-state Actors (ACLED) 97.4 25 0.00 -0.55
Cross-border Tensions (EIU) 25.0 42 0.00 -12.50
Internally Displaced People (IDMC) 93.5 40 -0.64 -1.48
Political Refugees (UNHCR) 99.9 8 0.00 0.00
SAFETY & RULE OF LAW
SCORE 2016
RANK 2016
10 -YEAR AAT
5-YEAR AAT
SCORE 2016
RANK 2016
10 -YEAR AAT
5-YEAR AAT
PARTICIPATION & HUMAN RIGHTS 53.7 24 +0.44 -0.83
PARTICIPATION 56.7 25 -1.43 -4.08
Political Participation (EIU/FH/V-Dem) 61.4 25 +0.97 -0.43
Civil Society Participation (BS/V-Dem/GI) 69.9 22 -1.81 -4.10
Free & Fair Elections (BS/CDD/V-Dem) 52.8 28 -1.97 -7.25
Election Monitoring Agencies (V-Dem/GI) 32.6 35 -3.13 -7.28
Legitimacy of Political Process (BS) 66.7 12 -1.23 -1.38
RIGHTS 59.9 9 +1.46 +0.83
Freedom of Expression (BS/RSF/V-Dem/GI) 71.6 14 -0.19 -2.58
Freedom of Association & Assembly (BS/GI) 63.2 16 +0.54 -1.55
Civil Liberties (BS/FH ) 56.3 16 0.00 0.00
Human Rights Conventions (UNOLA/OHCHR) 81.0 6 +4.23 +5.98
Human Rights Violations (EIU) 50.0 7 +2.78 0.00
Protection against Discrimination (GI) 37.5 12 +1.39 +3.13
GENDER 44.6 39 +1.32 +0.83
Gender Equality (AfDB/WB) 35.0 46 0.00 -0.53
Women's Political Participation (IPU/GI/WB) 39.7 24 +0.64 +1.13
Gender Balance in Education (UNESCO) 51.4 44 +2.16 +0.68
Women's Labour Force Participation (WB) 36.9 40 +0.12 +0.10
Workplace Gender Equality (GI) 50.0 4 +5.56 +12.50
Women in the Judiciary (GI) 25.0 36 -2.78 -6.25
Laws on Violence against Women (OECD) 41.7 22 +4.63 -1.03
Women's Political Empowerment (V-Dem) 76.8 23 +0.18 -0.08
PARTICIPATION & HUMAN RIGHTS
SCORE 2016
RANK 2016
10 -YEAR AAT
5-YEAR AAT
SUSTAINABLE ECONOMIC OPPORTUNITY 46.7 25 +0.93 +1.50
PUBLIC MANAGEMENT 45.6 30 -0.14 -1.35
Governmental Statistical Capacity (WB) 71.0 11 +0.32 +0.35
Civil Registration (GI) 62.5 25 0.00 0.00
Public Administration (AfDB/WB) 66.1 15 +0.87 -0.80
Diversification (AfDB/OECD/UNDP) 2.6 39 +0.21 -1.08
Budget Management (AfDB/WB) 67.5 21 -0.17 -1.43
Budget Balance (AfDB/AUC/UNECA) 31.2 46 -3.62 -5.73
Fiscal Policy (AfDB/WB) 67.5 22 +1.07 -3.55
Revenue Mobilisation (ICTD/UNU-WIDER/AfDB/WB) 41.9 36 -0.02 +0.15
Transparency of State-owned Companies (GI) 0.0 26 0.00 0.00
BUSINESS ENVIRONMENT 58.6 8 +1.97 +2.53
Investment Climate (HER) 61.1 21 +0.61 0.00
Competition (BS/GI/AfDB/WB) 55.4 17 +0.11 +0.43
Business Bureaucracy & Red Tape (EIU) 33.3 10 +3.70 0.00
Customs Procedures (WEF) . . . .
Soundness of Banks (WEF) . . . .
Employment Creation (AFR) 74.6 1 +4.73 +10.65
Regional Integration (AfDB) 68.8 10 +0.70 +1.58
INFRASTRUCTURE 33.9 39 +1.81 +3.70
Transport Infrastructure (WEF/AFR/EIU/GI) 50.0 14 +3.63 +8.18
Electricity Infrastructure (WEF/AFR) 32.0 27 +1.47 +3.30
Digital & IT Infrastructure (EIU/ITU) 9.1 49 +0.90 +0.88
Access to Improved Water (WHO/UNICEF) 35.0 47 +0.58 +0.50
Water & Sanitation Services (AFR) 43.4 14 +2.49 +5.60
RURAL SECTOR 48.8 33 +0.11 +1.10
Rural Land & Water (IFAD) 39.5 44 +0.81 0.00
Rural Business Climate (IFAD) 44.5 37 -1.78 0.00
Rural Development Resources (IFAD) 62.5 12 +0.47 +3.13
Agricultural Support System (IFAD) 65.1 16 +2.33 0.00
Agricultural Policy Costs (WEF) . . . .
Engagement with Rural Organisations (IFAD) 62.7 18 +2.32 0.00
Gender Balance in Rural Decision-making (IFAD) 12.5 49 -4.87 0.00
Rural Accountability & Transparency (IFAD) 54.5 22 +1.43 +4.55
SUSTAINABLE ECONOMIC OPPORTUNITY
SCORE 2016
RANK 2016
10 -YEAR AAT
5-YEAR AAT
HUMAN DEVELOPMENT 47.1 43 +0.98 +0.93
WELFARE 49.2 25 +1.18 +1.80
Welfare Services (AfDB/WB) 69.7 24 +0.57 +0.50
Social Safety Nets (BS) 30.8 31 +0.86 0.00
Social Protection & Labour (AfDB/WB) 56.3 21 0.00 0.00
Social Exclusion (BS) 0.0 33 0.00 0.00
Poverty (AFR) 52.0 18 +1.69 +3.80
Poverty Reduction Priorities (AFR/AfDB/WB) 67.3 7 +2.07 +3.75
Narrowing Income Gaps (AFR) 63.0 3 +3.89 +8.75
Environmental Policy (BS) 28.6 26 0.00 0.00
Environmental Sustainability (AfDB/WB) 75.0 11 +1.54 -0.70
EDUCATION 32.7 48 +1.11 +1.48
Education Provision (AFR) 63.5 7 +1.79 +4.03
Education Quality (BS) 16.7 35 +1.86 -2.08
Educational System Management (WEF) . . . .
Human Resources in Primary Schools (UNESCO) 72.5 26 +0.39 +0.63
Primary School Completion (WB) 53.4 29 +3.32 +5.25
Secondary School Enrolment (UNESCO) 14.4 50 +1.07 +1.28
Tertiary Education Enrolment (UNESCO) 2.4 50 +0.12 0.00
Literacy (WB) 5.8 51 -0.80 +1.13
HEALTH 59.5 46 +0.63 -0.48
Basic Health Services (AFR) 65.6 7 +1.23 +2.78
Public Health Campaigns (GI) 25.0 54 -5.56 -12.50
Child Mortality (IGME) 63.1 45 +2.79 +1.60
Maternal Mortality (MMEIG) 79.4 37 +0.61 +0.63
Access to Sanitation (WHO/UNICEF) 14.5 53 +0.59 +0.53
Undernourishment (WB) 91.9 16 +0.83 +0.33
Disease (WHO) 84.0 32 -0.13 +0.33
Immunisation (WB/WHO) 65.0 44 +0.63 -1.30
Antiretroviral Treatment (ART) Provision (UNAIDS) 46.6 36 +4.68 +3.23
HUMAN DEVELOPMENT
N/A
N/A
N/A
N/A
N/A
*AAT: Annual Average Trend
If AAT appears the same in the two time periods, differences exist beyond the 2nd decimal place.
For a full list of data sources see Annex.
Increasing Improvement Slowing Improvement Warning Signs Bouncing Back Slowing Deterioration Increasing Deterioration No Change
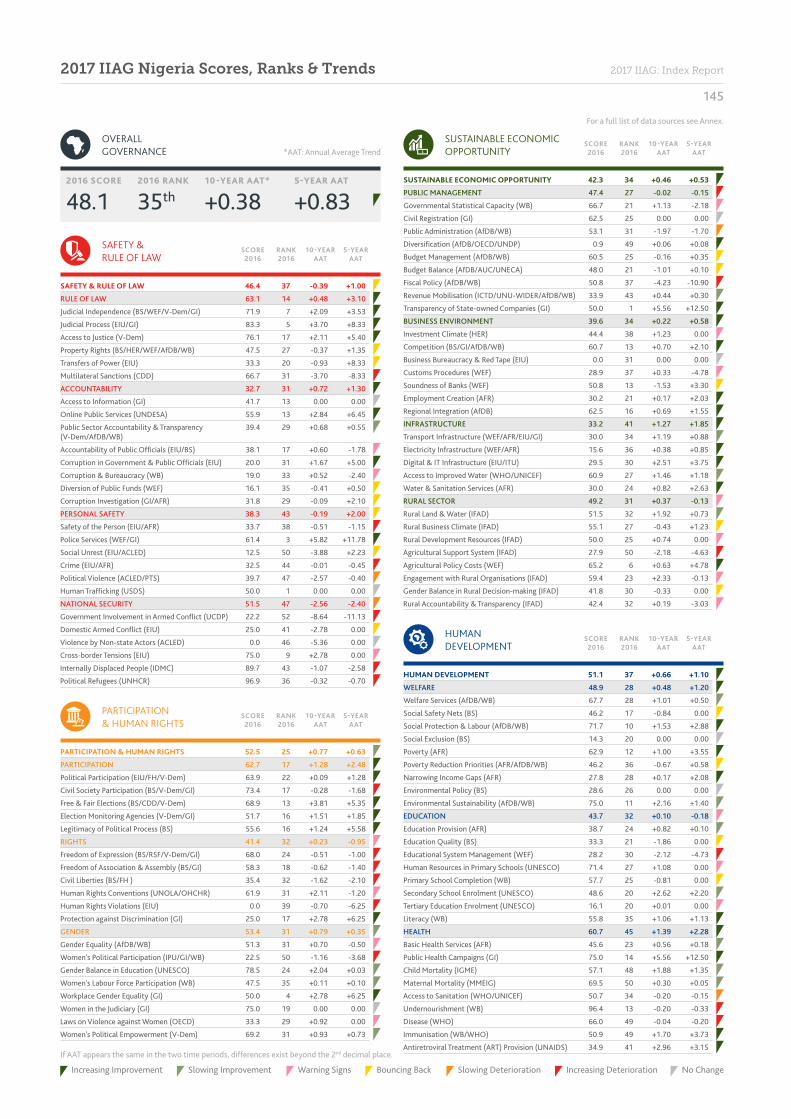
145
2017 IIAG: Index Report2017 IIAG Nigeria Scores, Ranks & Trends
OVERALL GOVERNANCE
48.1 35th2016 SCORE 2016 RANK
+0.38 +0.8310 -YEAR AAT* 5-YEAR AAT
SAFETY & RULE OF LAW 46.4 37 -0.39 +1.00
RULE OF LAW 63.1 14 +0.48 +3.10
Judicial Independence (BS/WEF/V-Dem/GI) 71.9 7 +2.09 +3.53
Judicial Process (EIU/GI) 83.3 5 +3.70 +8.33
Access to Justice (V-Dem) 76.1 17 +2.11 +5.40
Property Rights (BS/HER/WEF/AfDB/WB) 47.5 27 -0.37 +1.35
Transfers of Power (EIU) 33.3 20 -0.93 +8.33
Multilateral Sanctions (CDD) 66.7 31 -3.70 -8.33
ACCOUNTABILITY 32.7 31 +0.72 +1.30
Access to Information (GI) 41.7 13 0.00 0.00
Online Public Services (UNDESA) 55.9 13 +2.84 +6.45
Public Sector Accountability & Transparency (V-Dem/AfDB/WB)
39.4 29 +0.68 +0.55
Accountability of Public Officials (EIU/BS) 38.1 17 +0.60 -1.78
Corruption in Government & Public Officials (EIU) 20.0 31 +1.67 +5.00
Corruption & Bureaucracy (WB) 19.0 33 +0.52 -2.40
Diversion of Public Funds (WEF) 16.1 35 -0.41 +0.50
Corruption Investigation (GI/AFR) 31.8 29 -0.09 +2.10
PERSONAL SAFETY 38.3 43 -0.19 +2.00
Safety of the Person (EIU/AFR) 33.7 38 -0.51 -1.15
Police Services (WEF/GI) 61.4 3 +5.82 +11.78
Social Unrest (EIU/ACLED) 12.5 50 -3.88 +2.23
Crime (EIU/AFR) 32.5 44 -0.01 -0.45
Political Violence (ACLED/PTS) 39.7 47 -2.57 -0.40
Human Trafficking (USDS) 50.0 1 0.00 0.00
NATIONAL SECURITY 51.5 47 -2.56 -2.40
Government Involvement in Armed Conflict (UCDP) 22.2 52 -8.64 -11.13
Domestic Armed Conflict (EIU) 25.0 41 -2.78 0.00
Violence by Non-state Actors (ACLED) 0.0 46 -5.36 0.00
Cross-border Tensions (EIU) 75.0 9 +2.78 0.00
Internally Displaced People (IDMC) 89.7 43 -1.07 -2.58
Political Refugees (UNHCR) 96.9 36 -0.32 -0.70
SAFETY & RULE OF LAW
SCORE 2016
RANK 2016
10 -YEAR AAT
5-YEAR AAT
SCORE 2016
RANK 2016
10 -YEAR AAT
5-YEAR AAT
PARTICIPATION & HUMAN RIGHTS 52.5 25 +0.77 +0.63
PARTICIPATION 62.7 17 +1.28 +2.48
Political Participation (EIU/FH/V-Dem) 63.9 22 +0.09 +1.28
Civil Society Participation (BS/V-Dem/GI) 73.4 17 -0.28 -1.68
Free & Fair Elections (BS/CDD/V-Dem) 68.9 13 +3.81 +5.35
Election Monitoring Agencies (V-Dem/GI) 51.7 16 +1.51 +1.85
Legitimacy of Political Process (BS) 55.6 16 +1.24 +5.58
RIGHTS 41.4 32 +0.23 -0.95
Freedom of Expression (BS/RSF/V-Dem/GI) 68.0 24 -0.51 -1.00
Freedom of Association & Assembly (BS/GI) 58.3 18 -0.62 -1.40
Civil Liberties (BS/FH ) 35.4 32 -1.62 -2.10
Human Rights Conventions (UNOLA/OHCHR) 61.9 31 +2.11 -1.20
Human Rights Violations (EIU) 0.0 39 -0.70 -6.25
Protection against Discrimination (GI) 25.0 17 +2.78 +6.25
GENDER 53.4 31 +0.79 +0.35
Gender Equality (AfDB/WB) 51.3 31 +0.70 -0.50
Women's Political Participation (IPU/GI/WB) 22.5 50 -1.16 -3.68
Gender Balance in Education (UNESCO) 78.5 24 +2.04 +0.03
Women's Labour Force Participation (WB) 47.5 35 +0.11 +0.10
Workplace Gender Equality (GI) 50.0 4 +2.78 +6.25
Women in the Judiciary (GI) 75.0 19 0.00 0.00
Laws on Violence against Women (OECD) 33.3 29 +0.92 0.00
Women's Political Empowerment (V-Dem) 69.2 31 +0.93 +0.73
PARTICIPATION & HUMAN RIGHTS
SCORE 2016
RANK 2016
10 -YEAR AAT
5-YEAR AAT
SUSTAINABLE ECONOMIC OPPORTUNITY 42.3 34 +0.46 +0.53
PUBLIC MANAGEMENT 47.4 27 -0.02 -0.15
Governmental Statistical Capacity (WB) 66.7 21 +1.13 -2.18
Civil Registration (GI) 62.5 25 0.00 0.00
Public Administration (AfDB/WB) 53.1 31 -1.97 -1.70
Diversification (AfDB/OECD/UNDP) 0.9 49 +0.06 +0.08
Budget Management (AfDB/WB) 60.5 25 -0.16 +0.35
Budget Balance (AfDB/AUC/UNECA) 48.0 21 -1.01 +0.10
Fiscal Policy (AfDB/WB) 50.8 37 -4.23 -10.90
Revenue Mobilisation (ICTD/UNU-WIDER/AfDB/WB) 33.9 43 +0.44 +0.30
Transparency of State-owned Companies (GI) 50.0 1 +5.56 +12.50
BUSINESS ENVIRONMENT 39.6 34 +0.22 +0.58
Investment Climate (HER) 44.4 38 +1.23 0.00
Competition (BS/GI/AfDB/WB) 60.7 13 +0.70 +2.10
Business Bureaucracy & Red Tape (EIU) 0.0 31 0.00 0.00
Customs Procedures (WEF) 28.9 37 +0.33 -4.78
Soundness of Banks (WEF) 50.8 13 -1.53 +3.30
Employment Creation (AFR) 30.2 21 +0.17 +2.03
Regional Integration (AfDB) 62.5 16 +0.69 +1.55
INFRASTRUCTURE 33.2 41 +1.27 +1.85
Transport Infrastructure (WEF/AFR/EIU/GI) 30.0 34 +1.19 +0.88
Electricity Infrastructure (WEF/AFR) 15.6 36 +0.38 +0.85
Digital & IT Infrastructure (EIU/ITU) 29.5 30 +2.51 +3.75
Access to Improved Water (WHO/UNICEF) 60.9 27 +1.46 +1.18
Water & Sanitation Services (AFR) 30.0 24 +0.82 +2.63
RURAL SECTOR 49.2 31 +0.37 -0.13
Rural Land & Water (IFAD) 51.5 32 +1.92 +0.73
Rural Business Climate (IFAD) 55.1 27 -0.43 +1.23
Rural Development Resources (IFAD) 50.0 25 +0.74 0.00
Agricultural Support System (IFAD) 27.9 50 -2.18 -4.63
Agricultural Policy Costs (WEF) 65.2 6 +0.63 +4.78
Engagement with Rural Organisations (IFAD) 59.4 23 +2.33 -0.13
Gender Balance in Rural Decision-making (IFAD) 41.8 30 -0.33 0.00
Rural Accountability & Transparency (IFAD) 42.4 32 +0.19 -3.03
SUSTAINABLE ECONOMIC OPPORTUNITY
SCORE 2016
RANK 2016
10 -YEAR AAT
5-YEAR AAT
HUMAN DEVELOPMENT 51.1 37 +0.66 +1.10
WELFARE 48.9 28 +0.48 +1.20
Welfare Services (AfDB/WB) 67.7 28 +1.01 +0.50
Social Safety Nets (BS) 46.2 17 -0.84 0.00
Social Protection & Labour (AfDB/WB) 71.7 10 +1.53 +2.88
Social Exclusion (BS) 14.3 20 0.00 0.00
Poverty (AFR) 62.9 12 +1.00 +3.55
Poverty Reduction Priorities (AFR/AfDB/WB) 46.2 36 -0.67 +0.58
Narrowing Income Gaps (AFR) 27.8 28 +0.17 +2.08
Environmental Policy (BS) 28.6 26 0.00 0.00
Environmental Sustainability (AfDB/WB) 75.0 11 +2.16 +1.40
EDUCATION 43.7 32 +0.10 -0.18
Education Provision (AFR) 38.7 24 +0.82 +0.10
Education Quality (BS) 33.3 21 -1.86 0.00
Educational System Management (WEF) 28.2 30 -2.12 -4.73
Human Resources in Primary Schools (UNESCO) 71.4 27 +1.08 0.00
Primary School Completion (WB) 57.7 25 -0.81 0.00
Secondary School Enrolment (UNESCO) 48.6 20 +2.62 +2.20
Tertiary Education Enrolment (UNESCO) 16.1 20 +0.01 0.00
Literacy (WB) 55.8 35 +1.06 +1.13
HEALTH 60.7 45 +1.39 +2.28
Basic Health Services (AFR) 45.6 23 +0.56 +0.18
Public Health Campaigns (GI) 75.0 14 +5.56 +12.50
Child Mortality (IGME) 57.1 48 +1.88 +1.35
Maternal Mortality (MMEIG) 69.5 50 +0.30 +0.05
Access to Sanitation (WHO/UNICEF) 50.7 34 -0.20 -0.15
Undernourishment (WB) 96.4 13 -0.20 -0.33
Disease (WHO) 66.0 49 -0.04 -0.20
Immunisation (WB/WHO) 50.9 49 +1.70 +3.73
Antiretroviral Treatment (ART) Provision (UNAIDS) 34.9 41 +2.96 +3.15
HUMAN DEVELOPMENT
*AAT: Annual Average Trend
If AAT appears the same in the two time periods, differences exist beyond the 2nd decimal place.
For a full list of data sources see Annex.
Increasing Improvement Slowing Improvement Warning Signs Bouncing Back Slowing Deterioration Increasing Deterioration No Change

146
2017 IIAG Rwanda Scores, Ranks & Trends
OVERALL GOVERNANCE
63.9 9th2016 SCORE 2016 RANK
+0.97 +0.7510 -YEAR AAT* 5-YEAR AAT
SAFETY & RULE OF LAW 64.1 12 -0.08 +1.03
RULE OF LAW 55.5 27 -0.61 +0.55
Judicial Independence (BS/WEF/V-Dem/GI) 54.5 18 +1.61 +2.03
Judicial Process (EIU/GI) 54.2 19 -1.39 -3.13
Access to Justice (V-Dem) 82.8 16 +0.63 +0.55
Property Rights (BS/HER/WEF/AfDB/WB) 75.1 4 +2.90 +3.98
Transfers of Power (EIU) 0.0 38 -7.41 0.00
Multilateral Sanctions (CDD) 66.7 31 0.00 0.00
ACCOUNTABILITY 72.1 1 +1.76 +3.05
Access to Information (GI) 100.0 1 +4.63 +10.43
Online Public Services (UNDESA) 61.8 10 +3.54 +3.95
Public Sector Accountability & Transparency (V-Dem/AfDB/WB)
85.5 3 +0.80 +1.88
Accountability of Public Officials (EIU/BS) 45.2 12 +1.58 0.00
Corruption in Government & Public Officials (EIU) 60.0 9 0.00 0.00
Corruption & Bureaucracy (WB) 76.2 2 +3.70 +1.20
Diversion of Public Funds (WEF) 97.8 1 -0.24 +6.90
Corruption Investigation (GI/AFR) 50.0 12 0.00 0.00
PERSONAL SAFETY 63.5 5 +0.44 +1.48
Safety of the Person (EIU/AFR) 50.0 24 0.00 +6.25
Police Services (WEF/GI) 87.5 1 +2.17 +4.53
Social Unrest (EIU/ACLED) 87.5 2 +1.39 +0.18
Crime (EIU/AFR) 50.0 29 0.00 0.00
Political Violence (ACLED/PTS) 81.3 12 +1.92 +4.15
Human Trafficking (USDS) 25.0 21 -2.78 -6.25
NATIONAL SECURITY 65.4 43 -1.88 -0.93
Government Involvement in Armed Conflict (UCDP) 77.8 33 -2.47 +2.78
Domestic Armed Conflict (EIU) 50.0 25 -2.78 0.00
Violence by Non-state Actors (ACLED) 99.6 11 +0.10 +1.10
Cross-border Tensions (EIU) 25.0 42 -2.78 0.00
Internally Displaced People (IDMC) 100.0 1 +0.98 0.00
Political Refugees (UNHCR) 40.2 49 -4.28 -9.33
SAFETY & RULE OF LAW
SCORE 2016
RANK 2016
10 -YEAR AAT
5-YEAR AAT
SCORE 2016
RANK 2016
10 -YEAR AAT
5-YEAR AAT
PARTICIPATION & HUMAN RIGHTS 51.5 27 +0.87 +0.55
PARTICIPATION 33.8 37 +0.28 +0.48
Political Participation (EIU/FH/V-Dem) 19.4 52 -0.54 -0.50
Civil Society Participation (BS/V-Dem/GI) 41.2 37 +0.14 +0.25
Free & Fair Elections (BS/CDD/V-Dem) 32.6 38 +0.86 +1.35
Election Monitoring Agencies (V-Dem/GI) 64.4 12 +0.91 +1.25
Legitimacy of Political Process (BS) 11.1 25 0.00 0.00
RIGHTS 33.6 37 +0.19 0.00
Freedom of Expression (BS/RSF/V-Dem/GI) 36.6 42 +0.62 +0.95
Freedom of Association & Assembly (BS/GI) 23.6 39 -0.62 -0.70
Civil Liberties (BS/FH ) 20.8 42 -0.93 -1.58
Human Rights Conventions (UNOLA/OHCHR) 95.2 2 +4.76 +1.18
Human Rights Violations (EIU) 0.0 39 -2.78 0.00
Protection against Discrimination (GI) 25.0 17 0.00 0.00
GENDER 87.3 1 +2.14 +1.20
Gender Equality (AfDB/WB) 95.8 5 +2.44 +1.98
Women's Political Participation (IPU/GI/WB) 95.3 1 +2.37 +2.80
Gender Balance in Education (UNESCO) 87.3 6 +0.48 -0.38
Women's Labour Force Participation (WB) 96.5 1 +0.06 -0.10
Workplace Gender Equality (GI) 50.0 4 +2.78 +6.25
Women in the Judiciary (GI) 100.0 1 0.00 0.00
Laws on Violence against Women (OECD) 91.7 2 +10.19 +2.10
Women's Political Empowerment (V-Dem) 81.4 19 -1.17 -3.23
PARTICIPATION & HUMAN RIGHTS
SCORE 2016
RANK 2016
10 -YEAR AAT
5-YEAR AAT
SUSTAINABLE ECONOMIC OPPORTUNITY 67.7 3 +1.20 +0.68
PUBLIC MANAGEMENT 59.0 9 +0.40 +0.50
Governmental Statistical Capacity (WB) 69.6 13 +0.49 -2.18
Civil Registration (GI) 62.5 25 0.00 0.00
Public Administration (AfDB/WB) 85.4 6 +0.69 +1.18
Diversification (AfDB/OECD/UNDP) 8.5 17 +0.31 +0.35
Budget Management (AfDB/WB) 88.7 4 +1.39 +1.75
Budget Balance (AfDB/AUC/UNECA) 48.4 19 -1.12 +1.78
Fiscal Policy (AfDB/WB) 87.3 5 +0.62 0.00
Revenue Mobilisation (ICTD/UNU-WIDER/AfDB/WB) 55.3 17 +1.19 +1.63
Transparency of State-owned Companies (GI) 25.0 7 0.00 0.00
BUSINESS ENVIRONMENT 83.0 1 +1.87 +0.18
Investment Climate (HER) 66.7 15 +2.48 -1.38
Competition (BS/GI/AfDB/WB) 88.2 1 +2.57 +3.40
Business Bureaucracy & Red Tape (EIU) 100.0 1 +3.70 0.00
Customs Procedures (WEF) 96.0 1 +1.87 -1.00
Soundness of Banks (WEF) 53.2 11 -0.14 -1.65
Employment Creation (AFR) . . . .
Regional Integration (AfDB) 93.8 2 +0.70 +1.58
INFRASTRUCTURE 45.3 17 +0.47 +0.33
Transport Infrastructure (WEF/AFR/EIU/GI) 47.2 16 -0.43 -0.68
Electricity Infrastructure (WEF/AFR) 62.5 7 +0.04 -0.20
Digital & IT Infrastructure (EIU/ITU) 23.3 36 +1.54 +1.55
Access to Improved Water (WHO/UNICEF) 48.1 38 +0.70 +0.58
Water & Sanitation Services (AFR) . . . .
RURAL SECTOR 83.6 1 +2.07 +1.75
Rural Land & Water (IFAD) 79.8 3 +2.07 +0.75
Rural Business Climate (IFAD) 81.3 3 +2.02 +1.38
Rural Development Resources (IFAD) 93.8 2 +2.56 +6.25
Agricultural Support System (IFAD) 93.0 1 +4.66 +4.68
Agricultural Policy Costs (WEF) 91.6 1 +0.63 -2.10
Engagement with Rural Organisations (IFAD) 75.3 6 +1.81 +1.48
Gender Balance in Rural Decision-making (IFAD) 75.0 2 +0.69 0.00
Rural Accountability & Transparency (IFAD) 78.7 4 +2.02 +1.53
SUSTAINABLE ECONOMIC OPPORTUNITY
SCORE 2016
RANK 2016
10 -YEAR AAT
5-YEAR AAT
HUMAN DEVELOPMENT 72.4 5 +1.87 +0.73
WELFARE 79.2 1 +2.48 +0.98
Welfare Services (AfDB/WB) 100.0 1 +1.56 +1.00
Social Safety Nets (BS) 84.6 3 +4.27 +1.93
Social Protection & Labour (AfDB/WB) 79.5 1 +1.78 0.00
Social Exclusion (BS) 28.6 7 +1.59 +1.80
Poverty (AFR) . . . .
Poverty Reduction Priorities (AFR/AfDB/WB) 95.8 1 +0.92 0.00
Narrowing Income Gaps (AFR) . . . .
Environmental Policy (BS) 71.4 3 +4.76 0.00
Environmental Sustainability (AfDB/WB) 94.4 2 +2.47 +2.08
EDUCATION 51.3 23 +1.57 +0.38
Education Provision (AFR) . . . .
Education Quality (BS) 83.3 2 +3.70 +2.08
Educational System Management (WEF) 70.4 4 +1.30 +1.33
Human Resources in Primary Schools (UNESCO) 47.7 49 +1.38 +0.25
Primary School Completion (WB) 45.1 39 +1.32 -1.98
Secondary School Enrolment (UNESCO) 30.0 38 +1.74 -0.40
Tertiary Education Enrolment (UNESCO) 12.6 30 +0.78 +0.58
Literacy (WB) 70.3 29 +0.79 +0.90
HEALTH 86.7 4 +1.57 +0.85
Basic Health Services (AFR) . . . .
Public Health Campaigns (GI) 100.0 1 0.00 0.00
Child Mortality (IGME) 87.3 10 +2.31 +1.18
Maternal Mortality (MMEIG) 89.3 14 +0.86 +0.43
Access to Sanitation (WHO/UNICEF) 79.4 10 +0.59 +0.48
Undernourishment (WB) 52.2 35 +2.72 +1.23
Disease (WHO) 95.7 10 +1.20 +0.28
Immunisation (WB/WHO) 98.5 5 +0.22 0.00
Antiretroviral Treatment (ART) Provision (UNAIDS) 91.4 4 +4.69 +3.30
HUMAN DEVELOPMENT
N/A
N/A
N/A
N/A
N/A
N/A
*AAT: Annual Average Trend
If AAT appears the same in the two time periods, differences exist beyond the 2nd decimal place.
For a full list of data sources see Annex.
Increasing Improvement Slowing Improvement Warning Signs Bouncing Back Slowing Deterioration Increasing Deterioration No Change

147
2017 IIAG: Index Report2017 IIAG São Tomé & Príncipe Scores, Ranks & Trends
OVERALL GOVERNANCE
61.0 11th2016 SCORE 2016 RANK
+0.23 +0.1310 -YEAR AAT* 5-YEAR AAT
SAFETY & RULE OF LAW 64.2 11 -0.21 +0.10
RULE OF LAW 58.6 21 -0.77 -0.15
Judicial Independence (BS/WEF/V-Dem/GI) 51.5 21 -0.53 -1.20
Judicial Process (EIU/GI) 29.2 36 -1.39 -3.13
Access to Justice (V-Dem) 83.8 15 -0.22 -0.50
Property Rights (BS/HER/WEF/AfDB/WB) 54.1 20 +1.24 +4.00
Transfers of Power (EIU) 33.3 20 -3.71 0.00
Multilateral Sanctions (CDD) 100.0 1 0.00 0.00
ACCOUNTABILITY 39.3 21 +0.44 +0.48
Access to Information (GI) 54.2 7 -0.46 -1.03
Online Public Services (UNDESA) 5.9 49 -0.54 -2.50
Public Sector Accountability & Transparency (V-Dem/AfDB/WB)
72.2 8 +0.58 +0.18
Accountability of Public Officials (EIU/BS) 33.3 33 0.00 0.00
Corruption in Government & Public Officials (EIU) 40.0 17 +0.56 0.00
Corruption & Bureaucracy (WB) 57.1 8 +1.58 +3.55
Diversion of Public Funds (WEF) . . . .
Corruption Investigation (GI/AFR) 12.5 40 +1.39 +3.13
PERSONAL SAFETY 65.0 4 -0.56 0.00
Safety of the Person (EIU/AFR) 75.0 3 -2.78 0.00
Police Services (WEF/GI) 25.0 37 0.00 0.00
Social Unrest (EIU/ACLED) 50.0 34 0.00 0.00
Crime (EIU/AFR) 75.0 2 0.00 0.00
Political Violence (ACLED/PTS) 100.0 1 0.00 0.00
Human Trafficking (USDS) . . . .
NATIONAL SECURITY 93.7 9 +0.01 +0.03
Government Involvement in Armed Conflict (UCDP) 100.0 1 0.00 0.00
Domestic Armed Conflict (EIU) 100.0 1 0.00 0.00
Violence by Non-state Actors (ACLED) . . . .
Cross-border Tensions (EIU) 75.0 9 0.00 0.00
Internally Displaced People (IDMC) . . . .
Political Refugees (UNHCR) 99.7 16 +0.02 +0.03
SAFETY & RULE OF LAW
SCORE 2016
RANK 2016
10 -YEAR AAT
5-YEAR AAT
SCORE 2016
RANK 2016
10 -YEAR AAT
5-YEAR AAT
PARTICIPATION & HUMAN RIGHTS 64.7 11 -0.07 -0.55
PARTICIPATION 76.0 10 -0.01 -0.78
Political Participation (EIU/FH/V-Dem) 73.6 15 +0.20 +0.18
Civil Society Participation (BS/V-Dem/GI) 93.1 3 -0.18 -0.43
Free & Fair Elections (BS/CDD/V-Dem) 88.6 3 +0.51 -1.55
Election Monitoring Agencies (V-Dem/GI) 48.7 18 -0.58 -1.30
Legitimacy of Political Process (BS) . . . .
RIGHTS 57.3 12 -0.26 -0.60
Freedom of Expression (BS/RSF/V-Dem/GI) 66.3 26 -0.71 -1.65
Freedom of Association & Assembly (BS/GI) 75.0 8 -2.78 -6.25
Civil Liberties (BS/FH ) 83.3 5 0.00 0.00
Human Rights Conventions (UNOLA/OHCHR) 19.0 53 +0.52 +1.18
Human Rights Violations (EIU) 75.0 1 0.00 0.00
Protection against Discrimination (GI) 25.0 17 +1.39 +3.13
GENDER 60.9 22 +0.09 -0.28
Gender Equality (AfDB/WB) 55.4 26 -0.23 0.00
Women's Political Participation (IPU/GI/WB) 29.0 41 -0.13 -2.08
Gender Balance in Education (UNESCO) 82.1 16 -0.33 -0.45
Women's Labour Force Participation (WB) 43.5 38 +0.21 +0.15
Workplace Gender Equality (GI) 50.0 4 0.00 0.00
Women in the Judiciary (GI) 75.0 19 0.00 0.00
Laws on Violence against Women (OECD) . . . .
Women's Political Empowerment (V-Dem) 91.6 5 +1.12 +0.60
PARTICIPATION & HUMAN RIGHTS
SCORE 2016
RANK 2016
10 -YEAR AAT
5-YEAR AAT
SUSTAINABLE ECONOMIC OPPORTUNITY 44.1 32 +0.30 +0.83
PUBLIC MANAGEMENT 38.9 40 -0.64 -0.05
Governmental Statistical Capacity (WB) 56.5 29 0.00 -1.10
Civil Registration (GI) 25.0 47 0.00 0.00
Public Administration (AfDB/WB) 53.6 29 -0.52 -0.40
Diversification (AfDB/OECD/UNDP) 2.0 41 -0.41 -0.60
Budget Management (AfDB/WB) 60.5 25 +0.47 +0.35
Budget Balance (AfDB/AUC/UNECA) 34.4 43 -7.29 -0.03
Fiscal Policy (AfDB/WB) 73.0 18 +1.86 +1.38
Revenue Mobilisation (ICTD/UNU-WIDER/AfDB/WB) 44.9 32 +0.10 -0.05
Transparency of State-owned Companies (GI) 0.0 26 0.00 0.00
BUSINESS ENVIRONMENT 47.7 22 +0.83 +1.13
Investment Climate (HER) 72.2 11 +3.09 +4.15
Competition (BS/GI/AfDB/WB) 53.9 20 +0.23 +0.28
Business Bureaucracy & Red Tape (EIU) 33.3 10 0.00 0.00
Customs Procedures (WEF) . . . .
Soundness of Banks (WEF) . . . .
Employment Creation (AFR) . . . .
Regional Integration (AfDB) 31.3 37 0.00 0.00
INFRASTRUCTURE 45.0 18 +1.10 +1.78
Transport Infrastructure (WEF/AFR/EIU/GI) 25.0 40 +1.04 +3.13
Electricity Infrastructure (WEF/AFR) . . . .
Digital & IT Infrastructure (EIU/ITU) 34.3 25 +1.37 +1.45
Access to Improved Water (WHO/UNICEF) 75.7 13 +0.88 +0.73
Water & Sanitation Services (AFR) . . . .
RURAL SECTOR 44.9 39 -0.06 +0.53
Rural Land & Water (IFAD) 36.0 47 -0.06 +1.50
Rural Business Climate (IFAD) 38.4 42 -1.42 +0.80
Rural Development Resources (IFAD) 37.5 39 -0.87 -1.58
Agricultural Support System (IFAD) 51.1 31 +0.50 +1.18
Agricultural Policy Costs (WEF) . . . .
Engagement with Rural Organisations (IFAD) 65.3 14 +1.36 +0.63
Gender Balance in Rural Decision-making (IFAD) 37.5 36 -0.62 +1.05
Rural Accountability & Transparency (IFAD) 48.4 26 +0.73 0.00
SUSTAINABLE ECONOMIC OPPORTUNITY
SCORE 2016
RANK 2016
10 -YEAR AAT
5-YEAR AAT
HUMAN DEVELOPMENT 70.9 7 +0.91 +0.08
WELFARE 60.7 11 +0.76 +0.15
Welfare Services (AfDB/WB) 69.7 24 +1.23 +1.50
Social Safety Nets (BS) . . . .
Social Protection & Labour (AfDB/WB) 48.1 35 +0.49 -0.83
Social Exclusion (BS) . . . .
Poverty (AFR) . . . .
Poverty Reduction Priorities (AFR/AfDB/WB) 55.7 17 -1.16 0.00
Narrowing Income Gaps (AFR) . . . .
Environmental Policy (BS) . . . .
Environmental Sustainability (AfDB/WB) 69.4 18 +2.47 0.00
EDUCATION 68.1 6 +1.83 +0.50
Education Provision (AFR) . . . .
Education Quality (BS) . . . .
Educational System Management (WEF) . . . .
Human Resources in Primary Schools (UNESCO) 77.6 19 -0.47 -1.00
Primary School Completion (WB) 67.5 15 +1.10 -5.63
Secondary School Enrolment (UNESCO) 78.4 7 +4.07 +6.60
Tertiary Education Enrolment (UNESCO) 21.6 15 +1.73 +2.13
Literacy (WB) 95.6 4 +2.74 +0.50
HEALTH 83.8 7 +0.14 -0.48
Basic Health Services (AFR) . . . .
Public Health Campaigns (GI) 75.0 14 -2.78 -6.25
Child Mortality (IGME) 84.8 15 +0.82 +0.58
Maternal Mortality (MMEIG) 94.4 10 +0.07 +0.05
Access to Sanitation (WHO/UNICEF) 40.8 41 +1.30 +1.10
Undernourishment (WB) 97.1 12 +0.26 -0.33
Disease (WHO) 98.9 4 +0.70 +1.35
Immunisation (WB/WHO) 95.4 10 +0.64 +0.10
Antiretroviral Treatment (ART) Provision (UNAIDS) . . . .
HUMAN DEVELOPMENT
N/A
N/A
N/A
N/A
N/A
N/A
N/A
N/A
N/A
N/A
N/A
N/A
N/A
N/A
N/A
N/A
N/A
N/A
N/A
N/A
N/A
N/A
*AAT: Annual Average Trend
If AAT appears the same in the two time periods, differences exist beyond the 2nd decimal place.
For a full list of data sources see Annex.
Increasing Improvement Slowing Improvement Warning Signs Bouncing Back Slowing Deterioration Increasing Deterioration No Change

148
2017 IIAG Senegal Scores, Ranks & Trends
OVERALL GOVERNANCE
61.6 10th2016 SCORE 2016 RANK
+0.60 +0.7510 -YEAR AAT* 5-YEAR AAT
SAFETY & RULE OF LAW 65.2 10 +0.29 +0.83
RULE OF LAW 73.5 9 +0.71 +1.58
Judicial Independence (BS/WEF/V-Dem/GI) 63.5 12 +1.93 +3.80
Judicial Process (EIU/GI) 58.3 14 +1.84 +4.15
Access to Justice (V-Dem) 85.0 14 +0.10 +0.23
Property Rights (BS/HER/WEF/AfDB/WB) 67.5 10 +0.38 +1.23
Transfers of Power (EIU) 100.0 1 +3.70 +8.33
Multilateral Sanctions (CDD) 66.7 31 -3.70 -8.33
ACCOUNTABILITY 56.3 9 +1.46 +2.45
Access to Information (GI) 41.7 13 -3.23 -7.28
Online Public Services (UNDESA) 51.0 15 +1.31 +1.03
Public Sector Accountability & Transparency (V-Dem/AfDB/WB)
80.9 4 +1.37 +3.68
Accountability of Public Officials (EIU/BS) 59.5 7 +1.59 +3.58
Corruption in Government & Public Officials (EIU) 60.0 9 +2.22 +5.00
Corruption & Bureaucracy (WB) 57.1 8 +1.58 +3.55
Diversion of Public Funds (WEF) 45.5 14 +3.56 +5.90
Corruption Investigation (GI/AFR) 54.3 8 +3.18 +4.08
PERSONAL SAFETY 55.1 15 -0.32 +0.93
Safety of the Person (EIU/AFR) 59.8 13 +0.70 +1.58
Police Services (WEF/GI) 47.2 16 +0.57 +1.98
Social Unrest (EIU/ACLED) 59.1 26 -1.63 -3.53
Crime (EIU/AFR) 51.7 27 -0.32 +1.60
Political Violence (ACLED/PTS) 87.5 6 +1.51 +3.83
Human Trafficking (USDS) 25.0 21 -2.78 0.00
NATIONAL SECURITY 76.1 35 -0.67 -1.55
Government Involvement in Armed Conflict (UCDP) 88.9 19 -1.23 -2.78
Domestic Armed Conflict (EIU) 50.0 25 0.00 0.00
Violence by Non-state Actors (ACLED) 97.8 24 +0.04 -0.23
Cross-border Tensions (EIU) 25.0 42 -2.78 -6.25
Internally Displaced People (IDMC) 98.5 33 0.00 +0.03
Political Refugees (UNHCR) 96.3 40 -0.04 -0.08
SAFETY & RULE OF LAW
SCORE 2016
RANK 2016
10 -YEAR AAT
5-YEAR AAT
SCORE 2016
RANK 2016
10 -YEAR AAT
5-YEAR AAT
PARTICIPATION & HUMAN RIGHTS 68.3 9 +0.53 +0.70
PARTICIPATION 76.9 9 +0.14 +0.53
Political Participation (EIU/FH/V-Dem) 74.3 13 +0.56 -0.40
Civil Society Participation (BS/V-Dem/GI) 89.2 6 -0.10 +1.10
Free & Fair Elections (BS/CDD/V-Dem) 76.4 9 +0.84 +0.45
Election Monitoring Agencies (V-Dem/GI) 66.8 9 +0.68 +1.45
Legitimacy of Political Process (BS) 77.8 6 -1.23 0.00
RIGHTS 65.2 6 +0.84 +1.43
Freedom of Expression (BS/RSF/V-Dem/GI) 87.6 3 +0.20 -0.23
Freedom of Association & Assembly (BS/GI) 63.9 15 -0.61 -0.70
Civil Liberties (BS/FH ) 79.2 6 +0.93 +2.88
Human Rights Conventions (UNOLA/OHCHR) 85.7 4 +3.18 +3.58
Human Rights Violations (EIU) 50.0 7 0.00 0.00
Protection against Discrimination (GI) 25.0 17 +1.39 +3.13
GENDER 62.7 21 +0.59 +0.13
Gender Equality (AfDB/WB) 71.7 12 +0.47 +0.53
Women's Political Participation (IPU/GI/WB) 61.6 5 +1.17 -2.15
Gender Balance in Education (UNESCO) 100.0 1 +2.77 +2.33
Women's Labour Force Participation (WB) 43.2 39 +1.27 +0.18
Workplace Gender Equality (GI) 50.0 4 0.00 0.00
Women in the Judiciary (GI) 25.0 36 0.00 0.00
Laws on Violence against Women (OECD) 58.3 12 -1.86 -1.05
Women's Political Empowerment (V-Dem) 91.9 4 +0.90 +1.13
PARTICIPATION & HUMAN RIGHTS
SCORE 2016
RANK 2016
10 -YEAR AAT
5-YEAR AAT
SUSTAINABLE ECONOMIC OPPORTUNITY 54.9 12 +0.41 +0.15
PUBLIC MANAGEMENT 61.3 5 -0.11 +0.90
Governmental Statistical Capacity (WB) 76.8 6 -0.32 +3.98
Civil Registration (GI) 87.5 5 0.00 0.00
Public Administration (AfDB/WB) 79.2 9 0.00 0.00
Diversification (AfDB/OECD/UNDP) 18.8 7 -1.79 +0.98
Budget Management (AfDB/WB) 74.6 11 +0.62 +1.05
Budget Balance (AfDB/AUC/UNECA) 44.0 28 -0.08 +1.33
Fiscal Policy (AfDB/WB) 87.3 5 +0.62 +1.40
Revenue Mobilisation (ICTD/UNU-WIDER/AfDB/WB) 58.2 12 -0.11 -0.68
Transparency of State-owned Companies (GI) 25.0 7 0.00 0.00
BUSINESS ENVIRONMENT 57.6 10 +0.48 -0.13
Investment Climate (HER) 66.7 15 +1.23 +1.40
Competition (BS/GI/AfDB/WB) 60.2 15 +0.81 +2.00
Business Bureaucracy & Red Tape (EIU) 33.3 10 0.00 0.00
Customs Procedures (WEF) 68.8 4 +4.51 -2.30
Soundness of Banks (WEF) 51.3 12 -3.69 -5.00
Employment Creation (AFR) 35.3 17 +0.44 +3.08
Regional Integration (AfDB) 87.5 3 0.00 0.00
INFRASTRUCTURE 44.1 19 +1.13 +1.13
Transport Infrastructure (WEF/AFR/EIU/GI) 39.2 21 +1.07 +0.68
Electricity Infrastructure (WEF/AFR) 33.5 25 +1.81 +3.75
Digital & IT Infrastructure (EIU/ITU) 43.8 15 +3.24 +2.45
Access to Improved Water (WHO/UNICEF) 70.3 18 +0.97 +0.80
Water & Sanitation Services (AFR) 33.9 23 -1.41 -1.95
RURAL SECTOR 56.6 20 +0.14 -1.30
Rural Land & Water (IFAD) 55.1 23 -0.08 -0.40
Rural Business Climate (IFAD) 61.8 13 +0.82 -2.85
Rural Development Resources (IFAD) 50.0 25 -0.92 -3.13
Agricultural Support System (IFAD) 69.3 14 +0.84 0.00
Agricultural Policy Costs (WEF) 53.7 17 -0.57 -0.70
Engagement with Rural Organisations (IFAD) 76.8 4 +2.39 +1.75
Gender Balance in Rural Decision-making (IFAD) 37.5 36 -2.09 -5.20
Rural Accountability & Transparency (IFAD) 48.4 26 +0.76 0.00
SUSTAINABLE ECONOMIC OPPORTUNITY
SCORE 2016
RANK 2016
10 -YEAR AAT
5-YEAR AAT
HUMAN DEVELOPMENT 58.0 21 +1.16 +1.33
WELFARE 54.2 19 +1.19 +1.30
Welfare Services (AfDB/WB) 80.9 9 +1.02 0.00
Social Safety Nets (BS) 53.8 9 +0.84 0.00
Social Protection & Labour (AfDB/WB) 56.3 21 0.00 +0.28
Social Exclusion (BS) 14.3 20 0.00 0.00
Poverty (AFR) 48.0 21 +2.62 +5.45
Poverty Reduction Priorities (AFR/AfDB/WB) 55.5 18 +1.83 +1.40
Narrowing Income Gaps (AFR) 40.9 10 +2.16 +4.48
Environmental Policy (BS) 57.1 7 +1.58 0.00
Environmental Sustainability (AfDB/WB) 80.6 7 +0.62 0.00
EDUCATION 42.0 36 +0.69 +0.30
Education Provision (AFR) 23.9 30 -1.11 -1.40
Education Quality (BS) 33.3 21 0.00 0.00
Educational System Management (WEF) 49.7 14 +0.74 -0.30
Human Resources in Primary Schools (UNESCO) 77.6 19 +0.27 -0.13
Primary School Completion (WB) 41.4 41 +0.82 -0.38
Secondary School Enrolment (UNESCO) 42.7 25 +2.50 +1.78
Tertiary Education Enrolment (UNESCO) 16.6 19 +0.77 +0.25
Literacy (WB) 51.0 38 +1.53 +2.55
HEALTH 77.7 15 +1.59 +2.33
Basic Health Services (AFR) 34.7 28 -1.04 -0.48
Public Health Campaigns (GI) 100.0 1 +5.56 +12.50
Child Mortality (IGME) 84.8 15 +1.73 +0.98
Maternal Mortality (MMEIG) 88.4 17 +0.41 +0.35
Access to Sanitation (WHO/UNICEF) 64.7 19 +0.61 +0.50
Undernourishment (WB) 91.0 18 +1.78 +1.03
Disease (WHO) 90.2 20 +0.98 +0.05
Immunisation (WB/WHO) 85.2 26 -0.58 -0.65
Antiretroviral Treatment (ART) Provision (UNAIDS) 60.3 29 +4.86 +6.63
HUMAN DEVELOPMENT
*AAT: Annual Average Trend
If AAT appears the same in the two time periods, differences exist beyond the 2nd decimal place.
For a full list of data sources see Annex.
Increasing Improvement Slowing Improvement Warning Signs Bouncing Back Slowing Deterioration Increasing Deterioration No Change

149
2017 IIAG: Index Report2017 IIAG Seychelles Scores, Ranks & Trends
OVERALL GOVERNANCE
73.4 2nd2016 SCORE 2016 RANK
+0.60 +0.8510 -YEAR AAT* 5-YEAR AAT
SAFETY & RULE OF LAW 74.0 5 -0.14 +0.30
RULE OF LAW 76.3 7 +0.03 -0.08
Judicial Independence (BS/WEF/V-Dem/GI) 67.2 10 +0.48 +1.13
Judicial Process (EIU/GI) 37.5 33 -1.39 -3.13
Access to Justice (V-Dem) 86.6 11 +0.91 +2.05
Property Rights (BS/HER/WEF/AfDB/WB) 66.7 12 +0.23 -0.53
Transfers of Power (EIU) 100.0 1 0.00 0.00
Multilateral Sanctions (CDD) 100.0 1 0.00 0.00
ACCOUNTABILITY 59.6 8 +0.69 +1.65
Access to Information (GI) 54.2 7 +1.86 +4.18
Online Public Services (UNDESA) 54.9 14 +1.42 +2.45
Public Sector Accountability & Transparency (V-Dem/AfDB/WB)
62.1 16 -0.67 +0.05
Accountability of Public Officials (EIU/BS) 66.7 5 0.00 0.00
Corruption in Government & Public Officials (EIU) 80.0 3 +2.22 +5.00
Corruption & Bureaucracy (WB) 95.2 1 +2.64 +5.95
Diversion of Public Funds (WEF) 51.2 12 -0.60 -1.35
Corruption Investigation (GI/AFR) 12.5 40 -1.39 -3.13
PERSONAL SAFETY 60.3 7 -1.30 -0.33
Safety of the Person (EIU/AFR) 75.0 3 -2.78 -3.13
Police Services (WEF/GI) 36.5 27 +0.49 +1.10
Social Unrest (EIU/ACLED) 75.0 6 0.00 0.00
Crime (EIU/AFR) 75.0 2 0.00 +6.25
Political Violence (ACLED/PTS) 75.0 22 -2.78 -6.25
Human Trafficking (USDS) 25.0 21 -2.78 0.00
NATIONAL SECURITY 100.0 1 +0.03 +0.05
Government Involvement in Armed Conflict (UCDP) 100.0 1 0.00 0.00
Domestic Armed Conflict (EIU) 100.0 1 0.00 0.00
Violence by Non-state Actors (ACLED) . . . .
Cross-border Tensions (EIU) 100.0 1 0.00 0.00
Internally Displaced People (IDMC) 100.0 1 0.00 0.00
Political Refugees (UNHCR) 99.9 8 +0.16 +0.18
SAFETY & RULE OF LAW
SCORE 2016
RANK 2016
10 -YEAR AAT
5-YEAR AAT
SCORE 2016
RANK 2016
10 -YEAR AAT
5-YEAR AAT
PARTICIPATION & HUMAN RIGHTS 69.5 8 +1.00 +1.83
PARTICIPATION 74.3 11 +0.91 +2.85
Political Participation (EIU/FH/V-Dem) 82.4 7 +0.89 +0.90
Civil Society Participation (BS/V-Dem/GI) 81.1 11 +0.64 +1.45
Free & Fair Elections (BS/CDD/V-Dem) 68.1 14 -0.12 +4.10
Election Monitoring Agencies (V-Dem/GI) 65.8 11 +2.24 +5.05
Legitimacy of Political Process (BS) . . . .
RIGHTS 56.6 13 +0.70 +1.05
Freedom of Expression (BS/RSF/V-Dem/GI) 68.9 20 +0.34 +0.80
Freedom of Association & Assembly (BS/GI) 25.0 36 0.00 0.00
Civil Liberties (BS/FH ) 66.7 11 0.00 0.00
Human Rights Conventions (UNOLA/OHCHR) 66.7 22 +3.18 +2.40
Human Rights Violations (EIU) 75.0 1 -0.70 0.00
Protection against Discrimination (GI) 37.5 12 +1.39 +3.13
GENDER 77.5 2 +1.38 +1.55
Gender Equality (AfDB/WB) 87.5 7 +1.39 0.00
Women's Political Participation (IPU/GI/WB) 49.8 14 -0.20 -4.98
Gender Balance in Education (UNESCO) 87.0 7 +0.18 -0.30
Women's Labour Force Participation (WB) . . . .
Workplace Gender Equality (GI) 50.0 4 -2.78 -6.25
Women in the Judiciary (GI) 100.0 1 +8.33 +18.75
Laws on Violence against Women (OECD) . . . .
Women's Political Empowerment (V-Dem) 90.6 6 +1.36 +2.08
PARTICIPATION & HUMAN RIGHTS
SCORE 2016
RANK 2016
10 -YEAR AAT
5-YEAR AAT
SUSTAINABLE ECONOMIC OPPORTUNITY 65.0 5 +0.84 +0.35
PUBLIC MANAGEMENT 52.2 13 +1.84 +2.28
Governmental Statistical Capacity (WB) 69.6 13 +0.81 +2.18
Civil Registration (GI) 50.0 32 0.00 0.00
Public Administration (AfDB/WB) 50.0 33 0.00 0.00
Diversification (AfDB/OECD/UNDP) 3.7 32 -0.04 +0.13
Budget Management (AfDB/WB) 55.6 31 +1.24 0.00
Budget Balance (AfDB/AUC/UNECA) 69.6 3 +3.57 +5.85
Fiscal Policy (AfDB/WB) 55.6 34 +3.71 0.00
Revenue Mobilisation (ICTD/UNU-WIDER/AfDB/WB) 65.7 7 +1.74 -0.10
Transparency of State-owned Companies (GI) 50.0 1 +5.56 +12.50
BUSINESS ENVIRONMENT 52.6 15 -0.83 -1.60
Investment Climate (HER) 61.1 21 +0.61 +2.78
Competition (BS/GI/AfDB/WB) 31.3 45 -1.39 -3.13
Business Bureaucracy & Red Tape (EIU) 66.7 4 0.00 0.00
Customs Procedures (WEF) 53.3 12 -1.73 -3.90
Soundness of Banks (WEF) 50.6 14 -1.69 -3.80
Employment Creation (AFR) . . . .
Regional Integration (AfDB) . . . .
INFRASTRUCTURE 85.5 2 +1.18 +0.78
Transport Infrastructure (WEF/AFR/EIU/GI) 79.7 1 +0.38 +0.85
Electricity Infrastructure (WEF/AFR) 75.9 2 -1.21 -2.73
Digital & IT Infrastructure (EIU/ITU) 90.6 2 +5.33 +4.90
Access to Improved Water (WHO/UNICEF) 95.7 4 +0.18 +0.05
Water & Sanitation Services (AFR) . . . .
RURAL SECTOR 69.8 6 +1.22 -0.03
Rural Land & Water (IFAD) 70.4 10 +2.21 0.00
Rural Business Climate (IFAD) 61.7 14 +0.91 +0.48
Rural Development Resources (IFAD) 75.0 9 +1.39 0.00
Agricultural Support System (IFAD) 74.3 7 +1.14 0.00
Agricultural Policy Costs (WEF) 58.2 12 -0.26 -0.58
Engagement with Rural Organisations (IFAD) 67.4 8 +0.38 0.00
Gender Balance in Rural Decision-making (IFAD) 66.8 5 -0.33 0.00
Rural Accountability & Transparency (IFAD) 84.7 1 +4.37 0.00
SUSTAINABLE ECONOMIC OPPORTUNITY
SCORE 2016
RANK 2016
10 -YEAR AAT
5-YEAR AAT
HUMAN DEVELOPMENT 84.9 2 +0.68 +0.85
WELFARE 78.2 2 +0.96 0.00
Welfare Services (AfDB/WB) 60.0 38 +1.33 0.00
Social Safety Nets (BS) . . . .
Social Protection & Labour (AfDB/WB) 77.8 2 0.00 0.00
Social Exclusion (BS) . . . .
Poverty (AFR) . . . .
Poverty Reduction Priorities (AFR/AfDB/WB) 75.0 5 0.00 0.00
Narrowing Income Gaps (AFR) . . . .
Environmental Policy (BS) . . . .
Environmental Sustainability (AfDB/WB) 100.0 1 +2.47 0.00
EDUCATION 77.0 2 +0.50 +1.35
Education Provision (AFR) . . . .
Education Quality (BS) . . . .
Educational System Management (WEF) 72.6 3 +0.73 +1.65
Human Resources in Primary Schools (UNESCO) 98.6 1 -0.16 -0.33
Primary School Completion (WB) 93.6 1 -0.39 +0.98
Secondary School Enrolment (UNESCO) 73.9 9 +0.33 +0.18
Tertiary Education Enrolment (UNESCO) 23.0 14 +2.17 +5.33
Literacy (WB) 100.0 1 +0.30 +0.25
HEALTH 99.7 1 +0.59 +1.28
Basic Health Services (AFR) . . . .
Public Health Campaigns (GI) 100.0 1 +2.78 +6.25
Child Mortality (IGME) 99.9 3 +0.03 +0.08
Maternal Mortality (MMEIG) . . . .
Access to Sanitation (WHO/UNICEF) 100.0 1 +0.22 +0.18
Undernourishment (WB) . . . .
Disease (WHO) 100.0 1 +0.09 0.00
Immunisation (WB/WHO) 98.5 5 -0.17 -0.20
Antiretroviral Treatment (ART) Provision (UNAIDS) . . . .
HUMAN DEVELOPMENTN/A
N/A
N/A
N/A
N/A
N/A
N/A
N/A
N/A
N/A
N/A
N/A
N/A
N/A
N/A
N/A
N/A
N/A
*AAT: Annual Average Trend
If AAT appears the same in the two time periods, differences exist beyond the 2nd decimal place.
For a full list of data sources see Annex.
Increasing Improvement Slowing Improvement Warning Signs Bouncing Back Slowing Deterioration Increasing Deterioration No Change

150
2017 IIAG Sierra Leone Scores, Ranks & Trends
OVERALL GOVERNANCE
51.7 26th2016 SCORE 2016 RANK
+0.38 -0.2310 -YEAR AAT* 5-YEAR AAT
SAFETY & RULE OF LAW 60.6 20 +0.99 +0.55
RULE OF LAW 59.2 18 +2.00 +2.25
Judicial Independence (BS/WEF/V-Dem/GI) 43.6 25 +0.52 +1.90
Judicial Process (EIU/GI) 41.7 26 +1.86 0.00
Access to Justice (V-Dem) 57.3 33 +1.01 +1.10
Property Rights (BS/HER/WEF/AfDB/WB) 45.7 32 +1.19 +2.15
Transfers of Power (EIU) 66.7 8 +3.71 +8.35
Multilateral Sanctions (CDD) 100.0 1 +3.70 0.00
ACCOUNTABILITY 33.3 28 +0.58 -1.25
Access to Information (GI) 25.0 31 0.00 0.00
Online Public Services (UNDESA) 15.7 38 +0.69 -1.83
Public Sector Accountability & Transparency (V-Dem/AfDB/WB)
41.5 26 -0.06 -1.80
Accountability of Public Officials (EIU/BS) 45.2 12 +3.43 +0.88
Corruption in Government & Public Officials (EIU) 40.0 17 +4.44 +5.00
Corruption & Bureaucracy (WB) 38.1 17 +1.06 -1.20
Diversion of Public Funds (WEF) 22.9 30 -0.77 -1.73
Corruption Investigation (GI/AFR) 37.7 24 -4.19 -9.43
PERSONAL SAFETY 62.3 6 +0.13 +1.63
Safety of the Person (EIU/AFR) 77.5 2 +1.66 +3.73
Police Services (WEF/GI) 42.2 21 -0.08 -0.18
Social Unrest (EIU/ACLED) 70.7 15 -0.46 +0.68
Crime (EIU/AFR) 50.3 28 -0.52 -1.18
Political Violence (ACLED/PTS) 82.9 11 +0.18 +0.40
Human Trafficking (USDS) 50.0 1 0.00 +6.25
NATIONAL SECURITY 87.6 20 +1.22 -0.45
Government Involvement in Armed Conflict (UCDP) 77.8 33 -2.47 -2.78
Domestic Armed Conflict (EIU) 75.0 9 +2.78 0.00
Violence by Non-state Actors (ACLED) 99.6 11 +0.14 0.00
Cross-border Tensions (EIU) 75.0 9 +5.56 0.00
Internally Displaced People (IDMC) 100.0 1 +0.06 0.00
Political Refugees (UNHCR) 98.4 29 +1.30 +0.18
SAFETY & RULE OF LAW
SCORE 2016
RANK 2016
10 -YEAR AAT
5-YEAR AAT
SCORE 2016
RANK 2016
10 -YEAR AAT
5-YEAR AAT
PARTICIPATION & HUMAN RIGHTS 63.4 14 +0.79 +1.20
PARTICIPATION 65.9 14 +0.14 +0.85
Political Participation (EIU/FH/V-Dem) 61.2 26 -1.18 -0.98
Civil Society Participation (BS/V-Dem/GI) 73.0 18 +0.06 -0.40
Free & Fair Elections (BS/CDD/V-Dem) 64.3 17 -0.60 0.00
Election Monitoring Agencies (V-Dem/GI) 64.1 13 +2.44 +5.60
Legitimacy of Political Process (BS) 66.7 12 0.00 0.00
RIGHTS 56.3 14 +0.72 +1.00
Freedom of Expression (BS/RSF/V-Dem/GI) 62.9 30 -1.01 -2.10
Freedom of Association & Assembly (BS/GI) 57.6 20 -0.08 -0.18
Civil Liberties (BS/FH ) 70.8 10 +1.39 +0.78
Human Rights Conventions (UNOLA/OHCHR) 71.4 16 +2.64 +1.18
Human Rights Violations (EIU) 25.0 25 -2.78 -3.13
Protection against Discrimination (GI) 50.0 3 +4.17 +9.38
GENDER 68.1 13 +1.50 +1.80
Gender Equality (AfDB/WB) 42.9 39 -0.93 -0.53
Women's Political Participation (IPU/GI/WB) 28.7 42 +0.62 +2.28
Gender Balance in Education (UNESCO) 81.2 19 +3.39 +1.33
Women's Labour Force Participation (WB) 69.0 25 -0.01 0.00
Workplace Gender Equality (GI) 75.0 2 +2.78 +6.25
Women in the Judiciary (GI) 100.0 1 0.00 0.00
Laws on Violence against Women (OECD) 66.7 6 +4.63 +2.10
Women's Political Empowerment (V-Dem) 81.3 20 +1.56 +2.95
PARTICIPATION & HUMAN RIGHTS
SCORE 2016
RANK 2016
10 -YEAR AAT
5-YEAR AAT
SUSTAINABLE ECONOMIC OPPORTUNITY 38.5 38 -0.32 -1.63
PUBLIC MANAGEMENT 43.8 32 -0.02 +0.48
Governmental Statistical Capacity (WB) 60.9 25 +2.26 +2.90
Civil Registration (GI) 75.0 10 0.00 0.00
Public Administration (AfDB/WB) 59.9 23 +0.18 +0.40
Diversification (AfDB/OECD/UNDP) 7.5 20 -0.17 +0.85
Budget Management (AfDB/WB) 66.3 23 -0.30 -0.68
Budget Balance (AfDB/AUC/UNECA) 32.9 45 -2.33 +0.18
Fiscal Policy (AfDB/WB) 56.3 30 -0.80 0.00
Revenue Mobilisation (ICTD/UNU-WIDER/AfDB/WB) 35.0 42 +0.97 +0.53
Transparency of State-owned Companies (GI) 0.0 26 0.00 0.00
BUSINESS ENVIRONMENT 38.8 35 -0.41 -2.18
Investment Climate (HER) 66.7 15 +3.71 +1.40
Competition (BS/GI/AfDB/WB) 50.8 22 +0.58 -0.53
Business Bureaucracy & Red Tape (EIU) 0.0 31 0.00 0.00
Customs Procedures (WEF) 36.0 34 +0.57 +1.28
Soundness of Banks (WEF) 32.4 31 -2.22 -5.00
Employment Creation (AFR) 23.0 29 -5.54 -12.48
Regional Integration (AfDB) 62.5 16 0.00 0.00
INFRASTRUCTURE 22.4 47 -1.36 -3.65
Transport Infrastructure (WEF/AFR/EIU/GI) 26.8 38 -0.90 -2.03
Electricity Infrastructure (WEF/AFR) 16.4 35 -2.78 -6.25
Digital & IT Infrastructure (EIU/ITU) 19.1 42 +1.68 +2.83
Access to Improved Water (WHO/UNICEF) 49.7 37 +1.44 +1.20
Water & Sanitation Services (AFR) 0.0 33 -6.21 -13.98
RURAL SECTOR 48.9 32 +0.48 -1.20
Rural Land & Water (IFAD) 44.4 37 +1.77 +1.63
Rural Business Climate (IFAD) 50.2 33 0.00 -1.45
Rural Development Resources (IFAD) 50.0 25 +0.47 -1.58
Agricultural Support System (IFAD) 65.1 16 +3.88 0.00
Agricultural Policy Costs (WEF) 41.0 34 -2.43 -5.48
Engagement with Rural Organisations (IFAD) 54.0 31 +0.27 -0.33
Gender Balance in Rural Decision-making (IFAD) 50.0 13 +1.39 +2.05
Rural Accountability & Transparency (IFAD) 36.3 35 -1.51 -4.55
SUSTAINABLE ECONOMIC OPPORTUNITY
SCORE 2016
RANK 2016
10 -YEAR AAT
5-YEAR AAT
HUMAN DEVELOPMENT 44.5 49 +0.09 -0.95
WELFARE 36.2 46 -1.02 -2.80
Welfare Services (AfDB/WB) 52.6 44 -0.79 -1.78
Social Safety Nets (BS) 30.8 31 0.00 +0.98
Social Protection & Labour (AfDB/WB) 57.9 19 +0.79 0.00
Social Exclusion (BS) 0.0 33 0.00 0.00
Poverty (AFR) 43.9 22 -0.58 -1.30
Poverty Reduction Priorities (AFR/AfDB/WB) 33.8 46 -2.43 -6.38
Narrowing Income Gaps (AFR) 8.6 33 -7.37 -16.58
Environmental Policy (BS) 42.9 14 0.00 0.00
Environmental Sustainability (AfDB/WB) 55.6 38 +1.24 0.00
EDUCATION 40.3 39 +0.10 -0.25
Education Provision (AFR) 30.4 27 -1.88 -4.23
Education Quality (BS) 33.3 21 0.00 -2.10
Educational System Management (WEF) 33.6 25 +0.78 +1.75
Human Resources in Primary Schools (UNESCO) 93.3 3 +1.94 +4.18
Primary School Completion (WB) 50.3 32 -1.99 -1.25
Secondary School Enrolment (UNESCO) 36.4 31 +0.63 -1.45
Tertiary Education Enrolment (UNESCO) 3.1 49 0.00 0.00
Literacy (WB) 42.1 42 +1.37 +1.15
HEALTH 57.0 49 +1.20 +0.18
Basic Health Services (AFR) 49.8 18 -3.12 -7.03
Public Health Campaigns (GI) 50.0 33 0.00 0.00
Child Mortality (IGME) 51.9 50 +3.38 +2.38
Maternal Mortality (MMEIG) 48.8 53 +1.83 +1.40
Access to Sanitation (WHO/UNICEF) 45.2 39 +0.39 +0.33
Undernourishment (WB) 68.9 29 +2.42 +1.23
Disease (WHO) 55.3 52 -2.42 +1.70
Immunisation (WB/WHO) 81.4 29 +2.52 -1.70
Antiretroviral Treatment (ART) Provision (UNAIDS) 61.5 26 +5.77 +3.28
HUMAN DEVELOPMENT
*AAT: Annual Average Trend
If AAT appears the same in the two time periods, differences exist beyond the 2nd decimal place.
For a full list of data sources see Annex.
Increasing Improvement Slowing Improvement Warning Signs Bouncing Back Slowing Deterioration Increasing Deterioration No Change
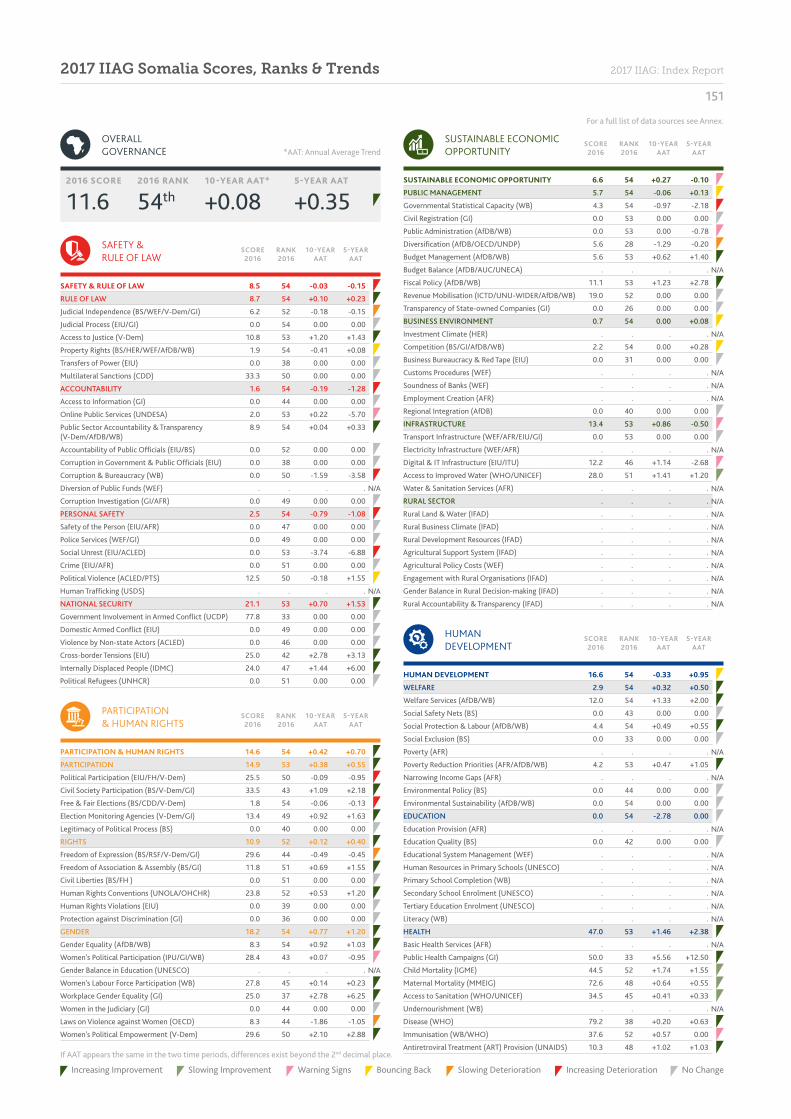
151
2017 IIAG: Index Report2017 IIAG Somalia Scores, Ranks & Trends
OVERALL GOVERNANCE
11.6 54th2016 SCORE 2016 RANK
+0.08 +0.3510 -YEAR AAT* 5-YEAR AAT
SAFETY & RULE OF LAW 8.5 54 -0.03 -0.15
RULE OF LAW 8.7 54 +0.10 +0.23
Judicial Independence (BS/WEF/V-Dem/GI) 6.2 52 -0.18 -0.15
Judicial Process (EIU/GI) 0.0 54 0.00 0.00
Access to Justice (V-Dem) 10.8 53 +1.20 +1.43
Property Rights (BS/HER/WEF/AfDB/WB) 1.9 54 -0.41 +0.08
Transfers of Power (EIU) 0.0 38 0.00 0.00
Multilateral Sanctions (CDD) 33.3 50 0.00 0.00
ACCOUNTABILITY 1.6 54 -0.19 -1.28
Access to Information (GI) 0.0 44 0.00 0.00
Online Public Services (UNDESA) 2.0 53 +0.22 -5.70
Public Sector Accountability & Transparency (V-Dem/AfDB/WB)
8.9 54 +0.04 +0.33
Accountability of Public Officials (EIU/BS) 0.0 52 0.00 0.00
Corruption in Government & Public Officials (EIU) 0.0 38 0.00 0.00
Corruption & Bureaucracy (WB) 0.0 50 -1.59 -3.58
Diversion of Public Funds (WEF) . . . .
Corruption Investigation (GI/AFR) 0.0 49 0.00 0.00
PERSONAL SAFETY 2.5 54 -0.79 -1.08
Safety of the Person (EIU/AFR) 0.0 47 0.00 0.00
Police Services (WEF/GI) 0.0 49 0.00 0.00
Social Unrest (EIU/ACLED) 0.0 53 -3.74 -6.88
Crime (EIU/AFR) 0.0 51 0.00 0.00
Political Violence (ACLED/PTS) 12.5 50 -0.18 +1.55
Human Trafficking (USDS) . . . .
NATIONAL SECURITY 21.1 53 +0.70 +1.53
Government Involvement in Armed Conflict (UCDP) 77.8 33 0.00 0.00
Domestic Armed Conflict (EIU) 0.0 49 0.00 0.00
Violence by Non-state Actors (ACLED) 0.0 46 0.00 0.00
Cross-border Tensions (EIU) 25.0 42 +2.78 +3.13
Internally Displaced People (IDMC) 24.0 47 +1.44 +6.00
Political Refugees (UNHCR) 0.0 51 0.00 0.00
SAFETY & RULE OF LAW
SCORE 2016
RANK 2016
10 -YEAR AAT
5-YEAR AAT
SCORE 2016
RANK 2016
10 -YEAR AAT
5-YEAR AAT
PARTICIPATION & HUMAN RIGHTS 14.6 54 +0.42 +0.70
PARTICIPATION 14.9 53 +0.38 +0.55
Political Participation (EIU/FH/V-Dem) 25.5 50 -0.09 -0.95
Civil Society Participation (BS/V-Dem/GI) 33.5 43 +1.09 +2.18
Free & Fair Elections (BS/CDD/V-Dem) 1.8 54 -0.06 -0.13
Election Monitoring Agencies (V-Dem/GI) 13.4 49 +0.92 +1.63
Legitimacy of Political Process (BS) 0.0 40 0.00 0.00
RIGHTS 10.9 52 +0.12 +0.40
Freedom of Expression (BS/RSF/V-Dem/GI) 29.6 44 -0.49 -0.45
Freedom of Association & Assembly (BS/GI) 11.8 51 +0.69 +1.55
Civil Liberties (BS/FH ) 0.0 51 0.00 0.00
Human Rights Conventions (UNOLA/OHCHR) 23.8 52 +0.53 +1.20
Human Rights Violations (EIU) 0.0 39 0.00 0.00
Protection against Discrimination (GI) 0.0 36 0.00 0.00
GENDER 18.2 54 +0.77 +1.20
Gender Equality (AfDB/WB) 8.3 54 +0.92 +1.03
Women's Political Participation (IPU/GI/WB) 28.4 43 +0.07 -0.95
Gender Balance in Education (UNESCO) . . . .
Women's Labour Force Participation (WB) 27.8 45 +0.14 +0.23
Workplace Gender Equality (GI) 25.0 37 +2.78 +6.25
Women in the Judiciary (GI) 0.0 44 0.00 0.00
Laws on Violence against Women (OECD) 8.3 44 -1.86 -1.05
Women's Political Empowerment (V-Dem) 29.6 50 +2.10 +2.88
PARTICIPATION & HUMAN RIGHTS
SCORE 2016
RANK 2016
10 -YEAR AAT
5-YEAR AAT
SUSTAINABLE ECONOMIC OPPORTUNITY 6.6 54 +0.27 -0.10
PUBLIC MANAGEMENT 5.7 54 -0.06 +0.13
Governmental Statistical Capacity (WB) 4.3 54 -0.97 -2.18
Civil Registration (GI) 0.0 53 0.00 0.00
Public Administration (AfDB/WB) 0.0 53 0.00 -0.78
Diversification (AfDB/OECD/UNDP) 5.6 28 -1.29 -0.20
Budget Management (AfDB/WB) 5.6 53 +0.62 +1.40
Budget Balance (AfDB/AUC/UNECA) . . . .
Fiscal Policy (AfDB/WB) 11.1 53 +1.23 +2.78
Revenue Mobilisation (ICTD/UNU-WIDER/AfDB/WB) 19.0 52 0.00 0.00
Transparency of State-owned Companies (GI) 0.0 26 0.00 0.00
BUSINESS ENVIRONMENT 0.7 54 0.00 +0.08
Investment Climate (HER) . . . .
Competition (BS/GI/AfDB/WB) 2.2 54 0.00 +0.28
Business Bureaucracy & Red Tape (EIU) 0.0 31 0.00 0.00
Customs Procedures (WEF) . . . .
Soundness of Banks (WEF) . . . .
Employment Creation (AFR) . . . .
Regional Integration (AfDB) 0.0 40 0.00 0.00
INFRASTRUCTURE 13.4 53 +0.86 -0.50
Transport Infrastructure (WEF/AFR/EIU/GI) 0.0 53 0.00 0.00
Electricity Infrastructure (WEF/AFR) . . . .
Digital & IT Infrastructure (EIU/ITU) 12.2 46 +1.14 -2.68
Access to Improved Water (WHO/UNICEF) 28.0 51 +1.41 +1.20
Water & Sanitation Services (AFR) . . . .
RURAL SECTOR . . . .
Rural Land & Water (IFAD) . . . .
Rural Business Climate (IFAD) . . . .
Rural Development Resources (IFAD) . . . .
Agricultural Support System (IFAD) . . . .
Agricultural Policy Costs (WEF) . . . .
Engagement with Rural Organisations (IFAD) . . . .
Gender Balance in Rural Decision-making (IFAD) . . . .
Rural Accountability & Transparency (IFAD) . . . .
SUSTAINABLE ECONOMIC OPPORTUNITY
SCORE 2016
RANK 2016
10 -YEAR AAT
5-YEAR AAT
HUMAN DEVELOPMENT 16.6 54 -0.33 +0.95
WELFARE 2.9 54 +0.32 +0.50
Welfare Services (AfDB/WB) 12.0 54 +1.33 +2.00
Social Safety Nets (BS) 0.0 43 0.00 0.00
Social Protection & Labour (AfDB/WB) 4.4 54 +0.49 +0.55
Social Exclusion (BS) 0.0 33 0.00 0.00
Poverty (AFR) . . . .
Poverty Reduction Priorities (AFR/AfDB/WB) 4.2 53 +0.47 +1.05
Narrowing Income Gaps (AFR) . . . .
Environmental Policy (BS) 0.0 44 0.00 0.00
Environmental Sustainability (AfDB/WB) 0.0 54 0.00 0.00
EDUCATION 0.0 54 -2.78 0.00
Education Provision (AFR) . . . .
Education Quality (BS) 0.0 42 0.00 0.00
Educational System Management (WEF) . . . .
Human Resources in Primary Schools (UNESCO) . . . .
Primary School Completion (WB) . . . .
Secondary School Enrolment (UNESCO) . . . .
Tertiary Education Enrolment (UNESCO) . . . .
Literacy (WB) . . . .
HEALTH 47.0 53 +1.46 +2.38
Basic Health Services (AFR) . . . .
Public Health Campaigns (GI) 50.0 33 +5.56 +12.50
Child Mortality (IGME) 44.5 52 +1.74 +1.55
Maternal Mortality (MMEIG) 72.6 48 +0.64 +0.55
Access to Sanitation (WHO/UNICEF) 34.5 45 +0.41 +0.33
Undernourishment (WB) . . . .
Disease (WHO) 79.2 38 +0.20 +0.63
Immunisation (WB/WHO) 37.6 52 +0.57 0.00
Antiretroviral Treatment (ART) Provision (UNAIDS) 10.3 48 +1.02 +1.03
HUMAN DEVELOPMENT
N/A
N/A
N/A
N/A
N/A
N/A
N/A
N/A
N/A
N/A
N/A
N/A
N/A
N/A
N/A
N/A
N/A
N/A
N/A
N/A
N/A
N/A
N/A
N/A
N/A
N/A
N/A
N/A
N/A
N/A
*AAT: Annual Average Trend
If AAT appears the same in the two time periods, differences exist beyond the 2nd decimal place.
For a full list of data sources see Annex.
Increasing Improvement Slowing Improvement Warning Signs Bouncing Back Slowing Deterioration Increasing Deterioration No Change

152
2017 IIAG South Africa Scores, Ranks & Trends
OVERALL GOVERNANCE
70.1 6th2016 SCORE 2016 RANK
-0.14 +0.1510 -YEAR AAT* 5-YEAR AAT
SAFETY & RULE OF LAW 67.1 7 -0.37 +0.65
RULE OF LAW 94.7 1 +0.30 +0.68
Judicial Independence (BS/WEF/V-Dem/GI) 96.5 1 +0.78 +1.45
Judicial Process (EIU/GI) 100.0 1 +1.86 +4.18
Access to Justice (V-Dem) 86.3 12 -1.00 -2.45
Property Rights (BS/HER/WEF/AfDB/WB) 85.4 1 +0.16 +0.95
Transfers of Power (EIU) 100.0 1 0.00 0.00
Multilateral Sanctions (CDD) 100.0 1 0.00 0.00
ACCOUNTABILITY 61.9 5 -0.98 -0.10
Access to Information (GI) 54.2 7 0.00 0.00
Online Public Services (UNDESA) 75.5 5 +0.01 +3.40
Public Sector Accountability & Transparency (V-Dem/AfDB/WB)
77.7 5 +0.40 +1.08
Accountability of Public Officials (EIU/BS) 69.0 3 -0.80 0.00
Corruption in Government & Public Officials (EIU) 80.0 3 0.00 0.00
Corruption & Bureaucracy (WB) 57.1 8 -1.59 0.00
Diversion of Public Funds (WEF) 34.7 24 -2.77 +0.33
Corruption Investigation (GI/AFR) 47.0 15 -3.03 -5.63
PERSONAL SAFETY 33.4 47 -0.36 +0.28
Safety of the Person (EIU/AFR) 19.3 46 -1.56 -0.28
Police Services (WEF/GI) 40.1 23 +0.14 -1.38
Social Unrest (EIU/ACLED) 12.5 50 -2.34 -2.35
Crime (EIU/AFR) 13.6 50 -0.76 -1.50
Political Violence (ACLED/PTS) 65.1 37 -0.41 +7.15
Human Trafficking (USDS) 50.0 1 +2.78 0.00
NATIONAL SECURITY 78.5 33 -0.41 +1.75
Government Involvement in Armed Conflict (UCDP) 100.0 1 0.00 0.00
Domestic Armed Conflict (EIU) 50.0 25 0.00 +6.25
Violence by Non-state Actors (ACLED) 46.0 43 -5.28 +4.25
Cross-border Tensions (EIU) 75.0 9 +2.78 0.00
Internally Displaced People (IDMC) 100.0 1 0.00 0.00
Political Refugees (UNHCR) 100.0 1 0.00 0.00
SAFETY & RULE OF LAW
SCORE 2016
RANK 2016
10 -YEAR AAT
5-YEAR AAT
SCORE 2016
RANK 2016
10 -YEAR AAT
5-YEAR AAT
PARTICIPATION & HUMAN RIGHTS 74.7 4 -0.18 +0.20
PARTICIPATION 80.1 8 -0.46 +0.78
Political Participation (EIU/FH/V-Dem) 94.6 2 +0.38 +0.85
Civil Society Participation (BS/V-Dem/GI) 71.2 19 +0.14 +1.53
Free & Fair Elections (BS/CDD/V-Dem) 73.5 12 -1.12 -0.38
Election Monitoring Agencies (V-Dem/GI) 83.6 2 +0.83 +1.88
Legitimacy of Political Process (BS) 77.8 6 -2.47 0.00
RIGHTS 70.3 3 -0.18 +0.20
Freedom of Expression (BS/RSF/V-Dem/GI) 81.3 5 -0.53 -0.03
Freedom of Association & Assembly (BS/GI) 64.6 13 -2.54 -3.65
Civil Liberties (BS/FH ) 79.2 6 -0.69 0.00
Human Rights Conventions (UNOLA/OHCHR) 71.4 16 +2.64 +4.75
Human Rights Violations (EIU) 50.0 7 0.00 0.00
Protection against Discrimination (GI) 75.0 1 0.00 0.00
GENDER 73.8 5 +0.10 -0.35
Gender Equality (AfDB/WB) 100.0 1 +1.39 0.00
Women's Political Participation (IPU/GI/WB) 77.5 2 +0.69 +0.15
Gender Balance in Education (UNESCO) 87.0 7 -1.37 0.00
Women's Labour Force Participation (WB) 44.7 37 -0.06 +0.58
Workplace Gender Equality (GI) 50.0 4 0.00 0.00
Women in the Judiciary (GI) 75.0 19 0.00 0.00
Laws on Violence against Women (OECD) 66.7 6 +0.97 -1.03
Women's Political Empowerment (V-Dem) 89.4 7 -0.86 -2.53
PARTICIPATION & HUMAN RIGHTS
SCORE 2016
RANK 2016
10 -YEAR AAT
5-YEAR AAT
SUSTAINABLE ECONOMIC OPPORTUNITY 67.6 4 -0.08 -0.03
PUBLIC MANAGEMENT 72.0 1 -1.29 -0.48
Governmental Statistical Capacity (WB) 85.5 4 -1.29 +3.25
Civil Registration (GI) 75.0 10 0.00 0.00
Public Administration (AfDB/WB) 100.0 1 0.00 0.00
Diversification (AfDB/OECD/UNDP) 36.8 3 -2.14 +4.20
Budget Management (AfDB/WB) 88.9 1 0.00 0.00
Budget Balance (AfDB/AUC/UNECA) 48.1 20 -1.50 +0.18
Fiscal Policy (AfDB/WB) 88.9 1 -1.23 0.00
Revenue Mobilisation (ICTD/UNU-WIDER/AfDB/WB) 74.4 3 +0.02 +0.48
Transparency of State-owned Companies (GI) 50.0 1 -5.56 -12.50
BUSINESS ENVIRONMENT 70.5 3 +0.44 +1.00
Investment Climate (HER) 44.4 38 -1.24 -1.40
Competition (BS/GI/AfDB/WB) 87.5 2 -0.21 +0.55
Business Bureaucracy & Red Tape (EIU) 100.0 1 +3.70 +8.33
Customs Procedures (WEF) 62.7 8 +1.29 -0.90
Soundness of Banks (WEF) 97.7 1 -0.02 -0.58
Employment Creation (AFR) 30.4 20 -0.86 -0.03
Regional Integration (AfDB) . . . .
INFRASTRUCTURE 63.4 7 +0.39 -1.08
Transport Infrastructure (WEF/AFR/EIU/GI) 66.3 4 -0.14 -1.23
Electricity Infrastructure (WEF/AFR) 39.3 17 -2.53 -4.65
Digital & IT Infrastructure (EIU/ITU) 74.0 4 +4.19 +2.23
Access to Improved Water (WHO/UNICEF) 81.8 9 +0.52 +0.43
Water & Sanitation Services (AFR) 55.9 6 -0.07 -2.00
RURAL SECTOR 64.6 8 +0.17 +0.50
Rural Land & Water (IFAD) 61.2 21 +0.61 0.00
Rural Business Climate (IFAD) 69.2 6 +1.11 +1.38
Rural Development Resources (IFAD) 81.3 6 +0.70 +3.13
Agricultural Support System (IFAD) 46.4 35 -1.18 0.00
Agricultural Policy Costs (WEF) 55.0 14 -2.32 -2.80
Engagement with Rural Organisations (IFAD) 62.4 19 +1.58 +0.75
Gender Balance in Rural Decision-making (IFAD) 75.0 2 +1.04 0.00
Rural Accountability & Transparency (IFAD) 66.6 8 -0.21 +1.53
SUSTAINABLE ECONOMIC OPPORTUNITY
SCORE 2016
RANK 2016
10 -YEAR AAT
5-YEAR AAT
HUMAN DEVELOPMENT 70.7 8 +0.02 -0.25
WELFARE 69.3 5 -0.28 -0.10
Welfare Services (AfDB/WB) 72.0 16 0.00 0.00
Social Safety Nets (BS) 76.9 4 -0.86 -0.98
Social Protection & Labour (AfDB/WB) 77.8 2 0.00 0.00
Social Exclusion (BS) 57.1 2 0.00 0.00
Poverty (AFR) 77.7 5 +1.24 +0.83
Poverty Reduction Priorities (AFR/AfDB/WB) 60.6 11 -1.00 -0.43
Narrowing Income Gaps (AFR) 37.9 13 -1.60 -0.28
Environmental Policy (BS) 85.7 1 -1.59 0.00
Environmental Sustainability (AfDB/WB) 77.8 9 +1.23 0.00
EDUCATION 63.9 11 -0.33 -0.48
Education Provision (AFR) 54.3 12 -0.64 -1.98
Education Quality (BS) 66.7 6 -1.84 -4.15
Educational System Management (WEF) 12.3 37 -1.80 +0.45
Human Resources in Primary Schools (UNESCO) 75.9 22 -0.06 -0.20
Primary School Completion (WB) 80.5 11 0.00 0.00
Secondary School Enrolment (UNESCO) 90.8 3 +0.78 +1.70
Tertiary Education Enrolment (UNESCO) 31.4 9 +0.07 +0.15
Literacy (WB) 99.1 3 +0.81 +0.28
HEALTH 79.1 13 +0.69 -0.18
Basic Health Services (AFR) 55.1 12 -0.04 -1.20
Public Health Campaigns (GI) 50.0 33 -2.78 -6.25
Child Mortality (IGME) 87.8 9 +1.53 +0.80
Maternal Mortality (MMEIG) 95.1 8 -0.06 +0.13
Access to Sanitation (WHO/UNICEF) 84.8 8 +0.72 +0.58
Undernourishment (WB) 100.0 1 0.00 0.00
Disease (WHO) 85.1 28 +0.40 +0.28
Immunisation (WB/WHO) 69.9 41 +0.39 -0.40
Antiretroviral Treatment (ART) Provision (UNAIDS) 83.7 10 +6.02 +4.35
HUMAN DEVELOPMENT
N/A
*AAT: Annual Average Trend
If AAT appears the same in the two time periods, differences exist beyond the 2nd decimal place.
For a full list of data sources see Annex.
Increasing Improvement Slowing Improvement Warning Signs Bouncing Back Slowing Deterioration Increasing Deterioration No Change

153
2017 IIAG: Index Report2017 IIAG South Sudan Scores, Ranks & Trends
OVERALL GOVERNANCE
20.2 53rd2016 SCORE 2016 RANK
. -2.1310 -YEAR AAT* 5-YEAR AAT
SAFETY & RULE OF LAW 14.0 53 . -5.20
RULE OF LAW 23.7 51 . -3.25
Judicial Independence (BS/WEF/V-Dem/GI) 22.1 45 . +1.25
Judicial Process (EIU/GI) 12.5 45 . 0.00
Access to Justice (V-Dem) 16.5 52 . -2.48
Property Rights (BS/HER/WEF/AfDB/WB) 24.7 50 . -1.63
Transfers of Power (EIU) 0.0 38 . -8.33
Multilateral Sanctions (CDD) 66.7 31 . -8.33
ACCOUNTABILITY 8.4 52 . -0.88
Access to Information (GI) 0.0 44 . 0.00
Online Public Services (UNDESA) 16.7 37 . -0.70
Public Sector Accountability & Transparency (V-Dem/AfDB/WB)
9.9 53 . -4.40
Accountability of Public Officials (EIU/BS) 7.1 47 . -4.18
Corruption in Government & Public Officials (EIU) 0.0 38 . 0.00
Corruption & Bureaucracy (WB) 0.0 50 . 0.00
Diversion of Public Funds (WEF) . . . .
Corruption Investigation (GI/AFR) 25.0 33 . +3.13
PERSONAL SAFETY 5.7 53 . -7.53
Safety of the Person (EIU/AFR) 0.0 47 . -6.25
Police Services (WEF/GI) 0.0 49 . 0.00
Social Unrest (EIU/ACLED) 34.1 44 . -9.35
Crime (EIU/AFR) 0.0 51 . -12.50
Political Violence (ACLED/PTS) 0.0 53 . -10.80
Human Trafficking (USDS) 0.0 39 . -6.25
NATIONAL SECURITY 18.3 54 . -9.13
Government Involvement in Armed Conflict (UCDP) 77.8 33 . +5.55
Domestic Armed Conflict (EIU) 0.0 49 . -6.25
Violence by Non-state Actors (ACLED) 7.2 45 . -17.00
Cross-border Tensions (EIU) 25.0 42 . 0.00
Internally Displaced People (IDMC) 0.0 50 . -17.05
Political Refugees (UNHCR) 0.0 51 . -20.00
SAFETY & RULE OF LAW
SCORE 2016
RANK 2016
10 -YEAR AAT
5-YEAR AAT
SCORE 2016
RANK 2016
10 -YEAR AAT
5-YEAR AAT
PARTICIPATION & HUMAN RIGHTS 20.7 52 . -1.30
PARTICIPATION 16.7 50 . -2.33
Political Participation (EIU/FH/V-Dem) 43.4 37 . -0.35
Civil Society Participation (BS/V-Dem/GI) 15.2 50 . -4.90
Free & Fair Elections (BS/CDD/V-Dem) 11.1 52 . -1.40
Election Monitoring Agencies (V-Dem/GI) 2.6 53 . -2.20
Legitimacy of Political Process (BS) 11.1 25 . -2.78
RIGHTS 16.6 50 . -2.18
Freedom of Expression (BS/RSF/V-Dem/GI) 18.0 53 . -4.73
Freedom of Association & Assembly (BS/GI) 29.9 32 . -2.95
Civil Liberties (BS/FH ) 12.5 48 . -5.73
Human Rights Conventions (UNOLA/OHCHR) 14.3 54 . +3.58
Human Rights Violations (EIU) 0.0 39 . -6.25
Protection against Discrimination (GI) 25.0 17 . +3.13
GENDER 28.7 52 . +0.55
Gender Equality (AfDB/WB) 16.7 53 . -2.50
Women's Political Participation (IPU/GI/WB) 50.5 13 . +0.78
Gender Balance in Education (UNESCO) 27.7 49 . +1.48
Women's Labour Force Participation (WB) . . . .
Workplace Gender Equality (GI) 50.0 4 . +6.25
Women in the Judiciary (GI) 0.0 44 . 0.00
Laws on Violence against Women (OECD) . . . .
Women's Political Empowerment (V-Dem) 27.1 52 . -2.80
PARTICIPATION & HUMAN RIGHTS
SCORE 2016
RANK 2016
10 -YEAR AAT
5-YEAR AAT
SUSTAINABLE ECONOMIC OPPORTUNITY 17.8 53 . -1.65
PUBLIC MANAGEMENT 19.6 52 . -1.18
Governmental Statistical Capacity (WB) 27.5 49 . +3.80
Civil Registration (GI) 37.5 42 . 0.00
Public Administration (AfDB/WB) 19.3 52 . -3.25
Diversification (AfDB/OECD/UNDP) 4.4 30 . +1.10
Budget Management (AfDB/WB) 15.3 52 . -3.58
Budget Balance (AfDB/AUC/UNECA) 55.0 6 . -1.63
Fiscal Policy (AfDB/WB) 0.0 54 . -7.75
Revenue Mobilisation (ICTD/UNU-WIDER/AfDB/WB) 17.2 53 . +0.75
Transparency of State-owned Companies (GI) 0.0 26 . 0.00
BUSINESS ENVIRONMENT 16.3 51 . -0.20
Investment Climate (HER) . . . .
Competition (BS/GI/AfDB/WB) 23.9 50 . -0.60
Business Bureaucracy & Red Tape (EIU) 0.0 31 . 0.00
Customs Procedures (WEF) . . . .
Soundness of Banks (WEF) . . . .
Employment Creation (AFR) . . . .
Regional Integration (AfDB) 25.0 38 . 0.00
INFRASTRUCTURE 15.5 51 . +0.73
Transport Infrastructure (WEF/AFR/EIU/GI) 0.0 53 . 0.00
Electricity Infrastructure (WEF/AFR) . . . .
Digital & IT Infrastructure (EIU/ITU) 6.0 52 . +0.45
Access to Improved Water (WHO/UNICEF) 40.5 43 . +1.73
Water & Sanitation Services (AFR) . . . .
RURAL SECTOR 19.7 52 . -5.95
Rural Land & Water (IFAD) 36.4 45 . -4.60
Rural Business Climate (IFAD) 28.1 50 . -3.95
Rural Development Resources (IFAD) 18.8 51 . -6.25
Agricultural Support System (IFAD) 9.2 52 . -7.00
Agricultural Policy Costs (WEF) . . . .
Engagement with Rural Organisations (IFAD) 18.8 52 . -5.45
Gender Balance in Rural Decision-making (IFAD) 8.3 52 . -8.38
Rural Accountability & Transparency (IFAD) 18.2 49 . -6.05
SUSTAINABLE ECONOMIC OPPORTUNITY
SCORE 2016
RANK 2016
10 -YEAR AAT
5-YEAR AAT
HUMAN DEVELOPMENT 28.2 53 . -0.38
WELFARE 16.7 53 . -1.15
Welfare Services (AfDB/WB) 31.4 52 . -1.00
Social Safety Nets (BS) 23.1 35 . 0.00
Social Protection & Labour (AfDB/WB) 13.8 53 . +0.28
Social Exclusion (BS) 0.0 33 . 0.00
Poverty (AFR) . . . .
Poverty Reduction Priorities (AFR/AfDB/WB) 28.9 50 . -1.78
Narrowing Income Gaps (AFR) . . . .
Environmental Policy (BS) 14.3 38 . +3.58
Environmental Sustainability (AfDB/WB) 5.6 53 . -9.03
EDUCATION 21.4 52 . +0.25
Education Provision (AFR) . . . .
Education Quality (BS) 0.0 42 . 0.00
Educational System Management (WEF) . . . .
Human Resources in Primary Schools (UNESCO) 60.9 44 . +0.68
Primary School Completion (WB) . . . .
Secondary School Enrolment (UNESCO) 3.4 52 . +0.10
Tertiary Education Enrolment (UNESCO) . . . .
Literacy (WB) . . . .
HEALTH 46.4 54 . -0.25
Basic Health Services (AFR) . . . .
Public Health Campaigns (GI) 50.0 33 . 0.00
Child Mortality (IGME) 64.4 40 . +1.15
Maternal Mortality (MMEIG) 70.4 49 . +0.63
Access to Sanitation (WHO/UNICEF) 19.1 51 . +1.30
Undernourishment (WB) . . . .
Disease (WHO) 82.8 34 . +0.18
Immunisation (WB/WHO) 17.0 53 . -8.48
Antiretroviral Treatment (ART) Provision (UNAIDS) 21.3 47 . +3.45
HUMAN DEVELOPMENT
*AAT: Annual Average Trend
If AAT appears the same in the two time periods, differences exist beyond the 2nd decimal place.
N/A
N/A
N/A
N/A
N/A
N/A
N/A
N/A
N/A
N/A
N/A
N/A
N/A
N/A
N/A
N/A
N/A
N/A
N/A
N/A
N/A
N/A
N/A
N/A
N/A
N/A
N/A
N/A
N/A
N/A
N/A
N/A
N/A
N/A
N/A
N/A
N/A
N/A
N/A
N/A
N/A
N/A
N/A
N/A
N/A
N/A
N/A
N/A
N/A
N/A
N/A
N/A
N/A
N/A
N/A
N/A
N/A
N/A
N/A
N/A
N/A
N/A
N/A
N/A
N/A
N/A
N/A
N/A
N/A
N/A
N/A
N/A
N/A
N/A
N/A
N/A
N/A
N/A
N/A
N/A
N/A
N/A
N/A
N/A
N/A
N/A
N/A
N/A
N/A
N/A
N/A
N/A
N/A
N/A
N/A
N/A
N/A
N/A
N/A
N/A
N/A
N/A
N/A
N/A
N/A
N/A
N/A
N/A
N/A
N/A
N/A
N/A
N/A
N/A
N/A
N/A
N/A
N/A
N/A
For a full list of data sources see Annex.
Increasing Improvement Slowing Improvement Warning Signs Bouncing Back Slowing Deterioration Increasing Deterioration No Change

154
2017 IIAG Sudan Scores, Ranks & Trends
OVERALL GOVERNANCE
32.5 50th2016 SCORE 2016 RANK
+0.11 +0.3310 -YEAR AAT* 5-YEAR AAT
SAFETY & RULE OF LAW 21.6 52 -0.76 -0.20
RULE OF LAW 24.8 49 +0.53 +1.05
Judicial Independence (BS/WEF/V-Dem/GI) 7.3 51 -0.17 -0.95
Judicial Process (EIU/GI) 16.7 44 +1.86 +4.18
Access to Justice (V-Dem) 26.4 46 +0.86 +2.23
Property Rights (BS/HER/WEF/AfDB/WB) 31.6 47 +0.66 +0.90
Transfers of Power (EIU) 33.3 20 0.00 0.00
Multilateral Sanctions (CDD) 33.3 50 0.00 0.00
ACCOUNTABILITY 10.0 51 -0.39 -0.70
Access to Information (GI) 0.0 44 0.00 0.00
Online Public Services (UNDESA) 29.4 25 +1.82 -1.28
Public Sector Accountability & Transparency (V-Dem/AfDB/WB)
14.5 52 -1.02 -0.60
Accountability of Public Officials (EIU/BS) 7.1 47 -1.07 -1.05
Corruption in Government & Public Officials (EIU) 0.0 38 0.00 0.00
Corruption & Bureaucracy (WB) 19.0 33 -1.07 +1.18
Diversion of Public Funds (WEF) . . . .
Corruption Investigation (GI/AFR) 0.0 49 -1.39 -3.13
PERSONAL SAFETY 19.2 49 -1.71 -0.55
Safety of the Person (EIU/AFR) 45.5 29 +0.48 +1.08
Police Services (WEF/GI) 0.0 49 0.00 0.00
Social Unrest (EIU/ACLED) 25.0 45 -5.53 -0.68
Crime (EIU/AFR) 44.7 40 -0.37 -0.83
Political Violence (ACLED/PTS) 0.0 53 -4.84 -2.83
Human Trafficking (USDS) 0.0 39 0.00 0.00
NATIONAL SECURITY 32.3 51 -1.49 -0.63
Government Involvement in Armed Conflict (UCDP) 66.7 45 -1.23 +2.78
Domestic Armed Conflict (EIU) 25.0 41 0.00 +3.13
Violence by Non-state Actors (ACLED) 0.0 46 -9.61 -9.23
Cross-border Tensions (EIU) 25.0 42 0.00 0.00
Internally Displaced People (IDMC) 18.1 48 +2.01 0.00
Political Refugees (UNHCR) 59.1 48 -0.07 -0.38
SAFETY & RULE OF LAW
SCORE 2016
RANK 2016
10 -YEAR AAT
5-YEAR AAT
SCORE 2016
RANK 2016
10 -YEAR AAT
5-YEAR AAT
PARTICIPATION & HUMAN RIGHTS 26.1 49 +0.88 +1.08
PARTICIPATION 21.8 49 +0.84 +0.25
Political Participation (EIU/FH/V-Dem) 43.0 38 +1.34 +1.78
Civil Society Participation (BS/V-Dem/GI) 14.3 53 -0.31 -1.08
Free & Fair Elections (BS/CDD/V-Dem) 23.2 47 +2.36 +1.78
Election Monitoring Agencies (V-Dem/GI) 17.5 46 -0.40 -1.23
Legitimacy of Political Process (BS) 11.1 25 +1.23 0.00
RIGHTS 15.5 51 -0.10 -0.50
Freedom of Expression (BS/RSF/V-Dem/GI) 20.1 52 -0.31 -0.40
Freedom of Association & Assembly (BS/GI) 11.1 52 -1.31 -2.95
Civil Liberties (BS/FH ) 0.0 51 0.00 -0.78
Human Rights Conventions (UNOLA/OHCHR) 61.9 31 +1.06 +1.20
Human Rights Violations (EIU) 0.0 39 0.00 0.00
Protection against Discrimination (GI) 0.0 36 0.00 0.00
GENDER 40.8 44 +1.88 +3.43
Gender Equality (AfDB/WB) 35.0 46 +1.11 -1.58
Women's Political Participation (IPU/GI/WB) 35.5 34 +1.41 +1.43
Gender Balance in Education (UNESCO) 64.0 36 +1.10 +0.40
Women's Labour Force Participation (WB) 16.1 50 +0.09 +0.28
Workplace Gender Equality (GI) 25.0 37 0.00 0.00
Women in the Judiciary (GI) 100.0 1 +11.11 +25.00
Laws on Violence against Women (OECD) 8.3 44 -1.86 0.00
Women's Political Empowerment (V-Dem) 42.8 47 +2.13 +1.93
PARTICIPATION & HUMAN RIGHTS
SCORE 2016
RANK 2016
10 -YEAR AAT
5-YEAR AAT
SUSTAINABLE ECONOMIC OPPORTUNITY 37.0 42 +0.01 +0.30
PUBLIC MANAGEMENT 38.3 41 +0.41 +1.13
Governmental Statistical Capacity (WB) 60.9 25 +3.87 +6.53
Civil Registration (GI) 75.0 10 0.00 0.00
Public Administration (AfDB/WB) 37.0 49 -0.76 +0.40
Diversification (AfDB/OECD/UNDP) 2.9 36 +0.29 +0.15
Budget Management (AfDB/WB) 43.7 45 +1.41 0.00
Budget Balance (AfDB/AUC/UNECA) 44.4 26 -0.09 +2.70
Fiscal Policy (AfDB/WB) 50.8 37 -1.23 +0.40
Revenue Mobilisation (ICTD/UNU-WIDER/AfDB/WB) 30.0 46 +0.18 0.00
Transparency of State-owned Companies (GI) 0.0 26 0.00 0.00
BUSINESS ENVIRONMENT 20.4 49 -1.08 -2.50
Investment Climate (HER) 16.7 50 0.00 0.00
Competition (BS/GI/AfDB/WB) 21.1 51 +0.08 -0.13
Business Bureaucracy & Red Tape (EIU) 0.0 31 -3.70 -8.33
Customs Procedures (WEF) . . . .
Soundness of Banks (WEF) . . . .
Employment Creation (AFR) . . . .
Regional Integration (AfDB) 43.8 29 -0.69 -1.55
INFRASTRUCTURE 37.7 29 +1.30 +0.63
Transport Infrastructure (WEF/AFR/EIU/GI) 25.0 40 0.00 0.00
Electricity Infrastructure (WEF/AFR) . . . .
Digital & IT Infrastructure (EIU/ITU) 37.4 19 +2.40 +0.60
Access to Improved Water (WHO/UNICEF) 50.8 35 +1.51 +1.30
Water & Sanitation Services (AFR) . . . .
RURAL SECTOR 51.6 27 -0.59 +1.90
Rural Land & Water (IFAD) 62.1 18 +1.79 +3.33
Rural Business Climate (IFAD) 57.3 24 -0.79 +0.48
Rural Development Resources (IFAD) 47.0 31 -2.20 +3.93
Agricultural Support System (IFAD) 65.1 16 +0.78 +2.30
Agricultural Policy Costs (WEF) . . . .
Engagement with Rural Organisations (IFAD) 52.1 36 -1.01 +0.80
Gender Balance in Rural Decision-making (IFAD) 35.5 41 -0.92 -0.50
Rural Accountability & Transparency (IFAD) 42.4 32 -1.72 +3.03
SUSTAINABLE ECONOMIC OPPORTUNITY
SCORE 2016
RANK 2016
10 -YEAR AAT
5-YEAR AAT
HUMAN DEVELOPMENT 45.5 46 +0.32 +0.18
WELFARE 30.7 49 +0.31 +0.38
Welfare Services (AfDB/WB) 42.6 49 +1.02 +1.80
Social Safety Nets (BS) 15.4 39 +0.86 +0.98
Social Protection & Labour (AfDB/WB) 38.1 46 +0.62 -0.28
Social Exclusion (BS) 14.3 20 0.00 0.00
Poverty (AFR) 49.2 19 +0.47 +1.05
Poverty Reduction Priorities (AFR/AfDB/WB) 38.1 44 -0.23 -0.53
Narrowing Income Gaps (AFR) . . . .
Environmental Policy (BS) 14.3 38 0.00 0.00
Environmental Sustainability (AfDB/WB) 33.3 50 -0.31 0.00
EDUCATION 40.8 38 -0.07 -0.38
Education Provision (AFR) . . . .
Education Quality (BS) 16.7 35 -1.84 -4.15
Educational System Management (WEF) . . . .
Human Resources in Primary Schools (UNESCO) 70.5 28 -0.21 0.00
Primary School Completion (WB) 41.0 42 -0.33 +0.13
Secondary School Enrolment (UNESCO) 35.9 32 +0.83 +0.63
Tertiary Education Enrolment (UNESCO) 26.4 11 +0.60 +0.58
Literacy (WB) 54.6 37 +0.56 +0.68
HEALTH 65.1 42 +0.74 +0.53
Basic Health Services (AFR) . . . .
Public Health Campaigns (GI) 50.0 33 0.00 0.00
Child Mortality (IGME) 74.5 30 +0.84 +0.70
Maternal Mortality (MMEIG) 88.6 16 +0.37 +0.20
Access to Sanitation (WHO/UNICEF) 51.1 32 +1.69 +1.45
Undernourishment (WB) . . . .
Disease (WHO) 92.7 17 +0.20 +0.30
Immunisation (WB/WHO) 90.9 17 +1.33 +0.40
Antiretroviral Treatment (ART) Provision (UNAIDS) 8.1 49 +0.84 +0.63
HUMAN DEVELOPMENT
N/A
N/A
N/A
N/A
N/A
N/A
N/A
N/A
N/A
N/A
N/A
*AAT: Annual Average Trend
If AAT appears the same in the two time periods, differences exist beyond the 2nd decimal place.
For a full list of data sources see Annex.
Increasing Improvement Slowing Improvement Warning Signs Bouncing Back Slowing Deterioration Increasing Deterioration No Change
N/A

155
2017 IIAG: Index Report2017 IIAG Swaziland Scores, Ranks & Trends
OVERALL GOVERNANCE
48.9 34th2016 SCORE 2016 RANK
+0.12 +0.0810 -YEAR AAT* 5-YEAR AAT
SAFETY & RULE OF LAW 59.4 22 +0.02 +0.23
RULE OF LAW 55.8 25 -0.20 -0.33
Judicial Independence (BS/WEF/V-Dem/GI) 21.3 46 -1.19 -1.58
Judicial Process (EIU/GI) 70.8 9 -1.39 -3.13
Access to Justice (V-Dem) 40.4 38 +0.58 +0.20
Property Rights (BS/HER/WEF/AfDB/WB) 68.9 8 +0.79 +2.60
Transfers of Power (EIU) 33.3 20 0.00 0.00
Multilateral Sanctions (CDD) 100.0 1 0.00 0.00
ACCOUNTABILITY 37.4 25 -0.89 -0.35
Access to Information (GI) 0.0 44 -3.24 -7.30
Online Public Services (UNDESA) 37.3 21 +0.17 +4.45
Public Sector Accountability & Transparency (V-Dem/AfDB/WB)
36.2 37 -0.79 -0.08
Accountability of Public Officials (EIU/BS) 33.3 33 0.00 0.00
Corruption in Government & Public Officials (EIU) 60.0 9 -2.22 0.00
Corruption & Bureaucracy (WB) 38.1 17 -2.11 -4.75
Diversion of Public Funds (WEF) 39.5 19 +0.64 +3.93
Corruption Investigation (GI/AFR) 54.9 7 +0.44 +1.00
PERSONAL SAFETY 54.6 16 +0.62 +1.58
Safety of the Person (EIU/AFR) 62.3 10 +0.26 +3.70
Police Services (WEF/GI) 29.1 34 +0.24 +1.15
Social Unrest (EIU/ACLED) 61.6 21 -1.41 +5.28
Crime (EIU/AFR) 69.0 10 +1.26 +2.83
Political Violence (ACLED/PTS) 80.3 14 +0.59 +2.70
Human Trafficking (USDS) 25.0 21 +2.78 -6.25
NATIONAL SECURITY 89.9 12 +0.56 -0.03
Government Involvement in Armed Conflict (UCDP) 100.0 1 0.00 0.00
Domestic Armed Conflict (EIU) 75.0 9 0.00 0.00
Violence by Non-state Actors (ACLED) 100.0 1 +0.03 0.00
Cross-border Tensions (EIU) 75.0 9 +2.78 0.00
Internally Displaced People (IDMC) . . . .
Political Refugees (UNHCR) 99.6 20 -0.03 -0.08
SAFETY & RULE OF LAW
SCORE 2016
RANK 2016
10 -YEAR AAT
5-YEAR AAT
SCORE 2016
RANK 2016
10 -YEAR AAT
5-YEAR AAT
PARTICIPATION & HUMAN RIGHTS 24.6 50 -0.40 -0.90
PARTICIPATION 15.1 52 -0.33 -0.40
Political Participation (EIU/FH/V-Dem) 12.1 53 +0.09 -0.30
Civil Society Participation (BS/V-Dem/GI) 17.4 48 -1.11 -0.70
Free & Fair Elections (BS/CDD/V-Dem) 16.0 51 -0.12 +0.18
Election Monitoring Agencies (V-Dem/GI) 14.9 47 -0.19 -0.80
Legitimacy of Political Process (BS) . . . .
RIGHTS 23.5 46 -0.32 -0.40
Freedom of Expression (BS/RSF/V-Dem/GI) 22.8 50 -0.69 -1.23
Freedom of Association & Assembly (BS/GI) 12.5 48 0.00 0.00
Civil Liberties (BS/FH ) 33.3 34 0.00 0.00
Human Rights Conventions (UNOLA/OHCHR) 47.6 42 +1.59 -1.20
Human Rights Violations (EIU) 25.0 25 -2.78 0.00
Protection against Discrimination (GI) 0.0 36 0.00 0.00
GENDER 35.1 49 -0.57 -1.90
Gender Equality (AfDB/WB) 50.0 34 0.00 0.00
Women's Political Participation (IPU/GI/WB) 35.9 31 +0.08 -1.18
Gender Balance in Education (UNESCO) 70.5 30 +0.21 +0.18
Women's Labour Force Participation (WB) 36.9 40 +0.61 +0.45
Workplace Gender Equality (GI) 0.0 54 -5.56 -12.50
Women in the Judiciary (GI) 25.0 36 0.00 0.00
Laws on Violence against Women (OECD) 33.3 29 +0.92 -0.53
Women's Political Empowerment (V-Dem) 29.0 51 -0.79 -1.73
PARTICIPATION & HUMAN RIGHTS
SCORE 2016
RANK 2016
10 -YEAR AAT
5-YEAR AAT
SUSTAINABLE ECONOMIC OPPORTUNITY 48.8 21 +0.31 +0.08
PUBLIC MANAGEMENT 39.0 39 -1.57 -1.13
Governmental Statistical Capacity (WB) 50.7 34 -0.64 -3.28
Civil Registration (GI) 50.0 32 0.00 0.00
Public Administration (AfDB/WB) 50.0 33 0.00 0.00
Diversification (AfDB/OECD/UNDP) 10.0 13 -2.18 -0.98
Budget Management (AfDB/WB) 33.3 47 -1.23 0.00
Budget Balance (AfDB/AUC/UNECA) 39.5 36 -5.44 +0.50
Fiscal Policy (AfDB/WB) 33.3 47 -2.48 0.00
Revenue Mobilisation (ICTD/UNU-WIDER/AfDB/WB) 59.2 10 +0.66 -0.20
Transparency of State-owned Companies (GI) 25.0 7 -2.78 -6.25
BUSINESS ENVIRONMENT 46.6 26 -0.33 -0.53
Investment Climate (HER) 55.6 31 0.00 -1.38
Competition (BS/GI/AfDB/WB) 50.0 25 0.00 0.00
Business Bureaucracy & Red Tape (EIU) 33.3 10 0.00 0.00
Customs Procedures (WEF) 44.7 23 +0.14 +3.63
Soundness of Banks (WEF) 63.8 4 -1.13 -3.10
Employment Creation (AFR) 32.2 19 -0.99 -2.23
Regional Integration (AfDB) . . . .
INFRASTRUCTURE 53.0 12 +0.94 +1.30
Transport Infrastructure (WEF/AFR/EIU/GI) 57.2 8 +0.08 +0.58
Electricity Infrastructure (WEF/AFR) 57.6 8 +0.93 +1.70
Digital & IT Infrastructure (EIU/ITU) 35.5 20 +2.17 +2.33
Access to Improved Water (WHO/UNICEF) 61.2 26 +1.12 +0.95
Water & Sanitation Services (AFR) 53.7 7 +0.43 +0.98
RURAL SECTOR 56.5 21 +2.19 +0.65
Rural Land & Water (IFAD) 61.3 19 +4.66 +3.85
Rural Business Climate (IFAD) 60.6 16 +3.47 +1.40
Rural Development Resources (IFAD) 56.3 21 +2.09 +1.58
Agricultural Support System (IFAD) 46.4 35 +3.36 +2.30
Agricultural Policy Costs (WEF) 51.9 23 -0.64 -1.75
Engagement with Rural Organisations (IFAD) 56.9 26 +2.22 +1.48
Gender Balance in Rural Decision-making (IFAD) 58.3 10 +0.92 -2.13
Rural Accountability & Transparency (IFAD) 60.5 12 +1.50 -1.53
SUSTAINABLE ECONOMIC OPPORTUNITY
SCORE 2016
RANK 2016
10 -YEAR AAT
5-YEAR AAT
HUMAN DEVELOPMENT 62.9 14 +0.59 +0.93
WELFARE 46.3 33 +0.21 +0.93
Welfare Services (AfDB/WB) 48.0 46 0.00 0.00
Social Safety Nets (BS) . . . .
Social Protection & Labour (AfDB/WB) 44.4 40 0.00 0.00
Social Exclusion (BS) . . . .
Poverty (AFR) 60.8 13 +1.64 +3.70
Poverty Reduction Priorities (AFR/AfDB/WB) 43.7 40 +0.04 +0.10
Narrowing Income Gaps (AFR) 36.4 15 +0.81 +1.83
Environmental Policy (BS) . . . .
Environmental Sustainability (AfDB/WB) 44.4 47 -1.24 0.00
EDUCATION 61.1 13 +0.49 +0.53
Education Provision (AFR) 76.4 4 -0.91 -2.05
Education Quality (BS) . . . .
Educational System Management (WEF) 48.1 16 +1.02 +3.25
Human Resources in Primary Schools (UNESCO) 82.3 13 +0.57 +0.30
Primary School Completion (WB) 63.5 18 +0.64 +0.38
Secondary School Enrolment (UNESCO) 58.7 12 +1.31 +1.13
Tertiary Education Enrolment (UNESCO) 8.3 35 +0.10 -0.13
Literacy (WB) 90.3 10 +0.66 +0.80
HEALTH 81.4 10 +1.07 +1.35
Basic Health Services (AFR) 84.8 2 -1.32 -2.98
Public Health Campaigns (GI) 75.0 14 +2.78 +6.25
Child Mortality (IGME) 78.7 23 +2.82 +1.33
Maternal Mortality (MMEIG) 85.6 26 +0.54 +0.10
Access to Sanitation (WHO/UNICEF) 72.1 12 +0.69 +0.58
Undernourishment (WB) 60.8 33 -1.48 -0.75
Disease (WHO) 89.9 21 +0.80 +1.90
Immunisation (WB/WHO) 88.1 21 -0.34 -0.05
Antiretroviral Treatment (ART) Provision (UNAIDS) 97.6 2 +5.17 +5.68
HUMAN DEVELOPMENT
N/A
N/A
N/A
N/A
N/A
N/A
N/A
*AAT: Annual Average Trend
If AAT appears the same in the two time periods, differences exist beyond the 2nd decimal place.
For a full list of data sources see Annex.
Increasing Improvement Slowing Improvement Warning Signs Bouncing Back Slowing Deterioration Increasing Deterioration No Change

156
2017 IIAG Tanzania Scores, Ranks & Trends
OVERALL GOVERNANCE
57.5 17th2016 SCORE 2016 RANK
+0.02 +0.5510 -YEAR AAT* 5-YEAR AAT
SAFETY & RULE OF LAW 62.9 14 +0.13 +1.10
RULE OF LAW 56.3 23 +0.07 +0.38
Judicial Independence (BS/WEF/V-Dem/GI) 62.6 15 -0.08 +1.35
Judicial Process (EIU/GI) 54.2 19 0.00 0.00
Access to Justice (V-Dem) 65.7 28 -0.07 -0.15
Property Rights (BS/HER/WEF/AfDB/WB) 55.2 18 +0.54 +0.95
Transfers of Power (EIU) 33.3 20 0.00 0.00
Multilateral Sanctions (CDD) 66.7 31 0.00 0.00
ACCOUNTABILITY 45.5 15 +0.51 +1.98
Access to Information (GI) 29.2 24 +0.47 +1.05
Online Public Services (UNDESA) 77.5 4 +4.97 +7.43
Public Sector Accountability & Transparency (V-Dem/AfDB/WB)
66.1 13 +0.78 +1.88
Accountability of Public Officials (EIU/BS) 38.1 17 -0.79 -0.90
Corruption in Government & Public Officials (EIU) 40.0 17 0.00 0.00
Corruption & Bureaucracy (WB) 19.0 33 -1.07 +1.18
Diversion of Public Funds (WEF) 38.9 20 -0.61 +0.90
Corruption Investigation (GI/AFR) 55.6 6 +0.39 +4.30
PERSONAL SAFETY 58.9 10 +0.01 +1.23
Safety of the Person (EIU/AFR) 73.8 6 +1.06 +2.38
Police Services (WEF/GI) 38.2 25 +1.82 +5.05
Social Unrest (EIU/ACLED) 68.6 17 -0.48 +0.95
Crime (EIU/AFR) 67.2 11 +0.52 +3.40
Political Violence (ACLED/PTS) 80.3 14 -0.11 +1.83
Human Trafficking (USDS) 25.0 21 -2.78 -6.25
NATIONAL SECURITY 91.1 11 -0.04 +0.85
Government Involvement in Armed Conflict (UCDP) 100.0 1 0.00 0.00
Domestic Armed Conflict (EIU) 75.0 9 0.00 +3.13
Violence by Non-state Actors (ACLED) 96.5 26 -0.29 +1.95
Cross-border Tensions (EIU) 75.0 9 0.00 0.00
Internally Displaced People (IDMC) 100.0 1 0.00 0.00
Political Refugees (UNHCR) 100.0 1 +0.01 +0.03
SAFETY & RULE OF LAW
SCORE 2016
RANK 2016
10 -YEAR AAT
5-YEAR AAT
SCORE 2016
RANK 2016
10 -YEAR AAT
5-YEAR AAT
PARTICIPATION & HUMAN RIGHTS 61.5 16 -0.14 +0.03
PARTICIPATION 57.4 24 -0.60 -1.00
Political Participation (EIU/FH/V-Dem) 71.7 17 +0.41 -1.13
Civil Society Participation (BS/V-Dem/GI) 49.2 33 -0.88 -1.98
Free & Fair Elections (BS/CDD/V-Dem) 57.8 24 -0.02 +0.88
Election Monitoring Agencies (V-Dem/GI) 30.8 38 -1.22 -2.75
Legitimacy of Political Process (BS) 77.8 6 -1.23 0.00
RIGHTS 58.2 10 +0.24 +0.53
Freedom of Expression (BS/RSF/V-Dem/GI) 60.7 31 -0.96 -1.40
Freedom of Association & Assembly (BS/GI) 40.3 28 -0.69 -1.55
Civil Liberties (BS/FH ) 56.3 16 -1.61 -2.08
Human Rights Conventions (UNOLA/OHCHR) 66.7 22 +0.53 -1.18
Human Rights Violations (EIU) 75.0 1 0.00 0.00
Protection against Discrimination (GI) 50.0 3 +4.17 +9.38
GENDER 68.9 11 -0.07 +0.55
Gender Equality (AfDB/WB) 67.5 15 -0.42 +1.55
Women's Political Participation (IPU/GI/WB) 56.7 9 +0.58 -0.80
Gender Balance in Education (UNESCO) 83.3 10 +1.00 +0.78
Women's Labour Force Participation (WB) 80.6 14 -1.99 -1.53
Workplace Gender Equality (GI) 50.0 4 +2.78 +6.25
Women in the Judiciary (GI) 75.0 19 0.00 0.00
Laws on Violence against Women (OECD) 58.3 12 -1.86 0.00
Women's Political Empowerment (V-Dem) 80.2 21 -0.58 -1.63
PARTICIPATION & HUMAN RIGHTS
SCORE 2016
RANK 2016
10 -YEAR AAT
5-YEAR AAT
SUSTAINABLE ECONOMIC OPPORTUNITY 49.5 19 -0.14 +0.85
PUBLIC MANAGEMENT 47.8 23 -0.43 +0.25
Governmental Statistical Capacity (WB) 73.9 9 +1.77 +0.35
Civil Registration (GI) 37.5 42 0.00 0.00
Public Administration (AfDB/WB) 80.7 7 +0.17 +2.48
Diversification (AfDB/OECD/UNDP) 8.6 16 -3.66 +0.85
Budget Management (AfDB/WB) 67.5 21 -0.97 +1.40
Budget Balance (AfDB/AUC/UNECA) 37.3 40 -0.50 -1.48
Fiscal Policy (AfDB/WB) 74.6 14 -0.97 -1.78
Revenue Mobilisation (ICTD/UNU-WIDER/AfDB/WB) 50.3 22 +0.29 +0.38
Transparency of State-owned Companies (GI) 0.0 26 0.00 0.00
BUSINESS ENVIRONMENT 52.2 16 -0.24 +0.35
Investment Climate (HER) 61.1 21 +0.61 0.00
Competition (BS/GI/AfDB/WB) 48.4 30 -0.91 -2.10
Business Bureaucracy & Red Tape (EIU) 33.3 10 0.00 0.00
Customs Procedures (WEF) 47.0 20 +1.79 +1.30
Soundness of Banks (WEF) 41.0 24 -3.27 -1.85
Employment Creation (AFR) 47.0 11 +0.09 +5.13
Regional Integration (AfDB) 87.5 3 0.00 0.00
INFRASTRUCTURE 36.1 34 +0.91 +1.58
Transport Infrastructure (WEF/AFR/EIU/GI) 41.6 19 +0.83 +0.23
Electricity Infrastructure (WEF/AFR) 36.9 18 +1.31 +3.63
Digital & IT Infrastructure (EIU/ITU) 23.3 36 +1.22 +1.13
Access to Improved Water (WHO/UNICEF) 40.2 44 +1.33 +1.13
Water & Sanitation Services (AFR) 38.7 18 -0.11 +1.80
RURAL SECTOR 61.7 11 -0.84 +1.23
Rural Land & Water (IFAD) 64.2 15 -0.47 -0.05
Rural Business Climate (IFAD) 60.6 16 -0.42 +2.85
Rural Development Resources (IFAD) 62.5 12 -0.92 +1.55
Agricultural Support System (IFAD) 74.3 7 +1.02 +2.30
Agricultural Policy Costs (WEF) 54.3 15 -1.69 -0.55
Engagement with Rural Organisations (IFAD) 67.4 8 -0.12 +2.73
Gender Balance in Rural Decision-making (IFAD) 50.0 13 -4.17 -2.08
Rural Accountability & Transparency (IFAD) 60.5 12 0.00 +3.03
SUSTAINABLE ECONOMIC OPPORTUNITY
SCORE 2016
RANK 2016
10 -YEAR AAT
5-YEAR AAT
HUMAN DEVELOPMENT 56.1 27 +0.22 +0.20
WELFARE 54.6 18 +0.41 +1.65
Welfare Services (AfDB/WB) 80.9 9 +0.89 +2.30
Social Safety Nets (BS) 53.8 9 +1.70 +1.90
Social Protection & Labour (AfDB/WB) 76.2 5 +1.41 +0.83
Social Exclusion (BS) 28.6 7 0.00 0.00
Poverty (AFR) 53.2 16 +1.34 +3.68
Poverty Reduction Priorities (AFR/AfDB/WB) 60.1 12 +0.42 +2.70
Narrowing Income Gaps (AFR) 43.0 8 +0.41 +5.45
Environmental Policy (BS) 28.6 26 -1.59 0.00
Environmental Sustainability (AfDB/WB) 66.7 23 -0.92 -2.08
EDUCATION 44.5 30 -0.20 -0.68
Education Provision (AFR) 45.1 17 -4.28 -1.25
Education Quality (BS) 33.3 21 0.00 -2.10
Educational System Management (WEF) 41.6 21 +0.18 -1.65
Human Resources in Primary Schools (UNESCO) 65.1 37 +1.27 +0.70
Primary School Completion (WB) 58.1 24 -0.90 -1.25
Secondary School Enrolment (UNESCO) 25.6 43 +0.11 -0.50
Tertiary Education Enrolment (UNESCO) 5.6 43 +0.40 -0.10
Literacy (WB) 81.5 16 +1.63 +0.70
HEALTH 69.4 34 +0.48 -0.35
Basic Health Services (AFR) 44.0 24 -2.90 +0.68
Public Health Campaigns (GI) 50.0 33 -5.56 -12.50
Child Mortality (IGME) 84.1 17 +1.53 +0.78
Maternal Mortality (MMEIG) 85.2 27 +0.88 +0.63
Access to Sanitation (WHO/UNICEF) 54.1 27 +0.50 +0.43
Undernourishment (WB) 51.3 38 +0.42 +0.60
Disease (WHO) 74.9 43 +2.54 +1.95
Immunisation (WB/WHO) 99.3 2 +1.61 +1.30
Antiretroviral Treatment (ART) Provision (UNAIDS) 81.6 12 +5.24 +2.93
HUMAN DEVELOPMENT
*AAT: Annual Average Trend
If AAT appears the same in the two time periods, differences exist beyond the 2nd decimal place.
For a full list of data sources see Annex.
Increasing Improvement Slowing Improvement Warning Signs Bouncing Back Slowing Deterioration Increasing Deterioration No Change

157
2017 IIAG: Index Report2017 IIAG Togo Scores, Ranks & Trends
OVERALL GOVERNANCE
51.7 26th2016 SCORE 2016 RANK
+1.11 +1.2810 -YEAR AAT* 5-YEAR AAT
SAFETY & RULE OF LAW 59.7 21 +0.56 +0.83
RULE OF LAW 51.6 33 -0.32 -0.78
Judicial Independence (BS/WEF/V-Dem/GI) 37.0 31 +0.28 -0.08
Judicial Process (EIU/GI) 29.2 36 -1.39 -3.13
Access to Justice (V-Dem) 65.2 29 -1.01 -2.28
Property Rights (BS/HER/WEF/AfDB/WB) 44.7 34 +0.14 +0.73
Transfers of Power (EIU) 33.3 20 0.00 0.00
Multilateral Sanctions (CDD) 100.0 1 0.00 0.00
ACCOUNTABILITY 37.9 24 +1.93 +2.60
Access to Information (GI) 29.2 24 +1.86 +4.18
Online Public Services (UNDESA) 43.1 18 +3.77 +6.13
Public Sector Accountability & Transparency (V-Dem/AfDB/WB)
45.4 25 +1.10 +2.10
Accountability of Public Officials (EIU/BS) 38.1 17 +1.59 -1.05
Corruption in Government & Public Officials (EIU) 40.0 17 +4.44 +5.00
Corruption & Bureaucracy (WB) 57.1 8 0.00 0.00
Diversion of Public Funds (WEF) . . . .
Corruption Investigation (GI/AFR) 12.1 48 +0.76 +1.70
PERSONAL SAFETY 60.2 8 +0.73 +1.83
Safety of the Person (EIU/AFR) 58.2 15 -0.60 +1.78
Police Services (WEF/GI) 50.0 11 +2.78 +6.25
Social Unrest (EIU/ACLED) 60.8 23 -0.19 -1.15
Crime (EIU/AFR) 54.5 23 +0.97 +2.18
Political Violence (ACLED/PTS) 87.5 6 +1.43 +1.80
Human Trafficking (USDS) 50.0 1 0.00 0.00
NATIONAL SECURITY 89.3 16 -0.09 -0.28
Government Involvement in Armed Conflict (UCDP) 88.9 19 -1.23 -2.78
Domestic Armed Conflict (EIU) 75.0 9 0.00 0.00
Violence by Non-state Actors (ACLED) 100.0 1 0.00 +0.08
Cross-border Tensions (EIU) 75.0 9 0.00 0.00
Internally Displaced People (IDMC) 99.8 29 0.00 +0.30
Political Refugees (UNHCR) 97.3 34 +0.73 +0.75
SAFETY & RULE OF LAW
SCORE 2016
RANK 2016
10 -YEAR AAT
5-YEAR AAT
SCORE 2016
RANK 2016
10 -YEAR AAT
5-YEAR AAT
PARTICIPATION & HUMAN RIGHTS 51.6 26 +1.13 +0.83
PARTICIPATION 44.2 31 +0.87 +0.23
Political Participation (EIU/FH/V-Dem) 55.8 30 +1.08 -0.30
Civil Society Participation (BS/V-Dem/GI) 62.8 26 +0.19 -1.13
Free & Fair Elections (BS/CDD/V-Dem) 50.0 30 +1.93 +3.33
Election Monitoring Agencies (V-Dem/GI) 41.5 23 +1.16 -0.68
Legitimacy of Political Process (BS) 11.1 25 0.00 0.00
RIGHTS 52.7 16 +1.46 +1.00
Freedom of Expression (BS/RSF/V-Dem/GI) 70.0 17 +0.20 +0.13
Freedom of Association & Assembly (BS/GI) 65.3 12 +2.70 +4.70
Civil Liberties (BS/FH ) 50.0 20 +2.31 0.00
Human Rights Conventions (UNOLA/OHCHR) 81.0 6 +2.12 +1.20
Human Rights Violations (EIU) 25.0 25 0.00 -3.13
Protection against Discrimination (GI) 25.0 17 +1.39 +3.13
GENDER 57.7 27 +1.07 +1.23
Gender Equality (AfDB/WB) 42.9 39 +0.46 +0.53
Women's Political Participation (IPU/GI/WB) 35.7 33 +0.24 -0.58
Gender Balance in Education (UNESCO) 44.3 46 0.00 0.00
Women's Labour Force Participation (WB) 89.8 7 +0.06 0.00
Workplace Gender Equality (GI) 50.0 4 +2.78 +6.25
Women in the Judiciary (GI) 50.0 31 0.00 0.00
Laws on Violence against Women (OECD) 66.7 6 +4.63 +3.13
Women's Political Empowerment (V-Dem) 82.5 14 +0.38 +0.60
PARTICIPATION & HUMAN RIGHTS
SCORE 2016
RANK 2016
10 -YEAR AAT
5-YEAR AAT
SUSTAINABLE ECONOMIC OPPORTUNITY 41.4 35 +1.24 +1.90
PUBLIC MANAGEMENT 46.4 29 +0.94 +1.13
Governmental Statistical Capacity (WB) 68.1 16 +2.09 +3.98
Civil Registration (GI) 87.5 5 +1.39 +3.13
Public Administration (AfDB/WB) 56.8 25 +3.07 +2.48
Diversification (AfDB/OECD/UNDP) 14.7 8 +0.16 +1.40
Budget Management (AfDB/WB) 47.8 41 +1.26 -3.53
Budget Balance (AfDB/AUC/UNECA) 51.9 12 -0.94 +4.45
Fiscal Policy (AfDB/WB) 43.7 45 0.00 -2.78
Revenue Mobilisation (ICTD/UNU-WIDER/AfDB/WB) 47.6 28 +1.49 +1.18
Transparency of State-owned Companies (GI) 0.0 26 0.00 0.00
BUSINESS ENVIRONMENT 42.5 30 +1.28 +2.38
Investment Climate (HER) 66.7 15 +3.71 +6.95
Competition (BS/GI/AfDB/WB) 49.2 27 +0.86 +0.85
Business Bureaucracy & Red Tape (EIU) 0.0 31 0.00 0.00
Customs Procedures (WEF) . . . .
Soundness of Banks (WEF) . . . .
Employment Creation (AFR) 40.4 15 +1.82 +4.10
Regional Integration (AfDB) 56.3 22 0.00 0.00
INFRASTRUCTURE 39.6 26 +1.93 +3.33
Transport Infrastructure (WEF/AFR/EIU/GI) 53.5 11 +3.52 +7.93
Electricity Infrastructure (WEF/AFR) 35.9 20 +1.33 +3.00
Digital & IT Infrastructure (EIU/ITU) 24.3 35 +2.28 +1.73
Access to Improved Water (WHO/UNICEF) 55.4 33 +1.23 +1.03
Water & Sanitation Services (AFR) 29.1 25 +1.30 +2.93
RURAL SECTOR 37.1 46 +0.82 +0.73
Rural Land & Water (IFAD) 42.7 39 +2.02 +0.83
Rural Business Climate (IFAD) 36.2 45 +0.08 +0.73
Rural Development Resources (IFAD) 37.5 39 +0.42 0.00
Agricultural Support System (IFAD) 51.1 31 +1.58 +3.48
Agricultural Policy Costs (WEF) . . . .
Engagement with Rural Organisations (IFAD) 42.6 43 +1.50 0.00
Gender Balance in Rural Decision-making (IFAD) 25.0 45 +0.93 0.00
Rural Accountability & Transparency (IFAD) 24.2 46 -0.81 0.00
SUSTAINABLE ECONOMIC OPPORTUNITY
SCORE 2016
RANK 2016
10 -YEAR AAT
5-YEAR AAT
HUMAN DEVELOPMENT 54.2 32 +1.50 +1.58
WELFARE 42.6 40 +1.56 +1.85
Welfare Services (AfDB/WB) 63.7 33 +1.23 +1.50
Social Safety Nets (BS) 38.5 22 +1.71 +0.98
Social Protection & Labour (AfDB/WB) 50.8 31 +2.03 +0.83
Social Exclusion (BS) 14.3 20 0.00 0.00
Poverty (AFR) 32.8 32 +0.78 +1.75
Poverty Reduction Priorities (AFR/AfDB/WB) 46.3 35 +2.37 +1.98
Narrowing Income Gaps (AFR) 36.4 15 +1.53 +3.45
Environmental Policy (BS) 28.6 26 +1.59 0.00
Environmental Sustainability (AfDB/WB) 72.2 15 +2.78 +6.25
EDUCATION 51.4 22 +1.20 +1.13
Education Provision (AFR) 45.1 17 -0.02 -0.05
Education Quality (BS) 50.0 11 +3.70 +4.18
Educational System Management (WEF) . . . .
Human Resources in Primary Schools (UNESCO) 66.7 31 -0.32 0.00
Primary School Completion (WB) 68.9 14 +1.63 +2.18
Secondary School Enrolment (UNESCO) 47.6 21 +1.16 0.00
Tertiary Education Enrolment (UNESCO) 17.0 18 +0.90 +0.13
Literacy (WB) 64.4 31 +1.31 +1.40
HEALTH 68.6 36 +1.74 +1.73
Basic Health Services (AFR) 46.3 22 +0.41 +0.93
Public Health Campaigns (GI) 50.0 33 0.00 0.00
Child Mortality (IGME) 70.8 33 +1.04 +0.85
Maternal Mortality (MMEIG) 86.4 24 +0.20 +0.23
Access to Sanitation (WHO/UNICEF) 26.7 49 +0.33 +0.28
Undernourishment (WB) 88.5 20 +2.36 +2.58
Disease (WHO) 86.2 26 +0.48 +0.43
Immunisation (WB/WHO) 86.4 24 +3.51 +2.03
Antiretroviral Treatment (ART) Provision (UNAIDS) 76.0 17 +7.34 +8.25
HUMAN DEVELOPMENT
N/A
N/A
N/A
N/A
N/A
*AAT: Annual Average Trend
If AAT appears the same in the two time periods, differences exist beyond the 2nd decimal place.
For a full list of data sources see Annex.
Increasing Improvement Slowing Improvement Warning Signs Bouncing Back Slowing Deterioration Increasing Deterioration No Change

158
2017 IIAG Tunisia Scores, Ranks & Trends
OVERALL GOVERNANCE
65.5 7th2016 SCORE 2016 RANK
+0.61 +0.9010 -YEAR AAT* 5-YEAR AAT
SAFETY & RULE OF LAW 62.9 14 +0.01 +0.65
RULE OF LAW 67.0 12 +2.03 +2.93
Judicial Independence (BS/WEF/V-Dem/GI) 67.8 9 +2.23 +2.45
Judicial Process (EIU/GI) 33.3 35 +0.92 +4.15
Access to Justice (V-Dem) 100.0 1 +2.23 +1.70
Property Rights (BS/HER/WEF/AfDB/WB) 67.3 11 -0.66 +0.78
Transfers of Power (EIU) 66.7 8 +7.41 +8.35
Multilateral Sanctions (CDD) 66.7 31 0.00 0.00
ACCOUNTABILITY 61.9 5 +1.08 +0.20
Access to Information (GI) 25.0 31 -3.24 -7.30
Online Public Services (UNDESA) 97.1 2 +8.71 +8.13
Public Sector Accountability & Transparency (V-Dem/AfDB/WB)
74.6 7 +3.34 +0.03
Accountability of Public Officials (EIU/BS) 54.8 8 +1.86 +0.90
Corruption in Government & Public Officials (EIU) 80.0 3 +3.89 +2.50
Corruption & Bureaucracy (WB) 57.1 8 -1.59 0.00
Diversion of Public Funds (WEF) 60.9 4 -2.91 +0.55
Corruption Investigation (GI/AFR) 45.4 19 -1.48 -3.33
PERSONAL SAFETY 42.1 33 -1.86 -0.10
Safety of the Person (EIU/AFR) 37.9 36 -0.94 +1.00
Police Services (WEF/GI) 38.5 24 -3.04 -2.98
Social Unrest (EIU/ACLED) 12.5 50 -8.33 +0.78
Crime (EIU/AFR) 59.3 17 +2.24 +7.13
Political Violence (ACLED/PTS) 79.4 17 +0.81 -0.23
Human Trafficking (USDS) 25.0 21 -1.86 -6.25
NATIONAL SECURITY 80.8 29 -1.20 -0.35
Government Involvement in Armed Conflict (UCDP) 88.9 19 -1.23 -2.78
Domestic Armed Conflict (EIU) 50.0 25 -2.78 +6.25
Violence by Non-state Actors (ACLED) 96.5 26 -0.39 +0.65
Cross-border Tensions (EIU) 50.0 31 -2.78 -6.25
Internally Displaced People (IDMC) 100.0 1 0.00 0.00
Political Refugees (UNHCR) 99.6 20 +0.02 0.00
SAFETY & RULE OF LAW
SCORE 2016
RANK 2016
10 -YEAR AAT
5-YEAR AAT
SCORE 2016
RANK 2016
10 -YEAR AAT
5-YEAR AAT
PARTICIPATION & HUMAN RIGHTS 70.2 7 +3.19 +2.73
PARTICIPATION 85.7 3 +6.42 +3.93
Political Participation (EIU/FH/V-Dem) 96.5 1 +7.84 +3.20
Civil Society Participation (BS/V-Dem/GI) 84.3 8 +5.24 +3.83
Free & Fair Elections (BS/CDD/V-Dem) 85.3 5 +7.74 +3.85
Election Monitoring Agencies (V-Dem/GI) 84.4 1 +3.86 +0.30
Legitimacy of Political Process (BS) 77.8 6 +7.41 +8.35
RIGHTS 55.7 15 +2.56 +3.43
Freedom of Expression (BS/RSF/V-Dem/GI) 75.4 9 +4.87 +1.88
Freedom of Association & Assembly (BS/GI) 64.6 13 +2.47 +2.08
Civil Liberties (BS/FH ) 58.3 14 +2.54 +2.85
Human Rights Conventions (UNOLA/OHCHR) 85.7 4 +2.64 +1.18
Human Rights Violations (EIU) 50.0 7 +2.78 +12.50
Protection against Discrimination (GI) 0.0 36 0.00 0.00
GENDER 69.3 9 +0.60 +0.85
Gender Equality (AfDB/WB) 100.0 1 0.00 0.00
Women's Political Participation (IPU/GI/WB) 54.1 11 +3.66 +7.48
Gender Balance in Education (UNESCO) 78.0 26 +0.14 +0.55
Women's Labour Force Participation (WB) 17.2 49 +0.14 -0.08
Workplace Gender Equality (GI) 50.0 4 0.00 0.00
Women in the Judiciary (GI) 100.0 1 0.00 0.00
Laws on Violence against Women (OECD) 58.3 12 -1.86 -2.10
Women's Political Empowerment (V-Dem) 96.9 1 +2.70 +1.00
PARTICIPATION & HUMAN RIGHTS
SCORE 2016
RANK 2016
10 -YEAR AAT
5-YEAR AAT
SUSTAINABLE ECONOMIC OPPORTUNITY 58.2 9 -0.34 -0.03
PUBLIC MANAGEMENT 67.2 3 +0.01 +0.33
Governmental Statistical Capacity (WB) 78.3 5 0.00 +0.73
Civil Registration (GI) 75.0 10 0.00 0.00
Public Administration (AfDB/WB) 87.5 5 0.00 0.00
Diversification (AfDB/OECD/UNDP) 68.8 1 +2.09 +3.95
Budget Management (AfDB/WB) 77.8 7 0.00 0.00
Budget Balance (AfDB/AUC/UNECA) 41.9 31 -1.09 -1.93
Fiscal Policy (AfDB/WB) 88.9 1 -1.23 0.00
Revenue Mobilisation (ICTD/UNU-WIDER/AfDB/WB) 61.9 8 +0.34 +0.33
Transparency of State-owned Companies (GI) 25.0 7 0.00 0.00
BUSINESS ENVIRONMENT 40.9 32 -2.08 -1.88
Investment Climate (HER) 38.9 41 +0.62 0.00
Competition (BS/GI/AfDB/WB) 63.6 10 -3.30 -4.73
Business Bureaucracy & Red Tape (EIU) 66.7 4 +0.93 +8.35
Customs Procedures (WEF) 31.9 35 -5.13 -7.75
Soundness of Banks (WEF) 24.5 35 -5.03 -5.98
Employment Creation (AFR) 19.8 31 -0.53 -1.20
Regional Integration (AfDB) . . . .
INFRASTRUCTURE 63.0 8 +1.34 +2.43
Transport Infrastructure (WEF/AFR/EIU/GI) 48.7 15 -0.99 -1.05
Electricity Infrastructure (WEF/AFR) 71.6 5 +1.07 +2.98
Digital & IT Infrastructure (EIU/ITU) 61.3 8 +3.21 +3.15
Access to Improved Water (WHO/UNICEF) 93.2 5 +0.42 +0.33
Water & Sanitation Services (AFR) 40.3 15 +2.99 +6.73
RURAL SECTOR 61.6 12 -0.69 -1.03
Rural Land & Water (IFAD) 72.2 9 +0.14 0.00
Rural Business Climate (IFAD) 67.3 7 -0.97 -2.13
Rural Development Resources (IFAD) 78.3 8 -0.56 -0.75
Agricultural Support System (IFAD) 55.9 24 +0.53 +1.20
Agricultural Policy Costs (WEF) 46.3 25 -4.60 -2.88
Engagement with Rural Organisations (IFAD) 59.4 23 +0.32 -2.00
Gender Balance in Rural Decision-making (IFAD) 50.0 13 -0.70 0.00
Rural Accountability & Transparency (IFAD) 63.7 10 +0.36 -1.50
SUSTAINABLE ECONOMIC OPPORTUNITY
SCORE 2016
RANK 2016
10 -YEAR AAT
5-YEAR AAT
HUMAN DEVELOPMENT 70.5 9 -0.40 +0.20
WELFARE 61.5 9 -0.62 +0.63
Welfare Services (AfDB/WB) 84.0 5 -1.33 0.00
Social Safety Nets (BS) 76.9 4 -2.57 -0.98
Social Protection & Labour (AfDB/WB) 66.7 12 -1.23 0.00
Social Exclusion (BS) 57.1 2 0.00 0.00
Poverty (AFR) 75.1 7 +1.17 +2.63
Poverty Reduction Priorities (AFR/AfDB/WB) 45.7 37 -1.30 +0.20
Narrowing Income Gaps (AFR) 9.6 31 -0.74 -1.68
Environmental Policy (BS) 71.4 3 +1.59 +5.35
Environmental Sustainability (AfDB/WB) 66.7 23 -1.23 0.00
EDUCATION 66.5 7 -1.01 -0.70
Education Provision (AFR) 12.5 32 +0.32 +0.73
Education Quality (BS) 83.3 2 -1.86 0.00
Educational System Management (WEF) 36.2 24 -7.09 -6.63
Human Resources in Primary Schools (UNESCO) 96.2 2 +0.30 +0.38
Primary School Completion (WB) 84.5 9 -0.36 +0.53
Secondary School Enrolment (UNESCO) 80.4 6 -0.27 -0.70
Tertiary Education Enrolment (UNESCO) 56.4 5 +0.34 -0.25
Literacy (WB) 82.4 15 +0.53 +0.28
HEALTH 83.4 8 +0.40 +0.65
Basic Health Services (AFR) 24.9 31 +1.27 +2.85
Public Health Campaigns (GI) 100.0 1 0.00 0.00
Child Mortality (IGME) 99.7 4 +0.32 +0.20
Maternal Mortality (MMEIG) 98.0 5 +0.04 +0.03
Access to Sanitation (WHO/UNICEF) 95.9 5 +0.66 +0.45
Undernourishment (WB) 100.0 1 0.00 0.00
Disease (WHO) 98.7 5 +0.06 0.00
Immunisation (WB/WHO) 98.9 3 0.00 +0.38
Antiretroviral Treatment (ART) Provision (UNAIDS) 34.9 41 +1.33 +2.10
HUMAN DEVELOPMENT
N/A
*AAT: Annual Average Trend
If AAT appears the same in the two time periods, differences exist beyond the 2nd decimal place.
For a full list of data sources see Annex.
Increasing Improvement Slowing Improvement Warning Signs Bouncing Back Slowing Deterioration Increasing Deterioration No Change

159
2017 IIAG: Index Report2017 IIAG Uganda Scores, Ranks & Trends
OVERALL GOVERNANCE
56.5 19th 2016 SCORE 2016 RANK
+0.33 +0.5810 -YEAR AAT* 5-YEAR AAT
SAFETY & RULE OF LAW 57.5 25 +0.20 +0.25
RULE OF LAW 55.0 28 -1.24 -0.03
Judicial Independence (BS/WEF/V-Dem/GI) 63.1 13 +0.79 +1.58
Judicial Process (EIU/GI) 70.8 9 0.00 0.00
Access to Justice (V-Dem) 75.2 20 -1.06 -2.30
Property Rights (BS/HER/WEF/AfDB/WB) 54.3 19 +0.21 +0.63
Transfers of Power (EIU) 0.0 38 -7.41 0.00
Multilateral Sanctions (CDD) 66.7 31 0.00 0.00
ACCOUNTABILITY 38.7 23 +0.49 +1.60
Access to Information (GI) 41.7 13 +2.78 +6.25
Online Public Services (UNDESA) 67.6 8 +3.76 +6.95
Public Sector Accountability & Transparency (V-Dem/AfDB/WB)
38.1 35 -0.81 -0.25
Accountability of Public Officials (EIU/BS) 38.1 17 -1.59 -1.78
Corruption in Government & Public Officials (EIU) 40.0 17 0.00 0.00
Corruption & Bureaucracy (WB) 19.0 33 -1.07 -2.40
Diversion of Public Funds (WEF) 22.3 31 +1.22 +3.08
Corruption Investigation (GI/AFR) 42.5 21 -0.39 +0.88
PERSONAL SAFETY 52.1 22 -0.41 -0.88
Safety of the Person (EIU/AFR) 66.3 8 +0.62 +1.40
Police Services (WEF/GI) 35.1 29 -0.94 -2.75
Social Unrest (EIU/ACLED) 36.9 40 -3.58 -3.98
Crime (EIU/AFR) 60.2 15 +0.53 -0.20
Political Violence (ACLED/PTS) 64.0 41 +0.88 +0.25
Human Trafficking (USDS) 50.0 1 0.00 0.00
NATIONAL SECURITY 84.1 25 +1.97 +0.30
Government Involvement in Armed Conflict (UCDP) 66.7 45 -1.23 -2.78
Domestic Armed Conflict (EIU) 75.0 9 +5.56 +6.25
Violence by Non-state Actors (ACLED) 89.5 34 +0.14 -1.65
Cross-border Tensions (EIU) 75.0 9 +2.78 0.00
Internally Displaced People (IDMC) 98.7 32 +4.39 -0.13
Political Refugees (UNHCR) 99.6 20 +0.14 0.00
SAFETY & RULE OF LAW
SCORE 2016
RANK 2016
10 -YEAR AAT
5-YEAR AAT
SCORE 2016
RANK 2016
10 -YEAR AAT
5-YEAR AAT
PARTICIPATION & HUMAN RIGHTS 58.5 17 +0.33 +0.18
PARTICIPATION 47.2 29 -0.02 -0.40
Political Participation (EIU/FH/V-Dem) 50.9 33 -0.57 -0.70
Civil Society Participation (BS/V-Dem/GI) 54.1 31 +0.10 +0.50
Free & Fair Elections (BS/CDD/V-Dem) 38.4 34 +0.10 +0.05
Election Monitoring Agencies (V-Dem/GI) 37.2 28 +0.29 +1.00
Legitimacy of Political Process (BS) 55.6 16 0.00 -2.78
RIGHTS 52.2 19 +0.11 +0.90
Freedom of Expression (BS/RSF/V-Dem/GI) 54.3 34 -1.38 -0.88
Freedom of Association & Assembly (BS/GI) 41.0 25 -1.23 -0.70
Civil Liberties (BS/FH ) 47.9 27 -1.62 -2.88
Human Rights Conventions (UNOLA/OHCHR) 76.2 11 0.00 -1.20
Human Rights Violations (EIU) 43.8 23 -0.69 -1.55
Protection against Discrimination (GI) 50.0 3 +5.56 +12.50
GENDER 76.0 3 +0.90 +0.03
Gender Equality (AfDB/WB) 65.8 19 -0.19 -0.43
Women's Political Participation (IPU/GI/WB) 62.8 3 +0.84 +0.40
Gender Balance in Education (UNESCO) . . . .
Women's Labour Force Participation (WB) 91.4 5 +0.53 +0.18
Workplace Gender Equality (GI) 50.0 4 0.00 0.00
Women in the Judiciary (GI) 100.0 1 0.00 0.00
Laws on Violence against Women (OECD) 75.0 3 +5.56 +1.05
Women's Political Empowerment (V-Dem) 87.1 10 -0.40 -0.90
PARTICIPATION & HUMAN RIGHTS
SCORE 2016
RANK 2016
10 -YEAR AAT
5-YEAR AAT
SUSTAINABLE ECONOMIC OPPORTUNITY 50.9 16 +0.13 +0.60
PUBLIC MANAGEMENT 47.9 22 -0.31 +0.50
Governmental Statistical Capacity (WB) 68.1 16 -0.32 +0.35
Civil Registration (GI) 50.0 32 0.00 0.00
Public Administration (AfDB/WB) 61.5 20 -0.34 0.00
Diversification (AfDB/OECD/UNDP) 10.6 12 -0.38 -0.45
Budget Management (AfDB/WB) 60.5 25 -2.36 0.00
Budget Balance (AfDB/AUC/UNECA) 33.5 44 -1.79 -2.28
Fiscal Policy (AfDB/WB) 76.2 13 -1.41 0.00
Revenue Mobilisation (ICTD/UNU-WIDER/AfDB/WB) 46.0 30 +1.03 +0.78
Transparency of State-owned Companies (GI) 25.0 7 +2.78 +6.25
BUSINESS ENVIRONMENT 60.5 6 +0.67 +0.65
Investment Climate (HER) 66.7 15 +1.23 +1.40
Competition (BS/GI/AfDB/WB) 57.3 16 -1.41 -2.10
Business Bureaucracy & Red Tape (EIU) 33.3 10 0.00 0.00
Customs Procedures (WEF) 61.5 9 +2.48 -0.15
Soundness of Banks (WEF) 54.1 9 -0.38 -2.95
Employment Creation (AFR) 50.6 6 +2.04 +6.83
Regional Integration (AfDB) 100.0 1 +0.69 +1.55
INFRASTRUCTURE 35.4 37 +1.44 +2.35
Transport Infrastructure (WEF/AFR/EIU/GI) 36.8 25 +1.63 +2.30
Electricity Infrastructure (WEF/AFR) 39.9 15 +3.41 +6.03
Digital & IT Infrastructure (EIU/ITU) 22.3 39 +1.28 +1.15
Access to Improved Water (WHO/UNICEF) 26.7 53 +0.64 +0.55
Water & Sanitation Services (AFR) 51.6 10 +0.29 +1.80
RURAL SECTOR 59.6 16 -1.30 -1.18
Rural Land & Water (IFAD) 70.3 11 +1.89 +2.35
Rural Business Climate (IFAD) 60.6 16 -1.60 +0.45
Rural Development Resources (IFAD) 68.8 11 -1.17 -1.55
Agricultural Support System (IFAD) 37.2 41 -4.66 -9.28
Agricultural Policy Costs (WEF) 54.3 15 -0.01 -2.08
Engagement with Rural Organisations (IFAD) 64.9 15 -0.68 +0.75
Gender Balance in Rural Decision-making (IFAD) 66.8 5 -2.30 0.00
Rural Accountability & Transparency (IFAD) 54.5 22 -1.86 0.00
SUSTAINABLE ECONOMIC OPPORTUNITY
SCORE 2016
RANK 2016
10 -YEAR AAT
5-YEAR AAT
HUMAN DEVELOPMENT 59.3 20 +0.68 +1.33
WELFARE 60.0 12 +0.57 +1.53
Welfare Services (AfDB/WB) 81.7 8 -0.36 +0.70
Social Safety Nets (BS) 53.8 9 +0.84 -1.93
Social Protection & Labour (AfDB/WB) 66.8 11 +0.99 +0.55
Social Exclusion (BS) 28.6 7 0.00 -1.78
Poverty (AFR) 66.4 10 +1.88 +4.78
Poverty Reduction Priorities (AFR/AfDB/WB) 65.9 8 +0.82 +4.05
Narrowing Income Gaps (AFR) 38.7 12 +0.61 +4.58
Environmental Policy (BS) 57.1 7 0.00 0.00
Environmental Sustainability (AfDB/WB) 80.6 7 +0.31 +2.80
EDUCATION 45.9 27 -0.07 +0.28
Education Provision (AFR) 59.8 10 -1.03 +2.95
Education Quality (BS) 66.7 6 0.00 0.00
Educational System Management (WEF) 43.9 18 -0.24 -2.25
Human Resources in Primary Schools (UNESCO) 62.3 42 +0.51 +0.93
Primary School Completion (WB) 37.2 44 -0.03 -0.68
Secondary School Enrolment (UNESCO) 16.8 48 -0.14 -0.13
Tertiary Education Enrolment (UNESCO) 7.4 39 +0.20 +0.38
Literacy (WB) 73.4 27 +0.27 +1.10
HEALTH 72.2 26 +1.54 +2.20
Basic Health Services (AFR) 59.6 9 -0.90 +3.53
Public Health Campaigns (GI) 50.0 33 +2.78 +6.25
Child Mortality (IGME) 81.5 21 +1.90 +1.08
Maternal Mortality (MMEIG) 87.3 21 +0.52 +0.48
Access to Sanitation (WHO/UNICEF) 54.7 25 +0.42 +0.35
Undernourishment (WB) 63.1 32 -0.37 -0.33
Disease (WHO) 84.7 29 +0.96 +0.43
Immunisation (WB/WHO) 78.0 36 +0.71 0.00
Antiretroviral Treatment (ART) Provision (UNAIDS) 90.4 5 +7.87 +8.03
HUMAN DEVELOPMENT
N/A
*AAT: Annual Average Trend
If AAT appears the same in the two time periods, differences exist beyond the 2nd decimal place.
For a full list of data sources see Annex.
Increasing Improvement Slowing Improvement Warning Signs Bouncing Back Slowing Deterioration Increasing Deterioration No Change

160
2017 IIAG Zambia Scores, Ranks & Trends
OVERALL GOVERNANCE
57.7 16th2016 SCORE 2016 RANK
+0.32 -0.3510 -YEAR AAT* 5-YEAR AAT
SAFETY & RULE OF LAW 66.4 9 +0.16 -0.65
RULE OF LAW 74.9 8 +0.06 +0.35
Judicial Independence (BS/WEF/V-Dem/GI) 63.1 13 +0.23 +0.23
Judicial Process (EIU/GI) 83.3 5 0.00 0.00
Access to Justice (V-Dem) 75.6 19 -0.16 -0.08
Property Rights (BS/HER/WEF/AfDB/WB) 60.5 14 +0.23 +1.88
Transfers of Power (EIU) 66.7 8 0.00 0.00
Multilateral Sanctions (CDD) 100.0 1 0.00 0.00
ACCOUNTABILITY 43.8 16 +0.79 +0.08
Access to Information (GI) 25.0 31 0.00 0.00
Online Public Services (UNDESA) 50.0 16 +5.56 +1.90
Public Sector Accountability & Transparency (V-Dem/AfDB/WB)
67.9 12 -0.79 -0.88
Accountability of Public Officials (EIU/BS) 38.1 17 -0.79 0.00
Corruption in Government & Public Officials (EIU) 40.0 17 0.00 0.00
Corruption & Bureaucracy (WB) 38.1 17 -0.53 -1.20
Diversion of Public Funds (WEF) 45.0 15 +2.79 +2.35
Corruption Investigation (GI/AFR) 46.4 17 +0.07 -1.65
PERSONAL SAFETY 53.0 21 -0.10 -1.63
Safety of the Person (EIU/AFR) 53.5 22 -0.56 -1.25
Police Services (WEF/GI) 28.5 35 -2.21 -5.78
Social Unrest (EIU/ACLED) 54.4 29 +0.76 -2.60
Crime (EIU/AFR) 51.9 26 +0.48 -1.28
Political Violence (ACLED/PTS) 79.4 17 +0.92 +1.10
Human Trafficking (USDS) 50.0 1 0.00 0.00
NATIONAL SECURITY 94.1 8 -0.12 -1.30
Government Involvement in Armed Conflict (UCDP) 100.0 1 0.00 0.00
Domestic Armed Conflict (EIU) 75.0 9 -2.78 -6.25
Violence by Non-state Actors (ACLED) 89.5 34 -0.73 -1.65
Cross-border Tensions (EIU) 100.0 1 +2.78 0.00
Internally Displaced People (IDMC) 100.0 1 0.00 0.00
Political Refugees (UNHCR) 100.0 1 0.00 0.00
SAFETY & RULE OF LAW
SCORE 2016
RANK 2016
10 -YEAR AAT
5-YEAR AAT
SCORE 2016
RANK 2016
10 -YEAR AAT
5-YEAR AAT
PARTICIPATION & HUMAN RIGHTS 57.7 18 -0.10 -0.70
PARTICIPATION 58.8 23 -0.67 -2.38
Political Participation (EIU/FH/V-Dem) 66.2 21 -0.30 -1.43
Civil Society Participation (BS/V-Dem/GI) 60.0 28 -0.82 -1.88
Free & Fair Elections (BS/CDD/V-Dem) 51.3 29 -0.33 -4.23
Election Monitoring Agencies (V-Dem/GI) 39.0 26 -1.83 -4.28
Legitimacy of Political Process (BS) 77.8 6 0.00 0.00
RIGHTS 48.8 23 -0.72 -1.70
Freedom of Expression (BS/RSF/V-Dem/GI) 54.4 33 -1.27 -2.10
Freedom of Association & Assembly (BS/GI) 41.0 25 -1.31 -3.65
Civil Liberties (BS/FH ) 50.0 20 -0.70 -0.78
Human Rights Conventions (UNOLA/OHCHR) 47.6 42 -1.06 -3.58
Human Rights Violations (EIU) 50.0 7 -2.78 -6.25
Protection against Discrimination (GI) 50.0 3 +2.78 +6.25
GENDER 65.6 16 +1.10 +1.95
Gender Equality (AfDB/WB) 55.4 26 +0.04 0.00
Women's Political Participation (IPU/GI/WB) 54.7 10 +1.66 +5.35
Gender Balance in Education (UNESCO) 81.1 20 +0.61 -0.08
Women's Labour Force Participation (WB) 75.2 22 -0.24 +0.03
Workplace Gender Equality (GI) 50.0 4 +5.56 +12.50
Women in the Judiciary (GI) 100.0 1 0.00 0.00
Laws on Violence against Women (OECD) 33.3 29 +0.92 -3.13
Women's Political Empowerment (V-Dem) 74.6 27 +0.22 +0.85
PARTICIPATION & HUMAN RIGHTS
SCORE 2016
RANK 2016
10 -YEAR AAT
5-YEAR AAT
SUSTAINABLE ECONOMIC OPPORTUNITY 48.9 20 +0.13 -0.48
PUBLIC MANAGEMENT 51.9 15 -0.12 -0.28
Governmental Statistical Capacity (WB) 47.8 40 -0.81 -2.90
Civil Registration (GI) 100.0 1 0.00 0.00
Public Administration (AfDB/WB) 61.5 20 +0.36 +0.40
Diversification (AfDB/OECD/UNDP) 1.9 42 -0.03 +0.13
Budget Management (AfDB/WB) 67.7 19 +0.47 -0.68
Budget Balance (AfDB/AUC/UNECA) 50.2 15 -0.41 +1.10
Fiscal Policy (AfDB/WB) 43.7 45 -3.43 -6.33
Revenue Mobilisation (ICTD/UNU-WIDER/AfDB/WB) 44.2 34 +0.02 -0.38
Transparency of State-owned Companies (GI) 50.0 1 +2.78 +6.25
BUSINESS ENVIRONMENT 50.7 18 +0.08 -1.55
Investment Climate (HER) 61.1 21 +0.61 0.00
Competition (BS/GI/AfDB/WB) 71.6 6 +0.23 +0.90
Business Bureaucracy & Red Tape (EIU) 33.3 10 0.00 0.00
Customs Procedures (WEF) 44.9 22 +0.48 -4.95
Soundness of Banks (WEF) 40.6 26 -4.14 -7.25
Employment Creation (AFR) 41.1 14 +3.37 +0.43
Regional Integration (AfDB) 62.5 16 0.00 0.00
INFRASTRUCTURE 39.3 27 +0.77 +0.50
Transport Infrastructure (WEF/AFR/EIU/GI) 47.0 17 +2.33 +2.60
Electricity Infrastructure (WEF/AFR) 34.2 22 -1.84 -1.85
Digital & IT Infrastructure (EIU/ITU) 27.3 32 +1.67 +1.25
Access to Improved Water (WHO/UNICEF) 53.5 34 +0.89 +0.73
Water & Sanitation Services (AFR) 34.8 21 +0.82 -0.13
RURAL SECTOR 53.7 23 -0.20 -0.55
Rural Land & Water (IFAD) 48.8 35 +0.23 0.00
Rural Business Climate (IFAD) 60.6 16 0.00 0.00
Rural Development Resources (IFAD) 43.8 32 -2.08 0.00
Agricultural Support System (IFAD) 65.1 16 +1.56 0.00
Agricultural Policy Costs (WEF) 55.8 13 -2.53 -4.40
Engagement with Rural Organisations (IFAD) 53.5 34 +0.74 0.00
Gender Balance in Rural Decision-making (IFAD) 41.8 30 -1.61 0.00
Rural Accountability & Transparency (IFAD) 60.5 12 +2.10 0.00
SUSTAINABLE ECONOMIC OPPORTUNITY
SCORE 2016
RANK 2016
10 -YEAR AAT
5-YEAR AAT
HUMAN DEVELOPMENT 57.7 22 +1.08 +0.38
WELFARE 49.0 27 +0.80 -0.35
Welfare Services (AfDB/WB) 72.9 14 +1.47 0.00
Social Safety Nets (BS) 53.8 9 +1.70 0.00
Social Protection & Labour (AfDB/WB) 48.1 35 -0.91 +0.83
Social Exclusion (BS) 28.6 7 +1.59 0.00
Poverty (AFR) 56.8 15 +1.24 -0.90
Poverty Reduction Priorities (AFR/AfDB/WB) 51.4 24 +1.28 -0.48
Narrowing Income Gaps (AFR) 31.5 23 +2.43 -2.58
Environmental Policy (BS) 28.6 26 -1.59 0.00
Environmental Sustainability (AfDB/WB) 69.4 18 0.00 0.00
EDUCATION 54.7 20 +0.79 -0.13
Education Provision (AFR) 48.7 14 +0.46 -0.68
Education Quality (BS) 50.0 11 0.00 +2.08
Educational System Management (WEF) 65.6 8 +1.36 -1.08
Human Resources in Primary Schools (UNESCO) 59.6 45 +0.94 +0.38
Primary School Completion (WB) 65.6 16 -0.50 -1.95
Secondary School Enrolment (UNESCO) . . . .
Tertiary Education Enrolment (UNESCO) 6.1 42 0.00 0.00
Literacy (WB) 87.4 13 +3.26 +0.40
HEALTH 69.4 34 +1.66 +1.58
Basic Health Services (AFR) 53.5 13 +0.80 -0.40
Public Health Campaigns (GI) 75.0 14 +2.78 +6.25
Child Mortality (IGME) 77.2 25 +1.69 +1.15
Maternal Mortality (MMEIG) 91.8 11 +0.37 +0.18
Access to Sanitation (WHO/UNICEF) 55.8 24 +0.46 +0.38
Undernourishment (WB) 23.0 44 +0.93 +0.73
Disease (WHO) 75.4 42 +2.19 +0.95
Immunisation (WB/WHO) 89.9 18 +0.67 +2.98
Antiretroviral Treatment (ART) Provision (UNAIDS) 82.8 11 +4.97 +1.83
HUMAN DEVELOPMENT
N/A
*AAT: Annual Average Trend
If AAT appears the same in the two time periods, differences exist beyond the 2nd decimal place.
For a full list of data sources see Annex.
Increasing Improvement Slowing Improvement Warning Signs Bouncing Back Slowing Deterioration Increasing Deterioration No Change

161
2017 IIAG: Index Report2017 IIAG Zimbabwe Scores, Ranks & Trends
OVERALL GOVERNANCE
45.4 40th2016 SCORE 2016 RANK
+1.06 +1.4510 -YEAR AAT* 5-YEAR AAT
SAFETY & RULE OF LAW 46.0 38 +0.64 +1.30
RULE OF LAW 42.5 38 +1.71 +2.83
Judicial Independence (BS/WEF/V-Dem/GI) 45.6 24 +2.33 +2.55
Judicial Process (EIU/GI) 37.5 33 +4.17 +9.38
Access to Justice (V-Dem) 48.7 36 +2.40 +2.83
Property Rights (BS/HER/WEF/AfDB/WB) 23.5 51 +1.37 +2.23
Transfers of Power (EIU) 0.0 38 0.00 0.00
Multilateral Sanctions (CDD) 100.0 1 0.00 0.00
ACCOUNTABILITY 24.6 40 +0.09 -0.90
Access to Information (GI) 54.2 7 +0.47 +1.05
Online Public Services (UNDESA) 35.3 22 +2.22 -1.35
Public Sector Accountability & Transparency (V-Dem/AfDB/WB)
25.0 46 +1.91 +2.80
Accountability of Public Officials (EIU/BS) 7.1 47 -0.80 -1.80
Corruption in Government & Public Officials (EIU) 0.0 38 -2.22 -5.00
Corruption & Bureaucracy (WB) 19.0 33 -1.07 -2.40
Diversion of Public Funds (WEF) 27.1 27 +1.11 -0.85
Corruption Investigation (GI/AFR) 29.0 30 -0.89 +0.25
PERSONAL SAFETY 38.0 44 +0.07 +2.18
Safety of the Person (EIU/AFR) 43.8 33 -0.83 +1.25
Police Services (WEF/GI) 42.1 22 +2.64 +4.55
Social Unrest (EIU/ACLED) 35.9 43 -3.19 -4.48
Crime (EIU/AFR) 55.1 21 +3.07 +3.63
Political Violence (ACLED/PTS) 51.3 44 +4.31 +8.13
Human Trafficking (USDS) 0.0 39 -5.56 0.00
NATIONAL SECURITY 78.9 32 +0.71 +1.15
Government Involvement in Armed Conflict (UCDP) 100.0 1 0.00 0.00
Domestic Armed Conflict (EIU) 50.0 25 0.00 +6.25
Violence by Non-state Actors (ACLED) 76.0 40 -0.39 +0.43
Cross-border Tensions (EIU) 50.0 31 0.00 0.00
Internally Displaced People (IDMC) 100.0 1 +4.67 0.00
Political Refugees (UNHCR) 97.2 35 -0.01 +0.23
SAFETY & RULE OF LAW
SCORE 2016
RANK 2016
10 -YEAR AAT
5-YEAR AAT
SCORE 2016
RANK 2016
10 -YEAR AAT
5-YEAR AAT
PARTICIPATION & HUMAN RIGHTS 42.8 34 +1.29 +2.00
PARTICIPATION 31.7 40 +0.49 +0.90
Political Participation (EIU/FH/V-Dem) 55.8 30 +0.39 +1.08
Civil Society Participation (BS/V-Dem/GI) 35.8 41 +1.41 +1.75
Free & Fair Elections (BS/CDD/V-Dem) 26.7 44 +0.81 +2.63
Election Monitoring Agencies (V-Dem/GI) 29.1 41 -0.16 -0.93
Legitimacy of Political Process (BS) 11.1 25 0.00 0.00
RIGHTS 28.5 43 +1.52 +2.40
Freedom of Expression (BS/RSF/V-Dem/GI) 34.7 43 +0.02 -2.08
Freedom of Association & Assembly (BS/GI) 28.5 34 +1.93 +2.28
Civil Liberties (BS/FH ) 35.4 32 +2.31 +4.43
Human Rights Conventions (UNOLA/OHCHR) 47.6 42 +2.11 +3.58
Human Rights Violations (EIU) 25.0 25 +2.78 +6.25
Protection against Discrimination (GI) 0.0 36 0.00 0.00
GENDER 68.3 12 +1.87 +2.73
Gender Equality (AfDB/WB) 67.1 17 +4.96 +7.08
Women's Political Participation (IPU/GI/WB) 39.4 25 +0.78 +2.20
Gender Balance in Education (UNESCO) 80.8 21 +0.13 -0.03
Women's Labour Force Participation (WB) 85.7 9 -0.41 +0.25
Workplace Gender Equality (GI) 50.0 4 +5.56 +12.50
Women in the Judiciary (GI) 100.0 1 0.00 0.00
Laws on Violence against Women (OECD) 58.3 12 +2.81 -3.13
Women's Political Empowerment (V-Dem) 65.1 33 +1.13 +2.88
PARTICIPATION & HUMAN RIGHTS
SCORE 2016
RANK 2016
10 -YEAR AAT
5-YEAR AAT
SUSTAINABLE ECONOMIC OPPORTUNITY 37.2 41 +1.36 +2.48
PUBLIC MANAGEMENT 42.2 35 +2.16 +1.75
Governmental Statistical Capacity (WB) 50.7 34 +0.64 +0.73
Civil Registration (GI) 62.5 25 0.00 0.00
Public Administration (AfDB/WB) 40.6 44 +2.20 +2.08
Diversification (AfDB/OECD/UNDP) 6.9 24 -0.70 -1.43
Budget Management (AfDB/WB) 55.2 34 +3.31 +6.35
Budget Balance (AfDB/AUC/UNECA) 49.8 16 +4.32 -1.30
Fiscal Policy (AfDB/WB) 32.5 48 +3.61 +1.78
Revenue Mobilisation (ICTD/UNU-WIDER/AfDB/WB) 56.1 15 +3.22 +1.25
Transparency of State-owned Companies (GI) 25.0 7 +2.78 +6.25
BUSINESS ENVIRONMENT 23.6 47 +0.12 +0.75
Investment Climate (HER) 27.8 48 +1.86 +6.95
Competition (BS/GI/AfDB/WB) 25.0 47 -0.11 -1.08
Business Bureaucracy & Red Tape (EIU) 0.0 31 0.00 0.00
Customs Procedures (WEF) 30.3 36 +0.51 -3.05
Soundness of Banks (WEF) 23.4 36 -2.58 -2.38
Employment Creation (AFR) 14.6 32 -0.99 +0.10
Regional Integration (AfDB) 43.8 29 +2.09 +4.70
INFRASTRUCTURE 36.0 35 -0.22 +1.20
Transport Infrastructure (WEF/AFR/EIU/GI) 38.9 23 +0.11 +2.10
Electricity Infrastructure (WEF/AFR) 18.0 34 +0.63 +2.45
Digital & IT Infrastructure (EIU/ITU) 41.5 18 +2.40 +1.30
Access to Improved Water (WHO/UNICEF) 59.9 31 -0.32 -0.28
Water & Sanitation Services (AFR) 21.6 28 -3.93 +0.40
RURAL SECTOR 47.1 36 +3.39 +6.23
Rural Land & Water (IFAD) 73.9 6 +6.39 +10.50
Rural Business Climate (IFAD) 58.0 23 +5.60 +8.18
Rural Development Resources (IFAD) 31.3 44 +3.48 +5.88
Agricultural Support System (IFAD) 55.9 24 +2.86 +10.48
Agricultural Policy Costs (WEF) 17.4 40 +1.72 -5.28
Engagement with Rural Organisations (IFAD) 54.0 31 +5.12 +8.48
Gender Balance in Rural Decision-making (IFAD) 50.0 13 +1.39 +4.68
Rural Accountability & Transparency (IFAD) 36.3 35 +0.59 +6.80
SUSTAINABLE ECONOMIC OPPORTUNITY
SCORE 2016
RANK 2016
10 -YEAR AAT
5-YEAR AAT
HUMAN DEVELOPMENT 55.5 28 +0.90 -0.05
WELFARE 39.8 41 +0.68 +1.28
Welfare Services (AfDB/WB) 67.7 28 +5.40 +8.85
Social Safety Nets (BS) 30.8 31 -0.86 +0.98
Social Protection & Labour (AfDB/WB) 39.2 45 +3.12 +3.45
Social Exclusion (BS) 28.6 7 0.00 0.00
Poverty (AFR) 43.8 23 +1.68 -0.73
Poverty Reduction Priorities (AFR/AfDB/WB) 33.0 47 -1.77 +0.35
Narrowing Income Gaps (AFR) 34.6 18 -1.03 -0.43
Environmental Policy (BS) 14.3 38 -3.18 -3.58
Environmental Sustainability (AfDB/WB) 66.7 23 +2.78 +2.78
EDUCATION 56.9 17 +0.56 -0.83
Education Provision (AFR) 47.5 16 +0.64 -6.13
Education Quality (BS) 50.0 11 +1.86 0.00
Educational System Management (WEF) 66.8 7 -0.29 -2.60
Human Resources in Primary Schools (UNESCO) 72.7 25 +0.12 -0.15
Primary School Completion (WB) 74.9 12 +0.56 +0.25
Secondary School Enrolment (UNESCO) 40.6 27 +0.64 +0.20
Tertiary Education Enrolment (UNESCO) 13.4 27 +0.46 +1.05
Literacy (WB) 89.6 11 +0.46 +0.78
HEALTH 69.7 32 +1.48 -0.60
Basic Health Services (AFR) 42.3 25 -0.44 -8.28
Public Health Campaigns (GI) 50.0 33 0.00 0.00
Child Mortality (IGME) 74.2 31 +1.36 +0.88
Maternal Mortality (MMEIG) 83.5 30 +0.50 -0.63
Access to Sanitation (WHO/UNICEF) 53.2 29 -0.02 -0.03
Undernourishment (WB) 48.9 40 +1.03 -0.10
Disease (WHO) 94.6 11 +0.52 +0.28
Immunisation (WB/WHO) 86.1 25 +1.92 -2.75
Antiretroviral Treatment (ART) Provision (UNAIDS) 94.1 3 +8.34 +5.20
HUMAN DEVELOPMENT
*AAT: Annual Average Trend
If AAT appears the same in the two time periods, differences exist beyond the 2nd decimal place.
For a full list of data sources see Annex.
Increasing Improvement Slowing Improvement Warning Signs Bouncing Back Slowing Deterioration Increasing Deterioration No Change


Annex
Data Sources
Indicators: Definitions & Sources
Notes
Research Team & Advisory Council
Board of Directors

164
Safety & Rule of Law
Rule of Law
1 Judicial Independence (BS/WEF/V-Dem/GI)
Independence of the judiciary from the influence of external actors; whether the judiciary has the ability and autonomy to interpret and review existing laws, legislation and policy; and the integrity of the process of appointing and removing national-level judges. It consists of four sub-indicators.
2 Judicial Process (EIU/GI)
Extent to which the legal process is free from interference, and the existence of formal judicial reasoning. It consists of two sub-indicators.
3 Access to Justice (V-Dem) Extent to which citizens enjoy secure and effective access to justice.
4 Property Rights (BS/HER/WEF/AfDB/WB)
Extent to which the government protects and enforces private property and contract rights. It consists of four sub-indicators.
5 Transfers of Power (EIU) Degree to which constitutional mechanisms are clear, established and accepted for the orderly transfer of power from one government to the next.
6 Multilateral Sanctions (CDD) Imposition of sanctions by the United Nations and/or the African Union on a state and/or governmental and/or non-governmental actors.
Accountability
1 Access to Information (GI) Extent to which public and legislative records are accessible. It consists of two sub-indicators.
2 Online Public Services (UNDESA) Extent to which the government uses ICT to deliver public services at national level.
3 Public Sector Accountability & Transparency (V-Dem/AfDB/WB)
Extent of executive corruption and extent to which the executive and public employees can be held to account by the electorate, legislative and judiciary. It consists of two sub-indicators.
4 Accountability of Public Officials (EIU/BS)
Extent of accountability of public officials and degree to which there are penalties if they abuse their positions. It consists of two sub-indicators.
5 Corruption in Government & Public Officials (EIU)
Level of vested interest/cronyism and corruption in the public sector.
6 Corruption & Bureaucracy (WB)
Degree of intrusiveness of bureaucracy, amount of red tape likely to be encountered and likelihood of encountering corruption among officials and other groups.
7 Diversion of Public Funds (WEF) Prevalence of the diversion of public funds to companies, individuals or groups due to corruption.
8 Corruption Investigation (GI/AFR)
Extent to which allegations of corruption in the public sector and the executive are investigated by an independent body, and extent to which the public are satisfied with how the government is fighting corruption. It consists of three sub-indicators.
Personal Safety
1 Safety of the Person (EIU/AFR) Perceived level of criminality, and public perceptions of neighbourhood safety. It consists of two sub-indicators.
2 Police Services (WEF/GI) Reliability of the police and the extent to which allegations of police misconduct and abuse of force are investigated. It consists of two sub-indicators.
3 Social Unrest (EIU/ACLED) Prevalence of violent demonstrations and social unrest, and degree of riots and protests in a given year. It consists of two sub-indicators.
4 Crime (EIU/AFR) Prevalence of violent crime; public perception of violent crime; and degree to which the public are satisfied with how the government is reducing crime. It consists of three sub-indicators.
5 Political Violence (ACLED/PTS) Level of violence and violations of physical integrity rights committed against civilians by the state. It consists of two sub-indicators.
6 Human Trafficking (USDS) Nature and scope of trafficking in persons and government actions to confront and eliminate it.
National Security
1 Government Involvement in Armed Conflict (UCDP)
Degree of direct or indirect involvement of the government in an armed conflict which results in at least 25 annual battle-related deaths.
2 Domestic Armed Conflict (EIU) Level of internal conflict and/or civil war, or the likelihood of conflict developing in the near future.
3 Violence by Non-state Actors (ACLED)
Degree of violence against civilians perpetrated by rebel groups, political militias and identity militias.
Indicators: definitions & sources

165
2017 IIAG: Index Report
4 Cross-border Tensions (EIU) Level of potential threats to economic and political stability due to international disputes or tensions.
5 Internally Displaced People (IDMC)
People displaced within a country due to violence, conflict and violations of human rights.
6 Political Refugees (UNHCR) People fleeing the country due to fear of persecution.
Participation & Human Rights
Participation
1 Political Participation (EIU/FH/V-Dem)
Extent to which citizens are free to participate in the political process, join a political organisation and the existence and freedom of opposition parties. It consists of three sub-indicators.
2 Civil Society Participation (BS/V-Dem/GI)
Extent to which the government enables the participation of civil society in the political process; allows NGOs to organise freely and involves civil society actors in the political process; and does not persecute or harass NGO employees. It consists of three sub-indicators.
3 Free & Fair Elections (BS/CDD/V-Dem)
Extent to which executive and legislative elections are free and fair, including impartiality of the electoral laws and framework. It consists of three sub-indicators.
4 Election Monitoring Agencies (V-Dem/GI)
Extent to which election management bodies are autonomous from the government, have the capacity to adequately monitor national elections, and make available timely, publicly available reports available before and after a national election.
5 Legitimacy of Political Process (BS)
Extent to which democratically elected political representatives have effective power to govern or to which there are veto powers and political enclaves.
Rights
1 Freedom of Expression (BS/RSF/V-Dem/GI)
Extent to which citizens and organisations can express opinions freely; the degree of print, broadcast and internet freedom; and the existence of media and citizen self-censorship. It consists of five sub-indicators.
2 Freedom of Association & Assembly (BS/GI)
Extent to which citizens can associate freely in public and participate in civic and political organisations, and workers can organise into trade unions. It consists of two sub-indicators.
3 Civil Liberties (BS/FH) Extent to which citizens enjoy civil liberties and can seek redress for violations of these rights. It consists of two sub-indicators.
4 Human Rights Conventions (UNOLA/OHCHR)
Ratification of the nine core international human rights conventions, and two optional protocols on children, and the submission of reports to the relevant bodies.
5 Human Rights Violations (EIU) Likelihood of a state being accused of serious human rights violations.
6 Protection against Discrimination (GI)
Whether the government protects ethnic minorities from discrimination and protects citizens from discrimination based on religious beliefs. It consists of two sub-indicators.
Gender
1 Gender Equality (AfDB/WB) Extent to which the government promotes equal access for men and women to human capital development opportunities and productive and economic resources, and provides equal status and protection under the law. It consists of two sub-indicators.
2 Women's Political Participation (IPU/GI/WB)
Extent to which women are represented in the legislative and executive. It consists of two sub-indicators.
3 Gender Balance in Education (UNESCO)
Ratio of girls to boys enrolled at primary and lower secondary levels in public and private schools.
4 Women's Labour Force Participation (WB)
Female population, 15 and older, that is economically active.
5 Workplace Gender Equality (GI)
Extent to which women receive equal pay and benefits to men for performing the same job, have equal opportunities to be hired or promoted and are not discriminated against as a result of pregnancy.
6 Women in the Judiciary (GI) Extent to which at least a third of the members of the highest branch of the judiciary are women.
7 Laws on Violence against Women (OECD)
Existence of women's legal protection from rape, assault and sexual harassment.

166
8 Women's Political Empowerment (V-Dem)
Extent to which women are politically empowered, assessing fundamental civil liberties, women's open discussion of political issues and participation in civil society organisations, and the descriptive representation of women in formal political positions.
Sustainable Economic Opportunity
Public Management
1 Governmental Statistical Capacity (WB)
Capacity of national statistical systems in terms of methodology, data sources, periodicity and timeliness.
2 Civil Registration (GI) Existence of a functioning birth and death registration system and the ability of citizens to obtain birth and death certificates in a reasonable period and at no charge. It consists of two sub-indicators.
3 Public Administration (AfDB/WB)
Effectiveness of the civilian central government in designing and implementing policy, delivering public services and managing human resources. It consists of two sub-indicators.
4 Diversification (AfDB/OECD/UNDP)
Extent to which exports are diversified.
5 Budget Management (AfDB/WB)
Extent to which there is a comprehensive and credible budget linked to policy priorities, effective financial management and fiscal reporting. It consists of two sub-indicators.
6 Budget Balance (AfDB/AUC/UNECA)
Total budget revenue as a proportion of total budget expenditure.
7 Fiscal Policy (AfDB/WB) Quality and sustainability of fiscal policy. It consists of two sub-indicators.
8 Revenue Mobilisation (ICTD/AfDB/WB)
Overall pattern of domestic resource mobilisation. It consists of two sub-indicators.
9 Transparency of State- owned Companies (GI)
Extent to which the financial records of state-owned companies are available online or offline to journalists, auditors and citizens in a timely and cost-efficient manner.
Business Environment
1 Investment Climate (HER) Degree of economic freedom, based on constraints on the flow of investment capital.
2 Competition (BS/GI/AfDB/WB)
Business regulatory environment; the level of market-based competition; and the quality of the competitive bidding process. It consists of three sub-indicators.
3 Business Bureaucracy & Red Tape (EIU)
Extent of red tape, including bureaucratic delay and complexity in obtaining the appropriate documentation or authorisation to engage in business activities.
4 Customs Procedures (WEF) Level of efficiency of customs procedures relating to the entry and exit of merchandise.
5 Soundness of Banks (WEF) Soundness of banks, ranging from the requirement of recapitalisation to being generally healthy with sound balance sheets.
6 Employment Creation (AFR) Extent to which the public are satisfied with how the government is handling creating jobs.
7 Regional Integration (AfDB) Extent of the government's actions and efforts to (i) promote free movement of persons and labour and easy right of establishment, and (ii) contribute to regional financial integration.
Infrastructure
1 Transport Infrastructure (WEF/AFR/EIU/GI)
Extent to which the public are satisfied with government maintenance of roads and bridges, the adequacy of the rail network for business needs; and quality of air transport and aviation safety. It consists of four sub-indicators.
2 Electricity Infrastructure (WEF/AFR)
Quality of the electricity supply and level of public satisfaction with the provision of a reliable electricity supply by the government. It consists of two sub-indicators.
3 Digital & IT Infrastructure (EIU/ITU)
Extent to which IT infrastructure is adequate for business needs; subscriptions to a mobile telephone service; households with a computer; and household access to Internet. It consists of four sub-indicators.
4 Access to Improved Water (WHO/UNICEF)
Population served with drinking water from an improved source, provided collection time is not more than 30 minutes for a round trip.
5 Water & Sanitation Services (AFR) Extent to which the public are satisfied with government provision of water and sanitation services.
Indicators: definitions & sources

167
2017 IIAG: Index Report
Rural Sector
1 Rural Land & Water (IFAD) Extent to which the rural poor have secure access to land and equitable user-rights over water resources for agriculture. It consists of two sub-indicators.
2 Rural Business Climate (IFAD) Extent to which the policy and institutional framework supports the development of private rural businesses and commercially-based agricultural and rural finance markets. It consists of three sub-indicators.
3 Rural Development Resources (IFAD)
Government policies, strategies and investment programmes for the agricultural and rural development sector, and the efficiency, consistency and transparency with which resources are allocated, managed and accounted for.
4 Agricultural Support System (IFAD)
Extent to which low-income farmers, including women, have access to agricultural research and the extension system, and whether it is responsive to their needs and priorities.
5 Agricultural Policy Costs (WEF)
Nature of agricultural policy, ranging from excessively burdensome for the economy to balancing the interests of taxpayers, consumers and producers.
6 Engagement with Rural Organisations (IFAD)
Extent to which the rural poor can organise for collective action and engage in dialogue with the government. It consists of two sub-indicators.
7 Gender Balance in Rural Decision-making (IFAD)
Extent to which laws, policies, institutions and practices promote equal representation of men and women in local decision-making.
8 Rural Accountability & Transparency (IFAD)
Extent to which there is local level accountability of the executive and legislature, including public employees and elected officials, to low-income rural populations for use of funds and results of actions.
Human Development
Welfare
1 Welfare Services (AfDB/WB) National policies and service delivery that affect access to and quality of health and education related services. It consists of two sub-indicators.
2 Social Safety Nets (BS) Extent to which there is equality of opportunity in society and there are social safety nets which compensate for poverty and other risks, such as old age, illness, unemployment or disability.
3 Social Protection & Labour (AfDB/WB)
Effectiveness of social protection and labour policies. It consists of two sub-indicators.
4 Social Exclusion (BS) Extent to which significant parts of the population are fundamentally excluded from society due to poverty and inequality (taking into account factors such as income and education inequality and religious, ethnic and gender exclusion).
5 Poverty (AFR) Quality of living conditions of the public, and extent to which the public have gone without enough food to eat, clean water for home use and fuel to cook food in the past year. It consists of four sub-indicators.
6 Poverty Reduction Priorities (AFR/AfDB/WB)
Level of public satisfaction with how the government is improving the living standards of the poor; and extent to which public expenditure and revenue collection affects poor populations and is consistent with national poverty reduction priorities. It consists of two sub-indicators.
7 Narrowing Income Gaps (AFR) Extent to which the public are satisfied with how the government is narrowing the gap between rich and poor.
8 Environmental Policy (BS) Extent to which environmental concerns are effectively taken into account in both macro- and micro-economic policymaking.
9 Environmental Sustainability (AfDB/WB)
Extent to which environmental policies promote the protection and sustainable use of natural resources and the management of pollution. It consists of two sub-indicators.
Education
1 Education Provision (AFR) Extent to which the public are satisfied with how the government is addressing educational needs.
2 Education Quality (BS) Extent to which there are solid institutions for basic, secondary and tertiary education, as well as for research and development.

168
3 Educational System Management (WEF)
Extent to which the educational system meets the needs of a competitive economy.
4 Human Resources in Primary Schools (UNESCO)
Pupils enrolled in primary school in relation to primary school teachers.
5 Primary School Completion (WB)
Students completing the last year of primary school, in relation to the population of the age group for that level.
6 Secondary School Enrolment (UNESCO)
Enrolment in secondary education, regardless of age, in relation to the population of the age group for that level.
7 Tertiary Education Enrolment (UNESCO)
Enrolment in tertiary education, regardless of age, in relation to the population of the age group for that level.
8 Literacy (WB) Population aged 15 or over who can both read and write a short simple statement on their everyday life.
Health
1 Basic Health Services (AFR) Extent to which the public are satisfied with how the government is improving basic health services.
2 Public Health Campaigns (GI)
Extent to which all citizens can find information and guidelines on common illnesses, and public health hazards such as epidemics trigger awareness campaigns.
3 Child Mortality (IGME) Probability of a child dying between birth and five years of age, if subject to current age-specific mortality rates.
4 Maternal Mortality (MMEIG) Female deaths from any cause related to, or aggravated by, pregnancy or its management (excluding accidental or incidental causes).
5 Access to Sanitation (WHO/UNICEF)
Population with access to an improved sanitation facility, and the population served with open defecation sanitation. It consists of two sub-indicators.
6 Undernourishment (WB) Population whose food intake is insufficient to meet dietary energy requirements continuously.
7 Disease (WHO) Prevalence of deaths from malaria and tuberculosis. It consists of two sub-indicators.
8 Immunisation (WB/WHO) Children that have received vaccinations against measles, DPT and hepatitis B. It consists of three sub-indicators.
9 Antiretroviral Treatment (ART) Provision (UNAIDS)
Eligible adults and children receiving antiretroviral treatment therapy, and HIV-positive pregnant women who receive antiretrovirals to prevent mother-to-child transmission. It consists of two sub-indicators.
Indicators: definitions & sources

169
2017 IIAG: Index ReportData sources
Acronym Name of Data Source
AfDB African Development Bank
AUC African Union Commission
AFR Afrobarometer
ACLED Armed Conflict Location & Event Data Project
BS Bertelsmann Stiftung
EIU Economist Intelligence Unit
FH Freedom House
CDD Ghana Center for Democratic Development
HER The Heritage Foundation
GI Global Integrity
IGME Inter-agency Group for Child Mortality Estimation
IDMC Internal Displacement Monitoring Centre
ICTD International Centre for Tax and Development
IFAD International Fund for Agricultural Development
ITU International Telecommunication Union
IPU Inter-Parliamentary Union
UNAIDS Joint United Nations Programme on HIV/AIDS
MMEIG Maternal Mortality Estimation Inter-agency Group
OHCHR Office of the High Commissioner for Human Rights
UNHCR Office of the United Nations High Commissioner for Refugees
OECD Organisation for Economic Co-operation and Development
PTS Political Terror Scale
RSF Reporters sans frontières
UNICEF United Nations Children's Fund
UNDESA United Nations Department of Economic and Social Affairs
UNDP United Nations Development Programme
UNECA United Nations Economic Commission for Africa
UNESCO United Nations Educational, Scientific and Cultural Organization
UNOLA United Nations Office of Legal Affairs
UNU-WIDER United Nations University World Institute for Development Economics Research
USDS United States Department of State - Office to Monitor and Combat Trafficking in Persons
UCDP Uppsala University, Department of Peace and Conflict Research - Uppsala Conflict Data Programme
V-Dem V-Dem Institute
WB World Bank
WEF World Economic Forum
WHO World Health Organization

170
Notes
The 2017 IIAG covers a 17-year data period from 2000 to 2016. The full IIAG data set, including underlying raw data and normalised scores, as calculated for the express purposes of the Index, is available online via the Foundation’s website at: http://mo.ibrahim.foundation/iiag/downloads/
All figures on IIAG outputs are displayed to one decimal place. The calculation method to arrive at these scores is as follows:
• Country scores are calculated on full-precision raw data values (using the exact values as they are collected from source). All scores are then rounded to one decimal place.
• Group averages are calculated on the rounded, one decimal place country scores.
• Both trends over time and ranks are calculated on the scores to one decimal place.
The exception to this are the annual average trend figures. These are calculated on the rounded trends over time, and displayed to two decimal places. Classifications are assigned based on the full precision of the annual average trend.
Forty-three of the 100 indicators in the IIAG were formed by clustering together a number of variables which each measure the same dimension or similar concept. For each indicator these variables, called ‘sub-indicators’, may come from the same or multiple sources. The value of a clustered indicator is the average of the underlying sub-indicators.
For the purposes of setting base years for trend analysis (improvements and deteriorations over time), in all 2017 IIAG publications and tables these are set at a ten-year period, 2007-2016, and five-year period, 2012-2016 (unless otherwise stated). Please note that users of the IIAG can carry out analysis of any other time-periods by using our online and offline Data Portals available via our website.
The 2017 IIAG does not include data for South Sudan prior to secession in 2011. Due to the lack of data, ten-year trends are not available for this country. Since the country trend classifications are based on a comparison of a country’s ten and five-year trends, these are not provided for South Sudan.
The absence of South Sudan scores prior to 2011 means that 53 countries are ranked in 2000 to 2010 inclusive and 54 countries are ranked in 2011 to 2017 inclusive. This should be taken into account when looking at rank change over time. Similarly, averages calculated for groups which include South Sudan exclude the country in pre-secession years.
All other group averages, including Regional Economic Communities and regional groups, are calculated on their current group composition.
Data for Sudan prior to 2011 (Former Sudan) have been used in the 2017 IIAG. Despite Sudan being a new country post-secession of South Sudan, pre-2011 data for ‘Former Sudan’ are deemed a suitable proxy for governance in Sudan.
Somalia has no underlying raw data for all indicators in the Rural Sector sub-category (2000-2016). In this instance Somalia does
not receive a score or rank. For this instance and the years where South Sudan does not receive a rank and score (2000-2010) this is indicated by “.”.
The Mo Ibrahim Foundation (MIF) is aware that some sources update their data sets after our documentation is sent to print. IIAG raw data are correct as per the data “last accessed”, which is stated for each indicator within the Data Portal and the Metadata (downloadable via our website).
For a full methodology and list of sources used in the IIAG please visit our website. For any other enquiries and clarifications please contact the Mo Ibrahim Foundation’s Research Team at [email protected].
Join the discussion on Twitter, Facebook or Instagram:
@Mo_IbrahimFdn #IIAG /MoIbrahimFoundationmoibrahimfoundation

171
2017 IIAG: Index ReportResearch Team & Advisory Council
Foundation Research Team
IIAG Project Team
Name Title
Nathalie Delapalme Executive Director - Research and Policy
Carolina Rocha da Silva Researcher
Camilla Rocca Senior Research Analyst
Diego Fernandez Fernandez Analyst
Vanessa Sanda Van-Dunem Junior Researcher
Yannick Vuylsteke Senior Programme Manager
Zainab Umar Research and Operations Officer
Foundation Design Team
Name Title
Styliani Orkopoulou Junior Graphic Designer
Maria Tsirodimitri Graphic Designer
Advisory Council
Name Organisation
Dr Abdalla Hamdok (Chair) United Nations Economic Commission for Africa
Abdoulie Janneh Mo Ibrahim Foundation
Abdul Aziz Al-Yaqout Al-Yaqout Group
Dr Ali Hadi Department of Mathematics and Actuarial Science, American University in Cairo
Dr Daniel Kaufmann Natural Resource Governance Institute
Dr Daniel Zovatto International Institute for Democracy and Electoral Assistance
Dr Emmanuel Gyimah-Boadi* Ghana Center for Democratic Development
Jide Olanrewaju TPG Growth
Lord Simon Cairns Africa's Voices
Dr Maurice Enguéléguélé International Institute for Democracy and Electoral Assistance
Nathalie Delapalme Mo Ibrahim Foundation
Dr Piero Stanig Department of Policy Analysis and Public Management, Bocconi University
Dr Vera Songwe United Nations Economic Commission for Africa
Prof Staffan Lindberg* V-Dem Institute
Dr Eddy Maloka Africa Peer Review Mechanism
Dr Alan Hudson* Global Integrity
Johannes Tonn* Global Integrity
*Observer
The Foundation would like to extend a special thank you to Christina Nelson for her contribution to the report.

172
Board of Directors
Nathalie Delapalme Executive Director - Research and Policy, Mo Ibrahim Foundation; Former Advisor on Africa and Development to various French Foreign Ministers.
Abdoulie Janneh Executive Director - Liaison with Governments and Institutions in Africa, Mo Ibrahim Foundation; Former Executive Secretary, UNECA.
Hosh Ibrahim Director of Special Projects, Mo Ibrahim Foundation.
Jendayi Frazer President and CEO of 50 Ventures, LLC; Former US Ambassador to South Africa.
Jin-Yong Cai Partner at TPG; Former Executive Vice President and Chief Executive Officer of the International Finance Corporation (IFC).
Mo Ibrahim Founder and Chair, Mo Ibrahim Foundation; Founder, Celtel International.
Donald Kaberuka Senior Adviser to TPG/Satya; Former President, African Development Bank; Former Minister of Finance of Rwanda.
Valerie Amos Director, School of Oriental and African Studies (SOAS), University of London; Former Under-Secretary General for Humanitarian Affairs and Emergency Relief Co-ordinator.
Hadeel Ibrahim Executive Director - Strategy and External Relations, Mo Ibrahim Foundation; Co-Chair of the Africa Center, New York.

173
2017 IIAG: Index Report
Mary Robinson UN Special Envoy on El Niño and Climate; Former UN High Commissioner for Human Rights; Former President of Ireland.
Salim Ahmed Salim Former Secretary-General, OAU; Former Prime Minister of Tanzania.
Ngaire Woods Dean of the Blavatnik School of Government and Professor of Global Economic Governance, University of Oxford.
Ketumile Masire (dcd 2017) Former President of Botswana.
Jay Naidoo Former Chair of the Board and Partnership Council, GAIN; Founding General Secretary, COSATU.
Pascal Lamy Former Director-General, World Trade Organization.
Graça Machel Founder, Graça Machel Trust; Former Education Minister of Mozambique.


mo.ibrahim.foundation
@Mo_IbrahimFdn #IIAG
/MoIbrahimFoundation
moibrahimfoundation
mo.ibrahim.foundation/iiag/downloads
2017COUNTRYSNAPSHOTS
The IIAG Data Portal is an interactive application, available for in-depth analysis of the results of the IIAG, in English or French.
DATAPORTALiiag.online