20 17 - symbiotics
TRANSCRIPT

ANNUALREPORT
2
0
1
7
2017

DisclaimerThis Annual Report contains general information about Symbiotics SA and its subsidiaries (together ‘Symbiotics’) and is intended for informational purposes only. Investors should determine for themselves whether a particular service or financial instrument is suitable for their investment needs and should seek professional advice for their particular situation. Any reliance placed on this Annual Report is done entirely at the risk of the person placing such reliance. Brand names, logos and trademarks used herein are for information purposes only. The listing of any company or their logos is not intended to imply any sponsorship, endorsement or affiliation with Symbiotics. The information contained in this Annual Report is not an offer to sell or a solicitation of an offer to purchase interests neither in Symbiotics nor in any financial instruments managed or offered by Symbiotics, nor is it intended to provide, and should not be relied on for, investment, tax, legal or financial advice. The content of this Annual Report is a summary only, is not complete, and does not include all material information about financial services or instruments managed or offered by Symbiotics, including potential conflicts of interest and risks associated with an investment by Symbiotics. Please refer to offering documents for further information concerning specific instruments.01
05.
18

ANNUALREPORT
2017


FOREWORD 3
GOVERNANCE 4
Social Charter 4
Board of Directors 5
General Management 6
CORPORATE 7
Financials 7
Risk, Compliance and Legal 7
People 8
Digital 9
MARKETS 12
Market Coverage 12
Investees 18
INVESTMENTS 20
Investment Instruments 22
Risk and Recovery 22
PORTFOLIOS 24
CLIENTS 25
IMPACT 26
Social Performance 26
Impact Measurement 27
Capacity Building 27
Corporate Social Responsibility 28
Market Research 28
CONTACTS 30
CONTENTS
1
A N N U A L R E PO RT 2017

2
2017 A N N U A L R E PO RT

Dear shareholders, clients and partners,
We are pleased to inform you that 13 years after inception, Symbiotics continues to be a fast-growing
innovative company, presenting outstanding results. We believe that over the recent years it has become
the leading market access platform for impact investments, and certainly a global reference mid-size
company in sustainable finance.
In 2017, the new investments originated during the year grew from 595m$ to 809m$. The direct
investment portfolio from 1.3b$ to 1.7b$. The invested markets from 60 to 66, and the investee
companies from 219 to 252. The number of home made deals from 845 to 995. And the staff from
97 to 132. They addressed the needs of over 20 funds/mandates, which are planned to grow to 2.5b$
assets under management by the end of 2018.
The performances of our funds were quite good in 2017, better than that of the two previous years, at
around 3 to 4% in net USD terms and 8 to 9% on average for unhedged local currency strategies. They
financed 1.7 million households and small businesses in low- and middle-income economies, which were
understood to directly support the jobs of 3.1 million people.
As a consequence, the revenues of the year were the largest since inception, inducing healthy
profitability and prudential ratios, offering robust financial perspectives for the future.
The firm has also embarked on a new strategy, targeting to pass 1b$ of origination per annum and
double its assets under management by 2020, by continuing to grow in financial inclusion (60%) but also
in small business finance (30%) and innovate through project and enterprise development (10%) – with
a focus on six core themes: agricultural finance, community development, renewable energy, health and
education, natural resources, and water and sanitation.
Symbiotics has also innovated in 2017 in impact measurement and financial technology, by launching
its first direct end client impact measurement initiative, tracking 500 SMEs in 12 countries, and by
launching plumseeds.com, its on-line deal-making platform for professional investors.
We would like to thank each one of you – shareholders, clients and partners, as well as our board,
management and staff, for your support in this continued success.
Ivan Pictet
Chairman
Roland Dominicé
Chief Executive Officer
3
A N N U A L R E PO RT 2017

GOVERNANCE
SOCIAL CHARTEREach investment made by Symbiotics needs to comply
with the following criteria:
› Target domestic markets in emerging and frontier
economies;
› Invest in the real economy, promoting the social
function of finance and seeking long-term value
creation;
› Integrate sustainability or social responsibility
ratings—using environmental, social and
governance (ESG) norms—in the investment
process;
› Benefit low- and middle-income households and
micro-, small and medium enterprises;
› Foster job creation and access to primary goods,
such as homes, food and energy.
At Symbiotics, our mission is to contribute to sustainable development in emerging and frontier markets by providing traditionally underserved businesses with increased access to capital and financial services. We aim to do this by offering specialized investment solutions that connect socially responsible investors to micro-, small and medium enterprises and to value chain development projects in emerging and frontier markets.
4
2017 A N N U A L R E PO RT

BOARD OF DIRECTORS
LORE VANDEWALLEAssociate Professor of Economics at the Graduate Institute of International and Development Studies (IHEID) in Geneva. Specialized in development economics and microfinance.
MICHEL GUILLETPresident of Adenia Partners, an Africa focused private equity firm; Co-Founder of BC Partners, one of the largest private equity firms worldwide; top management positions in the industrial and health sectors.
BETH KRASNAVice Chairwoman Professional independent non-executive director; currently, on the board of directors of the Swiss Federal Institutes of Technology, COOP Group and Raymond Weil SA. Formerly on the Banque Cantonale Vaudoise board.
IVAN PICTETChairman Former Senior Partner at Banque Pictet & Cie; President of the Pictet Foundation for Development and President of the Foundation for Geneva.
DAVID LEDERMANNSecretary Partner at Lenz & Staehlin since 2007; specialized in business law, particularly in corporate, M&A, private equity, investment, contract and commercial law.
TINEKE RITZEMASenior executive in the financial sector with companies including UBP and ABN AMRO Private Banking, as well as with the International Labour Organization and various NGOs. Board member of Banque Alternative Suisse and member of the ACTARES committee.
5
A N N U A L R E PO RT 2017

GENERAL MANAGEMENT The general management at Symbiotics is composed
of three professionals who have been with the firm
since its inception in 2005. The Chief Executive
Officer is supported by the Chief Financial Officer
and Chief Operating Officer (COO) in their general
management responsibilities. Together they
elaborate and implement the firm’s strategy and
manage its operations. Each of them is in charge
of one of the company’s divisions.
ROLAND DOMINICÉChief Executive Officer, Co-FounderMaster’s in international relations (Geneva), master’s in social sciences (Chicago), asset management (UBS), management consulting (PwC), corporate finance (San Francisco) and CFO (BlueOrchard).
VINCENT DUFRESNEChief Financial Officer Co-FounderMaster’s in business administration (St-Gallen), financial audit (Arthur Andersen), entrepreneurship in fintech development (including for Consultative Group to Assist the Poor (CGAP) and MixMarket).
YVAN RENAUDChief Operating OfficerMaster’s in public policy (London), banking and asset management (Capital International), development finance consulting (Africa, Latin America) and head of investment operations (BlueOrchard).
6
2017 A N N U A L R E PO RT

FINANCIALSFor the second year in a row, Symbiotics’s total
income was the highest ever achieved since our
inception. This is a logical consequence of the
material growth in volume under advisory and
management during the year under review. The
additional resources we have brought on board are
devoted to sustaining this positive development,
in particular in terms of hiring new staff. We have
maintained overheads at a level slightly above that of
the previous year. Overall our income remains quite
good, allowing to continue to deliver 20-25% return
on equity to our shareholders.
This good financial result allows us to strengthen
our equity materially as well as our main prudential
ratio (equity to fixed costs) that evolved positively in
parallel, almost twice as high as necessary.
We can thus rely on sound financial resources in
terms of retained earnings to finance the business
growth and expansion planned for the coming years.
RISK, COMPLIANCE AND LEGALWe reinforced the Risk and Compliance function
with the hiring of new staff in response to the
growing size and complexity of operations and to
an evolving and increasingly complex regulatory
environment in the jurisdictions where we are active.
Additional staff has also joined the legal team, which
is closely involved in all corporate, regulatory and
operational matters.
CORPORATE
7
A N N U A L R E PO RT 2017

Average age
37
Staff members Nationalities Shareholders
MEN50%
WOMEN50% 34 OF WHICH
45 ARE STAFF MEMBERS
7AMSTERDAM CAPE TOWNGENEVA (HQ)LONDONMEXICO CITYSINGAPOREZURICH
Office locations
Our mission—effectively connecting socially responsible investors to micro-, small and medium enterprises in emerging and frontier markets—is driven by our remarkably committed and engaged staff. The creation of 36 new positions in 2017, a 40% increase, is one visible sign of our achievements. The diversity of our workforce, catalyzed by our open, innovation-driven culture, builds our distinctive strength. Our strong commitment to building human relationships with all our stakeholders is of prime importance to our continued success.
“
” Yvonne Cachin Head of Human Resources
PEOPLE
8
2017 A N N U A L R E PO RT

Abaco Bank, Peru a plumseeds.com investment deal
DIGITALThe digital team enables Symbiotics to deliver
services to clients and to support stakeholders in
an innovative and efficient manner. It aims to identify
and leverage new technologies and digital processes
to improve the firm’s quality, speed and cost of
service delivery.
This strategy relies on project managers, business
analysts and software/application developers who
are responsible for translating it into concrete
solutions. We strengthened the team in 2017 by
hiring 3 additional developers; it now comprises
8 staff. We plan to increase investments in digital
resources (staff and systems) in the coming years in
order to further develop our competitive edge in an
environment that may be challenged by disruptive
fintech innovations.
During the year under review we developed
plumseeds.com, our web platform dedicated to the
marketing of individual investments in financial
intermediaries in emerging and frontier markets,
to institutional and professional investors. We
expect the public launch of plumseeds.com to
take place in June 2018.
Behind the scenes, the Digital team is also working
closely with the Risk and Compliance team in order
to guarantee business continuity and data security
in times where cybercrime now ranks among the
highest risks faced by businesses.
9
A N N U A L R E PO RT 2017

Myanmar, Yangon
Theingi Tsoung
Shoe business – making soles for shoes
10
2017 A N N U A L R E PO RT

11
A N N U A L R E PO RT 2017

MARKET COVERAGE In 2017, most and frontier economies confirmed
their recovery from the turmoil of 2014–2016.
Improvements in BRIC countries (Brazil and Russia
exited recession, China’s demand stabilized) led to
more positive regional macro outlooks and business
sentiments. Consequently, we witnessed a resurgence
of interest from global investors for these markets,
driven by stabilized commodity prices and structurally
low returns in most advanced economies. Although
some more challenging regional dynamics slightly
affected this positive picture, global GDP picked up,
led by a rebound in foreign direct investments as the
spike in geopolitical and global macro risks following
Brexit and the US elections decreased.
The development of our activities also reflected
this positive environment. We largely expanded
our research coverage, adding 6 countries and
contributing 67 first-time investment analysis reports
on financial institutions and impact fund structures.
In Latin America and the Caribbean, encouraging
signs of economic and credit growth at the beginning
of the year did not fully materialize, owing to
various factors such as political crises (i.e. in Brazil,
Argentina and Peru), tensions with the United States
(especially for Mexico) and natural disasters. Some of
our traditional strongholds in the region were less
dynamic and most of the growth actually came from
Central America, which also contributed 13 of the
17 brand-new financial institutions and fund
investment opportunities, including a comfortingly
large number linked to our historical core micro-
finance market segment.
MARKETS
12
2017 A N N U A L R E PO RT

South and East Asia was confirmed as the fastest
growing region globally, with moderate growth in key
markets balanced by greater expansion in smaller
countries. India suffered from falling growth rates
and slowing investments, which is partly explained by
the effects of the demonetization and the goods and
services tax reform that took place in late 2016;
but the economy is expected to pick up in 2018.
Cambodia’s economy continued to grow at 7% but
is subject to instability as the general elections
approach. Mongolia demonstrated robust recovery
with better than anticipated economic indicators and
a plan to strengthen the banking sector. We added
25 institutions or funds to our coverage in the region,
most on the higher end of our core microfinance
institutions segment.
In Eastern Europe and Central Asia, the overall picture
improved substantially with the stabilization of
commodity prices. The appreciation of the Russian
ruble contributed to an increase in remittance
volumes. Central Asian countries also benefited from
the intensification of commercial activities within the
region, notably with China and Russia. Finally, most
countries saw reinforced banking sector regulations.
Meanwhile, the Middle East and North Africa regions
were marked by relative stability in what remains a
difficult environment and by a push in technology to
improve financial services distribution. We analyzed
10 financial institutions, mostly banks, in these two
regions for the first time.
Sub-Saharan Africa remains on the path to recovery.
Diversified and services-led economies had the
best year, while the impact of the oil price slump
continued to plague undiversified economies.
However, Nigeria saw clear signs of improvement
supported by exchange rate reforms that spurred
foreign investors to return. In Kenya, post-election
tensions largely hindered growth; but the situation
seems to have calmed down. It is hoped that the
possible abolition of the lending rate cap could
boost lending to the private sector. Rumors that
West African governments would unpeg the CFA
franc from the euro affected countries in this sub-
region; but ultimately, the boost in economic activity
strengthened the common currency, allowing it to
appreciate. In this region we added 15 institutions
to our coverage, with a good balance covering all
market segments.
13
A N N U A L R E PO RT 2017

Countries in which Symbiotics is active
Percentage of Portfolio Outstanding (2017)Due to rounding, the sum does not equal 100%
%
LATIN AMERICA & THE CARIBBEAN
35%South America 18.2%
Central America, Mexico & Caribbean 17.3%
SUB-SAHARAN AFRICA
15%
14
2017 A N N U A L R E PO RT

SOUTH & EAST ASIA
33%East Asia & Pacific 16.5%
South Asia 16.1%
EASTERN EUROPE, CENTRAL ASIA & MENA
17%Russia, Caucasus & Central Asia 12.2%
Central & Eastern Europe 3.4%Middle East & North Africa 1.2%
15
A N N U A L R E PO RT 2017

Sri Lanka, Colombo
Gayathri
Broom business – dyeing bales of coconut shreds
which are used in brooms
16
2017 A N N U A L R E PO RT
17
A N N U A L R E PO RT 2017

INVESTEESThe vast majority of our investees remain financial
institutions mostly active in financial inclusion and
small business finance. Some of them focus on other
impact themes, such as affordable housing, renewable
energy or education.
In 2017, we started diversifying our market access
offer to impact investing, prospecting, analyzing
and offering opportunities in alternative channels
of impact financing, such as funds or pools of
investments.
In our core universe of financial institutions
(including thematic institutions), we note a steady
increase in coverage of virtually all sub-segments, be
it by asset size or by legal status, yet with a clearly
higher proportional growth of exposure to banks and
larger institutions.
Our partnering financial institutions display an
average balance sheet size of USD 690 million,
including USD 477 million in gross loan portfolio
(GLP), both of which are increasing through organic
growth and a greater proportion of large institutions.
Average loans to end-clients increased and the
proportion of microenterprise loans to total portfolios
continued to decrease in an obvious confirmation of
the evolution of our exposure towards institutions
with larger SME lending activity.
The financial performance indicators of the
institutions we work with have improved despite
eroding gross margins, evidencing both the global
recovery of emerging and frontier markets and
the evolution of our mix of investees, with more
diversified, more efficient and more profitable large
institutions having a rising influence on those
consolidated indicators.
Figure 1
Financial institutions in our portfolio, by status
(headcount)
40 51 60 21 20 21
119 137 158
13 11
13
0
50
100
150
200
250
300
2015 2016 2017
Number of financial institutions
NGONon-banking financial institutionCooperative Bank
Financial institutions in ourportfolio, by status (headcount)
Figure 2
Financial institutions in our portfolio, by size
(headcount)Number of financial institutions
Tier 3 Total assets < USD 10m Tier 2 Total assets USD 10m–100m Tier 1 Total assets USD 100m–1bnTier 0 Total assets > USD 1bn
Financial institutions in ourportfolio, by size (headcount)
7 13 18 55 75
90
117 112
124 14 18
16
0
50
100
150
200
250
300
2015 2016 2017
18
2017 A N N U A L R E PO RT

Figure 3
Average investee profile and performance
GROWTH INDICATORS 2015 2016 2017
Total assets (USD million) 347 578 689
Gross loan portfolio (USD million) 254 398 477
Number of active borrowers 187,629 207,523 218,611
Average loan balance per borrower (USD) – all financial institutions 4,479 7,897 9,773
Average loan balance per borrower (USD) – ‘microfinance institution’ type only
2,369 3,350 3,821
PRODUCT MIX 2015 2016 2017
Microenterprise loans (% of financial institution GLP) 56% 46% 42%
Other loan products (% of financial institution GLP). Other loan products include SME, large enterprise, education, housing, immediate household needs, and other products
44% 54% 58%
KEY PERFORMANCE INDICATORS 2015 2016 2017
Portfolio yield (%) 28.6% 25.2% 23.5%
Portfolio at risk >30 days (%) 4.4% 6.4% 5.6%
Return on equity (%) 10.7% 6.9% 9.3%
Debt/equity ratio 5.3 5.9 4.9
Operational self-sufficiency (%) 116.5% 114.2% 115.7%
Portfolio operating expense ratio (%) 16.7% 15.3% 14.4%
Cost of funding (%) 9.3% 9.0% 8.9%
19
A N N U A L R E PO RT 2017

With USD 809 million disbursed, 2017 was a record
year in terms of origination, representing 36% growth
from 2016. At the same time, considerable portfolio
reallocation marked the year. In some cases this was
voluntary as we decided to increase or decrease
our footprint in certain countries. In other cases, it
was driven by macroeconomic, political and market
conditions. For instance, we experienced very strong
investment activity in South and South-East Asia,
where origination grew from USD 156 million in
2016 to USD 295 million (+90%) in 2017, which was
in line with investor objectives to increase outreach
on this fast-growing continent. On the other hand, we
faced a very challenging year in sub-Saharan Africa,
where origination—mostly because of the impact of
lower commodities prices (Nigeria, Angola), political
tensions (Kenya, Democratic Republic of Congo), or
lower economic activity more generally (especially in
Western Africa)—decreased from USD 107 million in
2016 to 60 million (-44%) despite some of our funds
that were willing to invest more in the region.
A positive evolution, unexpected this early, came
from Eastern Europe, Central Asia and Mena, where
the crisis that hit the region in 2015 and 2016 came
to an end, resulting in strong funding demand and
origination climbing by 151%, from USD 71 million
in 2016 to USD 196 million in 2017. Although
origination did not grow in Latin America, the region
remained a core market, with USD 259 million in
loans disbursed. Note that South America proved
more difficult, mostly because of lower demand and
high domestic liquidities, whereas Central America
benefitted from the strong US economy, which
resulted in high demand for
debt funding.
Figure 4
Investment origination by region
Figure 5
Investment origination by tier
INVESTMENTS
USD million
20162017
Investment origination by region
0
50
100
150
200
250
300
Eastern Europe, Central Asia
& MENA
Latin America& the
Caribbean
South &East Asia
Sub-SaharanAfrica
USD million
Investment origination by tier
0
100
200
300
400
500
Tier 0
20162017
Tier 1 Tier 2 Tier 3
20
2017 A N N U A L R E PO RT

In terms of market segments, over half of total
origination was provided to tier 1 financial
institutions, USD 425 million in 2017 vs
USD 304 million in 2016; while the tier 0 (large
banks) segment did not grow as much, USD 127
million in 2017 vs USD 109 million in 2016.
Origination to tier 2 and tier 3 financial institutions
also improved, but only marginally.
The important geographical differences in terms of
origination, as well as the breakdown of the USD
420 million in loans that matured in 2017, caused
regional portfolio shifts, but without greatly
Figure 6
Portfolio outstanding by region, 2016 and 2017
impacting the diversification of our outstanding
portfolio. Overall, diversification remained stable in
2017, with the top 5 countries representing 35% in
2017 vs 37% in 2016; the top 5 investees remaining
stable at 10%; the average outstanding loans per
investee increasing slightly from USD 6 million
in 2016 to USD 6.9 million in 2017; and overall
outreach increasing thanks to the addition of 54
new investees and 6 new countries—Madagascar,
Pakistan, Timor-Leste, Myanmar, Cayman Islands and
Bangladesh. In total, 22 institutions dropped out
of the portfolio, mostly for risk considerations (for
instance, not performing well) or because we were
not able to match the institution’s funding request
(funding conditions not attractive to our investors).
Eastern Europe, Central Asia & MENA Latin America & the Caribbean South & East Asia Sub-Saharan Africa
December 2016
20% 16%
29% 36%
17%
35% 33%
15%
Eastern Europe, Central Asia & MENA Latin America & the Caribbean South & East Asia Sub-Saharan Africa
December 2017
21
A N N U A L R E PO RT 2017

INVESTMENT INSTRUMENTSAltogether, we disbursed 499 transactions to 152
financial institutions in 50 countries. We handled
413 of these transactions through direct promissory
notes or loan agreements between funds and
financial institutions (FIs) and 52 were secondary
trades (loans transferred from one fund to another).
We disbursed the remaining 34 transactions,
representing 43% of origination in terms of volume,
as impact bond issuances, syndicating discretionary
mandates, advisory mandates and external investors.
Bond issuances amounted to USD 340 million (vs
252 million in 2016) through 34 series, including 4
development finance institution participations for a
total of USD 24 million.
RISK AND RECOVERYAlthough the number of distressed FIs in our
portfolio remained stable at 24, we solved 8 cases
and started 8 new cases. Total risk exposure increased
from USD 75 million in 2016 to USD 90 million in
2017. However, taking overall portfolio growth into
account, risk exposure slightly decreased to 5.13% of
our portfolio. In total, we managed to recover USD
24 million in 2017. Several FIs in Central Asia and
the Caucasus started to wind down their operations
as they did not recover after the crisis that hit the
region in 2015. Overall, recovery rates in these cases
have been much higher than initially expected,
ranging from 60% to 85% of the amount due. At
the same time, no new cases started in this region.
Similarly, the risk volume in Latin America decreased
significantly after most institutions in Ecuador
recovered from the earthquake of early 2016. We
experienced our two first cases in India, where it was
necessary to workout debt repayment problems in the
aftermath of demonetization and the implementation
of a new goods and services tax. Both of these
moves by the government have been incredibly
disruptive and have negatively impacted the Indian
economy, particularly in the micro and SME segments.
Africa continued to witness problems linked to
the availability of dollars to pay back international
lenders, particularly in Nigeria, Angola and Zimbabwe.
The situation was getting back to normal for the
best institutions, whereas major cases of fraud were
uncovered in weaker institutions.
22
2017 A N N U A L R E PO RT

Sri Lanka, Colombo
Nillooka Jeeyanthi
Sewing business – stitching for schoolchildrens’ uniforms
23
A N N U A L R E PO RT 2017
Symbiotics manages and advises a number of funds
and tailor-made investment solutions for partners
and clients, including both third-party funds and
dedicated single investor mandates. At the end
of 2017, our advisory and management mandates
included:
› 4 global microfinance fixed-income funds
(hedged against the currency of the fund);
› 8 global microfinance fixed-income funds/
mandates (unhedged local currency);
› 1 African microfinance fixed-income fund;
› 2 global SME finance fixed-income funds;
› 1 global impact investing fixed-income fund.
During 2017, we launched two new unhedged
local currency fund mandates with SEB Wealth
Management. In July 2017, the Microfinance
Enhancement Facility S.A., SICAV-SIF (MEF) brought
Symbiotics onboard as an investment manager.
Launched in 2009, MEF is a global microfinance fund
with more than USD 650 million of assets promoted
by KfW (the German development bank) and the
International Finance Corporation. In parallel to the
launch of these 3 new mandates, and as a result of
decisions made in 2016, we liquidated 4 smaller
funds that were facing challenges in reaching
sufficient economies of scale and delivering on
investor expectations during 2017.
Investors returned to emerging markets in
2017 following the crisis that resulted from the
2014–2016 commodity price slump. This favorable
economic environment, coupled with rising US rates,
benefitted overall fund performance in USD and more
specifically the unhedged local currency strategies
that remain increasingly attractive to a number
of investors, particularly those with a longer term
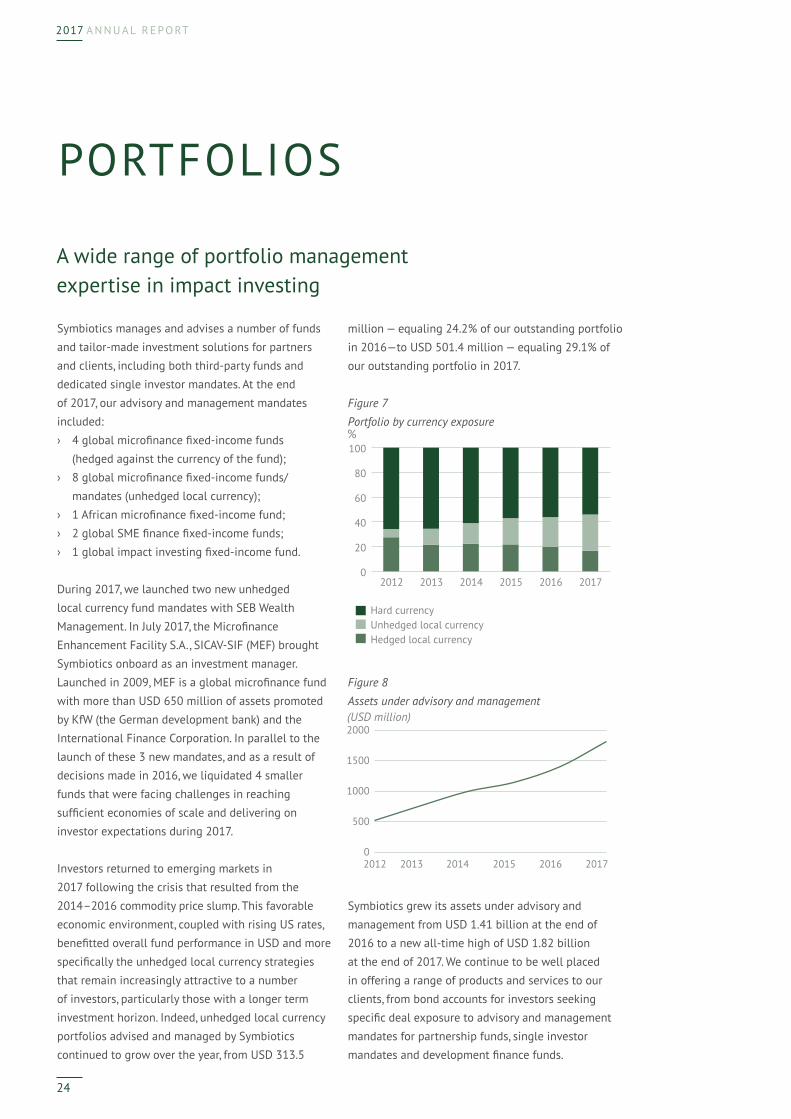
investment horizon. Indeed, unhedged local currency
portfolios advised and managed by Symbiotics
continued to grow over the year, from USD 313.5
million — equaling 24.2% of our outstanding portfolio
in 2016—to USD 501.4 million — equaling 29.1% of
our outstanding portfolio in 2017.
Figure 7
Portfolio by currency exposure
Figure 8
Assets under advisory and management
Symbiotics grew its assets under advisory and
management from USD 1.41 billion at the end of
2016 to a new all-time high of USD 1.82 billion
at the end of 2017. We continue to be well placed
in offering a range of products and services to our
clients, from bond accounts for investors seeking
specific deal exposure to advisory and management
mandates for partnership funds, single investor
mandates and development finance funds.
PORTFOLIOS
A wide range of portfolio management expertise in impact investing
%
Hard currencyUnhedged local currency Hedged local currency
Portfolio by Currency Exposure
0
20
40
60
80
100
2012 2013 2014 2015 2016 2017
(USD million)
Assets under Advisory and Management
0
500
1000
1500
2000
2012 2013 2014 2015 2016 2017
24
2017 A N N U A L R E PO RT

Since 2013 we also manage discretionary mandates
for large institutional clients, including banks,
pension funds and development finance institutions.
While the large majority of our clients is still based
in Europe, we have started to see growing interest in
our activities from investors in other regions of the
world, primarily Asia. Thus we expect our client base
to become more global over the coming years.
Symbiotics is the only leading asset manager in
the micro-, small and medium enterprise financing
space to offer unhedged local currency investment
solutions. We have been doing so in an advisory
format since 2011. The increasing geographical
diversification of our investment universe makes
possible the broad currency diversification that is
crucial for local currency investing. This together
with strong yield pickup makes local currency
investments an interesting option for an increasing
number of investors.
CLIENTS
Since its founding, Symbiotics has specialized in tailor-made mandates for institutional clients. We won our first advisory mandates in 2006 and have been an investment advisor for the majority of Europe’s leading microfinance investment vehicles and microfinance funds over the years.
25
A N N U A L R E PO RT 2017

SOCIAL PERFORMANCEWe released a white paper entitled Managing and
Measuring Social Performance in October 2017. It
contains the internal set of tools and methods
that we have built up over the years to measure,
manage and report on the social performance of our
investments. The paper puts our social performance
management (SPM) framework at the forefront. Our
SPM revolves around four distinct dimensions:
1. Storytelling on product beneficiaries (i.e. end-
clients) and our investees;
2. Understanding the social intentions of financial
intermediaries we target;
3. Measuring the level of social outreach of our
investments;
4. Measuring the level of social outcomes of our
investments on end-clients.
Applying this framework, we observe that at the
end of 2017, our portfolio financed 52% women
borrowers, more than 1.7 million end-clients, and 3.1
million jobs in emerging and frontier markets. While
these measures of social outreach have always been
common practice for Symbiotics, 2017 marked a new
beginning in terms of direct, on-field social outcome
measurement at the SME level.
IMPACT
As an investment company facilitating market access for impact investments, Symbiotics remains committed to reporting on the added social value of investments that target micro-, small and medium enterprises and low- and middle-income households.
52%WOMEN BORROWERS
43% RURAL
3.1mJOBS
1.7mEND CLIENTS
26
2017 A N N U A L R E PO RT

IMPACT MEASUREMENTIn 2017, Symbiotics expanded efforts to assess social
outcomes at the end of the investment value chain.
Focusing on the fourth component of our social
performance management framework for one of our
mandates, we launched a new initiative to measure
end-client outcomes specifically for SMEs. The aim of
this initiative is to evaluate the extent to which loans
to SMEs affect job creation and business growth,
and contribute to financial inclusion in emerging
and frontier markets. As such, we identified a rich
set of qualitative and quantitative indicators, and
we developed an internal methodology to measure
these indicators through face-to-face interviews with
entrepreneurs worldwide.
Among the main indicators we measure is
the number of employees hired by each SME,
disaggregated by gender, age, literacy and
employment type. We also track the businesses’
financial performance through their revenues,
expenditures and asset value, and access to
financial services.
Symbiotics is engaging with a wide range of
stakeholders in this initiative, including investors,
investees and end-clients, as well as local market
research agencies in the countries where the research
is being conducted. By the end of 2017, we had
successfully completed the first round of in-depth
interviews with more than 500 SMEs in 12 emerging
markets worldwide. We plan to continue this process
by re-interviewing the same SMEs on an annual basis
over the coming three years, with the objective of
observing the long-term outcomes they experience
after receiving loans.
Figure 9
Data collection methodology
Our research follows a diverse group of businesses,
each facing different external factors that may
influence their outcomes. Consequently, we are
aware that it is difficult to isolate our impact from
the effect of these factors, even when we gather data
from the end-clients directly. However, we are able
to gain significant insights into the performance,
practices and challenges that our end-clients face,
which we will use to guide our investment decisions
in the future.
CAPACITY BUILDINGImpact is also an important dimension of Symbiotics
technical assistance (TA), which goes hand-in-hand
with our investment activities and aims to maximize
their impact. In connection with our SPM framework,
we designed a TA program that supports financial
institutions in the integration of best practices in
SPM, client protection and ethical finance. So far, 14
Microfinance Institutions (MFIs) in 10 sub-Saharan
African countries have benefited from this program.
During 2017, we generated a total of 27 TA projects
with an aggregate volume of EUR 1.77 million,
covering 14 countries in frontier markets. Symbiotics’s
TA analyzes the diverse needs of MFIs and customizes
its TA interventions to ensure the highest possible
value. The projects include topics such as SME
lending, agricultural finance, rural lending, digital
financial services, savings mobilization and risk
management.
Design survey Sampleinvestees
Sample SMEs
Hire third-party consultants
Consultants conduct face-to-face interviews
Data validation and analysis
Share results with investees
27
A N N U A L R E PO RT 2017

CORPORATE SOCIAL RESPONSIBILITYAt our headquarters in Geneva, we offer employees
locally grown fruit and have installed fountains
connected to local water sources to reduce our
dependence on plastic bottles. Recycling bins
for paper, glass, aluminum, compost and PET are
available. Our premises are 100% powered by
hydraulic and solar energy, which is locally produced
in Geneva.
We also remain committed to efforts to reduce
our carbon footprint with the help of the Climate
Neutral Group and we continue to support the 1to4
foundation (www.1to4.ch) and the Paint a Smile
Foundation (www.paintasmile.org).
MARKET RESEARCHIn addition to publishing the 11th edition of our
Microfinance Investment Vehicles Survey, we launched
research publications showing microfinance from the
perspective of an investor, released a paper making
the case for unhedged investing, and presented
how we track and measure our social performance.
In 2017, we also started our collaboration with the
Global Impact Investing Network on a publication
entitled The Financial Performance of Impact Investing
through Private Debt.
28
2017 A N N U A L R E PO RT

India, Kerala
Sheena and Sheeba
Tailoring business – stitching dresses
29
A N N U A L R E PO RT 2017

CONTACTS
SWITZERLAND
Symbiotics SARue de la Synagogue 31
1204 Geneva
t +41 22 338 15 40
SWITZERLAND
Symbiotics SALimmatquai 86
8001 Zürich
t +41 43 499 87 89
MEXICO
Symbiotics Mexico S de RL de CVDiagonal Patriotismo 12 – 602
Colonia Hipódromo
06100 México D. F.
t +52 55 55 84 78 72
NETHERLANDS
Symbiotics NetherlandsMeester Treublaan 7
1097 DP Amsterdam
t +31 20 2409329
SINGAPORE
Symbiotics (Singapore) Pte. Ltd.134 Amoy Street #03–01
049963 Singapore
t +65 31 63 71 80
SOUTH AFRICA
Symbiotics I, C & S South Africa Ltd.4 Loop Street, Studio 502
8001 Cape Town
t +27 21 425 51 19
UNITED KINGDOM
Symbiotics UK Ltd6 Bevis Marks
London EC3A 7BA
t +44 203 786 1186
30
2017 A N N U A L R E PO RT


symbioticsgroup.com 2
0
1
7