microfinance funds 10 years of research &...
TRANSCRIPT

WHITE PAPERDECEMBER 2016
A review and analysis of CGAP & Symbiotics’Microfinance Investment Vehicles Surveys
MICROFINANCE FUNDS 10 YEARS OF RESEARCH & PRACTICE

This paper was co-written by CGAP and Symbiotics. Authors include Barbara Scola and Matthew Soursourian from CGAP, and Roland Dominicé, Marina Parashkevova and Ramkumar Narayanan from Symbiotics. The report was proofread by Christoffer Dahlberg, David Grimaud, Yannis Berthouzoz and Vincent Dufresne. Gilles Bayon provided technical support for facilitating the data aggregation and analysis process. Further data crunching support was provided by Yoann Rennard. Sivapriya Prem Kumar helped with data input. Edlira Dashi, MIX, helped analyse data from the CGAP Funder Survey. The project was supervised by John Staehli and the paper designed by James Atkins Design Ltd.
Legal Disclaimer This paper contains general information only. Symbiotics or CGAP is not by means of this paper rendering professional advice or services. The content of this paper is meant for research purposes, with an aim to broaden and deepen the understanding of Microfinance Investment Vehicles. On a few occasions, this paper refers to specific asset managers and collective investment schemes. Such references are made for research purposes only and are not intended as a solicitation or recommendation to buy or sell any specific investment product or services. Similarly, the information and opinions expressed in the text were obtained from self-reporting sources believed to be reliable and in good faith, reflecting the view of the authors on the state of the industry, but no representation or warranty, expressed or implied, is made as to its accuracy or completeness. Before making any decision or taking any action that may affect your finances or your business, you should consult a qualified professional adviser. Symbiotics or CGAP shall not be responsible for any loss whatsoever sustained by any person who relies on this paper. It is also meant for distribution only under such circumstances as may be permitted by applicable law.
01.1216

01 03 06
09 11 12 15 17
19 20 21 24 25 26 27 30
35 36 37
39 40 41 44
49 51 53
55
56 58 60 62
C O N T E N T S
Foreword Executive Summary Key Performance Indicators
1 BACKGROUND, METHODOLOGY & RATIONALE 1.1 History & Background 1.2 Definitions & Methodology 1.3 Investment Rationale 1.4 MIV Business Models 1.5 MIV Investment Universe
2 MICROFINANCE PORTFOLIOS 2.1 Market Size 2.2 Market Growth 2.3 Market Concentration by Size and Peer Group 2.4 Asset Composition 2.5 Microfinance Portfolio Instruments 2.6 Investment Terms 2.7 Regions 2.8 Portfolio Risk Management
3 INVESTOR MARKETS 3.1 Type of Investors 3.2 Fund Jurisdictions 3.3 MIV Manager Locations
4 COSTS, RETURNS & SOCIAL PERFORMANCE 4.1 Portfolio Yields 4.2 Costs 4.3 Net Return to the Investors 4.4 Social Performance
5 OUTLOOK: RISKS & OPPORTUNITIES 5.1 Investors 5.2 Institutions 5.3 Funds & Managers
6 ROADMAP TO 2025
APPENDICES I Key Metrics Definitions II Historical List of Microfinance Funds III Historical List of MIV Managers IV 10-year MIV Benchmarks Index of Figures 68

A C RO N Y M S
AUM Assets Under Management CAGR Compounded Annual Growth Rate CDO Collaterized Debt Obligation CEO Chief Executive Officer CGAP Consultative Group to Assist the PoorCPP Client Protection Principle DFI Development Finance Institution DMP Direct Microfinance Portfolio DDMP Direct Debt Microfinance Portfolio EAP East Asia & the Pacific EECA Eastern Europe & Central Asia ESG Environmental, Social & Corporate GovernanceEUR Euros FMO The Dutch Development Bank FX Foreign Exchange GIIN Global Impact Investing Network HFR Hedge Fund Research, Inc. HNW High Net Worth IRR Internal Rate of Return JPM J.P. Morgan KFW The German Development Bank LAC Latin America & the Caribbean LC Local Currency M-CRIL Micro-Credit Rating International Ltd.MENA Middle East & North Africa MFI Microfinance Institution MFP Microfinance Portfolio
MFX MFX Solutions MIIs Microfinance Investment IntermediariesMIX Microfinance Information Exchange MIV Microfinance Investment Vehicle MNO Mobile Network Operator MSCI Morgan Stanley Capital International NAV Net Asset Value NGO Non-Governmental Organization PPP Public-Private PartnershipPRI Principles for Responsible InvestmentSAS South AsiaSECO Swiss State Secretariat for Economic AffairsSDC Swiss Agency for Development
and CooperationSDG Sustainable Development GoalSME Small & Medium EnterpriseSMX Symbiotics Microfinance IndexSPTF Social Performance Task ForceSSA Sub-Saharan AfricaTA Total AssetsTCX The Currency Exchange FundTER Total Expense RatioUN United NationsUSAID United States Agency for
International DevelopmentUSD U.S. DollarsVC Venture Capital

F O R E W O R D
A major milestone in the global poverty development agenda was achieved in 2015 when the 184 member states of the United Nations (UN) agreed to the Sustainable Development Goals (SDGs), an ambitious agenda to fight inequality, injustice and climate change and to end poverty.
In the same year, the Addis Ababa summit on development finance sent a clear message that achieving the 17 SDGs is going to be expensive, and we cannot expect to get there relying on public funding alone. By now, nearly everyone involved in development is familiar with the USD 2.5 trillion annual gap between current investment levels in the developing world and what will be required to reach the SDGs by 2030. Governments cannot make up for that shortfall on their own. The private sector needs to step up its contributions, but how? This question is garnering increased attention at the highest policy levels. In October this year, the UN announced a new initiative dedicated to scaling up innovative finance solutions: The Financial Innovation Platform.
Microfinance, one of the most advanced sectors within the impact investing sphere, could help inform and ground current debates over the role of private finance in development. Microfinance Investment Vehicles (MIVs) offer a remarkable example of how public funding can crowd in private capital, thereby providing a link between the microfinance sector and capital markets. Development finance institutions (DFIs) provide the initial financing for the vehicle, which then attracts private investors.
The Consultative Group to Assist the Poor (CGAP), housed at the World Bank and dedicated to advancing financial solutions to improve the lives of the poor, was particularly interested in MIVs because they offer a means for microfinance institutions (MFIs) to expand their reach beyond what was possible with donor funding. In CGAP’s role as an incubator, we initiated the first MIV Benchmarking Report in 2007. CGAP believes deeply in the power of data – both as a tool to support evidence-based decision making and as a mechanism to make markets work better. The MIV survey has served both purposes, validating the potential of a new financing vehicle while standardizing and improving information flows to boost investor confidence. The CGAP–Symbiotics partnership is another success story, with CGAP supporting the initial development and rollout of the survey, and then stepping back once it became clear that a market actor could continue providing the service sustainably on its own.
As the development world sharpens its focus on leveraging private capital, it will be important to reflect on past experiences and build off of what’s already working. This report, looking back on 10 years of MIV data, is an excellent place to start.
Greta BullCEO, CGAPWashington, DC , November 2016
11

2

E X E C U T I V E S U M M A RY
This 10-year review of the landscape of microfinance offshore investments is based on data collected through annual CGAP/Symbiotics surveys of MIVs conducted between 2007 and 2016. The current paper largely focuses on MIVs, as defined in the disclosure guidelines – namely independent investment vehicles with more than 50% of non-cash assets invested in microfinance and open to multiple investors. However, and to a lesser extent, this paper also compiles data on some microfinance investment intermediaries (MIIs), such as funds open to single investors1.
High-level findings from this study are enumerated below:
SIZE & GROWTH: DOUBLE-DIGIT EXPANSION, MOVING UPMARKETSince December 2006, assets under management (AUM) of MIVs have grown more than five-fold, rising from USD 2 billion to USD 11 billion2 by the end of 2015 – an increase which represents a compounded annual growth rate (CAGR) of 20%. The assets remain highly concentrated among the largest MIVs, i.e. those with assets of more than USD 250 million, which have led growth in terms of size (29% CAGR). These large vehicles have also increased in number (from 2 in 2006 to 12 in 2015) and account for the largest market share at the end of 2015 (62%). MIVs’ microfinance portfolio has followed a similar high growth pattern, at a CAGR of 24% per annum. The microfinance portfolio has represented approximately three-fourths of an MIV’s balance sheet with little variance over the last decade. However, a shift in investee-type is taking place within the microfinance portfolio of MIVs, especially the larger ones, which have gradually evolved from financing institutions that offer traditional microcredit products to partnering with much larger, tier 1 institutions that form part of a broader financial inclusion landscape.
GEOGRAPHICAL ALLOCATION: ASIA GRADUALLY PICKING-UP In absolute terms, the regions of Eastern Europe & Central Asia (EECA) as well as Latin America & the Caribbean (LAC), remained the primary MIV markets in 2015 (USD 2.8 billion and USD 2.7 billion respectively). They have nonetheless declined in importance over the past 10 years with regard to MIV portfolio share (41% to 30% and 39% to 30% from 2006 to 2015 respectively). Overall, South Asia (SAS) was the fastest growing region during the past 10 years, recording a CAGR of 47%, and, as a whole, South and East Asia have grown to nearly 30% of DMP. Africa & the Middle East have accounted for around a tenth of MIV portfolio since 2006.
1 MIIs are investment entities that have microfinance as one of their core investment objectives and mandates. They include a broad spectrum of players: MIVs (both public and private), holding companies, and nonspecialized microfinance investment funds.
2 If a constant exchange rate is applied, the market size increases six-fold.
3

RISK MANAGEMENT: BETTER PORTFOLIO DIVERSIFICATIONConcentration indicators have been decreasing slightly for all funds, with the rate of exposure to the largest region decreasing by only 10 percentage points since 2006 (from 60% to 50%). Also, the top–5 investee exposure for Fixed-Income Funds decreased from 40% to 20% over the past 10 years. In terms of currency risk management, the share of unhedged local currency (LC) investments among Fixed-Income Funds almost tripled in percentage point terms, reaching 45% of their direct debt microfinance portfolio (DDMP) in LC at the end of 2015, which is equivalent to 15% when calculated on their entire DDMP (hard and LC investments combined).
INVESTORS: GROWTH IS LED BY INSTITUTIONAL MONEYBy the end of 2015, institutional investors were worth a total of USD 5 billion, 47% of total funding, compared to USD 500 million back in 2006 – an increase which represents a CAGR of 27% (vs. 22% for public funders and 17% for retail and high net worth individuals). With regard to public funding, the highest growth was registered by funds that blend capital from public and institutional investors in public-private partnerships (36% CAGR vs. 21% for exclusively public financed funds).
MIV JURISDICTION: GROWTH IS LED BY EUROPEAN FUNDSToday, more than two-thirds of vehicles are domiciled in Western Europe (mainly Luxembourg and the Netherlands), which currently accounts for nearly 90% of the MIV universe in terms of total assets (TA). North America, mainly represented by the United States, is the second largest MIV registration region, accounting for more than one-fifth of MIVs (in terms of number) as of 2015 and 8% in terms of market volume, down from 13% in 2006.
MIV MANAGER LOCATION: SWITZERLAND AND THE NETHERLANDSSwitzerland and the Netherlands remain the primary locations for MIV managers, while Germany and the United States have switched places, with the latter moving up to third place. Belgium, Austria, Sweden, Mauritius and Luxembourg complement the top 10 country location of MIV managers.
4

ASSET CLASS: FIXED-INCOME STRATEGIES MOSTLYThe majority of microfinance funds3 were launched during the 2005–2010 period. As of 2015, Fixed-Income Funds, which manage 78% of market universe investments, remained the dominant strategy/instrument, while Equity Funds tripled both in terms of number and size, reaching 9% of investment volume and thus recording the highest CAGR (37%).
PORTFOLIO YIELDS: SLIGHTLY DECLINING INTEREST RATESYields in USD on MIVs’ direct microfinance portfolios declined slightly, before stabilizing at around 7% from 2011 onwards on a weighted average basis.
COSTS: STABLE AVERAGEThe cost structure of MIVs has been relatively stable since 2007, the overall trend being led by the cost levels of Fixed-Income Funds, which account for a large share of total market size. Overall, management fees have accounted for around 1.6% of assets since 2009 on a weighted average basis while the total expense ratio (TER) has moved around a band of 2.2%–2.4%.
RETURNS: DIFFERENCES AMONG PEER GROUPSReturn spreads above Libor three-month USD and EUR have averaged 2% over the past 10 years. Fixed-Income Funds registered an asset weighted net return of 3.3% for USD and EUR share classes while Mixed/Hybrid Funds recorded a net return of 5.8% in EUR terms4. As for Equity Funds, the available internal rate of returns (IRR) recorded 14.8% on a TA weighted basis.
SOCIAL PERFORMANCE INDICATORS: STABLE TO IMPROVINGThe total number of active borrowers financed by MIVs through their portfolio investees has gradually increased, from 520,000 in 2006 to nearly 24 million at the end of 2015. MFIs’ average loan sizes to their clients amount to USD 1,575 at the end of 2015. This figure increased during the first four years of reporting, then peaked in 2012 and started to decline thereafter, representing portfolio movements in regions and in market segments. Among active borrowers, trends were relatively stable, with 65% of clients being women and 53% located in less developed rural areas. Finally, the number of voluntary savers first decreased after 2008, before stabilizing at around 60%, while the number of MIVs endorsing client protection principles (CPPs) increased dramatically, rising from 60% in 2008 to 98% at the end of 2015.
3 For simplicity reasons, Microfinance funds and Microfinance Investment Vehicles are used interchangeably in this paper.
4 No data available for USD currency.
5

K E Y P E R F O R M A N C E I N D I CATO R S
Size and Growth Unit Dec 2006 Dec 2015 CAGRTotal Assets USD 2.1bn 11.0bn 20%
Microfinance Portfolio USD 1.3bn 8.6bn 24%
Geographical Allocation Unit Dec 2006 Dec 2015 CAGREastern Europe & Central Asia USD 476m 2.9bn 22%
Latin America & the Caribbean USD 497m 2.7bn 21%
South Asia USD 41m 1.3bn 47%
East Asia & the Pacific USD 91m 1.1bn 32%
Sub-Saharan Africa USD 94m 889m 28%
Middle East & North Africa USD 3m 220m 64%
Risk Management Unit Dec 2006 Dec 2015 Top 1 Region % DMP 63% 51%
Top 5 Countries % DMP 64% 55%
Top 5 Investees % DMP 43% 28%
Investment in LC 32% 29% (hedged & unhedged) % DDMP (Dec 08)
Investor-type Unit Dec 2006 Dec 2015 CAGRInstitutional Investors USD 571m 5.1bn 27%
Retail & High-Net Worth (HNW) individuals USD 742m 3.0bn 17%
Public Investors USD 443m 2.7bn 22%
Yields & Cost-structure Unit Dec 2009 Dec 2015 Portfolio Yield % DDMP 8.4% 7.2%
Management Fees % TA 1.9% 1.6%
TER % TA 2.4% 2.4%
Provisions % MFP 1.6% 1.7%
6

Net Returns Unit Dec 2006 Dec 2015 2006–15 AverageUSD % NAV 2.5% 2.7% 3.3%
EUR % NAV 2.3% 2.3% 3.3%
Equity Funds – USD IRR 15%5
ESG Reporting Unit Dec 2008 Dec 2015 Active borrowers Financed – total # 0.5m 24m
% Women clients % of total active borrowers 64% 68%
Endorsement of CPPs % MIVs 60% 98%
5 Data availability for Equity Funds’ IRR is scarce. The figure of 15% reported on the table is the weighted average across the period 2006–2015 for a small sample of Equity Funds.
7

8
1BACKGROUND, METHODOLOGY & RATIONALE
1.1 H I S TO RY & B A C KG RO U N D
International funding for the microfinance sector originated primarily from donor organizations, including public development agencies and private foundations. However, as the sector commercialized, it became clear that to reach scale and professionalize MFIs would benefit from access to capital markets. As a result, private investors and donors came together in what became known as MIVs: independent investment entities that specialize in microfinance and are open to multiple investors. In general, MIVs originate with seed capital from a donor or institutional investor, with subsequent calls for investment capitalizing funds over time and MFIs being able to access these funds through debt and equity. Since their creation, MIVs have emerged as the main channel for foreign investors to invest in emerging microfinance markets.
CGAP began focusing on the segment in 2003, aiming to bring greater transparency and standardization to microfinance6. The sector also experienced an unprecedented investment boom around the United Nations 2005 International Year of Microcredit. Indeed, between 2004 and 2006, foreign capital investment in microfinance, including both equity and debt, more than tripled to a total of USD 4 billion, approximately half of which was channeled through MIVs7. Furthermore, the number of MIVs doubled from 40 to 80 between 2004 and 2007.
In 2007, CGAP and Symbiotics published the inaugural MIV Benchmarking Report based on a survey of 40 participants that together covered 87% of the total estimated AUM. The survey classified data according to CGAP’s MIV Disclosure Guidelines, which were produced to address the lack of common definitions, terminology, and performance standards. After several years of conducting the survey and extensive consultations with microfinance industry and capital market experts and stakeholders, CGAP revised its MIV Disclosure Guidelines in 2010 with the aim of strengthening “disclosure
6 https://www.devex.com/funding/tenders/25855/258557 MIV Benchmarking Report 2007
9

and standardization of MIV performance data, [so as to] provide investors with a greater level of confidence in the integrity, comparability, and comprehensiveness of MIV reporting”.8
Reflecting the sector’s progress toward realizing these objectives, the first report published by the Global Impact Investing Network (GIIN), in 2010, identified microfinance as “one of the most developed of the impact investment sectors” and further stated that it has “benefitted from the development of infrastructure and data histories that have yet to be as well established in many other impact investment sectors”9. In this sense, MIVs were at the vanguard of the broader impact investment sector.
After four years of executing the MIV Survey together, in 2010 CGAP transferred management of the survey to Symbiotics, which has continued to provide the microfinance investment community with critical market intelligence. In parallel, CGAP has carried out a larger annual survey on international funders of microfinance and financial inclusion (referred to in this paper as the CGAP Funder Survey). The survey captures annual data from a set of about 20 funders and biannual data from an additional 30+ funders. The panel primarily comprises public funders, including bilateral, multilateral and development finance institutions, but it also includes private foundations. The survey tracks several of the indicators included in the MIV survey, such as geography and instruments, but also captures additional information, including funding purpose. The survey originally used a narrow definition of traditional microfinance, but has since expanded to capture a range of activities that support financial inclusion. It should be noted that the CGAP survey does not include MIVs in its participants, instead uses Symbiotics data to complement its own data on primary funders.
8 MIV Disclosure Guidelines, 2010. P. 19 https://thegiin.org/assets/documents/Impact%20Investments%20an%20
Emerging%20Asset%20Class2.pdf
10

1.2. D E F I N I T I O N S & M E T H O D O LO G Y
This 10-year review of the microfinance offshore investment landscape is based on data collected through annual CGAP/Symbiotics MIV Surveys conducted between 2007 and 2016. The current paper largely focuses on MIVs, as defined in the disclosure guidelines – namely independent investment vehicles with more than 50% of non-cash assets invested in microfinance and open to multiple investors. However, and to a lesser extent, this paper also compiles data on some MIIs, such as funds open to single investors for instance. Funds of funds, which are also a type of MII, were only considered in the market universe estimates and not in total volumes in order to avoid double-accounting10.
Based on MIVs’ financial instruments, the funds are classified in three different peer groups: › Fixed-Income Funds: Vehicles investing more than 85 percent of their total
noncash assets in debt instruments› Equity Funds: Vehicles investing more than 65% of non-cash assets in
equity instruments › Mixed/Hybrid Funds: Vehicles investing in both debt and equity, with
greater than 15 percent and less than 65 percent of their total noncash assets invested in equity instruments.
For comparison purposes, for MIVs that adhere to an investment strategy revised annually with regard to financial instruments (debt, guarantee or equity), the average portions of debt and equity investments over the years were calculated for each of such fund in order to classify them in their relative peer groups (irrespective of their missions).
Most metrics, including growth calculations, were determined using a constant USD exchange rate as of December 2006. However, for certain sections, end-of-year exchange rates were used in order to be consistent with results presented in the annual MIV surveys. In such cases, the use of the spot rate is clearly emphasized.
As the number of reporting MIVs has varied each year (from 30+ to 90+), a constant sample of 14 historical funds, representative of the industry was used to measure key metrics in order to generate an accurate picture of industry trends over the years (fig.1). On certain occasions, a parallel comparison was made with the 10 largest MIVs of the above-mentioned constant sample. Data reflecting global estimates of public and private funding is based on CGAP’s Funder Survey.
10 Procredit Holding, investment entities not specialized in microfinance but with a significant microfinance investment portfolio and peer-to-peer micro lenders are not included in the universe.
Figure 1 Number of Participating MIVs
Year Number Constant Sample 2006 39 14
2007 61 14
2008 76 14
2009 82 14
2010 71 14
2011 70 14
2012 84 14
2013 80 14
2014 84 14
2015 93 14
11

1.3. I N V E S T M E N T R AT I O N A L E
Today, 767 million people, or 10.7% of the world population live in extreme poverty (fig.2),11 compared to nearly 2 billion people in the early 1980s. While enormous progress has been made in poverty reduction globally, regional disparities exist and absolute numbers still indicate high levels of precariousness, especially given how vulnerable one can be in living with less than USD 1.9 a day. Sub-Saharan Africa is home to half of the extreme poor while poverty levels in Asia have declined significantly, mainly driven by China, Indonesia and India.12 A recent study on the characteristics of the poor reveals that “80 percent live in rural areas; 64% work in agriculture; 44% are young (14 years old or younger); and 39% have no formal education at all”.13 These figures indicate the grand scale of challenges remaining to eradicate poverty by 2030.
Furthermore, two billion people in the world lack access to formal financial services (fig.3).14 While progress has been measured in this segment as well, with the percentage of adults with an account at a financial institution growing from 50% in 2011 to 61% in 2014, low financial inclusion represents a major impediment in the struggle to enable people to escape poverty, as recent empirical evidence suggests that access to basic financial services is positively correlated with growth and employment.15
Figure 3 Account Penetration around the World
11 The World Bank defines extreme poverty as living with less than USD 1.90 a day.
12 World Bank, Poverty and Shared Prosperity 2016: Taking on Inequality, 2016.13 Castañeda et al, Who Are the Poor in the Developing World?, 2016.14 Global Financial Inclusion (Global Findex) Database, World Bank Group, 2015.15 CGAP, Financial Inclusion and Development: Recent Impact Evidence, 2014.
0-1920-3940-6465-8990-100No data available
0
10
20
30
40
50
60
70
80
90 % of population
1981
19
84
1987
19
90
1993
19
96
1999
20
02
2005
20
08
2010
20
11
2012
20
13
Sub-Saharan Africa World
Middle East & North AfricaLatin America & Caribbean East Asia & Pacific Europe & Central Asia
Figure 2Poverty Headcount Ratio at $1.90 a Day (2011 PPP)
12

Accordingly, financial sector reforms that promote financial inclusion are increasingly part of policymakers’ agendas worldwide, and are seen as an integral part of the UN SDGs (fig.4).16 Ending extreme poverty (SDG 1) explicitly mentions the importance of access to financial services and there is increasing evidence that financial inclusion helps create the conditions that ultimately bring many of the SDGs within reach. A recent CGAP publication synthesized existing evidence on the link between financial inclusion and the first five SDGs.17
A growing portion of investors are also becoming conscious of their investment portfolios as not only a source of financial revenue but also a way of generating positive impact, and they have begun to understand the power and responsibility that they have with regard to the way they allocate their capital. More and more institutional and private investors are therefore signing up to sustainable finance initiatives, both international and local, sometimes via association memberships and sometimes via agreements involving binding principles, reporting guidelines, and compensation mechanisms. Still in its nascent phase, it is fair to say that demand for these investment solutions far exceeds supply today (fig.5).
16 Preceded by the sustainable development agenda of 1992 (the “Agenda 21”) and the Millennium Development Goals of 2015 (in 2000).
17 CGAP, Achieving the Sustainable Development Goals, 2016.
Figure 4Sustainable Development Goals
13

Styletile
$76 trillion
$59 trillion
$22 trillion$4 trillion
$4 trillion
$0.3 trillion
Global AuMPRI signatories AuMSustainable Investment AuM Private equity and VCHedge FundsUnlisted Infrastructure
Figure 5 Sustainable Investments18
Microfinance funds specialize in providing such investments. They offer investment opportunities with stable returns and low volatility19 in regions and countries where the population will grow the most in the future, thus anticipating future development challenges as they target the base of pyramid populations, micro, small and medium enterprises and low and middle income households.20 Furthermore, these investments contribute to a greater degree of financial inclusion, thereby directly enabling the first eight 2030 SDGs by providing base of pyramid financing products for agricultural activities, education and health services, solar energy and other clean-tech solutions as well as employment promotion and growth opportunities. In addition, many microfinance programs also target female clientele and seek to empower women.
18 Sources: IMF Financial Stability Report, April 2015; GSIA, 2014 Global Sustainable Investment Review; Preqin 2014 Global Report; www.unpri.org.
19 For more information on MIV returns, please see section 4.3.20 The United Nations: “World Population Prospects, the 2015 Revision”
14

1.4 M I V B U S I N E S S M O D E L S
MIVs are the main channel for foreign private investors, as well as DFIs, looking to invest in the microfinance sector in emerging and frontier markets. Only a few specialized actors invest directly in MFIs today, as the investment value chain and infrastructure within the microfinance sector are not as developed as within traditional investment markets despite the fact that the industry witnessed the development of online information platforms like the Microfinance Information Exchange (MIX) or rating agencies, such as Micro Credit Rating International Ltd. (M-CRIL), Microfinanza Rating, MicroRate and Planet Rating. However, due to their subsidized business models, those research boutiques have not yet managed to scale up their operations and render MIVs’ investment processes efficient enough through outsourcing and scale. The size of the market may arguably not have been large enough in number of MIVs and MIV managers. As a result, historical MIV managers have built-in the entire investment value chain within their firms, with relatively labor intensive structures compared to traditional fund managers.
The three main investment value chain functions which they have internalized for lack of outsourcing options to stand-alone businesses can be summarized as information, credit risk and pipeline management functions (fig.6) These represent the ‘Bloomberg’, the ‘Standard & Poor’s’ and local broker/dealer platforms that traditional fund managers use to make their investments.
Thanks to the development and offering of such expertise, the international investment community is today able to access the microfinance sector in emerging and frontier markets. There are currently around a dozen specialized MIV managers worldwide that have invested in developing the necessary resources to offer a traditional fund manager or investor comprehensive coverage of global microfinance markets and an appropriately diversified and managed portfolio of MFI investments. These MIV managers typically cover 50 or more emerging and frontier markets, and well over 300 MFIs. Such players have expanded rapidly over the past decade in response to market growth and in order to ensure investors the best possible service. These historical MIV managers typically have large teams of analysts spread around the globe, collecting and analyzing data, visiting MFIs, evaluating risks and negotiating funding needs directly. Given their important headcount and capital investment, they represent in themselves an important barrier to entry for newcomers.
15

Although all specialized MIV managers integrate the following three functions, there are significant differences with regard to product setup and distribution channels:› Fund Promoter: Some MIV managers have built their own distribution
channels, integrating the whole value chain. They promote their funds toretail or institutional investors and fully manage them from a regulatoryand operational perspective.
› Portfolio Manager: In other instances, MIV managers have been hired bya traditional fund promoter or investor to take responsibility for portfoliomanagement operations.
› Investment Advisor: Traditional fund managers will manage MIV portfoliosthemselves, but outsource the three market access functions to theirspecialized MIV managers, partnering with them on an exclusive basis, or insome cases with several at the same time.
End clients(micro-, small & mediumenterprises & low and middle income households)
MicrofinanceInstitutions(MFIs)
Market access functions:information, credit risk, pipeline management
Investment Advisory
Portfolio ManagementFund PromotionMicrofinance
Investment VehiclesMIVs
Investors Figure 6 Specialized MIV Business Model
16

11 15 15 12 15 9 9 6 8 5
-3 -5 -8 -2 -5 -9 -3
-10
-5
0
5
10
15
20
2006
Newly Opened Funds
Number of Funds
Closed Funds
2007 2008 2009 2010 2011 2012 2013 2014 2015
1.5 M I V I N V E S T M E N T U N I V E R S E
While a number of microfinance funds were launched in the late 1990s and early 2000s, fund setup activity peaked in 2005–2010 (fig.7). This was mainly due to the declaration of 2005 as “The International Year of Microcredit” by the UN and the awarding of the Nobel Prize to Mohamed Yunus and Grameen Bank in Bangladesh in 2006 – a development that put the global spotlight on the sector and attracted growing attention from private and institutional investors. MIVs have also provided over the years a robust risk-return profile to more traditional portfolios, particularly in light of the volatility in markets between the late 1990s and today.
Figure 7 MIV Inception and Targeted Closing Dates
17

The vast majority of MIVs are Fixed-Income Funds (24 out of 39 in 2006 and 54 out of 93 in 2015), although the total asset share of such players has declined slightly (from 82% in 2006 to 78% in 2015). The number for Mixed/Hybrid Funds, on the other hand, has remained relatively stable, with the 17 players active in this area as of the end of 2015 (vs. 10 in 2006) accounting for 13% of total assets (vs. 15% in 2006). On the other hand, Equity Funds recorded triple digit growth in terms of both overall numbers (5 in 2006 to 17 in 2015) and total asset share (3% in 2006 to almost 10% in 2015).
Based on the respective jurisdictions of different funds, MIVs can be classified as private placement funds, public placement funds, cooperative companies/non-governmental organizations (NGOs) or collateralized debt obligations (CDOs).21 The latter of these MIV structures was increasingly used in the mid-2000s. While these vehicles offered many advantages to investors, including lower fees and different types of risk in order to cater to a range of risk appetites, they were not renewed post the 2007–2008 financial crisis due to poor CDO reputation in mainstream markets.
Prior to 2006, nearly 50 MIVs had been created, mostly setup as open-ended structures although the share of closed-ended funds had gradually picked-up, in particular with the growth of institutional investor appetite. The funds that were closed starting in 2009 represent this closed ended fund growth which is planned to continue in the coming years.
21 Public Placement Funds: Vehicles which are supervised by local financial authorities and allow retail investors to invest amounts below USD 25,000. Public Placement Funds: Vehicles which are supervised by local financial authorities and allow retail investors to invest amounts below USD 25,000. Private Placement Funds: Vehicles that raise money from qualified investors via private placements and may or may not be supervised by their local financial authority. Cooperative Companies/Non-governmental Organizations (NGOs): Private organizations which are exempt from regulation by local financial authorities, reinvest most or all returns, and are often owned by their members (individuals and/or institutions). Collateralized Debt Obligations (CDOs): Offer a range of asset-backed securities with different risk and return profiles to investors.
18

0
2
4
6
8
10
12
Total Assets USD billion
Full Sample (40 to 93 MIVs)CAGR: 20%
2006
2007
2008
2009
2010
2011
2012
2013
2014
2015
Constant Sample (14 MIVs)CAGR: 16%
2MICROFINANCE PORTFOLIOS
2.1. M A R K E T S I Z E
When the initial MIV data collection was conducted 10 years ago, the combined assets under management of MIVs was calculated to be USD 2.1 billion. Comparatively, commitments in microfinance investments from non-MIV sources amounted to USD 13 billion at the same period according to CGAP’s first cross-border Funder Survey. Thus, the total size of private and public investments in microfinance was USD 15.1 billion.
In the initial MIV Survey, slightly less than 40 MIVs out of 74 identified vehicles participated (participation rate of 54%), compared to the record number of 93 MIVs in the 2016 edition out of 113 identified MIVs (82% participation rate). Since then, the market has more than doubled in terms of number of funds and quintupled in size to reach USD 11 billion (as of December 2015), an increase which is equivalent to a healthy 20% growth rate on a compound annual basis (fig. 8)22. If combined with the total public funding commitments in microfinance and financial inclusion, measured in CGAP’s Funder Survey at the end of 2015, the total market size doubled, representing USD 34.6 billion.23
The observed decline in market size in 2010 might not be directly attributable to adverse market conditions, although the global financial crisis did slow down MIV fundraising and financing operations that year. Instead, the decrease in total assets in 2010 was a direct consequence of a change in methodology (collecting data only from MIVs rather than MIIs as in previous years) and lower participation rate among MIVs in the 2011 survey.24 Overall, when analyzing the constant sample of 14 MIVs, growth was positive every single year throughout the 10-year period, although somewhat low during the 2010–2012 period.
22 The total market size was calculated using end-of-year exchange rate.23 Investments from private foundations were not taken into account.24 71 participants, out of 102 invited MIVs.
Figure 8 Historical Market Size
19

2.2. M A R K E T G RO W T H
In the past 10 years, MIV total assets and microfinance portfolio grew at respective CAGR of 20% and 24% – a performance which correlates with the constant sample of 14 MIVs, which have participated in each of the last 10 editions of the survey and recorded a CAGR of 16% in total asset terms and 21% in microfinance portfolio terms (fig. 9). If excluding the first two years of the survey, when funds grew very rapidly, the average rate of growth for the sample has typically remained between 12% and 15% (fig. 10). Among peer groups, the Equity Funds registered the highest CAGR (37%),25 followed by Fixed-Income Funds (20%) and Mixed/Hybrid Funds (18%).
In USD terms, this absolute growth rate implies an average annual industry capital inflow of USD 1.12 billion, with relatively low variance and stable volumes being recorded over the years. The strongest absolute growth was recorded in 2007 (USD 1.8 billion) while the lowest absolute increases was recorded in 2010 (USD 1 billion).26 This period of lower growth was largely due to the aftermath of the global financial crisis and the consequent liquidity crunch and economic slowdown in emerging markets (in some cases, this triggered repayment difficulties, including higher default rates).
The impact was for instance particularly severe in India and Nicaragua, with many debt MIVs booking provisions for portfolio losses and consequently negatively impacting or halting fund raising efforts. A more granular analysis of MIVs during this period shows that the new capital inflows which remained similar to those seen in previous years were off-set by outflows from several open-ended debt funds or non-renewal of very large closed-ended structures.
25 Starting from a low basis in 2006.26 Total Asset Growth calculated via following methodology: 1. Use of constant
exchange rate as of 2006 2. Exclusion of holding groups and funds of funds 3. Manual readjustment of data from two outliers during 2012–2015.
20%
16%
21%
24%
21%
0
4
8
13
17
21
25 %
AllParticipants
ConstantSample
Total AssetsMicrofinance Portfolio
Figure 9 Compounded Annual Growth Rate 2006–2015 (USD Spot)
39.6
%
32.1
%
17.5
%
10.3
%
12.0
%
16.4
%
14.0
%
12.0
%
12.3
%
0
15
30
45 %
2007
2008
2009
2010
2011
2012
2013
2014
2015
Figure 10 Historical Total Assets Growth
20

2.3. M A R K E T C O N C E N T R AT I O N B Y S I Z E A N D P E E R G RO U P
Despite being more segmented today compared to 10 years ago, the MIV market is still highly concentrated, with about 50% of MIVs accounting for more than 90% of the market in 2015 (fig.11), measured in total assets terms (out of 113 identified funds).27 The situation is similar for the constant sample of 14 funds that have reported data each year since 2006. While these historical MIVs accounted for close to 60% of investment volume in 2006 (i.e. microfinance portfolio), over the past 10 years their market share has fallen by only 11 percentage points, despite overall MIV industry volume growth of 5.2x and headcount growth of 2.9x.
As for investment strategies, the majority of the MIV market is still dominated by Fixed-Income MIVs, while the share of Equity MIVs, despite an increase in assets, remains low at 9% (vs. 3% in 2006, fig.12). On the other hand, the market share of MIVs with a hybrid strategy has remained relatively constant in terms of microfinance portfolio, currently standing at 13%.
Figure 11 MIV Universe
2006 Total Assets (USDm) %
2015 Total Assets (USDm) %
2006 MFP (USDm) %
2015 MFP (USDm) %
All participating MIVs 2,078 100% 10,995 100% 1,280 100% 8,554 100%
Top 5 1,135 55% 4,624 42% 669 52% 3,524 41%
Top 10 1,543 74% 6,113 56% 951 74% 4,767 56%
Top 20 1,896 91% 8,000 73% 1,204 94% 6,323 74%
Top 50 2,078 100% 10,285 94% 1,280 100% 8,024 94%
Figure 12Peer Groups
2006 Total Assets (USDm) %
2015 Total Assets (USDm) %
2006 MFP (USDm) %
2015 MFP (USDm) %
All participating MIVs 2,078 100% 10,995 100% 1,280 100% 8,554 100%
Equity 55 3% 951 9% 52 4% 824 10%
Fixed 1,705 82% 8,624 78% 1,068 83% 6,660 78%
Mixed 318 15% 1,420 13% 161 13% 1,071 13%
27 End-of-year exchange rate (i.e. spot rate).
21

In terms of asset size, MIVs can be split into different tiers by size: large MIVs with more than USD 250 million in AUM, mid-size MIVs (USD 50–250 million), and small MIVs (less than USD 50 million). When analyzing the data set with these three tiers in mind, it is apparent that the industry is highly concentrated, with large funds accounting for just 5% of MIVs but 38% of volume in 2006. These figures increased respectively to 13% and 62% by 2015 (fig.13 & 14). On the other hand, while the industry headcount share of small MIVs only fell from 69% to 54% (in absolute numbers, they increased from 20 to 57 funds) over the past 10 years, the volume share of such players more than halved, falling from 20% to 9% implying that small funds are witnessing a clear declining trend.
26%
2006
2010
2015
Large MIVsMedium MIVsSmall MIVs
62%
29%
9%
47%
34%
19%
38%
42%
20%
Figure 13 Breakdown by Volume
5%
26%
69%
2006
6%
24%
70%
2010
13%
33% 54%
2015
Large MIVsMedium MIVsSmall MIVs
Figure 14 Breakdown by Number
22

It should be noted that a couple of funds have now passed the USD 500 million–1 billion portfolio threshold, while three have portfolios in excess of USD 1 billion. However, these very large funds do not share the same growth models in terms of investor base, with some focusing on development banks, some on non-profit and/or retail clients, and others on institutional private clients. All three are Fixed-Income Funds but they do use equity instruments as well, some more than others. They also differ in terms of markets and target investees. One is a regional fund channeling capital to large SME banks while another focuses on smaller, tier 3 institutions and has a broader outreach in terms of number of countries. Nevertheless, there is a very strong correlation between the size of open-ended funds and the number of years they have been operating.
The difference in size between the largest fund and smallest fund has kept increasing over the years, as depicted in fig.15. More generally, the exponential growth of a few large MIVs over the last decade is pulling-up average values in terms of size. The average microfinance portfolio more than doubled since 2006, from USD 38m to USD 101m, while the median also increased but to a much lesser extent. Since 2010, it increased from a level of USD 19m to USD 32m five years later.
USDm
0
200
400
600
800
1,000
1,200
2006 2010 2015
MaxAverageMinMedian
Figure 15 Microfinance PortfolioDistribution
23

Cash
%
Other Portfolio & Other Assets
Microfinance Portfolio
62% 70% 73% 71% 73% 75% 75% 76% 79% 78%
12%
13% 10% 17% 13% 13% 13% 13% 12% 13%
26% 17% 17% 12% 14% 12% 12% 11% 9% 10%
0
17
33
50
67
83
100
2006 2007 2008 2009 2010 2011 2012 2013 2014 2015
Figure 16 Asset Composition
2.4. A S S E T C O M P O S I T I O N
MIVs have remained very stable in terms of asset composition, with around three-quarters of total assets being invested in the microfinance sector. There has been little variance over the past decade, although some years saw larger cash build-ups than others (fig.16). While some MIVs have integrated non-microfinance strategies, such as fair trade, the largest shift in MIV portfolio trends is related to microfinance assets, with the focus of the market evolving over the past decade from microcredit more towards financial inclusion. Indeed, as MIVs have grown and seen their investment markets evolve, they have gradually embraced a much more diverse range of financial institutions. A similar evolution took place among public funders, reflected in the updated methodology of the CGAP Funder Survey in 2012 that expanded the scope from traditional microfinance to broader financial inclusion. More recently in 2016, the CGAP Funder Survey added new recipient categories, including mobile network operator (MNO) and mobile money manager, to better reflect the changing sector.
While most small and mid-sized MIVs continue to focus on their historical core market (mostly second tier MFIs or non-bank regulated financial intermediaries focusing primarily on microcredit), today the largest MIVs have diversified their target investees and finance much larger clients such as first tier financial institutions or specialized and downscaling commercial banks with wider portfolios comprising SME, housing and household consumption loans.
A detailed analysis of microfinance portfolio instruments and investment terms in the next section helps to highlight some of these industry trends and changes.
24

2.5. M I C RO F I N A N C E P O RTO F L I O I N S T R U M E N T S
The vast majority of microfinance investment portfolios is composed of direct debt instruments (loans, notes, bonds, deposits, etc.). However, private equity investments have become more common over the past decade as a result of the creation of new specialized vehicles. Direct equity microfinance portfolio share has thus grown, rising from 9% in 2006 to 15% at the end of 2015 (fig.17). On the other hand, guarantee structures, as well as fund of funds strategies (indirect investments), remain scarce, accounting for just 3% of microfinance portfolios in 2015 – down from an already low 4% in 2006.
Figure 18 Trends in Commitments
by InstrumentCGAP Funder Survey
The CGAP Funder Survey evidences the same conclusion, showing that debt investments similarly dominate other instruments, although bilateral devel-opment agencies and foundations also utilize a significant amount of grant funding as well. Equity, the third instrument in terms of volume, typically originates from DFIs. Structured finance, which had declined in the years following the financial crisis, appears to be on the rise, particularly among DFIs.
Commitments in USD billionDebt Grant Equity
Guarantee Structured Finance Other Instrument
10.0
11.213.5 12.9
0
2
5
7
9
12
14
0
2
5
7
9
12
14
2009 2011 2013 2015
2.4 3.1
4.4 4.5
2009 2011 2013 2015
2.0 2.7
3.3 3.1
2009 2011 2013 2015
0.9 1.6 1.4 1.5
2009 2011 2013 2015
0.9 0.6 0.5 1.2
2009 2011 2013 2015
0.6 0.61 0.7 1.6
2009 2011 2013 2015
15%
83%
1%
1%
1%
9%
87%
2% 2%
26%
2006
2015
Direct Equity Direct Debt Direct Guarantee Indirect Debt Indirect Equity
Figure 17 Financial Instruments
25

2.6. I N V E S T M E N T T E R M S
The average number of investees financed per MIV has increased since 2007, stabilizing at 40 since 2013. With funds growing faster in volume compared to number of portfolio investees, the average outstanding portfolio per investee has naturally increased over the last decade – a development which in itself doesn’t necessarily imply more portfolio concentration risk. Rather, the observed increase in the average outstanding portfolio per investee shows a move towards the financing of institutions of considerable size, mostly tier 1, especially for the largest MIVs of the sector that are pulling upwards these average values. Indeed, an average exposure of over USD 2 million as observed today would not be justified in small, tier 3 institutions that have less than USD 10 million in total assets for MIVs in terms of sound risk management.28
This is further illustrated by the trend observed for the 10 largest MIVs (fig.19), with exposure levels currently higher than the overall industry average. This gap has been particularly noticeable since 2011, from which time these large vehicles have recorded tremendous growth in volume, and comparatively more so than an increase in their number of investees.
As for the overall market, at the end of 2015, outstanding direct investment portfolio per investee amounted to USD 2.5 million, up from USD 1.1 million in 2006. Such an increase was recorded by both debt and equity portfolios, although the latter saw a more notable spike, especially after 2011 (fig.20).
Figure 20 Direct Outstanding Portfolio per Investee
2006 2007 2008 2009 2010 2011 2012 2013 2014 2015
Debt Investees 1.2 1.7 1.7 1.5 1.7 1.8 1.8 1.8 2.1 2.2
Equity Investees 1.2 1.7 2.1 2.8 2.7 2.0 3.1 3.5 4.0 4.3
Debt tenor also provides a case for the mentioned ‘upmarket’ move of large MIVs. While remaining debt investment maturity has declined since 2006, the fact that it has been relatively stable at under two years since 2009 indicates the existence of a specific investee ‘type’ for the overall industry, with MIVs usually looking to provide debt financing to tier 2 institutions for a period of approximately two years. In contrast, remaining debt portfolio maturity for the 10 largest MIVs is longer than the market average, standing at nearly 30 months as of 2015 (fig.21). Their larger size inclines them to finance larger MFIs which expect longer maturities. These institutions are, for the most part categorized in the financial inclusion spectrum, shifting away from their original core microcredit mission towards providing a wider product offering to end clients – a trend which is in line with observations regarding the level of outstanding portfolio per investee.
28 For more information on MFIs’ tier definitions, please see Appendix I.
months
48.
5
35.
5
32.
3
31.
3
23.
8
23.
8
20.
9
22.
1
22.
5
22.
0
40.
0 3
3.4
35.
7
31.
9
31.
0
25.
5
25.
9
28.
6
28.
1
29.
6
0
8.3
16.7
25.0
33.3
41.7
50.0
2006
2007
2008
2009
2010
2011
2012
2013
2014
2015
10 Largest MIVsAll MIVs
Figure 21 Remaining Maturity of Debt Investments
Average no. Portfolio
USD m
0
1
2
2
3
4
5
0
8
17
25
33
42
50
2006
2007
2008
2009
2010
2011
2012
2013
2014
2015
Average no. of Investees
Direct Outstanding Portfolio per Investee
Direct Outstanding Portfolio per Investee – 10 Largest MIVs as of 2015
Figure 19 Number of Investees per MIV and Direct Outstanding Portfolio
26

% of DMP
Latin America & Caribbean East Asia & Pacific
Eastern Europe & Central Asia
Middle East & North Africa Sub-Saharan Africa
South Asia
39% 44% 44% 40% 40% 41% 40% 41% 39% 31%
41% 36% 34% 39% 35% 33% 31% 30% 30% 30%
8% 7% 8% 8% 9% 9% 11% 11% 11%
12%
3% 5% 7% 7% 8% 8% 8% 8% 9%
15%
0% 0% 1% 2% 2% 2% 1% 1% 2% 2%
8% 7% 5% 5% 5% 7% 7% 8% 9% 10%
0
17
33
50
67
83
100
2006 2007 2008 2009 2010 2011 2012 2013 2014 2015
2.7. R E G I O N S
Probably the biggest change in MIV asset structure over the past decade has been in terms of geographical distribution. While MIVs were highly concentrated in EECA and LAC in 2006, the market shares of these two regions have since shrunk, falling from 39% to 31% and 41% to 30% respectively of DMP. Nevertheless, in absolute and relative terms, those two regions continue to receive the largest share of investments (fig.22). The EECA region that had been hit hard by the global financial crisis, is currently facing political instability linked to the neighboring Russia situation and shock in foreign exchange (FX) rates and commodity prices, particularly the decline in oil prices. These elements had a negative impact on the financial strength of investees and prevented MIVs from increasing, or even maintaining their investments in the region. The LAC region (particularly Brazil but also other commodity exporting economies) has also experienced an economic slowdown, at the same time there has been an increase in the level of integration of inclusive finance in mainstream capital markets, with this trend being driven by larger savings and lower local funding costs.
The SAS and East Asia & Pacific (EAP) regions accounted for most new institutions and market expansion over the past decade, with their MIV investment market shares growing from 3% to 15% and 8% to 12% respectively. The strong growth of the sector in Cambodia and India, coupled
Figure 22Regional Allocation
27

with more favorable environment for foreign investments, has largely contributed to this general regional trend, which was particularly visible in 2015. In parallel, the market shares of the Middle East & North Africa (MENA) and Sub-Saharan Africa (SSA) regions both increased by two percentage points over the past 10 years, rising from 0% to 2% and from 8% to 10% respectively. While foreign investment in the former region continues to be limited by political instability, including civil war and conflict, the latter has gained in importance among Fixed-Income MIVs thanks to new FX risk hedging solutions.
Looking back at 10-year trends (fig.23), SAS has witnessed the most impressive growth (from a significant initial volume), with the region growing at a CAGR of 47%. While all three MIV types have varying levels of engagement in the region, growth has been driven by Fixed-Income Funds, which are capitalizing on an improved regulatory framework across the region. This has been especially true since 2012 in India, which accounts for the majority of investments in SAS.
Figure 23 Historical Regional Volumes
0
700
1,400
2,100
2,800
3,500
0
700
1,400
2,100
2,800
3,500
2006
20
07
2008
20
09
2010
20
11
2012
20
13
2014
20
15
Eastern Europe & Central Asia
47% 64% 28%
32%21%22%
Direct Microfinance Portfolio USD m
Direct Microfinance Portfolio USD m
2006
20
07
2008
20
09
2010
20
11
2012
20
13
2014
20
15
Latin America & the Caribbean
2006
20
07
2008
20
09
2010
20
11
2012
20
13
2014
20
15
East Asia & Pacific
2006
20
07
2008
20
09
2010
20
11
2012
20
13
2014
20
15
South Asia
2006
20
07
2008
20
09
2010
20
11
2012
20
13
2014
20
15
Middle East & North Africa
2006
20
07
2008
20
09
2010
20
11
2012
20
13
2014
20
15
Sub-Saharan Africa
All MIVsFixed-Income FundsMixed FundsEquity Funds
CAGR
28

Trends among the CGAP Funder Survey sample tell a similar story of geographic reallocation in recent years, with the heavy emphasis on EECA and SAS slowly giving way to SSA and EAP. The region with the largest number of projects is SSA, by a significant margin. Funding volumes to this region are also growing substantially, and surpassed SAS in 2015 for the first time in the history of the survey. In LAC and EAP, funders are increasing commitments and decreasing the number of projects.
29

% of DMP
2006
2015
2012
2009
2006
2015
2012
2009
2006
2015
2012
2009
2006
2015
2012
2009
0
17
33
50
67
83
100
All MIVs Fixed-Income Funds
Mixed Funds Equity Funds
2.8. P O RT F O L I O R I S K M A N A G E M E N T
MIV portfolio risk management relies essentially on investment diversification due to the illiquid nature of their investments, whether debt or equity. Diversification solutions are related to: regional diversification, country diversification, institutional diversification and currency diversification. Trends in this area have been relatively stable over the past decade, with concentration ratios decreasing but remaining relatively high.29 Portfolios at risk have remained low on average at 2% but have peaked post financial crisis and have increased also in 2015 due to market downturns.
REGIONAL DIVERSIFICATIONThe top 1 regional exposure has fluctuated around 60% until the global financial crisis, before gradually declining towards 50%. Mixed/Hybrid Funds have historically been more diversified in terms of region, whereas Equity Funds have logically been the least diversified due to the different nature of their risk return profile (fig.24).
Figure 24 Top 1 Regional Exposure
COUNTRY DIVERSIFICATIONThe top 5 country exposure ratio has also been relatively high, reaching 50% for Fixed-Income MIVs, 60% for Mixed/Hybrid MIVs and 90% for Equity MIVs, with little likelihood of decline in the foreseeable future (fig.25). However, outreach in terms of number of markets has increased strongly, with some MIVs claiming to have exposure in over 100 countries.
29 All concentration indicators of this section are calculated as a percentage of MIVs’ DMP.
30

% of DMP
2006
2015
2012
2009
2006
2015
2012
2009
2006
2015
2012
2009
2006
2015
2012
2009
0
17
33
50
67
83
100
All MIVs Fixed-Income Funds
Mixed Funds Equity Funds
Figure 25 Top 5 Country Exposure
INSTITUTIONAL DIVERSIFICATIONThis trend is reflected by a much wider outreach in terms of number of investees financed, with most Fixed-Income MIVs maintaining top 5 investee exposure at around 20%, down from over 40% in 2006 (fig.26). Overall, one can notice an improvement in the level of diversity and portfolio risk management for the industry as a whole. However, this indicator remains very different for equity investments due to the nature of the value creation proposal they offer investors.
Figure 26 Top 5 Investment Exposure
% of DMP
2006
2015
2012
2009
2006
2015
2012
2009
2006
2015
2012
2009
2006
2015
2012
2009
0
17
33
50
67
83
100
All MIVs Fixed-Income Funds
Mixed Funds Equity Funds
31

UnhedgedHedged
0
17
33
50
67
83
2008
2009
2010
2011
2012
2013
2014
2015
16%
15%
7%
14%
33%
41%
38%
45%
84%
85%
93%
86%
67%
59%
62%
55%
Figure28 Direct Debt LC Portfolio: Hedged and Unhedged Portions% of DDMP in LC100
CURRENCY DIVERSIFICATIONThere have been some changes with regard to MIV portfolio currency risk management in the past decade. While 100% of debt investments were made in hard currencies in 2006, thanks to the creation of specialized and affordable hedging facilities such as the Currency Exchange Fund (TCX) in 2007 and MFX Solutions (MFX) in 2009, MIV managers were offered solutions to mitigate FX risks and improve their outreach to new countries previously not available. Although debt investment in hard currencies remains the preferred practice today in the MIV industry, the average share of LC debt investments has stabilized at around one-third of DDMP since 2008 (fig.27).30
However, within those MIVs that do provide LC debt investments, an innovative shift is currently taking place, particularly for Fixed-Income Funds, with the share of unhedged LC portfolio gradually growing from 16% in 2006 to 45% in 2015 and the remainder being hedged back to the relative hard currency of the fund accounting currency (fig.28).31 In addition, another new trend within the industry is highlighted by the fact that a couple of MIV managers now follow a fully unhedged strategy for their LC debt investments.
30 No data is available for the period 2006–2007.31 Today, this large unhedged portion is approximately equivalent to 15% when
calculated on the entire DDMP (hard and local currency investments combined).
Local CurrencyHard Currency
32%
31%
32%
28%
37%
31%
31%
29%
68%
69%
68%
72%
63%
69%
69%
71%
0
17
33
50
67
83
2008
2009
2010
2011
2012
2013
2014
2015
Figure27Direct Debt Portfolio in Local Currency% of DDMP in LC100
32

% of MFP
Write-offsProvisions
0
0.5
1
1.5
2
2.5
3
3.5
4
4.5
5
2009
2010
2011
2012
2013
2014
2015
Figure 29 Portfolio Quality
PORTFOLIO AT RISKMIVs have displayed high and stable portfolio quality in most years since 2009.32 Loan loss provisions have generally accounted for less than 2% of MIVs’ microfinance portfolio while loan write-offs have been under 1%. A peak for both indicators nonetheless occurred in 2010 (fig.29), a year during which MFIs were affected by economic downturns and sector crises, especially in Nicaragua and India which led to some institutions defaulting. MIVs in response provisioned larger amounts, with the survey recording loan loss provisions and write-offs of respectively 4.5% and 1.6% that year. Portfolio quality has deteriorated most recently, in 2015, due to the negative effects of the global conjuncture in particular for economies highly dependent on oil prices such as Azerbaijan.
32 Data was not collected prior to 2009.
33

34

3INVESTOR MARKETS
3.1. T Y P E O F I N V E S TO R S
In the early days of the MIV sector (before 2006), DFIs were major investors, often seed investors in some products. Retail investors and HNW individuals were the main target, depending on registration license for early MIV promoters. Thanks to double-bottom line returns, combined with low volatility and low correlation with mainstream markets, MIVs gradually started to attract institutional investors such as pension funds, insurance companies, banks and foundations. These ‘new’ investors eventually becoming the main providers of funding for MIVs, starting in 2009 (fig.30).
By the end of 2015, institutional investors accounted for funding worth a total of USD 5 billion, compared to USD 500 million back in 2006 – an increase which represents a CAGR of 27% (vs. 22% for public funders and 17% for retail and high net worth individuals). Growth trends across all investor types are relatively stable, albeit some observed volatility in certain years due to varying samples. It should also be noted that the drop in retail investors in 2012 was mainly due to structural changes in one of the reporting funds.33
DFI investments still remain a principal source of funding, not only for funds relying exclusively on public funding, but also for those blending capital from public and institutional investors in public-private partnerships (PPP).34 Interestingly, with regard to public funding flows into MIVs, the highest growth was recorded by funds that blend public and private capital (36% CAGR vs. 21% CAGR for exclusively publicly financed funds). However, unsurprisingly, the bulk of public funding volume remains in MIVs that are financed by exclusively public investors only (fig.31). DFIs also continue to provide the vast majority of funding flows captured in the CGAP Funder Survey, consistently around 60% of total commitments. It seems, however, that DFIs may be shifting their investment strategy. Until 2011, DFIs’ direct and indirect investments were close to equal in the CGAP Funder Survey. Beginning in 2013, however, DFIs have increased their direct investment portfolio while maintaining levels of indirect financing through MIVs.
33 As a result of missing data from large MIVs with a retail license and to avoid potentially underestimating the contribution of retail investors, the Symbiotics team estimated the share of the former based on desk research and previous historical reports.
34 Publicly funded MIVs are defined as those with more than 70% of assets financed by public development agencies.MIVs with >70% Public Funding
MIVs with <70% Public Funding
USD m
500
0
1,000
1,500
2,000
2,500
2006
2007
2008
2009
2010
2011
2012
2013
2014
2015
Figure 31 Public Funding via MIVs
Public Sector Funders Retail & High-Net Worth Individuals
Institutional Investors
USD m
0
1,000
2,000
3,000
4,000
5,000
6,000
2006
2007
2008
2009
2010
2011
2012
2013
2014
2015
Figure 30 Funding Sources
35

3.2. F U N D J U R I S D I CT I O N S
Luxembourg and, to a lesser extent, the Netherlands have been the prime MIV jurisdictions over the past decade. Today, more than two-thirds of vehicles are domiciled in Western Europe, which currently accounts for nearly 90% of the MIV market size.
North America, mainly the United States, is the second largest MIV registration region, accounting for more than one-fifth of MIVs as of 2015 and 8% of the market size, down from 13% in 2006 (fig.32). These figures indicate that MIVs in North America are relatively small in size compared to those domiciled in Western Europe, mainly due to the fact that the former are typically Equity Funds and consequently closed-ended,35 therefore limiting to a certain extent the fund growth potential. Indeed, the small size of North American funds is further illustrated by considering the top-10 MIVs, which are all registered in Luxembourg or the Netherlands.
Figure 32 MIV Jurisdiction – % of Total Assets
Luxembourg is the leading investment fund center in Europe and second largest in the world behind the United States and has historically been the preferred country for MIV registration. The popularity of Luxembourg can be attributed to a number of different advantages, but primarily a flexible fund regulatory environment, with easy access to the rest of the European Union, and a political commitment to fast-tracking microfinance funds, thus creating a flourishing web of experience and expertise in this niche.
As of December 2015, Luxembourg funds accounted for some 61% of the MIV market size, up from 44% in 2006 (fig.33). In parallel, the number of Luxembourg funds accounted for in the MIV Survey has increased from 11 in 2006 to 39 today. However, it should be noted that, even if the majority of funds are registered in the above-mentioned countries, the actual location of investors and MIV managers is generally outside Luxembourg.
35 Closed-ended funds offer specific number of shares on a specified closing date that cannot be redeemed by the fund.
87%
8%
1% 3%
80%
13%
5%
1%
2006 2015Western Europe North America Latin America & the Caribbean Africa
Figure 33 Country of Incorporation – % of Total Assets
2006 2015Luxembourg 44% 61%
The Netherlands 32% 21%
Other Western Europe Countries 4% 6%
United States of America 13% 7%
Other North American Countries 0% 1%
Cayman Islands 5% 1%
Mauritius 1% 3%
36

3.3. M I V M A N A G E R LO CAT I O N S
Switzerland is the leading market for MIV manager location. Geneva, mainly due to the presence of the UN, spearheading the 2005 International Year of Microcredit, but also thanks to numerous private banks interested in the topic, as well as Zurich, where larger global banks and insurance groups quickly picked-up on the topic, have been the logical epicenter of the MIV management space. The private sector also found early support from national actors like the Swiss Agency for Development and Cooperation (SDC) or the Swiss State Secretariat for Economic Affairs (SECO), supporters of microfinance since the 1980s, carrying out financial sector development activities in emerging economies.
The Netherlands is also a leader in MIV management thanks to a historical close relationship between public and private actors active in the financial inclusion arena. In addition to favorable legislation, since 2003 the country has also been home to the NpM Platform for Inclusive Finance, which unites non-governmental organizations, the Dutch Ministry of Foreign Affairs and several social investors and commercial banks. Furthermore, the Dutch development bank , FMO, has also historically actively invested in emerging market private sector development. As a result, despite some national differences, Switzerland and the Netherlands remain leading centers for microfinance fund management (fig.34). The third leading country in terms of microfinance assets under management is Germany. One of the main factors for this positioning is the strong proactive role of KfW. The German development bank consistently ranks among the funders with the highest commitments to financial inclusion in the CGAP Funder Survey as well.
The United States, fourth on the list, is characterized by both a strong philanthropy and a strong venture capital (VC) culture, coupled with dedicated support from the United States Agency for International Development (USAID) to the topic. This explains the very long history of microfinance networks based in the United States and building the sector throughout developing countries. Many leading and reference MFIs were started by this confluence of efforts specific to the country. As a result, in the United States, the majority of microfinance Equity Funds are registered and run by American management companies (fig.35). Belgium, Austria, Sweden, Mauritius and Luxembourg complement the top 10 country location of MIV managers.36
36 Due to different methodological criteria, top 5 country in this study is different from the 2016 MIV Survey edition.
USD m
20062015
0
500
1,000
1,500
2,000
2,500
3,000
3,500
4,000
4,500
Switz
erla
nd
Net
herl
ands
Germ
any
USA
Belg
ium
Figure 34 Total Assets under Management per Country of MIV Managers
Figure 35 Number of Funds per MIV Manager Location 2006 2015USA 11 25
Switzerland 11 18
The Netherlands 5 13
Belgium - 7
Germany - 6
37

38

4COSTS, RETURNS & SOCIAL PERFORMANCE
4.1. P O RT F O L I O Y I E L D S
Portfolio yield figures are derived from the reported net total income37 from MIVs’ DDMP. These yields provide an indication of the level of returns generated by MIVs before incurring operational costs related to management and other operating fees. They represent a proxy for the interest rates charged by MIVs to their investees.
Portfolio yields have been relatively stable since 200838 although gradually declining from 9% to 7% on a weighted average basis (fig.36). This decrease can be explained both by declining money market rates and by lower credit premiums. The Libor USD 3 months fell from 5% to under 1% during the period. Also, as MIVs have moved upmarket in general, they have started lending to institutions with cheaper cost of funding or lower credit premiums. Today, loan pricing from MIVs has a Libor +5–6% lending profile, all other things being equal.
37 As per the MIV disclosure guidelines, the net total income refers to all interest and fees paid by MFIs to the MIV minus the hedging cost and the realized and unrealized foreign exchange gains/losses against the MIV’s accounting currency from the DDMP.
38 Portfolio yield data collected for the first time in 2008.
%
Simple Average Weighted Average
10.7
%
9.1%
8.6%
7.7%
8.0%
8.1%
8.2%
7.3%
9.4%
8.4%
8.2%
6.8%
7.7%
6.8%
7.1%
7.2%
0
3
6
9
12
2008
2009
2010
2011
2012
2013
2014
2015
Figure 36 Yield on Direct Debt Microfinance Portfolio
39

4.2. C O S T S
MIV operating expenses (OpExp) as a share of total assets, i.e. the TER as defined in the CGAP MIV disclosure guidelines, have been stable since 2007. OpExp include management fees, which account for the majority of MIV costs, and which, in turn, comprise all administration, investor relations and distribution costs.
The management fee ratio, on a weighted average basis, has stood at around 1.6% of assets since 200939 and is lower for Fixed-Income Funds, at approximately 1.3%, and higher for Equity Funds, at over 2.5%. Equity Funds have experienced more unstable fee ratios than other peer groups since 2009 as such structures usually incur fees based on the volume of committed capital from investors, rather than on outstanding volumes during their investment period.
Interestingly, other OpExp, which include accounting, audit, custodian, transfer agent and legal fees, as well as marketing and general administration costs, have been relatively volatile for the different peer groups, with the total assets share of such expenses standing at a high level of around 1% from 2010 to 2012. For Fixed-Income Funds, the other OpExp ratio has increased over the last couple of years, implying a faster rise in other OpExp than total assets. This trend is in line with the impact of the reinforcement of regulations and subsequent increase in regulatory and compliance costs in the European market on MIVs registered on the continent.
Overall, the cost structure of MIVs has remained relatively stable, largely due to the characteristics of Fixed-Income Funds (fig.37), which account for a large share of the market, with this trend being confirmed by analysis of a constant sample of nine MIVs (out of 14) that have reported management fees and total OpExp every year since 2009. The sample contains three Mixed/Hybrid Funds and six Fixed-Income Funds and reinforces how total costs have been steady across the market, fluctuating slightly between 2.0% and 2.5% of total assets since 2009 while other fees exhibit low levels between 0.1% and 0.2% since 2012 (fig.38). Arguably, these are average fee levels, and several funds have very different costs depending on whether share classes are sold to retail, to private or to institutional investors.40
39 Management fee data for the period 2006–2008 is not available.40 Cost structure data collected for first time in 2009 for the constant sample of 9
MIVs.
%
Fixed-Income Funds ALL MIVs
Equity Funds Mixed Funds
0
2
4
6
8
2007
2008
2009
2010
2011
2012
2013
2014
2015
Figure 37 Total Expense Ratio – Weighted Average
%
Management Fee Ratio Other Operating Expenses
0
0.4
0.9
1.3
1.7
2.1
2.6
3
2009
2010
2011
2012
2013
2014
2015
1.9%
1.8%
2.0%
1.9%
2.0%
1.9%
2.0%
0.4%
0.4%
0.6%
0.2%
0.2%
0.1%
0.1%
Figure 38 Total Expense Ratio – Weighted Average (Constant Sample)
40

4.3. N E T R E T U R N TO T H E I N V E S TO R S
Fixed-Income Funds recorded stable and positive net returns in both USD and EUR terms of 3.3% on a weighted average basis over the past 10 years. During the same period, Mixed/Hybrid Funds’ net returns amounted to 5.8% in EUR terms.41 As for Equity Funds, the only available data on internal rate of returns reported since 2007 has come from just 2–3 funds, which reported a net return of 15% on a TA weighted basis.42 Overall, it should be noted that the level of responses from survey participants about their net return figures has varied each year and across all peer groups.
A more detailed analysis of the NAV share price performance (fig.39) shows that after recording relatively low returns in 2006 (2.5% in USD and 1.9% in EUR), MIVs’ performance peaked the following year (6.5% in USD and 4.5% in EUR), before then declining following the financial crisis in 2007–2008. This can be attributed to the fact that the drop in money market rates during this period was reflected in demand among MFIs for lower funding rates, while increased liquidity levels locally created harsher competition, consequently putting pressure on credit premiums.43 However, returns picked up in 2011, before dropping again in 2013, when several emerging market currencies depreciated against the USD due to instability in the financial markets – a development which, in turn, affected the supply of LC funding, as hedging costs had increased substantially. By the end of 2015, net returns had more or less fallen back to their 2006 levels (2.7% in USD, 2.3% in EUR), following continued political and economic challenges in emerging markets in general, including in key microfinance markets.
When comparing spreads of MIVs above money markets across the past decade, a bandwidth of Libor +100 to +400 basis points net return has characterized the industry with an average at 1.8% in both USD and EUR (fig.40).
41 There are a limited number of observations for net returns in USD and CHF for Mixed/Hybrid Funds.
42 Due to the small sample, equity returns might not be representative for the Equity Funds peer group.
43 Symbiotics, Swiss Microfinance Investment Report, December 2011.
%
Libor USD 3 months NAV Share Price Return USD
Libor EUR 3 months NAV Share Price Return EUR
-2
0
2
4
6
8
10
2006
2007
2008
2009
2010
2011
2012
2013
2014
2015
Figure 39 NAV Share Price Performance vs. Libor 3 months
%
Spread EUR Spread USD
-3
-1.5
0
1.5
3
4.5
2006
2007
2008
2009
2010
2011
2012
2013
2014
2015
Figure 40 MIVs’ Net Returns Spread over Libor 3 Months
41

When viewed in parallel to
mainstream financial markets,
net returns of microfinance
investments have arguably
provided an attractive risk-
return profile for the investor.
This coupled with the social
development mission of MIVs is
the main explanatory factor for
the growth and success of the
industry.
Figure 41 depicts this well by
presenting the performance of
the SMX-MIV Debt USD index44
over the period 2004–2015
relative to mainstream market
indices like Libor 3 Months USD
(money markets), JPM Hedged
USD GBI Global (bonds), MSCI
World Index (stocks), HFRX
Global Hedge Fund Index
(hedge funds) and Bloomberg
Commodity Index (commodities).
The trend line for the SMX–MIV
Debt USD index shows steady
monthly returns that are subject
to low volatility, whereas other
indices exhibit more instability
of returns during the period.
44 The SMX–MIV Debt index is an equally-weighted index that has been developed by Symbiotics. It tracks on a monthly basis the net returns of a selected number of historical Fixed-Income MIVs. This index serves as a reference benchmark for microfinance debt investments within the industry and has been available on syminvest.com in USD, EUR and CHF since 2004.
Fixed-Income MIVs vs. Mainstream Indexes
Figure 41 Microfinance vs. Other Asset ClassesIndex Value
50.00
75.00
100.00
125.00
150.00
175.00
200.00
Dec
03
Jun
04
Dec
04
Jun
05D
ec 0
5
Jun
06D
ec 0
6
Jun
07D
ec 0
7
Jun
08D
ec 0
8
Jun
09D
ec 0
9
Jun
10D
ec 1
0
Jun
11D
ec 1
1
Jun
12D
ec 1
2
Jun
13D
ec 1
3
Jun
14
Dec
14
Jun
15D
ec 1
5
Libor 3 Months USD JPM Hedged USD GBI Global
HFRX Global Hedge Fund Index SMX-MIV Debt USD IndexBloomberg Commodity Index
MSCI World Index
42

Testimony of the appeal of
microfinance debt instruments
is also their low or negative
correlation of returns with more
traditional asset classes over
the past decade (fig.42). When
combining a basket of all these
indices, one can witness that a
gradual increase in the portion
of SMX–MIV Debt USD index
in the global portfolio results
in lower volatility risk and a
marginal increase in returns
(fig.43).
Figure 43 Risk-Return Profile of Microfinance Investments
1.20
1.29
1.37
1.46
1.54
1.63
1.71
1.80
Returns (%)
Risk (%)6.5 7.0 7.5 8.0 8.5 9.0
Portfolio 4 SMX = 17%
Portfolio 3 SMX = 10%
Portfolio 2 SMX = 5%
Portfolio 1 SMX = 0%
Figure 42 Correlation of Microfinance Returns (SMX–MIV Debt USD Index) with Mainstream Asset Classes (2003–2015)
Cash (Libor 3 Months USD) 0.56
Bonds (JPM Hedged USD GBI Global) 0.03
Stocks (MSCI World Index) -0.11
Hedge Funds (HFRX Global Hedge Fund Index) -0.14
Commodities (Bloomberg Commodity Index) 0.01
43

In 2006–2008, the microfinance industry had only just begun to develop ESG indicators, which were gradually integrated in MIV reports to investors. Initial assessments of MIV’s social performance in annual surveys started in 2008 for most of the following indicators.
OUTREACH/GENDER/LOCATION: Measurement of outreach to end clients is based on the number of active borrowers financed by an MIV’s DMP.45 Indeed, there was a gradual increase in number of active borrowers over the past 10 years (reaching 24 million by end of 2015). The only disruption to this trend came in 2010–2011, when MIVs reduced investment in India following the Andhra Pradesh microfinance crisis (fig.44).
The average end-client loan size is currently at USD 1,575. This figure increased during the first four years of reporting, before peaking in 2012, and then declining – a result partly explained by the fact that MIVs entered new markets and regions, such as SAS and SSA, where demand tends to be for smaller average loans (fig.45).
45 Active borrowers are individuals who currently have an outstanding loan balance with the MFI in which MIVs invest.
Million
0
5
10
15
20
25
30
2008
2009
2010
2011
2012
2013
2014
2015
Figure 44 Number of Active Borrowers Financed
% of Total Active Borrowers
0
15
30
45
60
75
90
2008
2009
2010
2011
2012
2013
2014
2015
Figure 46 Women Active Borrowers
4.4. S O C I A L P E R F O R M A N C E
Figure 45 Average Loan Size of MFIs to Active Borrowers (USD)
2008 1,492
2009 1,494
2010 1,631
2011 1,797
2012 2,069
2013 1,787
2014 1,622
2015 1,575
44

Among active borrowers, 65% are women (fig.46), the primary target of microfinance, with more than 52% generally located in less developed rural areas (fig.47).
CREDIT PRODUCTS46
While micro-enterprise loans remain the principal product offer of investees, they have been decreasing in importance since 2009, with their portfolio share falling from 72% to 63% at the end of 2015 (fig.48). MIVs are increasingly financing a broader range of investees, mostly larger companies that are moving upmarket out of the traditional microcredit spectrum, a trend confirmed by figure 49, which shows an increase in investee portfolio dedicated to finance household consumption.
46 In terms of loan offering, the data reported by MIVs is at MFI level, similar to the outreach indicators above.
% of Total Active Borrowers
0
10
20
60
40
50
60
2008
2009
2010
2011
2012
2013
2014
2015
Urban Clients Rural Clients
Figure 47 Rural and Urban Clients
% of MIV Investees' Portfolio
60
63
65
68
70
73
75
2009
2010
2011
2012
2013
2014
2015
Figure 48 Micro-enterprise Loans
% of MIV Investees' Portfolio
9
10
11
12
13
14
15
2009
2010
2011
2012
2013
2014
2015
Figure 49 Household Consumption
45

% of MFIs in the MIV Direct Portfolio
30
37
43
50
57
63
70
2009
2010
2011
2012
2013
2014
2015
Insurance Savings
Non-Financial Services Other Financial Services
% of Investees’ Active Borrowers
0
30
60
90
2009
2010
2011
2012
2013
2014
2015
NON-CREDIT PRODUCTS47
The fact that all indicators exhibit an upward trend, although with a varying level of volatility, indicates that, overall, loans partners are gradually diversifying their product offer to include savings, insurance, other financial services (debit/credit card, money transfers, payments by check, etc.), as well as non-financial services such as enterprise services, adult education, health services, agricultural extension and training, and women’s empowerment. At the end of 2015, more than half of MIV portfolio investees offered these types of services, whereas 10 years ago, this figure was around 40% (fig.50).
The number of voluntary savers started to decrease after 2008, before eventually stabilizing at around 60%. However, the upward trend witnessed in 2015 is expected to continue, with regulatory mechanisms helping traditional MFIs to obtain banking licenses in many economies (fig.51).
47 Regarding non-credit product range, indicators are calculated on a headcount basis, therefore highlighting the number of portfolio investees that provide a specific type of non-credit product.
Figure 50 Product Offering
Figure 51 Voluntary Savers
46

ESG NORMSIn terms of client protection, efforts have been led by third-party stakeholders such as the Smart Campaign to establish and promote responsible lending practices through a set a CPPs.48 Endorsement of these principles by MIVs has increased rapidly (fig.52), from 42 MIVs claiming endorsement (60%) in 2008 to 85 MIVs at the end of 2015 (98%).
With regard to environmental impact, more and more MIVs require MFIs to comply with an environmental exclusion list (27 MIVs in 2008 vs. 57 MIVs in 2015)49 and are establishing procedures for integrating environmental issues in their investment decisions (36 MIVs in 2008 vs. 66 MIVs) (fig.53).
The same trend can be observed with regard to governance. In 2008, 38 MIVs reported ESG information to investors while, in 2015, this number had increased to 69, with the number of MIVs requiring anti-corruption and/or internal whistleblowing policies increasing from 55 to 75 in 2015 (fig.54).
48 The Client Protection Principles refer to a microfinance industry-wide initiative that encourages investors to ensure that low-income clients are treated fairly and protected from harmful financial products. For more information, see www.smartcampaign.org.
49 An environmental exclusion list refers to a set of minimum environmental standards/practices and/or a list of activities that cannot be financed by the microfinance service provider because of environmental risks.
Number of MIVs
Environmental Issues Integrated in Investment Decision
Environmental Exclusion List
0
15
30
45
60
75
90
2008
2009
2010
2011
2012
2013
2014
2015
Reporting of ESG Information to Investors
Requirement of Anti-corruption and/or Internal Whistleblowing Policies
Number of MIVs
0
15
30
45
60
75
90
2008
2009
2010
2011
2012
2013
2014
2015
Number of MIVs
0
15
30
45
60
75
90
2008
2009
2010
2011
2012
2013
2014
2015
Figure 52 Endorsement of Client Projection Principles
Figure 53 Environment
Figure 54 Governance
47

48

5 OUTLOOK: RISKS & OPPORTUNITIES
5.1. I N V E S TO R S
Investor appetite for microfinance funds has continuously grown since the first commercial private MIVs were created in the late 1990s. Indeed, over the last decade, the size of such investment vehicles has multiplied over five-fold, growing from 2b$ to 11b$. In addition, these amounts do not represent the entire investor spectrum, as the direct investments of public funders, which are double this size, are also increasingly financing the microfinance sector directly. Beginning in 2013, direct financing surpassed indirect financing among all funder subtypes in the CGAP Funder Survey, which is broader than the MIV Surveys, also including direct investments from development banks and large private sector specialized foundations. They also do not account for the larger share of microfinance funding coming from local savings and deposits and increasingly from local capital markets.
All in all the opportunity for the investor market remains very large and vibrant. Over the years microfinance has moved from a niche investment topic limited to specialized investors (mostly DFIs and MIVs) towards a much more integrated opportunity into the mainstream financial markets. The contribution of specialized investors has also evolved, diversified and sophisticated itself, moving from short term senior US dollar lending, towards a much broader span including equity, subordinated debt, longer term financing, local currency lending, also including structured finance securitizations, tranched investments, syndications and guarantees. Increasingly, microfinance institutions have started issuing bonds, gradually offering a perspective of liquidity in microfinance investor markets.
Arguably, MIV growth rates have been declining, averaging 20% CAGR over the past decade, but moving from 25–30% in 2006 to 5–10% in recent years. And, when looking at Fixed-Income MIVs, their absolute net returns have declined from 6.0% in 2006 to 2.0% in 2015. Investors may see there a sign of decline, pointing to a has been investment theme. But by taking a closer look, one may notice that the annual growth volumes in absolute US dollar terms remain stable year after year, actually increasing. And the relative returns are also stable to slightly increasing within a bandwidth of Libor USD +1.5 to 3.0%. As a matter of fact the investor appetite continues to accelerate, in particular
49

as MIVs are increasingly granted mainstream mutual fund distribution licenses in certain jurisdictions, such as recently in Germany or historically in the Netherlands, and attract growing interest from large institutional investors, on both sides of the Atlantic; new MIVs are also popping up in Japan. The overarching investor paradigm remains very favorable to this low risk, low volatility, low correlation, positive social impact and sustainable development contributor investment narrative. 2015–2016 has certainly been one of the most difficult years for MIVs, in terms of portfolio at risk and provisioning rates, more so than in 2009–2010, due to the real slowdown in economic growth in some emerging markets following the drop in commodity prices. But the expectation is that with this period behind together with USD money markets and commodity prices gradually regaining color, microfinance investments should retain their historical track record and perspective, and consequent attractiveness to investors.
That being said, the conjunction of growing local capital market involvements, increasing direct investments from development banks, new retail distribution funds and large inflows from foreign institutional investors is very positive but also worrisome for some observers. In particular in a period of relative slowdown in emerging markets, a recurring question investors wonder about is whether there is too much capital supply in microfinance markets, and whether the market is wide and deep enough to absorb such inflows. This threat has to a certain extent been resolved by opening up target market definitions and subsequent investment strategies and guidelines. Investors are following the trend from micro-credit, to microfinance and now to financial inclusion. They include it in SME finance but also new business models such as leasing, factoring or securitizations. Some even push it to a much broader ‘access to finance at the base of the pyramid’ paradigm, including thematic segments in education, housing, energy, agriculture, etc. The debate, and risks, for investors is gradually shifting from the size of the niche to a much broader universe where the diversity and sophistication of business models, deals and instruments raises the complexity significantly. This is a good news in terms of choice for the investor, but also raises the bar in terms of transparency, comparability, pricing and risk. Microfinance investors will need norms defining the contours of their strategies, and within those strategies will probably need much more informed support to make the right decisions.
50

5.2. I N S T I T U T I O N S
The MIV surveys focus on the fund level information of the microfinance investment value chain, and less so on the actual profile of microfinance institutions in which they invest. Both Symbiotics, through its Syminvest.com platform, and CGAP, through its partnership with the MixMarket.org, offer significant research on the MFI level information. Data indeed continues to show growth rates of 20%+ CAGR at clients, portfolio or balance sheet levels. Most interestingly, MFI portfolios financed by MIVs have shifted significantly over the past decade, as they have grown and as the market has evolved. From second tier institutions with 80%+ microcredit, gradually shifting towards an average profile first tier institution with 50%+ microcredit and the rest evenly split between small enterprise lending and household lending (housing, education, consumption, et al.). The average institution has also evolved on the non-credit products, with increasingly more savings, payment, insurance, technology and advisory offerings. This is reflected in Figure 50 of this study. The MFI profile has also moved from a traditional non-bank financial institution specialized in microcredit, towards a broader span including cooperatives, downscaling specialized banks, but also increasingly a much wider range of commercial banks, investment companies and financing intermediaries. Microfinance institutions have grown to include companies providing not only microcredit, savings, insurance or payment services, but also leasing or factoring schemes, mobile technology, and more broadly partnerships with retailers.
Today several MIV managers claim coverage of over 50 countries and more than 300 MFI investees in their portfolios. As their investor base has continuously increased, MIV managers have broadened their outreach into new countries, new market segments and new business models, with this trend set to continue over the coming years. Increasingly MIVs are using financial institutions of all kinds and earmarking specific themes, whether agriculture, education, energy, housing, or more often simply employment and entrepreneurship in the missing middle – fitting within this broader financial inclusion realm. In that sense, in many cases, microfinance funds have grown to define their market as ‘access to finance at the base of the pyramid’, offering a much wider investment universe and opening up their absorption capacity to the large volumes flowing in.
51

Arguably, many MIV offering memorandums and fund prospectuses are seeing an evolution in the definition of their eligible target investee. This maintains and accelerates the investment opportunity for investors, also naturally adapting to market changes and realities, but it also raises the risk levels in the sense that MIV portfolios are composed of a much more diverse population of financial institutions, instruments and risk/return profiles. As a consequence, the role of MIV managers, their business model and differentiating factors, and their selection by investors, is increasing in importance – choice of funds matter. The dispersion and variance of track record is wider now than a decade ago, where most MIVs had very close profiles. And, also as a consequence, the role of market facilitators and policymakers remains very important, to set norms, definitions and standards, provide transparency and somehow regulate the market for investors.
52

5.3. F U N D S & M A N A G E R S
Over a hundred new MIVs have been created in the past decade, with an average of 13.6 new funds being opened per year in 2006–2010 and 7.6 per year in 2011–2015. Despite the fact that fewer funds have been created recently, the MIV market remains very atomized in relation to its size. That being said, as this study shows, it remains relatively concentrated when looking at it from an MIV perspective. The top 10 MIV management firm landscape hasn’t really changed over the past decade; all leading market facilitators were already present and established in 2005. No new market entry occurred. No consolidation has taken place either. And no fragmentation of the value chain happened either, as specialized research, rating, brokerage or structuring firms haven’t emerged in a commercially sustainable manner. This is neither a risk nor an opportunity but rather a sign that the industry is still in its nascent phase and historical MIV managers in their growth phase. None seem to have an incentive to merge, some already representing 10–20% of market share, rather they are all seeking ways to diversify beyond microfinance, into a wider impact investing universe. The expectation is that as they continue to grow, create new funds, offer their market access capabilities to a wider range of investment banks and large institutional investors, the MIV industry will reach a plateau in terms of cycle, a minimum size at which the market will be wide and deep enough to offer a fragmentation of the value chain, with more specialized firms along the value chain, whether dedicated to information and research, ratings and evaluations, structuring and brokerage of deals. The fact that an increasing number of fund promoters request to open up the target investment markets of their products beyond microfinance may provide some acceleration of this trend. Also increasingly, local intermediaries and advisors will probably become more important, providing needed domestic expertise in more complex impact market segments outside of the financial sector. The speed of these changes is slow, gradual but not linear. Looking at the variance between a picture of the industry in 2005, vs. a decade later, it is fair to say that the MIV intermediation space will significantly continue to grow, evolve and materially change by 2025.
53

54

6ROADMAP TO 2025
The MIV industry is growing both in size and in scope, towards a wider investment universe of access to finance at the base of the pyramid. MIV managers are increasingly facing a more diverse market in terms of instruments, investees and market segments. Also a much larger crowd of institutional investors, fund promoters and capital market players is able to approach financial inclusion from an investment perspective. But it’s fair to say that the market is still in a young age and will need further involvement and innovation from donors and policy makers, just as much as from MIV managers.
Key topics of development in the coming years will probably include:
› Specialized agencies federating market definitions, norms, guidelines andperspectives
› Specialized information, research and analysis firms, providing furthertransparency on the industry, on funds and on investees
› Specialized deal structurers, brokers and financial adviser working todevelop a wider pipeline of investment solutions
› A multiplicity of locally based advisors helping cross-border funders enterinto new market themes and segments
› A range of new investment solutions to better manage credit risk, currencyrisk and political risk
› The emergence of a secondary market, including liquidity managementfacilities and distressed debt facilities
› Additional capacity building and technical assistance support for targetinvestees to grow and diversify into new themes
› Further public sector involvement, as risk carriers, in creative public privatepartnerships, crowding in more risk averse investor volumes
› Online financial technology to ease the intermediation value chain.
The question of the equilibrium between supply and demand of capital sustaining the continuous growth of the sector will remain for investors, as well as the price equilibrium at which it should take place. But the microfinance investment space will continue to grow rapidly, pulled by population growth, economic development and the gap to bridge for both the unbanked and the missing middle. Key to steering this growth will be the capacity of MIVs to measure their microfinance's impact in terms of low-income households and small businesses gaining access to finance.
55

A P P E N D I C E S
I: KEY METRICS DEFINITIONS50
Code Indicator / Information Description/DefinitionType of Data
Data as percentage of
Asset Value2.1.1 Total assets All MIV assets including nonmicrofinance-related investments C TA
2.1.2 Microfinance Portfolio Total assets invested in microfinance C TA
2.1.2.1Microfinance Portfolio in Microfinance Investees with USD assets > 100M USD
% of MIV's Microfinance Portfolio which is channeled to microfinance investees with asset size of over USD 100 million.
% MP
2.1.2.2Microfinance Portfolio in Microfinance Investees with USD assets >10M USD and < 100M USD
% of MIV's Microfinance Portfolio which is channeled to microfinance investees with asset size between USD 10 million and USD 100 million.
% MP
2.1.2.3Microfinance Portfolio in Microfinance Investees with USD assets <10M USD
% of MIV's Microfinance Portfolio which is channeled to microfinance investees with asset size of less than USD 10 million.
% MP
2.1.3 Other PortfolioTotal financial assets invested in activities other than microfinance (SMEs, fair trade, investments in other market instruments)
C TA
2.1.4 Liquid/ Current AssetsThis includes current accounts, investment accounts, deposit accounts, clearing accounts, etc., with maturities less than one year.
C TA
2.1.5 Other AssetsThis includes equipment, real estate, currency forwardcontracts, receivables and deferred assets, accrued interests, etc.
C TA
Microfinance Portfolio2.2.1.1 Direct Microfinance Portfolio Sum of direct investments to microfinance service providers C MP
2.2.2.1Average Investment Size by Microfinance Service Provider
Direct microfinance portfolio divided by the number of microfinance service providers in direct microfinance portfolio
C
2.2.2.7Direct microfinance portfolio in debt invested in microfinance service provider's local currency
Direct microfinance portfolio in debt invested in microfinance service provider's local currency
C DMP
2.2.2.8Direct Unhedged Debt Microfinance Portfolio in Accounting Currency
Direct debt microfinance portfolio in local currency not hedged against currency fluctuations
C DMP
2.2.2.11Net Yield on Direct Debt Microfinance Portfolio
(Net total income from direct microfinance portfolio in debt n+1)/((Total direct MP in debt n + Total direct MP in debt n+1) / 2)) Refers to all interest and fees paid by microfinance service providers to the MIV minus the hedging cost and the realized and unrealized foreign exchange gains/ losses against the MIV’s accounting currency from the direct microfinance portfolio’s direct debt.
% DDMP
50 For more exhaustive definitions on all indicators included in the MIV Guidelines, please see ‘MIV Disclosure Guidelines 2010’, CGAP.
56

Code Indicator / Information Description/DefinitionType of Data
Data as percentage of
Liabilities and Equity
2.3.7Subscription of Retail Investors
Sum of all retail investor (individual investor) subscriptions %Total
investors
2.3.8 Subscription of High Net Worth Individuals
Sum of all subscriptions from persons with a high net worth (e.g., US$1 million).
%Total
investors
2.3.9Subscription of Private Institutional Investors
Sum of all Private Institutional Investors subscriptions (pension funds, MIVs, financial institutions such as insurance companies, banks, asset management companies, and treasury departments of companies, NGOs, and foundations).
%Total
investors
2.3.10 Subscription of Public InvestorsSum of all Public Investors subscriptions (i.e. development financial institutions and other public funders).
%Total
investors
Efficiency and Cost Structure
2.4.1 Management FeesThe charge paid to a fund’s managers for their services, including administration costs, investor relations, and distribution costs.
C TA
2.4.2 Operating Expenses
Includes management fees, accounting fees, custodian fees, legal fees, marketing and distribution costs, and general administration. It does not include dividends, capital items (i.e., unrealized losses on investments), brokerage fees, transaction costs, performance fees, bank and interest charges, currency profits/losses, and restructuring fees.
C TA
Environmental, Social and Governance Indicators
3.1.2Compliance of Microfinance Service Providers with an Environmental Exclusion List
An environmental exclusion list refers to a set ofminimum environmental standards/practices and/or a list of activities that cannot be financed bythe microfinance service provider because of riskson the environment.
Yes/No
3.2.2Number of Active borrowers Financed
Active borrowers refer to individuals who currently have an outstanding loan balance with the microfinance service provider or are primarily responsible for repaying any portion of the gross loan portfolio. Sum of borrowers financed through direct investments made in each microfinance service provider ‘n’ being part of the MIV direct portfolio divided by the average loan balance per borrower for microfinance service provider ‘n’.
N
3.2.4.1Rural Active Microfinance Clients as a Percentage of Total Active Clients
Sum of number of rural clients of each microfinance service provider in the MIV direct portfolio / Sum of number of active clients of each microfinance service provider in the MIV direct portfolio.
%MIV
Investees' Clients
3.2.6.1Percentage of Microfinance Service Providers’ Portfolio in Microenterprise Loans
Sum of microfinance service providers’ gross loan portfolio (in the MIV direct portfolio) dedicated to microenterprise loans / Sum of gross loan portfolio of each microfinance service provider in the MIV direct microfinance portfolio.
%
MIV Investees'
Loan Portfolio
3.2.7.1Percentage of Microfinance Service Providers in the MIV Direct Portfolio Offering Savings Products
Number of microfinance service providers in the MIV direct portfolio offering savings products / Total number of microfinance serviceproviders in the MIV direct portfolio.
%Number of MIVs'
Investees
3.2.10.1Endorsement of the Client Protection Principles
If an MIV has other policies or practices designed to protect clients and ensure their fair treatment, provide details here.
Yes/No
3.3.1 ESG Reporting to InvestorsDoes the MIV produce a special report on ESG,or does the MIV include ESG performance in itsannual report
Yes/No
57

II: HISTORICAL LIST OF MICROFINANCE FUNDS
PUBLIC PLACEMENT FUNDSFixed-Income FundsASN-Novib Microcredit Fund
Capital Gestion - Microfinance
Dual Return Fund SICAV
DWM Microfinance Fund-J
IIV-Mikrofinanzfonds
responsAbility Global Microfinance Fund
responsAbility Microfinanz-Fonds
St. Honoré Microfinance
Mixed/Hybrid FundsDutch Microfund
Triodos Fair Share Fund
Triodos SICAV II - Triodos Microfinance Fund
Equity FundsAavishkaar Goodwell India Microfinance Development Company II
Goodwell West Africa Microfinance Development Company Lt
PRIVATE PLACEMENT FUNDSFixed-Income FundsAccion Bridge Guarantee Program
Actiam Institutional Microfinance Fund II (ex SNS II)
Actiam Institutional Microfinance fund III
ADA - Luxmint
BBVA Codespa Microfinanzas, FIL
Capital Gestion - Impact Investing
Consorzio ETIMOS s.c.
CoopEst
Cresud SPA
Deutsche Bank Microcredit Development Fund (DBMDF)
Dexia Microcredit Fund
Dual Return Fund – Vision Microfinance Local Currency
DWM Microfinance Fund
Emergency Liquidity Fund
EMF Microfinance Fund AGmvK
Envest Microfinance Fund LLC
ETIMOS Fund Global MicroFinance Debt
European Fund for South East Europe
Fairtrade Access Fund
FEFISOL
FINCA Microfinance Fund B.V.
Finethic Microfinance SICAV-SIF
Fonds pour l’Inclusion financière en RD Congo
Global Partnerhips Social Investment Fund 2010
Global Partnerships Microfinance Fund 2005 LLC
Global Partnerships Microfinance Fund 2006 LLC
Global Partnerships Microfinance Fund 2008 LLC
Global Partnerships Social Investment Fund 5.0
IC Asia Women Microfinance Fund
Impulse Microfinance Investment Fund NV
Investisseur et Partenaire pour le Développement (I&P)
JAIDA
KCD Mikrofinanzfonds (FIS) I “Global”
KCD Mikrofinanzfonds II “Lateinamerika”
KCD Mikrofinanzfonds III
Kolibri Kapital ASA
Locfund
Locfund II L.P.
Luxembourg Microfinance and Development Fund
MCE Social Capital
Microfinance Challenge Fund Rwanda
Microfinance Enhancement Facility SA
Microfinance Growth Fund
MicroVentures Financial Inclusion
MicroVest I, LP
MicroVest Short Duration Fund
MicroVest+Plus
MIFA - Microfinance Initiative for Asia Debt Fund
MV Microfin Pvt Ltd (MicroVentures India)
ProPulse Fund
Regional MSME Investment Fund for Sub-Saharan Africa (REGMIFA)
responsAbility SICAV (Lux) Financial Inclusion Fund
responsAbility SICAV (Lux) Microfinance Leaders Fund
Selectum SICAV-SIF BL Microfinance
Shared Interest
Symbiotics SICAV - SEB Microfinance Fund
Symbiotics SICAV - SEB Microfinance Fund II
Symbiotics SICAV - SEB Microfinance Fund III
Symbiotics SICAV (Lux.) - Emerging Impact Bond Fund
Symbiotics SICAV (Lux.) - Emerging Sustainable Funds
Symbiotics SICAV (Lux.) - High Yield Frontier Impact
The Dignity Fund, L.P.
The Nots Fund
The SANAD Fund for MSME
The Small Enterprise Impact Investing Fund
Wallberg Global Microfinance Fund
58

Mixed/Hybrid FundsAccess Africa Fund LLC
Actiam Institutional Microfinance Fund I (ex SNS I)
Africap Microfinance Fund Ltd
Elevar Equity II, LP
FONIDI
GAWA Microfinance Fund
Global Microfinance Equity Fund
India Financial Inclusion Fund
LOK Capital LLC
MicroVentures Equity 1
MicroVentures Investments SCA SICAR
MVH S.p.A.
NMI Frontier Fund
Progression Eastern African Microfinance Equity Fund
Prospero Microfinanzas Fund, LP
Rural Impulse Fund II
Rural Impulse Microfinance Fund
Sarona Risk Capital Fund I LP
Shore Cap II
Equity FundsAavishkaar Goodwell India Microfinance Development Company
ACCION Investments in Microfinance SPC
Balkan Financial Sector Equity Fund C.V.
Bamboo Financial Inclusion Fund
Bellwether Microfinance Fund
Bridge Philippines Investments
Catalyst Microfinance Investors
Creation Investment Social Venture Fund I
Creation Investments Social Ventures Fund II
DWM Inclusive Finance Equity Fund II
DWM Microfinance Equity Fund I
Fonds Desjardins pour la Finance inclusive
Global Financial Inclusion Fund
MicroVest II, LP
NMI Fund III
NMI Global Fund
ShoreCap International, Ltd.
Unitus Equity Fund, LP
Women’s World Banking Capital Partners
COOPERATIVES/NGOSFixed-Income FundsagRIF Coöpertiaf U.A.
Alterfin cvba
Capital for Communities Fund
Fonds International de Garantie
Global Commercial Microfinance Consortium II B.V.
Global Microfinance Consortium
Grameen-Jameel Pan-Arab Microfinance Ltd.
Oikocredit
Opportunity Loan Guarantee Fund I, LLC
Mixed/Hybrid FundsIncofin cvso
SIDI “Solidarité Internationale pour le Développement et l’Investissement”
CDOSFixed-Income FundsBlueOrchard Loans for Development - 2007
BlueOrchard Loans for Development 2006-1
BlueOrchard Microfinance Securities-1 (BOMS1)
db Microfinance-Invest Nr. 1
MicroAccess Trust 2007
Microfinance Loan Obligations (MFLO) Compartment LC
Microfinance Loan Obligations (MFLO) Compartment Sub Debt
Microfinance Loan Obligations SA - Compartment Opportunity Eastern Europe 2005-1
Microfinance Securities XXEB
OTHER MIISFixed-Income FundsGlobal Microfinance Fund
Grameen Credit Agricole Microfinance Foundation
Local Credit Fund
MFLO4 - Microfinance Loan Obligations S.A. - Compartment 4 - Banex
MLC “Frontiers” LLC.
Planet MicroFund
Mixed/Hybrid FundsCaspian Impact Investments
DID - Partnership Fund
Erste Responsible Microfinance (ex-ESPA Vinis)
Gray Ghost Microfinance Fund LLC
Hivos-Triodos Fund Foundation
Omidyar-Tufts Microfinance Fund
Triodos-Doen Foundation
Equity FundsACCION Gateway Fund
CreditAccess Asia (ex MicroVentures Finance Group SA)
59

III: HISTORICAL LIST OF MIV MANAGERSAsset Manager Country
Accion USA
Actiam Impact Investing Netherlands
ADA Luxembourg
Alterfin Belgium
Annexum Netherlands
Bamboo Capital Partners Switzerland
Bank Im Bistum Essen eG Germany
Banque de Luxembourg Luxembourg
BIM Asset Management Bolivia
BlueOrchard Switzerland
Bridge Philippines Investments Philippines
Caspian Impact Investment Adviser India
Catalyst Microfinance Investors Mauritius
Coopest Belgium
C-Quadrat Austria
Consorzio Etimos Italy
Creation Investments USA
Credit Agricole Foundation Luxembourg
Cresud Italy
Cyrano Management S.A. Peru
Deutsche Bank USA
Developing World Markets USA
dfe Partners Switzerland
Dignity Fund, Inc. USA
Elevar Equity USA
Envest USA
Equator Capital Partners USA
Erste - Sparinvest Austria
Finance in Motion Germany
Fondation RAFAD Switzerland
FONIDI Canada
Frankfurt School of Finance& Management Germany
Fundo Switzerland
GAWA Capital Spain
Global Partnerships USA
60

Asset Manager Country
Goodwell Investments Netherlands
Grameen Jameel UAE
Grassroots Capital USA
Gray Matters Capital USA
Incofin Investment Management Netherlands
Invest in Visions Germany
Investisseurs & Partenaires France
Jaida Morocco
Kolibri Capital Norway
Lok Capital India
Luxembourg Microfinance and Development Fund Luxembourg
MCE Social Capital USA
Mecene Investments Mauritius
Micro-Ventures India India
MicroVentures Investments Luxembourg
MicroVentures SpA Italy
MicroVest USA
Norwegian Microfinance Initiative Norway
Oikocredit Netherlands
Omtrix Costa Rica
Opportunity International USA
PlaNIS France
Progression Capital Africa Mauritius
responsAbility Switzerland
Sarona Capital USA
Shared Interest USA
SIDI “Solidarité Internationale pour le Développement et l’Investissement” France
Skandinaviska Enskilda Banken AB (SEB) Sweden
Symbiotics Switzerland
Triodos Investment Management Netherlands
Triple Jump Netherlands
Tufts University USA
Women’s World Banking USA
Working Capital for Community Needs USA
61

IV: 10-YEAR MIV BENCHMARKS51
MIV Balance Sheet - USD million 2006 2007 2008 2009 2010 2011 2012 2013 2014 2015Total Assets (TA) 53.3 57.8 65.0 74.6 82.9 96.0 95.0 110.7 124.7 130.3 # 39 61 76 82 71 69 83 80 84 93% of TA 100% 100% 100% 100% 100% 100% 100% 100% 100% 100%
Microfinance Portfolio (MP) 37.6 49.5 47.9 52.7 61.4 72.3 71.4 84.0 99.3 101.2 # 34 50 75 82 70 69 83 80 83 93% of TA 62% 70% 73% 71% 73% 75% 75% 76% 79% 78%
Total Liquid Assets 7.8 9.2 7.0 12.8 10.7 12.6 12.2 14.6 14.7 16.9 # 32 50 69 81 70 69 82 80 83 91% of TA 12% 13% 10% 17% 13% 13% 13% 13% 12% 13%
Other Portfolio na na na 6.5 8.5 7.7 8.5 8.5 8.3 9.5 # na na na 82 70 69 82 80 83 91% of TA na na na 9% 10% 8% 9% 8% 7% 7%
Other Assets na na na 2.5 3.5 3.4 3.1 3.5 2.6 3.3 # na na na 81 69 69 81 80 83 91% of TA na na na 3% 4% 4% 3% 3% 2% 2%
Investment Terms 2006 2007 2008 2009 2010 2011 2012 2013 2014 2015Direct Outstanding Portfolio per Investee - $million 1.11 1.63 1.57 1.72 1.81 1.84 1.97 2.10 2.41 2.45 # 30 49 67 77 65 67 80 77 83 93
Direct Outstanding Debt Portfolio per Investee - $million 1.20 1.74 1.72 1.52 1.74 1.80 1.78 1.81 2.13 2.16 # 22 35 39 64 58 56 64 61 67 74
Direct Outstanding Equity Portfolio per Investee - $million 1.23 1.71 2.14 2.79 2.67 1.96 3.09 3.52 3.97 4.29 # 10 14 16 35 27 29 36 40 43 47
Number of Direct Investees 36 29 32 30 33 38 36 40 40 40 # 34 57 70 81 70 69 82 78 83 93
Remaining Maturity of Debt Investments (in months) 48.5 35.5 32.3 31.3 23.8 23.8 20.9 22.1 22.5 22.0 # 10 44 55 62 47 47 59 54 59 66
51 All reported values are averages per MIV. The figures are in USD, applying a constant exchange rate as of December 2006 across the 10 years.
62
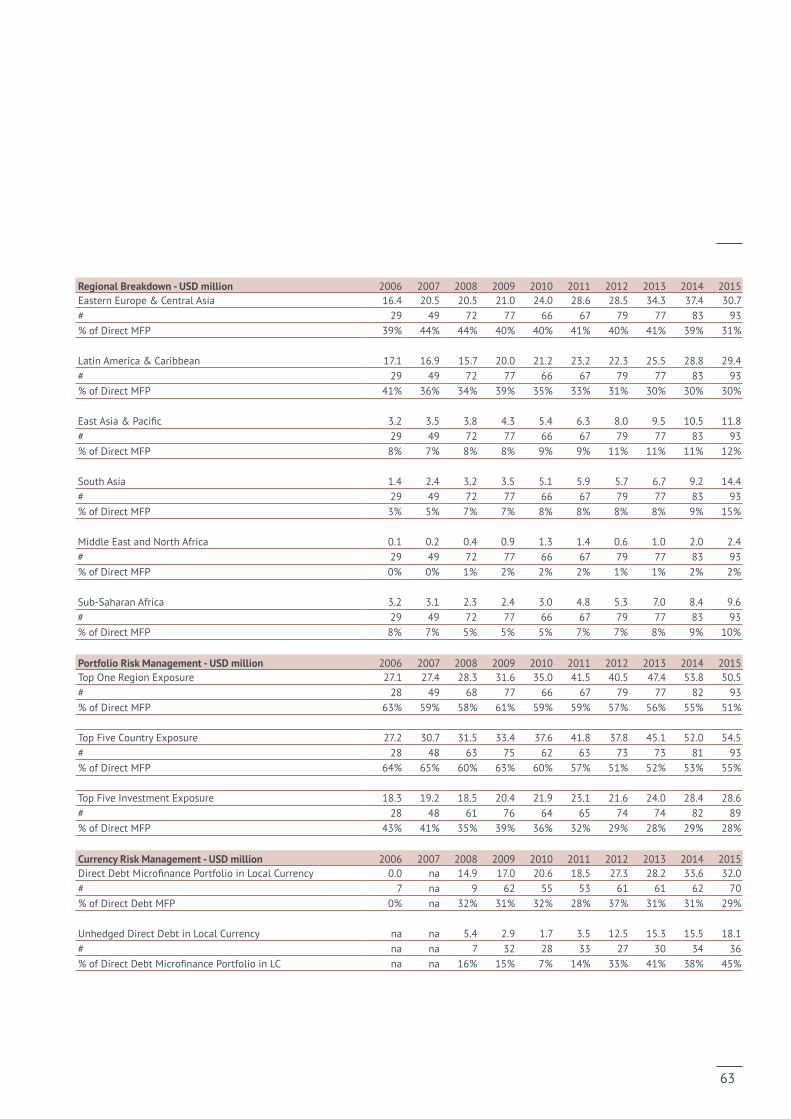
Regional Breakdown - USD million 2006 2007 2008 2009 2010 2011 2012 2013 2014 2015Eastern Europe & Central Asia 16.4 20.5 20.5 21.0 24.0 28.6 28.5 34.3 37.4 30.7# 29 49 72 77 66 67 79 77 83 93% of Direct MFP 39% 44% 44% 40% 40% 41% 40% 41% 39% 31%
Latin America & Caribbean 17.1 16.9 15.7 20.0 21.2 23.2 22.3 25.5 28.8 29.4# 29 49 72 77 66 67 79 77 83 93% of Direct MFP 41% 36% 34% 39% 35% 33% 31% 30% 30% 30%
East Asia & Pacific 3.2 3.5 3.8 4.3 5.4 6.3 8.0 9.5 10.5 11.8# 29 49 72 77 66 67 79 77 83 93% of Direct MFP 8% 7% 8% 8% 9% 9% 11% 11% 11% 12%
South Asia 1.4 2.4 3.2 3.5 5.1 5.9 5.7 6.7 9.2 14.4# 29 49 72 77 66 67 79 77 83 93% of Direct MFP 3% 5% 7% 7% 8% 8% 8% 8% 9% 15%
Middle East and North Africa 0.1 0.2 0.4 0.9 1.3 1.4 0.6 1.0 2.0 2.4# 29 49 72 77 66 67 79 77 83 93% of Direct MFP 0% 0% 1% 2% 2% 2% 1% 1% 2% 2%
Sub-Saharan Africa 3.2 3.1 2.3 2.4 3.0 4.8 5.3 7.0 8.4 9.6# 29 49 72 77 66 67 79 77 83 93% of Direct MFP 8% 7% 5% 5% 5% 7% 7% 8% 9% 10%
Portfolio Risk Management - USD million 2006 2007 2008 2009 2010 2011 2012 2013 2014 2015Top One Region Exposure 27.1 27.4 28.3 31.6 35.0 41.5 40.5 47.4 53.8 50.5 # 28 49 68 77 66 67 79 77 82 93% of Direct MFP 63% 59% 58% 61% 59% 59% 57% 56% 55% 51%
Top Five Country Exposure 27.2 30.7 31.5 33.4 37.6 41.8 37.8 45.1 52.0 54.5 # 28 48 63 75 62 63 73 73 81 93% of Direct MFP 64% 65% 60% 63% 60% 57% 51% 52% 53% 55%
Top Five Investment Exposure 18.3 19.2 18.5 20.4 21.9 23.1 21.6 24.0 28.4 28.6 # 28 48 61 76 64 65 74 74 82 89% of Direct MFP 43% 41% 35% 39% 36% 32% 29% 28% 29% 28%
Currency Risk Management - USD million 2006 2007 2008 2009 2010 2011 2012 2013 2014 2015Direct Debt Microfinance Portfolio in Local Currency 0.0 na 14.9 17.0 20.6 18.5 27.3 28.2 33.6 32.0 # 7 na 9 62 55 53 61 61 62 70% of Direct Debt MFP 0% na 32% 31% 32% 28% 37% 31% 31% 29%
Unhedged Direct Debt in Local Currency na na 5.4 2.9 1.7 3.5 12.5 15.3 15.5 18.1 # na na 7 32 28 33 27 30 34 36% of Direct Debt Microfinance Portfolio in LC na na 16% 15% 7% 14% 33% 41% 38% 45%
63

Portfolio Quality – % of MFP 2006 2007 2008 2009 2010 2011 2012 2013 2014 2015Provisions na na na 1.6% 4.5% 3.1% 1.3% 0.9% 1.0% 1.7%# na na na 61 47 52 55 58 60 68
Write-offs na na na 0.1% 1.6% 0.7% 0.5% 0.7% 0.1% 0.3%# na na na 60 46 51 55 56 56 60
Investor Type - USD million 2006 2007 2008 2009 2010 2011 2012 2013 2014 2015Private Institutional Investors 22.9 23.5 19.8 34.3 31.8 38.8 47.2 50.8 56.1 58.7 # 25 43 63 69 63 66 72 77 80 86 % of Total Investors 33% 42% 37% 48% 43% 43% 55% 49% 48% 47%
Public Investors 17.7 12.8 12.1 13.7 17.4 21.7 24.7 27.0 32.1 33.1 # 25 43 63 69 61 64 68 74 76 82 % of Total Investors 25% 23% 23% 19% 23% 23% 28% 25% 26% 25%
Private Retail & High-Net Worth Individuals 29.7 19.0 21.7 23.1 26.0 31.3 14.8 27.4 30.0 34.8 # 25 43 63 69 63 66 70 76 80 86 % of Total Investors 42% 34% 40% 32% 35% 34% 17% 26% 26% 28%
Yields & Costs 2006 2007 2008 2009 2010 2011 2012 2013 2014 2015Yields on Direct Debt Microfinance Portfolio - Simple Average na na 10.7% 9.1% 8.6% 7.7% 8.0% 8.1% 8.2% 7.3%Yields on Direct Debt Microfinance Portfolio - Weighted Av. na na 9.4% 8.4% 8.2% 6.8% 7.7% 6.8% 7.1% 7.2%# na na 24 23 33 32 41 46 37 44
Management Fee Ratio - Simple Average na 2.9% na 2.5% 2.0% 1.9% 1.8% 2.1% 2.0% 2.1%Management Fee Ratio - Weighted Average na 2.0% na 1.9% 1.3% 1.4% 1.4% 1.7% 1.6% 1.6%# na 27 na 41 37 43 54 57 53 63
Total Expense Ratio - Simple Average na 4.0% 3.3% 3.3% 2.9% 2.8% 2.9% 3.2% 3.1% 3.3%Total Expense Ratio - Weighted Average na 2.3% 2.2% 2.4% 2.2% 2.4% 2.3% 2.4% 2.3% 2.4%# na 42 55 54 45 49 54 62 58 68
64

Net Returns to Investors 2006 2007 2008 2009 2010 2011 2012 2013 2014 2015Growth NAV per Share - USD (Fixed-Income Funds) 2.5% 6.5% 6.2% 2.1% 2.0% 1.8% 3.6% 2.4% 3.6% 2.7%# 4 5 4 6 7 8 10 13 11 13
Growth NAV per Share - EUR (Fixed-Income Funds) 2.3% 4.7% 5.9% 2.5% 2.8% 2.2% 4.1% 2.0% 4.3% 2.3%# 3 6 6 10 11 11 13 14 15 15
Growth NAV per Share - CHF (Fixed-Income Funds) na 3.3% na na na na 2.0% 1.4% 3.6% 1.2%# 2 3 2 2 2 2 3 5 8 6
Growth NAV per Share - EUR (Mixed/Hybrid Funds) na na 7.1% 6.9% 5.6% 5.1% 10.0% 5.1% 4.6% 3.7%# na 2 3 4 4 4 5 3 3 4
Coupon Return - USD (Fixed-Income Funds) 6.0% 4.5% 3.9% 5.0% 4.3% 2.3% 2.1% 2.9% 3.5% 3.9%# 3 7 8 14 12 7 10 7 7 6
Coupon Return - EUR (Fixed-Income Funds) na 4.5% 2.6% 3.7% 2.6% 2.7% 2.2% 2.8% 2.4% 2.4%# 1 3 4 7 6 6 6 4 3 3
Internal Rate of Return – Equity Funds 14.8%# 15 observations over 10 years
65
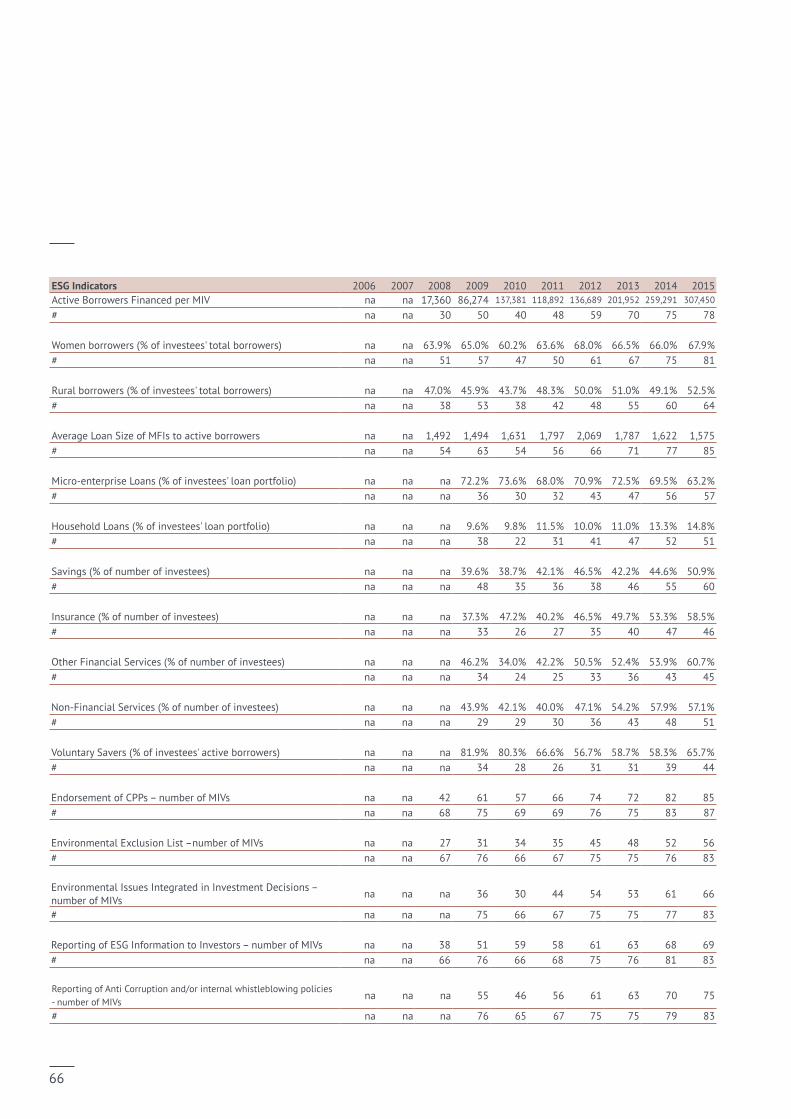
ESG Indicators 2006 2007 2008 2009 2010 2011 2012 2013 2014 2015Active Borrowers Financed per MIV na na 17,360 86,274 137,381 118,892 136,689 201,952 259,291 307,450
# na na 30 50 40 48 59 70 75 78
Women borrowers (% of investees' total borrowers) na na 63.9% 65.0% 60.2% 63.6% 68.0% 66.5% 66.0% 67.9%# na na 51 57 47 50 61 67 75 81
Rural borrowers (% of investees' total borrowers) na na 47.0% 45.9% 43.7% 48.3% 50.0% 51.0% 49.1% 52.5%# na na 38 53 38 42 48 55 60 64
Average Loan Size of MFIs to active borrowers na na 1,492 1,494 1,631 1,797 2,069 1,787 1,622 1,575 # na na 54 63 54 56 66 71 77 85
Micro-enterprise Loans (% of investees' loan portfolio) na na na 72.2% 73.6% 68.0% 70.9% 72.5% 69.5% 63.2%# na na na 36 30 32 43 47 56 57
Household Loans (% of investees' loan portfolio) na na na 9.6% 9.8% 11.5% 10.0% 11.0% 13.3% 14.8%# na na na 38 22 31 41 47 52 51
Savings (% of number of investees) na na na 39.6% 38.7% 42.1% 46.5% 42.2% 44.6% 50.9%# na na na 48 35 36 38 46 55 60
Insurance (% of number of investees) na na na 37.3% 47.2% 40.2% 46.5% 49.7% 53.3% 58.5%# na na na 33 26 27 35 40 47 46
Other Financial Services (% of number of investees) na na na 46.2% 34.0% 42.2% 50.5% 52.4% 53.9% 60.7%# na na na 34 24 25 33 36 43 45
Non-Financial Services (% of number of investees) na na na 43.9% 42.1% 40.0% 47.1% 54.2% 57.9% 57.1%# na na na 29 29 30 36 43 48 51
Voluntary Savers (% of investees' active borrowers) na na na 81.9% 80.3% 66.6% 56.7% 58.7% 58.3% 65.7%# na na na 34 28 26 31 31 39 44
Endorsement of CPPs – number of MIVs na na 42 61 57 66 74 72 82 85# na na 68 75 69 69 76 75 83 87
Environmental Exclusion List –number of MIVs na na 27 31 34 35 45 48 52 56# na na 67 76 66 67 75 75 76 83
Environmental Issues Integrated in Investment Decisions – number of MIVs
na na na 36 30 44 54 53 61 66
# na na na 75 66 67 75 75 77 83
Reporting of ESG Information to Investors – number of MIVs na na 38 51 59 58 61 63 68 69# na na 66 76 66 68 75 76 81 83
Reporting of Anti Corruption and/or internal whistleblowing policies - number of MIVs
na na na 55 46 56 61 63 70 75
# na na na 76 65 67 75 75 79 83
66

67

I N D E X
INDEX OF FIGURES1 Number of Participating MIVs 11 2 Poverty Headcount Ratio at $1.90 a Day (2011 PPP) 12 3 Account Penetration around the World 12 4 Sustainable Development Goals 13 5 Sustainable Investments 14 6 Specialized MIV Business Model 16 7 MIV Inception and Targeted Closing Dates 17 8 Historical Market Size 19 9 Compounded Annual Growth Rate 2006–2015 (USD Spot) 20 10 Historical Total Assets Growth 20 11 MIV Universe 21 12 Peer Groups 21 13 Breakdown by Volume 22 14 Breakdown by Number 22 15 Microfinance Portfolio Distribution 23 16 Asset Composition 24 17 Financial Instruments 25 18 Trends in Commitments by Instrument 25 19 Number of Investees per MIVs and Direct Outstanding Portfolio 26 20 Direct Outstanding Portfolio per Investee 26 21 Remaining Maturity of Debt Investments 26 22 Regional Allocation 27 23 Historical Regional Volumes 28 24 Top 1 Regional Exposure 30 25 Top 5 Country Exposure 31 26 Top 5 Investment Exposure 31 27 Direct Debt Portfolio in Local Currency 32 28 Direct Debt LC Portfolio: Hedged and Unhedged Portions 32 29 Portfolio Quality 33 30 Funding Sources 35 31 Public Funding via MIVs 35 32 MIV Jurisdiction – % of Total Assets 36 33 Country of Incorporation – % of Total Assets 36 34 Total Assets per Country of MIV Managers 37 35 Number of Funds per MIV Manager Location 37
68

36 Yield on Direct Debt Microfinance Portfolio 39 37 Total Expense Ratio – Weighted Average 40 38 Total Expense Ratio - Weighted Average (Constant Sample) 40 39 NAV Share Price Performance vs. Libor 3 Months 41 40 MIVs’ Net Returns Spread over Libor 3 Months 41 41 Microfinance vs. Other Asset Classes 4242 Correlation of Microfinance Returns (SMX–MIV Debt USD Index)
with Mainstream Asset Classes (2003–2015) 4343 Risk-Return Profile of Microfinance Investments 43 44 Number of Active Borrowers Financed 44 45 Average Loan Size of MFIs to Active Borrowers (USD) 44 46 Women Active Borrowers 44 47 Rural and Urban Clients 45 48 Micro-enterprise Loans 45 49 Household Consumption 45 50 Product Offering 46 51 Voluntary Savers 46 52 Endorsement of Client Protection Principles 47 53 Environment 47 54 Governance 47
69

70


Symbiotics SARue de la Synagogue 31
1204 Geneva
Switzerland
CGAP1825 I Street
NW 7th floor
Washington DC 20006
USA
symbioticsgroup.com cgap.org