© kantar worldpanel irish grocery market review – period ending - 25 th dec 2011
TRANSCRIPT
© Kantar Worldpanel
IRISH GROCERY MARKET REVIEW– Period ending - 25th Dec 2011

© Kantar Worldpanel
OVERVIEW
Market Overview•The annual market sales are ahead of last year, with growth of +0.5% year-on-year. The food market is showing stronger growth (0.9% year on year) than the non-food market.
•Over the shorter term, market value has increased by +1% as shoppers buy more volume despite price inflation, and compensate by purchasing on offer and trading down to cheaper lines.
•Consumers are making more shopping trips, but reducing their average spend per trip.

© Kantar Worldpanel
Key themes in the marketplace
Stability
Inflation
Trading DownSmaller Trips
Store Choice

© Kantar Worldpanel
The period 2001 to 2008 saw average growth of 7% per annum and overall +58% over the whole period
€5.9€6.3
€6.7€7.1
€7.5€8.0
€8.6€9.3
2001 2002 2003 2004 2005 2006 2007 2008 2009 2010 2011
+8% +6% +6% +6% +6% +7% +8%
Annu
al v
alue
of t
ake
hom
e gr
ocer
y (€
b)
Data to 52 week ending August

© Kantar Worldpanel
The market value declined in 2010 by 6% but has now stabilised
€5.9€6.3
€6.7€7.1
€7.5€8.0
€8.6€9.3 €9.3
€8.8 €8.9
2001 2002 2003 2004 2005 2006 2007 2008 2009 2010 2011
+8% +6% +6% +6% +6% +7% +8% +1% -6% +1%
Annu
al v
alue
of t
ake
hom
e gr
ocer
y (€
b)
Data to 52 week ending August

© Kantar Worldpanel
The Irish grocery market remains in growth this period with 12w sales up +1% on this period last year
Total Grocery Market Value Sales and YOY Growth
€9,120,707 €8,867,536 €8,910,759
€2,147,698 €2,188,173 €2,208,986
52 w/e 27Dec 09
52 w/e 26Dec 10
52 w/e 25Dec 11
12 w/e 27Dec 09
12 w/e 26Dec 10
12 w/e 25Dec 11
€000
s
-2.8% +0.5% +1.9% +1.0%

© Kantar Worldpanel
5,218,577 5,165,940 5,148,694
1,233,687 1,225,030 1,228,673
52 w/e 27Dec 09
52 w/e 26Dec 10
52 w/e 25Dec 11
12 w/e 27Dec 09
12 w/e 26Dec 10
12 w/e 25Dec 11
52 we packs 12 we packs
-1.7% +0%
-0.7% 0.3%
-0.3%-1%
w/e 25 Dec 2011
ROI Total Grocery Market Volume Sales and YOY Growth
Volume sales are in decline on a yearly basis while growth remains flat over the shorter term

© Kantar Worldpanel
12w Total Grocery – Sectors Value Shares & YoY % Change
Fresh & Chilled Produce
44%
Ambient Food 31%
Household 7%
Frozen 5%
Alcohol 9%Toiletries 4%
Healthcare 1%
Share of total trolley
Total Trolley
+1.0% value
1
-4.2
-3.2
-2.2
1.4
1
2.7
-0.2
TotalGrocery
Alcohol*
Healthcare
Household
Toiletries
AmbientFood
Fresh &ChilledFrozenFood
Fresh Food, Ambient Food, and Toiletries sectors have driven 12w growth

© Kantar Worldpanel
21.3
14.2
10 8.6
8.4
7.7
7.7
5.8
3.6
3.5
3.4
3 2 1.7
1.5
1.3
1.2
1 0.6
0.6
0.5
0.5
-0.7 -1
-3 -3-3
.2-3
.7 -4 -4-4
.2-6
.1-8
.7-1
0.1
Chill
ed D
rinks
Chill
ed B
aker
y Pro
duct
s
Swee
t Hom
e Co
okin
g
Froz
en C
onfe
ction
ery
Fres
h Po
ultr
y+Ga
me
Bi
scui
ts
Hot B
ever
ages
Othe
r Toi
letr
ies
Cann
ed G
oods
Frui
t+Ve
g+Sa
lads
Pick
le+T
bl Sc
e+Co
ndim
ent
Take
Hom
e Co
nfec
tione
ry
Oral
-Car
e
Dairy
Pro
duct
s
Chill
ed C
onve
nien
ce
Take
Hom
e So
ft Dr
inks
Fr
esh
Mea
t To
tal G
roce
ryPe
t Car
e
Fres
h Fi
sh
Pack
et B
reak
fast
Bath
room
Toile
trie
s
Froz
en P
repa
red
Food
s Ha
ircar
e
Hous
ehol
d &
Cle
anin
g Prd
s
Savo
ury
Hom
e Co
okin
g
Heal
thca
re
Ambi
ent B
aker
y Pr
oduc
ts
Take
Hom
e Sa
vour
ies
Froz
en Fi
sh
Alco
hol
Froz
en P
oultr
y+Ga
me
Savo
ury
Carb
ohyd
rts+S
ncks
Fr
ozen
Mea
t
12w Total Grocery - value %chg by category
Which categories are performing well?Chilled Drinks has performed best YoY, shoppers also spending more on Sweet Home Cooking, Frozen Confectionary and Fresh Poultry

© Kantar Worldpanel
12w Total Grocery - pack % sold on deal by category
34.2
32.8
31.3
29.1
29.1
28.6
26.7
25.3
23.3
21.5
20.7
20.4
19.4
19.4
19.3
17.8
17.5
17.4
16.8
15.1
14.8
13.4
13.3
13.3
12.6
12.5
11.5
10.9
10.6
9.2
8.9
8.9
8.4
6.8
Bath
room
Toile
trie
s Al
coho
l Ho
t Bev
erag
es
Take
Hom
e So
ft Dr
inks
Take
Hom
e Sa
vour
ies
Take
Hom
e Co
nfec
tione
ry
Bisc
uits
Ch
illed
Drin
ks
Hairc
are
Hous
ehol
d &
Cle
anin
g Prd
s
Froz
en C
onfe
ction
ery
Froz
en Fi
sh
Fres
h Po
ultr
y+Ga
me
Froz
en P
repa
red
Food
s Or
al-C
are
To
tal G
roce
ry
Pick
le+T
bl Sc
e+Co
ndim
ent
Chill
ed C
onve
nien
ce
Froz
en P
oultr
y+Ga
me
Othe
r Toi
letr
ies
Chill
ed B
aker
y Pro
duct
s Fr
esh
Fish
Frui
t+Ve
g+Sa
lads
Cann
ed G
oods
Pe
t Car
e
Pack
et B
reak
fast
Fr
esh
Mea
t
Savo
ury
Hom
e Co
okin
g
Savo
ury
Carb
ohyd
rts+S
ncks
Swee
t Hom
e Co
okin
g Da
iry P
rodu
cts
Ambi
ent B
aker
y Pr
oduc
ts
Heal
thca
re
Froz
en M
eat
Categories with a lot of perceived promotional activityToiletries, Alcohol and Drinks have the highest proportion of packs sold on deal. Staples such as Dairy and Bakery have low promotional levels

© Kantar Worldpanel
Change in value sales – Total grocery sectorsAmbient and Fresh performing well over shorter periods
11
0.5
-4.6 -4.8
1.6 1.3 1.0 1.0 0.21
-4.2 -3.2 -2.2
1.4 12.7
-0.22.2
0.2
-4.6
0.43.1 2.2 3.6
-1
TOTALGROCERY
TOTALALCOHOL
TOTALHEALTHCARE
TOTALHOUSEHOLD
(inc Petcare)
TOTALTOILETRIES
AMBIENTGROCERIES
TOTAL FRESH& CHILLED
FROZEN
52 w/e Change 12 w/e Change 4 w/e Change
% Value Change
w/e 25 Dec 2011

© Kantar Worldpanel
What is the size of the total food market?The total food market shows stronger growth than non food this period
7,271,991 7,099,092 7,165,029
1,673,455 1,720,741 1,753,271
52 w/e 27Dec 09
52 w/e 26Dec 10
52 w/e 25Dec 11
12 w/e 27Dec 09
12 w/e 26Dec 10
12 w/e 25Dec 11
52 we €000’s
-2.4% +0.9%
12 we €000’s
+1.9%+2.8%
w/e 25 Dec 2011

© Kantar Worldpanel
Growth for the Food market – QuarterlyThe food market has shown growth on the same period last year
1.1
0.8
1.92.0
2.8
2.8
1.9
0.5
1.31.2 1.2
1.0
0.4
0.1
1.6
0.5
0
1
1
2
2
3
3
12 w/e28 Nov
10
12 w/e26 Dec
10
12 w/e26 Dec
10
12 w/e23 Jan
11
12 w/e20 Feb
11
12 w/e20 Mar
11
12 w/e17 Apr
11
12 w/e15 May
11
12 w/e12 Jun
11
12 w/e10 Jul 11
12 w/e07 Aug
11
12 w/e04 Sep
11
12 w/e02 Oct
11
12 w/e30 Oct
11
12 w/e27 Nov
11
12 w/e25 Dec
11
Total food
12 w/e 25 Dec 2011

© Kantar Worldpanel
% change year on year – 12 weekly period
-12
-10
-8
-6
-4
-2
0
2
4
6
8
Dec-
08
Jan-
09
Feb-
09
Mar
-09
Apr-
09
May
-09
Jun-
09
Jul-0
9
Aug-
09
Sep-
09
Oct
-09
Nov
-09
Dec-
09
Jan-
10
Feb-
10
Mar
-10
Apr-
10
May
-10
Jun-
10
Jul-1
0
Aug-
10
Sep-
10
Oct
-10
Nov
-10
Dec-
10
Jan-
11
Feb-
11
Mar
-11
Apr-
11
May
-11
Jun-
11
Jul-1
1
Aug-
11
Sep-
11
Oct
-11
Nov
-11
Dec-
11
Inflation % chg
HH Spend % chg
Household Spend change is holding behind inflation, though both are now in positive growth year on year
Change in Household Spend (%) and Inflation Rate

© Kantar Worldpanel
Inflation is evident in over 70% of the markets
% of Markets with like-for-like Price Inflation
0%
10%
20%
30%
40%
50%
60%
70%
80%
90%
100%12
w/e
24
Feb
0812
w/e
Mar
08
12 w
/e 2
0 A
pr 0
812
w/e
18
May
08
12 w
/e 1
5 Ju
n 08
12 w
/e 1
3 Ju
n 08
12 w
/e 1
0 A
ug 0
812
w/e
07
Sep
0812
w/e
05
Oct
08
12 w
/e 0
2 N
ov 0
812
w/e
30
Nov
08
12 w
/e 2
8 D
ec 0
812
w/e
25
Jan
0912
w/e
22
Feb
0912
w/e
22
Mar
09
12 w
/e 1
9 A
pr 0
912
w/e
17
May
09
12 w
/e 1
4 Ju
n 09
12 w
/e 1
2 Ju
l 09
12 w
/e 0
9 A
ug 0
912
w/e
6 S
ep 0
912
w/e
4 O
ct 0
912
w/e
01
Nov
09
12 w
/e 2
9 N
ov 0
912
w/e
27
Dec
09
12 w
/e 2
5 Ja
n 10
12
w/e
21
Feb
10
12
w/e
21
Mar
10
12
w/e
18
Apr
il 10
12
w/e
16
May
10
12 w
/e 1
3 Ju
n 10
12w
/e 1
1 Ju
ly 1
012
w/e
08
Aug
10
12 w
/e 0
5 Se
pt 1
012
w/e
03
Oct
10
12 w
/e 3
1 O
ct 1
012
w/e
28
Nov
10
12 w
/e 2
6 D
ec 1
012
w/e
23
Jan
1112
w/e
20
Feb
1112
w/e
20
Mar
11
12 w
/e 1
7 A
pr 1
112
w/e
15
May
11
12 w
/e 1
2 Ju
n 11
12 w
/e 1
0 Ju
l 11
12 w
/e 0
7 A
ug 1
112
w/e
04
Sep
1112
w/e
02
Oct
11
12 w
/e 3
0 O
ct 1
112
w/e
27
Nov
11
12 w
/e 2
5 D
ec 1
1
15

© Kantar Worldpanel
12w Total Grocery - changes in consumer shopping behaviour
€24.60 €25.00 €24.10
12 w/e 27 Dec 09 12 w/e 26 Dec 10 12 w/e 25 Dec 11
Avg Spend per Trip
Average frequency increased by
+5.0%
Average frequency increased by
+5.0%
Average basket spend reduced by -
3.9%
Average basket spend reduced by -
3.9%
€12 increase in 12w spend per HH
(+0.9%)
€12 increase in 12w spend per HH
(+0.9%)
Irish households are shopping more often this year, but spending less per trip
55.3 53.6 56.3
12 w/e 27 Dec 09 12 w/e 26 Dec 10 12 w/e 25 Dec 11
Trips per Household
€1,360€1,341 €1,353
12 w/e 27 Dec 09 12 w/e 26 Dec 10 12 w/e 25 Dec 11
Avg Spend per Household
© Kantar Worldpanel
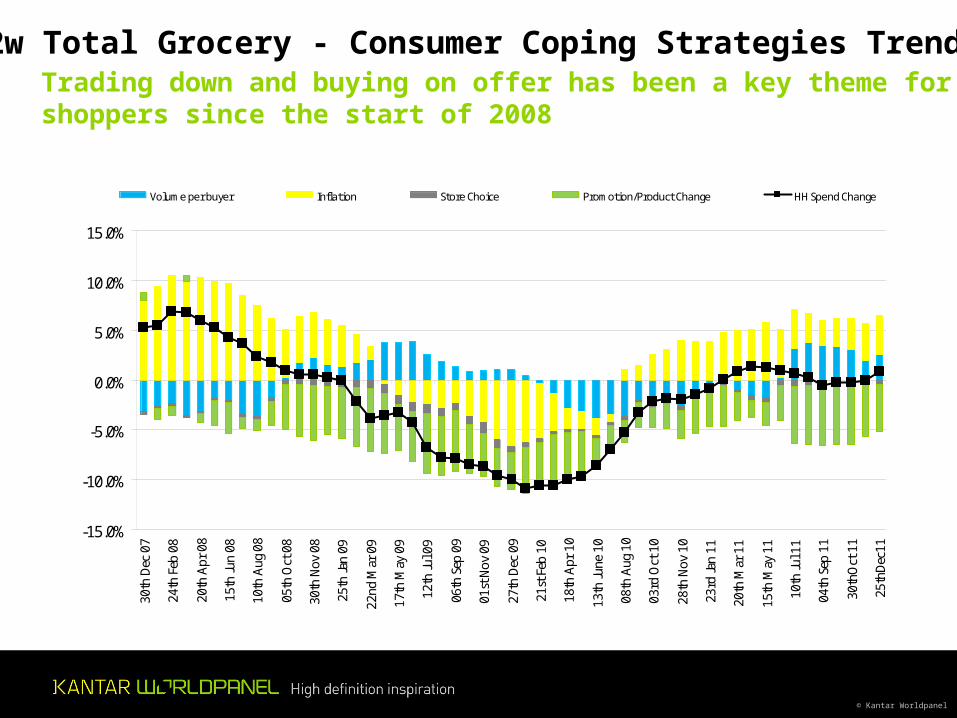
12w Total Grocery - Consumer Coping Strategies Trended
-15.0%
-10.0%
-5.0%
0.0%
5.0%
10.0%
15.0%
30th
Dec
07
24th
Feb
08
20th
Apr
08
15th
Jun
08
10th
Aug
08
05th
Oct
08
30th
Nov
08
25th
Jan
09
22nd
Mar
09
17th
May
09
12th
Jul 0
9
06th
Sep
09
01st
Nov
09
27th
Dec
09
21st
Feb
10
18th
Apr
10
13th
June
10
08th
Aug
10
03rd
Oct
10
28th
Nov
10
23rd
Jan
11
20th
Mar
11
15th
May
11
10th
Jul 1
1
04th
Sep
11
30th
Oct
11
25th
Dec
11
Volume per buyer Inflation Store Choice Promotion/Product Change HH Spend Change
Trading down and buying on offer has been a key theme for shoppers since the start of 2008

© Kantar Worldpanel
18
2007 2008 2009 2010 2011
42%
43%44%
45%46%
Shoppers are increasingly turning to Non Branded Products – (Private Label and No Brand Name*)
Christmas 2011:
Branded Sales: -1%Private Label: +6%
Non Branded Share Of Grocery Market
*No brand name includes loose fruit & Veg, loose meat etc.

© Kantar Worldpanel
Grocery Packs Growth by branded, no brand name* and Private label tier. Standard and value PL in growth and also non branded products
40
25
22
31
12 w/e 25 Dec 11
Standard PL
Value PL
Premium
No BrandName
Branded
Growth in Grocery sales (Packs)
0.3
-3.3
4.0
-2.8
0.8
2.4
-4
-3
-2
-1
0
1
2
3
4
5
TotalMarket
Branded No BrandName
Premium PL
Value PL StandardPL
Share of sales
*No brand name includes loose fruit & Veg, loose meat etc.

© Kantar Worldpanel
31.9
32.6 32
.9 33.2
32.7
32.3 32
.5
32.4 32
.6
32.6 32
.8
32.9 33
.1
32.8 33
.2
33.8
34.7
34.6
34.5
34.5
34.5
34.5
34.6
34.5
34.3
34.1
33.7
12 w
/e 27
Dec
09
12 w
/e 24
Jan
1012
w/e
21 Fe
b 10
12 w
/e 21
Mar
10
12 w
/e 18
Apr
10
12 w
/e 16
May
1012
w/e
13 Ju
n 10
12 w
/e 11
Jul 1
012
w/e
08 A
ug 10
12 w
/e 05
Sep
1012
w/e
03 O
ct 10
12 w
/e 31
Oct
1012
w/e
28 N
ov 10
12 w
/e 26
Dec
10
12 w
/e 23
Jan
1112
w/e
20 Fe
b 11
12 w
/e 20
Mar
11
12 w
/e 17
Apr
11
12 w
/e 15
May
1112
w/e
12 Ju
n 11
12 w
/e 10
Jul 1
112
w/e
07 A
ug 11
12 w
/e 04
Sep
1112
w/e
02 O
ct 11
12 w
/e 30
Oct
1112
w/e
27 N
ov 11
12 w
/e 25
Dec
11
% Value share
Private Label Value Share of Grocery
12w Private Label Value Share of Total Grocery MarketPrivate label value share has dropped back in the run up to Christmas when consumers tend to prefer brands

© Kantar Worldpanel
PROMOTIONAL ACTIVITY IN THE TOTAL GROCERY SECTORPromotions still remain an important part of the grocery sector – however compared to 2009 Promotions are back
15.915.7
15.3
14.915.1 15.1
15.0
14.6
14.214.0 14.0
14.1
14.414.5
14.714.5
14.314.4 14.4
14.514.3
14.114.3
14.514.7
14.214.0
12 w
/e 2
7 D
ec 0
9
12 w
/e 2
4 Ja
n 10
12 w
/e 2
1 Fe
b 10
12 w
/e 2
1 M
ar 1
0
12 w
/e 1
8 Ap
r 10
12 w
/e 1
6 M
ay 1
0
12 w
/e 1
3 Ju
n 10
12 w
/e 1
1 Ju
l 10
12 w
/e 0
8 Au
g 10
12 w
/e 0
5 Se
p 10
12 w
/e 0
3 O
ct 1
0
12 w
/e 3
1 O
ct 1
0
12 w
/e 2
8 N
ov 1
0
12 w
/e 2
6 D
ec 1
0
12 w
/e 2
3 Ja
n 11
12 w
/e 2
0 Fe
b 11
12 w
/e 2
0 M
ar 1
1
12 w
/e 1
7 Ap
r 11
12 w
/e 1
5 M
ay 1
1
12 w
/e 1
2 Ju
n 11
12 w
/e 1
0 Ju
l 11
12 w
/e 0
7 Au
g 11
12 w
/e 0
4 Se
p 11
12 w
/e 0
2 O
ct 1
1
12 w
/e 3
0 O
ct 1
1
12 w
/e 2
7 N
ov 1
1
12 w
/e 2
5 D
ec 1
1
21
% Packs Sold on Deal in Total Grocery,

© Kantar Worldpanel
SHOPPING BEHAVIOUR THROUGH CHRISTMAS: SALES (4 week sales)Shoppers cut back spend in Jan as they buy fewer packs, but purchasing picks up again in Feb
+5.8%-14.2%
€672
,146
€669
,142
€804
,767
€652
,442
€657
,961
€672
,931
€686
,396
€828
,665
€643
,890
€672
,428
392,
217
394,
154 44
1,96
4
396,
016
400,
008
386,
299
390,
452 44
6,40
8
380,
336
402,
504
4 w/e 01Nov 09
4 w/e 29Nov 09
4 w/e 27Dec 09
4 w/e 24Jan 10
4 w/e 21Feb 10
4 w/e 31Oct 10
4 w/e 28Nov 10
4 w/e 26Dec 10
4 w/e 23Jan 11
4 w/e 20Feb 11
Weighted 000's EUROS
Weighted RPacks / 000

© Kantar Worldpanel
57 5751
56 59 58 5749
58 58
15 14
15
16 14 15 14
15
14 15
13 1414
13 13 13 13
14
13 13
11 1113
11 10 10 1113
11 10
3 34
3 3 3 35
3 31.4 1.5 3 1.2 1.1 1.1 1.5 3.3
1 1
4 w/e 01Nov 09
4 w/e 29Nov 09
4 w/e 27Dec 09
4 w/e 24Jan 10
4 w/e 21Feb 10
4 w/e 31Oct 10
4 w/e 28Nov 10
4 w/e 26Dec 10
4 w/e 23Jan 11
4 w/e 20Feb 11
Over €150
€101 - €150
€51 - €100
€31 - €50
€21 - €30
Less Than €20
SHOPPING BEHAVIOUR THROUGH CHRISTMAS: BASKET SIZE4w share of purchase occasions by trip type Increase in big shops in Dec, but normal habits are quickly resumed after Christmas

© Kantar Worldpanel
SHOPPING BEHAVIOUR THROUGH CHRISTMAS: BRANDED4w value salesBranded goods have a higher share at Christmas, but this drops back in the new year as shoppers look to reduce expenditure
+5.8%-14.2%
57.2 57.859.9
54.555.7 56.4 57.1
59.1
54.1 54.3
10.6 10.08.6
11.3 11.0 10.4 9.7 8.811.1 10.9
32.2 32.2 31.5
34.2 33.3 33.2 33.232.1
34.8 34.9
4 w/e 01Nov 09
4 w/e 29Nov 09
4 w/e 27Dec 09
4 w/e 24Jan 10
4 w/e 21Feb 10
4 w/e 31Oct 10
4 w/e 28Nov 10
4 w/e 26Dec 10
4 w/e 23Jan 11
4 w/e 20Feb 11
Branded No Brand Name Private Label

© Kantar Worldpanel
KANTAR WORLDPANEL: DATA TO 25TH DEC 2011
UK OVERVIEW

© Kantar Worldpanel
UK Grocery Update to 25 Dec 2011 – Market Trends Summary• Inflation rate has started to fall this period. Although prices are still rising, the
annual rate at which they are rising has fallen for the first time since late 2010.
• The level of trading down has reduced to 1.8% due to the fall in inflation and less promotional discount on offer.
• Retailers have changed their focus to concentrate their efforts on price competitiveness and away from pushing promotions this period.
• With fewer promotions to turn to, consumers are seeking other ways to trade down. The marked increase in frequency & decline in basket size is indicative of consumer shopping around for the best deals. We have also seen the rise in private label sales and decline in branded and also the continued growth in Budget sales.
• Conversely we see a different tranche of consumers wanting to indulge, possibly at the expense of eating out, as demonstrated by the Premium growth, both in brands and retailers.

© Kantar Worldpanel
27
10 yrs 3 yrs 1 yr
+51% -4% +1%
+58% +15% +4%
Grocery Market Sales Performance

© Kantar Worldpanel
0
1
2
3
4
5
6
7
8
9
10
Inflation
HH Spend change
UK Total Grocery - Value & Household Spend % Change Year on YearShoppers in the UK also manage to keep spend below rising inflation

© Kantar Worldpanel
29
-4%
-3%
-2%
-1%
0%
1%
2%
3%
4%
27
De
c 0
9
24
Ja
n 1
0
21
Fe
b 1
0
21
Ma
r 1
0
18
Ap
r 1
0
16
Ma
y 1
0
13
Ju
n 1
0
11
Ju
l 10
08
Au
g 1
0
05
Se
p 1
0
03
Oct
10
31
Oct
10
28
No
v 1
0
26
De
c 1
0
23
Ja
n 1
1
20
Fe
b 1
1
20
Ma
r 1
1
17
Ap
r 1
1
15
Ma
y 1
1
12
Ju
n 1
1
10
Ju
l 11
07
Au
g 1
1
04
Se
p 1
1
02
Oct
11
30
Oct
11
27
No
v 1
1
25
De
c 1
1
con
trib
utio
n t
o c
ha
ng
e %
pts
Volume change Store Choice Promotions Product Choice
Grocery (RST) 12we 25 Dec 2011 (KWP P1)
Trading–Up and Trading–Down StrategiesShoppers no longer able to save through buying promotions but use trading down product as the main way to save money

© Kantar Worldpanel
UK Grocery Volume (Packs) Growth by Price BandConsumers in the UK continue to trade down to cheaper products. We see an increase in budget products this year which accounts for over a quarter of UK grocery sales
26
22
32
12
9
Share
SuperPremium
Premium
Good
Standard
Budget
Growth in Grocery sales (Packs)
0.6
3.6
4.5
-4.9
2.4
1.0
-6.0
-4.0
-2.0
0.0
2.0
4.0
6.0
AllPurchases
Budget Standard Good Premium SuperPremium
Change in sales Share of sales
12 W/e 25 Dec 11

© Kantar Worldpanel
Grocery Volume (Packs) Growth by Private Label TierBudget Private label also shows growth while branded products fall back
43.5
2
41.8
6.35
Share
Budget PL
Standard PL
Premium PL
Branded
Growth in Grocery sales (Packs)
0.6
-0.7
3.6
0.4
5.8
-2.00E+00
-1.00E+00
0.00E+00
1.00E+00
2.00E+00
3.00E+00
4.00E+00
5.00E+00
6.00E+00
7.00E+00
AllPurchases
Branded PremiumPL
StandardPL
Budget PL
Change in sales Share of sales
12 W/e 25 Dec 11