yield displacement profiles of asymmetric structures for ...files.aspete.gr/archimedes/y8/paradoteo...
TRANSCRIPT
Structural Engineering and Mechanics, Vol. 45, No.2 (2013) 233-257 233
Yield displacement profiles of asymmetric structures for optimum torsional response
George K. Georgoussis
Department of Civil and Construction Engineering, School of Pedagogical and Technological Education
(ASPETE), N. Heraklion 14121, Attica, Greece
(Received October 3, 2012, Revised December 1, 2012, Accepted December 15, 2012)
Abstract. Given the yield shear of a single-story inelastic structure with simple eccentricity, the problem of strength distribution among the resisting elements is investigated, with respect to minimize its torsional response during a ground motion. Making the hypothesis that the peak accelerations, of both modes of vibration, are determined from the inelastic acceleration spectrum, and assuming further that a peak response quantity is obtained by an appropriate combination rule (square root of sum of squares-SRSS or complete quadratic combination-CQC), the first aim of this study is to present an interaction relationship between the yield shear and the maximum torque that may be developed in such systems. It is shown that this torque may be developed, with equal probability, in both directions (clockwise and anticlockwise), but as it is not concurrent with the yield shear, a rational design should be based on a combination of the yield shear with a fraction of the peak torque. The second aim is to examine the response of such model structures under characteristic ground motions. These models provide a rather small peak rotation and code provisions that are based on such principles (NBCC-1995, UBC-1994, EAK-2000, NZS-1992) are superiors to EC8 (1993) and to systems with a stiffness proportional strength distribution.
Keywords: eccentric structures; modal analysis; inelastic spectra
1. Introduction
One of the major tasks of the practicing engineer during a structural design, after the design base shear has been determined, is to distribute this force among the resisting elements that provide the lateral resistance of the given structure. In general terms, seismic codes require that the design base shear should be determined from the acceleration design spectrum in relation to the fundamental period, T, of the structure, reduced by a suitable modification (behavior) factor. The accurate evaluation of T is not however required, but only an estimate of its value, which is usually taken as the fundamental period of the symmetrical counterpart structure. A common formula to determine the design (yield) shear, in respect to the mass, M, of the structure, is as follows
yy MAq
MAF (1)
Corresponding author, Professor, E-mail: [email protected]

George K. Georgoussis
in which A is the effective acceleration given by the elastic design (acceleration) spectrum and q the behavior factor. A typical elastic acceleration spectrum is shown in Fig. 1. In the acceleration sensitive region and particularly in the period interval between T1 and T2 the spectrum is flat and amplified by the factor αΑ. For periods shorter than T1 it is linear and it has a hyperbolic shape for periods higher than T2. The characteristic periods T1 and T2, together with the acceleration amplification factor αΑ are country specified parameters, and an inelastic spectrum may be obtained from Eq. (1). Such a spectrum, in a simplified form consisting of two branches (flat-hyperbolic spectrum) is also shown in the aforementioned figure. Ay may be defined now as the effective acceleration given from the inelastic spectrum.
Structures designed with 1q are expected to remain essentially elastic in the event of a strong earthquake, but structures designed with a reduced strength, corresponding to q=3 or 4, are expected to sustain significant inelastic deformations when subjected to such ground excitations. Note here that the concept of introducing the q factor is based on studies concerning the behavior of single degree of freedom (SDOF) inelastic structures (Newmark and Riddell 1979, Chopra 2007).
Fig. 1 Typical elastic and inelastic spectra
Once the base shear Fy has been established, the general trend to specify the design
strength of the various resisting elements (frames) is to apply the principles of a static (elastic) design. That is, the guidelines for strength assignment are stiffness dependant. Considering that the stiffnesses of all resisting elements are known in advance from the overall dimensions of the members that constitute a particular frame (element), its strength is determined from the static equilibrium of the system under the action of a horizontal force equal to Fy. This force, as an inertia force may be considered to be applied through the center of mass (CM), but in asymmetric structures its location should be modified to account for magnified torsional moments which may be developed during a ground
234

Yield displacement profiles of asymmetric structures for optimum torsional response
motion. This is because of the translational-torsional coupling in unbalanced systems that may lead to an excessive torsional response. Modern seismic codes require that the design shear force be applied eccentrically to CM, at a distance, measured from the center of stiffness (CS), given by the following pair of equations
bee sd 1 (2a)
bee sd 2 (2b)
where es is the eccentricity of CM from CS, b is the dimension of the building perpendicular to the direction of the ground motion, and α, β and δ are specified coefficients.
Neglecting the last part of the right hand side of the design eccentricities above, which represents an accidental eccentricity (due to stiffness uncertainties, possible torsional ground motion and an unfavorable distribution of live load mass), it may be seen that a coefficient 1 , accounts for amplified torsional moments and determines the strength in elements on the flexible side of the structure, while a coefficient 1 is critical for assessing the strength in elements on the stiff side of the structure (Zhu and Tso 1992, Tso and Zhu 1992). However, there are controversies about these coefficients and different country codes provide different values for them. For example, the National Building Code of Canada (NBCC 1995) and the Greek Aseismic Code (EAK 2000) specify α = 1.5, δ = 0.5. Other codes, such as the Uniform Building Code (UBC 1994) and the New Zealand Standard (NZS 1992) require α = δ = 1.0, while Eurocode 8 (EC8 1993) amplifies the first of Eq. (1), i.e.: edi = es + eo, ed2 = es, , where the additional eccentricity eo is determined as the least value of two specified expressions, as shown in the Appendix. It is evident that although the combined use of the design eccentricities may lead to a total strength higher than the design lateral force Fy, as the strength demand of each element is decided by the most unfavorable loading eccentricity, is not clear which design procedure guarantees a sound performance in inelastic systems which are expected to be deformed well into the post-elastic range during a strong ground excitation. The problem has been the subject of many research papers, which include systems with conventional elements having strength independent stiffness (e.g., Goel and Chopra 1990, 1991, Tso and Ying 1990, Tso and Zhu 1992, Chandler and Duan 1997, Stathopoulos and Anagnostopoulos 2003, 2005) and, also, when the stiffness of the lateral force resisting elements is strength dependent (Myslimaj and Tso 2002, 2005a, Tso and Myslimaj 2003).
There are two parameters that are of particular interest in the response of inelastic structures (Paulay 2005, Myslimaj and Tso 2005b). The first is to minimize the deck rotation and hence the peak displacements at the edges of the system parallel to the direction of the ground motion. Although a peak edge displacement is not necessarily related with the maximum rotation sustained by the system, the deck rotation is the fundamental parameter that denotes the severity of torsional response. As stated by Myslimaj and Tso (2004, 2005b) zero peak rotation implies translational response, while a structure which undergoes a small rotation would be less susceptible to torsional damage.
235

George K. Georgoussis
All other commonly used parameters to measure torsional effects (edge displacements, element ductility factors) are derived parameters caused by rotations.
The second parameter is the ductility demand in the resisting elements that provide the lateral resistance of a given structure. When elements with different yield displacements are used, it is not the maximum edge displacement that determines the maximum element ductility factor. Peak displacements and the corresponding ductility factors should be determined for all resisting elements and is important for the practicing engineer to have a clear view about the displacement ductility demands of the most stressed elements. The objective of having similar (and of acceptable magnitude) ductility factors at the edge elements, together with minimum torsional response, as outlined above, is not however feasible (Myslimaj and Tso 2004, 2005b). The practicing engineer must choose which parameter is the most important in a design situation.
The first aim of this study is to provide a methodology for assessing the peak torsional moment in eccentric inelastic systems subjected to strong ground motions. The basic assumptions at this stage are two: (i) the peak of the effective accelerations (yield accelerations) of all modes of vibration of an eccentric system are evaluated from the inelastic acceleration spectrum. This allows a direct evaluation of the peak modal values of shear and torque, in a similar manner as the maximum shear is obtained in single degree of freedom (SDOF) inelastic systems. (ii) The modal peaks of shear and torque are combined by an appropriate combination rule (SRSS or CQC), as in elastic systems, to provide the probable peak values of shear and torsional moment. This assumption is based on the suggestions of recent studies (Chopra and Goel 2002, 2004, Chopra 2007, Kunnath 2004) that modal peaks of inelastic systems can be combined in such a way with reasonable accuracy. It is shown that the probable peak torque may develop, with equal probability, in both directions (clockwise and anticlockwise) and that this torque and the peak shear force are not concurrent since they are evaluated by a combination rule. Consequently, in systems in which all elements are expected to be deformed beyond their yield limits and therefore the peak shear force is equal to the yield shear, it is appropriate to combine the latter shear with a fraction of the expected peak torque (or the corresponding peak plastic eccentricity, defined as the ratio of the expected peak torque to the yield shear). The second aim of this study is to provide numerical results which demonstrate that simple structural models detailed according to the proposed methodology produce relatively small peak rotations and code provisions that are based on such principles (NBCC-1995, UBC-1994, EAK-2000, NZS-1992) are superiors to EC8 (1993) and to systems with a stiffness proportional strength distribution.
The systems analyzed by the computer program SAP2000-V11 are one-story monosymmetric systems, composed by three inelastic resisting elements, subjected to the El-Centro 1940 and Kobe 1995 types of motion, at different ground intensities. These model systems have been extensively used in past (Bozorgnia and Tso 1986, Tso and Bozorgnia 1986, Tso and Ying 1990, Georgoussis 2008, Chandler and Duan 1991) for similar analyses. The elements that provide the lateral resistance of the analyzed systems are assumed elastoplastic and as they are representative of multi-member assemblies
236

Yield displacement profiles of asymmetric structures for optimum torsional response
(multi-bay frames, wall-frame assemblies) their initial (elastic) stiffness is considered independent of the assigned strength. Undoubtedly, in reinforced concrete structures the element stiffness is strength dependant (Priestley 1993, Paulay 1998), but such an issue is beyond the scope of the present work. Therefore, it is assumed that the initial stiffness of each resisting element is determined form the cross sections of the members that constitute the particular bent, as is recommended by most of the building codes. 2. Symmetrical system comsiderations
Consider a simple symmetric single-story building structure, like that one shown in Fig. 2(a), which is subjected to a ground motion (purely translatory) perpendicular to the x-axis of symmetry. The structural model consists of a rigid slab (deck) with a uniform mass intensity, supported by three resisting elements in the y-direction, in a symmetrical configuration in respect to CM, but with uneven stiffnesses. To simplify the analysis described below, elements ‘m’ (on the left edge) and ‘r’ (on the right edge) are assumed identical, while element ‘l’ (located at CM) is considered with higher stiffness. The stiffness in the x-direction is provided by resisting elements (not shown in this figure), aligned along the x-axis. An asymmetric counterpart of this structure may be obtained simply by interchanging the location of elements ‘l’ and ‘m’, as shown in Fig. 3(a). Assuming an elastic response of the former system when it is subject to a ground motion, the lateral displacements of all points of the deck which lie along the x-axis of symmetry, at any time instant, will be a pure translation of this axis along the direction of the ground motion. This is because of the in-plane rigidity of the floor slab, which makes the assumed single story symmetrical structure to respond as a SDOF system. Therefore, a design procedure which defines the yield displacement of all elements to be equal to each other (Fig. 2(b)), simply transforms the elastic SDOF system to an elastoplastic one and the benefits of this strength detailing are that all aspects of the structural response (displacements, ductility factors, internal element forces) may be determined from the dynamic behavior of a simple elastoplastic SDOF system. The response of this system is quite predictable and the main reason for this is that the element yield displacement profile is properly selected. It satisfies engineering judgment that symmetry must be maintained in element yield displacements, since, any other yield pattern with unequal element yield displacements will make the structure of Fig. 2(a) a torsionally unbalanced system with unpredictable behavior, when it enters the inelastic phase. Alternatively, the aforesaid uniform yield displacement profile may be assumed that is derived from the following condition: to ensure the translational response of the system (which means that no torsional moments should be allowed to develop in the event of a ground motion), the element resisting forces must be in static equilibrium with a lateral inertia force generated at CM. If the maximum value of this force is taken equal to Fy (computed on the grounds of the inelastic response spectrum of Fig. 1), the static equilibrium of the deck provides the element strengths and the corresponding yield profile.
237

George K. Georgoussis
CM
'r '
b
x
y
(a)F y
'm ' 'l'
U
U y
Fy
F
Element 'l'
Elements 'm ','r '
System Curve
(b)
c
Maximum dynamicresponse envelope
Fig. 2 (a) Symmetrical system; (b) Force-displacement diagrams
of the complete structure and the individual elements 3. Dynamic torsion in eccentric systems
Similar considerations can not be easily made for eccentric inelastic structures, as the structural model of Fig. 3(a), where the element of higher stiffness is located at the left edge. To select, just by engineering judgment, a yield displacement profile which ensures minimum rotation is a difficult task, since the oscillatory response of the system is inevitable, at least at the initial stages of the ground motion, when all elements are stressed below their limits. However, some ideas may be taken by consideration of the response of the symmetrical system shown in Fig. 2. The element yield displacement profile was assessed from the static equilibrium of the deck when only an inertia force is developed at CM. In the case of an asymmetric system, where dynamic oscillation is inevitable, some sort of torsion should be taken into account and some further ideas can be taken from the elastic behavior of these systems. If the response of such a system was unlimited elastic, an appropriate element strength assignment would require an assessment of the probable peak values of shear and torque that may develop at CM during a ground motion. Modal analysis is a useful tool to make such an assessment and although the aforementioned peak resultant forces are not concurrent and therefore a direct combination of them is unrealistic, it worth’s mentioning that there is a unique interaction relationship between these forces, as it was first demonstrated by Kan and Chopra (1977), which is helpful to make a more reasonable combination of them. The reason for mentioning these features of dynamic coupling of linear eccentric systems is that a similar interaction relationship may be derived for inelastic structures on the grounds of two hypotheses:
(i) The peaks of the effective accelerations (yield accelerations) of all modes of vibration of an eccentric system may be determined from the inelastic acceleration spectrum of Fig. 1. This allows a direct evaluation of the peak modal values of shear
238

Yield displacement profiles of asymmetric structures for optimum torsional response
and torque, in a similar manner as the maximum shear is obtained in SDOF inelastic systems. It is reminded here that the concept of the inelastic acceleration spectrum for SDOF inelastic systems is well established, but its use in multi-degree-of-freedom (MDOF) systems with inelastic elements represents an approximation with no firm theoretical background. There is however, an increased tendency to estimate the seismic demands of MDOF inelastic structures from the modal contributions, as described below. (ii) The modal peaks of shear and torque are combined by an appropriate combination rule (SRSS or CQC), as in elastic systems, to provide the probable peak values of shear and torsional moment. This assumption is based on the suggestions of recent studies (Chopra and Goel 2002, 2004, Chopra 2007, Kunnath 2004) that modal peaks of MDOF inelastic systems can be combined in such a way with reasonable accuracy.
CM
Ground accelerationalong the y-direction
'l' 'm' 'r'
N1 N2
CS
e
N1
N2
D1
N2N1
D2
x
y
Fe1e1
d
e2=e1e2=e1
(a)
(b)
(c)
1
F2
c
b
stiff side flexible side
Fig. 3 (a) Three element eccentric system; (b) first mode elastic displacement
profile; (c) second mode elastic displacement profile
239
George K. Georgoussis
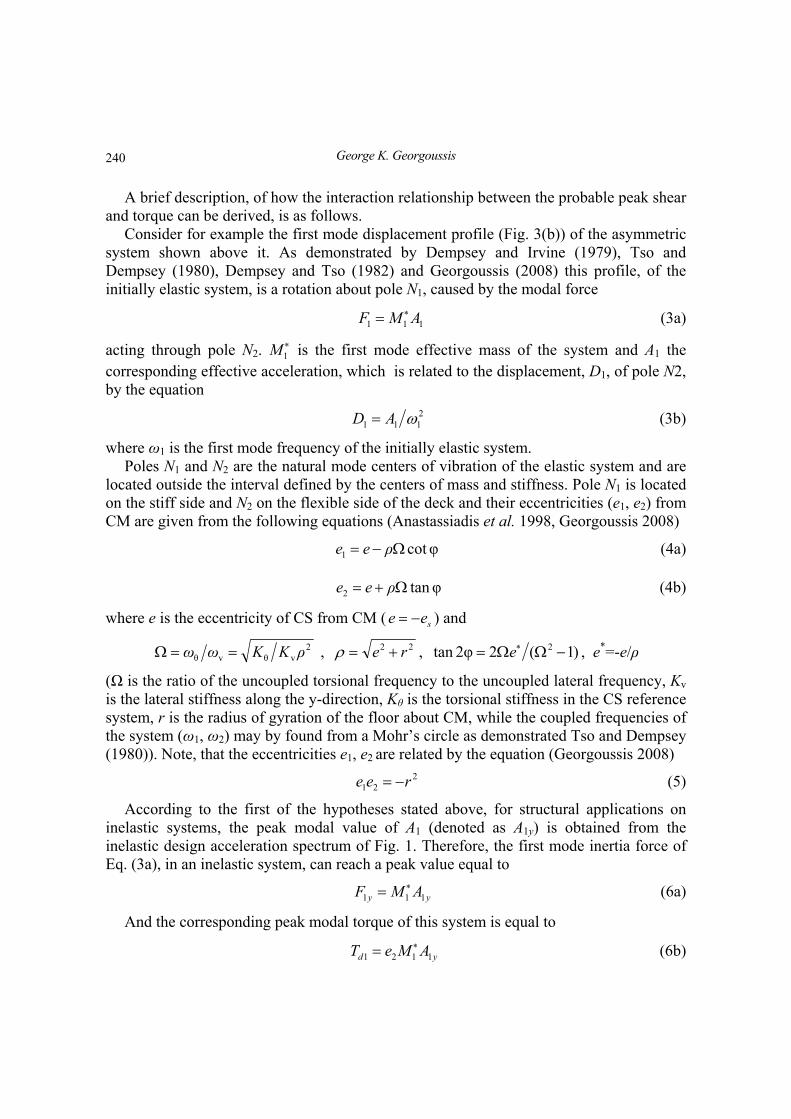
A brief description, of how the interaction relationship between the probable peak shear and torque can be derived, is as follows.
Consider for example the first mode displacement profile (Fig. 3(b)) of the asymmetric system shown above it. As demonstrated by Dempsey and Irvine (1979), Tso and Dempsey (1980), Dempsey and Tso (1982) and Georgoussis (2008) this profile, of the initially elastic system, is a rotation about pole N1, caused by the modal force
111 AMF (3a)
acting through pole N2. 1M is the first mode effective mass of the system and A1 the
corresponding effective acceleration, which is related to the displacement, D1, of pole N2, by the equation
2111 AD (3b)
where ω1 is the first mode frequency of the initially elastic system. Poles N1 and N2 are the natural mode centers of vibration of the elastic system and are
located outside the interval defined by the centers of mass and stiffness. Pole N1 is located on the stiff side and N2 on the flexible side of the deck and their eccentricities (e1, e2) from CM are given from the following equations (Anastassiadis et al. 1998, Georgoussis 2008)
φcot1 ρee (4a)
φtan2 ρee (4b)
where e is the eccentricity of CS from CM ( see ) and
2vθvθ ρKKωω , 22 re , )1(2φ2tan 2 e , e*=-e/ρ
(Ω is the ratio of the uncoupled torsional frequency to the uncoupled lateral frequency, Kv is the lateral stiffness along the y-direction, Kθ is the torsional stiffness in the CS reference system, r is the radius of gyration of the floor about CM, while the coupled frequencies of the system (ω1, ω2) may by found from a Mohr’s circle as demonstrated Tso and Dempsey (1980)). Note, that the eccentricities e1, e2 are related by the equation (Georgoussis 2008)
221 ree (5)
According to the first of the hypotheses stated above, for structural applications on inelastic systems, the peak modal value of A1 (denoted as A1y) is obtained from the inelastic design acceleration spectrum of Fig. 1. Therefore, the first mode inertia force of Eq. (3a), in an inelastic system, can reach a peak value equal to
yy AMF 111 (6a)
And the corresponding peak modal torque of this system is equal to
yd AMeT 1121 (6b)
240

Yield displacement profiles of asymmetric structures for optimum torsional response
Similarly, the second mode displacement profile is a rotation about N2, caused by the following modal force, acting through N1 (Fig. 3(c))
222 AMF (7a)
where 2M is the second mode effective mass of the system and A2 the corresponding
effective acceleration. This acceleration produces a displacement, D2, of pole N1, which can be determined by a relationship similar to Eq. (3b), i.e.
2222 AD (7b)
As for the first mode, the second mode peak inertia forces (shear and torque) for an inelastic system will be equal to
yy AMF 222 (8a)
yd AMeT 2212 (8b)
According to the second hypothesis stated above, a reasonable estimate of the probable maximum shear may be obtained by an appropriate combination of the peak modal forces of Eqs. (6a) and (8a) and the same procedure can be applied to the modal torques of Eqs. (6b) and (8b). Applying the CQC rule, the expected maximum values of the aforementioned resultant forces are
)1(2 21221
22
21 yyyyoy FFFFF , )1(2 2
122122
21 ddddd TTTTT (9)
Note that ε12 is the correlation coefficient (Kan and Chopra 1977, Chopra 2007) and the product Td1Td2 in the second of the equations above is negative, since the modal torques Td1 and Td2 are opposing each other (the distance e1 in the reference system shown in Fig. 3 is a negative quantity). Assuming further, that the modal yield accelerations correspond to either the flat region (A1y = A2y = Ay) or the hyperbolic part (A1y/ω1 = A2y/ω2 = Ay/ωv) of the assumed inelastic acceleration spectrum of Fig. 1, and recalling that the modal masses
1M and 2M (Georgoussis 2008) may be expressed as
MdeMM )(cos)( 122
1v1 , MdeΜM )(sin)( 222
2v2 (10)
where d ( cossin12 ee ) is the distance between the nodes N2 and N1, and M is the mass of the system, a simple combination of Eqs. (5), (6a), (6b), (8a), (8b) and (10) results to the following interaction relationship
122 dy TF (11)
where: vydyddyoyyoyy ,rMA/TrF/TT,MA/FF/FF is the frequency of the
symmetrical counterpart system and Ay is the corresponding spectral acceleration, which appears in Eq. (1).
241

George K. Georgoussis
It is interesting to note that the modal static response of Td1 (represented by the quantity 12Me ) is equal and opposite to that of Td2 (represented by the quantity
21Me ) and this permits a physical interpretation about the directional nature of the total dynamic torque given by the second of Eq. (9). It is evident that in systems with closely spaced coupled frequencies, the expected maximum torsional moment may act, with equal probability, in both directions (clockwise and anticlockwise). Therefore, when an element strength assignment is attempted towards a minimal torsional response in the event of a ground motion, the dynamic torsional moment Td should be taken into account in either direction (clockwise and anticlockwise). 4. Yield profiles of eccentric inelastic systems
The interaction relationship expressed by Eq. (11) may be seen as a yield surface (De la Llera and Chopra 1995) which correlates the expected peak normalized values of base shear and torque, but as these resultant forces are not concurrent, a direct combination of them is unrealistic.
Therefore, in inelastic systems, where plasticity is expected to spread to all resisting elements during a strong ground motion (which means that at some time instant the shear force resisted by these elements will be equal to the design shear Fy), it is reasonable to assume that an appropriate combination of the peaks of the resultant forces is in fact a combination of Fy with a fraction of Td. The ratio ep = Td/Fy represents the peak plastic eccentricity of the system (that is, the eccentricity when all elements in the direction of the ground motion are assumed to be displaced into the inelastic region) and for the requirements of an element strength assignment, a fraction of it may be assumed that represents the dynamic eccentricity of the system. That is, the eccentricity
ydpd FTee (with λ<1 and algebraic signs) in respect to CM, may be considered
as the dynamic eccentricity which accounts for the magnified torsional effects that may be developed in the event of a ground motion. In elastic systems, it is customary to express
(a)
0
0.25
0.5
0.75
1
1.25
1.5
0.8 0.9 1 1.1 1.2 1.3 1.4
1.0se
2.0
3.0
5.0
8.0
de(b)
0
0.25
0.5
0.75
1
1.25
1.5
0.8 0.9 1 1.1 1.2 1.3 1.4
1.0se
2.03.0
5.0
8.0
de
Fig. 4 Normalized dynamic eccentricities (λ = 0.25) for (a) flat spectrum; (b) hyperbolic spectrum
242

Yield displacement profiles of asymmetric structures for optimum torsional response
this eccentricity in terms of the static eccentricity, and this trend is followed in this paper, although the CS is not an invariant point in inelastic systems. The variation of the normalized dynamic eccentricity
)( sydsdd eFTeee (12)
in relation to the normalized static eccentricities ree ss and the ratio Ω is shown in Fig.
4, for λ = 0.25. The curves of this figure have been drawn by assuming that the yield modal accelerations correspond, first, to the flat region of the acceleration spectrum and, also, to the hyperbolic part of this spectrum and that the damping ratio equals 5% for both modes of vibration. As can be seen, there is not much difference between the two sets of curves, and for normalized static eccentricities ree ss higher than 0.3, the
corresponding dynamic eccentricity de is almost a constant value, not affected by the ratio
of the uncoupled frequencies Ω. Only in cases where the static eccentricity se receives
values smaller than 0.2 and the ratio Ω is close to unity there is a remarkable amplification of de . At this point, the problem is what values of λ produce the displacement profile of
minimum torsional response, but prior to that lets examine the shape of this profile for a given value of λ (or de ).
The yield displacement profile of a system which is subjected to a horizontal force Fy, at an eccentricity from CM equal to sdd eee , is determined from the element strengths,
which are as follows
yfjdfjo
fj FxeK
K
K
Kf
~1 1
θ
v
v
ysjdsjo
sj FxeK
K
K
Kf
~1 2
θ
v
v
(13)
where the subscripts fj and sj denote the ‘j’ elements on the flexural and stiff side respectively and fjx~ , sjx~ are their x-coordinates in the CS reference system. As stated
above, the concept of CS is meaningless in inelastic systems, but its use provides the element strengths with the same simplicity as in linear systems. The eccentricities ed1 and ed2, shown in Eq. (13), are equal to
)1(1 dsd eee )1(2 dsd eee (14)
and it is evident that when the normalized dynamic eccentricity is taken equal to 5.0de ,
this is equivalent of applying the provisions of the National Building Code of Canada (NBCC 1995) or the Greek Aseismic Code (EAK 2000). If 0de , that is when the
dynamic coupling is ignored, then the structural design follows the provisions of the Uniform Building Code (UBC 1994) or the New Zealand Standards (NZS 1992).
The use of Eq. (13) implies that the assumed structure is over-strengthened, since
yo
sjofj
oy FffF )( (15)
243

George K. Georgoussis
Therefore the assumed strength assignment provides an over-strength factor:
yo
yo
y FFF , which is increasing with increasing values of de . In the parametric analysis
that follows in the next section, where the response of inelastic structures with different element strengths is examined under strong ground motions, the proposed strength assignment of Eq. (13) is modified as
oy
ofjfj Fff / , o
yo
sjsj Fff / (16)
in order to keep the sum of the element strengths equal to Fy (= )( sjfj ff ) and therefore
to have a common basis for comparison reasons. The corresponding element yield displacements, in terms of the yield displacement Uy of the symmetrical counterpart system (Fig. 2) which is equal to
vKFU yy (17)
are as follows
oy
yfjdfjy F
Uxe
K
KU
~1 1
θ
v , o
y
ysjdsjy F
Uxe
K
KU
~1 2
θ
v (18)
As can be seen the shape of the element yield displacement profile, given by Eq. (18), has a concave form which depends on coefficient λ of Eq. (12). The normalized eccentricity de is linearly dependant on λ and when 0de (i.e.: λ = 0) this profile has a
linear form, but it becomes increasingly concave with increasing values of de (such
profiles, in a graphical form, are shown further below for the case of one of the analyzed systems). There is no criterion of how to select the optimum value of de which provides
minimum torsional response. For this reason, in the study that follows, four distinct values of the normalized eccentricity de will be examined: 0.0, 0.5, 2.0, and 4.0. 5. Systems analyzed
In order to evaluate how the torsional response is affected by the aforesaid element yield displacement profiles, a number of analyses is carried out on three element stiffness eccentric structural models which represent from torsional stiff to torsionally flexible systems. The first model (Model 1 in Fig. 5) is a torsionally stiff system, which has a ratio of the uncoupled torsional frequency to the uncoupled lateral frequency equal to Ω = 1.273. It consists of a rigid rectangular deck (b = 10 m, c = 5 m) with a uniformly distributed mass, supported by three elements in the y-direction of the ground excitation. The x-direction elements are assumed to be located along the axis of symmetry and as they do not contribute to the torsional resistance are not shown in this figure. Element ‘m’ is located at CM and the other two at a distance b/2 on either side of CM. Elements ‘m’ and
244

Yield displacement profiles of asymmetric structures for optimum torsional response
‘r’ are identical, but the stiffness of element ‘l’ is higher by 30% providing a normalized stiffness eccentricity equal to e/r = -0.14. This eccentricity corresponds to a ratio e/b equal to -0.045 and provides coupled frequencies (Georgoussis 2008) equal to: ω1 = 0.986 ωv and ω2 = 1.303 ωv, where ωv is the lateral frequency, in the y-direction, of the uncoupled system (the symmetrical counterpart structure). This type of three element stiffness eccentric structure is the most commonly used model in inelastic analyses (Chandler et al. 1996). The second model (Model 2 in Fig. 5) is similar to the first, but the outer resisting elements are closer to CM at a distance equal to 0.4b. The ratio of uncoupled frequencies is equal to Ω = 1.021, the normalized stiffness eccentricity e/r = -0.112 (e/b = -0.036), and the coupled frequencies are equal to ω1 = 0.957 ωv and ω2 = 1.073 ωv. This model is very susceptible to torsional oscillations since not only the normalized eccentricity is rather small, but also the ratio Ω is approximately equal to unity (Tso and Dempsey 1980) and for this reason it has been extensively used in the past (Bozorgnia and Tso 1986, Tso and Bozorgnia 1986, Tso and Ying 1990, Georgoussis 2008). Similar is the third model (Model 3 in Fig. 5), in which the outer elements are even closer to CM at a distance 0.35b.
CM
'l' 'm' 'r'
b=10m
y
'l' 'm' 'r'
'l' 'm' 'r'
0.8b
0.7b
c=5m
Model 1
Model 2
Model 3
Fig. 5 Plan configurations of analyzed model structures
245

George K. Georgoussis
The ratio of uncoupled frequencies is equal to Ω = 0.895 now, representing a torsionally flexible system. The normalized stiffness eccentricity is equal to e/r = -0.098 (e/b = -0.032) and the coupled frequencies are equal to ω1 = 0.88 ωv and ω2 = 1.021 ωv.
Two different types of each model structure are examined. In the first type (Models 1a, 2a and 3a) elements ‘m’ and ‘r’ are moment resisting frames composed by two 50 × 50 cm columns of a height equal to 7.5 m, located in a distance of 5 m and connected by completely rigid beams (shear-beam elements). Similar is the ‘l’ element, but its columns are wider 65 × 50 cm to provide the increased stiffness. In the second type (Models 1b, 2b and 3b) the columns of elements ‘m’ and ‘r’ are of a section 35 × 35 cm, while those of element ‘l’ are 45.5 × 35 cm. In all cases, the total gravity load of the slab is equal to W = 600kN and the modulus of elasticity was assumed equal to E = 20 × 106 kN/m2. The lateral period of the corresponding uncoupled structure of the first type of models (Models 1a, 2a and 3a) is equal to 0.351s, representing a structural system which corresponds to the acceleration sensitive region of the design spectrum. Models 1a, 2a and 3a will also be referred as short period systems. Similarly, for the second type of structures (Models 1b, 2b and 3b) the lateral period of the uncoupled system is equal to 0.717s, which denotes a system in the velocity-displacement sensitive region of the response spectrum. These models will be referred as long period systems. All model structures are designed to withstand elastically a total shear force equal to Fy = 0.2W, chosen as a typical design load for structures in seismic active regions.
The torsional response of each of the aforementioned models (Models 1a, 2a, 3a and 1b, 2b, 3b) is examined for six different yield displacement profiles. All the element yield displacements have been computed from Eq. (18), on the grounds of the eccentricities of Eq (2), but neglecting the accidental part ( b ) of these equations. In the first four profiles (SEq, Code, Opt2 and Opt4) the design eccentricities ed1 and ed2 are based on Eq. (14), where the normalized eccentricity de is taking the distinct values: 0.0, 0.5, 2.0, and
4.0 respectively. The next two profiles are, first, the stiffness proportional (StP) profile, which simply assumes that the design force Fy is applied through the CS ( 021 dd ee )
and, second, the profile (EC8) defined by the provisions of Eurocode 8 (1993). That is, by assuming that osd eee 1 and sd ee 2 , where the additional eccentricity eo is determined
as the least value of two specified expressions, as shown in the Appendix. The above element yield displacement profiles, normalized in respect to the yield displacement of the corresponding symmetrical system are shown in Fig. 6 for the case of Model1a. Similar are the profiles for the other model structures.
To evaluate the response of the assumed models under different ground motion, two different types of earthquake shocks are used. The first record is the 1940 El Centro NS component, which represents a moderately long irregular motion and is associated with moderate distances from the focus. The second record is the 1995 Kobe KJM000 component, which is considered representative of near-field earthquake ground motions. The time histories of these records are shown in Fig. 7, together with the associated 5% damped acceleration spectra. Since the presence of transverse elements that may contribute to the torsional resistance of the assumed systems has been excluded in this study
246

Yield displacement profiles of asymmetric structures for optimum torsional response
0.7
1
1.3
0 5 10
StP
SEq
EC8
Opt4
Opt2
Code
yry UUymy UUyly UU
frame l'' frame m'' frame r''
Fig. 6 Element yield displacement profiles for Model 1a
Fig. 7 (a) 1940 El Centro NS component and its 5% damped acceleration spectrum; (b) 1995 Kobe KJM000 component and its 5% damped acceleration spectrum
247

George K. Georgoussis
all the analyses have been performed by assuming unidirectional ground motion excitations. In fact, there is experimental evidence that the use of building models with only lateral resisting elements, subjected to unidirectional ground motions, provide acceptably conservative but accurate results (Correnza et al. 1994). By excluding traverse elements is easier to specify and qualify the parameters that play a key role in the torsional response of eccentric systems. On the other hand, the inclusion of transverse elements requires additional modeling assumptions to be made in the structural definition, such as the specification of total transverse stiffness and strength and their distributions, the location of the transverse elements, and the strength of the transverse earthquake component, if it is applied (Chandler et al. 1996).
The effect of the behavior factor q (Eq. (1)), is examined via an indirect method. Since all the analyzed model structures are designed to withstand a design force equal to Fy = 0.2W, two levels of excitation are considered in the present study. In the first level the motion input, of both records, was scaled to peak ground acceleration (PGA) equal to 0.3g, which is considered as a fairly moderate intensity. As the extent of the element inelastic behavior is increasing at higher intensities of ground motions, a higher intensity of PGA, but not unrealistic, equal to 0.7g was also considered in the present study.
All dynamic analyses are carried out by assuming that the element shear force-displacement relationships are bilinear with a post-yielding stiffness ratio equal to 0.1% (essentially elasto-plastic elements). The three lateral load resisting elements are considered mass-less with in-plane stiffness and the frame deflections are caused by shearing action. The out-of-plane stiffness of the elements is considered negligible, and as infinitely rigid beams are assumed to connect their columns at the level of the slab, the inelastic behavior of each load resisting element was modeled by means of plastic hinges forming at the ends of each column. The analyses were performed by means of the program SAP2000-V11, using inelastic link elements at the ends of the column members.
As the slab rotation is considered the major response parameter to represent the severity of the torsional response of eccentric systems, the peak rotations of all the model structures are shown in Fig. 8. Curves denoted as ‘Elc.3’ (thin solid lines) and ‘Ko.3’(thin dotted lines) provide the results of the analyses when the input motions of the aforesaid El Centro and Kobe earthquake records are scaled to a PGA equal to 0.3g. Similar is the meaning of curves denoted as ‘Elc.7’ (thick solid lines) and ‘Ko.7’ (thick dotted lines). They represent results of analyses with these records scaled to a PGA equal to 0.7g. The curves of Fig. 8 reveal two particular features. The first is that the StP and EC8 element yield displacement profiles provide, in general, higher rotations compared with the other profiles, which are based on the interaction relationship of Eq. (11). The StP profile is obtained simply by assuming that the resultant force Fy is applied through CS. This means that it is a uniform profile (Fig. 6) resulting in a centre of strength (usually called center of plasticity (CP)) which coincides with CS (on the left of CM). It is reminded here that the eccentricity of CS from CM (normalized in respect to the dimension of the building perpendicular to the direction of the ground motion, b) is equal to e/b = -0.045, -0.036 and -0.032 for the model structures 1, 2 and 3 respectively. Therefore these values represent
248

Yield displacement profiles of asymmetric structures for optimum torsional response
Fig. 8 Peak rotations of the analyzed model structures
249

George K. Georgoussis
the normalized eccentricities, ev/b, of CP (measured from CM) for the case of the StP profile. On the other hand the EC8 profile, although it has a concave form (Fig. 6) as the element strength assignment is based on the most unfavorable loading eccentricity ( osd eee 1 and sd ee 2 , where eo is equal to 0.101b, 0.90b and 0.084b for Models 1, 2
and 3 respectively), provides a center of strength located on the right of CM, at a normalized eccentricity, ev/b, equal to 0.044, 0.038 and 0.036 for Models 1, 2 and 3 respectively. It can be seen that the latter eccentricities, are almost symmetrical to those of CS in respect to CM. It is interesting to compare the eccentricities of CP of the aforementioned profiles with those given by the rest of the profiles examined in this study. These profiles (SEq, Code, Opt2 and Opt4) are shown in Fig. 6 for the case of Model 1, and their strength eccentricity is very close to CM. In particular, for Model 1, the normalized eccentricity, ev/b, is equal to 0.0, -0.001, -0.003 and -0.005 for the profiles SEq, Code, Opt2 and Opt4, respectively. For Model 2, the above eccentricities are equal to 0.0, -0.0007, -.0024 and -0.0042, while for Model 3 the corresponding eccentricities ev/b are 0.0, -0.0006, -0.0021 and -0.0037. Profile SEq is based on a zero dynamic eccentricity
de (Eq. (14)) and is a linear profile, which always provides a value of ev/b equal to zero.
On the other hand the Code, Opt2 and Opt4 profiles are based on increasing values of de
(specifically 0.5, 2.0 and 4.0) and have a concave form with increasing concavity when de
obtains higher values. The reason that the location of CP is on the left of CM (ev/b is a negative number in the case of Code, Opt2 and Opt4 profiles) is because there are two resisting elements on the right of CS and just one element on its left side. In a similar structural configuration, but with two elements on the left of CS and one element on its right side, the location of CP would be on the right of CM, but again in a very close distance. The second feature of the curves of Fig. 8 is that the rotational response of all the structural Models detailed according to the SEq, Code, Opt2 and Opt4 profiles is presenting an almost constant peak rotation, for each type of excitation. Besides, this rotation is also, in most of the cases, the smaller value presented by the analyzed systems. In other words, if the dynamic eccentricity is taken into account symmetrically to CM in a stiffness eccentric system, its peak rotation is not only relatively small, but also is not much affected by the magnitude of the dynamic eccentricity. This finding has a useful consequence: the dynamic eccentricity can be easily incorporated into the accidental eccentricity, since the latter is always taken into account symmetrically to CM, i.e.: b . From this point of view is not surprising that when the element strength assignment is based on the elastic response of an eccentric system, the inclusion of the accidental eccentricity improves its performance (Wong and Tso 1994).
The normalized peak edge displacements (mean values from the four input motions)
oUUU max are shown in Fig. 9 (Uo is the maximum displacement of the symmetrical
counterpart system). For most of the profiles of the short period structures (Models 1a, 2a and 3a), the flexible-edge element (right frame) sustains larger displacements than the stiff-edge element (left frame), and the StP profile provides the larger deviation between
250

Yield displacement profiles of asymmetric structures for optimum torsional response
Fig. 9 Normalized peak edge displacements
251

George K. Georgoussis
Fig. 10 Normalized peak ductility factors for edge elements (frames)
252

Yield displacement profiles of asymmetric structures for optimum torsional response
the two edge elements. This behavior is not always the case for short period systems with the EC8 profile (Fig. 9, Model 1a). For long period systems, the deviation between the normalized peak edge displacements seems to be unaffected by the yield displacement profile (Fig. 9, Models 1b, 2b and 3b), and a special feature of the models which are susceptible to translational-torsional coupling (Models 2b and 3b) is the closeness between the displacements of the edge elements. In the latter models, all the displacement profiles assumed in this study produced almost equal maximum edge displacements. Envisaging the complete set of the diagrams of Fig. 9, a rough conclusion that can be drawn is that the deviation between the peak edge displacement ratios is almost invariant in the systems detailed according to SEq, Code, Opt2 and Opt4 profiles.
The normalized peak ductility factors, , for the edge elements are shown in Fig. 10 (mean values from the four input motions). For the particular ‘j’ edge element, the aforementioned factor is defined as
)//()/(/ max, yojyjjj UUUU (19)
where Uj,max is the peak displacement and Ujy its yield displacement. It can be seen that minimum rotation response does not imply minimum ductility ratio (Myslimaj and Tso 2004, 2005b), neither an equity of this ratio between the edge elements (frames). However, it interesting to note that systems detailed according to SEq, Code, Opt2 and Opt4 profiles present a relatively steady response, without the fluctuations of the other two profiles. The deviation of the ductility ratios between the edge elements in the aforementioned profiles appears to be constant, as in the case of the normalized edge displacements (Fig. 9), with the stiff-edge element (left frame) to require, in most cases, a higher ductility factor. 6. Conclusions
In one-story inelastic systems with simple eccentricity, the strength distribution among the resisting elements is examined in relation to the post-elastic rotation of these systems, when they are subjected to strong ground motions. Given the yield (design) shear of the system, it is shown that the probable peak torque may be developed about the center of mass, with equal probability, in both directions (clockwise and anticlockwise), and a rational design should be based on a combination of the yield shear with a fraction of the peak plastic eccentricity (defined as the ratio of the expected torque to the yield shear) assumed to occur on both sides of the center of mass. The resulting element strength assignment produces a plasticity center very close to the center of mass and the corresponding yield displacement profile obtains a concave form, depending on the magnitude of the assumed eccentricity. Simple three-element, stiffness eccentric, systems analyzed under two types of characteristic ground motions (1940 El Centro NS component and 1995 Kobe KJM000 component) of different intensities, presented the following features:
253

George K. Georgoussis
(i) The maximum rotations sustained by the assumed systems, are smaller than those detailed with other element displacement profiles, such as the stiffness proportional profile and that derived according to the recommendations of Eurocode 8. (ii) The sound performance of structures, which have been detailed in accordance to the suggested methodology, is not much affected by the magnitude of the peak dynamic eccentricity, when they are well deformed into the inelastic region during an earthquake shock. This means that code recommendations that describe a dynamic eccentricity in symmetric locations about the center of mass (regardless of the magnitude of this eccentricity) provide a reasonable structural design in relation to the rotational performance of the structure. Therefore, code provisions that are based on such principles (NBCC 1995, EAK 2000, UBC 1994 and NZS 1992) are superiors to Eurocode 8 (1993). (iii) The good performance of the assumed systems is also demonstrated by the fact that the edge displacements and the ductility demands of the edge elements are parameters that are practically unaffected when the yield shear is combined with different magnitudes of the dynamic eccentricity. Finally, as the results presented herewith indicate that the dynamic eccentricity should
be taken into account on both sides of CM, this may easily be incorporated in the accidental eccentricity, which, by nature, must also be considered symmetrically to the CM.
Acknowledgments This investigation was supported by the Research Program ARCHIMEDES III and was
implemented through the Operational Program ‘Education and Lifelong learning’ and co-financed by the European Union (European Social Fund) and Greek national funds. The author is grateful for this support. References Anastassiadis, K., Athanatopoulou, A. and Makarios, T. (1998), “Equivalent static eccentricities in the
simplified methods of seismic analysis of buildings”, Earthquake Spectra, 14(1), 1-34. Bozorgnia, Y. and Tso, W.K. (1986), “Inelastic earthquake response of asymmetric structures”, J. Struct.
Eng. ASCE, 112(2), 383-400. Chandler, A.M. and Duan, X.N. (1991), “Evaluation of factors influencing the inelastic seismic performance
of torsionally asymmetric buildings”, Earthquake Engng. Struct. Dyn., 20, 87-95. Chandler, A.M. and Duan, X.N. (1997), “Performance of asymmetric code-designed buildings for
serviceability and ultimate limit states”, Earthquake Engng. Struct. Dyn., 26, 717-735. Chandler, A.M., Duan, X.N. and Rutenberg, A. (1996), “Seismic torsional response: assumptions,
controversies and research progress”, European Earthquake Engineering, 1, 37-51. Chopra, A.K. (2007), Dynamics of Structures: Theory and Applications to Earthquake Engineering, 3rd
edition, Prentice-Hall, N.J. Chopra, A.K. and Goel, R.K. (2002), “A modal pushover analysis procedure for estimating seismic demands
254

Yield displacement profiles of asymmetric structures for optimum torsional response
for buildings”, Earthquake Engng. Struct. Dyn., 31, 561-582. Chopra, A.K. and Goel, R.K. (2004), “A modal pushover analysis procedure to estimate seismic demands
for unsymmetric-plan buildings”, Earthquake Eng. Struct. Dyn., 33, 903-927. Correnza, J.C., Hutchinson, G.L. and Chandler, A.M. (1994), “Effect of transverse load-resisting elements
on inelastic earthquake response of asymmetrical-plan buildings”, Earthquake Eng. Struct. Dyn., 23, 75-89.
De la Llera, J.C. and Chopra, A.K. (1995), “Understanding the inelastic seismic behaviour of asymmetric-plan buildings”, Earthquake Engng. Struct. Dyn., 24, 549-572.
Dempsey, K.M. and Irvine, H.M. (1979), “Envelopes of maximum seismic response for a partially symmetric single story building model”, Earthquake Eng. Struct. Dyn., 7, 161-180.
Dempsey, K.M. and Tso, W.K. (1982), “An alternative path to seismic torsional provisions”, Soil Dynamics and Earthquake Engineering, 1, 3-10.
EAK (2000), Greek Aseismic Code, Greek Ministry of Environment, City Planning and Public Works, Greece.
Eurocode EC8 (1993), Structures in Seismic Regions, Part 1, General and Building, Report EU1226EN, Brussels.
Georgoussis, G.K. (2008), “Modal ductility factors of one-story inelastic structures with simple eccentricity”, Structural Design of Tall and Special Buildings, 17(3), 635-653.
Goel, R.K. and Chopra, A.K. (1990), “Inelastic seismic response of one-story, asymmetric-plan systems: effects of stiffness and strength distribution”, Earthquake Engng. Struct. Dyn., 19, 949-970.
Goel, R,K, and Chopra, A,K. (1991), “Inelastic seismic response of one-story, asymmetric-plan systems: effects of system parameters and yielding”, Earthquake Eng. Struct. Dyn., 20, 201-222.
Kan, C.L. and Chopra, A,K. (1977), “Effects of torsional coupling on earthquake forces in buildings”, J. Struct. Div. ASCE, 103, 805-819.
Kunnath, S.K. (2004), “Identification of modal combinations for nonlinear static analysis of building structures”, Computer-Aided Civil and Infrastructure Engineering, 19, 246-259.
Myslimaj, B. and Tso, W.K. (2002), “A strength distribution criterion for minimizing torsional response of asymmetric wall-type systems”, Earthquake Eng. Struct. Dyn., 31, 99-120.
Myslimaj, B. and Tso, W.K. (2004), “Desirable strength distribution for asymmetric structures with strength-stiffness dependent elements”, Journal of Earthquake Engineering, 8(2), 231-248.
Myslimaj, B. and Tso, W.K. (2005a), “A design-oriented approach to strength distribution in single-story asymmetric systems with elements having strength dependent stiffness”, Earthquake Spectra, 21(1), 197-212.
Myslimaj, B. and Tso, W.K. (2005b), Response to T. Paulay’s Discussion of “A design-oriented approach to strength distribution in single-story asymmetric systems with elements having strength dependent stiffness”, Earthquake Spectra, 21(3), 897-899.
National Building Code of Canada (1995), National research Council of Canada, Ottawa, Ontario. New Zealand Standard NZS 4203 (1992), Code of Practice for General Structural Design and Design
Loadings for Buildings, Standards Association of New Zealand, Wellington, NZ. Newmark, N.M. and Riddell, R. (1979), “A statistical study of inelastic response spectra”, Proc. 2nd U.S.
National Conference on Earthquake Engineering, 495-504. Paulay, T. (1998), “A mechanism-based design strategy for the torsional seismic tesponse of ductile
buildings”, European Earthquake Engineering, 2, 33-48. Paulay, T. (2005), Discussion of “A design-oriented approach to strength distribution in single-story
asymmetric systems with elements having strength dependent stiffness”, Earthquake Spectra, 21(3), 893-895.
Priestley, M.J.N. (1993), “Myths and fallacies in earthquake engineering- conflicts between design and reality”, Bulletin N. Zealand National Society for Earthquake Engineering, 26(3), 329-341.
Stathopoulos, K.G. and Anagnostopoulos, S.A. (2003), “Inelastic earthquake response of single-story asymmetric building: an assessment of simplified shear beam models”, Earthquake Engng. Struct. Dyn., 32, 1813-1831.
255

George K. Georgoussis
Stathopoulos, K.G. and Anagnostopoulos, S.A. (2005), “Inelastic torsion of multistory buildings under earthquake excitations”, Earthquake Engng. Struct. Dyn., 34, 1449-1465.
Tso, W.K. and Bozorgnia, Y. (1986), “Effective eccentricity for inelastic seismic response of buildings”, Earthquake Engng. Struct. Dyn., 14, 413-427.
Tso, W.K. and Dempsey, K.M. (1980), “Seismic torsional provisions for dynamic eccentricity”, Earthquake Engng. Struct. Dyn., 8, 275-289.
Tso, W.K. and Myslimaj, B. (2003), “A yield displacement distribution-based approach for strength assignment to lateral force-resisting elements having strength dependent stiffness”, Earthquake Eng. Struct. Dyn., 32, 2319-2351.
Tso, W.K. and Ying, H. (1990), “Additional seismic inelastic deformation caused by structural asymmetry”, Earthquake Eng. Struct. Dyn., 19, 243-258.
Tso, W.K. and Zhu, T.J. (1992), “Design of torsionally unbalanced structural systems based on code provisions I: ductility demand”, Earthquake Eng. Struct. Dyn., 21, 609-627.
Uniform Building Code (1994), International Conference of Building Officials, Whittier, California. Wong, C.M. and Tso, W.K. (1994), “Inelastic seismic response of torsionally unbalanced systems designed
using elastic dynamic analysis”, Earthquake Eng. Struct. Dyn., 23, 777-798. Zhu, T.J. and Tso W.K. (1992), “Design of torsionally unbalanced structural systems based on code
provisions II: strength distribution”, Earthquake Eng. Struct. Dyn., 21, 629-644.
256

Yield displacement profiles of asymmetric structures for optimum torsional response
Appendix
Eurocode 8 (1993) specifies the design eccentricities as
aosd eeee 1
asd eee 2
Where: ea is the accidental eccentricity, and eo is the additional eccentricity which accounts for the dynamic effect of simultaneous translational and torsional vibrations and is equal to the lower of the following two values
)(1.0/10)(1.0 cbbecbe so
222222222 4)(2
1 ssss
o eerere
e
in which, ρ is the resilience radius, equal to v/ KK .
257