white paper vaisala lidar ceilometer cl61
TRANSCRIPT
WHITE PAPER
Vaisala Lidar Ceilometer CL61Depolarization measurement with ceilometer
1WHITE PAPER | Vaisala Lidar Ceilometer CL61
See more with depolarization
Vaisala introduces the depolarization measurement capability to a high-end profiling ceilometer, setting a new standard in analysis and applications. Depolarization provides straightforward identification of liquid and ice clouds, precipitation type, and melting layer, as well as good potential for monitoring aerosols, smoke, dust, and volcanic ash.
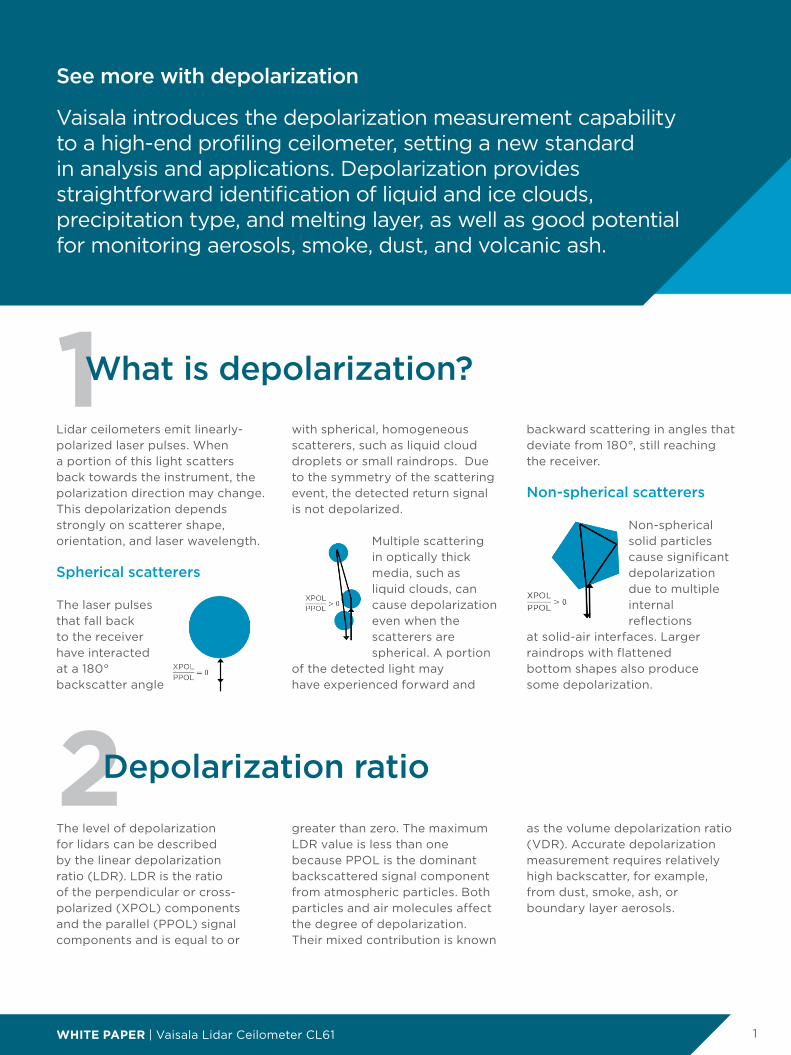
1What is depolarization?
Lidar ceilometers emit linearly-polarized laser pulses. When a portion of this light scatters back towards the instrument, the polarization direction may change. This depolarization depends strongly on scatterer shape, orientation, and laser wavelength.
Spherical scatterers
The laser pulses that fall back to the receiver have interacted at a 180° backscatter angle
The level of depolarization for lidars can be described by the linear depolarization ratio (LDR). LDR is the ratio of the perpendicular or cross-polarized (XPOL) components and the parallel (PPOL) signal components and is equal to or
with spherical, homogeneous scatterers, such as liquid cloud droplets or small raindrops. Due to the symmetry of the scattering event, the detected return signal is not depolarized.
Multiple scattering in optically thick media, such as liquid clouds, can cause depolarization even when the scatterers are spherical. A portion
of the detected light may have experienced forward and
greater than zero. The maximum LDR value is less than one because PPOL is the dominant backscattered signal component from atmospheric particles. Both particles and air molecules affect the degree of depolarization. Their mixed contribution is known
backward scattering in angles that deviate from 180°, still reaching the receiver.
Non-spherical scatterers
Non-spherical solid particles cause significant depolarization due to multiple internal reflections
at solid-air interfaces. Larger raindrops with flattened bottom shapes also produce some depolarization.
as the volume depolarization ratio (VDR). Accurate depolarization measurement requires relatively high backscatter, for example, from dust, smoke, ash, or boundary layer aerosols.
2Depolarization ratio

2WHITE PAPER | Vaisala Lidar Ceilometer CL61
3
4
CL61 depolarization measurement
How to interpret depolarization
The Lidar Ceilometer CL61 measures VDR. The CL61 operating wavelength of 910.55 nm is a novel lidar wavelength for depolarization measurements and provides some benefits compared with conventional research lidars that typically use depolarization channels in the 300 - 500 nm UV range. Aerosol layers at 910 nm can be more visible because they are not masked by molecular
Vertical depolarization ratio profiles allow straightforward identification of several weather phenomena, such as liquid vs. solid precipitation, cloud phase, and melting layer. Near-zero values from liquid scatterers are clearly distinguished from larger values from complex ice crystal shapes.
In most cases it is better to do a side-by-side visual inspection of the time-height figures of
signal, due to the strong wavelength dependency (λ^(-4)) of molecular scattering. This also means that VDR measured with CL61 is comparable to the particle depolarization ratio (PDR) measured by lidars operating on a shorter wavelength.
CL61 alternates acquisition of XPOL and PPOL signals with a measurement time of 0.2 s for each. Vertical profiles from
attenuated backscatter (ABS) and depolarization ratio (LDR). Characteristic behavior of local weather events, seen in signal strength, variance, and shape of patterns, are clearly recognizable with some practice. For example, by looking only at LDR values, it may be difficult to distinguish some aerosols from liquid clouds without the ABS information. Aerosol characterization is also possible,
ground level to a measurement range of 15.4 km are time averaged for 5 s before analysis. CL61 measures depolarization with two filters in front of a single avalanche photodiode detector on the coaxial optical path. As the same receiver module is used for XPOL and PPOL signals, there is no need for receiver sensitivity calibration.
especially when additional information is available, such as in model forecasts and backward trajectories, or complimentary lidar measurements.
Polarization lidars operating in one wavelength cannot provide independent, unambiguous aerosol type identification. Aerosols can also exist in mixtures and go through hygroscopic growth, which complicates identification.

3WHITE PAPER | Vaisala Lidar Ceilometer CL61
Approximate ranges for typical LDR values
However, they can help quickly and confidently identify several weather conditions, such as snowfall, supercooled liquid clouds, and freezing rain, and support research lidars in aerosol studies. The figure below shows
some approximate LDR value ranges for various scatterers, indicated by the widths of the gray boxes. The ranges of values shown above the color bar have been observed in Vaisala studies with 910 nm depolarization lidar.
The ranges of values shown below the color bar are from the UK Met Office campaign report (see later in this document) and may not accurately represent observations at 910 nm.
5Case examples
The following cases consist of different types of clouds, precipitation and aerosols measured in different climates and seasons: mid-latitude summer conditions from Cardington, UK, and arctic winter conditions and very clean air in Pallas, Finland.
Each case is illustrated with time-height plots of attenuated backscatter (ABS) and depolarization ratio (LDR). The x-axes of the figures show the time in UTC and the y-axes show the height above the instrument in meters. On the upper panel, the color represents the attenuated backscatter coefficient and on the lower panel the LDR measurement. Data is averaged and plotted as 1-min averages and the vertical resolution is 4.8 meters.

4WHITE PAPER | Vaisala Lidar Ceilometer CL61
Case 1 represents a 9-hour time period measured in Cardington, UK on August 7, 2020. Liquid cloud layers are visible in attenuated backscatter throughout the time period as shallow dark red layers. Individual attenuated backscatter profile shows a peak signal at the liquid cloud layer. The signal strength is largest in the case of liquid layers containing large number of small cloud droplets; the signal usually attenuates in the layer and no signal above can be received (only noise visible). Spherical liquid droplets can be verified from the linear depolarization plot as values in those layers are close to zero.
During some time periods (between 15:00 – 19:00 and 21:00 – 22:00), these liquid cloud layers are precipitating which can be seen as a red-colored signal below the strong peak signal that extends over longer vertical distance in the attenuated backscatter image. This can also be verified from the depolarization ratio image where the precipitation regions show varying values of LDR with higher values representing ice / snow and lower values representing raindrops / drizzle. Note that most of the time, the precipitation is not reaching the ground but evaporating into the atmosphere.
The melting layer inside the precipitation (between 17:15 – 19:00, about 3700 m) can be easily distinguished from the depolarization ratio image as values change rapidly from orange to blue corresponding to the melting of non-spherical snow / ice crystals into spherical liquid droplets. The melting layer can also be seen from the attenuated backscatter image as a weakening of the signal (so-called dark band, seen as a yellow stripe in the attenuated backscatter plot) inside the precipitation signal.
The aerosol signal is visible in the boundary layer (below 2000 m) in both images.
Case 1. Precipitating liquid clouds, melting layer and boundary layer aerosols

5WHITE PAPER | Vaisala Lidar Ceilometer CL61
Case 2 represents a 29-hour time period measured in Cardington, UK on July 30-31, 2020. The case represents variable aerosol layers measured below 3500 m and some cloud and precipitation formation after 17:00 UTC July 31. The aerosol layers are visible in both the attenuated backscatter and depolarization ratio images. Visual inspection of the attenuated backscatter and depolarization ratio
images shows residual layers in the nocturnal boundary layer from the previous day. The growth of the daytime convective boundary layer is also visible starting in the morning hours. Different layers can be distinguished from the attenuated backscatter image, however; the different depolarization ratio values in these layers are distinct and suggest different constituents of aerosols in these layers.
Based on the depolarization ratio image, it can be seen that the aerosols are more layered during the night, and that mixing occurs during the day.
Precipitation between 20:00 and 21:00 UTC reveals a melting layer around 3700 m and can be distinguished very clearly from the depolarization ratio image, and is also visible in the attenuated backscatter image.
Case 2. Variable aerosol layers including daytime convective boundary layer. Liquid clouds, precipitation and melting layer
6WHITE PAPER | Vaisala Lidar Ceilometer CL61
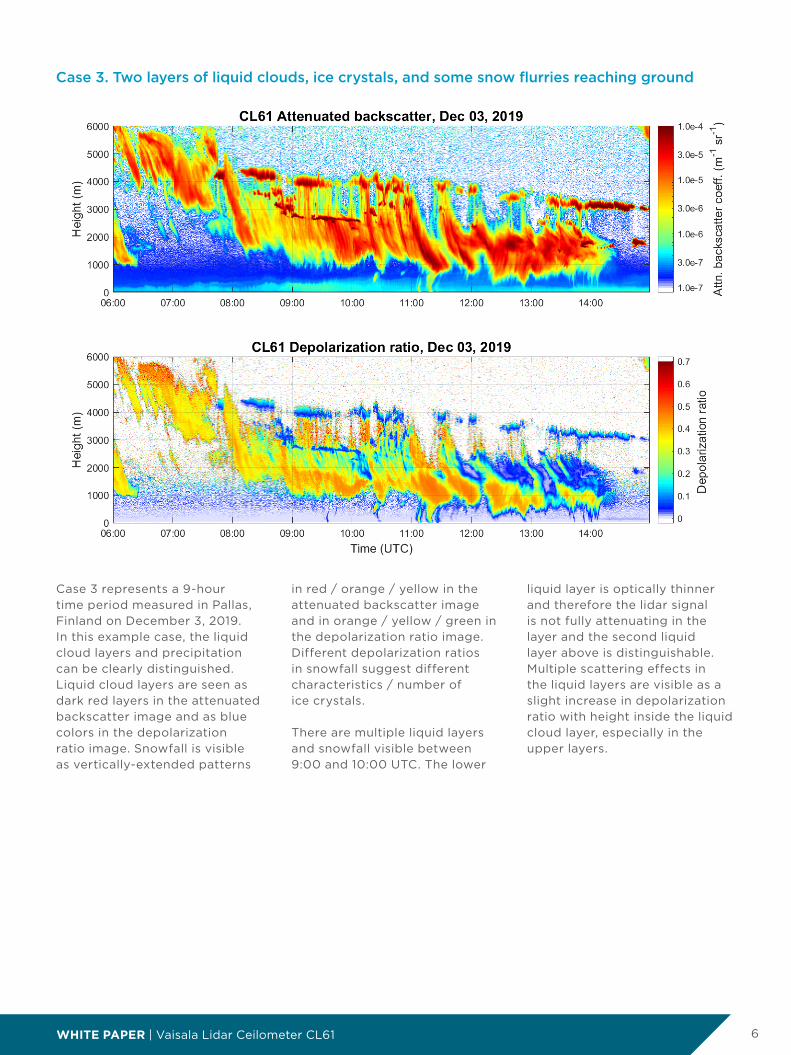
Case 3. Two layers of liquid clouds, ice crystals, and some snow flurries reaching ground
Case 3 represents a 9-hour time period measured in Pallas, Finland on December 3, 2019. In this example case, the liquid cloud layers and precipitation can be clearly distinguished. Liquid cloud layers are seen as dark red layers in the attenuated backscatter image and as blue colors in the depolarization ratio image. Snowfall is visible as vertically-extended patterns
in red / orange / yellow in the attenuated backscatter image and in orange / yellow / green in the depolarization ratio image. Different depolarization ratios in snowfall suggest different characteristics / number of ice crystals.
There are multiple liquid layers and snowfall visible between 9:00 and 10:00 UTC. The lower
liquid layer is optically thinner and therefore the lidar signal is not fully attenuating in the layer and the second liquid layer above is distinguishable. Multiple scattering effects in the liquid layers are visible as a slight increase in depolarization ratio with height inside the liquid cloud layer, especially in the upper layers.

7WHITE PAPER | Vaisala Lidar Ceilometer CL61
Case 4. Fluctuations of aerosol layers in the boundary layer. Liquid clouds and some precipitation from a low cloud
Case 4 represents an 11-hour time period measured in Pallas, Finland on December 10 – 11, 2020. The case shows fluctuating aerosol layers in the atmospheric boundary layer and some cloud and precipitation formation at 3000 m after 02:30 UTC and below 500 m after 03:30 UTC. The aerosol layers that are distinguishable from the attenuated backscatter image show different depolarization values. Layers with potentially different aerosol characteristics can be easily distinguished from the depolarization ratio image.
The clean air in Pallas, Finland results in a low attenuated backscatter signal in the boundary layer, for example, when compared to cases 1 and 2 measured in Cardington, UK, where there are more aerosols in the boundary layer. The liquid cloud layer at 3000 m shows the multiple scattering effect and the lower precipitating liquid cloud brings snowfall to the ground.

8WHITE PAPER | Vaisala Lidar Ceilometer CL61
Pallas cloud experiment by Finnish Meteorological Institute
CL61 LDR measurements were compared against research-grade Raman lidar PollyXT (http://polly.tropos.de/), operated by the Finnish Meteorological Institute. The measurement campaign was conducted in Pallas, Finnish Lapland, in winter 2019 – 2020 with overlapping measurements between October and December 2019. The focus area of the campaign was on clouds and the comparison dataset consisted of different types of clouds measured in an Arctic environment. CL61 910 nm VDR measurement was compared to PollyXT VDR and PDR at 532 nm, averaged over one hour.
The following figure shows examples of the results. The x-axis shows the depolarization ratio and the y-axis shows the height above the instrument. Measurements are interpolated to the same vertical grid.
The example on the left represents an ice cloud between 5 – 7 km. There is good correspondence between the two instruments despite the different wavelengths.
The example in the middle represents another ice cloud between 2 – 4 km. The CL61 VDR at 910 nm is slightly smaller compared to PollyXT VDR and PDR results at 532 nm.
The example on the right represents liquid cloud at around 900 m, where the VDR from CL61 and VDR from PollyXT are both close to zero, as expected. The increasing depolarization ratio inside the cloud is due to multiple scattering effects.
Overall, the correspondence between CL61 and PollyXT depolarization ratio measurements was good in all analyzed examples. While in a few cases the CL61 showed smaller values compared to PollyXT, it should be noted that the values are not expected to be exactly the same in every situation due to the different responses of different particles to different wavelengths.
6Performance evaluations

vaisala.com/CL61 Scan the code for more information
Ref. B212267EN-A ©Vaisala 2021This material is subject to copyright protection, with all copyrights retained by Vaisala and its individual partners. All rights reserved. Any logos and/or product names are trademarks of Vaisala or its individual partners. The reproduction, transfer, distribution or storage of information contained in this brochure in any form without the prior written consent of Vaisala is strictly prohibited. All specifications — technical included — are subject to change without notice.
Performance evaluation campaign by the UK Met Office
CL61 LDR measurements were also compared against the research-grade Raymetrics Raman Lidar LR111-D300, operated by the UK Met Office. The Raymetrics lidar VDR and PDR values are measured at 355 nm. The measurement campaign was conducted in Cardington, UK between March and September, 2020. The focus of the analyzed cases was more towards aerosol studies and conducted by the UK Met Office.
The following figure shows the comparison results in one case that represents aerosol layers above the boundary layer. The image on the left shows the attenuated
backscatter signals, Raymetrics in blue and CL61 in orange. The image on the right shows the depolarization ratio measurements, Raymetrics VDR in blue, Raymetrics PDR in orange, and CL61 VDR in green.
The PDR at 355 nm and VDR at 910 nm, averaged over 3.5 hours, show similar structure and variation in two different layers. On the lower layer (layer 1), however, the 910 nm VDR is smaller than the PDR at 355 nm, and on the upper layer (layer 2) the situation is reversed. The report concludes that these differences are likely due to a change in the aerosols that comprise the two layers, and similar wavelength dependence has been noted in the literature. In addition, the HYSPLIT trajectory
analysis suggested different origins for these two layers supporting the conclusion of different aerosol constituents.
More analysis and other cases can be found in the full report (available on request from Vaisala). Based on the measurement campaign results, it is concluded that CL61 shows good potential for aerosol monitoring and potential for aerosol classification and quantification with the help of the depolarization measurement capability. Moreover, the additional wavelength from CL61 can provide valuable information for aerosol typing when used with Raymetrics lidar. CL61 depolarization measurement also showed good potential for improved mixing layer height identification.
SummaryThe Vaisala Lidar Ceilometer CL61 with depolarization capability shows great benefits in different applications. CL61 can be used not only for cloud base height measurements, but also for characterizing different particles: liquid droplets, drizzle and raindrops, snow and ice crystals, dust, volcanic ash and sand. CL61 is more effective than traditional ceilometers for detecting icing and freezing conditions and for mixing layer height detection. CL61 has compared favorably with different research-grade lidars in measurement campaigns in different climates.
©British Crown copyright 2020, Met Office