what determines entrepreneurial success? — a psychometric ... · pdf filewhat determines...
TRANSCRIPT

WHAT DETERMINES ENTREPRENEURIALSUCCESS? — A PSYCHOMETRIC STUDY OF RURAL
ENTREPRENEURS IN INDIA
Viral Acharyaa, Abhilasha Rajanb,∗, Antoinette Schoarc
aLondon Business School, [email protected] for Financial Management and Research, [email protected] Institute of Technology, Sloan School of Management, [email protected]
Abstract
We investigated what determines entrepreneurial success by studying thecharacteristics of rural kiosk operators in India, specifically kiosks run by Dr-ishtee. We constructed a questionnaire to collect data on various psychologicalfactors from existing kiosk operators in two states: Assam and Uttar Pradesh(UP). We related these factors and questions to performance measured by logsales of the kiosk. A significant degree of performance variation can be ex-plained by psychological characteristics, in particular, self efficacy, achieve-ment motivation and average psychological aptitude for entrepreneurs in As-sam. However, performance variation of UP’s entrepreneurs is explained byage and prior experience in borrowing in addition to the psychological charac-teristic of achievement motivation. We identify specific questions as well andfind that performance is significantly related to the questions relating to self-efficacy and locus of control for both states. Finally, we employ these findingsto build a model for the selection strategy of rural entrepreneurs.
∗We wish to thank Souditi Mazumdar and Davina Mcphill for their efforts in data collection and Shyamali
Rajivan for her help in editing.
1

I INTRODUCTION
“My son is now an ‘entrepreneur’. That’s what you’re called when you don’t have a
job.”
—Ted Turner, broadcasting entrepreneur
What is entrepreneurship? Who are entrepreneurs? How are they different from non-
entrepreneurs? Is entrepreneurship is just another career option? Drawing from research,
people choose entrepreneurial careers because of the perceived greater economic and
psychological rewards than regular employment. The definition of an entrepreneur has
evolved in last three centuries, from someone who bears risk by buying at a low price
and selling at a higher price; to the creation of new enterprises of which the entrepreneur
is the founder (Financing Microenterprises, Theory and Practice)
Considerable effort has gone into understanding the psychological and sociological
wellsprings of entrepreneurship; and some common characteristics like the need for
achievement, locus of control, orientation toward intuitive rather than sensate thinking,
and risk-taking propensity of entrepreneurs have been suggested. This begs the question:
can these traits be generalized across countries and culture? In the current scenario, we
have a broad spectrum of different countries with respect to the economic structure as
well stage of economic status they are in.
In India, small firms contribute considerably to economic growth and employ a very
large number of people, second only to agriculture. The concentrations of these firms
are mostly in the urban areas while rural areas have failed to seize the opportunities
unleashed by economic reforms. Different models of rural entrepreneurship are being
attempted by various government and private agencies to tap the potential of human
sources as an engine of growth. However, little is know about the characteristics of rural
entrepreneurs who take up entrepreneurship mostly because they do not have a better
opportunity and only incidentally due to their interest.
Empirical literature analyses the characteristics of entrepreneurs, which found direct
relationships between the need for achievement, locus of control and risk taking propen-
sity with success in most cases. Again, the entrepreneurial characteristics required to
launch a business successfully are often not those required for its growth and even more
frequently not those required to manage it once it grows to considerable size. In other
words, the role of the entrepreneur needs to change with the business cycle as it develops
and grows.
Keeping in mind these constraints, the objective of this paper is to identify and, even-
tually, provide a model for selection of rural entrepreneurs for the different rural en-
trepreneurship based businesses. In particular, the existing rural entrepreneurs of Dirsh-
tee have been analysed for their psychometric characteristics, thus laying the foundation
to building a model for their selection strategy. The database of sales performance pro-
vided by Drishtee and questionnaires proved to be the key to understanding the psycho-
2
metric traits of these kiosk operators. Although Drishtee’s data has been used and focus
is on the Drishtee’s selection case, it could also be useful as a methodological tool for
other rural entrepreneurship based businesses interested in a set of criteria for selecting
entrepreneurs.
In reaching the above-mentioned objectives, the structure of this paper is as fol-
lows. Section II introduces Drishtee, as an organization and the importance of rural
entrepreneurs for their business. Section III provides detail of data; sample construc-
tion, construction of variables, questionnaire and sample description. In section IV, we
describe the methodology and results obtained. We recommend to Drishtee a selection
model in section V. Lastly section VI concludes the paper.
II WHY ENTREPRENEURS OF DRISHTEE ARE IMPORTANT?
Drishtee is a for profit rural network of information centers which provides information
and services to the village community. These centers are called Drishtee Soochnalaya
or Information Kiosks and they are the main interface where customers can avail the
services offered by Drishtee. The kiosks are small shops equipped with a complete
set of computers and other accessories such as web cameras, photocopy machines, etc
which are required for the delivery of services. Drishtee selects and appoints people to
run these kiosks on a service-delivery based revenue model. More than 1,020 kiosks of
Drishtee are operating in seven states of India1.
Drishtee’s kiosks also function as retail outlets for the products and services of its
partners2. Some of the popular services include agri-queries, insurance products, com-
puter courses, and English Proficiency courses while batteries, reading glasses, books
and mobile recharge coupons are some of the product lines sold at kiosk. Drishtee has
recently collaborated with other organizations to diversify into microfinance, e-health,
women’s empowerment and promotion of rural artisan.
The backbone of this business is its huge network of kiosks operated by people ac-
quainted with the local area. Though business opportunities are offered by Drishtee in
form of loans for basic infrastructure, the people are also required to invest a certain part
of capital. This model looks attractive given the abundance of human capital in India.
However, little is known about the critical components required to make such kiosk ven-
ture successful. For Drishtee, kiosk operators (KOs) are entrepreneurs because they put
their money in the venture and take the risk of operating in an uncertain environment.
Given the current employment scenario in the country, there is a large pool of appli-
cants who would like to become KOs in villages. It is a challenging task for Drishtee to
screen out persons who have a greater probability of success in this venture. At present,
1Currently in seven states-Bihar, UP, Assam, Haryana, Punjab, Madhya Pradesh and Rajsthan.2Microsoft, Intel, ICICI Prudential, ICICI Lombard, Scojo Foundation, Amaron, HCL, CEEP, Quiver
Infoservices Ltd.
3

there is no reliable method to objectively measure the characteristics that separate an
entrepreneur from a non-entrepreneur.
Although personality characteristics are viewed as a vital component of entrepreneur-
ship, situational circumstances and social functions are also important to the process of
becoming an entrepreneur. Under similar situational circumstances certain people will
set up in business while others will not: it takes a special kind of person to set up busi-
ness on their own. Setting up alone is not as important as becoming successful in the
venture. It requires a completely different set of skills to manage resources, foresee op-
portunities and stay ahead of time. For Drishtee it is crucial to know how social factors,
educational background, heredity along with personality features play a role in defining
a successful entrepreneur.
Kiosk operators of Drishtee are from different social and educational backgrounds but
most of them are villagers. The opportunity to become an entrepreneur is being given by
Drishtee: an induced phenomenon. It is possible that a KO would not have become an
entrepreneur and would have opted for some other profession if Drishtee had not offered.
In other words, the choice to become a KO for Drishtee may not be a voluntary pursuit of
opportunity but instead a reflection of the necessity to engage in entrepreneurship; in the
absence of other employment opportunities (Block & Wagner 2006). Despite the fact
that the selected ones could be necessity entrepreneurs, it is very important for Drishtee
to filter out the best among those available.
We have tried to objectively define personal characteristics indicative of entrepreneur-
ship and identify a set of factors influencing the success of these entrepreneurs.
In following section we discuss the data - sample construction, variables that deter-
mine entrepreneurship traits and the questionnaire and sample that was used. Section IV
contains methodology and results obtained. Finally based on the findings we suggest a
model to be used by Drishtee for their selection strategy.
III DATA
A SAMPLE CONSTRUCTION
A simple approach when trying to determine the various psychometric traits important
for an entrepreneur would be to identify the traits established from previous studies,
design a psychometric test and administer it to the selected sample. However, this would
mean an implicit assumption that other factors of social and economic background are
constant across the observed samples. We selected 100 KOs for our sample from two
different states: 45 from Assam and 55 from Uttar Pradesh (UP). One obvious problem
with this is that the two states selected are different with respect to education level, socio-
economic status and culture. Hence we did not merge our samples from the two states.
To track the performance of the KOs over a period of time we use sales figure from
Drishtee’s database. The same KO’s were interviewed and administered a psychometric
4

test to find the correlation, if any, that existed between performance and the psycho-
metric traits of the KO’s. We also tried to discover if a significant relationship can be
found between performance and the psychological characteristics of KOs. As discussed
earlier, we objectively identified certain psychological characteristics indicative of en-
trepreneurs. Based on these characteristics, we then constructed the variables. From
there, we move on to formulate a questionnaire to measure these variables.
B CONSTRUCTION OF VARIABLES
The variables are constructed to measure the psychological characteristics of KOs im-
portant for their success. Earlier studies by other researchers list a number of charac-
teristics; we restrict our attention to psychological traits, time preference, risk aversion,
intelligence quotient and background.
1 Psychological traits
a) Achievement Motivation (AchM)
The need for achievement is a distinct human motive which can be defined as a need
for success or attainment of excellence. Individuals satisfy their needs through different
means, and are driven to success for reasons both internal and external. McClelland
asserted that while most people do not possess a strong achievement-based motivation,
those who do, display consistent behaviour in setting goals. Achievement-motivated in-
dividuals are different from gamblers or risk takers. They set achievable goals which
they can influence with their effort and ability. This results-driven approach is almost
invariably present in the character make-up of all successful business people and en-
trepreneurs (Cassidy and Lynn 1989). The questions (Hermans 1970) used to indicate
achievement motivation is Q3, 7 and 19 of main survey part 1. (See Table 1)
b) Locus of Control (LC)
A person’s perception of the source of his or her fate is termed as a locus of control, i.e.
the degree to which people believe they are master of their own fate. Individuals who
believe that they control what happens to them are ‘Internals’ or internally motivated
and have an Internal Locus of Control. Those who believe that outside factors such as
luck or chance controls their fate are ‘Externals’ or externally motivated and have an
External Locus of Control (Robins 2003)
Empirical evidence (J. and Tewary 1979) shows that internals are more suited for jobs
which require initiative and independence of action. People with high internal scores
on Rotter’s (I-E) (Rotter 1966) scale are more likely to be successful entrepreneurs.
Internals believe that they personally are in control of their destiny and that luck and
fate have only a modest influence on the outcome of events. For internals, personal
destiny comes from within and therefore they tend to be self-reliant and independent.
5

Questions (Levenson 1974) 1, 5, 11 and 14 from part 1 of the main survey have been
used to measure Locus of Control. (See Table 1)
c) Meta- Cognitive Activity (MC)
Simply defined, meta-cognition is thinking about thinking (Jennifer A. Livingston,
1997). It refers to the higher order thinking that involves active control over the thinking
processes involved in learning. It consists of two basic processes occurring simulta-
neously: monitoring our progress as we learn, and making changes and adapting our
strategies if perceived that we are not doing so well (Winn and Snyder, 1998). It’s
about self-reflection, self-responsibility and initiative, as well as goal setting and time
management. Activities such as planning how to approach a given learning task, moni-
toring comprehension, and evaluating progress toward the completion of a task are meta-
cognitive in nature.
”Metacognitive skills include taking conscious control of learning, planning and se-
lecting strategies, monitoring the progress of learning, correcting errors, analyzing the
effectiveness of learning strategies and changing learning behaviors and strategies when
necessary. ” (Ridley et al. 1992) A successful entrepreneur should be a good learner
with meta-cognitive skills. The questions (Rybowiak et al 1999) constructed to measure
meta-cognitive activity include, 2, 9, 12 and 16. (See Table 1)
d) Need for Dominance (ND)
In society, the relative position of an individual is determined by structure of the society
and the relative importance given to various occupations. Domination is the condition
of having control or power over people or things. Like many other needs of humans,
the need for dominance is a motive to acquire a dominating position in society. An
entrepreneur controls his or her work and is perceived to have relatively more power
over the events in their life than a salaried person. Also, people who don’t want to be
in subordinate position or don’t want to take orders from anyone else tend to work for
themselves. High need for dominance could be a key characteristic of an entrepreneur.
Thus we have selected need for dominance as one of the variables which is measured by
questions (Steers and Braunstein, D. N. 1976) 10 and 13. (See Table 1).
e) Passion for Work (PW)
An individual’s passion for his or her work comes from self motivation to work more-
driving to achieve the goal. It creates an insatiable hunger for excellence. However,
many people do not enjoy their work and do it to earn a livelihood, rather than out
of interest. For entrepreneurs, being passionate about their work is not only important
but crucial because it directly affects their business. They constantly need to discover
new ways to sustain and expand their business, maintain their client base and look for
6

new opportunities. If they are not enjoying the work they are doing, it may result in
failure. Do entrepreneurs of Drishtee have passion for work and whether it affects their
performance? This variable, passion for work has been measured by questions (Locke
1993). Q5, 15 and 18. (See Table 1).
f) Self- Efficacy (SE)
Self-efficacy is defined as people’s beliefs about their capabilities to produce designated
levels of performance that exercise influence over events that affect their lives (Bandura
1997). Self-efficacy beliefs determine how people feel, think, motivate themselves and
behave. Entrepreneurs are perceived as having a high level of assurance in their capabil-
ities and who approach difficult tasks as challenges to be mastered rather than as threats
to be avoided. Such an efficacious outlook fosters intrinsic interest and deep engross-
ment in activities (Bandura 1997). They set themselves challenging goals and maintain
strong commitment to them. When met with failure, they heighten and sustain their
efforts and quickly recover their sense of efficacy after it. Also they attribute failure to
insufficient effort or lack of knowledge and skills which they think can be acquired. This
approach produces personal accomplishments, reduces stress and lowers vulnerability to
depression. We perceive that entrepreneurs should have self-efficacious attitude towards
life and measure this through questions (Schwarzer et al 1997). 4, 8, 17 and 20 in part 1
of the main survey. (See Table 1)
2 Cognitive Reflection (IQ), Risk Aversion and Time Preference
a) IQ
People with higher cognitive ability (or “IQ”) differ from those with lower cognitive
ability in a variety of ways. Entrepreneurs as perceived should have high cognitive
ability because it is suppose to influences judgment and decision-making ability. It is
logical for us to select IQ as one of the personality traits of a successful entrepreneur.
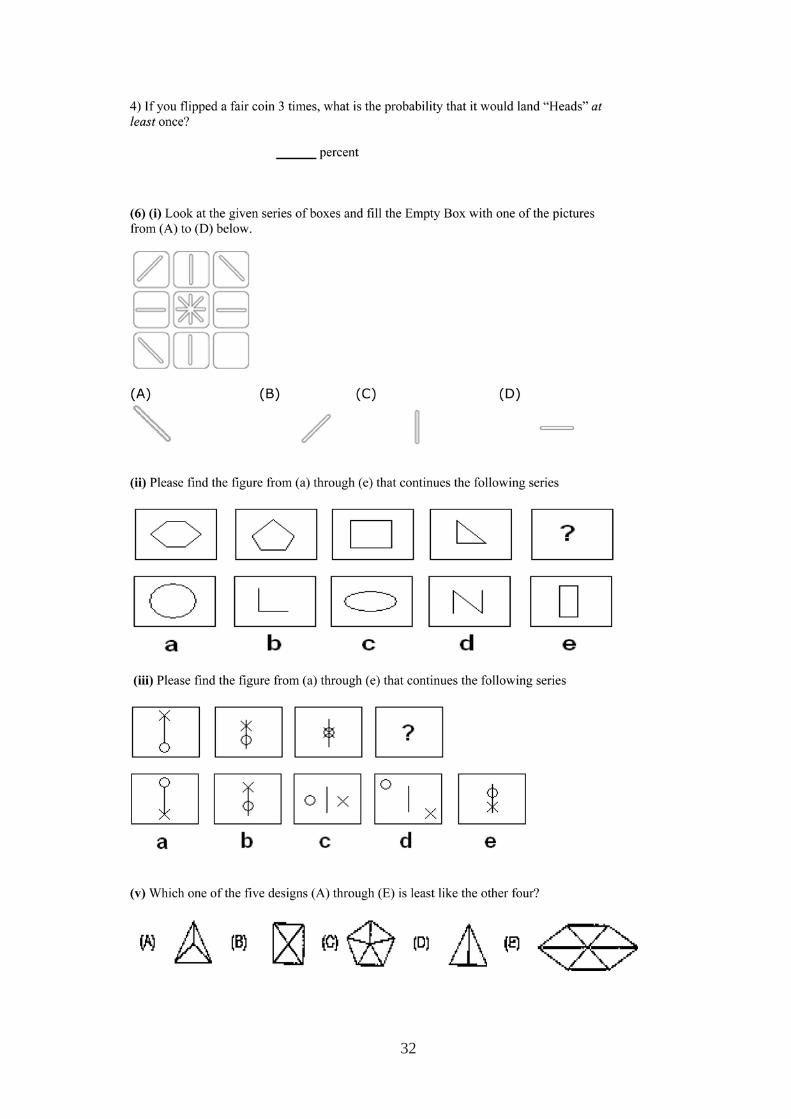
We have used questions 5 and 6: 5 for IQ1 and 6 for IQ2 from the main survey part II
for measuring IQ. And we sum both of these to get SumIQ. (See Table 1)
b) Risk Aversion (RA)
Entrepreneurship is historically associated with risk bearing and hence risk attitude is
widely believed to affect the selection of individuals for entrepreneurial positions. The
process of being an entrepreneur may increase the desire for higher levels of risk. We
propose risk-aversion as one of our variables because an entrepreneur is required to take
risky decisions in uncertain environments and hence more risk-averse individuals are
less likely to become entrepreneurs. Like IQ, we have two variables RA1 and RA2 for
risk-aversion which is measured by Q4 in main survey part II.
7

Table 1
Variables detail
Psychometric Variables Questions (Main Survey) Formula useda
Achievement Motivation 3, 7, 19 {A3 + A17 − A19}/3
Locus of control 1, 5 (6 for Assam), 11, 14 {A1 + A5 − Q11 − A14}/4
Meta- cognitive activity 2, 9, 12, 16 {A2 + A9 + A12 + A16}/4
Need for dominance 10, 13 {A10 + A13}/2
Passion for work 5, 15, 18 {A5 + A15 + A18}/3
Self-efficacy 4,8,17,20 {A4 + A8 + A17 + A20}/4
Sum IQb IQ1 5 (1 to 4) Sum of A(5.1 + 5.2 + 5.3 + 5.4)
IQ2 6 (1 to 4) Sum of A(6.1 + 6.2 + 6.3 + 6.4)
RAc RA1 sum 4 (1 to 12) Sum of A(RA1 + RA2 + RA3 + RA4 + RA5)
RA2 sum 4(1 to 16) Sum of A(RA1 + RA2 + RA3 + RA4 + RA5 + RA6 + RA7)
TP TP1 1a A to 1a
TP2 2d (1 to 11) Sum of A (no of a’s)
Notes
a. A stands for Answer
b. Sum IQ is sum of IQ1 and IQ2
c. RA1 and RA2 have been used in the whole document for RA1 Sum and RA2 Sum.
c) Time Preference (TP)
In addition to IQ and Risk Aversion, there is also a notion that entrepreneurs need to be
more patient. When the time element is involved, they go thorough lot of consideration
in taking decision. They devalue or “discount” future rewards less. Similar to IQ and RA
we have constructed TP1 and TP2 as the variables (Time preference) measured in the
main survey part II, by questions, 1 & 2d respectively (Frederick 2005). (See Table 1)
C QUESTIONNAIRE
We have constructed a questionnaire which attempts to measure the above mentioned
variables. The whole questionnaire is divided into three parts. The first part consists
of background classification questions like age, education and business background of
the KO’s. The main questions in this section are about age, the level of education,
social connections, general experience and knowledge of business (own or others), and
knowledge of financial aspects of business. During data analysis they have further been
grouped into Background and Business Background questions.
The second part is the main survey questionnaire which has been used to measure
entrepreneurial characteristics. It comprises of 20 questions where the psychological
characteristics are measured on several scales. A brief summary of psychometric vari-
ables with their respective questions is illustrated in the Table 1. In addition to the
8

main questionnaire, respondents completed another set of questions to measure cogni-
tive traits (IQ), Time Preference, and Risk Aversion.
D SAMPLE DESCRIPTION
Table 2 present means and standard deviations for all the psychological variables of the
entrepreneurs from UP and Assam. It also presents the means and standard deviations
for the scores they obtained for IQ, age and average education. The first two columns
report summary statistics for UP and the last two columns for Assam. The last row of
the Table 2 contains the sample size for each state.
We observe that KOs score high in meta-cognition and passion for work and low
in locus of control for both the states. Further, their score is average in self-efficacy,
average aptitudes and achievement motivation for the two states but the score in need
for dominance is high for Assam and low for UP. Overall the scores for Assam are lower
than UP. We also see that the average age of KO’s in Assam is more than that of UP.
They score very poor in IQ in both the states, with Assam scoring less than UP.
Table 2
Descriptive Statisticsa
UP Assam
Mean St. Dev Mean St. Dev
Locus of Control (LC) 2.16 2.10 1.49 2.01
Self Efficacy (SE) 3.22 1.64 2.85 1.52
Achievement motivation (AchM) 3.04 1.68 2.82 1.48
Meta Cognition (MC) 4.10 1.06 3.42 1.20
Passion for work (PW) 4.02 1.30 3.76 1.18
Need for dominance (ND) 2.42 3.25 3.14 2.04
Avg Apt (AA) 3.14 0.95 2.91 0.99
Sales 44017.74 86067.05 33914.78 42237.67
Age 28.79 6.55 30.04 5.63
SumIQ 2.96 1.60 2.56 1.18
Sample Size 55 45
aNotes:
a. Each of the above variables was measured on an 11 point scale. (−5 to 5) and then transformed to
5 point scale.
b. 5 denoting the extreme positive attribute while −5 the extreme negative. For example, +5 for
locus of control would mean, the person has extremely internal, while −5 meaning exact oppo-
site. Similarly, High belief of self- efficacy, high achievement motivation, high meta-cognition,
passionate about work, high need for dominance would score +5.
c. Average aptitude is the average of all the six aptitudes.
d. SumIQ is sum of IQ1 and IQ2. The total score is 8.
9

Table 3 is the correlation matrix for psychometric characteristics for both the states.As we can see from the table, average aptitude is highly correlated with all the othervariables for Assam but for UP, it shows significant correlations only with locus of con-trol and self-efficacy. Locus of control and self-efficacy are significantly correlated forUP while in Assam only self efficacy shows high correlation with other variable butnot with locus of control. Achievement motivation has very significant correlation withother variables for Assam. Meta-cognition activity and passion for work are correlatedwith a few variables, while locus of control and need for dominance don’t show muchcorrelation with other variables.
Table 3
Correlation matrix for Assam and UPa
Assam
LC SE AchM MC PW ND sales Avg Apt log sales
LC −SE 0.06 −AchM 0.14 0.51 −MC 0.16 0.44 0.27 −PW 0.20 0.55 0.47 0.45 −ND 0.01 0.37 0.35 0.19 0.41 −Sales 0.03 0.27 0.21 0.06 0.19 −0.02 −Avg Apt 0.46 0.72 0.69 0.59 0.75 0.65 −Log sales 0.19 0.30 0.41 0.11 0.24 −0.01 0.31 −
UP
LC −SE 0.43 −AchM 0.56 −0.34 −MC 0.53 −0.24 −0.07 −PW 0.43 −0.21 −0.06 −0.12 −ND 0.34 −0.24 −0.02 −0.03 −0.08 −Sales 0.33 −0.25 −0.05 −0.05 −0.10 −0.07 −Avg Apt 0.42 −0.25 −0.10 −0.10 −0.14 −0.11 −0.13 −Log sales 0.33 −0.25 −0.07 −0.10 −0.14 −0.10 −0.11 −
Assam
LC SE AchM MC PW ND sales Avg Apt log sales
SE − 0.51 0.44 0.55 0.37 0.27 0.72 0.30
Avg Apt 0.46 0.72 0.69 0.59 0.75 0.65 −AchM 0.51 − 0.27 0.47 0.35 0.69 0.41
UPLC − 0.43 0.56 0.53 0.43 0.34 0.33 0.42 0.33
SE − −0.34 −0.24 −0.24 −0.25 −0.25 −0.25
aNotes:
a. Product moment correlations are shown in Table 3. Correlations greater than an absolute 0.24 are
shown in bold letters.
b. The last two tables show separate significant results for Assam and UP.
10

It is expected that for entrepreneurs, self-efficacy (SE) and locus of control (LC)should be positively correlated and the result is in sync for UP but not in Assam.
SE and LC don’t show statistically significant correlation. A very striking featurecan be observed here in case of UP- SE is negatively correlated with all other variablesexcept LC.
We also check the correlation for individual questions in the correlation matrix givenin Tables 4 and 5 in appendix. In a separate analysis which is not reported here, we alsocheck for correlation between questions of variables from other group of TP, RA, IQ butno significant correlation was found.
Table 4 reports the correlation matrix for Assam. Q 3, 5, 7, 8, 10, 13, 15, 17, 18,19, and 20 show significant correlations with other questions in the group. We alsoobserve here that, questions which make up SE are in high correlation with questions ofLC. Later during regression analysis we have identified SE as a significant psychometrictrait for KO’s of Assam.
We observe similar pattern for UP in Table 5, though the extent of correlation is notthat prevalent as in Assam. We found significant correlation between questions of SEand LC for UP as well.
Because of the high correlation of SE with LC, we can say that those who have strongbelief in their ability would also think that fate has only a modest influence on what-ever happens to them. And hence they would be more self-dependent and reliant andpossibly be related to less incidents of failure. Interestingly other important traits for As-sam, achievement motivation questions (3, 7 & 19) don’t show much correlation withinthemselves but they are highly correlated with other questions.
In the next section, we write the methodology and results. We report for each statethe variables which worked and then the individual questions having significant relationwith the performance.
IV WHAT MAKE ENTREPRENEURS?
A METHODOLOGY
We want to find out what make successful entrepreneurs. In doing so, we have tried tofind out how to select kiosk operators who could be successful entrepreneurs. We havefollowed a strategy to identify statistically significant relationships between the selectedvariables by first finding the correlation between different variables and then we use a setof multiple regressions to find out relations between variables. We have already reportedthe correlation results in previous section.
For the sake of simplicity, we have chosen log-linear (independent variable is linear)as the functional form for all of our regressions. The simple logarithm of sales data isthe dependent variable for all estimated regressions.
We propose to estimate the following regression for each of the combinations.
Yi = α + βi1Xi1 + β2Xi2 + · · · + βinXin + Ei . . . (1)
Yi stands for log of sales, α is the constant or intercept term, Xi represents the indepen-dent variables, βi represents the slopes or the coefficients corresponding to each Xi andEi is an error term.
First we grouped each of the psychometric variables with aptitude variables and back-ground variables. This gives us a set of combinations for each psychometric variable.
11

For example; with Achievement Motivation, one combination of variables is time pref-erence, risk aversion and IQ. A second combination would be with time preferenceand risk aversion. Similarly, in another combination, there is background and businessbackground. A single regression is also there to check the independent effect of achieve-ment motivation on sales performance. This strategy gives a large pool set of regressionresults.
From the above set of regressions we were able to identify variables which have sig-nificant relation with performance. Here it is important to mention that the datasets forUP and Assam were kept separate. All the above regressions were done separately forboth the states. The reason for not merging the data for the two states, as mentionedpreviously, was that the two states are different in many parameters, and the regressionresults were not similar for these two states. Merging in one dataset may have resultedin the loss of significant result for a particular variable.
Because we wanted to study separately the individual questions bearing any signifi-cant relation, we performed another set of regressions where questions have been takenas independent variable while the dependent variable remained the same as in the log-linear model.
Finally and most importantly Drishtee would be interested in developing a modelbased on which they can orient their selection strategy. We have developed a model tosuggest to Drishtee separately for UP and Assam.
B RESULTS
We have presented the result in two sub-sections one each for identification of importantof variables and questions.
1 Variables
Table 6 and 7 show our results from the estimation of equation (1) for different sets ofcombination of variables as discussed earlier. We find that three psychometric variablesare statistically significant for Assam, in contrast with UP which has one significantpsychometric variable. There are other factors like age and ‘other knowledge of borrow-ing’ (OK*Borrowing) which are instrumental in driving the performance of KOs in UP.We now discuss the results of regression analysis in greater detail.
From each set of regressions, we report only those variables for which coefficientsare significant in each combination in that set. Thus we have identified three variables,all psychometric which show statistically significant relations with sale performance forAssam: average aptitude, achievement and self-efficacy. Moreover, we don’t observeany significant variables from other group variables- background, business background,time preference, risk aversion.
In Table 6, for UP, only one psychological factor, achievement motivation, is statis-tically significant. ‘Other knowledge of borrowing’ and age are the other two factorsfrom background and business background group of variables which seem to drive salesperformance in UP.
Overall, the findings in Tables 6 and 7 suggest that, both the states are different withrespect to factors influencing sales performance. KOs in Assam are more driven byinternal factors, achievement motivation, self-efficacy and average of all psychological
12

Table 6
Psychometric Variables that worked for Assam and UPa
Assam UP
Regression combinations Average Aptitude Ach Motivation Self Efficacy Ach M
Regr1 0.477 0.427 0.301 −0.322
(0.040) (0.005) (0.048) (0.025)
[0.073] [0.147] [0.066] [0.074]
Regr2 0.419 0.390 0.274 −0.306
(0.104)∗ (0.015) (0.077) (0.037)
[0.064] [0.138] [0.076] [0.087]
Regr3 0.466 0.386 0.312 −0.307
(0.072) (0.015) (0.050) (0.049)
[0.083] [0.144] [0.096] [0.023]
Regr4 0.474 0.383 0.326 −0.310
(0.086) (0.018) (0.059) (0.049)
[0.059] [0.122] [0.074] [0.005]
Regr5 0.488 0.389 0.192 −0.346
(0.042) (0.017) (0.112)∗ (0.016)
[0.046] [0.086] [0.068] [0.123]
Regr6 0.544 0.393 0.453 −0.284
(0.062) (0.024) (0.028) (0.058)
[−0.059] [−0.009] [−0.015] [0.153]
aNotes:
a. Each entry in this table corresponds to a different regression.b. The columns show the variables that worked for each state; first three columns are for Assam and
the last one is for UP.c. Column 1 shows various combinations of the independent variables. The dependent variable is
the same for all regressions. For example Reg1 for the entire column has only one independentvariable which is psychometric variable in that column. Reg2 includes TP1, RA1 and Sum IQ withthe psychometric trait that column. Similarly other combinations are depicted.
Independent variables
Reg1 Reg2 Reg3 Reg4 Reg5 Reg6
Psychometriccharacteristics
Psychometriccharacteristics+ TP1, RA1,SumIQ
Psychometriccharacteristics+ TP2, RA2,SumIQ
Psychometriccharacteristics+ TP2, RA2,IQ1, IQ2
Psychometriccharacteristics+ Background
Psychometriccharacteristics+ Businessbackground +Bacground
d. Background and business background contains other variables of those groups.e. The first number in each cell is the estimated coefficient of the regression, the second number is
the estimated p value (in round brackets) and the third number is the estimated R2 (in squaredbrackets).
13

factors, whereas age of KO’s and some knowledge of borrowing along with internal
motivation for achievement seem to affect the performance in UP. Next we analyze the
results of both the states separately.
a) Assam
In Table 6, Regression1 shows the result when only one independent variable is used.
For Assam, the coefficient of the three psychometric variables is significant at p value
of, 0.04, 0.005 and 0.048 for average aptitude, achievement motivation and self efficacy
respectively. However when time preference1 (TP1), risk aversion1 (RA1) and cogni-
tive traits (Sum IQ) are included in Reg2, the significance of the coefficient of average
aptitude drops to an insignificant 10.4%. The other two also show a decline to 1.5% and
7.7% respectively. In four successive sets of regressions with TP2, RA2, SumIQ; TP2,
RA2, IQ1, IQ2; Background and Business Background, the coefficients of average ap-
titude and achievement motivation are significant at below 8.6% and 2.4% respectively.
Self efficacy is also significant for all regressions at below 7.7% except with background
where it drops to 11.2%.
b) UP
The last column of Table 6 focuses on UP and it presents result for achievement mo-
tivation. When it is regressed individually, the significance level is at 2.6% and sub-
sequently decreases to 3.7%, 4.9%, 4.9% and 5.8% with the addition of effects of TP1,
RA1, SumIQ; TP2, RA2, SumIQ; TP2, RA2, IQ1, IQ2 and Business Background. How-
ever inclusion of background increases the significance level of achievement motivation
coefficient to 1.6%.
Table 7 reports our result for variables Age and Other Knowledge of borrowing of
KOs in UP. The first column presents the results of all the sets of regression of psy-
chological traits with background in which age coefficient is significant. It can be
observed that age is significant in each of these regressions at below 5.7%. Simi-
larly the last two columns show the regression results of all the psychological traits
when background and business background are taken together. The results indicate that
OK*Borrowing is significant for AA, PW, LC, SE and MC at 7.5%, 3.1%, 4.6%, 3.1%
14

and 3.9% while Age is significant for PW, LC, SE and MC at 5.9%, 9%, 8.4% and
6.9%respectively.
Table 7
Other Variables that worked for UPa
UP
Background Background and Business Background
Age Age OK*Borrow
Avg Apt 0.086 0.045 1.670
(0.055) (0.422)∗ (0.075)
[0.017] [0.140]
ND 0.083 0.060 1.433
(0.057) (0.318)∗ (0.199)∗
[−0.064] [0.079]
PW 0.092 0.087 1.600
(0.032) (0.059) (0.031)
[0.113] [0.228]
Ach M 0.085 0.081 1.044
(0.046) (0.090) (0.202)∗
[0.123] [0.153]
LC 0.086 0.087 1.611
(0.057) (0.084) (0.046)
[0.006] [0.077]
SE 0.086 0.077 1.721
(0.056) (0.118)∗ (0.031)
[0.009] [0.115]
MC 0.086 0.090 1.632
(0.052) (0.069) (0.039)
[0.042] [0.114]
aNotes:
a. Similar to Table 6, each entry corresponds to different regressions. First column shows regression
of background variables with each of the psychometric variable.
b. Each entry in the last two columns depicts result of a single regression.
c. The first number in each cell is the estimated coefficient of the regression, the second number is
the estimated p value (in round brackets) and the third number is the estimated R2 (in squared
brackets).
d. Significant p values are shown in bold.
15
One important observation for both states is that none of the variables from the group
of time preference, risk aversion and cognitive traits are significant. These results at first
glance may seem to be contrary to the conventional wisdom that an entrepreneur is re-
quired to make risky decisions in an uncertain environment and hence only those persons
who are able to bear higher risks should perform well. However, we have measured risk
taking propensity of established KOs or at least who are experienced in running the kiosk
for sometime which might be different from that of a new or aspiring KO (Brockhaus
1987).
Also, IQ and time preference are generally perceived to be two important drivers of
entrepreneur performance. Surprisingly, our results say that KO’s need not be very high
on IQ and being patient is not an important factor for their performance.
A tentative explanation for these results is as follows: most KOs of Drishtee are from
a rural background3 with poor education4 who have opted to become entrepreneurs not
because it was their dream, but because they lacked other opportunities of regular em-
ployment in a salaried job.
It seems intuitively appealing for us to expect KOs to possess all the typical char-
acteristics expected from entrepreneurs but they are not entrepreneurs in the accepted
sense. Previous studies have considered successful entrepreneurs as their subject based
on which these characteristics have been identified. Further these studies are mostly
representative of the characteristics of those entrepreneurs who despite of having other
options of employment, opt for own enterprise because of a strong wish to follow their
passion. On the other hand, our study is focused on UP and Assam, two underdeveloped
states of India where literacy and employment are major problems. Drishtee’s KOs from
both the states score poorly on IQ which could be one reason why no significant rela-
tionship between risk aversion or time preference with performance was found for them
(Frederick 2005).
3Average villages populations 26171.87 for UP and 8491.11 for Assam4Education average: UP 0.84 and Assam 0.44 ( 2 is for M.A and -1 for study till class X)
16

Thus, of the wide variety of factors selected for this study, only few are identified as
statistically significant and relevant characteristics of successful KOs. The identification
of such factors provides us with a platform for making selection criteria for them.
We proceed in our study to find out which questions in the survey seem to have a
significant relationship with sales performance of KO’s.
2 Questions
Table 8 presents the results of the regressions in similar fashion as we did for psy-
chometric traits. We estimated equation (1) having independent variables as individual
questions and dependent variables as the log of sales for the two states separately.
The results found reinforce the results obtained in trait identification. As expected, the
important questions found for the two states are not the same. Though questions relating
to the KO’s psychometric traits are found to be related to performance in Assam, only
four questions (numbers 13, 16, 17 and 19) are found to be significant. On the other
hand, UP has five significant questions (5, 10, 17, 19 and 20) from the psychometric
group even though we have only one psychometric trait, achievement motivation, as an
important factor for performance. Now we explain the details of questions for the two
states.
a) Assam
Assam has four questions, one each from the groups ND, MC, SE and AM. Questions 17
and 19 are from SE and AM respectively which has already been identified as important
factors. But question 13 and 16 of ND and MC respectively emerge from nowhere in
our analysis and have not been identified earlier. The importance of these two questions
from different traits can be understood because of the reason that Assam’s KOs are more
influenced by psychometric traits than other factors.
17

Table 8
Significant Questions identified for Assam and UPa
Assam UP
Q13 Q16 Q17 Q19 Q5 Q10 Q17 Q19 Q20
Reg1 −0.586 −0.15 −0.256 0.272 0.181 −0.702
Q1−5, 15−20 (0.026) (0.028) (0.015) (0.005) (0.009) (0.002)
[0.235] [0.242] [0.242]
Reg2 0.086
Q1−15 (0.054)
[−0.022]
Reg3 −0.15 0.334 −0.157 0.077 0.156 0.224
Q6−20 (0.105) (0.025) (0.041) (0.081) (0.023) (0.055)
[0.186] [0.151]
Reg4 0.172
Q1−10 (0.0128)
[0.073]
Reg5 −0.171 0.320 −0.174 0.351 0.129 −0.479
Q11−20 (0.042) (0.019) (0.016) (0.014) (0.084) (0.033)
[0.2372] [0.1494]
Reg, SE 0.232 0.175 −0.573
(0.08) (0.078) 0.0086
[0.045] [0.1033]
Reg, AchM −0.161 0.1403
(0.0145) (0.035)
[0.177] [0.049]
aNotes:
a. Similar to table 6, each entry corresponds to a different regression. First five columns of results
are for UP and the last four columns for Assam.
b. The first column is shows the questions used in regression. For example, Reg1 use questions 1 to
5 and 15 to 20. Similarly, Reg2 has questions 1 to 15. The last two columns contains the questions
from the group of SE and AchM
c. The first number in each cell is the estimated coefficient of the regression, the second number is
the estimated p value (in round brackets) and the third number is the estimated R2 (in squared
brackets).
d. Significant p values are shown in bold.
18

b) UP
Surprisingly, UP has more significant questions than Assam. Out of five identified as
significant, two questions, Q17 and 20 are from SE and one question, Q5 is from LC.
It appears that though SE was not identified as an important trait of the KO’s from UP,
it does in fact play a role in performance for UP as well. LC shows positive correlation
with SE for both the states and finally one of the important questions for UP comes out
from LC. Similar to Assam, one question, Q10 is from ND but there is no question from
MC like the one for Assam.
V RECOMMENDATION
Finally we come back to the equation (1) to suggest a model for the two states based on
the analysis so far. As we have already seen, the variables as well as the questions that
worked for Assam are different from UP. Hence while selecting KOs in two states; the
variables to look for should be different. Based on the results, we suggest that the level
of sales performance is a function of the different variables and questions and Drishtee
should use this as a model to test the aspiring entrepreneurs to forecast about their sales
performance in future.
For Assam, the variables driving performance are: average psychometric aptitude,
self-efficacy and achievement motivation. And the questions which show significant
relations are 13, 16, 17 and 19.
Selection Model for Assam
Ln(Sales) = α + 0.477 ∗ Avg Apt + 0.427 ∗ AchM + 0.301 ∗ SE
− 0.171 ∗ Q13 − 0.586 ∗ Q16 + 0.32 ∗ Q17 − 0.174 ∗ Q19
Similarly for UP, the important variables are: achievement motivation, age and other
knowledge of borrowing. UP has five questions significantly related to the sales perfor-
mance.
Selection Model for Assam
Ln(Sales) = α − 0.322 ∗ AchM + 0.092 ∗ Age + 1.6 ∗ OKB − 0.256 ∗ Q5
+ 0.172 ∗ Q10 + 0.272 ∗ Q17 + 0.181 ∗ Q19 − 0.702 ∗ Q20
VI CONCLUSION
The primary objective of this paper is to document systematic behavioural differences
that affect the performance of successful entrepreneurs, specifically rural entrepreneurs.
We have developed an empirical framework for KOs of Drishtee to analyze the impor-
tance of various factors and questions to sales performance. We found considerable
heterogeneity across entrepreneurs from two different states. The performance appears
19

to be systematically driven by psychological factors for Assam; it is dependent on age
and knowledge of borrowing in addition to the psychological factors in UP. We also
found some questions which have a strong relation with performance of KO’s. More-
over, entrepreneurs with high sales performance, score high on certain questions for the
two states. Thus, the selection criterion is also different for two states and a selection
strategy has been developed based on these findings. While the framework we follow
is quite extensive, it doesn’t allow us to estimate the causal effect of Drishtee’s poli-
cies on performance. Thus, although the findings of the paper focus on the Drishtee
case, the analysis and methodology developed could have a much broader interest for
organizations involved in rural entrepreneurship.
As for further research, we come across issue of variation in the entrepreneurial traits
with respect to culture, geography and also macro economic status of the country. For
those involved in selection activities, it would be important to know whether they prefer
entrepreneurial qualities over managerial skills or a balance of both. And further the role
of training for grooming of skills required for sustaining over business cycles.
20

REFERENCE
Bandura, A. (1994). Self-efficacy. In V. S. Ramachaudran (Ed.), Encyclopedia of human
behavior (Vol. 4, pp. 71–81). New York: Academic Press. (Reprinted in H. Friedman
[Ed.], Encyclopedia of mental health. San Diego: Academic Press, 1998).
Block, J., Wagner, M., (2006). “Necessity and Opportunity Entrepreneurs in Germany:
Characteristics and Earnings Differentials”, MPRA Paper 610.
Bonnett, C., Furnham, A. (1991), “Who wants to be an entrepreneur? A study of ado-
lescents interested in a young enterprise scheme”, Journal of Economic Psychology,
Vol. 12 pp. 465–478.
Brockhaus, R.H. (1987), “Risk Taking Propensity of Entrepreneurs”, The Academy of
Management Journal, Vol. 23, No. 3. (Sep., 1980), pp. 509–520.
Brockhaus, R.H. (1980), “Psychological and environmental factors which distinguish
the successful from the unsuccessful entrepreneur: a longitudinal study”, Proceed-
ings, Academy of Management, pp. 368–372.
Cassidy, T., Lynn, R. (1989), “A multifactorial approach to achievement motivation”,
Journal of Occupational Psychology, Vol. 62, pp. 301–312.
Chell, E. (1986), “The entrepreneurial personality: a review and some theoretical devel-
opments”, in Curran, J., Stanworth, J., Watkins, D. (Eds), The Survival of the Small
Firm, Vol. 1.
Chell, E., Haworth, J., Brearley, S. (1991), The Entrepreneurial Personality: Concepts,
Cases and Categories, Routledge, London.
Edwards, A.L. (1957), Techniques of Attitude Scale Construction, Appleton-Century-
Crofts, New York, NY.
Frederick, Shane (2005), “Cognitive Reflection and Decision Making”, Journal of Eco-
nomic Perspectives, Vol. 19, No. 4 (Fall) pp. 25–42.
Furnham, A. (1986), “Economic locus of control”, Human Relations, Vol. 39 pp. 29–43.
Hermans, H. J. (1970). “A questionnaire measure of achievement motivation”, Journal
of Applied Psychology, Vol. 54, 353–373.
Levenson, H. (1974). Activism and powerful others: Distinctions within the concept of
internal-external control. Journal of Personality Assessment, 38, 377–383.
21

Livingston, J. A. (1996). “Effects of metacognitive instruction on strategy use of college
students”. http://www.gse.buffalo.edu/fas/shuell/CEP564/Metacog.htm.
Johnson, B.R. “Towards a multidimensional model of entrepreneurship: the case of
achievement motivation and the entrepreneur”, Entrepreneurship Theory and Prac-
tice.
Locke, E. A. (1993). The traits of American business heroes. University of Maryland:
Unpublished manuscript
Lynn, R. (1969), “An achievement motivation questionnaire”, British Journal of Psy-
chology, Vol. 60 pp. 529–34.
McClelland, D. (1958), “The use of measuring human motivation”, in Atkinson, J.W.
(Eds), Motives in Fantasy, Action and Society, Van Nostrand, Princeton, NJ.
McClelland, D.C. (1966), “Longitudinal trends in the relation of thoughts to action”,
Journal of Consulting Psychology, Vol. 30 No. 6, pp. 479–483.
McClelland, D.C. (1987), “Characteristics of successful entrepreneurs”, Journal of Cre-
ative Behavior, Vol. 21 pp. 219–233.
Pandey, J., Tewary, N.B. (1979), “Locus of control and achievement values of en-
trepreneurs”, Journal of Occupational Psychology, No. 52, pp. 107–111.
Ridley, D.S., Schutz, P.A., Glanz, R.S. & Weinstein, C.E. (1992). Self-regulated learn-
ing: the interactive influence of metacognitive awareness and goal-setting. Journal of
Experimental Education 60 (4), 293–306.
Rotter, Julian B. “Generalized expectancies for interval versus external control of rein-
forcement.” Psychological Monographs, 80, (1966): 1–28.
Rybowiak, V., Garst, H., Frese, M., Batinic, B. (1999). Error orientation questionnaire
(EOQ): Reliability, validity, and different language equivalence. Journal of Organi-
zational Behavior, 20, 527–547.
Saal, F.E. (1978), “Job involvement: a multivariate approach”, Journal of Applied Psy-
chology, Vol. 63 pp. 53–61.
Schwarzer, R., Baßler, J., Kwiatek, P., Schroder, K., & Zhang, J.X. (1997), “The as-
sessment of optimistic self-beliefs: Comparison of German, Spanish, and Chinese
versions of the General Self-Efficacy Scale”. Applied Psychology: An International
Review, 46(1), 69–88.
22

Shapero, A. (1975), “The displaced uncomfortable entrepreneur”, Psychology Today,
November, pp. 83–89.
Smith, J.M. (1973), “A quick measure of achievement motivation”, British Journal of
Social and Clinical Psychology, Vol. 12 pp. 137–143.
Steers, R. M., Braunstein, D. N. (1976). Scale for measuring need of dominance. Journal
of Vocational Behavior, 9, 251–266.
Robins, S. P., (2003), Organizational Behavior, 98–99, New Delhi, India: Pearson
Education.
Warr, P., Cook, J., Wall, T. (1979), “Scales for the measurement of some work atti-
tudes and aspects of psychological wellbeing”, Journal of Occupational Psychology,
Vol. 52 pp. 129–148.
Winn, W. & Snyder D. (1996). Cognitive perspectives in pyschology. In D.H. Jonassen,
ed. Handbook of research for educational communications and technology, 112–142.
New York: Simon & Schuster Macmillan.
23

Appendix A: Correlation Matrix for Questions
Table 4
Correlation matrix for question for Assam
Assam
Q 1 2 3 4 5 6 7 8 9 10 11 12 13 14 15 16 17 18 19 20
1 −
2 0.01 −− −
3 0.25 0.05 −−
4 0.24 0.08 0.20 −
5 0.23 0.21 0.28 0.26 −−
6 0.21 0.10 0.05 0.44 0.41 −
7 0.02 0.09 0.33 0.30 0.25 0.36 −
8 0.05 0.17 0.27 0.39 0.33 0.32 0.42 −−
9 0.16 0.19 0.50 0.05 0.19 0.10 0.08 0.19 −−
10 0.21 0.08 0.28 0.17 0.53 0.21 0.20 0.17 0.43 −− − − − −
11 0.10 0.27 0.12 0.13 0.13 0.09 0.25 0.16 0.11 0.01 −−
12 0.06 0.04 0.29 0.15 0.29 0.11 0.01 0.46 0.24 0.23 0.09 −− − −
13 0.01 0.02 0.09 0.14 0.23 0.15 0.30 0.19 0.04 0.40 0.06 0.02 −− − − − −
14 0.24 0.04 0.08 0.08 0.06 0.13 0.16 0.18 0.18 0.05 0.48 0.17 0.07 −− −
15 0.07 0.31 0.12 0.05 0.24 0.05 0.29 0.12 0.36 0.30 0.26 0.05 0.17 0.21 −− − − −
16 0.03 0.18 0.29 0.07 0.42 0.06 0.20 0.12 0.27 0.32 0.27 0.24 0.20 0.10 0.40 −− − −
17 0.25 0.16 0.20 0.06 0.33 0.25 0.43 0.42 0.16 0.30 0.06 0.08 0.53 0.05 0.23 0.29 −− − − −
18 0.10 0.09 0.58 0.20 0.40 0.27 0.46 0.15 0.32 0.31 0.06 0.24 0.19 0.11 0.42 0.24 0.32 −− − − − − − − − − − − − −
19 0.09 0.24 0.05 0.13 0.13 0.12 0.02 0.14 0.10 0.09 0.36 0.16 0.21 0.08 0.19 0.09 0.20 0.03 −− − −
20 0.11 0.43 0.35 0.14 0.51 0.32 0.59 0.44 0.43 0.23 0.03 0.24 0.31 0.08 0.48 0.50 0.60 0.49 0.18 −
24

Table 5
Correlation matrix for questions for UP
UP
1 2 3 4 5 6 7 8 9 10 11 12 13 14 15 16 17 18 19 20
1 −−
2 0.04 −−
3 0.07 0.13 −−
4 0.38 0.02 0.18 −
5 0.05 0.36 0.16 0.19 −− −
6 0.11 0.15 0.06 0.05 0.19 −−
7 0.07 0.06 0.03 0.25 0.12 0.26 −
8 0.16 0.08 0.16 0.28 0.31 0.26 0.14 −− −
9 0.05 0.21 0.39 0.13 0.24 0.05 0.07 0.06 −− −
10 0.09 0.21 0.17 0.19 0.15 0.14 0.14 0.01 0.03 −− −
11 0.27 0.11 0.25 0.23 0.04 0.06 0.04 0.15 0.29 0.01 −− − −
12 0.10 0.13 0.11 0.22 0.41 0.19 0.08 0.13 0.01 0.10 0.14 −− −
13 0.19 0.26 0.17 0.12 0.22 0.36 0.14 0.10 0.03 0.62 0.01 0.06 −− −
14 0.36 0.19 0.02 0.34 0.27 0.10 0.20 0.23 0.31 0.15 0.42 0.02 0.17 −− − − − − − − −
15 0.02 0.12 0.06 0.05 0.12 0.01 0.07 0.05 0.18 0.01 0.08 0.24 0.13 0.04 −−
16 0.04 0.17 0.02 0.22 0.09 0.05 0.06 0.15 0.02 0.07 0.00 0.27 0.03 0.06 0.57 −− − −
17 0.03 0.11 0.08 0.25 0.22 0.32 0.07 0.36 0.03 0.22 0.10 0.72 0.27 0.05 0.20 0.27 −− − −
18 0.19 0.09 0.22 0.44 0.33 0.07 0.23 0.41 0.07 0.02 0.29 0.27 0.00 0.14 0.02 0.04 0.17 −− − − − − − − − − − − − − − −
19 0.18 0.13 0.09 0.27 0.05 0.12 0.17 0.05 0.10 0.15 0.02 0.29 0.26 0.06 0.26 0.39 0.17 0.28 −− −
20 0.27 0.13 0.00 0.48 0.10 0.14 0.06 0.32 0.24 0.08 0.06 0.28 0.13 0.37 0.05 0.29 0.25 0.24 0.16
25

Appendix B: Questionnaire
I. Background Information
Name of respondent: ____________________________
Name of surveyor: _____________________________ Date of survey
[MM/DD/YYYY] At what time did
the interview begin?
At what time did the interview
finish?
(1) What is the highest grade that you completed? ?
1…….None 2…….If Grade 1-10, till which grade? 3…….Class 12 passed 4…….Graduate 5…….Bed 6…….M.A 7…….M.A Bed
998….Refuse to answer (2) What is the occupation of your father?
------------------------------------------------------ (3) What was your occupation before you became a kiosk operator?
------------------------------------------------------- (4) What is the distance of your village from the nearest town?
-------------------------------------------------------kms (5) What is the approximate population of your village?
--------------------------------------------------------
(6) What is the proportion in which you sell Drishtee to Non Drishtee products?
---------------------------------------------------------
(7) How often, if ever, did you work or help in a small business immediately before starting your own?
1....... Regularly; at least once a week 2....... Irregularly; less than once a week 3....... Never; did not help in any small business 998…Refuse
(8) How many businesses have you managed in total in your entire life? ___________
Which were those businesses?
(9) When you were 16 years old, did your mother or father (or a person that you considered to be your mother or father) manage or run a business?
1…...Yes 2……No
26

998…Refuse Examples?
(10) Before you started business, did you know well friends or relatives who had managed or run a business?
1…Yes 2……No 998…Refuse
(11) Did anyone among your acquaintances – parents, friends or relatives - help you start your first business with concrete actions or recommendations?
1……Yes 2……No 998…Refuse Such as?
(12) Did starting your first business (if not the computer kiosk) require initial financing? 1……Yes 2……No 998…Refuse 3…….Does not apply
(13) If Answer is Yes in (7), then how much initial financing was required? Rs. _________
(14) If Answer is Yes in (7), then did the initial financing involve borrowing money? 1……Yes 2……No 998…Refuse
II. Main Survey – Part I
Please indicate the extent to which the following statements are true or false.
(1) It is chiefly a matter of fate whether or not I have few friends or many friends.
5 4 3 2 1 0 1 2 3 4 5 |---------|---------|---------|---------|---------|---------|---------|---------|---------|---------| very very false true
(2) When my way of running the business is not successful, I experiment with new different ways of running the business.
5 4 3 2 1 0 1 2 3 4 5 |---------|---------|---------|---------|---------|---------|---------|---------|---------|---------| very very false true
(3) Working hard is something I like doing very much.
5 4 3 2 1 0 1 2 3 4 5 |---------|---------|---------|---------|---------|---------|---------|---------|---------|---------| very very false true
(4) It is usually easy for me to stick to my aims and accomplish my goals.
5 4 3 2 1 0 1 2 3 4 5 |---------|---------|---------|---------|---------|---------|---------|---------|---------|---------| very very
27

false true
(5) I accomplish a lot at work because I love my job.
5 4 3 2 1 0 1 2 3 4 5 |---------|---------|---------|---------|---------|---------|---------|---------|---------|---------| very very false true
(6) When I get what I want, it is usually because I worked hard for it.
5 4 3 2 1 0 1 2 3 4 5 |---------|---------|---------|---------|---------|---------|---------|---------|---------|---------| very very false true
(7) When I am working, the demands I make upon myself are pretty high.
5 4 3 2 1 0 1 2 3 4 5 |---------|---------|---------|---------|---------|---------|---------|---------|---------|---------| very very false true
(8) I am confident that I could deal efficiently with unexpected events.
5 4 3 2 1 0 1 2 3 4 5 |---------|---------|---------|---------|---------|---------|---------|---------|---------|---------| very very false true
(9) I closely monitor the areas where I need more practice.
5 4 3 2 1 0 1 2 3 4 5 |---------|---------|---------|---------|---------|---------|---------|---------|---------|---------| very very false true
(10) I seek an active role in the leadership of groups that I am part of.
5 4 3 2 1 0 1 2 3 4 5 |---------|---------|---------|---------|---------|---------|---------|---------|---------|---------| very very false true
(11) Its not always wise to plan too far ahead since many things turn out to be a matter of good or bad fortune.
5 4 3 2 1 0 1 2 3 4 5 |---------|---------|---------|---------|---------|---------|---------|---------|---------|---------| very very false true
(12) I set goals for myself in order to direct my activities for making the business a success.
5 4 3 2 1 0 1 2 3 4 5 |---------|---------|---------|---------|---------|---------|---------|---------|---------|---------| very very false true
28

(13) When working in a group, I prefer being “in command” rather than being a follower.
5 4 3 2 1 0 1 2 3 4 5 |---------|---------|---------|---------|---------|---------|---------|---------|---------|---------| very very false true
(14) Most leaders have reached their positions because they were lucky enough to be in the right place at the right time.
5 4 3 2 1 0 1 2 3 4 5 |---------|---------|---------|---------|---------|---------|---------|---------|---------|---------| very very false true
(15) I look forward to returning to work when I am away from my work.
5 4 3 2 1 0 1 2 3 4 5 |---------|---------|---------|---------|---------|---------|---------|---------|---------|---------| very very false true
(16) I figure out which things I do not understand well and adjust my strategies accordingly.
5 4 3 2 1 0 1 2 3 4 5 |---------|---------|---------|---------|---------|---------|---------|---------|---------|---------| very very false true
(17) I can remain calm when facing difficulties because I can rely on my coping abilities.
5 4 3 2 1 0 1 2 3 4 5 |---------|---------|---------|---------|---------|---------|---------|---------|---------|---------| very very false true
(18) Most of my life’s satisfaction is derived from my work.
5 4 3 2 1 0 1 2 3 4 5 |---------|---------|---------|---------|---------|---------|---------|---------|---------|---------| very very false true
(19) Other people think I don’t work very hard.
5 4 3 2 1 0 1 2 3 4 5 |---------|---------|---------|---------|---------|---------|---------|---------|---------|---------| very very false true
(20) When confronted with a problem, I can usually find several solutions.
5 4 3 2 1 0 1 2 3 4 5 |---------|---------|---------|---------|---------|---------|---------|---------|---------|---------| very very false true
29

III. Main Survey – Part II
(1) Please give us your best answer for each question below.
I would be indifferent between getting Rs. 40 right now or getting Rs. ______ in 10 years.
If a young mango tree is currently two feet tall, how tall will it be in 10 years?
______ feet tall
The average price of gasoline in India is currently Rs.50 a litre. What will its price be in 10 years?
Rs.______ a litre.
In 10 years, I will have ______% of what I need to retire.
(2a) Do you currently have any money saved or invested? (This might include savings accounts, mutual funds, stocks, bonds, or anything else you consider an investment.)
YES NO
Do you have any land holdings or anything else that you consider as saving?
YES NO
(2b) If you received Rs.100 today and you saved it for one year in a savings bank
account, approximately how much would you expect it to be worth?
About Rs._____
(2c) If you borrowed Rs.100 today and paid it back in one year, approximately how much
would you have to repay?
About Rs._____
Is this borrowing from a formal or informal source?
-------------------------------------------------------------------------------------------------
----------------
(2d) For each of the eleven options below (a through k), circle which option you would prefer to receive. (Assume that the money would be received with certainty.)
Rs. 1000 today OR
a) Rs.1000 in one year b) Rs.1050 in one year
c) Rs.1100 in one year d) Rs.1150 in one year
e) Rs.1200 in one year f) Rs.1250 in one year
g) Rs.1300 in one year h) Rs.1350 in one year
i) Rs.1400 in one year j) Rs.1450 in one year
k) Rs.1500 in one year
30

(4) For each of the 16 choices in the table below, please circle the option you prefer.
Choice 1 Banana Oranges
Choice 2 Rs 3400 this month Rs 3800 in two months
Choice 3 Gulab Jamun Rasmalai
Choice 4 a 15% chance of Rs.1,000,000 Rs.500 for sure
Choice 5 saving money spending money
Choice 6 Rs.100 for sure a 50% chance of Rs.300
Choice 7 Lottery ticket Ice-cream
Choice 8 an 80% chance of Rs.20 a 10% chance of Rs.150
Choice 9 being successful having fun
Choice 10 flip a coin and win Rs.200 for “HEADS”, but lose Rs.100 for “TAILS”.
Rs.5 for sure
Choice 11 Cricket Soccer (Football)
Choice 12 win Rs.100 for sure get a 75% chance to win Rs.200
Choice 13 Amitabh Bachchan movie Shahrukh Khan movie
Choice 14 lose Rs.100 for sure take a 75% chance to lose Rs.200
Choice 15 Potato chips Chocolate
Choice 16 25% chance of Rs.3,000 20% chance of Rs.4,000
(5) Below are several problems that vary in difficulty. Try to answer as many as you can.
1) A bat and a ball cost Rs 1.10 in total. The bat costs Rs. 1.00 more than the ball. How much does the ball cost?
______ paise
2) If it takes 5 machines 5 minutes to make 5 widgets, how long would it take 100 machines to make 100 widgets?
______ minutes
3) In a lake, there is a patch of lilypads. Every day, the patch doubles in size. If it takes 48 days for the patch to cover the entire lake, how long would it take for the patch to cover half of the lake?
______ days
31
32

(7) Compared to the average person taking this survey today, how seriously did you take this survey?
5 4 3 2 1 0 1 2 3 4 5 |---------|---------|---------|---------|---------|---------|---------|---------|---------|---------| much about much less average more than than average average
(8) Compared to the average person taking this survey today, how much do you like taking risks?
5 4 3 2 1 0 1 2 3 4 5 |---------|---------|---------|---------|---------|---------|---------|---------|---------|---------| much about much less average more
than than average average
(9) Compared to the average person taking this survey today, how much money do you have in your wallet or purse right now?
5 4 3 2 1 0 1 2 3 4 5 |---------|---------|---------|---------|---------|---------|---------|---------|---------|-------| much about much less average more
than than average average
(10) Compared to the average person taking this survey today, how much do you trust people?
5 4 3 2 1 0 1 2 3 4 5 |---------|---------|---------|---------|---------|---------|---------|---------|---------|---------| much about much less average more
than than average average
(11) Compared to the average person taking this survey today, how happy are you?
5 4 3 2 1 0 1 2 3 4 5
|---------|---------|---------|---------|---------|---------|---------|---------|---------|---------| much about much less average more
than than average average
33