welcome intro slide - agrilinks · pastoralism resilience in north eastern kenya . pastoralist...
TRANSCRIPT
Enhancing Livestock Resilience and Pastoral Livelihoods in Africa
May 17, 2012
Presenters Francis Chabari, CNFA Jurjen Draaijer, CNFA
John McPeak, Syracuse University
Welcome
Intro Slide

Upcoming Events
• May 22 | Breakfast Seminar: Feed the Future's NAFAKA Project in Tanzania
• May 30 | Ag Sector Council Seminar
• May 31 | MSU Food Security III Event
Upcoming Events
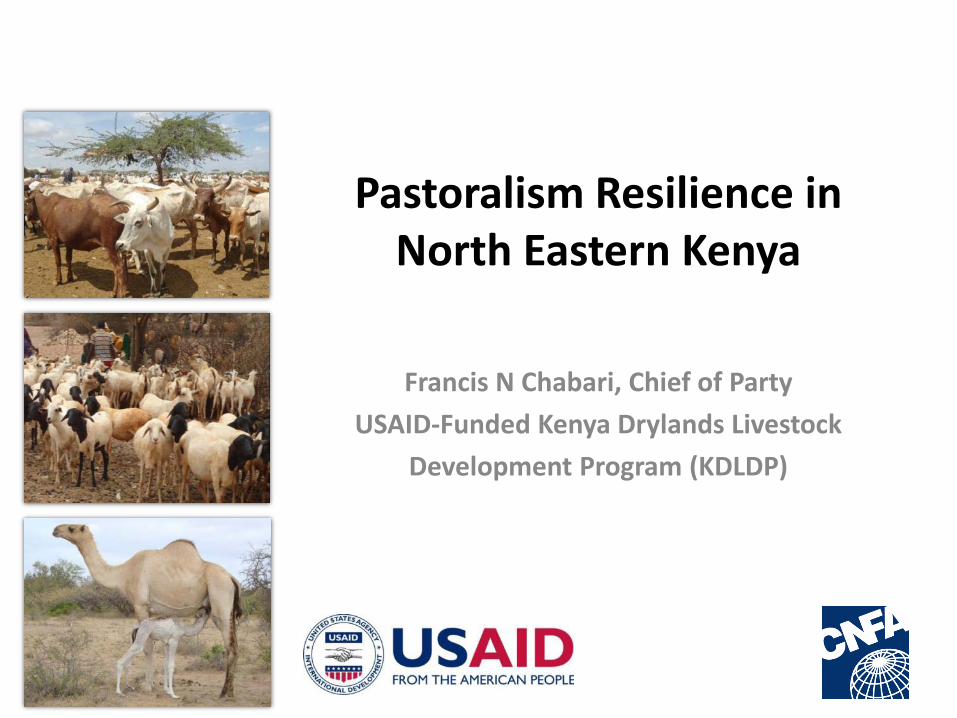
Francis N Chabari, Chief of Party
USAID-Funded Kenya Drylands Livestock
Development Program (KDLDP)
Pastoralism Resilience in North Eastern Kenya

Pastoralist Resilience
Resilience The ability of a social or ecological system to absorb
disturbances while retaining the same basic structure and ways of functioning, the capacity for self-organization, and the capacity to adapt to stress and change
Pastoralists Pastoralists are agriculturalists who keep domesticated
livestock on natural pastures and depend upon their animals as their primary source of income
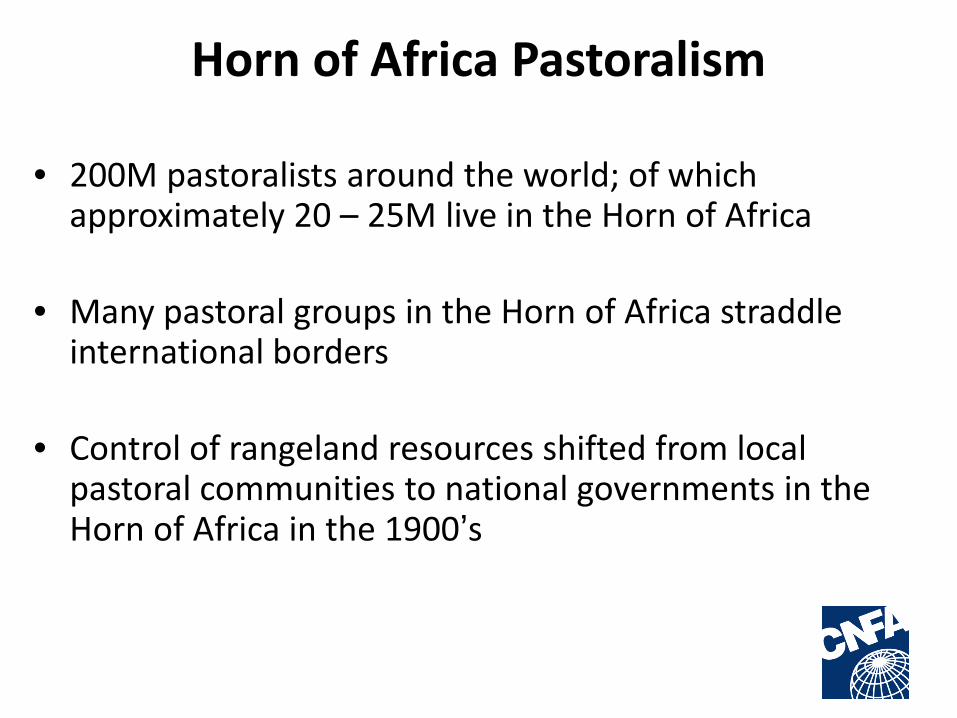
Horn of Africa Pastoralism
• 200M pastoralists around the world; of which approximately 20 – 25M live in the Horn of Africa
• Many pastoral groups in the Horn of Africa straddle
international borders • Control of rangeland resources shifted from local
pastoral communities to national governments in the Horn of Africa in the 1900’s
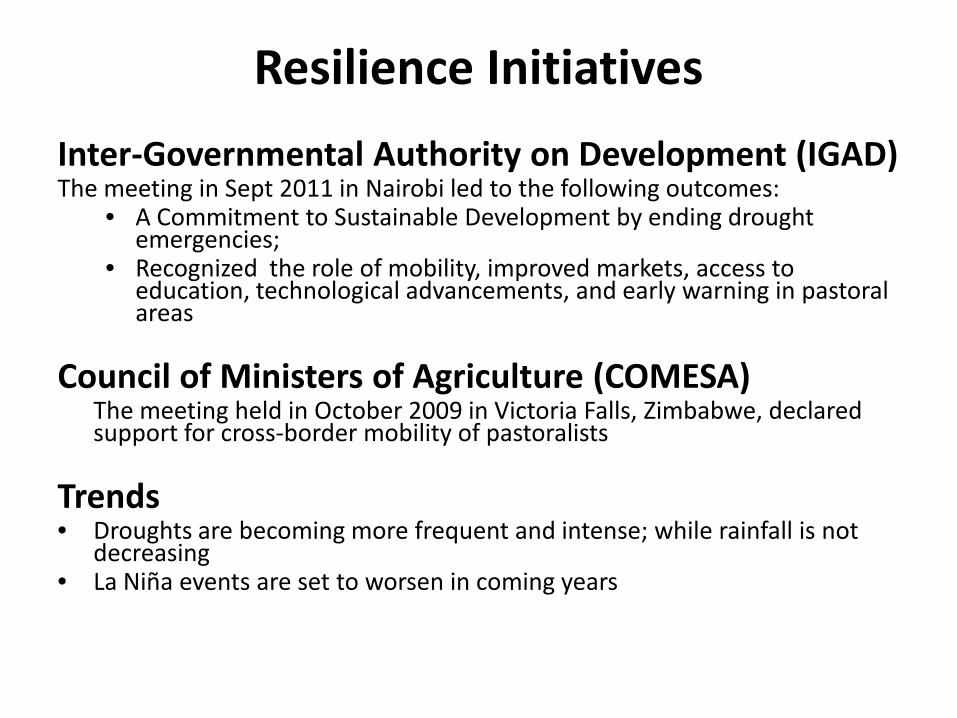
Resilience Initiatives
Inter-Governmental Authority on Development (IGAD) The meeting in Sept 2011 in Nairobi led to the following outcomes:
• A Commitment to Sustainable Development by ending drought emergencies;
• Recognized the role of mobility, improved markets, access to education, technological advancements, and early warning in pastoral areas
Council of Ministers of Agriculture (COMESA) The meeting held in October 2009 in Victoria Falls, Zimbabwe, declared
support for cross-border mobility of pastoralists Trends • Droughts are becoming more frequent and intense; while rainfall is not
decreasing • La Niña events are set to worsen in coming years
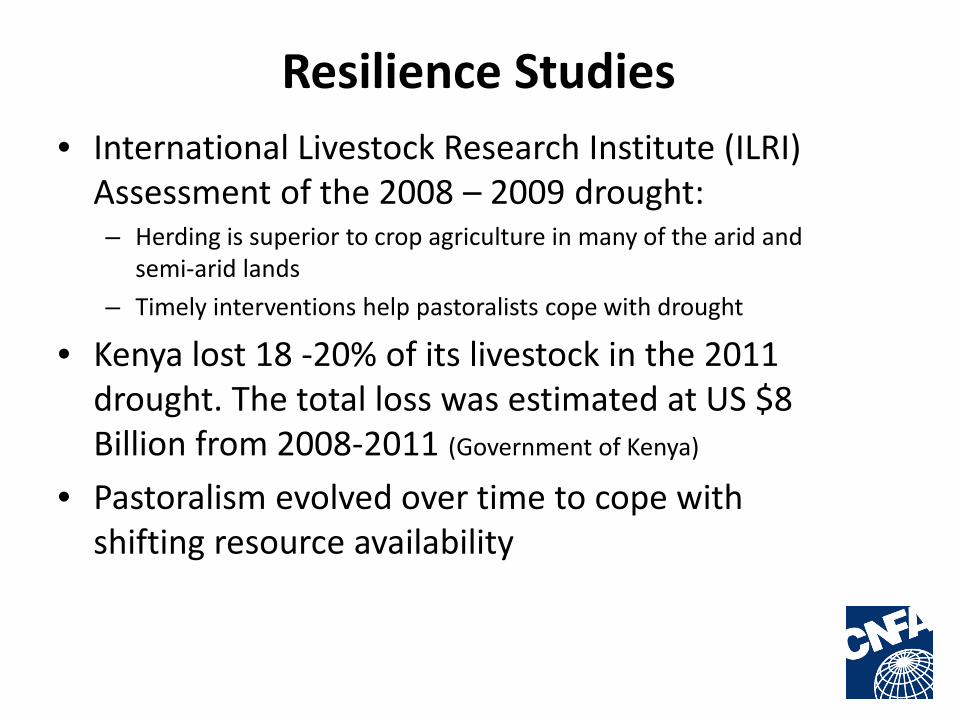
Resilience Studies • International Livestock Research Institute (ILRI)
Assessment of the 2008 – 2009 drought: – Herding is superior to crop agriculture in many of the arid and
semi-arid lands
– Timely interventions help pastoralists cope with drought
• Kenya lost 18 -20% of its livestock in the 2011 drought. The total loss was estimated at US $8 Billion from 2008-2011 (Government of Kenya)
• Pastoralism evolved over time to cope with shifting resource availability
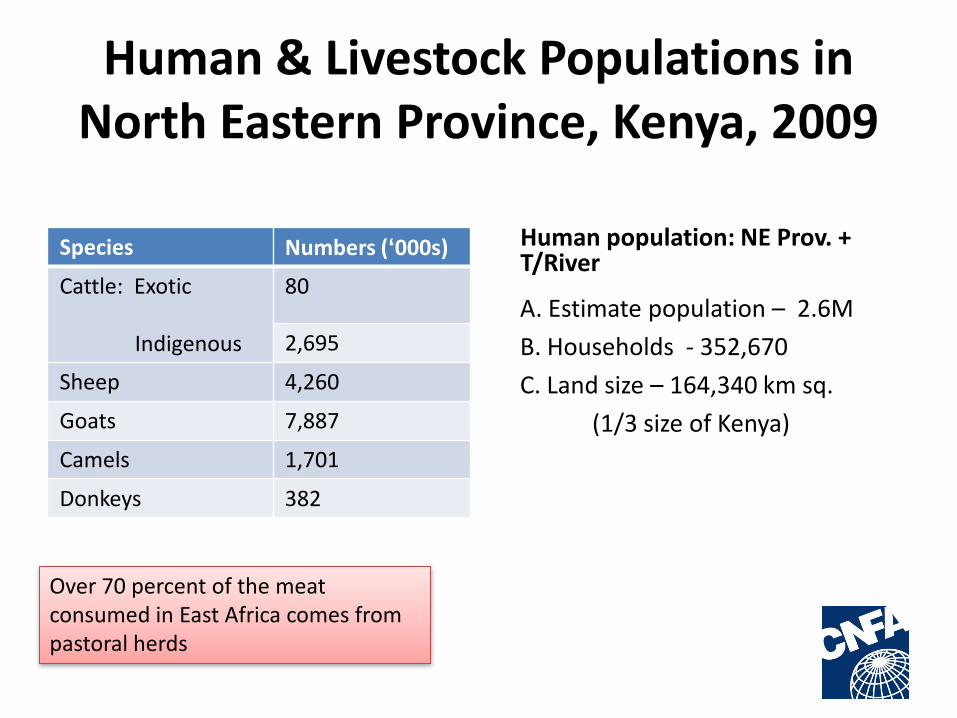
Human & Livestock Populations in North Eastern Province, Kenya, 2009
Species Numbers (‘000s)
Cattle: Exotic
Indigenous
80
2,695
Sheep 4,260
Goats 7,887
Camels 1,701
Donkeys 382
Human population: NE Prov. + T/River
A. Estimate population – 2.6M
B. Households - 352,670
C. Land size – 164,340 km sq.
(1/3 size of Kenya)
Over 70 percent of the meat consumed in East Africa comes from pastoral herds
• Proposed key land tenure reforms and DRR planning
• Access rights to key resources: wetlands, forests, water, mineral/salt licks
• Strengthening pastoral associations, indigenous civil society and advocacy forums
• Growth of pastoral contribution to national economies
For the Future
•Capacity building – a necessary foundation for technological interventions
•Expanded use of ICT for market information and mobile banking facilities
•Important to conserve local breeds of livestock •Control of trans-boundary and other economically significant range diseases for un-interrupted trade
For the Future ….(cont’d)
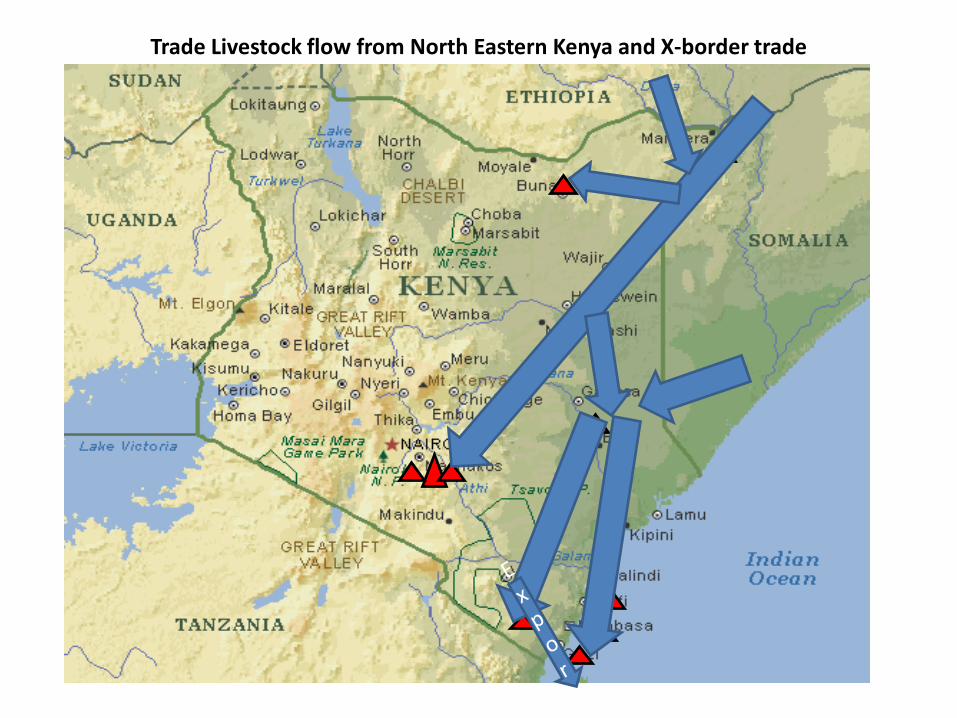
Trade Livestock flow from North Eastern Kenya and X-border trade
For the Future (cont’d)
• Human population control • Policies facilitating cross-border mobility • Institutional structures for resources management
and conflict resolution • Inclusion of women in decision making structures
• Representation of LVC actors in devolved
government structures • Expanded physical and social infrastructure and
opportunities for formal education for pastoralist children
For the Future (cont’d)
• Diversified livelihoods with greater attention to pastoral drop outs
• Early commercial off-take of non-core breeding stock when drought is imminent
• Livestock mix: more camels in drylands
• Expand production where feasible; this competes very effectively with other farm enterprises
USAID-Funded KDLDP Key Interventions
• Access to markets and market linkages
• Value addition to livestock products
• Productivity and competitiveness
• Creating enabling policies for production and marketing
• Adaptation to climate change
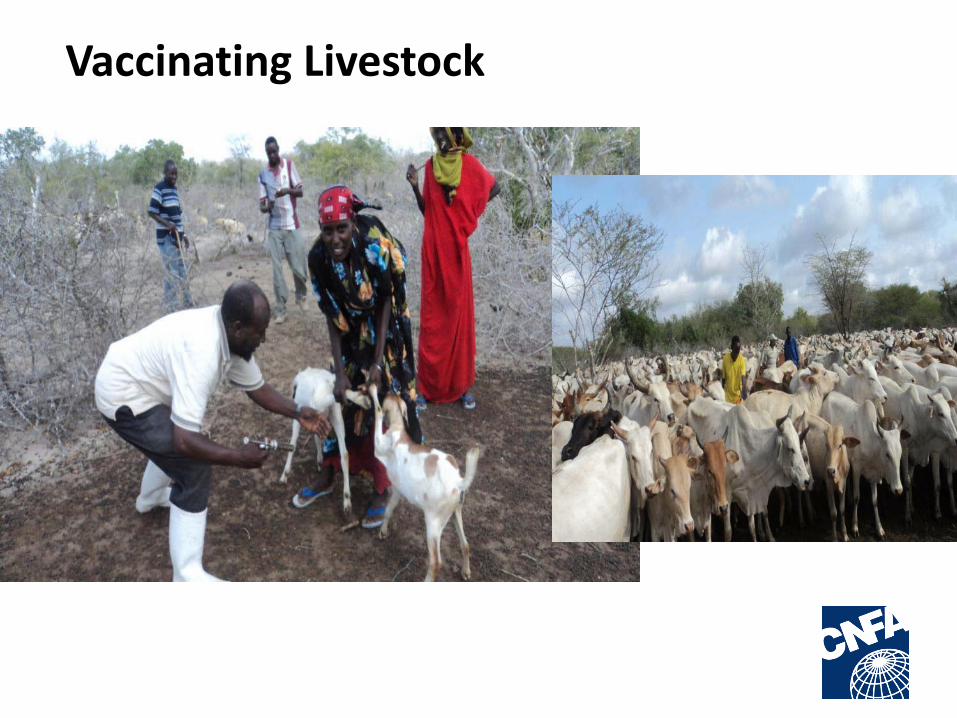
Vaccinating Livestock
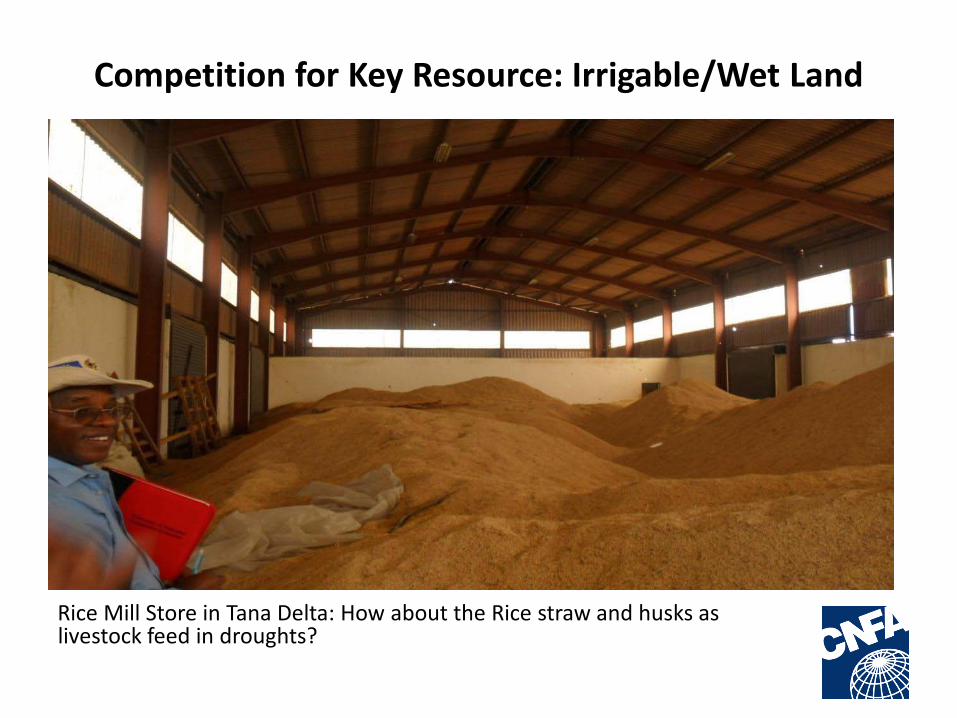
Competition for Key Resource: Irrigable/Wet Land
Rice Mill Store in Tana Delta: How about the Rice straw and husks as livestock feed in droughts?
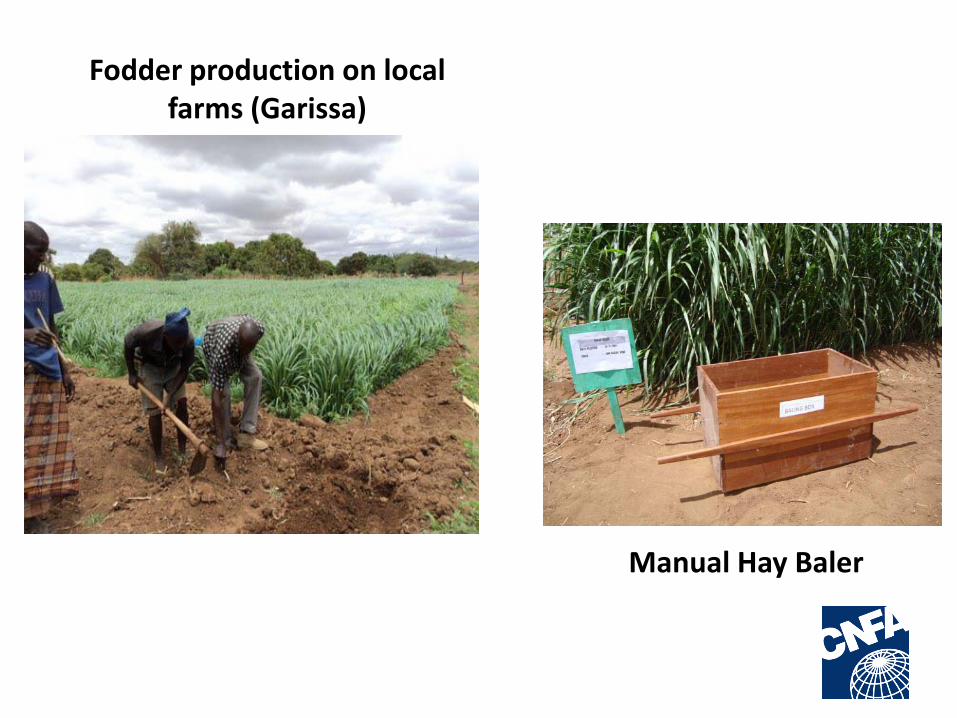
Fodder production on local farms (Garissa)
Manual Hay Baler
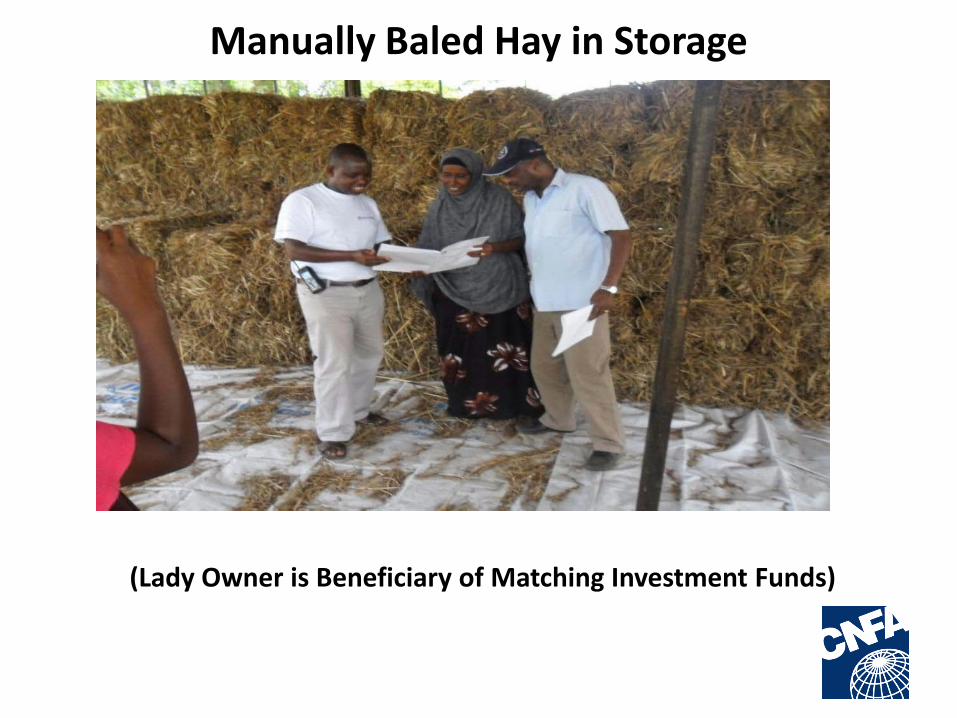
Manually Baled Hay in Storage
(Lady Owner is Beneficiary of Matching Investment Funds)

Value Addition
Processing Camel Milk into Yoghurt

Value Addition
Two Volunteers from Oklahoma State University (right)

Conclusion
Pastoralism has survived over millennia because it changes and adapts
Pastoralism is here to stay
Thanks

Competitiveness improvement of the livestock value chain in Somaliland
Partnership for Economic Growth (PEG)
Funded by USAID/East Africa Implemented by DAI and CNFA
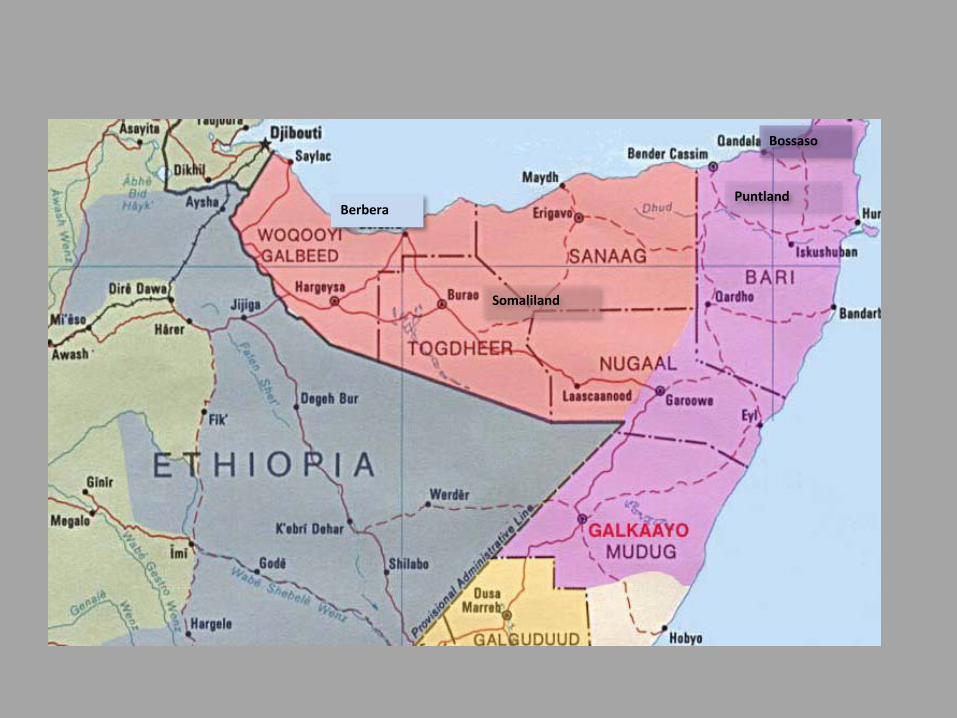
Berbera
Bossaso
Somaliland
Puntland
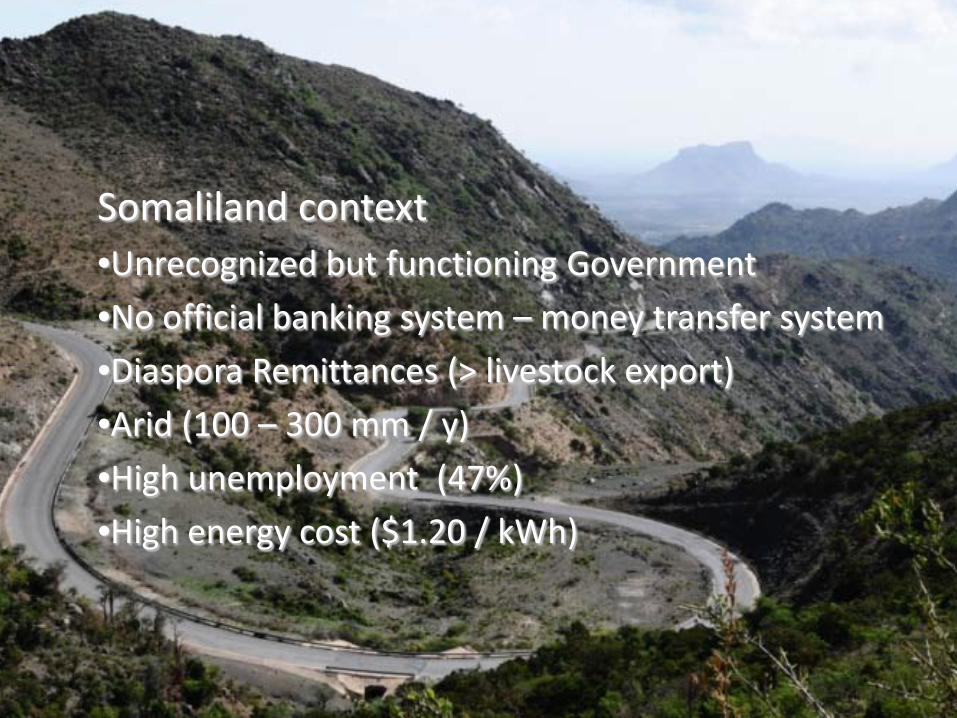
Somaliland Context
Somaliland context •Unrecognized but functioning Government
•No official banking system – money transfer system
•Diaspora Remittances (> livestock export)
•Arid (100 – 300 mm / y)
•High unemployment (47%)
•High energy cost ($1.20 / kWh)

Somaliland Livestock Production
• 65% of GDP
• Pastoralist extensive livestock production system • goats & sheep / camels / cattle
• Large export and regional trade – live animals
• 30% of Gov. revenue from livestock export
• Large number of transactions / animal
• Burao largest market (10,000 per day)
• Unreliable data and figures
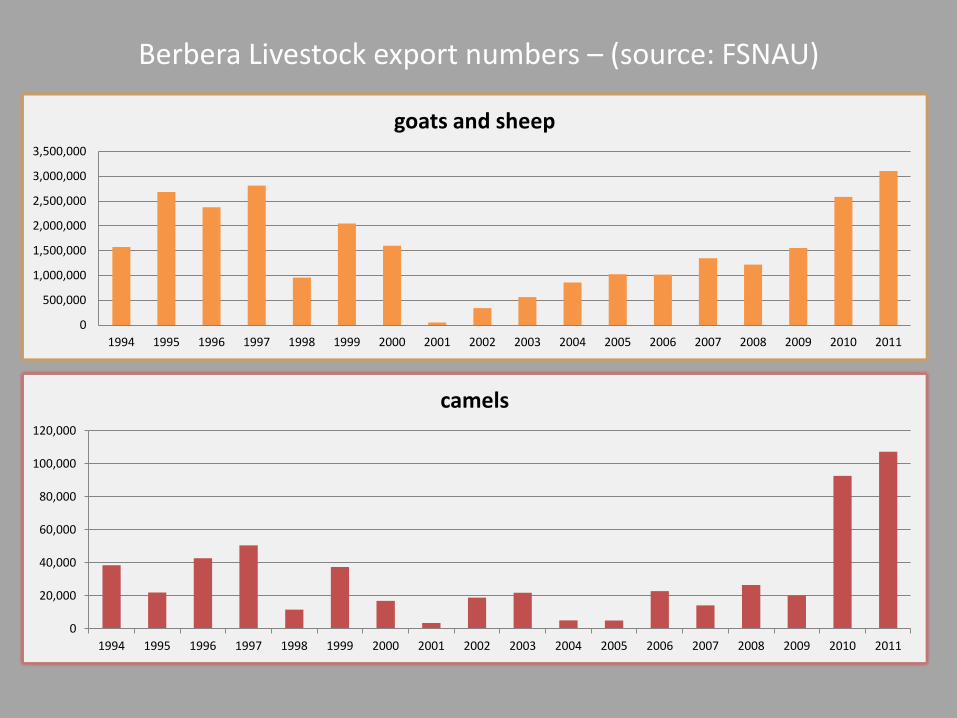
0
500,000
1,000,000
1,500,000
2,000,000
2,500,000
3,000,000
3,500,000
1994 1995 1996 1997 1998 1999 2000 2001 2002 2003 2004 2005 2006 2007 2008 2009 2010 2011
goats and sheep
0
20,000
40,000
60,000
80,000
100,000
120,000
1994 1995 1996 1997 1998 1999 2000 2001 2002 2003 2004 2005 2006 2007 2008 2009 2010 2011
camels
Berbera Livestock export numbers – (source: FSNAU)
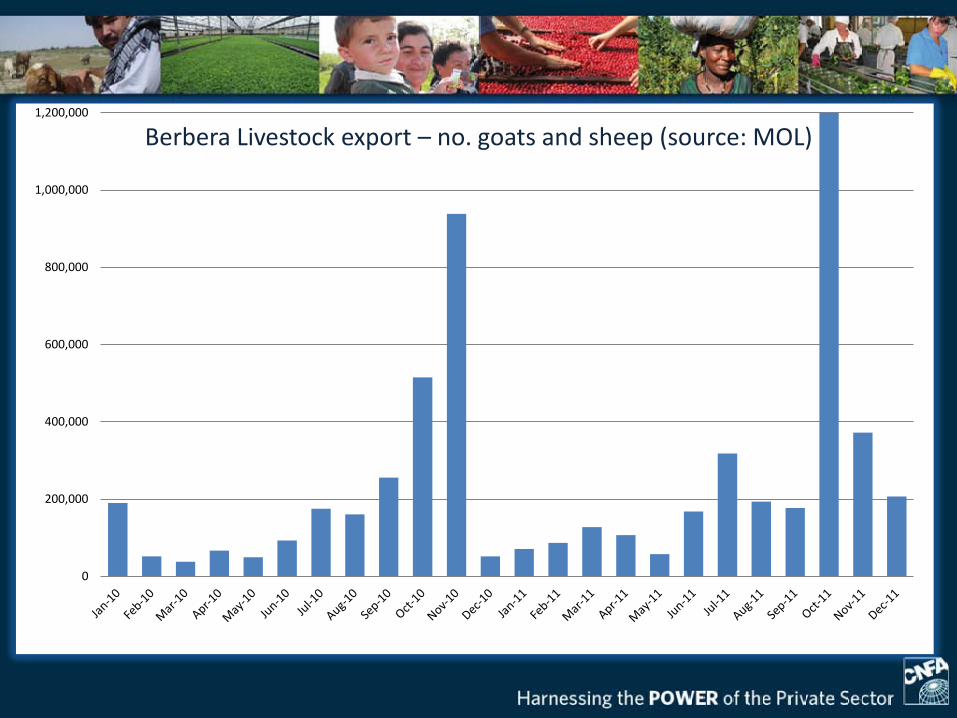
0
200,000
400,000
600,000
800,000
1,000,000
1,200,000
Berbera Livestock export – no. goats and sheep (source: MOL)
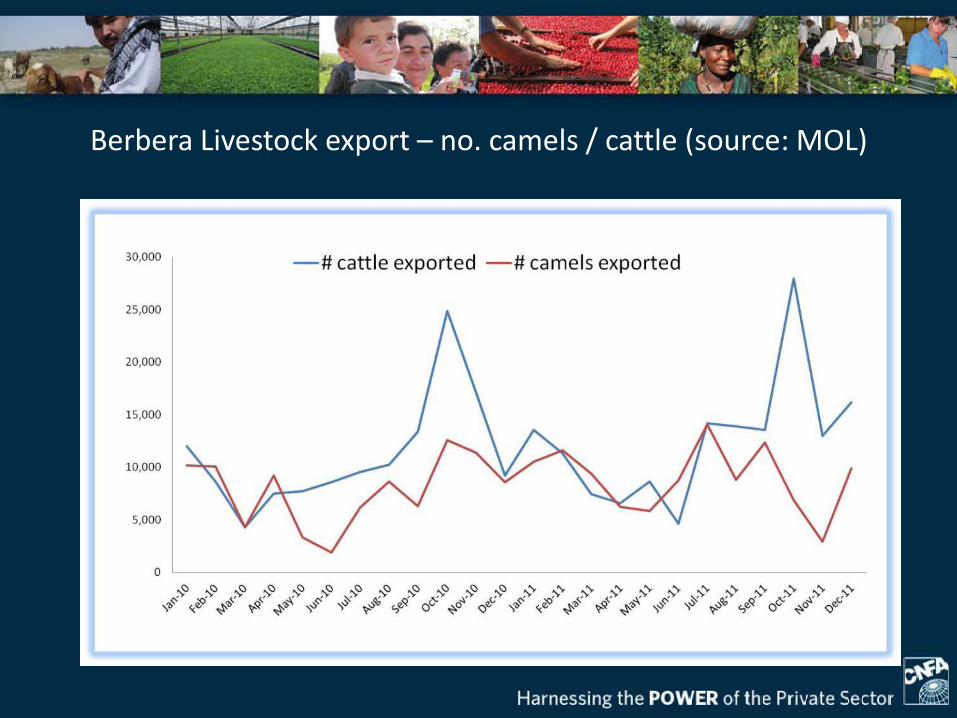
Berbera Livestock export – no. camels / cattle (source: MOL)
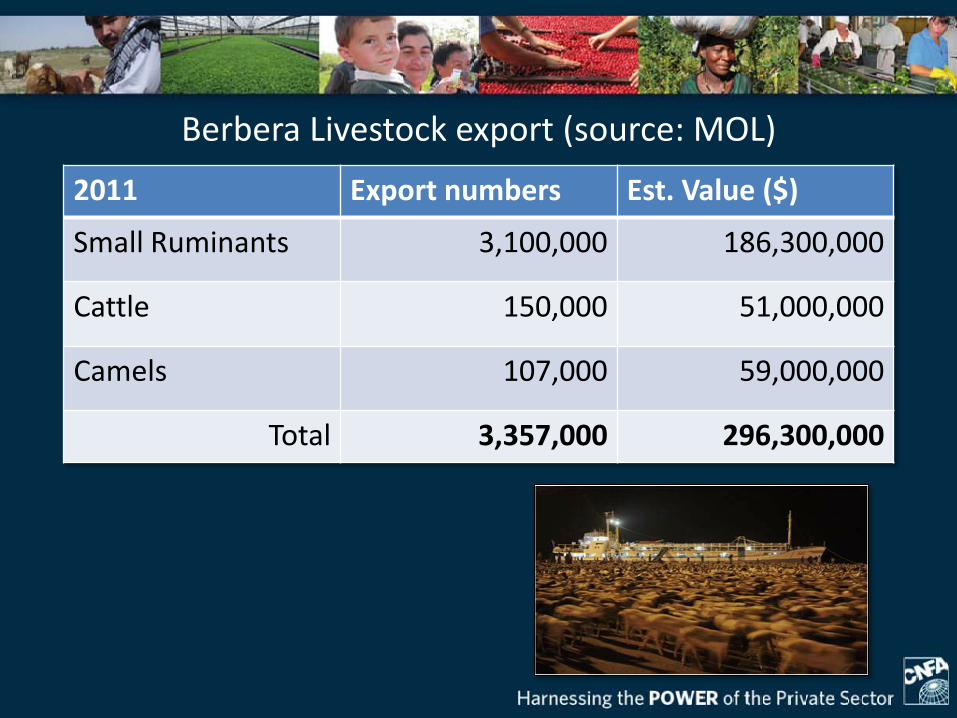
2011 Export numbers Est. Value ($)
Small Ruminants 3,100,000 186,300,000
Cattle 150,000 51,000,000
Camels 107,000 59,000,000
Total 3,357,000 296,300,000
Berbera Livestock export (source: MOL)
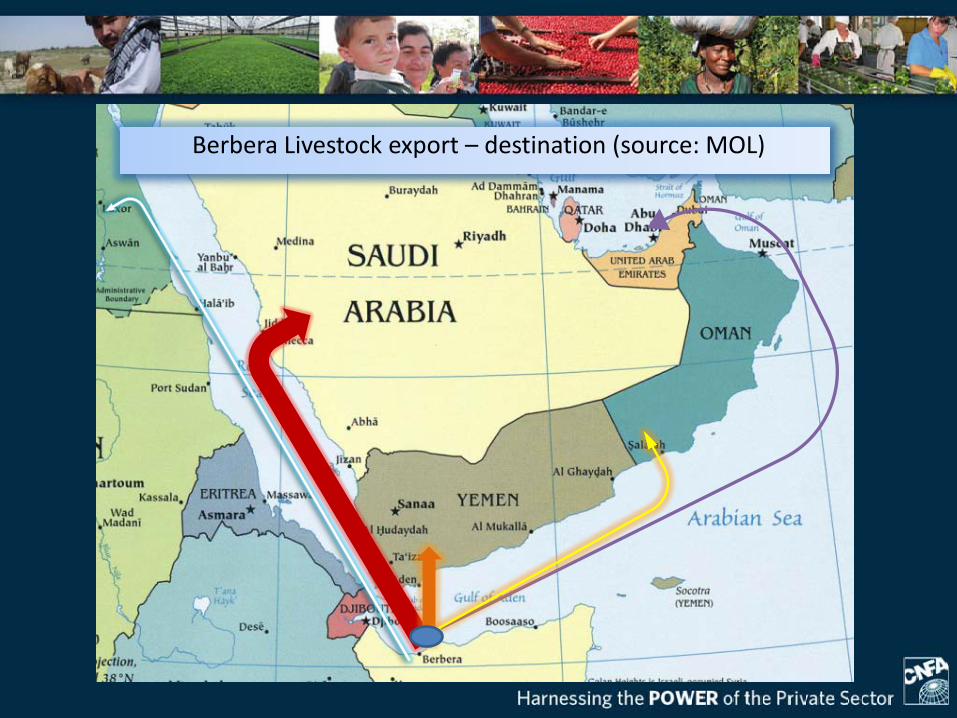
Berbera Livestock export – destination (source: MOL)
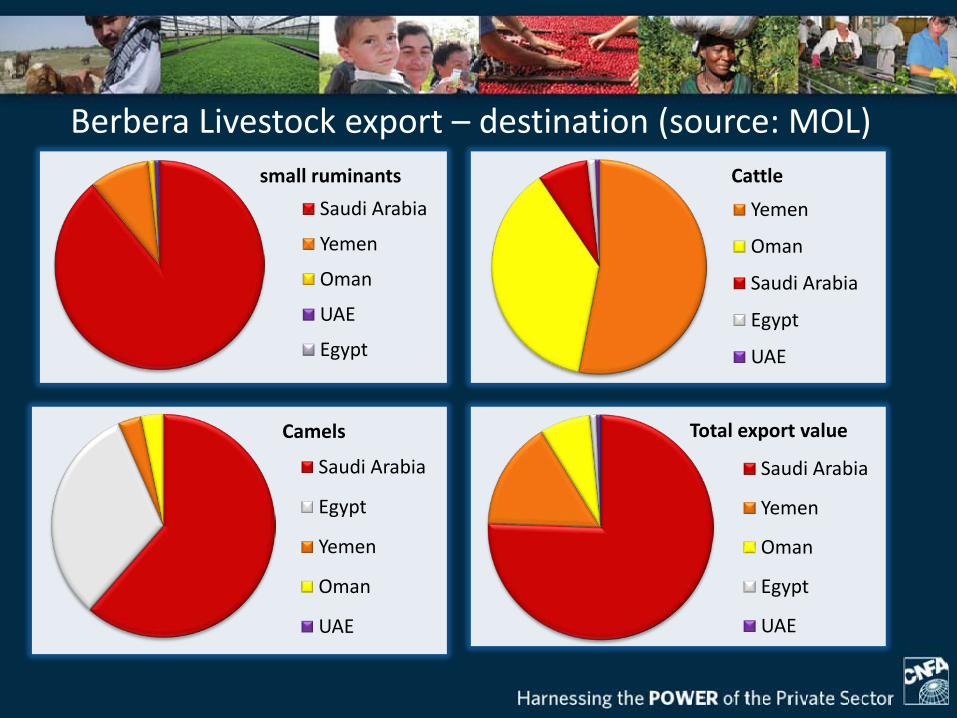
small ruminants
Saudi Arabia
Yemen
Oman
UAE
Egypt
Cattle
Yemen
Oman
Saudi Arabia
Egypt
UAE
Total export value
Saudi Arabia
Yemen
Oman
Egypt
UAE
Camels
Saudi Arabia
Egypt
Yemen
Oman
UAE
Berbera Livestock export – destination (source: MOL)
Berbera animals originate from: •Somali region in Ethiopia (50 %)
•Other Somalia regions (10 %)
Other Ports: Djibouti, Bossaso
Livestock export to: SA, Yemen, Oman, Egypt, UAE
Links to regional bodies – IGAD, AU, COMESA •policies (trade, pastoralism)
Regional linkages


Djibouti
Somaliland-Berbera
Puntland - Bossaso
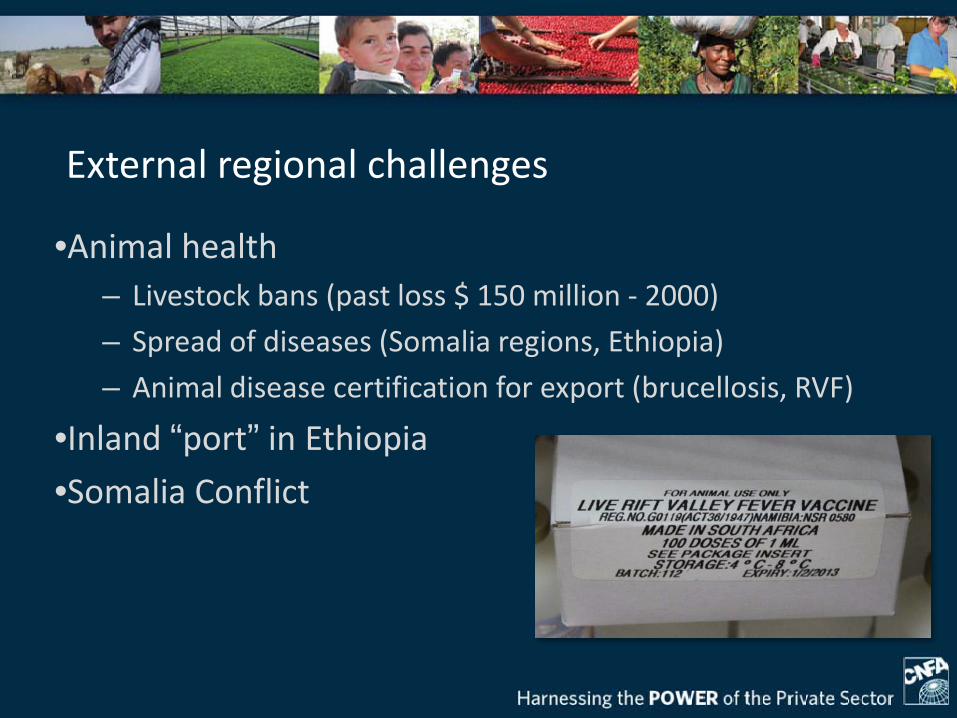
•Animal health – Livestock bans (past loss $ 150 million - 2000)
– Spread of diseases (Somalia regions, Ethiopia)
– Animal disease certification for export (brucellosis, RVF)
•Inland “port” in Ethiopia
•Somalia Conflict
External regional challenges
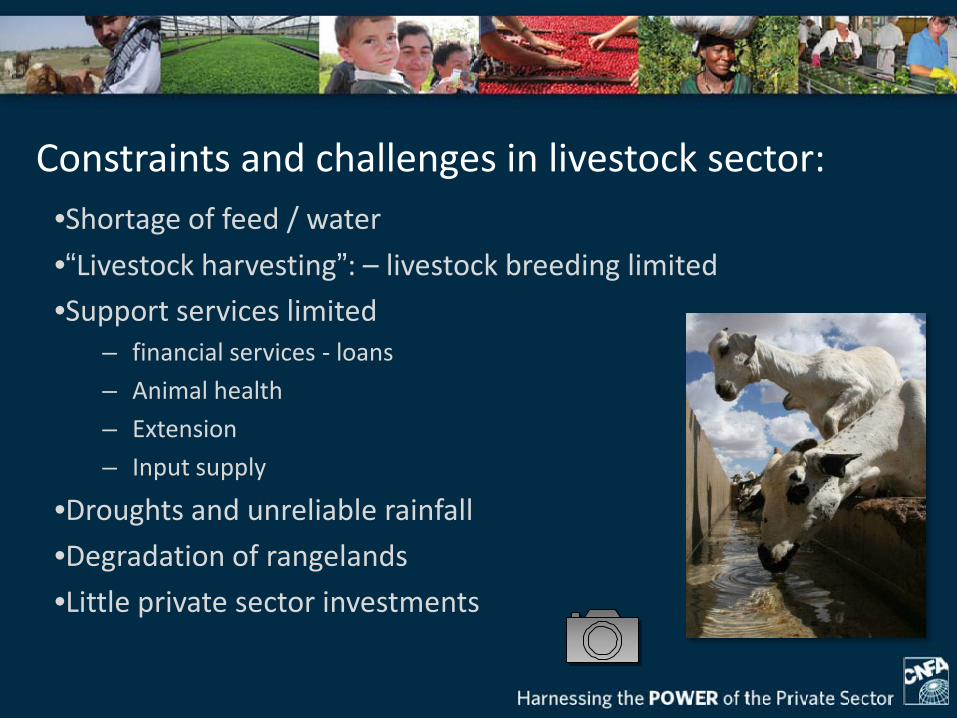
•Shortage of feed / water
•“Livestock harvesting”: – livestock breeding limited •Support services limited
– financial services - loans
– Animal health
– Extension
– Input supply
•Droughts and unreliable rainfall
•Degradation of rangelands
•Little private sector investments
Constraints and challenges in livestock sector:
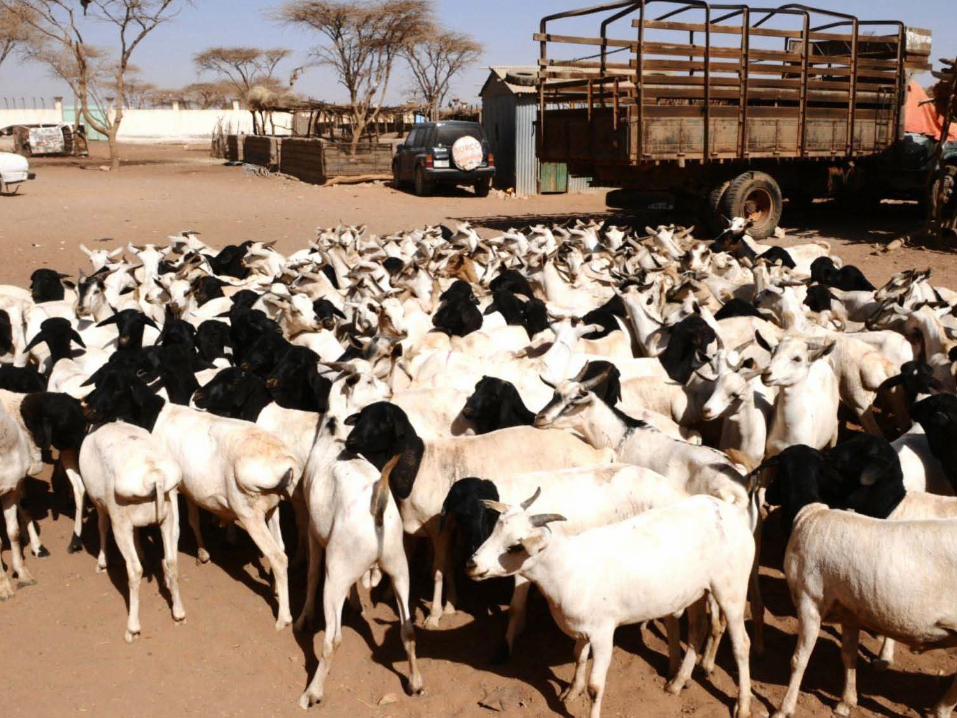
Photo 1
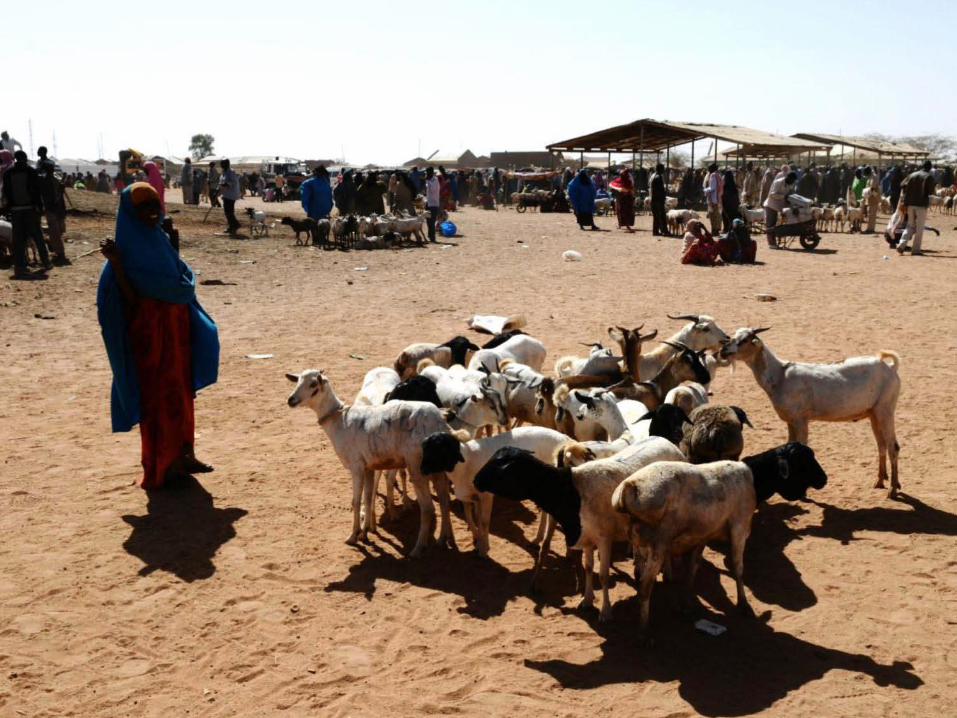
Photo 2
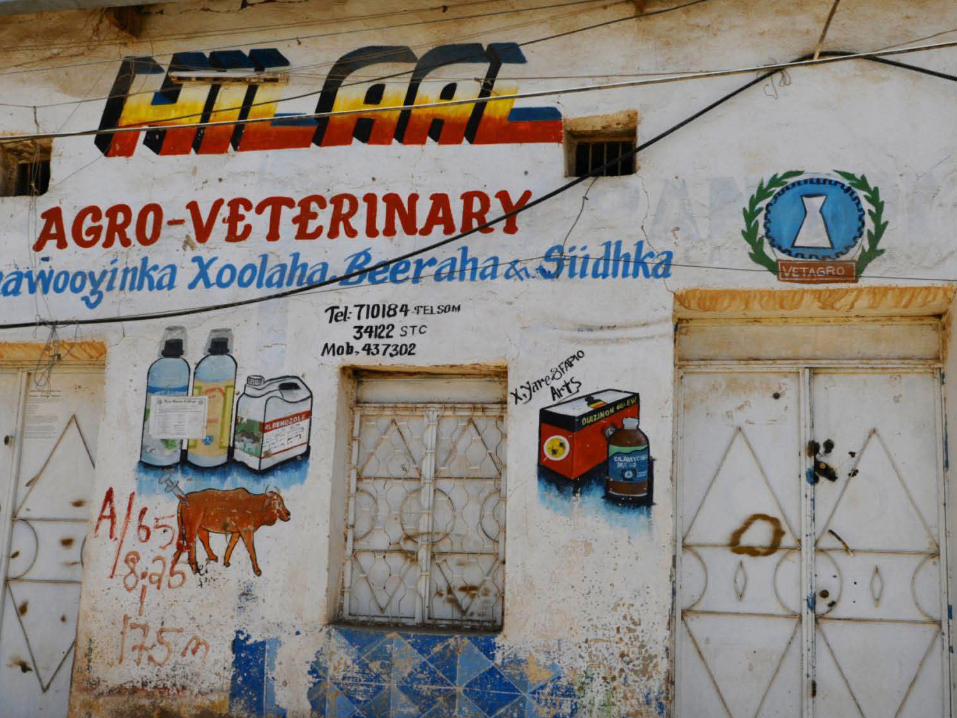
Photo 3
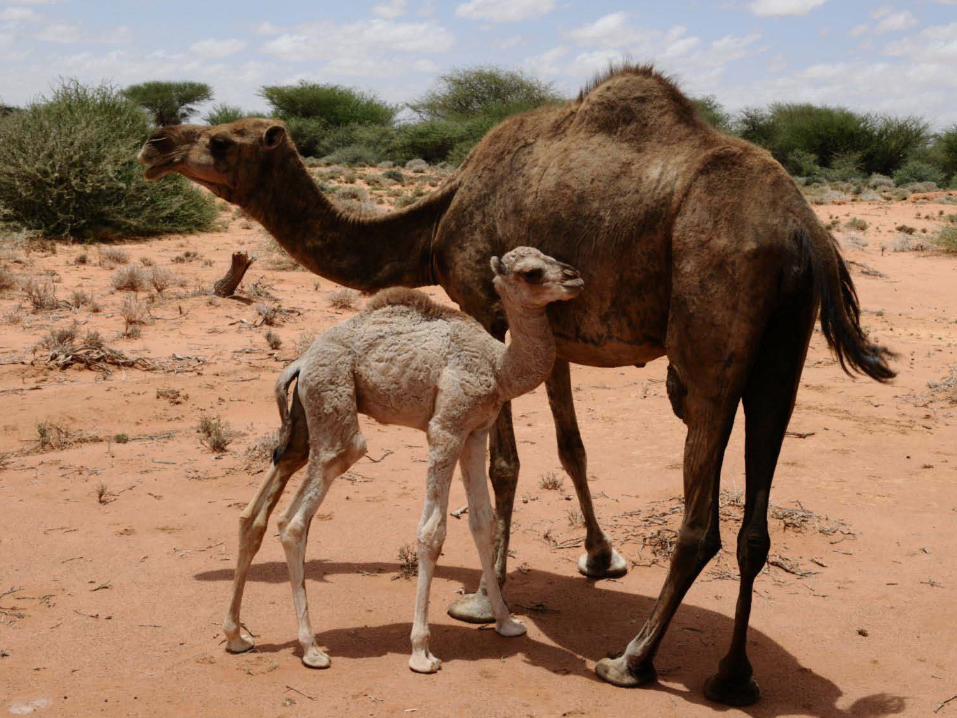
Photo 4

Photo 5
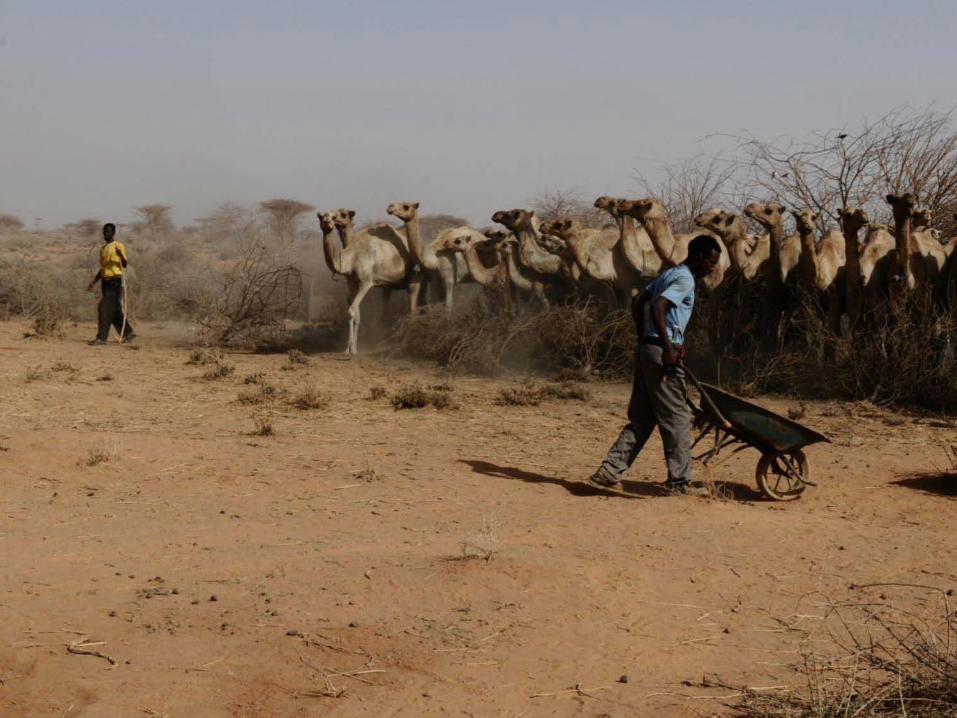
Photo 6
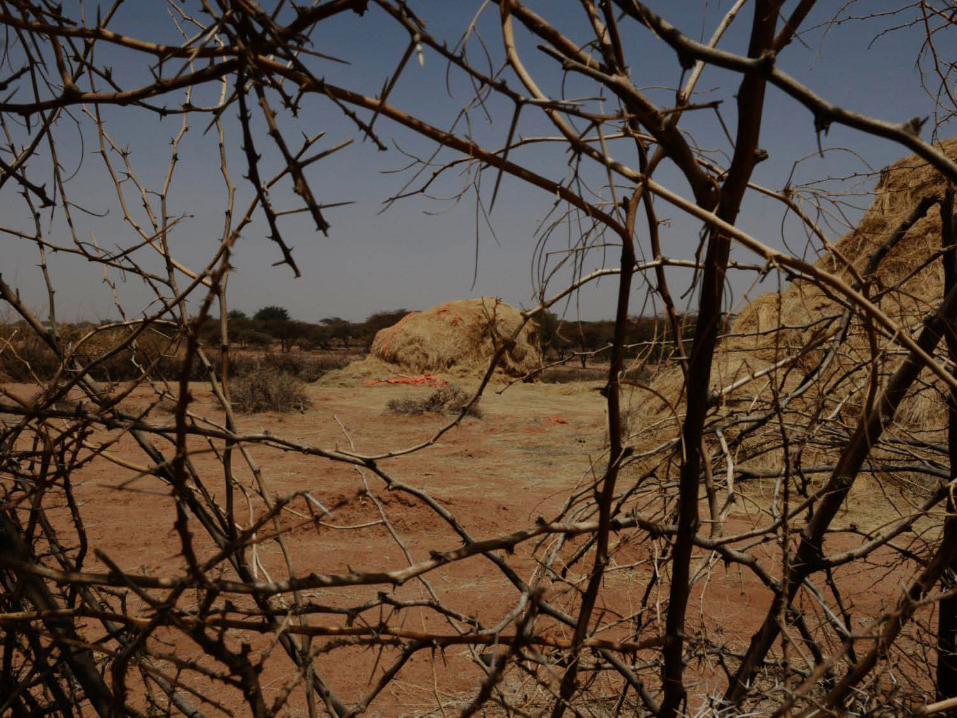
Photo 7
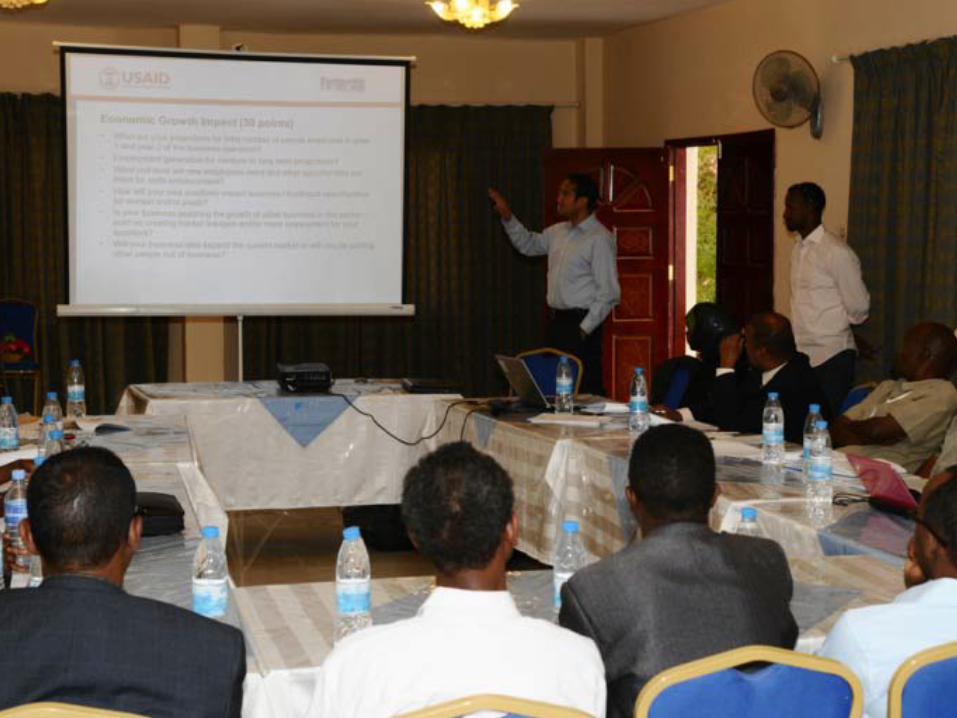
Photo 8
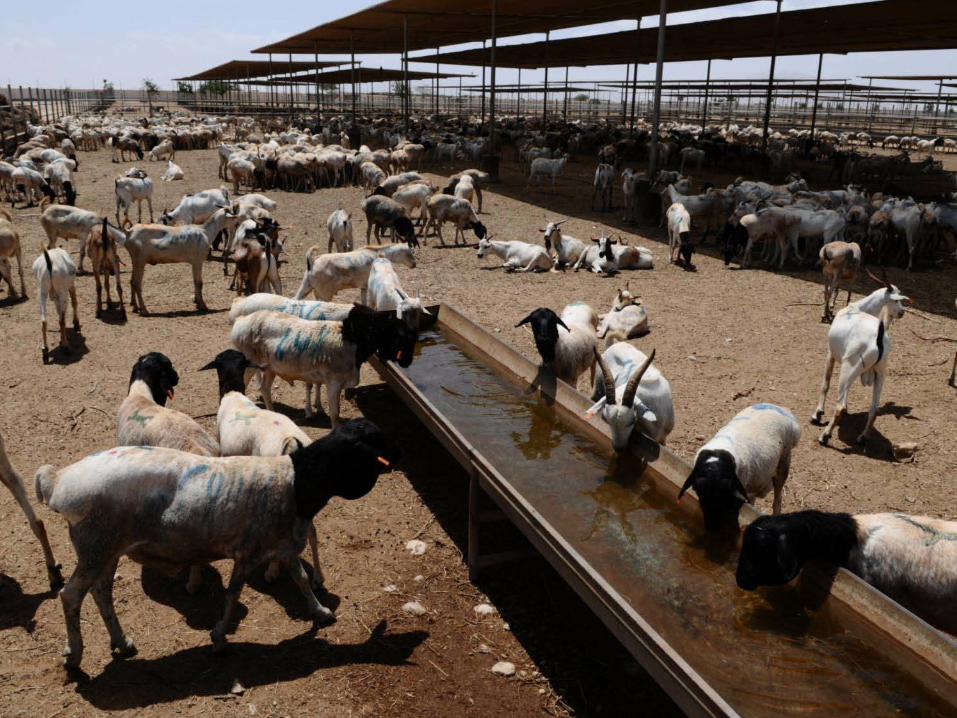
Photo 9
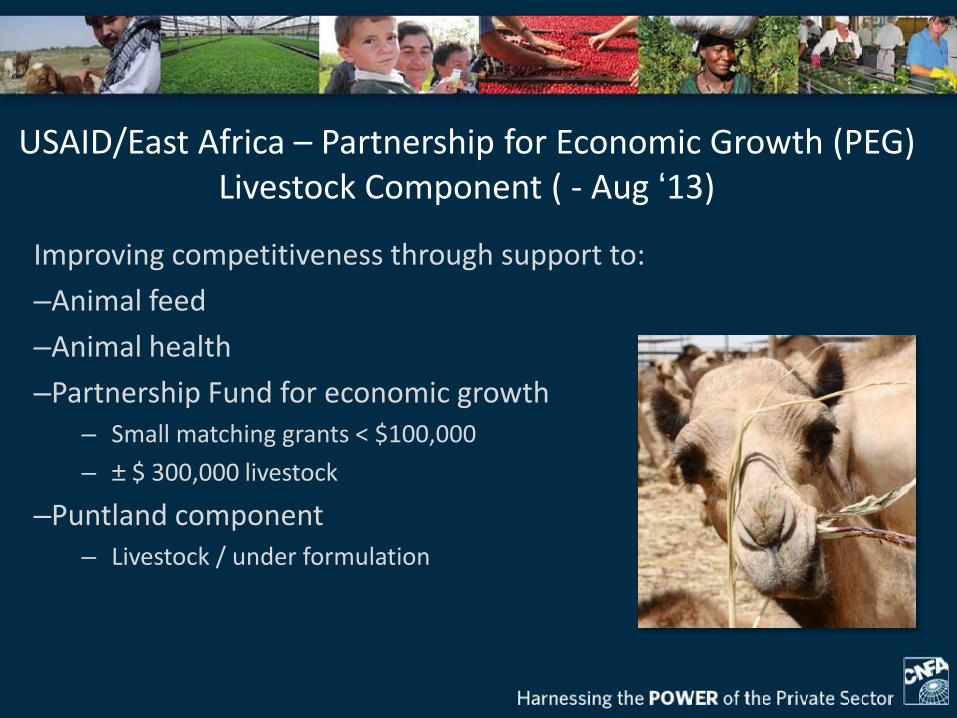
Improving competitiveness through support to:
–Animal feed
–Animal health
–Partnership Fund for economic growth – Small matching grants < $100,000
– ± $ 300,000 livestock
–Puntland component – Livestock / under formulation
USAID/East Africa – Partnership for Economic Growth (PEG) Livestock Component ( - Aug ‘13)
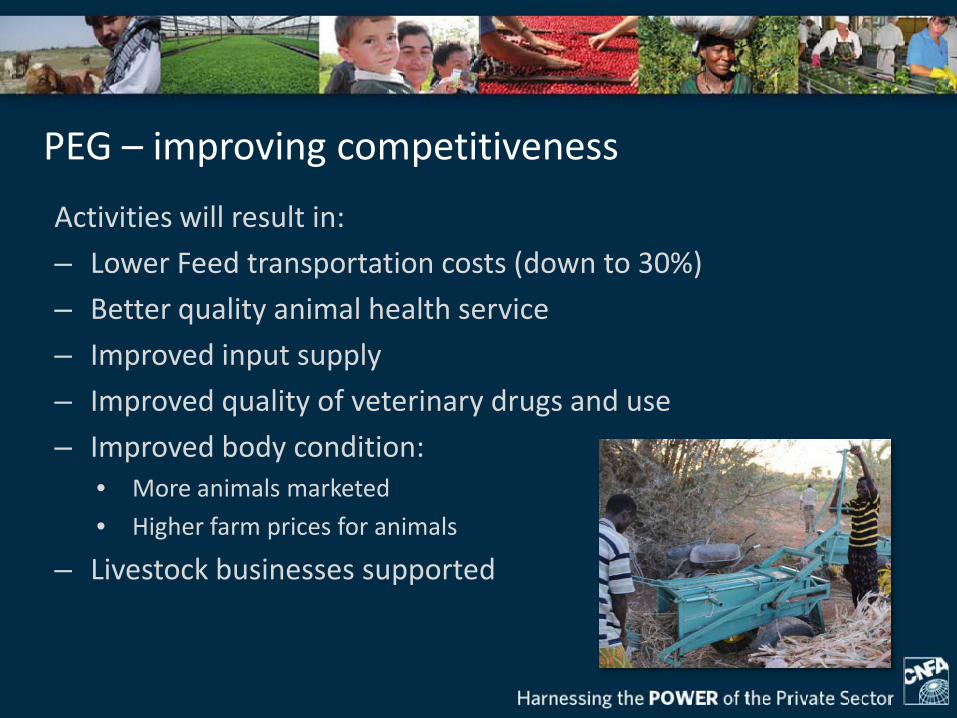
Activities will result in:
– Lower Feed transportation costs (down to 30%)
– Better quality animal health service
– Improved input supply
– Improved quality of veterinary drugs and use
– Improved body condition: • More animals marketed
• Higher farm prices for animals
– Livestock businesses supported
PEG – improving competitiveness
• Extremely High Value of Livestock sector
• Thriving Regional Trade
• Great opportunities exist
Need for:
• Improvement of public support sector
• private sector investments
• better end-market analysis
• Marketing livestock products?
Conclusions and Recommendations
Harnessing the POWER of the Private Sector
Mahadsanid! - Thank you!
Part 2 | Changing Livelihoods in a Risky Environment: Findings from the Pastoral Risk
Management Project
Welcome
Part 2 Intro Slide

Intro Slide
John McPeak – Syracuse University
PARIMA data, book with Peter Little and Cheryl Doss
Changing Livelihoods in a Risky Environment: Findings From the PARIMA Data
GL CRSP: This research was made possible through support provided to the Global Livestock Collaborative Research Support Program by the United States Agency for International Development under terms of Grant No. PCE-G-00-98-00036-00 and by contributions of participating institutions.
BASIS / AMA CRSP: This research was made possible by support provided in part by the US Agency for International Development (USAID) Agreement No. EDH00-06-0003-00 awarded to the Assets and Market Access Collaborative Research Support Program (AMA CRSP).
LCC CRSP: This presentation was made possible by the United States Agency for International Development and the generous support of the American people through Grant No. EEM-A-00-10-00001.
The opinions expressed herein are those of the author and do not necessarily reflect the views of GL CRSP, BASIS AMA CRSP, LCC CRSP, the U.S. Agency for International Development or the U.S. government.
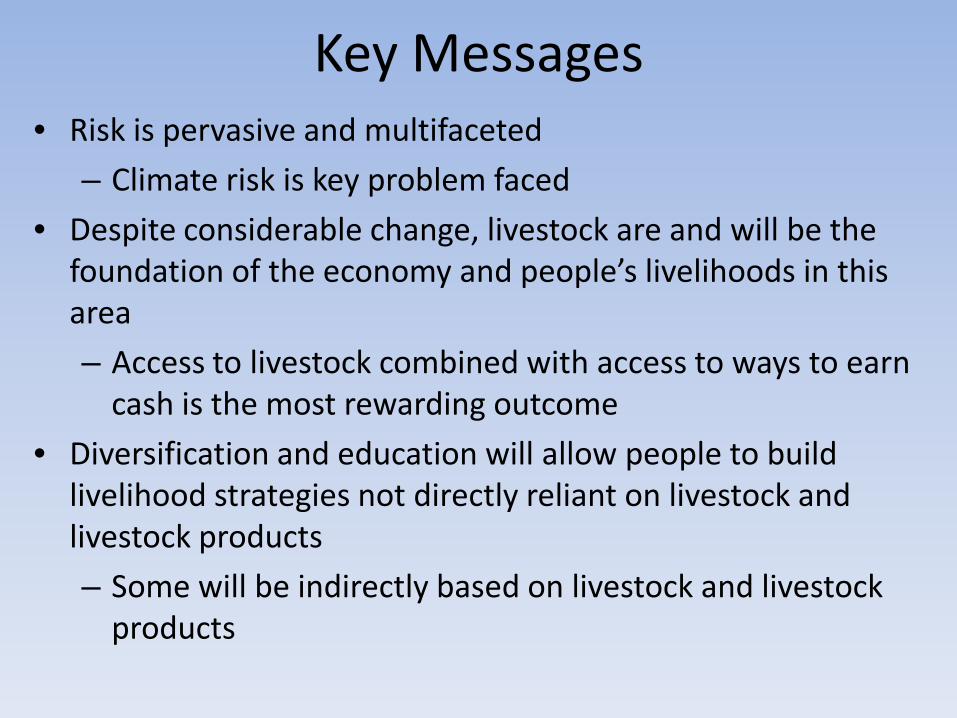
Key Messages • Risk is pervasive and multifaceted
– Climate risk is key problem faced
• Despite considerable change, livestock are and will be the foundation of the economy and people’s livelihoods in this area
– Access to livestock combined with access to ways to earn cash is the most rewarding outcome
• Diversification and education will allow people to build livelihood strategies not directly reliant on livestock and livestock products
– Some will be indirectly based on livestock and livestock products
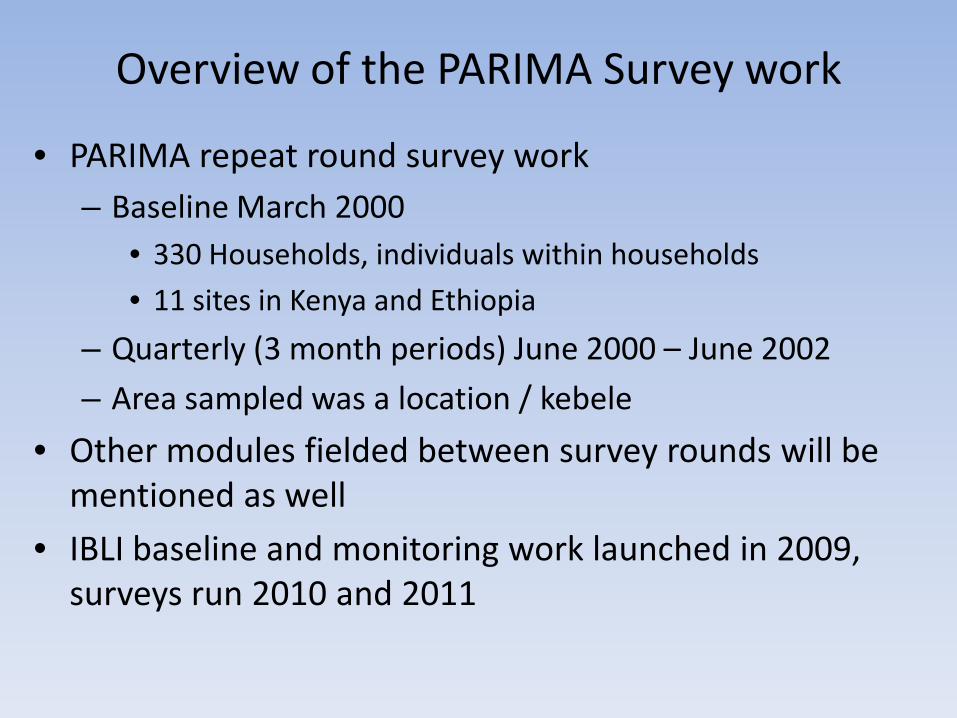
Overview of the PARIMA Survey work
• PARIMA repeat round survey work – Baseline March 2000
• 330 Households, individuals within households
• 11 sites in Kenya and Ethiopia
– Quarterly (3 month periods) June 2000 – June 2002
– Area sampled was a location / kebele
• Other modules fielded between survey rounds will be mentioned as well
• IBLI baseline and monitoring work launched in 2009, surveys run 2010 and 2011

PARIMA Research sites SM-K FI-E DG-K DH-E WA-E QO-E LL-K NG-K DL-E KA-K NH-K
NDVI (CV NDVI)
0.42 (0.33)
0.31 (0.39)
0.30 (0.56)
0.30 (0.32)
0.28 (0.35)
0.27 (0.52)
0.23 (0.50)
0.22 (0.35)
0.21 (0.42)
0.19 (0.45)
0.10 (0.25)
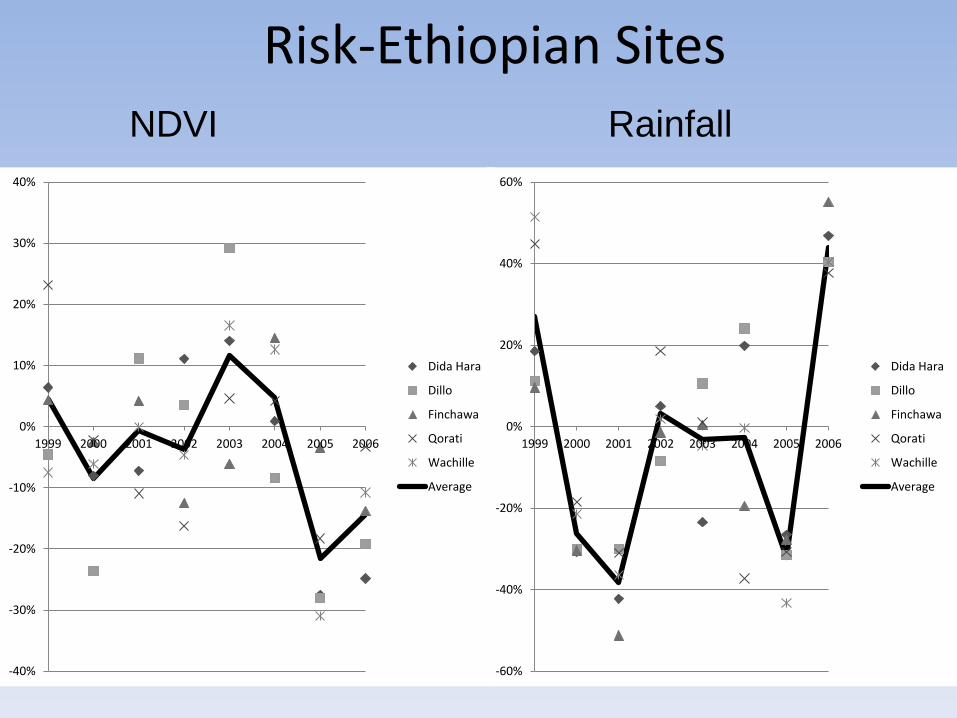
Risk-Ethiopian Sites
-40%
-30%
-20%
-10%
0%
10%
20%
30%
40%
1999 2000 2001 2002 2003 2004 2005 2006
Dida Hara
Dillo
Finchawa
Qorati
Wachille
Average
-60%
-40%
-20%
0%
20%
40%
60%
1999 2000 2001 2002 2003 2004 2005 2006
Dida Hara
Dillo
Finchawa
Qorati
Wachille
Average
NDVI Rainfall
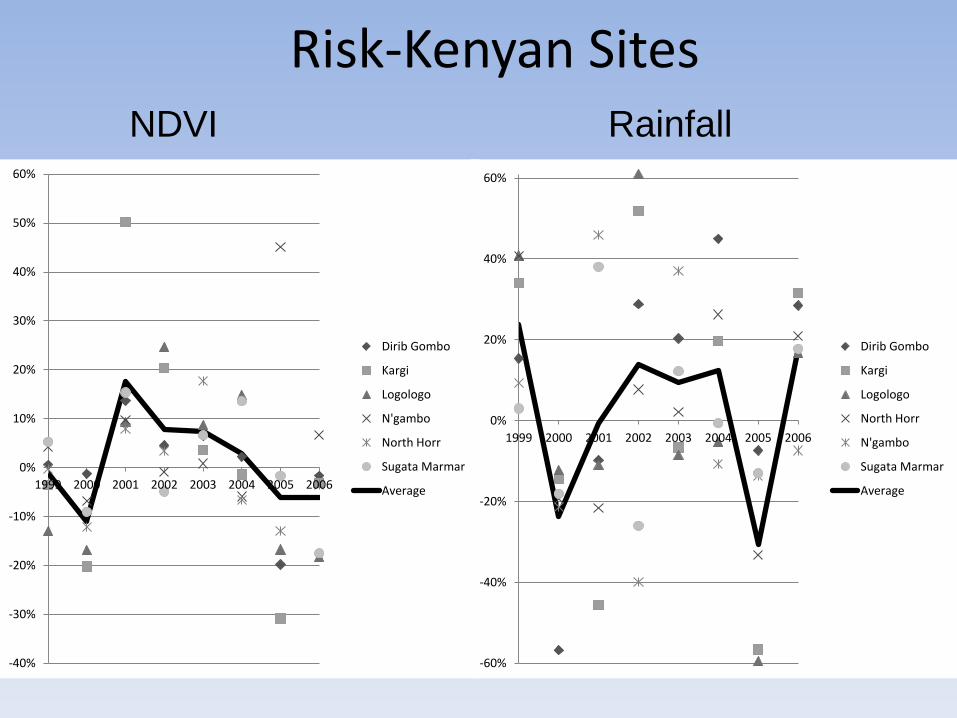
Risk-Kenyan Sites
-60%
-40%
-20%
0%
20%
40%
60%
1999 2000 2001 2002 2003 2004 2005 2006
Dirib Gombo
Kargi
Logologo
North Horr
N'gambo
Sugata Marmar
Average
-40%
-30%
-20%
-10%
0%
10%
20%
30%
40%
50%
60%
1999 2000 2001 2002 2003 2004 2005 2006
Dirib Gombo
Kargi
Logologo
N'gambo
North Horr
Sugata Marmar
Average
NDVI Rainfall
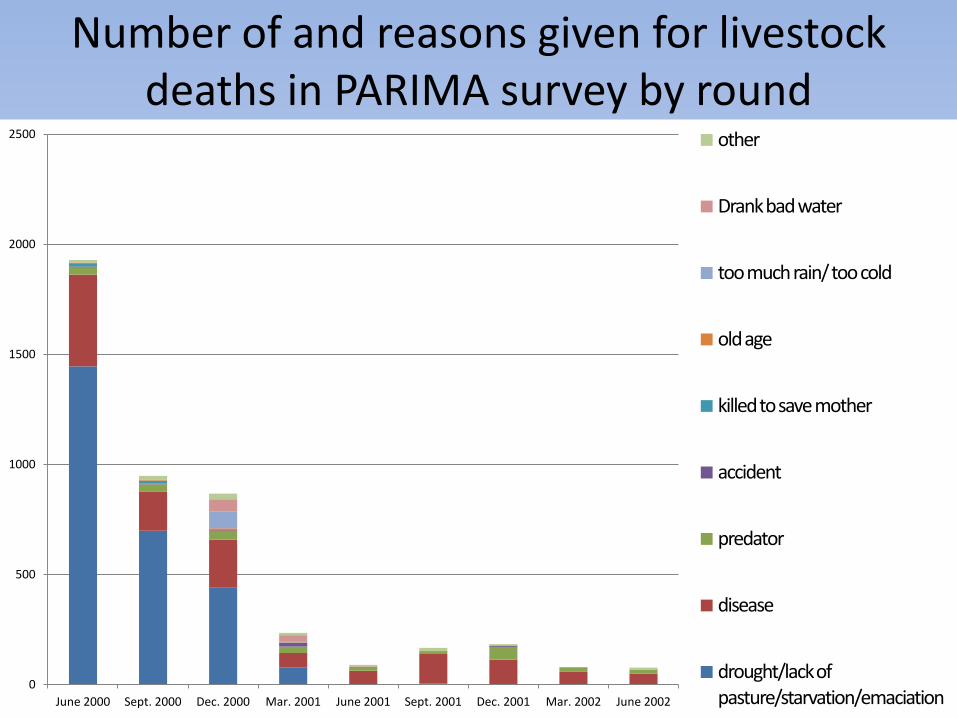
Number of and reasons given for livestock deaths in PARIMA survey by round
0
500
1000
1500
2000
2500
June 2000 Sept. 2000 Dec. 2000 Mar. 2001 June 2001 Sept. 2001 Dec. 2001 Mar. 2002 June 2002
other
Drank bad water
too much rain/ too cold
old age
killed to save mother
accident
predator
disease
drought/lack of pasture/starvation/emaciation
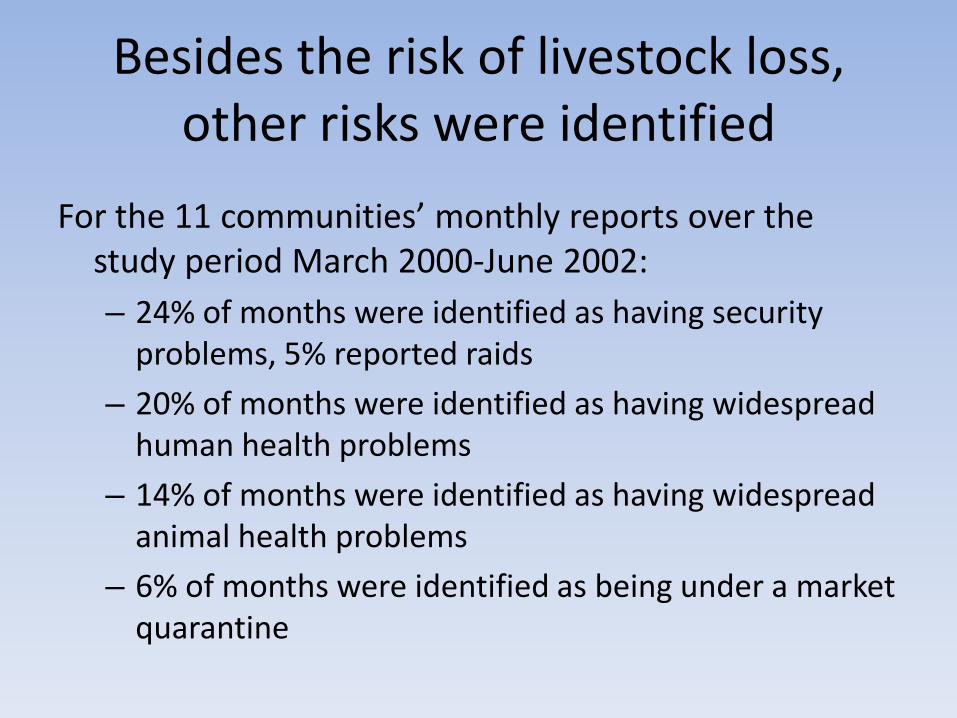
Besides the risk of livestock loss, other risks were identified
For the 11 communities’ monthly reports over the study period March 2000-June 2002: – 24% of months were identified as having security
problems, 5% reported raids
– 20% of months were identified as having widespread human health problems
– 14% of months were identified as having widespread animal health problems
– 6% of months were identified as being under a market quarantine
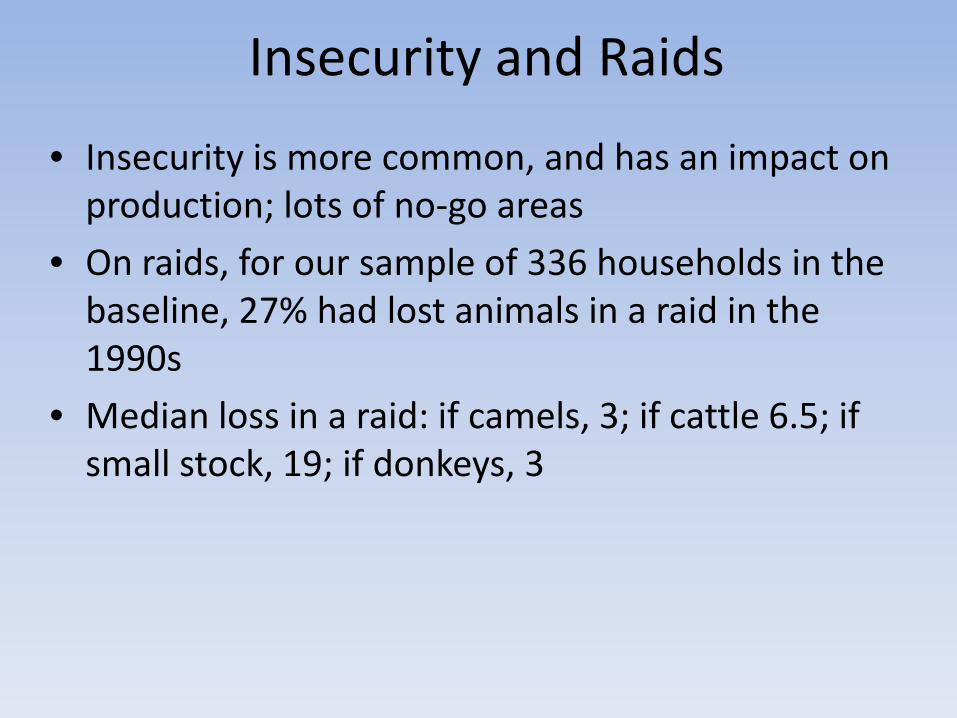
Insecurity and Raids
• Insecurity is more common, and has an impact on production; lots of no-go areas
• On raids, for our sample of 336 households in the baseline, 27% had lost animals in a raid in the 1990s
• Median loss in a raid: if camels, 3; if cattle 6.5; if small stock, 19; if donkeys, 3

Risk and climate • Prices for things to buy higher during drought
• Mean decrease and variance increase in livestock producer prices during drought
• Health problems more pronounced during drought: % of households reporting illness by round (50% malaria, respiratory 8%, ENT 7%, injury 6%,…)
• Climate information findings – More confidence in traditional, but understand and trust
official forecast
– Hear, understand, update, but little action in response
Jun-00 Sep-00 Dec-00 Mar-01 Jun-01 Sep-01 Dec-01 Mar-02 Jun-02 33% 33% 30% 23% 19% 16% 15% 13% 12%
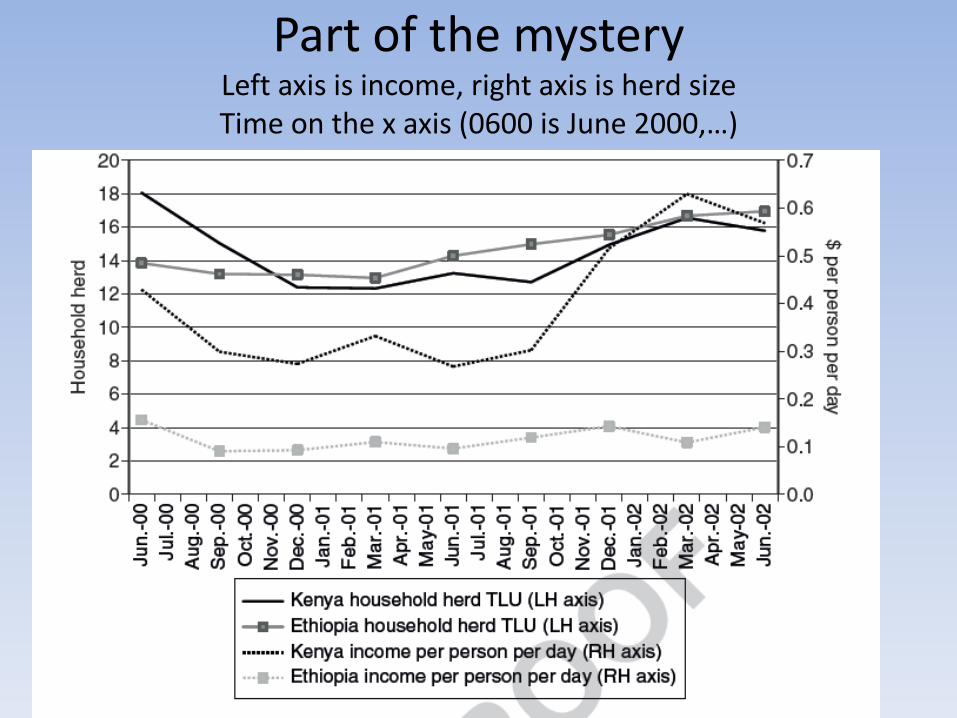
Part of the mystery Left axis is income, right axis is herd size Time on the x axis (0600 is June 2000,…)
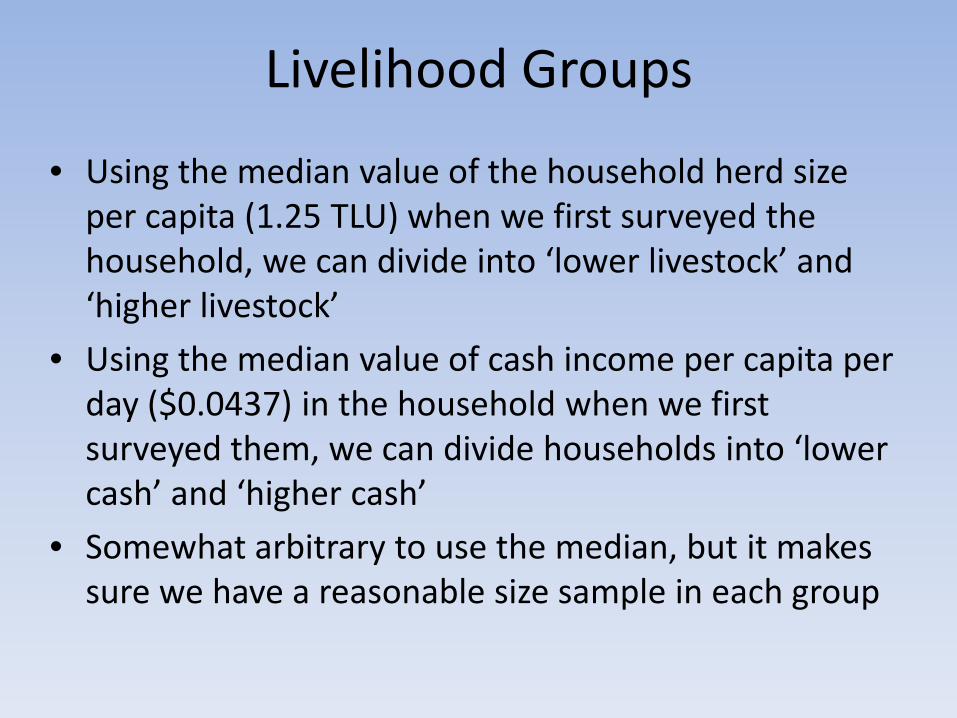
Livelihood Groups
• Using the median value of the household herd size per capita (1.25 TLU) when we first surveyed the household, we can divide into ‘lower livestock’ and ‘higher livestock’
• Using the median value of cash income per capita per day ($0.0437) in the household when we first surveyed them, we can divide households into ‘lower cash’ and ‘higher cash’
• Somewhat arbitrary to use the median, but it makes sure we have a reasonable size sample in each group

Livelihood Groups Mean Total Income (mean cv over time) Lower cash Higher cash
Lower Herd $0.23 (1.32)
$0.24 (0.90)
Higher Herd $0.35 (0.82)
$0.48 (0.63)
Total income per household per person per day as expressed in USD = cash income + cash value of home produced and consumed goods (milk, meat, crops) + net gifts (including the cash value of food aid) Differences are significant for higher cash higher herd compared to the lower herd groups. The variation differences are all significant except the .90 and .82 comparison.
cv is coefficient of variation, higher means more relative variability over time in the flow of income for the average household in the livelihood group
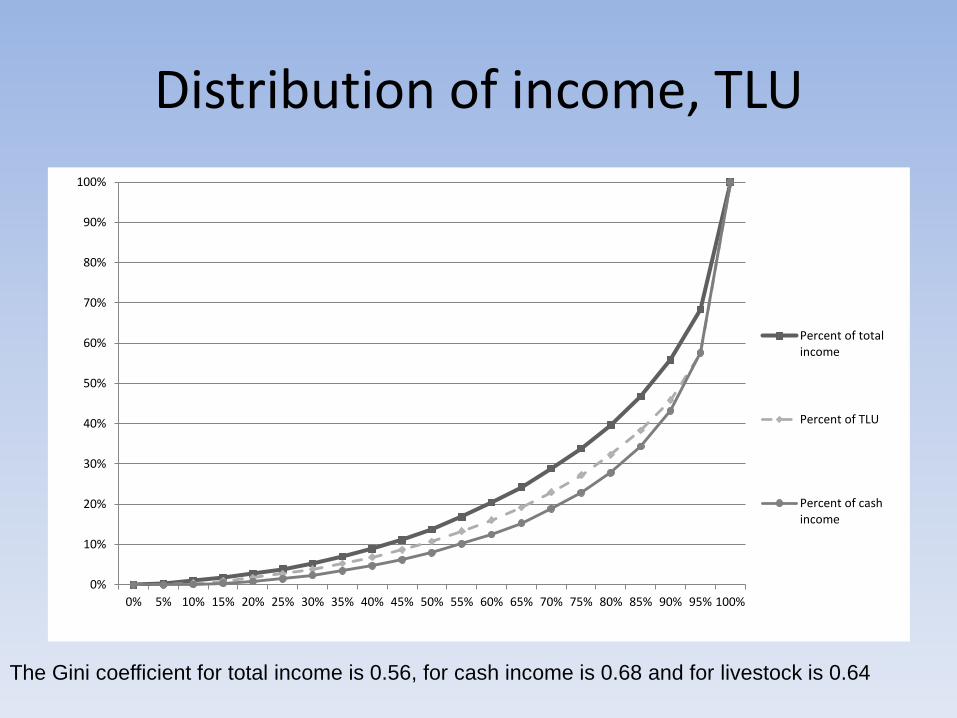
Distribution of income, TLU
0%
10%
20%
30%
40%
50%
60%
70%
80%
90%
100%
0% 5% 10% 15% 20% 25% 30% 35% 40% 45% 50% 55% 60% 65% 70% 75% 80% 85% 90% 95% 100%
Percent of total income
Percent of TLU
Percent of cash income
The Gini coefficient for total income is 0.56, for cash income is 0.68 and for livestock is 0.64
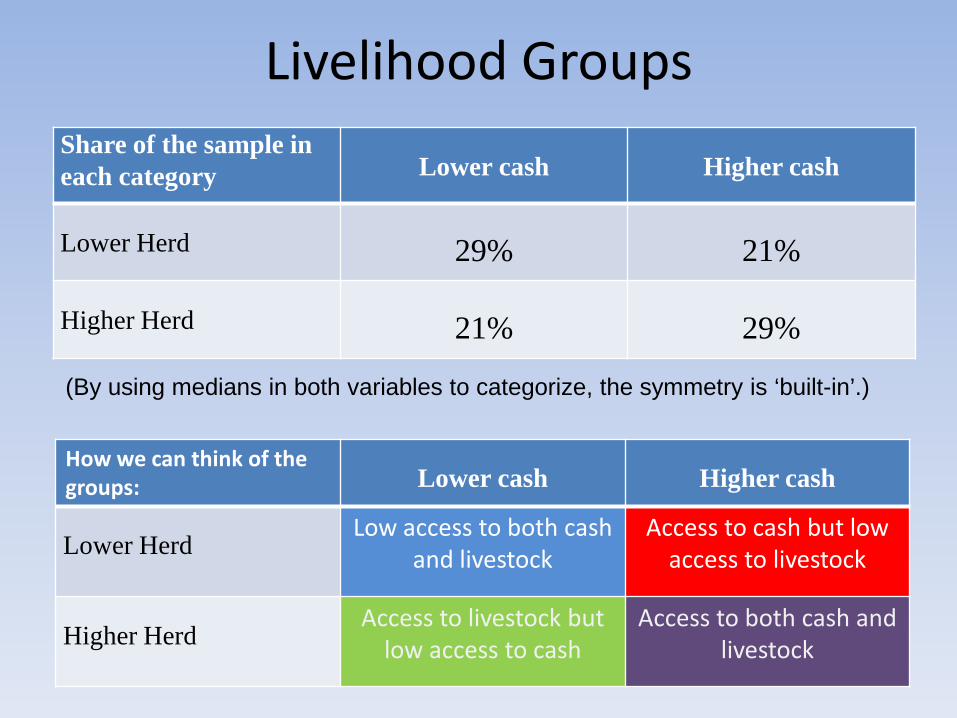
Livelihood Groups Share of the sample in each category Lower cash Higher cash
Lower Herd 29% 21%
Higher Herd 21% 29%
How we can think of the groups: Lower cash Higher cash
Lower Herd Low access to both cash
and livestock Access to cash but low
access to livestock
Higher Herd Access to livestock but
low access to cash Access to both cash and
livestock
(By using medians in both variables to categorize, the symmetry is ‘built-in’.)
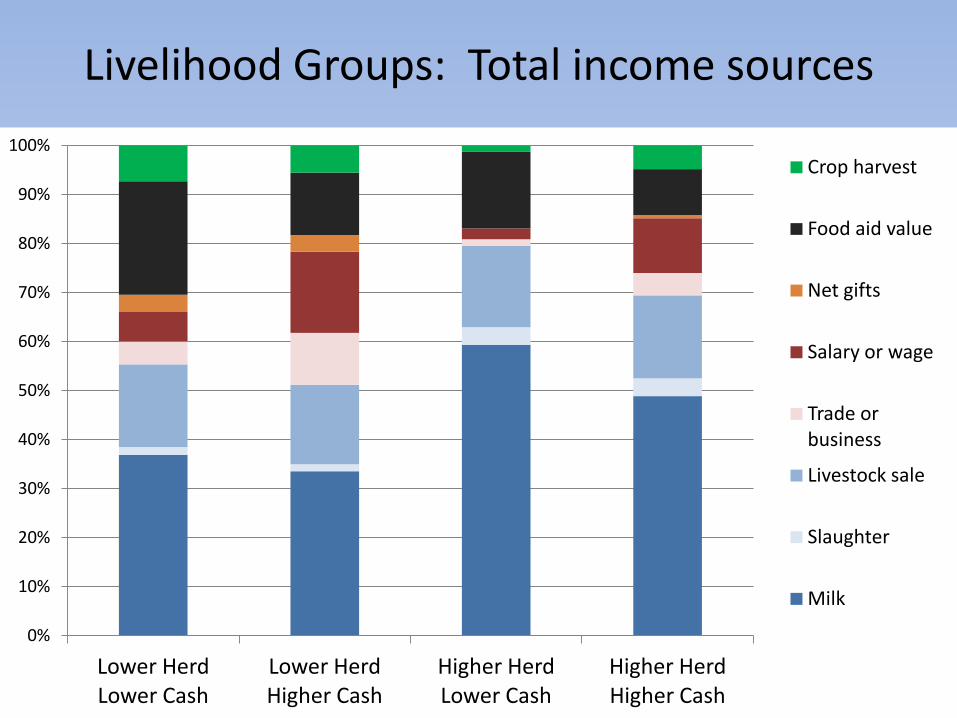
Livelihood Groups: Total income sources
0%
10%
20%
30%
40%
50%
60%
70%
80%
90%
100%
Lower Herd Lower Cash
Lower Herd Higher Cash
Higher Herd Lower Cash
Higher Herd Higher Cash
Crop harvest
Food aid value
Net gifts
Salary or wage
Trade or business
Livestock sale
Slaughter
Milk
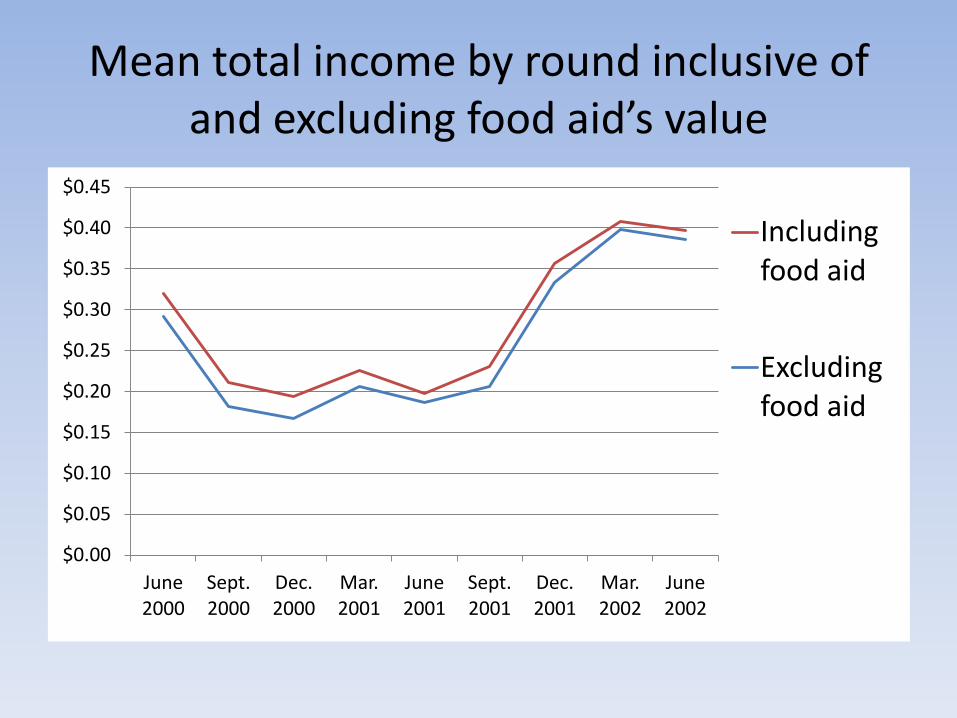
Mean total income by round inclusive of and excluding food aid’s value
$0.00
$0.05
$0.10
$0.15
$0.20
$0.25
$0.30
$0.35
$0.40
$0.45
June 2000
Sept. 2000
Dec. 2000
Mar. 2001
June 2001
Sept. 2001
Dec. 2001
Mar. 2002
June 2002
Including food aid
Excluding food aid
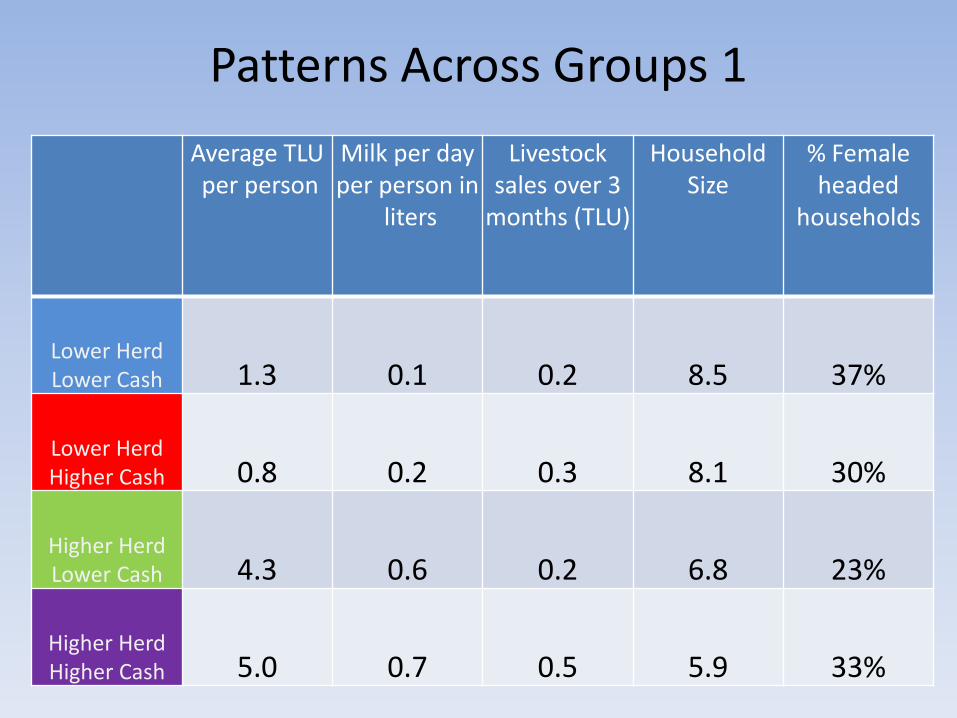
Patterns Across Groups 1
Average TLU per person
Milk per day per person in
liters
Livestock sales over 3
months (TLU)
Household Size
% Female headed
households
Lower Herd Lower Cash 1.3 0.1 0.2 8.5 37%
Lower Herd Higher Cash 0.8 0.2 0.3 8.1 30%
Higher Herd Lower Cash 4.3 0.6 0.2 6.8 23%
Higher Herd Higher Cash 5.0 0.7 0.5 5.9 33%
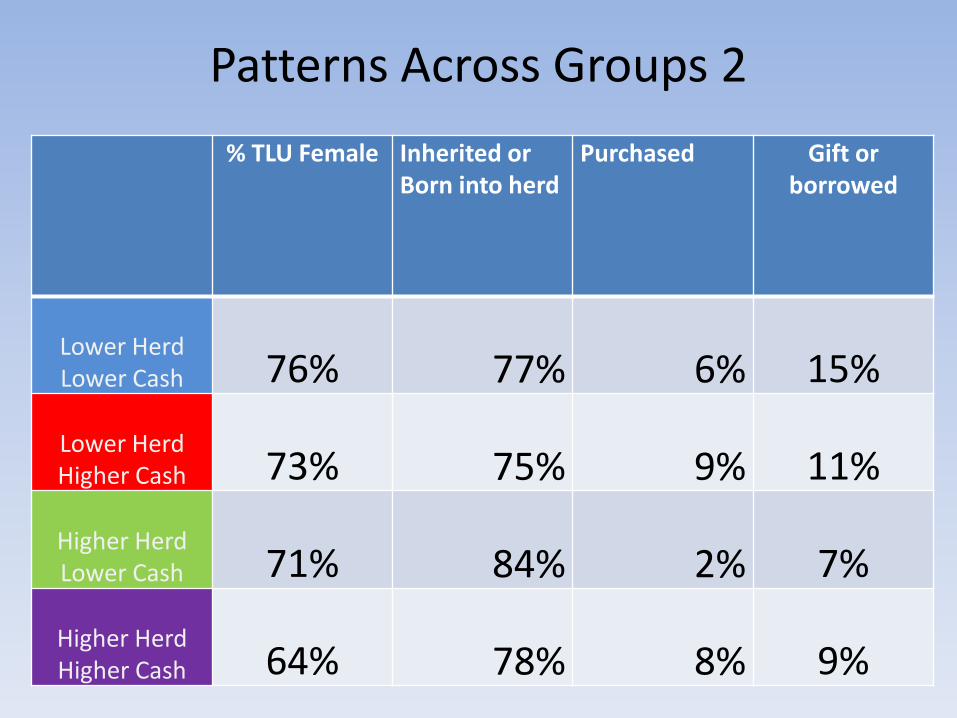
Patterns Across Groups 2
% TLU Female
Inherited or Born into herd
Purchased
Gift or borrowed
Lower Herd Lower Cash 76% 77% 6% 15%
Lower Herd Higher Cash 73% 75% 9% 11%
Higher Herd Lower Cash 71% 84% 2% 7%
Higher Herd Higher Cash 64% 78% 8% 9%
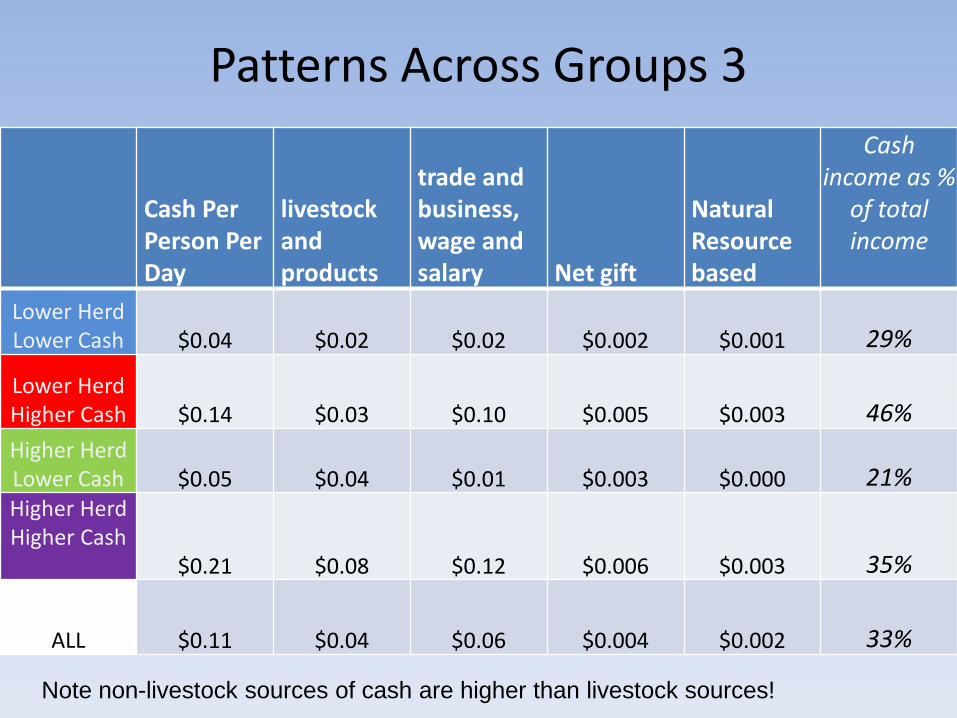
Patterns Across Groups 3
Cash Per Person Per Day
livestock and products
trade and business, wage and salary Net gift
Natural Resource based
Cash income as %
of total income
Lower Herd Lower Cash $0.04 $0.02 $0.02 $0.002 $0.001 29%
Lower Herd Higher Cash $0.14 $0.03 $0.10 $0.005 $0.003 46% Higher Herd Lower Cash $0.05 $0.04 $0.01 $0.003 $0.000 21% Higher Herd Higher Cash
$0.21 $0.08 $0.12 $0.006 $0.003 35%
ALL $0.11 $0.04 $0.06 $0.004 $0.002 33%
Note non-livestock sources of cash are higher than livestock sources!

Patterns in Education
Percent of household members with any formal education
Percent of enrollable age children enrolled.
Lower Herd Lower Cash 22% 26% Lower Herd Higher Cash 34% 44% Higher Herd Lower Cash 14% 19% Higher Herd Higher Cash 22% 29%
Higher cash and higher enrollment and higher spending on education appear to be related. Gender ratio about even for both primary and secondary
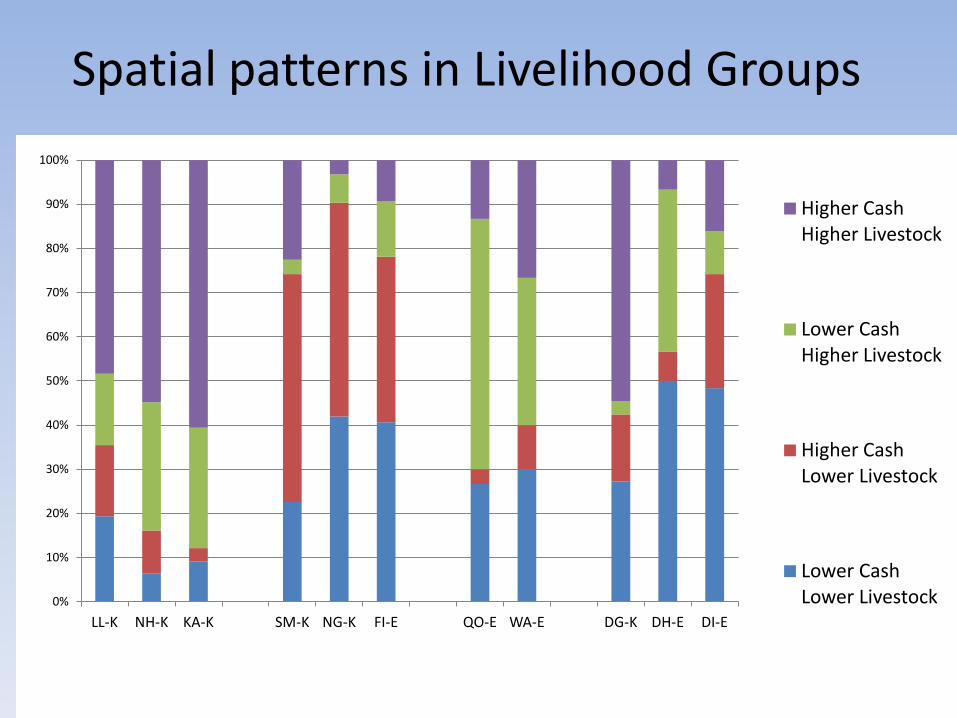
Spatial patterns in Livelihood Groups
0%
10%
20%
30%
40%
50%
60%
70%
80%
90%
100%
LL-K NH-K KA-K SM-K NG-K FI-E QO-E WA-E DG-K DH-E DI-E
Higher Cash Higher Livestock
Lower Cash Higher Livestock
Higher Cash Lower Livestock
Lower Cash Lower Livestock
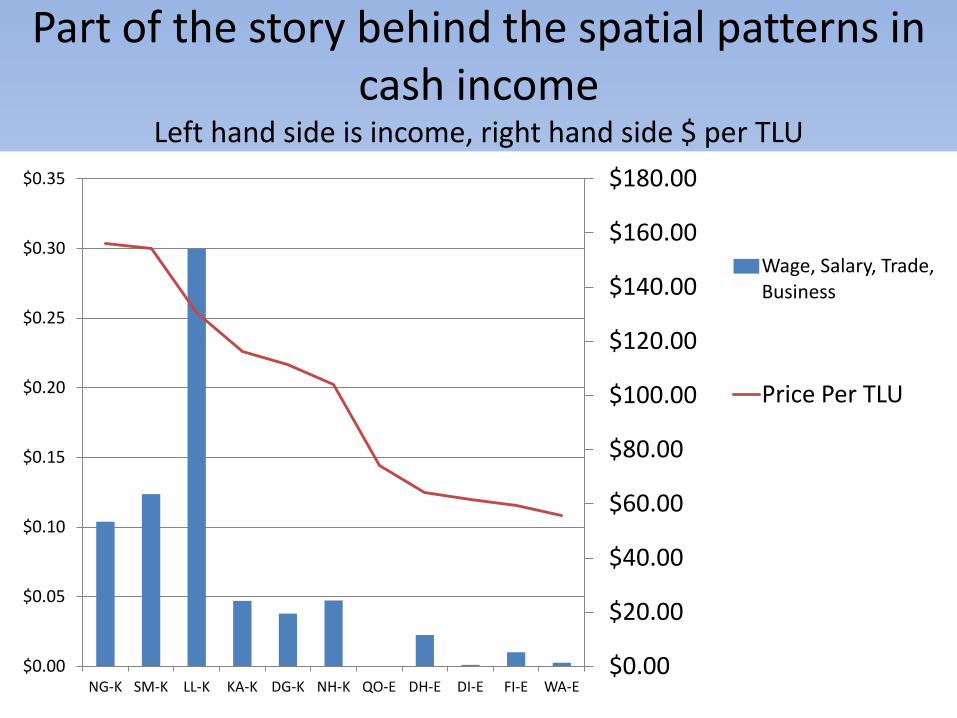
Part of the story behind the spatial patterns in cash income
Left hand side is income, right hand side $ per TLU
$0.00
$20.00
$40.00
$60.00
$80.00
$100.00
$120.00
$140.00
$160.00
$180.00
$0.00
$0.05
$0.10
$0.15
$0.20
$0.25
$0.30
$0.35
NG-K SM-K LL-K KA-K DG-K NH-K QO-E DH-E DI-E FI-E WA-E
Wage, Salary, Trade, Business
Price Per TLU
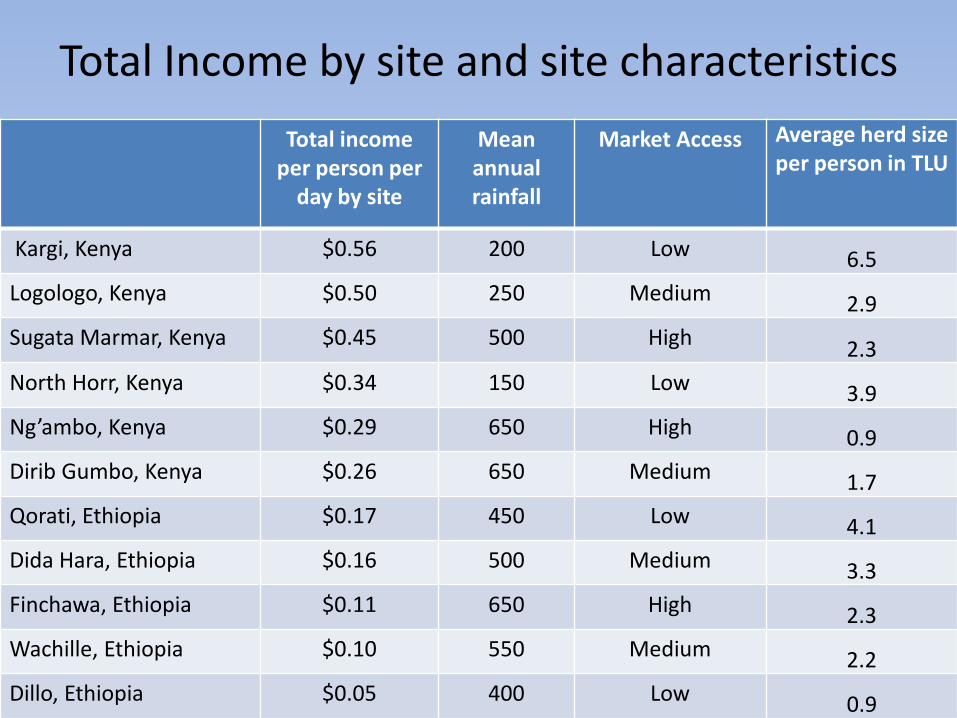
Total Income by site and site characteristics
Total income per person per
day by site
Mean annual rainfall
Market Access Average herd size per person in TLU
Kargi, Kenya $0.56 200 Low 6.5 Logologo, Kenya $0.50 250 Medium 2.9 Sugata Marmar, Kenya $0.45 500 High 2.3 North Horr, Kenya $0.34 150 Low 3.9 Ng’ambo, Kenya $0.29 650 High 0.9 Dirib Gumbo, Kenya $0.26 650 Medium 1.7 Qorati, Ethiopia $0.17 450 Low 4.1 Dida Hara, Ethiopia $0.16 500 Medium 3.3 Finchawa, Ethiopia $0.11 650 High 2.3 Wachille, Ethiopia $0.10 550 Medium 2.2 Dillo, Ethiopia $0.05 400 Low 0.9
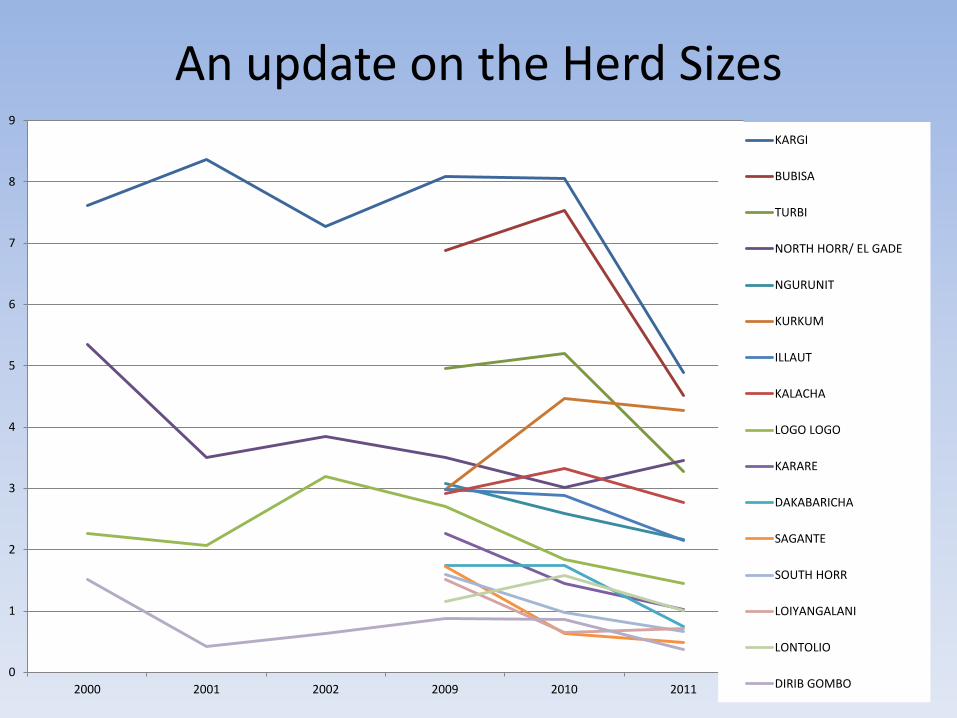
An update on the Herd Sizes
0
1
2
3
4
5
6
7
8
9
2000 2001 2002 2009 2010 2011
KARGI
BUBISA
TURBI
NORTH HORR/ EL GADE
NGURUNIT
KURKUM
ILLAUT
KALACHA
LOGO LOGO
KARARE
DAKABARICHA
SAGANTE
SOUTH HORR
LOIYANGALANI
LONTOLIO
DIRIB GOMBO
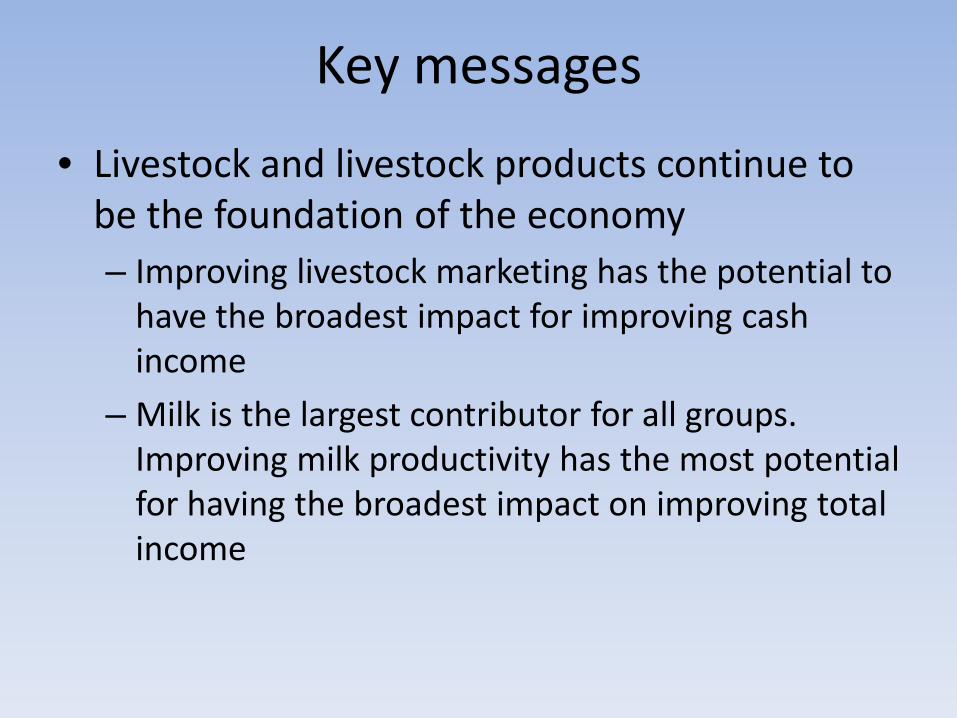
Key messages
• Livestock and livestock products continue to be the foundation of the economy – Improving livestock marketing has the potential to
have the broadest impact for improving cash income
– Milk is the largest contributor for all groups. Improving milk productivity has the most potential for having the broadest impact on improving total income
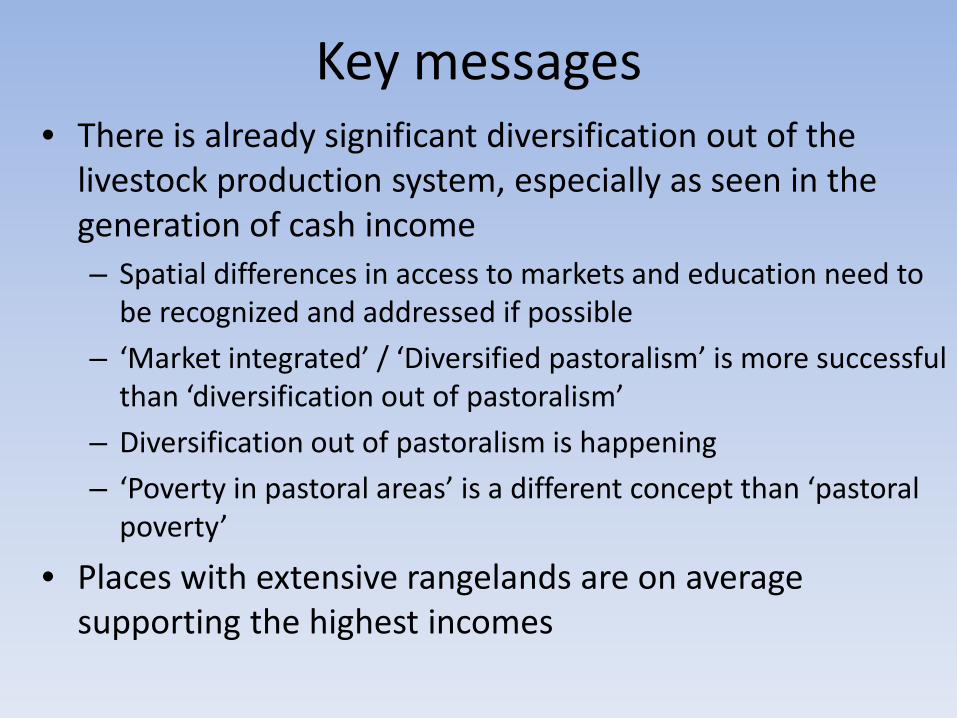
Key messages • There is already significant diversification out of the
livestock production system, especially as seen in the generation of cash income – Spatial differences in access to markets and education need to
be recognized and addressed if possible
– ‘Market integrated’ / ‘Diversified pastoralism’ is more successful than ‘diversification out of pastoralism’
– Diversification out of pastoralism is happening
– ‘Poverty in pastoral areas’ is a different concept than ‘pastoral poverty’
• Places with extensive rangelands are on average supporting the highest incomes
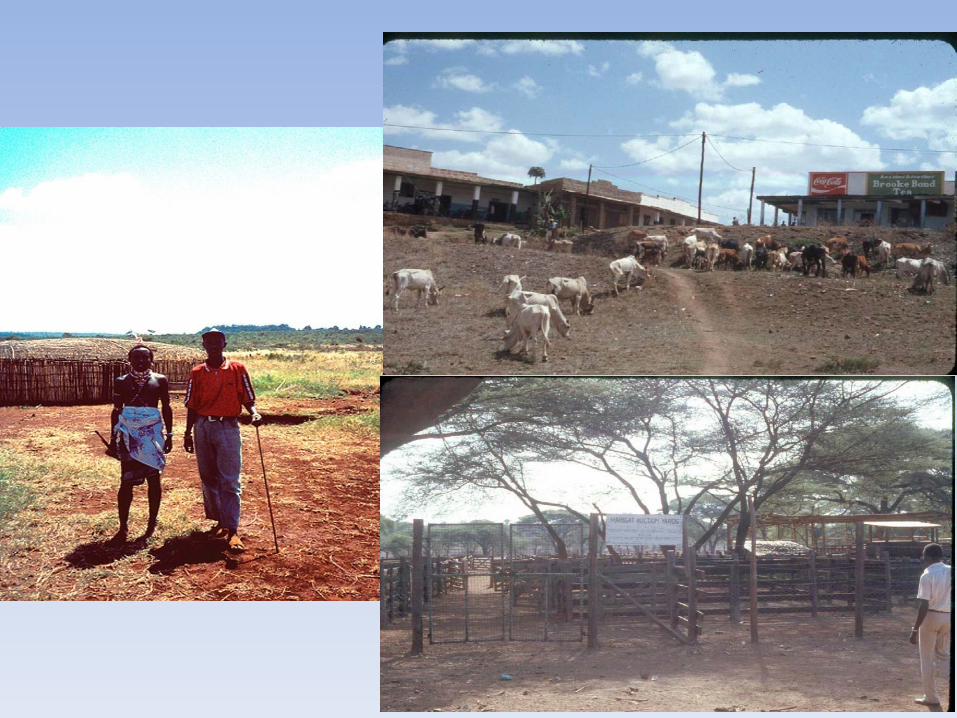
Photographs
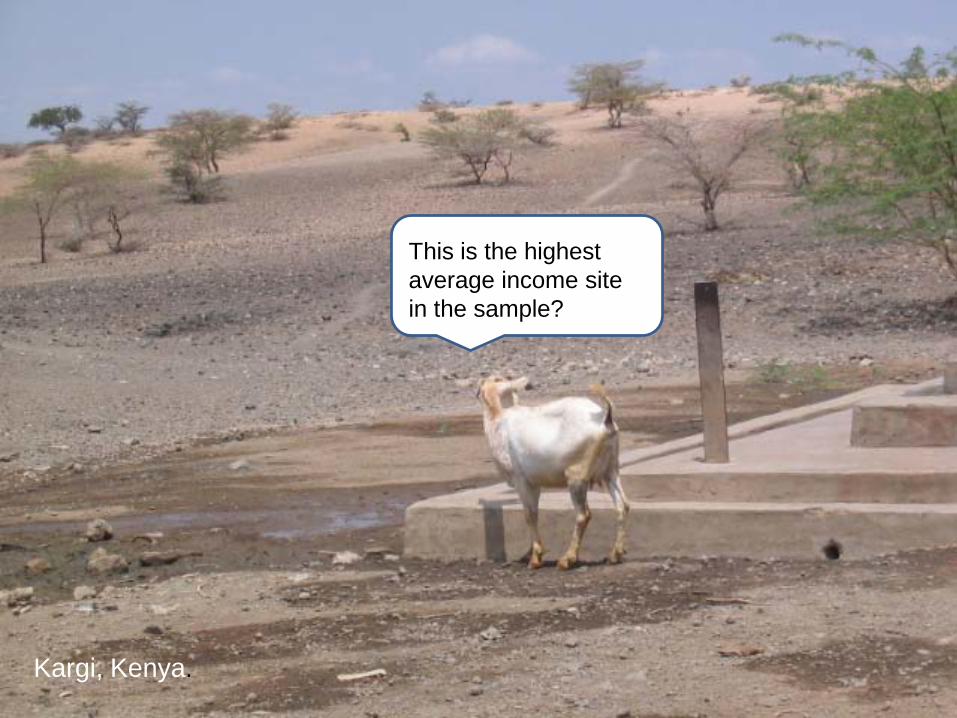
This is the highest average income site in the sample?
Kargi, Kenya.
This is the highest average income site in the sample?
Roundtable Discussion With Members of the Global Livestock Discussion Group
Welcome
Roundtable Discussion
Thank you for joining us!
Upcoming Events Share Feedback Stay In Touch
Agrilinks and the Agriculture Sector Council Seminar Series are products of the USAID Bureau for Food Security under the Knowledge-Driven Microenterprise Development (KDMD) project.
Please take our 3 minute survey: http://bit.ly/May17Special You can also visit the event pagehttp://bit.ly/May17EventPage to post comments & questions.
Contact Us: [email protected] Zachary Baquet, USAID/BFS: [email protected]
May 22 | Breakfast Seminar: Feed the Future’s NAFAKA Project in Tanzania May 30 | Ag Sector Council Seminar May 31 | MSU Food Security III Event Find upcoming events & past presentations: agrilinks.org/events
Thanks you slide