september 2014 - agrilinks
TRANSCRIPT

1
Feed the Future is the United States
Government's global hunger and food
security initiative. It supports country-
driven approaches to address the root
causes of hunger and poverty and forge
long-term solutions to chronic food
insecurity and under-nutrition. Drawing
upon resources and expertise of
agencies across the U.S. Government,
this Presidential Initiative is helping
countries transform their own
agricultural sectors to grow enough food
sustainably to feed their people.
Cover photo: Yussef Kassa from the Dakabaricha Self Help Group
in Kenya received USAID training and support to purchase climate
resilient seeds. To the left is his maize grown from the new,
improved seed variety and to the right is the maize from his old
seeds.
Photo by Polycarp Otieno Onyango, REGAL-IR
September 2014
1
Overview The Feed the Future Monitoring System (FTFMS) is part of an interagency effort to consolidate U.S. Government (USG)
reporting on Feed the Future activities. The U.S. Agency for International Development (USAID), Department of
Agriculture, Millennium Challenge Corporation, Peace Corps, Department of Treasury (contribution to the Global
Agriculture and Food Security Program), The International Fund for Agricultural Development (IFAD), and the US-Africa
Development Foundation contribute data to FTFMS. FTFMS indicator data are the official results for Feed the Future, help
USAID/Bureau for Food Security (BFS) support your work in the field, provide the foundation for public documents like the
Feed the Future Progress Report, and inform decisions on future programming and budget allocations.
FTFMS collects and stores information at the implementing mechanism (IM) level for all USAID Operating Units (OUs)
receiving 4.5 Agriculture (FTF Focus, Aligned, and Strategic Partner countries), 3.1.9 Nutrition (focus countries only), or
Food for Peace development funding (all countries).1 This includes buy-ins to Washington-managed IMs and pooled donor
funding. Data for population-based survey (PBS) indicators from the 19 FTF Focus Countries are also entered in the
FTFMS. PBS indicators track results in the FTF Zone of Influence and are collected and entered by either the centrally-
funded FTF FEEDBACK mechanism or an OU-procured M&E contractor,2 along with indicators from secondary sources.
1 Aligned Missions are not required to report 3.1.9 Nutrition funding in FTFMS.
2 Population-based survey (PBS) indicators are collected by the centrally-funded FTF-FEEDBACK mechanism for the following Focus
Countries: Kenya (north), Malawi, Mozambique, Rwanda, Tajikistan, Uganda, and Zambia.
FTFMS Basics and Support
FTFMS Opens: October 1, 2014
FTFMS Deadline: November 18, 2014
Updates: December 15-19, 2014
Website: www.ftfms.net
Send requests for new accounts to Lela Makbul at FTFMS Help Desk ([email protected])
Existing users: select “forgot password” on the login screen if old password is lost
FTFMS webinar October 7, 2014 (8:00-9:30 a.m. Washington time)
Hyperlinks
Annex I: FTF Indicators (including new, changed, and archived indicators)
Annex II: Attributions
Annex III: Sample IM Performance Narrative
Annex IV: Sample FY14 FTF Key Issue Narrative
Annex V: Annotated Screenshots
Annex VI: FY14 FTFMS Training Exercise
Revised FTF Indicator Handbook: www.FeedtheFuture.gov/progress.
Go to www.Agrilinks.org to view recorded FTF M&E webinars and other resources.
Contact John Spears ([email protected]) for system issues, Anne Swindale ([email protected]) for indicators,
Sally Rey ([email protected]) for budget/attribution, and your BFS M&E POC for other reporting questions.

2
FTFMS Checklist
Task Description FTFMS
Location Responsible
Confirm IM
Information
Make sure basic IM information is correct (name, start/end dates, IP name,
award number, etc.). Enter updates or corrections in FACTSInfo. Contact
[email protected] if you are unable to locate an IM.
Enter Project
Information
OU Staff
Hide Extra IMs OUs can hide old, duplicate, or non-activity IMs (A&O, etc.). Click the
next to an IM you wish to hide. Enter Project
Information OU Staff
Add/Confirm IM
Tags
Please select/confirm all relevant tags on left and move to box on the right.
Enter Project
Information
(click in IM
Details
column)
OU Staff or
Implementing
Partners (IP) Add/Confirm IM
Location
Select “Add location.” Use the drop-down menus to select country, region,
sub-region levels. Add as many locations as needed. If IM activities cover
all or most sub-regions in a region, just select the region/admin 1 level.
Contact [email protected] if location options are incomplete or incorrect.
Select/Confirm
Indicators and
Commodities
Assign appropriate FTF indicators to each implementing mechanism.
Select commodities for indicators that disaggregate by commodity.
Select
Indicators
OU Staff
Open Data Entry Click “Start Data Entry” for each mechanism. This action will open the
mechanism to implementing partners and send e-mail notifications.
Select
Indicators
OU Staff
Bypass
Implementing
Partners
OUs not asking implementing partners to enter data must bypass the
implementing partner stage to enter data. Change the status in
“Submit/Approve Data” from “IP Data Entry” to “OU Data Entry.”
Enter
Indicator
Data
OU Staff
Enter Indicator
Data
FY14 Actual, FY15 Target, Out year targets for FY16 & FY17, Baseline
value (if new mechanism)
Enter
Indicator
Data
IP, OU Staff (if IP
bypassed), M&E Contractors
(M&E)
Enter Deviation
Narratives and
Comments
Enter a short deviation narrative for FY14 results if actual performance was
10% above or below the target level. Enter additional indicator comments
as needed.
Enter
Indicator
Data
IP, OU Staff,
M&E
Enter
Smallholders
Estimate
Estimate the number and percentage of FTF beneficiaries holding five
hectares or less of arable land or equivalent livestock. Entry is in “High
Level Indicators” (focus) or “FTF Key Issue/Smallholders” (other OUs).
Enter
Indicator
Data
OU Staff
Enter IM
Performance
Narratives
Enter a 1-2 page performance narrative for each IM, using the provided
template. Please ensure the data in the narratives are consistent with the
data submitted online, and that the narrative adds value to the numbers.
Enter or View
Narratives
IP, OU Staff
Upload FTF Key
Issue/PPR
Narrative
Enter the FY14 FTF Key Issue narrative in “High-Level Indicators” (focus
countries) or “FTF Key Issue Narrative/Smallholders” (other OUs).
Focus countries: please select and follow the template.
Enter or View
Narratives
OU Staff
Submit and
Approve Data
Implementing Partners and M&E Contractors: submit data to the OU.
OU Staff: Approve the data within FTFMS and according to OU policy.
Enter Indicator
Data IP, OU Staff,
M&E
Generate FTFMS
PPR Report
Export an Excel file of all FTFMS data for an OU. Data will be available
at the IM and OU levels.
Generate
Data Entry
Status Report
OU Staff
See the screenshots in Annex IV and the on-screen instructions in FTFMS for more details

3
FTF Indicators: New, Changed, and Archived
BFS worked with FTF OUs and agencies to update the FTF indicator list. New, revised, and archived indicators are listed
below and are highlighted in the indicator table in Annex 1. New performance indicator reference sheets (PIRS) are
available at www.feedthefuture.gov/progress and the FTFMS page on Agrilinks. Nine indicators were archived, five
indicators are new, and six indicators have been changed. New indicators do not have a FACTSInfo number yet and will
not be in the PPR this year.
Please see the revised FTF Indicator Handbook for full performance indicator reference sheets (PIRS) of the new and
revised indicators. The new FTF Indicator Handbook also includes many clarifications and explanations to other indicators.
Archived Indicators: OUs may delete archived indicators or continue to track in FTFMS.
New indicators: Please add as appropriate.
Changed indicators: No action required prior to data entry. Please read the revised PIRS for each indicator.
New Indicators
4.5.2(TBD1): Prevalence of women of reproductive age who consume targeted nutrient-rich value chain commodities
4.5.3(TBD2): Prevalence of children 6-23 months who consume targeted nutrient-rich value chain products
4.5.3(TBD3): Total quantity of targeted nutrient-rich value chain commodities set aside for home consumption by
direct beneficiary producer households
4(TBD8): Depth of Poverty: The mean aggregate consumption shortfall relative to the $1.25 poverty line
4.5.1 (TBD9): Number of national-level policies required for full implementation of a regionally agreed-upon policy
progressing through necessary steps as a result of USG assistance.
Changed Indicators
4.5.2(35): Percent change in value of intra-regional trade in targeted agricultural commodities (for regional missions)
4.5.2(5): Number of farmers and others who have applied new technologies or management practices as a result of USG assistance
4.5.2(2): Number of hectares under improved technologies or management practices as a result of USG assistance
4.5.2(6): Number of individuals who have received USG supported long-term agricultural sector productivity or food security training
4.5.2(34): Number of people implementing risk-reducing practices/actions to improve resilience to climate change
4.5.1(24): Number of agricultural and nutritional enabling environment policies completing the following
processes/steps of development as a result of USG assistance in each case: Analysis; Stakeholder consultation/public
debate; Drafting or revision; Approval (Legislative or regulatory); Full and effective implementation
Archived Indicators
4(16): Ease of doing business rank
4.5(11): Market discount of targeted agricultural commodities
4.5.1(21): Number of climate vulnerability assessments conducted
4.5.1(26): Average number of days required to trade goods across borders
4.5.2(41): Number of water resource sustainability assessments conducted
4.5.2(25): Number of people with a savings account or insurance policy
4.5.2(32): Number of stakeholders using climate information
4.5.1(22): Number of rural hectares mapped and adjudicated
CBLD5: Score, in percent, of combined key areas of organizational capacity among USG direct and indirect local IPs.

4
Other Updates
Custom Reports: OU-level users can now create custom reports in FTFMS. Go to the “Download Reports and Check Data
Entry Status” screen and click on the “Custom Report” tab. The standard reports (PPR Report and Data by IM) will still
meet the needs of most users, but the custom reports may be useful for reports on specific indicators and commodities or
to see results by agency at the country level. See the screenshots in Annex V for detailed instructions.
FTF Key Issue Narrative Template (focus countries): As mentioned in the FY14 PPR guidance the FTF Key Issue should
follow the template in Annex IV. The goal is to create data-driven country narratives that explain how FY14 results are
leading to the ZOI outcome targets. The FTF Key Issues narratives will be a key input to the FY14 FTF Portfolio Reviews.
The new FTF Key Issue narrative template is described in more detail in the “Narratives” section.
Ensuring Data Quality: FTFMS data are used to justify FTF activities to Congress and other key stakeholders throughout
the year and each OU must strive to submit high-quality data. To emphasize that the entire OU is responsible for the
quality of data submitted to FTFMS we changed the name of OU-level approval in FTFMS from “Cleared/Authorized” to
“Data approved by OU.”
FTF ZOI Detail for PBS Indicators: Three areas were added to each PBS indicator: DA/ESF-funded, FFP-funded, and Other.
Adding the three areas will allow us to differentiate and report on varying strata within the ZOI, including FFP, resilience
areas, and the value chain-focused FTF zone.
New Calculation for Value of Incremental Sales indicator (4.5.2-23): The calculation was updated in spring 2014 to
account for changes in the number of beneficiaries. Many mechanisms had significantly expanded the number of
beneficiaries since baseline, resulting in artificially high incremental sales values since the baseline sales of the new
beneficiaries were not included in the baseline. The new calculation uses the baseline sales and baseline number of
beneficiaries to establish average sales per beneficiary at baseline. The average sales per beneficiary are multiplied by the
number of beneficiaries for each reporting year to create an adjusted baseline sales value.
FTFMS and FACTSInfo (Operational Plans/PPR)
FTFMS and the PPR: The FTFMS reporting schedule is aligned with the Performance Plan and Report (PPR) reporting
period. OUs can generate a FTFMS PPR Report that aggregates indicator data from the mechanism level to the OU level
(see example in Annex 5). Indicator totals from the FTFMS PPR Report can be entered into the PPR without modification if
all mechanisms that contribute to an indicator are FTF mechanisms. Non-FTF mechanisms are mechanisms that do not
receive 4.5 Agriculture funding or 3.1.9 Nutrition funding. OUs are strongly encouraged to enter FTF indicator data in
FTFMS before entering data in the PPR to improve consistency between the results in each system.
Value of Incremental Sales Old Calculation: Incremental Sales = Reporting Year Sales – Baseline Sales
New Calculation: Incremental Sales = Reporting Year Sales – Adjusted Baseline Sales

5
Nutrition Results in FTFMS and PPR: Nutrition results in FTFMS used to be restricted to the FTF zone of influence in FTF
focus countries. Starting with FY14 reporting focus countries should report all nutrition results regardless of location. It is
necessary to align nutrition reporting between FTFMS and the PPR due to a planned transition of FTF data entry from
FTFMS to AidTracker Plus for many operating units in FY15.
FTFMS and Operational Plans: FTFMS is pre-populated with implementing mechanism information from OU Operational
Plans via FACTSInfo. The transfer includes basic implementing mechanism information:
Name, life of project, implementing partner, FACTSInfo ID number, award number; FY14 budget allocation, Key
Issues selected, implementing mechanism planning narratives and FTF Key Issue planning narratives.
The transfer does not include indicators or indicator data.
The FTFMS/Operational Plan link saves time and ensures IM consistency between FACTSInfo and FTFMS. Changes or
corrections to the basic implementing mechanism information must be made in FACTSInfo (Operational Plan). Edits
entered in FACTSInfo are transferred to FTFMS every day at 12:01 a.m. Washington time.
Roles and Responsibilities There are three main FTFMS user types: implementing partner, operating unit (OU) staff, and OU-funded M&E
contractors. Data can be entered by implementing partners directly, by M&E contractors, CORs/AORs or the Program
Office. E-mail notifications are sent to OU staff when implementing partners submit data to the OU-level. OU staff
approves all implementing mechanism data before the BFS data review. Please remember to approve data for each
implementing mechanism by selecting “Data Approved by OU”. Once an OU user approves data in FTFMS it is released to
BFS for review (November 18 deadline) or for final reporting (December 19 deadline).
Each OU is free to determine who enters and approves FTFMS implementing mechanism data
OUs can choose to enter all data on behalf of implementing partners
Please follow any existing OU policies for approving final FTFMS data
Access and Training FTFMS (www.ftfms.net) is a web-based program that can be accessed at any computer running at least Windows XP and
Internet Explorer 7. Software installation is not required. Google Chrome is also supported. Safari (Macintosh) and
Firefox usually work, but are not officially supported. If you are having trouble with FTFMS using Safari or Firefox, try
Internet Explorer or Google Chrome.
Current users can log in to FTFMS using their existing username (full e-mail address) and password. Select “forgot
password” on the login screen if you do not have your old password. FTFMS will prompt users to create a new password
every 90 days. Users also have the option to use a random system-generated password. Please contact the FTF Help Desk
([email protected]) if you need to create an account.
New FTF indicators and disaggregates will not appear in the PPR/FACTSInfo this year.
New disaggregates in changed indicators will not be available in the PPR this year
6
Webinar: A webinar will be held on October 7th from 8:00-9:30 a.m. Washington time to review the guidance and other
FTFMS questions. Click or enter this link to register for the webinar: http://agrilinks.org/events/fy14-feed-future-
monitoring-system-ftfms-guidance-review. You can also visit the same link after the webinar to view a recording of the
event and download the presentation.
Explore Indicators: This screen in FTFMS allows users to see how the data entry screen is configured for each indicator
and export the indicators to Excel. The exports can be used as a template if data needs to be collected outside FTFMS.
Training Site: You can experiment with FTFMS at https://training.ftfms.net. This website is a copy of FTFMS. Feel free to
enter data or other actions. The training site is separate from FTFMS and the data are not saved. Log in to the testing site
by adding “trn_” to your username ([email protected] or [email protected]). Use your regular FTFMS password.
Training Exercise (see Annex VI): Covers the main features in FTFMS: configuring mechanisms, selecting indicators and
commodities, entering data, entering narratives, submitting/approving data, and generating reports. It can be used with
the FTFMS Training site and is meant to provide hands-on experience to complement the FTFMS webinar.
Narratives FTFMS requires IM performance narratives, indicator deviation narratives/comments, and FTF Key Issue narratives – the
FTF Key Issue narrative is the same narrative required for the PPR. Narratives are very important to help interpret FTFMS
data and prepare for the FTF Portfolio Reviews.
Indicator Deviation Narratives: Deviation narratives are required if the FY14 actual deviates +/- 10% from the FY14 target.
Deviation narratives may be short (two or three sentences), but must directly address the deviation. BFS will carefully
review each narrative and will request more information if they do not address the deviation.
Indicator Comments: Please enter indicator comments to provide details, list public-private partnerships, explain unique
circumstances or outline data collection challenges. Refer to the indicator PIRS to determine if specific narrative is
required for the indicator.
IM Performance Narrative Template:
FTFMS requires a one or two page performance narrative for each IM. Narratives should add value to the data by
explaining how FY14 results are linked to the desired outcomes (instead of just repeating the results) and provide context.
Please identify successes and challenges and mention unique conditions or circumstances. Spell-out project names and
acronyms, do not use jargon. A template is available on the narratives screen in FTFMS and an example narrative is
included in Annex 3.
1. Project Summary (one short paragraph listing project context, purpose, scope, key approaches, and goals. Mention the main beneficiaries and key stakeholders/partners– one option is to modify/update the OP narrative.)
2. FY14 Performance (Discuss significant FY14 results and key FY14 actions. Describe the main beneficiaries. Why are the results important?)
3. Successes and Challenges (How will successes lead to desired outcomes? How is the IM adapting?)

7
FY14 Key Issue Narrative Template (focus country OUs)
Focus country OUs must follow the template below when completing the FTF Key Issue for the PPR (also uploaded to FTFMS). The template is organized around the ZOI outcomes identified in the 2014 FTF Portfolio reviews. In addition to following the standard PPR Key Issue guidance, the narrative must demonstrate how FY14 data are leading to the FTF ZOI-level outcomes. The FTF Key Issue narratives will be used as a key input to the 2015 FTF Portfolio Reviews and for reporting to Congress. OUs may upload a longer narrative to FTFMS beyond the 10,000 character limit for the PPR.
1. FY14 Results: (Please describe how FY14 data support each ZOI outcome target. Be sure to identify key FY14 actions taken to
support the scaling plans. Mention key projects and implementing mechanisms. Discuss the location of nutrition and FFP activities relative to the FTF ZOI.)
Outcome Target #1:
FY14 Outputs and Intermediate Results: Scaling - FY14 Actions:
Outcome Target #2:
Outputs and Intermediate Results: Scaling - FY14 Actions:
Outcome Target #3:
FY14 Outputs and Intermediate Results: Scaling - FY14 Actions:
2. FY15 Expected Results: (Discuss how FTF projects during FY15 will build on FY14 success or address challenges. Mention
potential use of field support mechanisms. Explain how new or modified mechanisms in the FY15 mission procurement plan will ensure adequate density of FTF activities in the ZOI needed to implement scaling plans and meet output targets.)
Focus Areas for FY14 Reporting The points below discuss new requests, clarifications, or common mistakes from FY13. The bullets below will also be
covered in the FTFMS webinar. Please review and contact your OU or BFS M&E POC with questions.
Jobs created: Jobs lasting less than one month are not counted, emphasizing jobs that provide more stability through
length. If an IM has employment creation as an activity objective, and wants to report seasonal agricultural labor
generated as a result of its activities under this indicator, it must be able to track the number of consecutive days per
person generated so only employment for more than 30 consecutive days in length is counted. The IM should not sum
person-days of seasonal agricultural labor generated over the production cycle(s) and divide by 260 to determine FTEs.
Extrapolation: Many IM-level indicators require data that reflect the total for all direct beneficiaries (e.g. total
production, total value of sales, total quantity of sales, total recurrent cash input costs, total units of production
(hectares, animals, cages) by commodity and sex for 4.5-16, 17,18 Gross Margin; total hectares under improved
technologies for 4.5.2-2 number hectares under improved technologies, total baseline and reporting year sales for
4.5.2-23 Value of Incremental Sales). If data are collected from a sample of direct beneficiaries, sample averages must
be extrapolated to the total direct beneficiary population. Do not enter sample totals or averages.
Baselines: If the baseline for an indicator is not available, leave it blank. Do not enter 0, which is a real value.
8
Out-Year Targets: Please enter out-year targets when possible, even for implementing mechanisms still in the
procurement phase. Failing to report out-year targets gives the impression that overall FTF results are declining.
Targets for implementing mechanisms in the procurement stage can be entered by creating a TBD mechanism in
FACTSInfo. OUs will have multiple opportunities to update out-year targets as needed. Most indicators require
targets to be set at the disaggregate level, although there are exceptions. Target data points are not required for the
gross margin indicator (4.5-16-18), and targets are not required at all for the following contextual indicators: intra-
regional trade (4.5.2-35), percentage of national budget to nutrition (3.1.9.3-1), and percentage of national budget to
agriculture (4.5-12). Please consult the FTF Indicator Handbook for more information.
Nutrition: Focus country OUs, please make sure nutrition activities are reported in FTFMS. OUs should now report all
3.1.9 Nutrition results regardless of location relative to the FTF ZOI. It is necessary to align nutrition reporting between
FTFMS and the PPR due to a planned transition of FTF data entry from FTFMS to AidTracker Plus for many OUs in FY15.
Number of technologies or management practices in phases of development (4.5.2-39): The purpose of the
indicator is for research activities to track the progression of new or significantly improved technologies through the
research and development process. It should not be used to track the number of available technologies being
disseminated by value chain or other activities. Technologies reported under Phase III “made available for transfer as a
result of USG assistance” should be those that have reached the stage in the R&D process where they can now be
made available to the market or partners for dissemination to farmers. A value chain activity that facilitates farmers’
access to a newly certified seed or other technology/management practice should not be assigned this indicator.
High-Level/PBS Indicators and Smallholders Estimate
Agricultural GDP: The baseline for 4.5-3 Percent change in agricultural GDP should be agricultural GDP in local
currency in 2010. Actual agricultural GDP for each reporting year should be converted to constant 2010 local currency
before entering in FTFMS. We recognize that GDP data is usually only available for calendar years and thus is
somewhat lagged. For example, GDP data for January – December 2012 are often the most recently available for FY
2013 reporting. Users should enter the most recently available GDP data in constant 2010 local currency and note the
period that the GDP data cover in the FTFMs indicator comment box.
Zone of Influence Population-based Indicators: The 16 Zone of Influence population-based indicators have been
assigned to “High-Level Indicators – name of country.” Please enter the data from the Zone of Influence population-
based survey (ZOI-PBS) in this location. Do not assign the ZOI-PBS indicators to M&E contractor mechanisms. M&E
contractors are able to enter the data from the ZOI-PBS in the High-Level Indicator section. If you want to hold
implementing mechanisms accountable for changes in any of the 16 PBS indicators, e.g. stunting, among the
population within their program area or among their direct beneficiaries, you can assign the same indicators at the
implementing mechanism level, but you must enter a description of the population covered by the indicator in an
Indicator Note so it is clear how the data reported under the indicator at the implementing mechanism level differs
from the Zone of Influence population-based data entered at the High Level Indicator level.
Smallholders Estimate: The smallholders estimate (FTF01) is very important for FTF internal use and helps us justify
FTF activities to key stakeholders. Please enter the estimated number and overall estimated percentage of
beneficiaries who hold 5 hectares or less of arable land or equivalent units of livestock. Estimate the disaggregation
between beneficiaries owning land or livestock.* If a beneficiary owns both land and livestock, report under
"livestock" only if the OU is working with the beneficiary through a livestock value chain project. If the producer is not

9
a beneficiary of a livestock activity, report under the land definition. Please include a comment that describes the
smallholders benefiting from FTF in your host country, how the mission identified beneficiary smallholders, and why
the mission decided to work with some smallholders are not others.
Loans and Investment
Value of loans: 4.5.2(29) Value of Agricultural and Rural Loans only counts cash loans disbursed by registered
financial institutions. Do not count in-kind credit. Do not count the value of the entire loan portfolio, only loans
disbursed during the reporting year. Do not count loans made by informal groups such as village savings/loan groups.
Private sector investment leveraged: Only investments made by private sector, for-profit, formal companies should
be reported under 4.5.2-38 Value of new private sector investment in the agriculture sector or food chain leveraged by
FTF implementation. Include only capital investments. Do not include funds used for operating capital. Do not include
investments made by individuals, e.g. direct beneficiary farmers.
Gross Margin
Gross Margin Baseline, Actual and Targets: All five data points (production, area, value of sale, volume of sale, input
costs) should be entered for Gross Margin baseline and actual reporting. The unit of measure for production (e.g. kg,
mt, liter) must be the same as the unit of measure for volume of sales and must be selected in the “unit of measure”
drop-down menus. The form of the product (e.g. in shell vs. shelled) for production must also be the same as the form
of the product for volume of sales. Enter targeted GM for the out-years (e.g. $280/ha); you do not need to enter
targets for the five data points. If data for the five GM data points were collected from a sample survey of direct
beneficiaries rather than a census of all beneficiaries, sample results must be extrapolated to the total beneficiary
population level before entering in FTFMS, to ensure accurate calculation of weighted average GM per commodity
across implementing mechanisms at the OU level and across countries for FTF overall reporting.
Gross Margin PPR reporting: Because aggregating across different units of measure (hectare, animal, crate) does not
make sense, a separate GM indicator for each unit of measure has been created in the PPR. The FTFMS PPR report will
provide the weighted average GM for each of these indicators for entry into the PPR. FTFMS commodity-specific GM
will be used for FTF reporting
Gross Margin and Value of Incremental Sales Horticulture Disaggregation: Gross Margin reporting for horticultural
products should be disaggregated by the specific horticultural product (e.g. tomato, onion). If an IM is working with
many different horticultural products, it may report on gross margins for the five most important. Product-specific
disaggregation is not required for Incremental Sales; the overall “horticulture” commodity disaggregate can be used.
Smallholders only!: Only report results for smallholder direct beneficiaries, even if the IM reaches larger farmers.
Value of Incremental Sales
Number of direct beneficiaries: As explained above, there is a new calculation to account for the rise or fall in the
number of direct beneficiaries each reporting year. Reporting the number of beneficiaries of each value chain is
required. FTFMS will not calculate if the number of beneficiaries at baseline and for the reporting year is not entered.
*Units of Livestock: Cattle: 10 beef cows, Dairy: two milking cows, Sheep and Goats: five adult ewes/does,
Camel Meat and Milk: five camel cows, Pigs: two adult sows, Chickens: 20 layers and 50 broilers

10
Baseline Year Sales: The Value of Incremental sales indicator cannot be calculated if the baseline sales are not
entered. If the value of baseline sales prior to project is not available, use the reporting year sales value from the first
year it was reported as the baseline.
Horticulture Disaggregation: Unlike the gross margin indicator, product-specific disaggregation is not required for
Incremental Sales; the overall “horticulture” disaggregate can be used.
Farm level, not farm gate: “Farm level” does not equal “farm gate”. All sales of targeted commodities by small-holder
direct beneficiaries are included in 4.5.2-23 Value of incremental sales, not just farm-gate sales.
Smallholders only!: Only report results for smallholder direct beneficiaries, even if the IM reaches larger farmers.
Disaggregation
Disaggregation for Required if Applicable indicators: Reporting of disaggregates is expected for all indicators, but it is
required that disaggregates be reported for required if applicable (RiA) indicators.
Sex Disaggregation: Sex disaggregation is a crucial part of FTF reporting and frequently requested by
stakeholders. We expect this information to be available from all implementing partners. Sex disaggregation is
required for all relevant indicators in the FTFMS and PPR. Both FTF guidance and ADS 203 require disaggregation by
sex for relevant indicators.
Hectares under Improved Technology Type Disaggregation: The number of hectares under each technology type
should be entered under the appropriate disaggregate – note the addition of the cultural practices disaggregate for
FT2015. In addition, the total number of hectares with one or more improved technologies should always be entered
under the # of ha with one or more Technology Type disaggregates. This allows entering hectares under multiple
technology types while preventing double-counting. See below:
Technology Type
crop genetics 800
cultural practices (new for FY15)
pest management 600
disease management
soil-related
irrigation 950
Water management
Climate mitigation or adaptation
Other
Total with one or more improved technology 1000
Example: An activity supports
dissemination of improved seed,
Integrated Pest Management and drip
irrigation. During the reporting year, a
total of 1,000 hectares were under
improved technologies: 800 with
improved seed, 600 with IPM and 950
with drip irrigation. FTFMS Technology
Type disaggregate data entry would be
as follows:
11
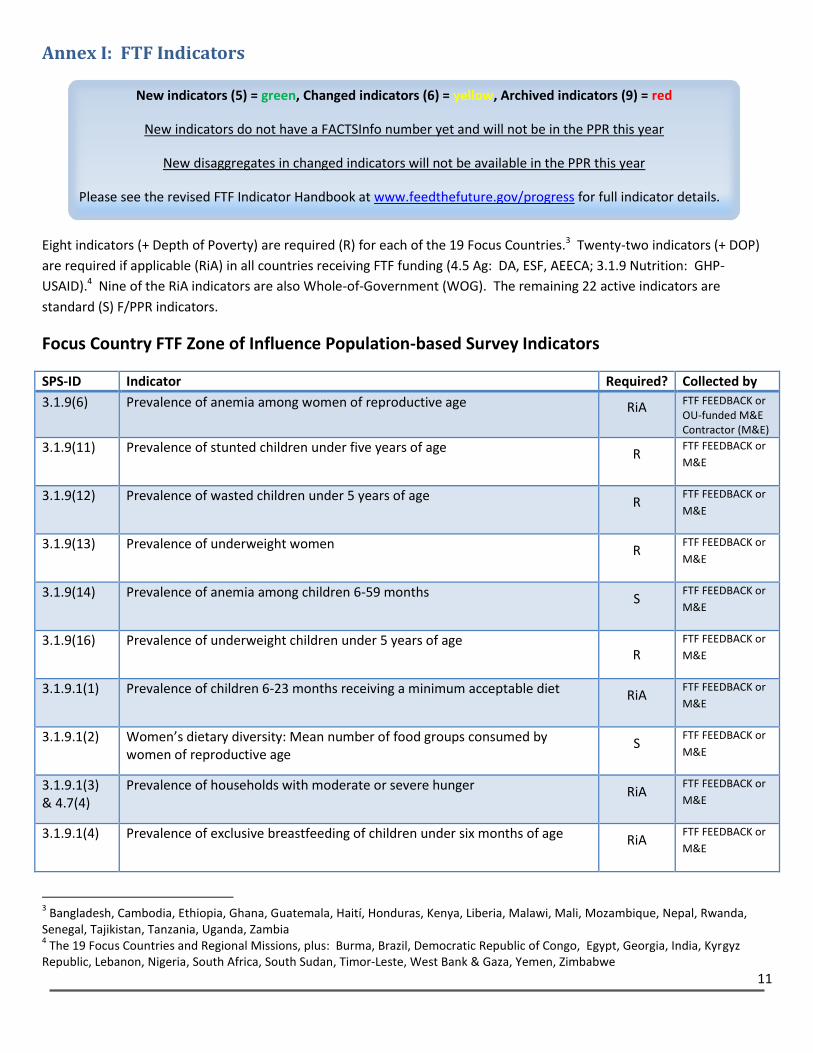
Annex I: FTF Indicators
Eight indicators (+ Depth of Poverty) are required (R) for each of the 19 Focus Countries.3 Twenty-two indicators (+ DOP)
are required if applicable (RiA) in all countries receiving FTF funding (4.5 Ag: DA, ESF, AEECA; 3.1.9 Nutrition: GHP-
USAID).4 Nine of the RiA indicators are also Whole-of-Government (WOG). The remaining 22 active indicators are
standard (S) F/PPR indicators.
Focus Country FTF Zone of Influence Population-based Survey Indicators
SPS-ID Indicator Required? Collected by
3.1.9(6) Prevalence of anemia among women of reproductive age RiA FTF FEEDBACK or OU-funded M&E Contractor (M&E)
3.1.9(11) Prevalence of stunted children under five years of age R FTF FEEDBACK or
M&E
3.1.9(12) Prevalence of wasted children under 5 years of age R FTF FEEDBACK or
M&E
3.1.9(13) Prevalence of underweight women R FTF FEEDBACK or
M&E
3.1.9(14) Prevalence of anemia among children 6-59 months S FTF FEEDBACK or
M&E
3.1.9(16) Prevalence of underweight children under 5 years of age R
FTF FEEDBACK or
M&E
3.1.9.1(1) Prevalence of children 6-23 months receiving a minimum acceptable diet RiA FTF FEEDBACK or
M&E
3.1.9.1(2) Women’s dietary diversity: Mean number of food groups consumed by women of reproductive age
S FTF FEEDBACK or
M&E
3.1.9.1(3) & 4.7(4)
Prevalence of households with moderate or severe hunger RiA FTF FEEDBACK or
M&E
3.1.9.1(4) Prevalence of exclusive breastfeeding of children under six months of age RiA FTF FEEDBACK or
M&E
3 Bangladesh, Cambodia, Ethiopia, Ghana, Guatemala, Haití, Honduras, Kenya, Liberia, Malawi, Mali, Mozambique, Nepal, Rwanda,
Senegal, Tajikistan, Tanzania, Uganda, Zambia 4 The 19 Focus Countries and Regional Missions, plus: Burma, Brazil, Democratic Republic of Congo, Egypt, Georgia, India, Kyrgyz
Republic, Lebanon, Nigeria, South Africa, South Sudan, Timor-Leste, West Bank & Gaza, Yemen, Zimbabwe
New indicators (5) = green, Changed indicators (6) = yellow, Archived indicators (9) = red
New indicators do not have a FACTSInfo number yet and will not be in the PPR this year
New disaggregates in changed indicators will not be available in the PPR this year
Please see the revised FTF Indicator Handbook at www.feedthefuture.gov/progress for full indicator details.

12
4(17) Prevalence of Poverty: Percent of people living on less than $1.25/day R FTF FEEDBACK or M&E
4(TBD8) Depth of Poverty: The mean aggregate consumption shortfall relative to the $1.25 poverty line
R (FFP) RiA(econ. resilience)
FTF FEEDBACK or M&E
4.5(9) Per capita expenditure (as a proxy for income) of USG targeted beneficiaries R FTF FEEDBACK or
M&E
4.5(19) Women’s Empowerment in Agriculture Index (WEAI) R FTF FEEDBACK or
M&E
4.5.2(TBD1) Prevalence of women of reproductive age who consume targeted nutrient-rich value chain commodities
S FTF FEEDBACK or
M&E
4.5.3(TBD2) Prevalence of children 6-23 months who consume targeted nutrient-rich value chain commodities
S FTF FEEDBACK or
M&E
National/Regional Indicators
SPS I.D. Indicator Required? Collected b y
3.1.9.3(1) Percentage of national budget invested in nutrition RiA OU or M&E
4(16) Ease of Doing Business rank S OU or M&E
4.5(3) Percent change in agriculture GDP R OU or M&E
4.5(12) Percentage of national budget invested in agriculture RiA OU or M&E
4.5.1(26) Average number of days required to trade goods across borders (average of export/import time)
S OU or M&E
4.5.2(35) Percent change in value of intra-regional trade in targeted agricultural commodities (for regional OUs)
RiA Regional OU Staff or Implementing Partner (IP)
Implementing Mechanism Indicators
SPS I.D. Indicator Required? Collected by
3.1.9(1) Number of people trained in child health and nutrition through USG-supported programs
S IP
3.1.9(15) Number of children under five reached by USG-supported nutrition programs
S (RiA for GHI) IP
3.1.9.2(2) Number of health facilities with established capacity to manage acute under-nutrition
S IP
3.1.9.2(3) Number of children under five years of age who received vitamin A from USG-supported programs
S IP
3.3.3(15) Number of USG social assistance beneficiaries participating in productive safety nets
S IP

13
4.5(2) Number of jobs attributed to FTF implementation RiA IP
4.5(10) Total increase in installed storage capacity (m3) S IP
4.5(11) Market discount of targeted agriculture commodities S IP
4.5(16,17,18) Gross Margin per unit of land, kilogram, or animal of selected product (crops/animals selected varies by country)
RiA IP
4.5.1(17) Kilometers of roads improved or constructed RiA/WOG IP
4.5.1(21) Number of climate vulnerability assessments conducted as a result of USG assistance
S IP
4.5.1(22) Number of rural hectares mapped and adjudicated S IP
4.5.1(24) Numbers of policies completing the following processes/steps of development as a result of USG assistance in each case: analysis; stakeholder consultation/public debate; drafting or revision; approval (legislative or regulatory); full and effective implementation
S IP
4.5.1(25) Number of households with formalized land RiA/WOG IP
4.5.1(28) Number of hectares with irrigation and drainage services RiA/WOG IP
4.5.1(TBD9) Number of national-level policies required for full implementation of a regionally agreed-upon policy progressing through necessary steps as a result of USG assistance.
S IP
4.5.2(2) Number of hectares under improved technologies or management practices as a result of USG assistance
RiA/WOG IP
4.5.2(5) Number of farmers and others who have applied new technologies or management practices as a result of USG assistance
RiA/WOG IP
4.5.2(6) Number of individuals who have received USG supported long-term agricultural sector productivity or food security training
S IP
4.5.2(7) Number of individuals who have received USG supported short-term agricultural sector productivity or food security training
RiA/WOG IP
4.5.2(11) Number of food security private enterprises (for profit), producers organizations, water users associations, women's groups, trade and business associations, and community-based organizations (CBOs) receiving USG assistance
RiA/WOG IP
4.5.2(12) Number of public-private partnerships formed as a result of FTF assistance S IP
4.5.2(13) Number of rural households benefiting directly from USG interventions S IP
4.5.2(14) Number of vulnerable households benefiting directly from USG assistance S IP
4.5.2(23) Value of incremental sales (collected at farm-level) attributed to FTF implementation
RiA IP
4.5.2(25) Number of people with a savings account or insurance policy as a result of USG assistance
S IP
4.5.2(27) Number of members of producer organizations and community based organizations receiving USG assistance
S IP
4.5.2(29) Value of agricultural and rural loans RiA/WOG IP
4.5.2(30) Number of MSMEs, including farmers, receiving USG assistance to access bank loans
S IP
4.5.2(32) Number of stakeholders using climate information in their decision making as a result of USG assistance
S IP
4.5.2(34) Number of people implementing risk-reducing practices/actions to improve resilience to climate change as a result of USG assistance
S IP
4.5.2(36) Value of exports of targeted agricultural commodities as a result of USG assistance (for bilateral OUs)
S IP
4.5.2(37) Number of MSMEs, including farmers, receiving business development S IP
14
services from USG assisted sources
4.5.2(38) Value of new private sector investment in the agriculture sector or food chain leveraged by FTF implementation
RiA IP
4.5.2(39) Number of new technologies or management practices in one of the following phases of development: …in Phase I: under research as a result of USG assistance …in Phase II: under field testing as a result of USG assistance …in Phase III: made available for transfer as a result of USG assistance
S IP
4.5.2(41) Number of water resources sustainability assessments undertaken S IP
4.5.2(42) Number of private enterprises (for profit), producers organizations, water users associations, women's groups, trade and business associations, and community-based organizations (CBOs) that applied new technologies or management practices as a result of USG assistance
RiA/WOG IP
4.5.2(43) Number of firms (excluding farms) or NGOs engaged in agricultural and food security-related manufacturing and services now operating more profitably (at or above cost) because of USG assistance
RiA IP
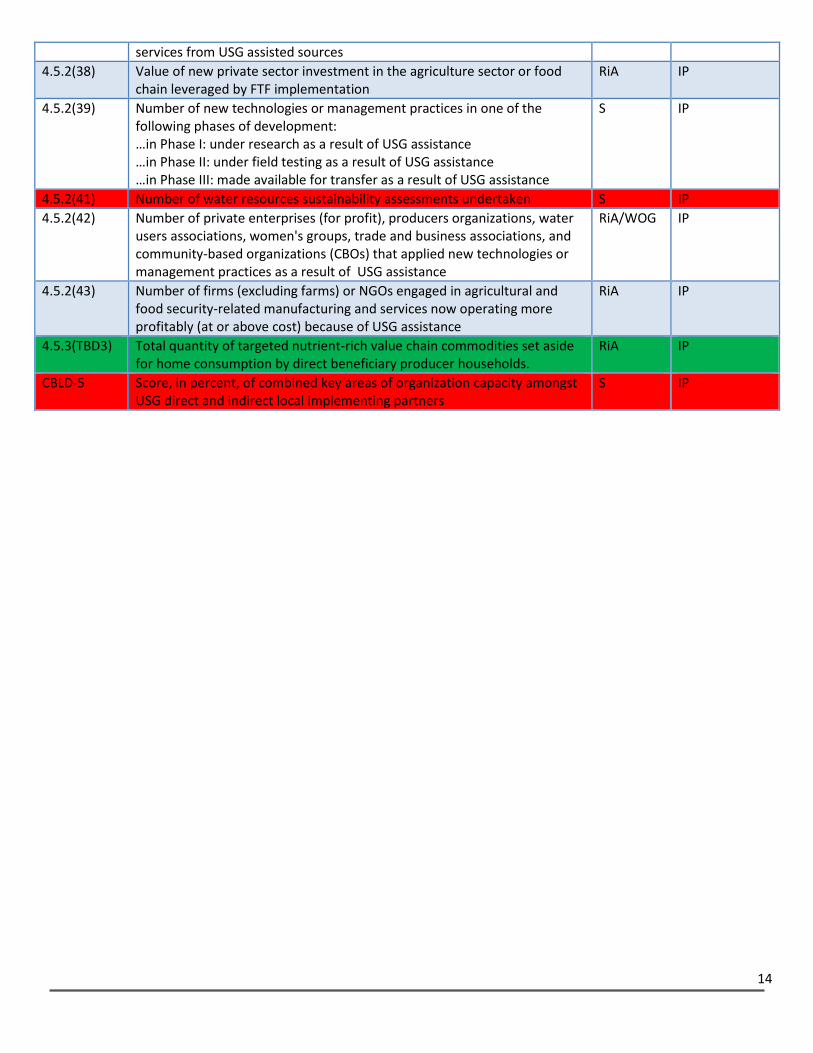
4.5.3(TBD3) Total quantity of targeted nutrient-rich value chain commodities set aside for home consumption by direct beneficiary producer households.
RiA IP
CBLD-5 Score, in percent, of combined key areas of organization capacity amongst USG direct and indirect local implementing partners
S IP

15
Annex II: Attributions FTFMS ties budget obligations with project performance to the extent possible. USAID Operating Units must report results
for all activities funded through Feed the Future allocations, including buy-ins to Washington-managed mechanisms and
activities that pool donor funding. FTFMS uses the budget allocation transferred from FACTSInfo to determine the amount
of FTF funding for each mechanism. As needed, FTFMS can produce reports that determine the results attributable to FTF
(4.5 Agriculture, 3.1.9 Nutrition). For example, a project is 70% FTF funded and 30% funded through Global Climate
Change Initiative funds and supported 100 individuals in long-term training. The implementing partner will enter 100 as
the result under # of individuals with long-term training indicator. FTFMS would attribute 70% of results (i.e. 70 individuals
trained) to FTF funding. However, since information on the allocation of funding under pooled donor activities is not
available in FACTSInfo, only the proportion of results attributable to USAID funding for multi-donor activities should be
entered into FTFMS. We attribute the full results from the Zone of Influence population-level indicators to FTF because of
our essential contribution to host country, whole-of-government, and multi-donor coordinated efforts.
Food for Peace, USDA 632b Agreements, and Peace Corps: Food for Peace development food aid programs are
considered part of FTF and are included in FTFMS. Reporting for all FFP mechanisms will be entered by DCHA/FFP. As
usual, USDA sends data for 632b agreements to the USAID Agreement Manager. The Agreement Manager is responsible
for entering project data into the FTFMS. Please coordinate with Peace Corps to ensure PAPAs and other USAID-funded
mechanisms implemented by Peace Corps are reported to OU staff and entered into FTFMS.
Buy-ins to central/BFS-managed mechanisms: OUs should coordinate with BFS to report buy-ins to Washington-managed
mechanisms. We can create an entry for the buy-in in FTFMS. In most cases data will be entered by the IP in the buy-in
entry at the same time data are entered for the centrally-managed mechanism.

16
Annex III: Sample IM Performance Narrative
1. Project Summary (one short paragraph listing project context, purpose, scope, and goals. Mention the main
beneficiaries and key stakeholders/partners– one option is to modify/update the OP narrative.)
The FTF Joint Enterprise Development Initiative (JEDI) activity, now in its fourth year, works with the Government of
Hectaria, the Morogoro Horticultural Export Council, the Songea Farmers Alliance, Integral Foods and others to reduce
constraints in the horticulture and fish value chains and open new markets. Horticulture and aquaculture production
have declined by 85% since 1986 due to disruptions caused by a decade-long civil war and a devastating hurricane in
2004. Many farmers now lack needed skills and capital. By increasing the competitiveness of the value chain, JEDI is
helping to increase the quality of horticultural and aquaculture production and create new income generating
opportunities for 75,000 smallholder farmers in the Ancud delta.
2. FY14 Performance (Discuss significant FY14 results and key FY14 actions. Describe the main beneficiaries. Why are
the results important?)
During FY 2014, JEDI expanded interventions in the southern reaches of the Ancud delta, which is part of Feed the
Future Zone of Influence. As detailed below, the project has made significant progress towards achieving its goals
including sales growth, job creation, and increased investment.
To meet the growing demand of the market, JEDI assisted its horticulture partner organizations to increase their
production and improve the quality of their products through trainings, farmer field schools, and increasing farmer
access to markets and finance. JEDI trained and assisted approximately 30,000 farmers to enhance their capacity for
better production and increase the supply of sweet potato, eggplant, and mango for domestic markets and potential
export markets. JEDI-assisted farmers jointly increased incremental sales from $3 million to $7.8 million and applied
one or more new technology to 8,788 hectares. A new partnership with First National Bank of Hectaria led to $2.75
million in new loans to farmers for the purchase of inputs. The bank was convinced to make loans to the farmers after
noting the increased production and quality that are a result of JEDI training courses and technical assistance.
JEDI’s contract farming systems provided support to 12,632 contract farmers (41% female) to introduce orange-flesh
sweet potato production (complementing the popular local variety). The farmers received a two week training to
reduce vine perishability and explain the use of biodegradable bags to avoid large post-harvest losses. The training
and support made significant positive changes in both the quality and quantity of farmer outputs: incremental sales
jumped from $500,000 in FY13 to $3.5 million in FY14 and gross margins increased 36% on the 800 hectares with the
new technologies. Integral Foods was encouraged by the progress and invested $4.5 million to construct a new
storage and distribution facility.
In the aquaculture sector, 7,000 farmers learned group marketing techniques and were linked to high quality seed
producing hatcheries, nurseries, and feed millers. These market linkages resulted in higher production and a 50%
increase in sales ($2.6 million). The shrimp subsector received workforce development assistance for better export
processing, creating 97 FTE jobs (92% women). JEDI also arranged several awareness creation campaigns to stop
malpractice and adulteration in the shrimp sector.
3. Successes and Challenges (How will the successes lead to desired outcomes? How is the activity adapting to meet
the challenges?)
17
JEDI-supported organizations generated $7.8 million in incremental sales and leveraged $10.17 million in private
sector investment. This is a significant increase from the previous year (approx. $4 million) and is mostly attributable
to a JEDI-facilitated contract between Integral Foods and the Songea Farmers Alliance signed in 2012. Integral Foods
purchased $4.4 million worth of specialty sweet potatoes and striker fish unique to the Ancud delta, raising farmer
incomes and food security. The successful partnership with Integral Foods is one example of how JEDI-supported
progress will be sustained once the activity ends in 2016.
Establishing market access to the 15,000 mango farmers on the big island of Uyuni remains a challenge. Despite
repeated promises from the GOH, the road link to the island nearly destroyed by Hurricane Bridget remains passable
only for pedestrian traffic. The GOH has also been unable to repair roads on the island. An alternative plan to transfer
mangos to the mainland by water failed since the nearly impassable roads on the island resulted in 70% post-harvest
losses before the mangos ever reached the boat. JEDI hopes to rehabilitate a long-neglected system of canals on the
island that would allow farmers to send mangos to the mainland more quickly and with a 65% reduction in post-
harvest losses.

18
Annex IV: Sample FY14 FTF Key Issue Narrative Focus country OUs must follow the template below when completing the FTF Key Issue for the PPR (also uploaded to FTFMS). The template is organized around the ZOI outcomes identified in the 2014 FTF Portfolio reviews. In addition to following the standard PPR Key Issue guidance, the narrative must demonstrate how FY14 data are leading to the FTF ZOI-level outcomes. The FTF Key Issue narratives will be used as a key input to the 2015 FTF Portfolio Reviews and for reporting to Congress. OUs may upload a longer narrative to FTFMS beyond the 10,000 character limit for the PPR.
Agriculture is a critical part of the Hectarian economy and accounts for an estimated 48 percent of employment. However, the average farm size of 1.2 acres is declining due to continued population growth coupled with traditional land distribution and inheritance practices. Feed the Future (FTF) interventions are focused in a zone located in the south and southwest regions of Hectaria with a population of over 30 million. USAID selected this zone based on its potential for significant agricultural growth and because relatively high poverty rates, high risk of severe tidal surges, annual flooding, and increasing soil and water salinization have all historically hampered production in the region. Furthermore, poverty, limited dietary diversity, and poor hygiene contribute to one of the highest child malnutrition rates in the world. In Hectaria, 36 percent of children under five years of age are underweight and 41 percent are stunted. Malnutrition is a significant cause for concern as studies have shown that malnutrition in the first 1,000 days of a child’s life can have irreversible, long-term effects on cognitive development, eventually leading to decreased workforce productivity.
1. FY14 Results: (Please describe how FY14 data support each ZOI outcome target. Be sure to identify key FY14 actions taken to
support the scaling plans. Mention key projects and implementing mechanisms. Discuss the location of nutrition and FFP activities relative to the FTF ZOI.)
Outcome Target #1: Increase rice yield by 15% - 20% on 1.6 million hectares out of a total of 2.8 million hectares under
rice cultivation in the FTF ZOI. Estimated increase in production of about 830 thousand metric tons per year.
FY14 Outputs and Intermediate Results: In FY 2014, 343,282 farmers in the FTF zone adopted high-yielding and stress-tolerant rice varieties on 47,690 hectares of agricultural land. Furthermore, FFP programs helped 1,751 farmers reduce catastrophic crop failure from floods and spread their risk using early maturing rice varieties, harvesting twice instead of just once a year. These improved varieties allowed farmers to adapt to increasing salinization and flooding. To directly improve agricultural productivity, USAID’s FTF program facilitated the adoption by approximately 3.2 million smallholder farmers (including 1.9 million new farmers) of improved agronomic technologies such as urea deep placement and water cooperatives to rehabilitate irrigation canals that make more efficient use of agricultural inputs such as fertilizer, seed, and water. USAID contributed to this technology adoption through various activities including rice field demonstrations and agricultural extension training, and training input suppliers and seed distributors. The main technologies USAID promotes are fertilizer deep placement and improved seed varieties. The deep-placement method can, in the long run, help decrease fertilizer costs and improve its efficiency by reducing fertilizer runoff during heavy rains. Importantly, fertilizer deep placement has increased rice production by 15% while reducing the amount of fertilizer used. During FY 2013, FTF expanded fertilizer deep placement technology to a total of 1,161,797 hectares in the FTF zone and an additional 405,551 hectares outside the zone, leading to incremental rice sales of $57 million in the FTF zone and an additional $20 million outside the FTF zone. USAID also expanded technical training in farm management and business record keeping skills. Overall through FTF programs, USAID trained more than 406,973 individuals on aquaculture, fertilizer deep placement and improved seeds, farm management, integrated pest management, post-harvest handling, home gardening, and group marketing. Scaling - FY14 Actions: USG agencies partnered with researchers, extension workers, and service providers from the public, private and NGO sectors, as well as other donors, to enable the rapid dissemination and adoption of improved seeds, farm practices and management approaches. USAID also carried out over 17,000 adaptive trials and demonstrations of short duration, submergence and salinity tolerant rice seed varieties as well as high yielding varieties of various vegetables, including genetically engineered eggplant. The mission is also close to releasing a new scaling plan for mechanization/service delivery.

19
Outcome Target #2: Increase yields of fish and shrimp by over 100% and 75% respectively on more than 235,000
hectares (about 70% of the total) of ponds in the FTF ZOI, resulting in incremental sales of $215 million.
Outputs and Intermediate Results: In the aquaculture sector, USAID activities strengthened fish and shrimp cultivation, expanding access to a critical source of protein and raising rural household income. USAID worked with 35 private hatcheries to improve fish and shrimp spawn nursery management. This increased household access to improved spawn and expanded fish and shrimp production by more than 100,000 hectares to a total of 210,000 hectares. In addition, FFP programs provided technical training and spawn to 10,932 of the most impoverished households to bolster their household production and income. Overall, USAID assistance was responsible for $127 million in incremental sales of fish and shrimp in the FTF zone. Scaling - FY14 Actions: The scaling plan for fish/shrimp was revised and finalized. The new plan moves beyond a focus on Tilapia to a broader range of fish and shrimp. The scaling plan includes a broad range of technologies and management practices with a particular focus on sustainable dissemination “pathways” outside the project modality, with a particular focus on the use of mobile technology to provide market information to producers.
Outcome Target #3: Increase in percentage of children aged 6 – 23 months in the Zone of Influence receiving a
minimum acceptable diet from 24% to 34%.
FY14 Outputs and Intermediate Results: USAID strongly focused on improved coordination among its FTF, FFP and health programs. For example, USAID established a group comprised of leadership teams from eight FTF and FFP projects to coordinate nutritional activities and use the most effective approaches to reduce malnutrition. As a result, USAID initiated farmer field schools that provided both training on household vegetable, poultry and fish production, as well as direct nutrition and hygiene counseling to 28,115 women. These courses provide families with the know how to grow vegetables and meats that will provide them with proper nutrition. In addition, USAID trained 14,000 health and agriculture workers who conducted over 1.1 million nutrition counseling sessions. USAID’s FFP programs augmented this work by supporting 19,435 sessions on nutrition counseling and cooking demonstrations for pregnant and lactating mothers and behavior change communication (bcc) educational broadcasts to encourage nutritional behaviors that reached over ten million children per week. Scaling - FY14 Actions: The plan for scaling aquaculture technology was finalized. Scaling of aquaculture technology will increase productivity in fish and shrimp through the use of improved varieties of fingerlings, and fish feed.
2. FY15 Expected Results: (Discuss how FTF projects during FY15 will build on FY14 success or address challenges. Mention
potential use of field support mechanisms. Explain how new or modified mechanisms in the FY15 mission procurement plan will ensure adequate density of FTF activities in the ZOI needed to implement scaling plans and meet output targets.)
During FY 2015, the Mission will launch several new projects including a $33 million agriculture value chain project, a $15 million public-private sector partnership project to develop a cold chain for horticulture, a $15 million government to government agreement to construct and/or rehabilitate agricultural infrastructure including roads and markets, and a $12 million trade facilitation program to expand the trade of agricultural commodities. The new projects will further consolidate and intensify FTF activities in the ZOI and strengthen the coordination of agriculture and nutrition activities.
20
Annex V: Annotated Screenshots
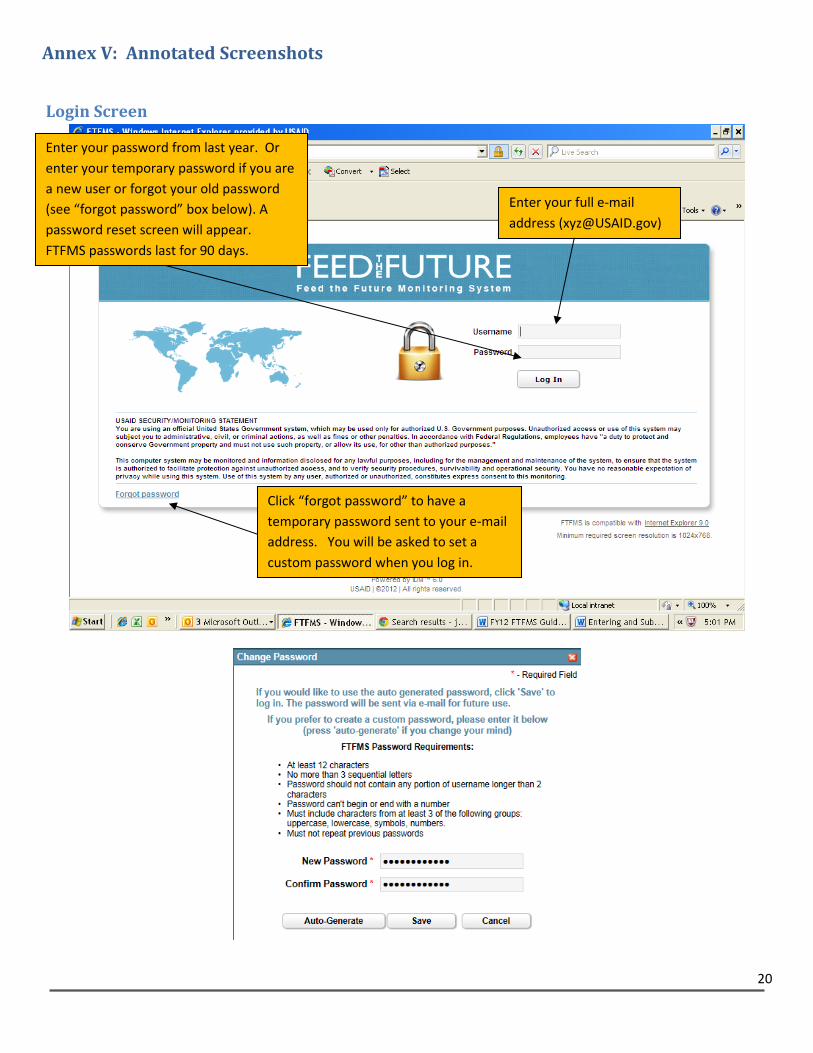
Login Screen
Enter your full e-mail
address ([email protected])
Enter your password from last year. Or
enter your temporary password if you are
a new user or forgot your old password
(see “forgot password” box below). A
password reset screen will appear.
FTFMS passwords last for 90 days.
Click “forgot password” to have a
temporary password sent to your e-mail
address. You will be asked to set a
custom password when you log in.
21
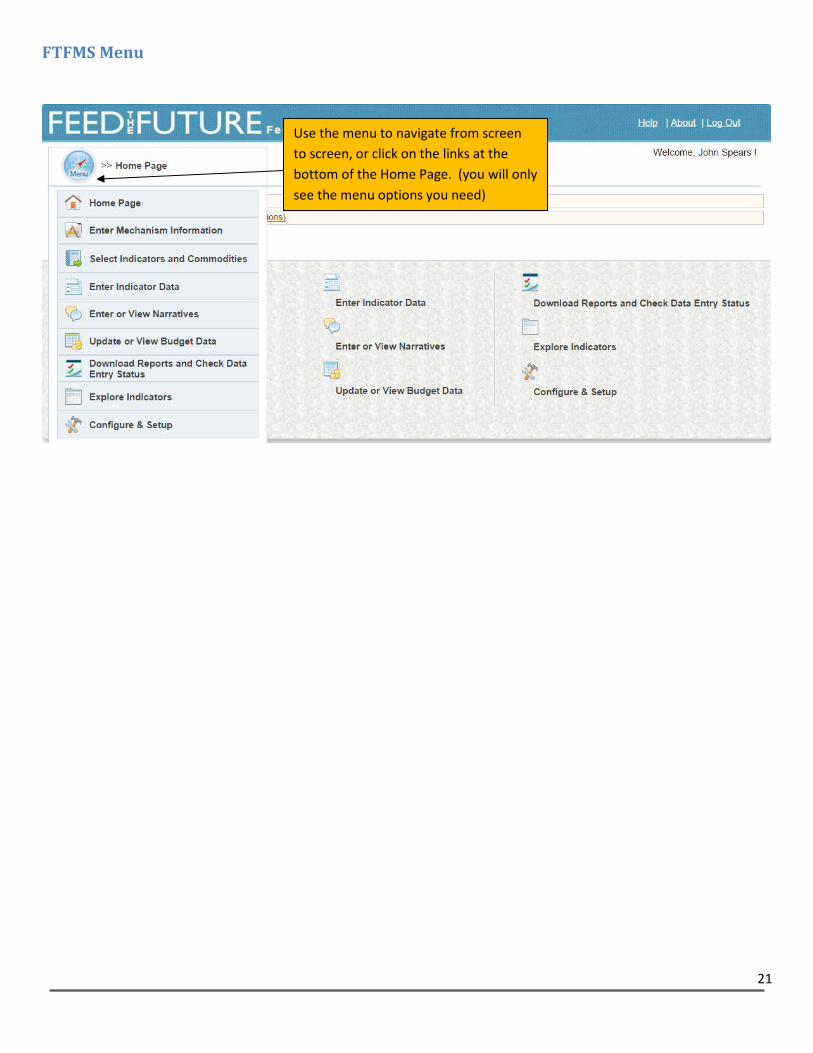
FTFMS Menu
Use the menu to navigate from screen
to screen, or click on the links at the
bottom of the Home Page. (you will only
see the menu options you need)
22
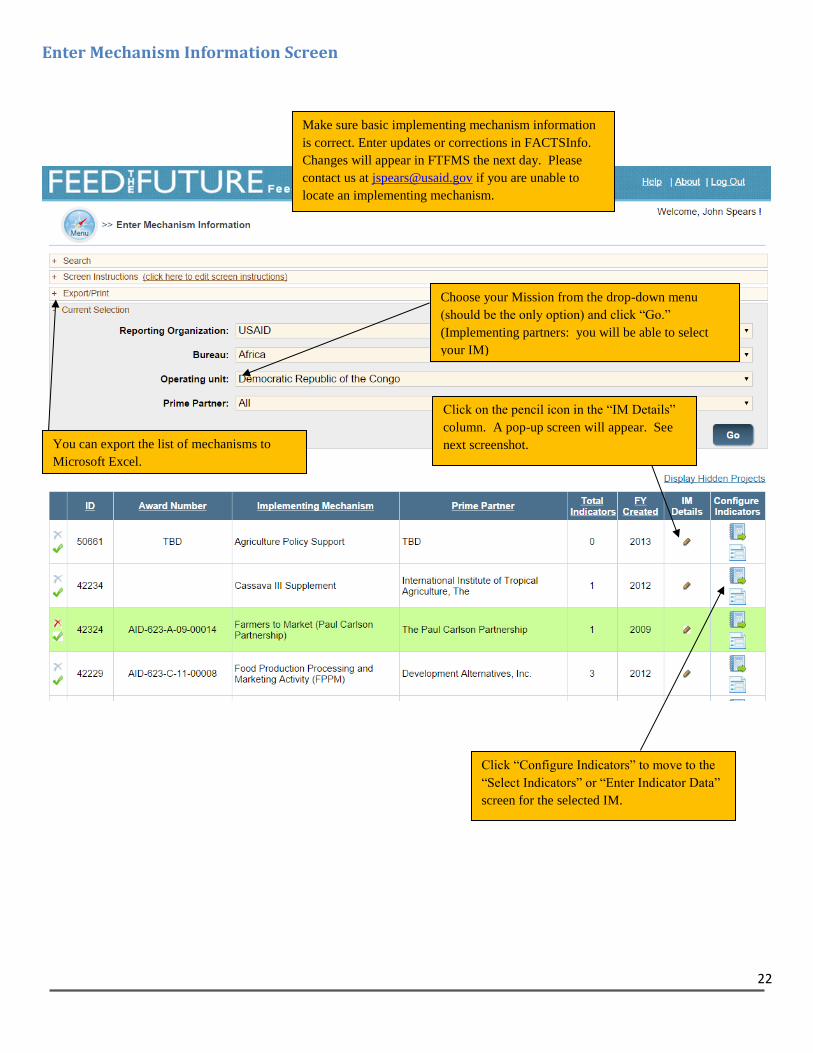
Enter Mechanism Information Screen
Make sure basic implementing mechanism information
is correct. Enter updates or corrections in FACTSInfo.
Changes will appear in FTFMS the next day. Please
contact us at [email protected] if you are unable to
locate an implementing mechanism.
You can export the list of mechanisms to
Microsoft Excel.
Choose your Mission from the drop-down menu
(should be the only option) and click “Go.”
(Implementing partners: you will be able to select
your IM)
Click “Configure Indicators” to move to the
“Select Indicators” or “Enter Indicator Data”
screen for the selected IM.
Click on the pencil icon in the “IM Details”
column. A pop-up screen will appear. See
next screenshot.

23
IM Details
Most IMs were transferred from your
OU’s Operational Plan via FACTSInfo.
For FACTSInfo-transferred IMs, fields
with a red “*” are locked in FTFMS.
Edits to these fields must be made to
your Mission’s 2014 OP in FACTSInfo
(FACTSInfo pushes updates to FTFMS
daily).
Some IMs are created in FTFMS directly.
This is usually done to create a
placeholder when an IM does not
appear in the OP for some reason. In
this case, fields with a red * will be
unlocked.
Select contacts for each IM. Missions
decide who should be listed as a
contact, but the COR/AOR and the
COP are two likely choices. Move the
contact to the box on the right.
Please list any partner
organizations (local and
non-local). You can select
from the lists or click on
“create new” to enter a
new partner. This
information allows us to
search by partner name
and helps answer Front
Office information
requests.
Please select all tags that apply. And
feel free to create a new tag (select
“create new”).
FTFMS IMs and data are now
geocoded to the sub-regional level
(stay tuned for GIS reports!). You
may create as many locations as
needed. If an IM operates in all (or
most) of a region/admin1, no need to
select multiple sub-regions/admin 2.
This screen appears after clicking on the
pencil icon in the “IM Details” column
(see “Enter Project Information” screen
– previous screenshot).

24
Select Indicators and Commodities Screen
Click to see selected indicators. Click “add indicator”
to select more indicators from a list of the FTF
indicators.
You will see a similar option for indicators that
require a commodity. Click the “+” sign next to the
indicator and choose from a list of commodities.
VERY IMPORTANT
MISSION STAFF: CLICK HERE TO
OPEN THE IMPLEMENTING
MECHANISM FOR DATA ENTRY.
IMPLEMENTING PARTNERS (OR
ANYONE ELSE) WILL NOT BE ABLE
TO ENTER DATA UNTIL THIS STEP
IS COMPLETED.
Choose the implementing mechanism from the drop-
down menu. Mission users: select “all” to see all IMs
Leave this checked. FTFMS will send e-mails to the
implementing partners once data entry is opened.

25
Enter Indicator Data Screen (Part 1)
VERY IMPORTANT
Implementing Partners: Please select “Submit to OU” and click “Go” once data
entry is complete.
Mission Staff: Data entry will be locked for you until one of two things happen:
1. The implementing partner enters data and submits it to you.
2. You bypass the implementing partner stage (because the implementing
partner is not using FTFMS). Bypass the implementing partner stage by
selecting “Submit to OU” and click “Go.”
Mission Staff: Once data entry is complete, please select “Data Approved by OU”
and click “Go” to send the data to BFS.
Choose the implementing mechanism from the drop-
down menu if it is not already selected.

26
Enter Indicator Data Screen (Part 2)
Enter data in the yellow cells (14
actual, 15/16/17 targets
Indicators selected for the IM will appear. Move
between indicators using the drop-down menu.
Click “Add” to enter a deviation narrative or
comment. Type the deviation narrative/comment into
the box that will appear. FTFMS will alert you to
enter a deviation narrative for results that are 10%
above or below target (unless you already entered it).
Do not add deviation narratives or indicator
comments here. Only enter comments that apply to
the entire implementing mechanism.
Please note that the total for each disaggregate must
match. FTFMS will alert you if they do not match.
27
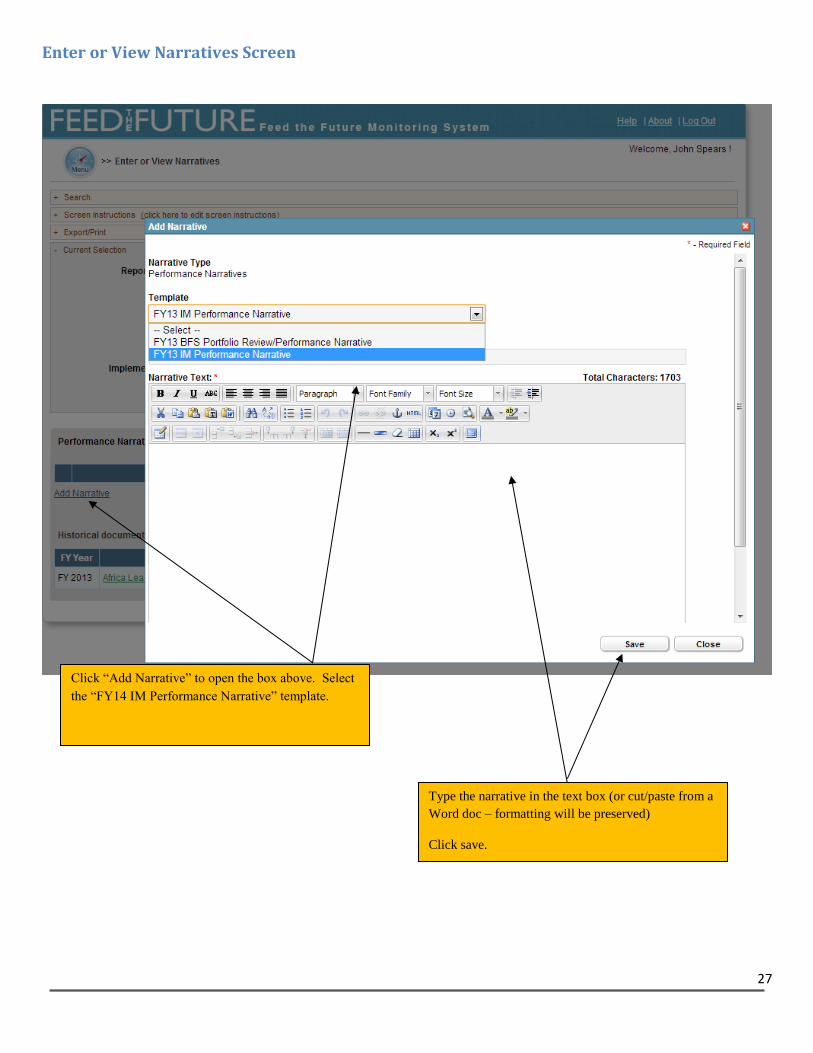
Enter or View Narratives Screen
Click “Add Narrative” to open the box above. Select
the “FY14 IM Performance Narrative” template.
Type the narrative in the text box (or cut/paste from a
Word doc – formatting will be preserved)
Click save.
28
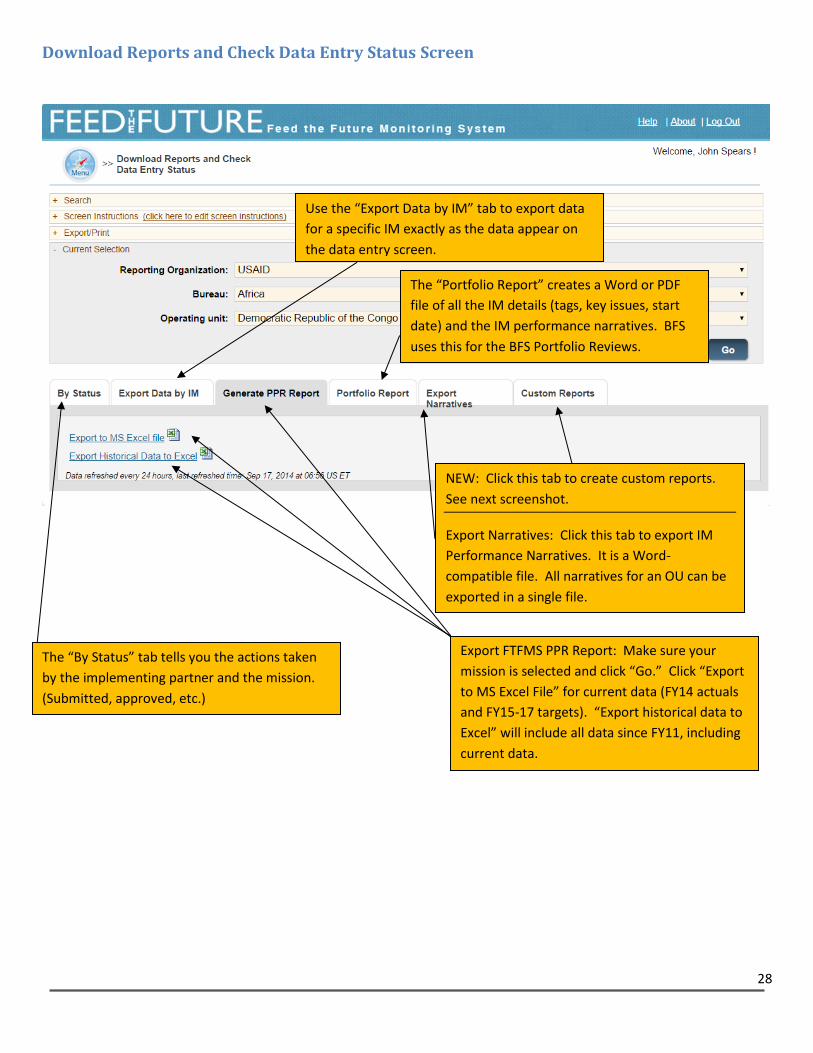
Download Reports and Check Data Entry Status Screen
The “By Status” tab tells you the actions taken
by the implementing partner and the mission.
(Submitted, approved, etc.)
Export FTFMS PPR Report: Make sure your
mission is selected and click “Go.” Click “Export
to MS Excel File” for current data (FY14 actuals
and FY15-17 targets). “Export historical data to
Excel” will include all data since FY11, including
current data.
Use the “Export Data by IM” tab to export data
for a specific IM exactly as the data appear on
the data entry screen.
NEW: Click this tab to create custom reports.
See next screenshot.
Export Narratives: Click this tab to export IM
Performance Narratives. It is a Word-
compatible file. All narratives for an OU can be
exported in a single file.
The “Portfolio Report” creates a Word or PDF
file of all the IM details (tags, key issues, start
date) and the IM performance narratives. BFS
uses this for the BFS Portfolio Reviews.

29
Custom Reports
This is the “Indicator by Data Source” report screen. Select it from the
“Custom Reports” tab.
This report has to be configured using the options below. Most
FTFMS users will not need to create a custom report, but it could be
useful in some cases. Use at your own risk.
This report is configured by
moving options from boxes on
the left side to the boxes on the
right side.
Indicators: select as many
indicators as desired. If
indicators are not selected, all
indicators will be selected by
default.
Groupings: The report will be
grouped by the top grouping.
The screenshot shows a report
that will be grouped by
indicators, then IMs.
Years: FY11 is the first year of
FTFMS data, but older data may
be available for Africa OUs.
Values: Pre-FY2013 you need to
select “PPR” and “Updated.”
“Show Disaggregates” and “Show Deviation Narratives and Indicator Comments” are self-explanatory. Be sure to
specify the year for the narratives/comments. “Show life of activity” will add a row with start/end dates and
“Show IM number” will add another row with the FACTSInfo ID number. Uncheck “Show FFP” or “Show non-FFP”
if you want to only see FFP data or see all but FFP data. “Show Hidden IMs” will include IMs in the report that
have been hidden by the OU on the “Enter Project Information” screen – could be useful when looking for old
data.
Submit and Export: Click “Submit” once the report is configured. Click the Excel icon to export to Excel.
30
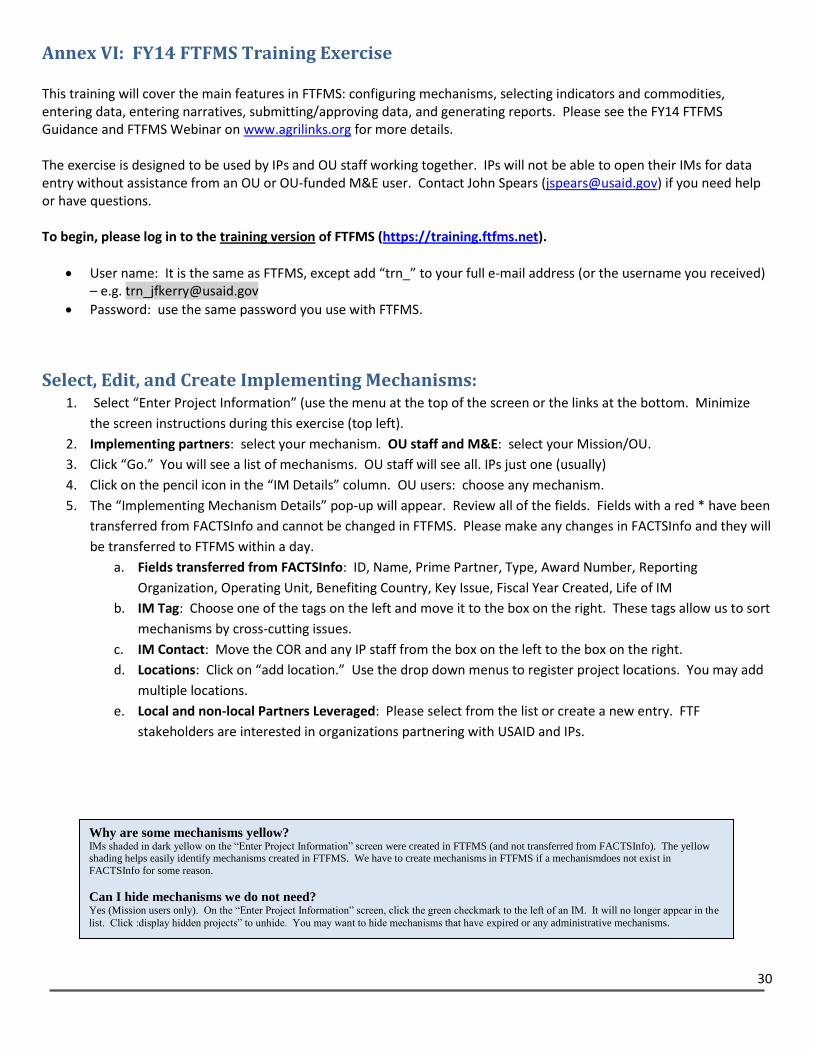
Annex VI: FY14 FTFMS Training Exercise This training will cover the main features in FTFMS: configuring mechanisms, selecting indicators and commodities, entering data, entering narratives, submitting/approving data, and generating reports. Please see the FY14 FTFMS Guidance and FTFMS Webinar on www.agrilinks.org for more details. The exercise is designed to be used by IPs and OU staff working together. IPs will not be able to open their IMs for data entry without assistance from an OU or OU-funded M&E user. Contact John Spears ([email protected]) if you need help or have questions. To begin, please log in to the training version of FTFMS (https://training.ftfms.net).
User name: It is the same as FTFMS, except add “trn_” to your full e-mail address (or the username you received) – e.g. [email protected]
Password: use the same password you use with FTFMS.
Select, Edit, and Create Implementing Mechanisms: 1. Select “Enter Project Information” (use the menu at the top of the screen or the links at the bottom. Minimize
the screen instructions during this exercise (top left).
2. Implementing partners: select your mechanism. OU staff and M&E: select your Mission/OU.
3. Click “Go.” You will see a list of mechanisms. OU staff will see all. IPs just one (usually)
4. Click on the pencil icon in the “IM Details” column. OU users: choose any mechanism.
5. The “Implementing Mechanism Details” pop-up will appear. Review all of the fields. Fields with a red * have been
transferred from FACTSInfo and cannot be changed in FTFMS. Please make any changes in FACTSInfo and they will
be transferred to FTFMS within a day.
a. Fields transferred from FACTSInfo: ID, Name, Prime Partner, Type, Award Number, Reporting
Organization, Operating Unit, Benefiting Country, Key Issue, Fiscal Year Created, Life of IM
b. IM Tag: Choose one of the tags on the left and move it to the box on the right. These tags allow us to sort
mechanisms by cross-cutting issues.
c. IM Contact: Move the COR and any IP staff from the box on the left to the box on the right.
d. Locations: Click on “add location.” Use the drop down menus to register project locations. You may add
multiple locations.
e. Local and non-local Partners Leveraged: Please select from the list or create a new entry. FTF
stakeholders are interested in organizations partnering with USAID and IPs.
Why are some mechanisms yellow? IMs shaded in dark yellow on the “Enter Project Information” screen were created in FTFMS (and not transferred from FACTSInfo). The yellow shading helps easily identify mechanisms created in FTFMS. We have to create mechanisms in FTFMS if a mechanismdoes not exist in
FACTSInfo for some reason.
Can I hide mechanisms we do not need? Yes (Mission users only). On the “Enter Project Information” screen, click the green checkmark to the left of an IM. It will no longer appear in the
list. Click :display hidden projects” to unhide. You may want to hide mechanisms that have expired or any administrative mechanisms.

31
Select Indicators and Commodities OU staff and M&E are responsible for selecting indicators and commodities, but IPs also have access. Always consult with
your OU before adding or deleting indicators or commodities.
1. Go to the “Select Indicators and Commodities” screen. There are two ways to get there: select from the menu at
the top of the screen or click on this image in the “Configure Indicators” column: 2. The drop down menus at the top should show the IM you selected on the previous screen. If not, select an IM.
(OU users: you can also see a list of all IMs on this screen) 3. Click the to the left of the IM name (will become once clicked). All indicators currently selected for the IM
will appear. Required disaggregates are listed in red and click on “reference sheet” to link to the FTF Indicator Handbook.
4. Add indicators: click on “add indicator” (appears beneath any previously-selected indicators). Make sure the following indicators are selected: 4.5.2(23), 4.5.2(2), 4.5.2(7).
5. Add commodities to 4.5.2(23): once you have added 4.5.2(23), look for the sign to the left of the indicator name. Click it. And then click the option to “add commodity.” Select one or more commodities from the box on the left and move the selected commodities to the box on the right. Click “add.”
Start Data Entry OU users must click “start data entry” for each active IM in the “IM Status” column on the “Select Indicators” screen (see
screenshot above). IP users will not be able to enter data until this happens. IP users: if your selected IM is not open for
data entry, ask an OU user to open it for you. Once you see “data entry in progress” (refresh your browser), click in
the “Configure” column or select “Enter Indicator Data” from the menu.

32
Data Entry and Deviation Narratives Finally, the moment we have all been waiting for! Data entry is available to IPs and OU staff/M&E, but not at the same
time. FTFMS defaults to “IP Data Entry” when an IM is opened. Only IPs can enter data at this point.
OU staff/M&E: you can bypass this stage by selecting “submit to OU” if data will be entered by the OU directly.
1. IP users: Select indicator 4.5.2-7 on the “Enter Indicator Data” screen for your IM.
2. Enter the data below:
FY13
Target
FY13
Actual
FY14
Target
FY15
Target
FY16
Target
Type of Individual
Producers 30 55 30 50 50
People in govt. 20 12 20 25 25
People in private sector firms
People in civil society
Disaggregates not available
Sex
Male 25 30 25 35 35
Female 25 40 25 40 40
Disaggregates not available
3. Click “calculate totals” to get a total for the two disaggregates and the overall indicator total. Click “save.”
4. There is one problem: one of the disaggregate totals does not match. Find it and adjust to match. Click “save”
again.
5. A deviation narrative is required since the FY14 actual is more than 10% above target. Click “add” in the “FY14
deviation narrative” column and type a short explanation.
Deviation narratives and indicator comments are very important and useful. Good
deviation narratives that explain the reason(s) for the deviation will answer many
questions the Mission and BFS may have about the data. And avoid follow-up in
December!

33
6. Select indicator 4.5.2-2. Enter the data below. Click “save.”
Number of hectares under improved
technologies or management practices
FY13
Target
FY13
Actual
FY14
Target
FY15
Target
FY16
Target
Technology Type
Crop genetics
Pest management
Disease management 80 80
Soil-related 125 125
Irrigation 125 125
Water management 40 40
Climate mitigation/adaption
Other
Total with one or more improved technology 125 125 165 145 135
Disaggregates not available
New/Continuing
New 125 125 45 0 10
Continuing 120 145 125
Disaggregates not available
Sex
Male 50 55 80 80 95
Female 75 70 85 65 40
Disaggregates not available
The “Technology Type” disaggregate is unique. The only row used for the indicator calculation is “total with one or more improved technology.” The individual technologies are not calculated since it is possible to have more than one
technology on a single hectare.
34
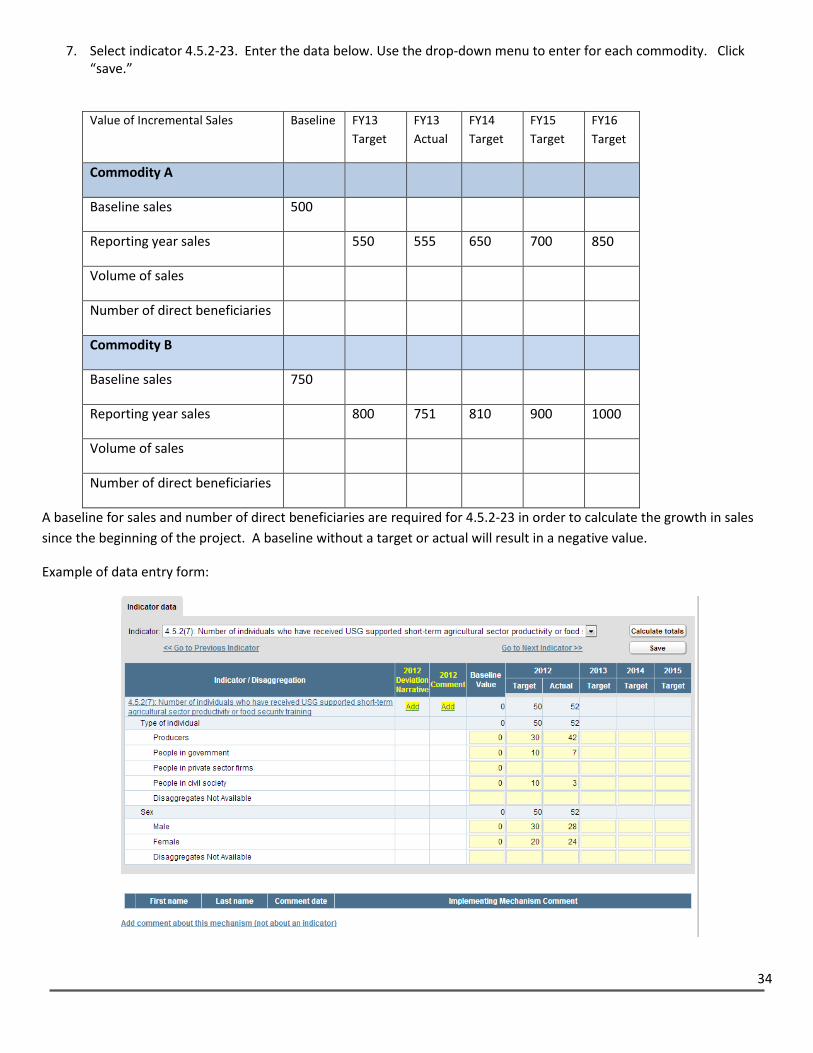
7. Select indicator 4.5.2-23. Enter the data below. Use the drop-down menu to enter for each commodity. Click “save.”
Value of Incremental Sales Baseline FY13
Target
FY13
Actual
FY14
Target
FY15
Target
FY16
Target
Commodity A
Baseline sales 500
Reporting year sales 550 555 650 700 850
Volume of sales
Number of direct beneficiaries
Commodity B
Baseline sales 750
Reporting year sales 800 751 810 900 1000
Volume of sales
Number of direct beneficiaries
A baseline for sales and number of direct beneficiaries are required for 4.5.2-23 in order to calculate the growth in sales
since the beginning of the project. A baseline without a target or actual will result in a negative value.
Example of data entry form:

35
Submitting/Approving Data IM users: once data entry is complete, please submit your IM data to the OU. Select “submit to OU” in the
“submit/approve data” bar near the top of the screen (see page 3). Click “go.” The data are now locked (read-only) to IM
users. The OU will receive an e-mail notification.
OU/M&E users: Look for submitted IMs on the “Generate Data Entry Status Report” screen, “by status” tab. Each
submitted IM may now be reviewed and edited as needed. OUs then have two options in the “submit/approve data” bar.
Send the data back to the IP
Data approved by OU (send to BFS) – this used to be called “clear/authorize.” We changed it to emphasize
that data submitted in FTFMS is official and OUs are responsible for the data.
IM Performance Narratives A one-two page performance narrative is required for each IM.
1. Go to the “Enter or View Narratives” screen.
2. Make sure the “performance narratives” tab is selected and click “add narrative.”
3. Enter a test narrative in the text box (see next page). You may also cut/paste from Microsoft Word without losing
formatting. We switched from uploading Word documents since the text box allows us to use the narratives in
reports and make them more accessible.
4. Click “save” and the narrative will now appear in the list of performance narratives. You may come back and edit
the narrative at any time (it never locks).
IM Performance Narrative Screenshot:

36
Generate Reports 1. Go to the “Generate Data Entry Status Report” screen.
2. Report #1 (by IM): click on the “Export Data by IM” tab. Select an IM above. Click “Go.” Click on “Export to MS
Excel file.”
3. Report #2 (PPR report): Click on the “Generate PPR Report” tab. Make sure “all” is selected in the IM menu. Click
“Go.” Click on “Export to MS Excel file.” The PPR report is only available to OU/M&E users and aggregates the
totals for the IM-level data to the OU level. This report can be used to enter OU data in the PPR. A second tab
includes the data at the IM-level and shows all deviation narratives and indicator comments.
4. Custom reports: See screenshots in the FY14 FTFMS guidance to see options for custom reports.
Passwords FTFMS passwords are difficult since FTFMS is linked to the FACTSInfo reporting system. Strict passwords are required to
maintain the link. You will be prompted to reset your password every 90 days.
1. Following the requirements, write a valid password in the box below.