economic value of camel milk in pastoralist communities …pubs.iied.org/pdfs/10119iied.pdf · of...
TRANSCRIPT
Country ReportApril 2015
Drylands and pastoralism
Keywords: Drylands, pastoralism, economic resilience
Economic value of camel milk in pastoralist communities in EthiopiaFindings from Yabello district, Borana zone
Galma Wako
About the authorGalma WakoMasters degree candidateHawassa [email protected]
Produced by IIED’s Climate Change GroupThe Climate Change Group works with partners to help secure fair and equitable solutions to climate change by combining appropriate support for adaptation by the poor in low- and middle-income countries, with ambitious and practical mitigation targets.
The work of the Climate Change Group focuses on achieving the following objectives:
• Supporting public planning processes in delivering climate resilient development outcomes for the poorest.
• Supporting climate change negotiators from poor and vulnerable countries for equitable, balanced and multilateral solutions to climate change.
• Building capacity to act on the implications of changing ecology and economics for equitable and climate resilient development in the drylands.
AcknowledgementsThe synthesis of research was guided by Saverio Krätli as a consultant for IIED and facilitated by Eshetu Yimer at Tufts University. The report was reviewed by Caroline King-Okumu at IIED and edited by Lucy Southwood.
International Institute for Environment and Development 80-86 Gray’s Inn Road, London WC1X 8NH, UK Tel: +44 (0)20 3463 7399 Fax: +44 (0)20 3514 9055 email: [email protected] www.iied.org
@iied www.facebook.com/theIIED
Download more publications at www.iied.org/pubs
Partner organisationsIIED is a policy and action research organisation. We promote sustainable development to improve livelihoods and protect the environments on which these livelihoods are built. We specialise in linking local priorities to global challenges. IIED is based in London and works in Africa, Asia, Latin America, the Middle East and the Pacific, with some of the world’s most vulnerable people. We work with them to strengthen their voice in the decision-making arenas that affect them — from village councils to international conventions.
The Feinstein International Center of the Tufts University Gerald J. and Dorothy R. Friedman School of Nutrition Science and Policy develop and promote operational and policy responses to protect and strengthen the lives and livelihoods of people living in crisis-affected and marginalized communities who are impacted by violence, malnutrition, loss of assets or forced migration. Through publications, seminars, and confidential evidence-based briefings, the Feinstein International Center seeks to influence the making and application of policy in the countries affected by crises and in those states in a position to influence such crises. The Center works globally in partnership with national and international organizations to bring about institutional changes that enhance effective policy reform and promote best practice. The Center seeks to combine academic excellence, innovative research and public policy development.
Published by IIED, April 2015
Galma Wako. 2015. Economic value of camel milk in pastoralist communities in Ethiopia: Findings from Yabello district, Borana zone. IIED Country Report. IIED, London.
http://pubs.iied.org/10119IIED
ISBN: 978-1-78431-148-3

country report
www.iied.org 1
this is one of a series of reports synthesising the findings of field research conducted by masters’ degree students at ethiopian universities who investigated the contribution of pastoral production to the national economy. the students developed the research to complement their degree studies, with support from the International Institute for environment and Development and tufts university.
ContentsAcronyms 2
Glossary 2
Executive summary 3
1 Introduction 4
2 Methods and materials 6
2.1 Description of research area 72.2 Sampling techniques 82.3 Data collection and tools 92.4 Limitation to research methodology 102.5 Data analysis 10
3 Study results 11
3.1 number of camels owned 123.2 Volume of camel milk produced and used 123.3 economic value of camel milk in household
economies 15
4. Discussion 17
5. Conclusion 19
References 21
Related reading 22
Appendices 23
Appendix 1: Household survey questionnaire 23Appendix 2: Key informant interview and group discussion checklist 32
Economic valuE of camEl milk in pastoralist communitiEs in Ethiopia
2 www.iied.org
AcronymsBZopDo Borana Zone pastoral Development office
Se standard error
Glossaryadolessa cold dry season (June–August)
birr ethiopian currency. exchange rate uS$1=18.81 birr from october 2013 (www.oanda.com) can be applied to all costs mentioned in this report
bona long dry season (December–February)
gada the gada broadly encompasses the social, political, and economic institutions of the Borana and other oromo branches. Legesse (1973) correctly describes the term gada as a concept that stands for the whole way of life of the oromo (Debsu 2013)
ganna long rainy season (March–May)
gibira tax
hagayya short rainy season (September–november)
kebele the smallest administrative unit in ethiopia. It is part of a woreda, which in turn is part of a zone, which is part of a region
kookkii A local unit used in the study area, 3 kookkii = 1 litre
woreda A third-level administrative division in ethiopia. A district
IIED COUNTRY REPORT
www.iied.org 3
Executive summarypastoralism is a viable economic system which contributes an immense share to the formal and informal economy at national, regional and global levels. this study investigates the economic importance of camel milk production in local and household economies in Borana zone, southern ethiopia through original research at a case study site in yabello woreda. the study reveals that the production of camel milk has a high economic value for pastoralist households and local communities, providing sustainable income and nutrition. camel milk production is improving household incomes and the wider local economy. We estimate that camel milk production in the Borana zone has a total value of 902,253 birr a day and 329.3 million birr a year, based on the total value of camel milk from sampled households, which is 11,739 birr a day and 4.2 million birr a year.
Economic valuE of camEl milk in pastoralist communitiEs in Ethiopia
4 www.iied.org
1
Introduction
IIED COUNTRY REPORT
www.iied.org 5
pastoralism is a viable economic system which makes an immense contribution to economies at national, regional and global scales. to assess the benefits of pastoralism in yabello woreda, we used a broad framework developed to assess the value of pastoralism in east Africa (Hesse and MacGregor 2006), which looks beyond the immediate benefits of livestock and livestock products. past research estimated the total annual economic value of pastoralism in ethiopia at 15 billion birr (around uS$1.6 billion)1 (SoS Sahel 2006). Domestic and international export sales of livestock and livestock products account for 12–16 per cent of the country’s GDp and 30–35 per cent of its agricultural GDp (reGLAp 2012).
camels can provide a useful addition to the economy and food security in terms of milk, meat and other products (Ahmad et al. 2010). the economic viability of camels in arid lands is assured by their comparative advantages in their ability to adapt and remain productive under harsh climatic conditions (nori et al. 2007). previous research has proved that camel and camel milk production makes a considerable contribution to local and national economies as well as to individual livelihoods (Musinga et al. 2008). the camel milk industry has a lot of potential for growth to improve the livelihoods and economic status of pastoralist communities (cAre Kenya 2009).
the first continent-wide policy framework on pastoralism recognises the economic potential of camel production in Africa’s Sahel regions and identifies camel husbandry as a priority area for further research (African union 2010). Between 1 october and 15 December 2013, Galma Wako carried out field research as part of a masters’ degree project at Hawassa university, to investigate the economic value of camel milk production in the Borana zone, southern ethiopia. this paper summarises the findings of this research, which is presented in full in the thesis.
1 exchange rate uS$1=18.81 birr from october 2013 (www.oanda.com). this exchange rate can be applied to all costs mentioned in this report.
Economic valuE of camEl milk in pastoralist communitiEs in Ethiopia
6 www.iied.org
2
Methods and materials

IIED COUNTRY REPORT
www.iied.org 7
2.1 Description of research area the study took place in yabello district, Borana zone, in the extreme southern lowlands of ethiopia, 575km south of Addis Ababa, along the east African (Addis Ababa–nairobi) main road (Figure 1).
the area is characterised by an arid and semi-arid climate, with pockets of sub-humid zones. the rainfall in the area is bimodal where the average annual rainfall varies between 350 mm and 900 mm with a considerable inter-annual variability of 21 to 68 per cent. the rainfall of the area is erratic by nature and there are four distinct seasons:
• ganna long rainy season March–May
• hagayya short rainy season September–november
• bona long dry season December–February
• adolessa cold dry season June–August
recurrent droughts are common in pastoral systems, but the frequency and severity of drought in the area has increased in the face of climate change (pFe 2010).
the topography of Borana rangelands is distinguished by plain rangelands, intersected with occasional mountain ranges, volcanic cones and depressions, and an altitude of 750–1,700 metres above sea level. A particular feature is the supply of permanent water from the traditional deep wells. the rangelands are dominated by savannah vegetation, with varying proportions of open grasslands, perennial herbaceous and woody vegetation (coppock 1994). pastoralists in the study area have a rich and respected cultural heritage and customary institutions for local governance, rules and regulations of social relationships and resource management under the umbrella of the Borana gada system (Legesse 1973).
production in the study area is primarily a pastoralist system — where livestock production is the main source of livelihood and social prestige for most of the population — together with agro-pastoralism, which relies on livestock and cereal crop production (coppock
Figure 1. Map of study area

Economic valuE of camEl milk in pastoralist communitiEs in Ethiopia
8 www.iied.org
1994). In the face of ongoing environmental change, many people have diversified their livelihoods and also engage in activities such as petty trading, forest products and others.
As the earth's climate and the natural environment has undergone perpetual change, the camel has proved more adaptable than other livestock. this attracted the attention of many Borana pastoralists and has led to the ongoing growth of the camel population in the study area since the 1970s (Wassie and Fekadu 2014).
2.1.1 Camel population in Borana zone According to the Borana Zone pastoral Development office (BZopDo), in 2012 the total camel population across the zone’s 13 woredas was 119,223 (29,690 male and 89,533 female). yabello woreda had the highest of the 13 districts, with nearly 19 per cent of the zone’s total camel population. two of the woredas — Abaya and Gelana — had no camels (see Figure 2).
2.1.2 Estimated volume and value of camel milk production in Borana zone We extrapolated the survey results from our sample households in yabello to estimate the volume and value of camel milk production at zonal level. We obtained up-to-date data on the zone’s camel population from the BZopDo and estimated the number of lactating camels and the daily volume of milk per camel based on results from the sample households in the case study site. Finally, we worked out the value of milk produced by multiplying the estimated volume of milk by the average price for the year.
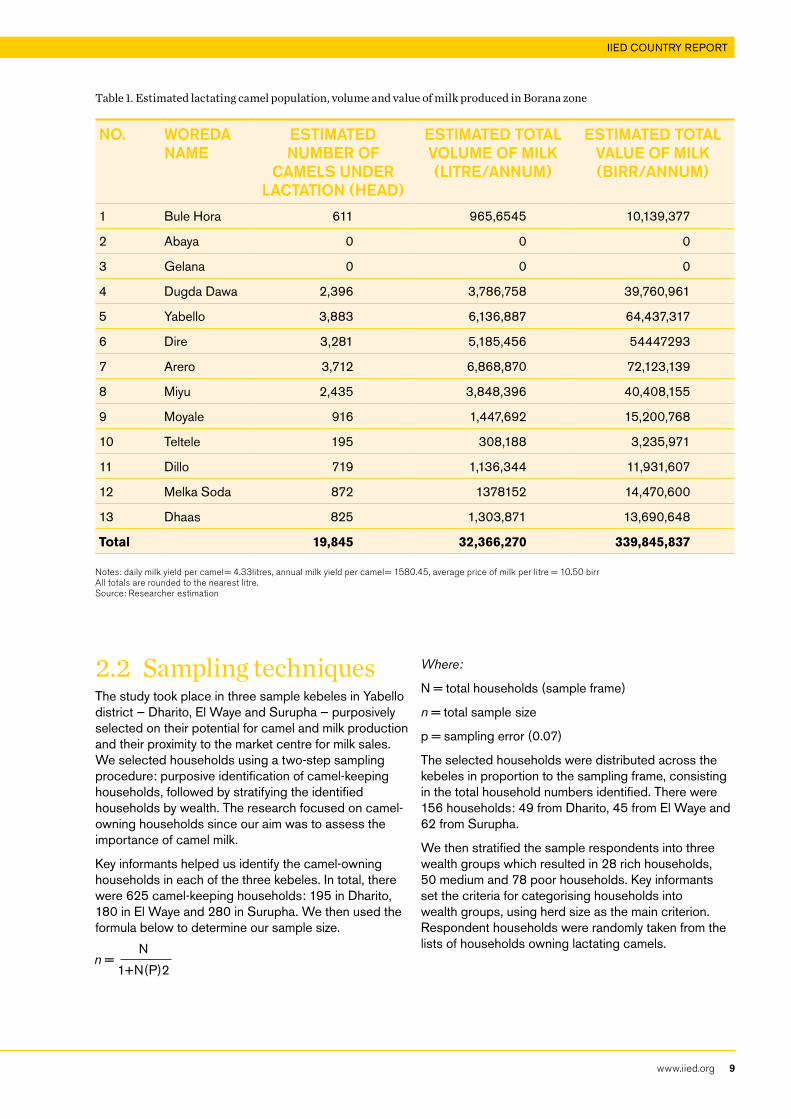
Based on the above, we assumed that 19,845 of the 89,533 total population of female camels were under lactation (see table 1), estimating the annual volume of milk production at 32,366,270 litres, with a value of 339,845,837 birr. this translates into 85,929 litres a day, with a value of 902,253 birr.
Figure 2. Total camel population, by woreda (2012)
Source: BZoPDO
cam
el p
opul
atio
n (h
ead)
Woredas
Bule H
ora
Abaya
Gelana
Dugda
Daw
a
yabe
llo DireArer
oMiyo
Moyale
telte
leDillo
Melka S
oda
Dhaas
3,703
0 0
14,520
23,326
19,886
22,498
14,520
5,248
880
4,359 5,283 5,000
25,000
20,000
15,000
10,000
5,000
0
IIED COUNTRY REPORT
www.iied.org 9
2.2 Sampling techniques the study took place in three sample kebeles in yabello district — Dharito, el Waye and Surupha — purposively selected on their potential for camel and milk production and their proximity to the market centre for milk sales. We selected households using a two-step sampling procedure: purposive identification of camel-keeping households, followed by stratifying the identified households by wealth. the research focused on camel-owning households since our aim was to assess the importance of camel milk.
Key informants helped us identify the camel-owning households in each of the three kebeles. In total, there were 625 camel-keeping households: 195 in Dharito, 180 in el Waye and 280 in Surupha. We then used the formula below to determine our sample size.
Where:
n = total households (sample frame)
n = total sample size
p = sampling error (0.07)
the selected households were distributed across the kebeles in proportion to the sampling frame, consisting in the total household numbers identified. there were 156 households: 49 from Dharito, 45 from el Waye and 62 from Surupha.
We then stratified the sample respondents into three wealth groups which resulted in 28 rich households, 50 medium and 78 poor households. Key informants set the criteria for categorising households into wealth groups, using herd size as the main criterion. respondent households were randomly taken from the lists of households owning lactating camels.
Table 1. Estimated lactating camel population, volume and value of milk produced in Borana zone
No. WoREDA NAME
EStIMAtED NuMbER of
CAMElS uNDER lACtAtIoN (hEAD)
EStIMAtED totAl voluME of MIlk (lItRE/ANNuM)
EStIMAtED totAl vAluE of MIlk (bIRR/ANNuM)
1 Bule Hora 611 965,6545 10,139,377
2 Abaya 0 0 0
3 Gelana 0 0 0
4 Dugda Dawa 2,396 3,786,758 39,760,961
5 yabello 3,883 6,136,887 64,437,317
6 Dire 3,281 5,185,456 54447293
7 Arero 3,712 6,868,870 72,123,139
8 Miyu 2,435 3,848,396 40,408,155
9 Moyale 916 1,447,692 15,200,768
10 teltele 195 308,188 3,235,971
11 Dillo 719 1,136,344 11,931,607
12 Melka Soda 872 1378152 14,470,600
13 Dhaas 825 1,303,871 13,690,648
Total 19,845 32,366,270 339,845,837
Notes: daily milk yield per camel= 4.33litres, annual milk yield per camel= 1580.45, average price of milk per litre = 10.50 birr All totals are rounded to the nearest litre. Source: Researcher estimation
nn = 1+n(p)2
Economic valuE of camEl milk in pastoralist communitiEs in Ethiopia
10 www.iied.org
2.3 Data collection and tools the study used qualitative and quantitative data from primary and secondary sources. to collect data from primary sources — sample households, key informants and groups of pastoralists — we used a household survey (see Appendix 1), group discussions and key informant interviews (see Appendix 2). Secondary data included published and unpublished articles, reports and documents from various institutions.
to explore the magnitude of camel milk production at household level, we collected data from the sample households through a household survey. We estimated the magnitude of production at zonal level by extrapolating the results of these research samples to a larger scale.
to address the seasonal variability of milk production and use, we collected production data for both wet and dry seasons. We also collected milk price data for both seasons, to estimate the value of milk produced and average prices for the year.
2.4 Limitation to research methodology the scope of the research was narrow and limited to camel milk production and its value to producers’ economies. We did not focus on the entire value chain from production through processing to end consumption. this would have been helpful to reveal the economic contribution of camel milk, not only to the camel-owning pastoralists but also to non-pastoral communities and/or individuals, whether directly or indirectly. nor did we directly assess the production volume and value of camel milk for the whole zone. Instead, we extrapolated this from the results of the sample woreda to the larger scale.
2.5 Data analysis to analyse the data, we used descriptive statistical tools such as AnoVA tests presented in mean and standard error and applied the Statistical package for Social Science (SpSS version 20) software and Microsoft office excel 2007.
Economic valuE of camEl milk in pastoralist communitiEs in Ethiopia
12 www.iied.org
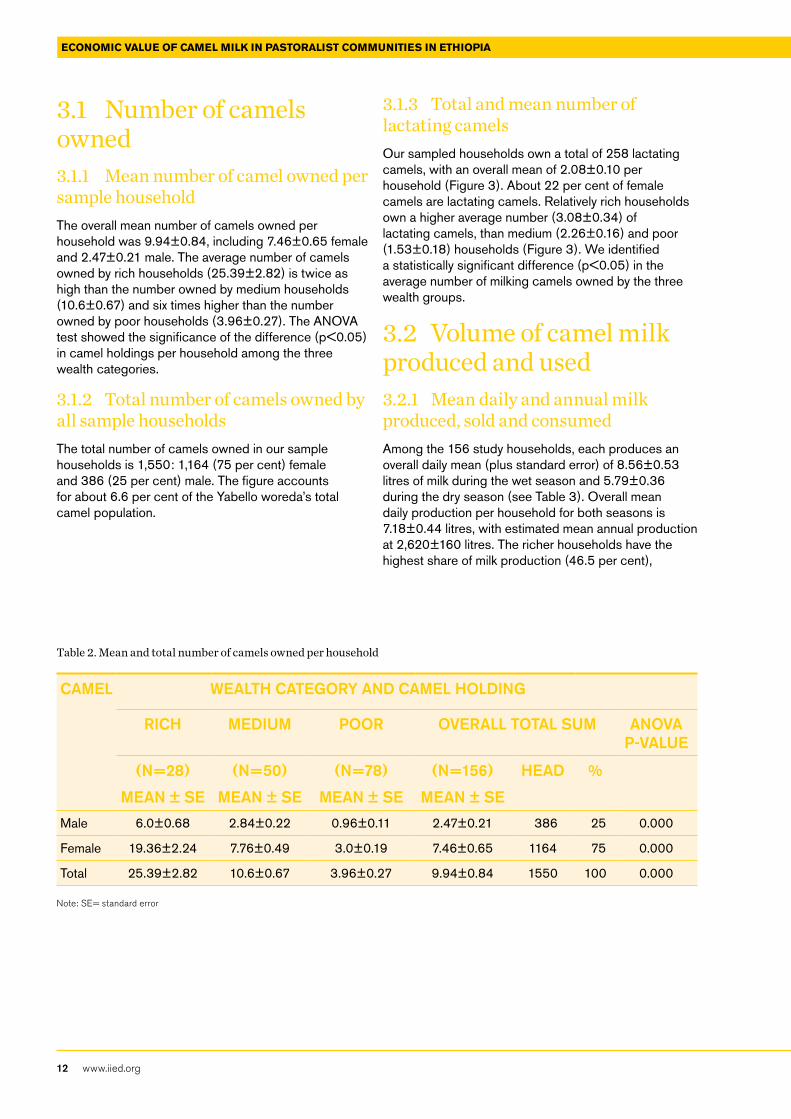
3.1 Number of camels owned 3.1.1 Mean number of camel owned per sample household the overall mean number of camels owned per household was 9.94±0.84, including 7.46±0.65 female and 2.47±0.21 male. the average number of camels owned by rich households (25.39±2.82) is twice as high than the number owned by medium households (10.6±0.67) and six times higher than the number owned by poor households (3.96±0.27). the AnoVA test showed the significance of the difference (p<0.05) in camel holdings per household among the three wealth categories.
3.1.2 Total number of camels owned by all sample householdsthe total number of camels owned in our sample households is 1,550: 1,164 (75 per cent) female and 386 (25 per cent) male. the figure accounts for about 6.6 per cent of the yabello woreda’s total camel population.
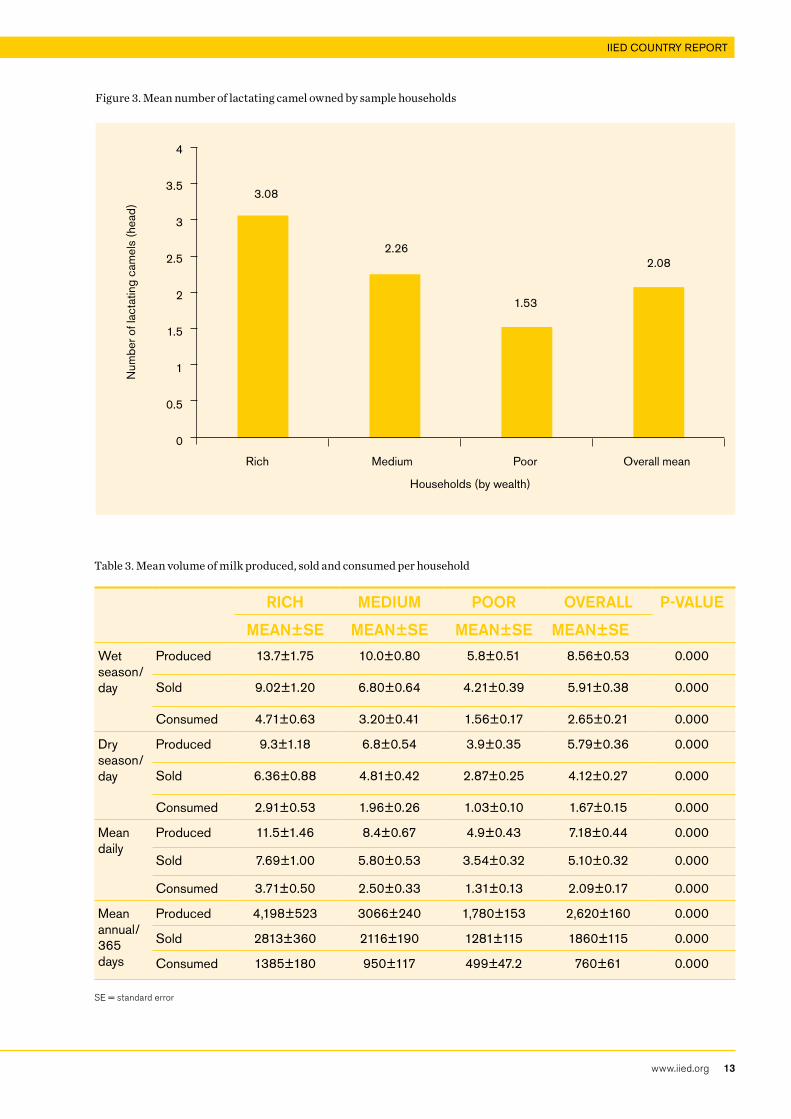
3.1.3 Total and mean number of lactating camels our sampled households own a total of 258 lactating camels, with an overall mean of 2.08±0.10 per household (Figure 3). About 22 per cent of female camels are lactating camels. relatively rich households own a higher average number (3.08±0.34) of lactating camels, than medium (2.26±0.16) and poor (1.53±0.18) households (Figure 3). We identified a statistically significant difference (p<0.05) in the average number of milking camels owned by the three wealth groups.
3.2 Volume of camel milk produced and used 3.2.1 Mean daily and annual milk produced, sold and consumed Among the 156 study households, each produces an overall daily mean (plus standard error) of 8.56±0.53 litres of milk during the wet season and 5.79±0.36 during the dry season (see table 3). overall mean daily production per household for both seasons is 7.18±0.44 litres, with estimated mean annual production at 2,620±160 litres. the richer households have the highest share of milk production (46.5 per cent),
Table 2. Mean and total number of camels owned per household
CAMEl WEAlth CAtEGoRy AND CAMEl holDING
RICh MEDIuM PooR ovERAll totAl SuM ANovA P-vAluE
(N=28)
MEAN ± SE
(N=50)
MEAN ± SE
(N=78)
MEAN ± SE
(N=156)
MEAN ± SE
hEAD %
Male 6.0±0.68 2.84±0.22 0.96±0.11 2.47±0.21 386 25 0.000
Female 19.36±2.24 7.76±0.49 3.0±0.19 7.46±0.65 1164 75 0.000
total 25.39±2.82 10.6±0.67 3.96±0.27 9.94±0.84 1550 100 0.000
Note: SE= standard error
IIED COUNTRY REPORT
www.iied.org 13
Figure 3. Mean number of lactating camel owned by sample households
3.08
2.26
1.53
2.08
rich Medium poor overall mean
Households (by wealth)
num
ber o
f lac
tatin
g ca
mel
s (h
ead)
4
3.5
3
2.5
2
1.5
1
0.5
0
Table 3. Mean volume of milk produced, sold and consumed per household
RICh MEDIuM PooR ovERAll P-vAluE
MEAN±SE MEAN±SE MEAN±SE MEAN±SE
Wet season/ day
produced 13.7±1.75 10.0±0.80 5.8±0.51 8.56±0.53 0.000
Sold 9.02±1.20 6.80±0.64 4.21±0.39 5.91±0.38 0.000
consumed 4.71±0.63 3.20±0.41 1.56±0.17 2.65±0.21 0.000
Dry season/ day
produced 9.3±1.18 6.8±0.54 3.9±0.35 5.79±0.36 0.000
Sold 6.36±0.88 4.81±0.42 2.87±0.25 4.12±0.27 0.000
consumed 2.91±0.53 1.96±0.26 1.03±0.10 1.67±0.15 0.000
Mean daily
produced 11.5±1.46 8.4±0.67 4.9±0.43 7.18±0.44 0.000
Sold 7.69±1.00 5.80±0.53 3.54±0.32 5.10±0.32 0.000
consumed 3.71±0.50 2.50±0.33 1.31±0.13 2.09±0.17 0.000
Mean annual/ 365 days
produced 4,198±523 3066±240 1,780±153 2,620±160 0.000
Sold 2813±360 2116±190 1281±115 1860±115 0.000
consumed 1385±180 950±117 499±47.2 760±61 0.000
SE = standard error
Economic valuE of camEl milk in pastoralist communitiEs in Ethiopia
14 www.iied.org
medium households 34 per cent and poor households 19.5 per cent. this is because the rich households own more lactating camels. Statistically, the result showed significant difference in average milk production among the wealth groups (p<0.05).
on average, respondents sell 1,860 litres of milk a year and consume only 760 litres. In the wet season, pastoralist households sell about 5.91 litres a day and consume about 2.65. But in the dry season, when the camels produce less milk, households sell an average of 4.12 litres a day and consume 1.67. In the dry season, households sell a higher percentage of their total milk production (see table 4). this is because they need the cash and have increased access to food grains and other goods for consumption during the dry season.
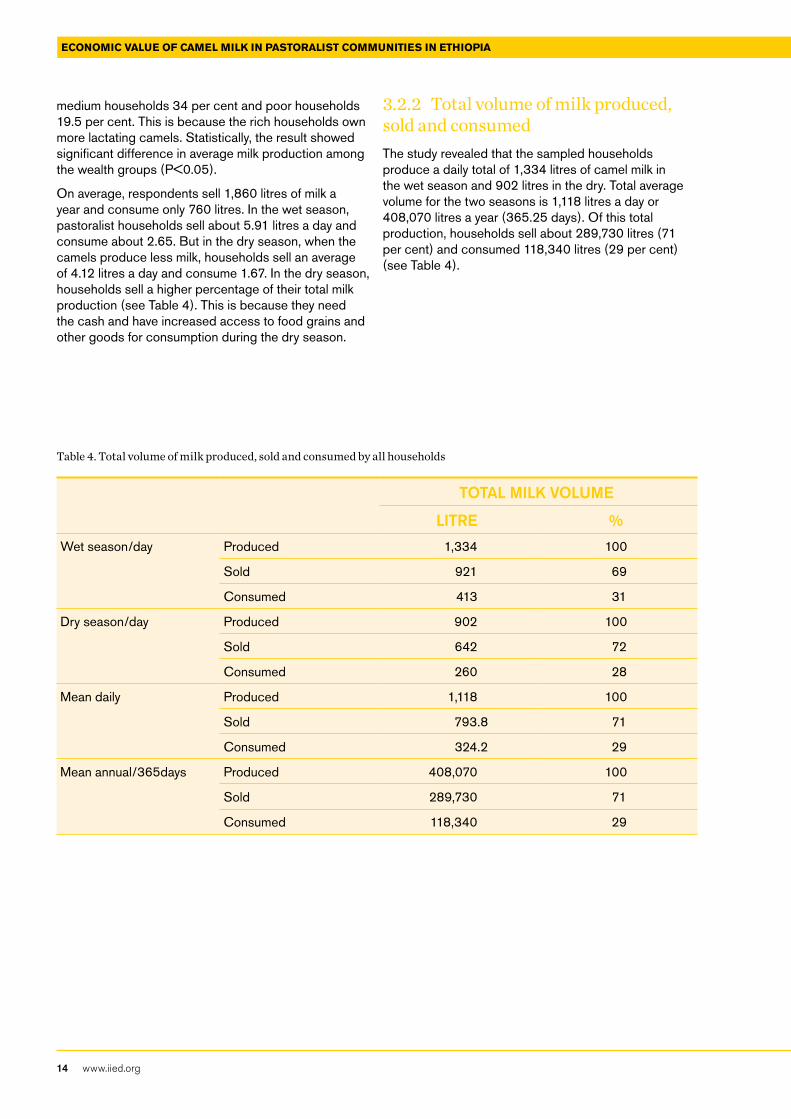
3.2.2 Total volume of milk produced, sold and consumed the study revealed that the sampled households produce a daily total of 1,334 litres of camel milk in the wet season and 902 litres in the dry. total average volume for the two seasons is 1,118 litres a day or 408,070 litres a year (365.25 days). of this total production, households sell about 289,730 litres (71 per cent) and consumed 118,340 litres (29 per cent) (see table 4).
Table 4. Total volume of milk produced, sold and consumed by all households
totAl MIlk voluME
lItRE %
Wet season/day produced 1,334 100
Sold 921 69
consumed 413 31
Dry season/day produced 902 100
Sold 642 72
consumed 260 28
Mean daily produced 1,118 100
Sold 793.8 71
consumed 324.2 29
Mean annual/365days produced 408,070 100
Sold 289,730 71
consumed 118,340 29
IIED COUNTRY REPORT
www.iied.org 15
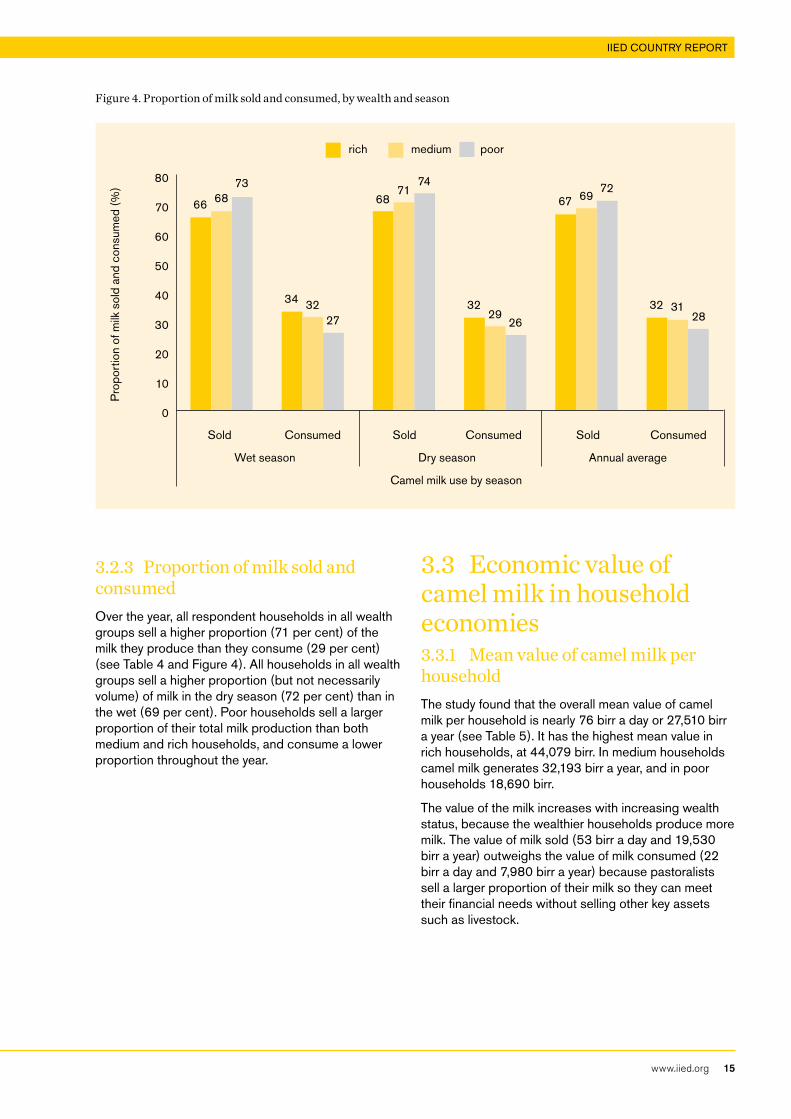
3.2.3 Proportion of milk sold and consumed over the year, all respondent households in all wealth groups sell a higher proportion (71 per cent) of the milk they produce than they consume (29 per cent) (see table 4 and Figure 4). All households in all wealth groups sell a higher proportion (but not necessarily volume) of milk in the dry season (72 per cent) than in the wet (69 per cent). poor households sell a larger proportion of their total milk production than both medium and rich households, and consume a lower proportion throughout the year.
3.3 Economic value of camel milk in household economies3.3.1 Mean value of camel milk per householdthe study found that the overall mean value of camel milk per household is nearly 76 birr a day or 27,510 birr a year (see table 5). It has the highest mean value in rich households, at 44,079 birr. In medium households camel milk generates 32,193 birr a year, and in poor households 18,690 birr.
the value of the milk increases with increasing wealth status, because the wealthier households produce more milk. the value of milk sold (53 birr a day and 19,530 birr a year) outweighs the value of milk consumed (22 birr a day and 7,980 birr a year) because pastoralists sell a larger proportion of their milk so they can meet their financial needs without selling other key assets such as livestock.
Figure 4. Proportion of milk sold and consumed, by wealth and season
Sold consumed Sold consumed Sold consumed
Wet season Dry season Annual average
camel milk use by season
pro
port
ion
of m
ilk s
old
and
cons
umed
(%
)
80
70
60
50
40
30
20
10
0
rich medium poor
66
34
68
32
67
32
68
32
71
29
69
31
73
27
74
26
72
28

Economic valuE of camEl milk in pastoralist communitiEs in Ethiopia
16 www.iied.org
3.3.2 Total value of camel milk We estimated the total value of camel milk produced by all sample households at 11,739 birr a day and 4,284,735 birr a year (table 6). this is a significant value, both at household and local economy level.
Table 5. Mean value of camel milk produced by sample household
MEAN vAluE of CAMEl MIlk (bIRR/houSEholD)
RICh MEDIuM PooR ovERAll MEAN
Mean daily value Sold milk 80.75 60.9 37.17 53.55
consumed milk 38.85 26.25 13.76 22.05
Total milk 119.60 87.15 50.93 75.6
Mean annual value Sold milk 29,536.5 22,218 13,450.5 19,530
consumed milk 14,542.5 9,975 5,239.5 7,980
Total milk 44,079 32,193 18,690 27,510
Note: estimated value based on average price of 10.5birr a litre
Table 6. Total value of respondents’ camel milk production
totAl vAluE of CAMEl MIlk
MIlk voluME (lItRE) vAluE (bIRR)
Daily total 1,118 11,739
Annual total 408,070 4,284,735
Note: estimated value based on average price of 10.5 birr a litre
Economic valuE of camEl milk in pastoralist communitiEs in Ethiopia
18 www.iied.org
previous studies have described the historic shift towards increased camel production among the Borana pastoralists (Desta and coppock 2004). our study findings shed further light on the reasons for this phenomenon. respondents told us, in group discussions and interviews, that households in the Borana zone keep camels for their milk production potential. this confirms earlier observations that the camel is well suited to meet the milk requirements of pastoral people, as well as other populations, if managed, bred and fed properly (Ahmad et al. 2010). Households favour female camels, a strategy to maximise milk production.
the results of our study also suggest that previous research has underestimated the value and volume of milk production in ethiopia. We found that pastoralists produce a significant volume of camel milk in the study area, and our key informants told us the camels produce a relatively reliable amount of milk for the households who own them. they can be milked three or more times a day, and lactation lasts, on average, for one to two years. Although the milk volume depends on feed and water conditions, camels continue to produce milk through periods of extended drought without significant reductions in yield. We estimate that pastoralists in Borana are producing around 31.3 million litres of camel milk a year — this is 27.6 per cent of the previous estimate of 114.8 million litres of camel milk produced across the whole of ethiopia (SoS Sahel 2006). We also calculated that the value of the milk produced by the 258 lactating camels in the study is 11,739 birr.
our key informants said that camel milk production contributes immensely to the local economy, at household and community levels. camel milk is the prime source of income and food in respondent households, who use the cash generated from milk sales to ensure food security throughout the year. the cash return from camel milk enables most households to preserve their assets such as livestock, which they would otherwise have to sell to access food. this enables asset accumulation and sharing, which plays a huge role in enhancing the economic wellbeing of pastoralist households in the study area.
our study confirms and illustrates various observations from earlier studies:
• the interfaces for analysing the economics of camel milk are the terms of trade between pastoral milk marketing and purchased goods (nori et al. 2006)
• the economic potential of the camel and its milk in the arid and semi-arid lands is increasingly recognisable (Bekele 2010), and
• camel milk contributes to the maintenance of rural livelihoods and economic development and facilitates the integration of pastoralists in the global economy (Faye 2011).
these observations are at odds with the older, long-accepted premise that milk does not factor significantly in the economic value of camels (yagil 1982). clearly this is no longer the case.
to our knowledge, there has been no previous research on camel milk production and its economic value in the study area. this created a challenge for discussing and comparing our results in relation to other studies. We did, however, find studies from other regions for comparison.
the lack of relevant and up-to-date information on the value of the camel milk subsector in Borana means it has received little attention from both government and researchers. this lack of research and policy attention is part of the reason for the lack of investment in measures to address the problems of camel and milk production (Bedilu et al. 2014). We hope that our findings, which demonstrate the value of camel milk, can be instrumental in contributing to a change in this situation. At the very least, they underline the justification and scope for more research in this area.
Economic valuE of camEl milk in pastoralist communitiEs in Ethiopia
20 www.iied.org
the study area has high potential for camel milk production. camels are a reliable source of milk which provide sustainable milk supplies to households, even during periods of drought. camel milk production is of substantial value to both households and the local economy. our findings suggest that previous assessments have underestimated the value of camel milk production. For the full value of camel milk production to be recognised, we recommend that the research projects are further expanded. At the same time, we need to raise awareness among development practitioners and policymakers of the economic value of camel milk.
IIED COUNTRY REPORT
www.iied.org 21
ReferencesAfrican union (2010) Department of rural economy and Agriculture policy Framework for pastoralism in Africa: securing, protecting and improving the lives, livelihoods and rights of pastoralist communities. African union, Addis Ababa www.africa-union.org
Ahmad, S. et al. (2010) economic importance of camel: a unique alternative under crisis. Pakistan Veterinary Journal 30(4): 191–197 www.pvj.com.pk
cAre Kenya (2009) camel milk marketing clusters in Garissa. commissioned by cAre Kenya under enhanced Livelihoods in the Mandera triangle (eLMt). project report.
coppock, DL (1994) the Borana plateau of southern ethiopia: Synthesis of pastoral research, development and changes 1980–1990. International livestock center for Africa, Addis Ababa.
Debsu, D n (2013) Local institutions, external interventions, and adaptation to climate change: the case of the Borana pastoralists in southern ethiopia. oxfam America research Backgrounder series.
Demissie, B et al. (2014) Factors affecting camel and cow milk marketed surplus: the case of eastern ethiopia. African Journal of Agricultural Science and Technology vol. 2, issue 2: 54–58.
Desta, S and coppock, L. (2004) pastoralism under pressure: tracking system change in Southern ethiopia. Human Ecology vol 32 no 4.
Faye B (2011) the production potential and importance of camels, camelids in the world. campus International de Baillarguet, 34398 Montpellier, France.
Hesse, c and MacGregor, J (2006) pastoralism: drylands’ invisible asset? Developing a framework for assessing the value of pastoralism in east Africa. IIeD issue paper no 142.
Legesse, A (1973) Gada: three approaches to the study of African society. Free press, new york.
Musinga, M et al. (2008) the camel milk industry in Kenya: the potential of camel milk from Isiolo District. netherland Development organization (SnV). Study results.
nori, M et al. (2006) Milking drylands: the marketing of camel milk in northeast Somalia. Nomadic Peoples 10.1: 9–28.
pFe pastoralist Forum ethiopia (2010) climate change and pastoralism: implications for sustainable pastoral development. pastoralist Forum ethiopia. report of 5th national conference on pastoralism, Addis Ababa.
reGLAp (2012) Key statistics on the drylands of Kenya, uganda and ethiopia. reGLAp Secretariat. regional Learning and Advocacy programme for Vulnerable Dryland communities.
SoS Sahel (2006) pastoralism in ethiopia: its total economic values and development challenges. ethiopia.
tafesse, B (2010) Milk production, fluid balance and temperature regulation in lactating camels (Camelus dromedarius). Doctoral thesis. Swedish university of Agricultural Sciences, uppsala.
Wassie, B and Fekadu, B (2014) the impact of climate change on pastoral production systems: A study of climate variability and household adaptation strategies in southern ethiopian rangelands. World Institute for Development economics research (WIDer), working paper.
yagil, r et al. (1982) Science and camel’s milk production: some keys for nutrition and marketing. Ben-Gourion university of the negev, Kimron Veterinary Institute, Bet Dagan, Israel.
Economic valuE of camEl milk in pastoralist communitiEs in Ethiopia
22 www.iied.org
Related readingAraya, S t (2015) Impact of camel transportation on pastoralist livelihoods in ethiopia: findings from Berahle woreda, Afar regional State. country report. IIeD, London. http://pubs.iied.org/10127IIeD.html
Bassa, Z and Woldeamanuel, t (2015) Value chain analysis of the cattle trade in Moyale, southern ethiopia: an economic assessment in oromiya regional State. country report. IIeD, London. http://pubs.iied.org/10121IIeD.html
elhadi, y A and Wasonga, o V (2015) economic and nutritional contribution of camel milk in northern Kenya: a field study in Isiolo county. country report. IIeD, London. http://pubs.iied.org/10125IIeD.html
Gebremedhin, G G and tesfaye, y (2015) Market chain analysis of live goats: Asaita district, Afar regional State, ethiopia. country report. IIeD, London. http://pubs.iied.org/10120IIeD.html
Gituku, B c, Wasonga, o V and ngugi, r K (2015) economic contribution of the pastoral meat trade in Isiolo town, Kenya. country report. IIeD, London. http://pubs.iied.org/10124IIeD.html
Hesse, c and MacGregor, J (2006) pastoralism: drylands’ invisible asset? Developing a framework for assessing the value of pastoralism in east Africa. Dossier n. 142. IIeD, London. http://pubs.iied.org/12534IIeD.html
Iruata, M n, Wasonga, o V and ngugi, r K (2015) economic contribution of the pastoral meat trade in Isiolo county, Kenya: findings from oldonyiro and Garbatulla towns. country report. IIeD, London. http://pubs.iied.org/10126IIeD.html
Kebede, S, Animut, G and Zemedu, L (2015) contribution of camel milk to pastoralist livelihoods in ethiopia: an economic assessment in Somali regional State. country report. IIeD, London. http://pubs.iied.org/10122IIeD.html
Krätli, S (2014) If not counted does not count? A programmatic reflection on methodology options and gaps in total economic valuation studies of pastoral systems. Issue paper. IIeD, London. http://pubs.iied.org/10082IIeD.html
Mwaura, M W, Wasonga, o V, elhadi, y A M and ngugi, r K (2015) economic contribution of the camel milk trade in Isiolo town, Kenya. country report. IIeD, London. http://pubs.iied.org/10123IIeD.html
IIED COUNTRY REPORT
www.iied.org 23
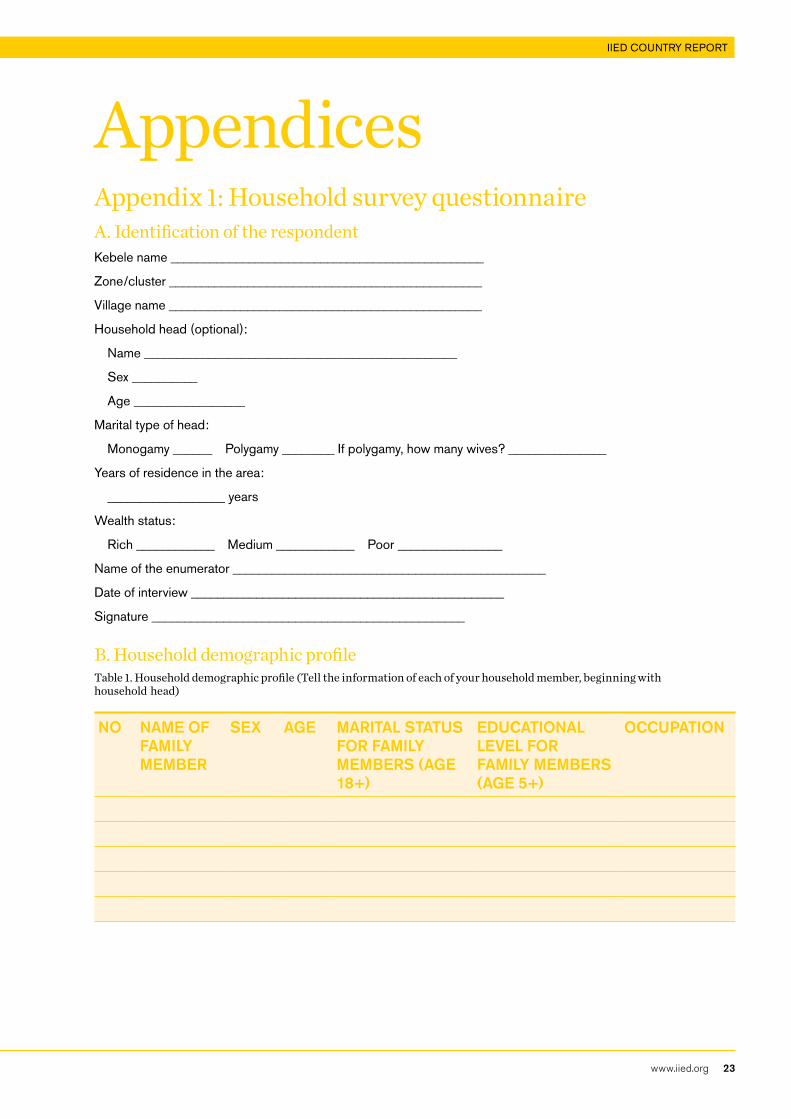
AppendicesAppendix 1: Household survey questionnaire A. Identification of the respondent Kebele name ________________________________________________
Zone/cluster ________________________________________________
Village name ________________________________________________
Household head (optional):
name ________________________________________________
Sex __________
Age _________________
Marital type of head:
Monogamy ______ polygamy ________ If polygamy, how many wives? _______________
years of residence in the area:
__________________ years
Wealth status:
rich ____________ Medium ____________ poor ________________
name of the enumerator ________________________________________________
Date of interview ________________________________________________
Signature ________________________________________________
B. Household demographic profileTable 1. Household demographic profile (Tell the information of each of your household member, beginning with household head)
No NAME of fAMIly MEMbER
SEx AGE MARItAl StAtuS foR fAMIly MEMbERS (AGE 18+)
EDuCAtIoNAl lEvEl foR fAMIly MEMbERS (AGE 5+)
oCCuPAtIoN
Economic valuE of camEl milk in pastoralist communitiEs in Ethiopia
24 www.iied.org
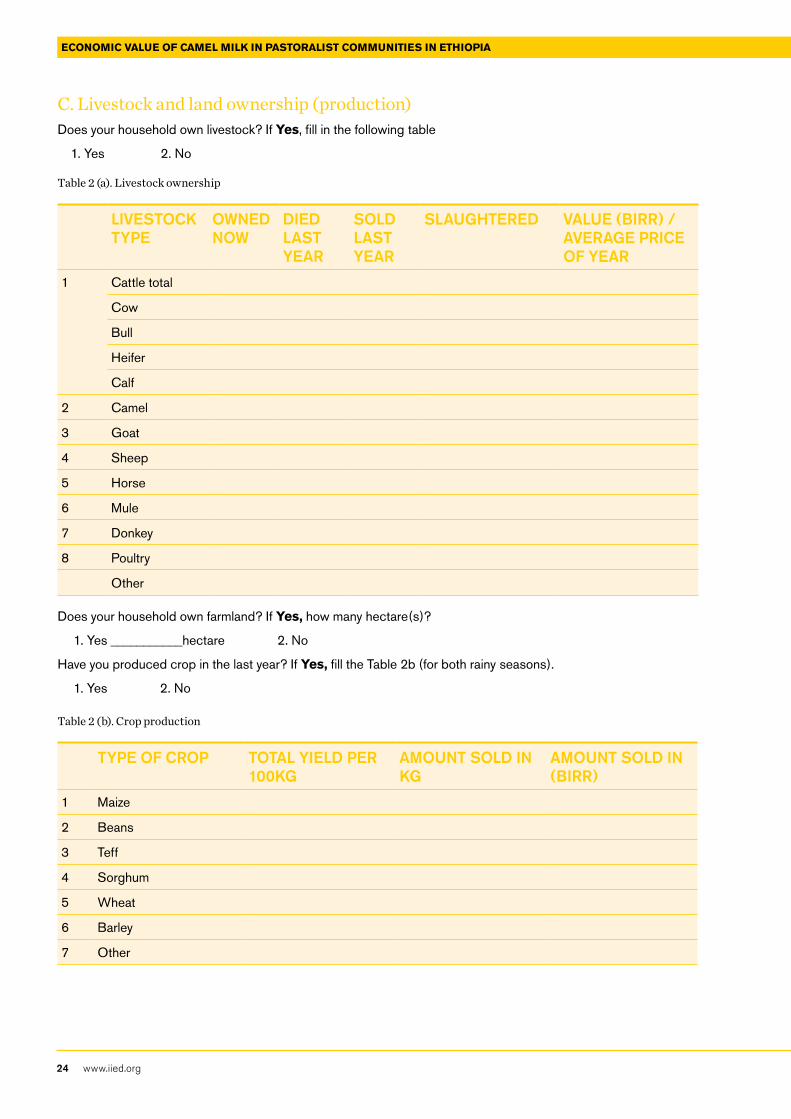
C. Livestock and land ownership (production)Does your household own livestock? If Yes, fill in the following table
1. yes 2. no
Table 2 (a). Livestock ownership
lIvEStoCk tyPE
oWNED NoW
DIED lASt yEAR
SolD lASt yEAR
SlAuGhtERED vAluE (bIRR) / AvERAGE PRICE of yEAR
1 cattle total
cow
Bull
Heifer
calf
2 camel
3 Goat
4 Sheep
5 Horse
6 Mule
7 Donkey
8 poultry
other
Does your household own farmland? If Yes, how many hectare(s)?
1. yes ___________hectare 2. no
Have you produced crop in the last year? If Yes, fill the table 2b (for both rainy seasons).
1. yes 2. no
Table 2 (b). Crop production
tyPE of CRoP totAl yIElD PER 100kG
AMouNt SolD IN kG
AMouNt SolD IN (bIRR)
1 Maize
2 Beans
3 teff
4 Sorghum
5 Wheat
6 Barley
7 other

IIED COUNTRY REPORT
www.iied.org 25
D. Camel production How many camels do you own currently?
1. ______male ______female
How did you initially acquire it/them?
1. Inherited from parents 2. purchased
3. restocking by nGo/Go 4. Gift from relatives
5. Buusaa-gonofaa (ethiopian micro-finance institution)
6. other (specify) _______________________
When (which gada period) did you first start rearing camel and how did the trend go over time?
1. Jilo Aga (1976–1984) 2. Boru Guyo (1984–1992)
3. Boru Madha (1992–2000) 4. Liban Jaldessa (2000–2008)
5. Guyo Goba (2008–2013)
What was (were) the factor (s) that drove you to engage in camel production?
1. ____________________________________________________________________________
2._____________________________________________________________________________
3. _____________________________________________________________________________
4. _____________________________________________________________________________
Table 3. Trends in camel population/production over time (please fill number of camels owned at the end of each Gada period; beginning from the period in which you first started rearing)
NuMbER of CAMElS oWNED DuRING EACh GADA PERIoD (GC)Jilo Aga (1976–1984)
Boru Guyo (1984–1992)
Boru Madha (1992–2000)
Liban Jaldessa (2000–2008)
Guyo Goba (2008–2013) (present)
Why do you rear camels? (rank the uses below in order of importance to you) Why?
1. Milk production 2. Meat production
3. to sell 4. transport
5. reason(s) __________________________________________________________
E. Camel management and input supply What time of camel production system do you use?
1. traditional system, mainly for subsistence
2. Improved production system, for commercial purposes
3. combination of the two
4. other (specify) ______________________________________________________
Is there enough forage for your camel(s) now?
1. yes 2. no
Economic valuE of camEl milk in pastoralist communitiEs in Ethiopia
26 www.iied.org
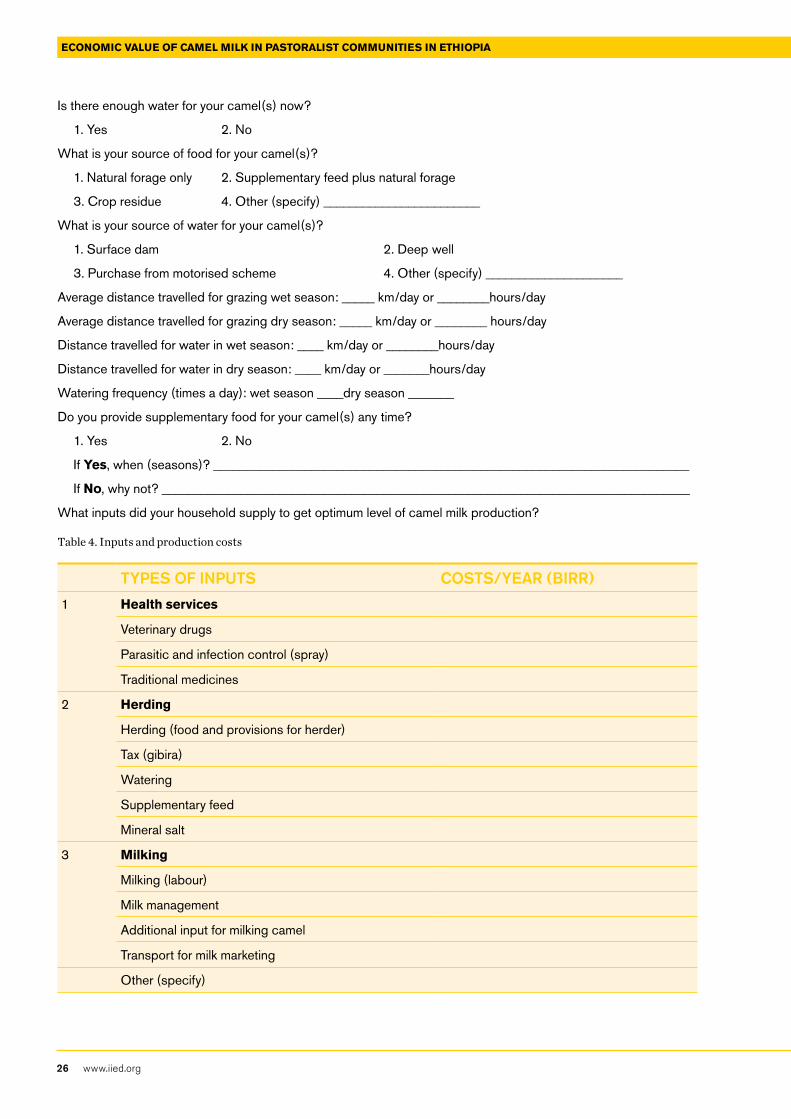
Is there enough water for your camel(s) now?
1. yes 2. no
What is your source of food for your camel(s)?
1. natural forage only 2. Supplementary feed plus natural forage
3. crop residue 4. other (specify) ________________________
What is your source of water for your camel(s)?
1. Surface dam 2. Deep well
3. purchase from motorised scheme 4. other (specify) _____________________
Average distance travelled for grazing wet season: _____ km/day or ________hours/day
Average distance travelled for grazing dry season: _____ km/day or ________ hours/day
Distance travelled for water in wet season: ____ km/day or ________hours/day
Distance travelled for water in dry season: ____ km/day or _______hours/day
Watering frequency (times a day): wet season ____dry season _______
Do you provide supplementary food for your camel(s) any time?
1. yes 2. no
If Yes, when (seasons)? _________________________________________________________________________
If No, why not? _________________________________________________________________________________
What inputs did your household supply to get optimum level of camel milk production?
Table 4. Inputs and production costs
tyPES of INPutS CoStS/yEAR (bIRR)
1 Health services
Veterinary drugs
parasitic and infection control (spray)
traditional medicines
2 Herding
Herding (food and provisions for herder)
tax (gibira)
Watering
Supplementary feed
Mineral salt
3 Milking
Milking (labour)
Milk management
Additional input for milking camel
transport for milk marketing
other (specify)
IIED COUNTRY REPORT
www.iied.org 27
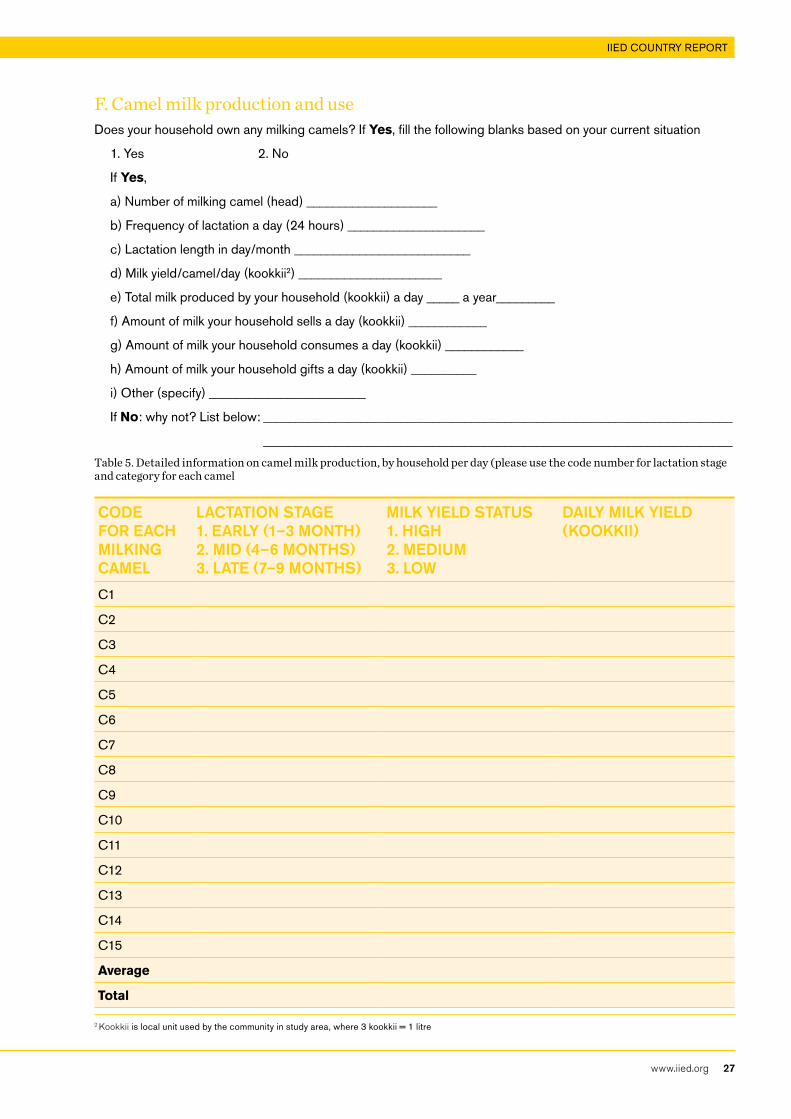
F. Camel milk production and use Does your household own any milking camels? If Yes, fill the following blanks based on your current situation
1. yes 2. no
If Yes,
a) number of milking camel (head) ____________________
b) Frequency of lactation a day (24 hours) _____________________
c) Lactation length in day/month ___________________________
d) Milk yield/camel/day (kookkii2) ______________________
e) total milk produced by your household (kookkii) a day _____ a year_________
f) Amount of milk your household sells a day (kookkii) ____________
g) Amount of milk your household consumes a day (kookkii) ____________
h) Amount of milk your household gifts a day (kookkii) __________
i) other (specify) ________________________
If No: why not? List below: ________________________________________________________________________
________________________________________________________________________
Table 5. Detailed information on camel milk production, by household per day (please use the code number for lactation stage and category for each camel
CoDE foR EACh MIlkING CAMEl
lACtAtIoN StAGE 1. EARly (1–3 MoNth)2. MID (4–6 MoNthS)3. lAtE (7–9 MoNthS)
MIlk yIElD StAtuS 1. hIGh2. MEDIuM 3. loW
DAIly MIlk yIElD (kookkII)
c1
c2
c3
c4
c5
c6
c7
c8
c9
c10
c11
c12
c13
c14
c15
Average
Total
2 Kookkii is local unit used by the community in study area, where 3 kookkii = 1 litre
Economic valuE of camEl milk in pastoralist communitiEs in Ethiopia
28 www.iied.org
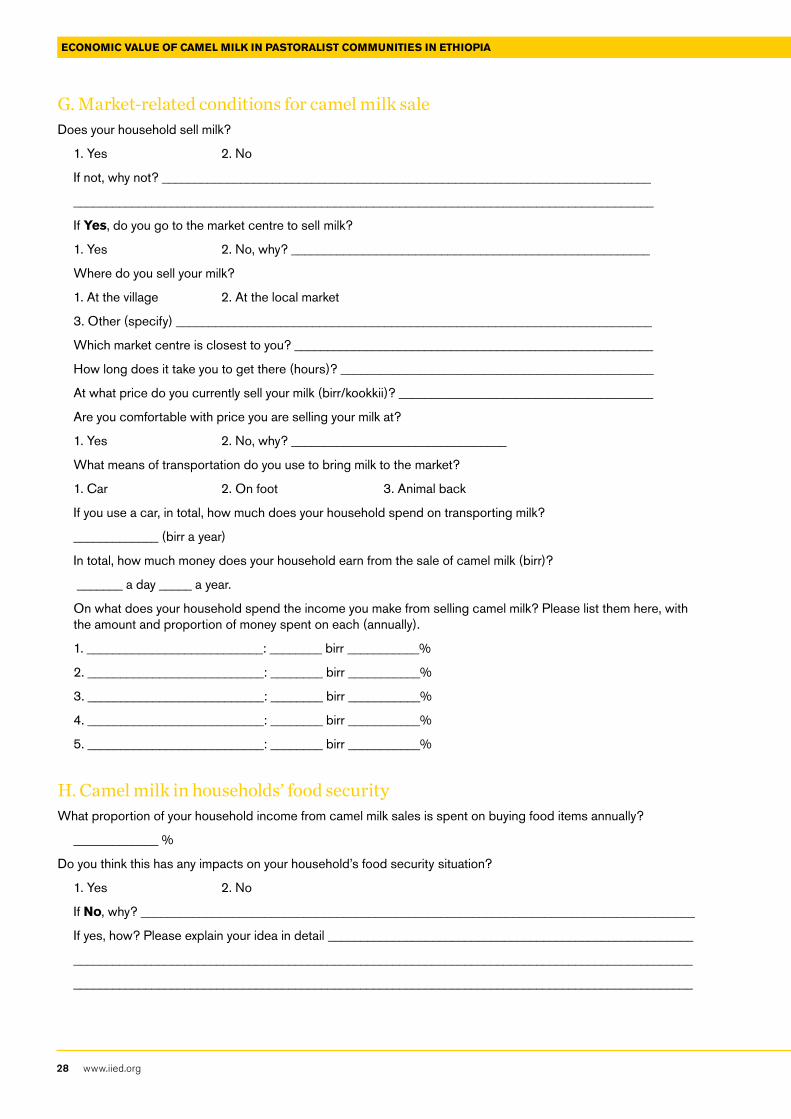
G. Market-related conditions for camel milk sale Does your household sell milk?
1. yes 2. no
If not, why not? ___________________________________________________________________________
_________________________________________________________________________________________
If Yes, do you go to the market centre to sell milk?
1. yes 2. no, why? _______________________________________________________
Where do you sell your milk?
1. At the village 2. At the local market
3. other (specify) _________________________________________________________________________
Which market centre is closest to you? _______________________________________________________
How long does it take you to get there (hours)? ________________________________________________
At what price do you currently sell your milk (birr/kookkii)? _______________________________________
Are you comfortable with price you are selling your milk at?
1. yes 2. no, why? _________________________________
What means of transportation do you use to bring milk to the market?
1. car 2. on foot 3. Animal back
If you use a car, in total, how much does your household spend on transporting milk?
_____________ (birr a year)
In total, how much money does your household earn from the sale of camel milk (birr)?
_______ a day _____ a year.
on what does your household spend the income you make from selling camel milk? please list them here, with the amount and proportion of money spent on each (annually).
1. ___________________________: ________ birr ___________%
2. ___________________________: ________ birr ___________%
3. ___________________________: ________ birr ___________%
4. ___________________________: ________ birr ___________%
5. ___________________________: ________ birr ___________%
H. Camel milk in households’ food security What proportion of your household income from camel milk sales is spent on buying food items annually?
_____________ %
Do you think this has any impacts on your household’s food security situation?
1. yes 2. no
If No, why? _____________________________________________________________________________________
If yes, how? please explain your idea in detail ________________________________________________________
_______________________________________________________________________________________________
_______________________________________________________________________________________________
IIED COUNTRY REPORT
www.iied.org 29
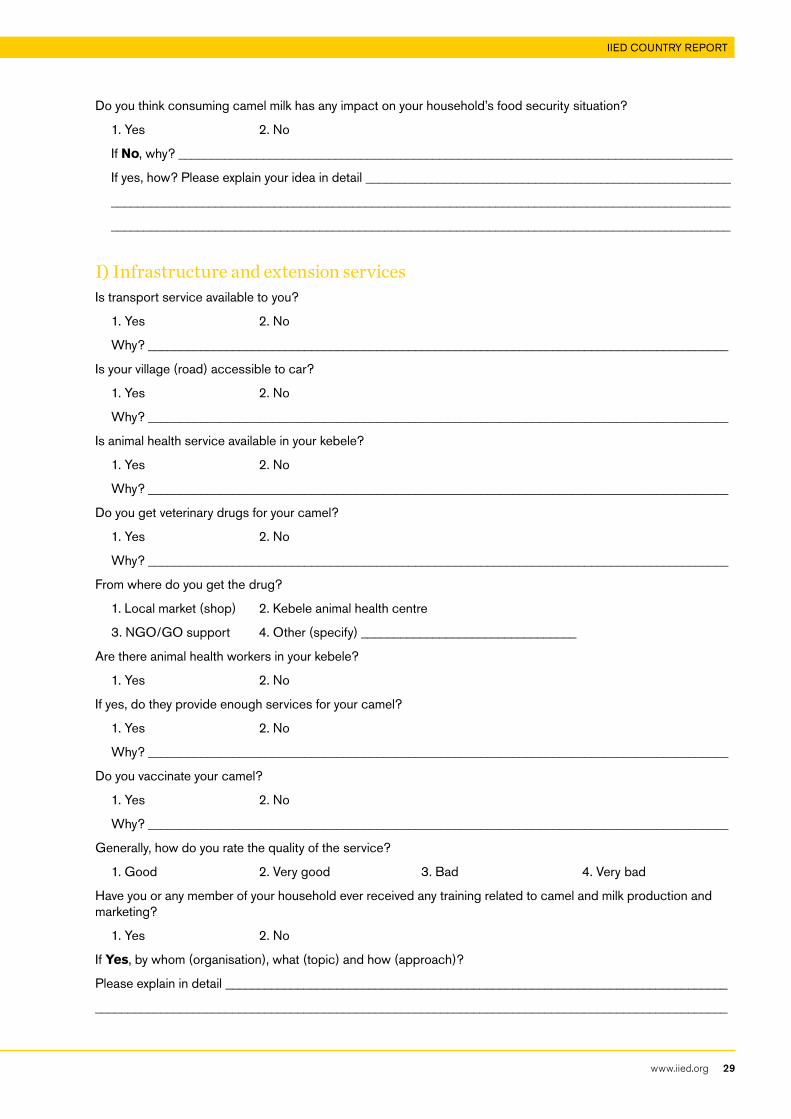
Do you think consuming camel milk has any impact on your household’s food security situation?
1. yes 2. no
If No, why? _____________________________________________________________________________________
If yes, how? please explain your idea in detail ________________________________________________________
_______________________________________________________________________________________________
_______________________________________________________________________________________________
I) Infrastructure and extension servicesIs transport service available to you?
1. yes 2. no
Why? _________________________________________________________________________________________
Is your village (road) accessible to car?
1. yes 2. no
Why? _________________________________________________________________________________________
Is animal health service available in your kebele?
1. yes 2. no
Why? _________________________________________________________________________________________
Do you get veterinary drugs for your camel?
1. yes 2. no
Why? _________________________________________________________________________________________
From where do you get the drug?
1. Local market (shop) 2. Kebele animal health centre
3. nGo/Go support 4. other (specify) _________________________________
Are there animal health workers in your kebele?
1. yes 2. no
If yes, do they provide enough services for your camel?
1. yes 2. no
Why? _________________________________________________________________________________________
Do you vaccinate your camel?
1. yes 2. no
Why? _________________________________________________________________________________________
Generally, how do you rate the quality of the service?
1. Good 2. Very good 3. Bad 4. Very bad
Have you or any member of your household ever received any training related to camel and milk production and marketing?
1. yes 2. no
If Yes, by whom (organisation), what (topic) and how (approach)?
please explain in detail _____________________________________________________________________________
_________________________________________________________________________________________________
Economic valuE of camEl milk in pastoralist communitiEs in Ethiopia
30 www.iied.org
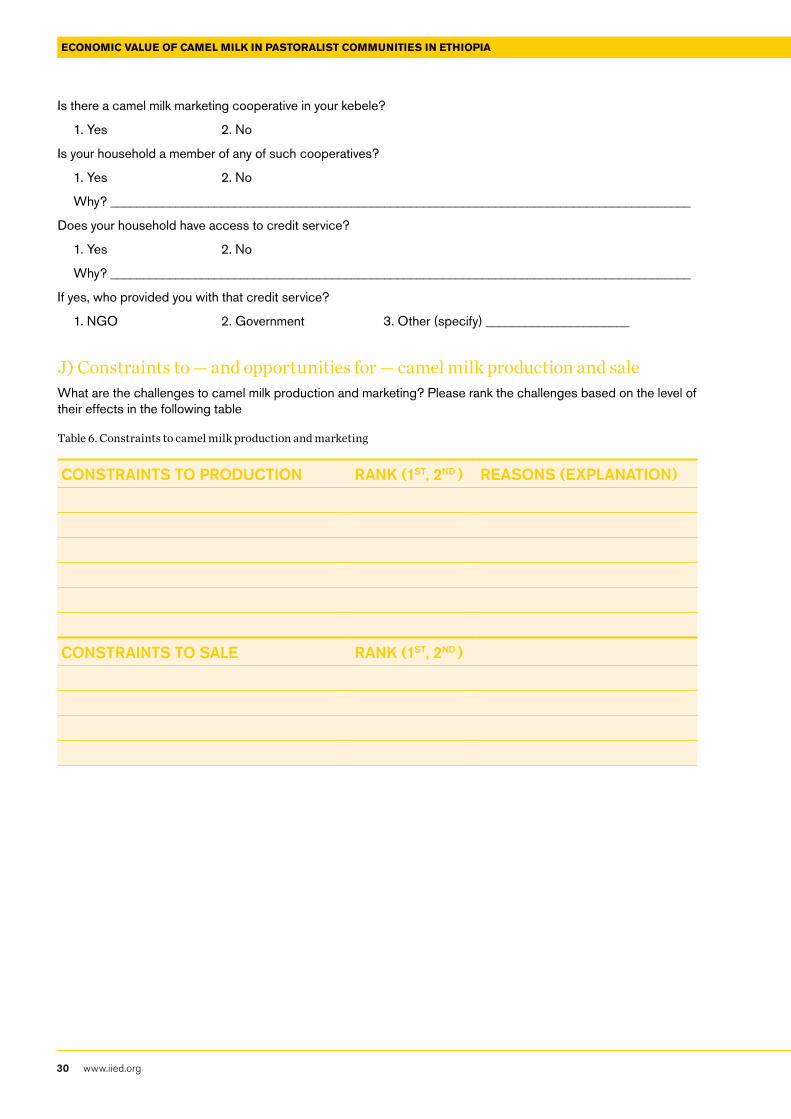
Is there a camel milk marketing cooperative in your kebele?
1. yes 2. no
Is your household a member of any of such cooperatives?
1. yes 2. no
Why? _________________________________________________________________________________________
Does your household have access to credit service?
1. yes 2. no
Why? _________________________________________________________________________________________
If yes, who provided you with that credit service?
1. nGo 2. Government 3. other (specify) ______________________
J) Constraints to — and opportunities for — camel milk production and saleWhat are the challenges to camel milk production and marketing? please rank the challenges based on the level of their effects in the following table
Table 6. Constraints to camel milk production and marketing
CoNStRAINtS to PRoDuCtIoN RANk (1St, 2ND ) REASoNS (ExPlANAtIoN)
CoNStRAINtS to SAlE RANk (1St, 2ND )
IIED COUNTRY REPORT
www.iied.org 31
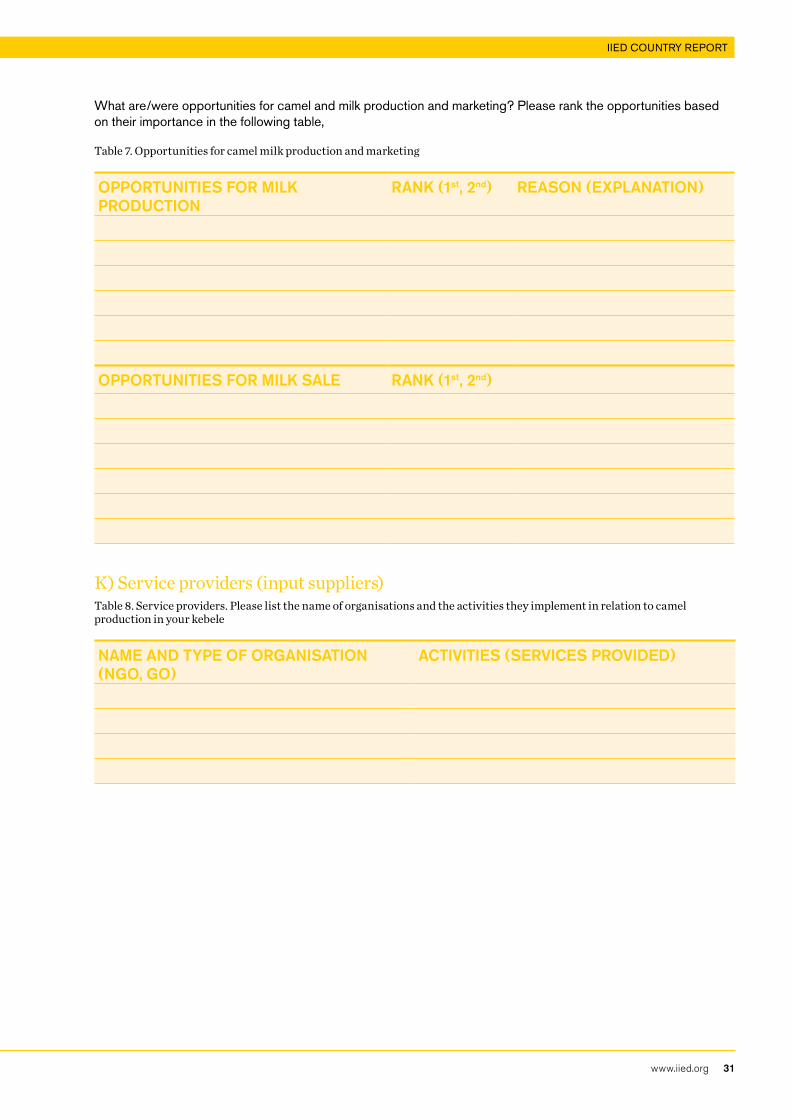
What are/were opportunities for camel and milk production and marketing? please rank the opportunities based on their importance in the following table,
Table 7. Opportunities for camel milk production and marketing
oPPoRtuNItIES foR MIlk PRoDuCtIoN
RANk (1st, 2nd) REASoN (ExPlANAtIoN)
oPPoRtuNItIES foR MIlk SAlE RANk (1st, 2nd)
K) Service providers (input suppliers)Table 8. Service providers. Please list the name of organisations and the activities they implement in relation to camel production in your kebele
NAME AND tyPE of oRGANISAtIoN (NGo, Go)
ACtIvItIES (SERvICES PRovIDED)
Economic valuE of camEl milk in pastoralist communitiEs in Ethiopia
32 www.iied.org
Appendix 2: Key informant interview and group discussion checklist • What are the main criteria for wealth ranking in your
kebele? please explain.
• When did the community in your kebele first adopt camel production (excluding Surupha)? For what purposes?
• What factors derived them community in your kebele to adopt camel production (excluding Surupha)? please list.
• What is/are the camel management system in your kebele?
• How do camels work with the current changes of environmental and climatic conditions of the area? What are the advantages and disadvantages of such changes for camels and camel milk production with regards to pasture (forage) and water conditions (changes in milk yield, lactation length and frequency, reproductive capacity and other)?
• What is the milk production potential of camels in your kebele? What determines their milk production?
• List and prioritise the major constraints and opportunities for camel milk production and sale in your kebele, explaining the reasons for them.
• How do you assess the contribution of camel milk to pastoralist livelihoods in general and households’ food security in your kebele? can you justify this?
• How do you see your community’s attitude towards camels, camel milk and their economic importance during the long past and current period? Have seen any changes? What?
• How do you assess availability, access to and quality of extension services, particularly those related to camels and camel milk production in your kebele — for example, the health service?
• Are there any development organisations serving your community? Who are they and what services do they provide in your kebele, particularly with regard to camels and camel milk production?

Knowledge Products
International Institute for Environment and Development 80-86 Gray’s Inn Road, London WC1X 8NH, UK Tel: +44 (0)20 3463 7399 Fax: +44 (0)20 3514 9055 email: [email protected] www.iied.org
IIeD is a policy and action research organisation. We promote sustainable development to improve livelihoods and protect the environments on which these livelihoods are built. We specialise in linking local priorities to global challenges. IIeD is based in London and works in Africa, Asia, Latin America, the Middle east and the pacific, with some of the world’s most vulnerable people. We work with them to strengthen their voice in the decision-making arenas that affect them — from village councils to international conventions.
this is one of a series of reports synthesising the findings of field research conducted by masters’ degree students at ethiopian universities who investigated the contribution of pastoral production to the national economy. the students developed the research to complement their degree studies, with support from the International Institute for environment and Development and tufts university.
Funded by: