weight reduction, body composition, thyroid hormones and ... · 3 master thesis in clinical...
TRANSCRIPT
Weight reduction, body
composition, thyroid hormones
and basal metabolic rate in
elite athletes

2
Master thesis in Clinical Nutrition, Anu Koivisto 2009
Effects of weight reduction rate on body composition, thyroid
hormones and basal metabolic rate in elite athletes
A randomized controlled clinical trial
Anu Koivisto
Master thesis in Clinical Nutrition
Medical Faculty, Department of Nutrition
UNIVERSITY OF OSLO
20th of April 2009
3
Master thesis in Clinical Nutrition, Anu Koivisto 2009
Abbreviations
BMD Bone Mineral Density
BMR Basal Metabolic Rate
BW
BCOAD
Body Weight
Branched- Chain 2-Oxo Acid Dehydrogenase
CR Calorie Restriction
DEXA Dual Energy X-ray Absorptiometry
EE Energy Expenditure
FAST Weight reduction of 1.4% of body weight/week
FFM Fat Free Mass
FM fat mass
LBM Lean Body Mass
LCD Low Calorie Diet
NBAL Nitrogen Balance
NEAT Non-Exercise Activity Thermogenesis
NREE Non-Resting Energy Expenditure
RMR Resting Metabolic Rate
SLOW Weight reduction of 0.7% of body weight/week
SPA Spontaneous Physical Activity
TEE Total Energy Expenditure
VLCD Very Low Calorie Diet
WL Weight Loss
4
Master thesis in Clinical Nutrition, Anu Koivisto 2009
Abstract
Background: Optimal body composition and body weight (BW) are important
performance factors in sports that emphasize aesthetics and high power to weight ratio.
Weight reduction guidelines for athletes per date suggest a weekly weight loss of 0.5-
1.0 kg which corresponds to 0.7% and 1.4% of BW in a 70-kg athlete. Weight
reduction may lead to loss of lean body mass (LBM) and changed thyroid hormone
(TH) profile and thereby reduced basal metabolic rate (BMR). Combining energy
restriction with resistance training may inhibit loss of LBM in obese subjects. Little is
known about these changes and their effect on metabolism (BMR, TH) in athletes.
Purpose: To compare changes in body composition, TH and BMR in two different
weight-loss interventions promoting loss of 0.7% versus 1.4% of BW per week in
elite athletes. Methods: 30 male and female elite athletes were randomized into slow
weight reduction [“SLOW”, n=14, 23.5 (3.3) y, 72.1 (12.2) kg] and fast weight
reduction [“FAST”, n=16, 22.3 (4.7) y, 72.2 (11.3) kg]. Both intervention groups
included energy restricted diets and resistance training regimen for 4-12 weeks. The
duration of the intervention was dependent on the desired weight loss and the type of
intervention group the participant was allocated to. Diets were recorded at baseline by
4-day weighed food records which were used to design individual intervention diets
promoting weekly BW loss of 0.7% or 1.4%. Four weekly resistance training sessions
were added to the usual training regimen to stimulate muscle hypertrophy. The
following measurements were taken at baseline and post intervention: BW, LBM, fat
mass (FM) with dual energy x-ray absorptiometry (DEXA), serum thyroid stimulating
hormone(s-THS) and free thyroxine (s-free T4) and BMR with indirect calorimeter.
Results: There were no significant differences between the groups in any variables at
the baseline. BW was reduced by 5.6 (3.0) % [mean(SD)], p<0.001 and 5.4 (2.3%),
p<0.001) for SLOW- and FAST weight reduction group, respectively. The changes
were not significantly different between the intervention groups (p=0.8). LBM was
significantly increased for SLOW [2.0 (1.3) %, p<0.001] but not for FAST [1.1 (3.0)
%, p=0.3]. There was a significant difference in FM reduction obtained during weight
loss between the intervention groups SLOW -31 (2.9) %, p<0.001) and FAST -23.4

5
Master thesis in Clinical Nutrition, Anu Koivisto 2009
(13.8) %, p<0.001 (p=0.04). Free T4 reduction during the intervention was significant
in FAST [-11.2 (7.6) %, p=0.001] but not in SLOW. These changes were significantly
different between the groups (p<0.001). BMR was reduced significantly for both
SLOW [12.3 (11.4) %, p=0.036] and FAST [9.8 (6.5) %, p=0.018], but the changes
did not differ between the intervention groups (p=0.9). Changes in LBM were
associated with baseline LBM (r=0.49, p=0.006) but not with weight reduction rate.
Changes in free T4 or LBM were not associated with changes in BMR. Conclusion:
Body composition changes were different between the groups; LBM increased only in
the SLOW group who also obtained a larger FM reduction than the FAST group, thus
body composition changes were more beneficial in SLOW weight loss intervention.
Only FAST weight reduction had an impact on thyroid hormones, producing a larger
decline in free-T4 but not in TSH compared with SLOW intervention. BMR
reductions did not differ between the interventions. Thus for optimal body
composition changes in athletes a moderate energy restriction combined with
resistance training leading to a weekly weight loss of 0.7% seems preferable. Despite
maintained or increased LBM, and maintained free T4 athletes experienced reductions
in BMR.
6
Master thesis in Clinical Nutrition, Anu Koivisto 2009
Acknowledgements
First I would like to thank my supervisors who gave me irreplaceable feedback and
guidance during the whole study.
Ina Garthe at Norwegian School of Sports Sciences –Thank you for including me in
this project, being always available and patiently answering the endless flow of
questions! Thank you for being an excellent supervisor by directing my focus to the
essentials!
Lene Frost Andersen at the Department of Nutrition, University of Oslo –Thank you
for posing many important critical questions!
Jorunn Sundgot-Borgen at Norwegian School of Sports Sciences -Thank you for
keeping me on track and giving me support and encouragement!
I would also like to acknowledge Per-Egil Refsnes and Sindre Madsgaard (Norwegian
Olympic Sports Centre) for their contribution in the strength training part of the study.
Thanks to Monica Viker Brekke (Norwegian Olympic Sports Centre) for making
blood sampling and testing logistics run smoothly. Big thanks to Nils Kvamme and
Truls Raastad (Norwegian School of Sports Sciences) for being so flexible with a short
notice and helping me with BMR data collection and analysis.
Thanks to all athletes who participated in this study – May all of you reach your
athletic goals!
Special thanks go to Børge, Kia and Alexis for their unconditional love!
7
Master thesis in Clinical Nutrition, Anu Koivisto 2009
Table of contents
ABBREVIATIONS .............................................................................................................................. 3
ABSTRACT.......................................................................................................................................... 4
ACKNOWLEDGEMENTS................................................................................................................. 6
TABLE OF CONTENTS..................................................................................................................... 7
1. INTRODUCTION ................................................................................................................... 10
2. THEORY.................................................................................................................................. 11
2.1 WEIGHT REDUCTION AND ATHLETES ................................................................................. 11
2.2 WEIGHT REDUCTION AND DIET .......................................................................................... 12
2.2.1 Energy metabolism during weight loss......................................................................... 12
2.2.2 Composition of energy restricted diet for athletes ....................................................... 16
2.3 WEIGHT REDUCTION AND STRENGHT TRAINING................................................................. 19
2.4 WEIGHT REDUCTION AND BODY COMPOSITION .................................................................. 20
2.5 WEIGHT REDUCTION AND THYROID HORMONES................................................................. 23
2.6 WEIGHT REDUCTION AND BASAL METABOLIC RATE........................................................... 25
2.7 POTENTIAL ADVERSE EFFECTS OF WEIGHT REDUCTION...................................................... 27
2.8 WEIGHT REDUCTION RATE ................................................................................................. 29
2.9 AIM OF THE STUDY ............................................................................................................ 29
3. SUBJECTS AND METHODS ................................................................................................ 31
3.1 SUBJECTS........................................................................................................................... 31
3.1.1 Inclusion and exclusion criteria ................................................................................... 31
3.2 PROCEDURE ....................................................................................................................... 32
3.3 DESIGN .............................................................................................................................. 33
3.3.1 Recruitment .................................................................................................................. 33
3.3.2 Randomization.............................................................................................................. 33

8
Master thesis in Clinical Nutrition, Anu Koivisto 2009
3.3.3 Intervention .................................................................................................................. 34
3.4 MEASUREMENTS................................................................................................................ 38
3.4.1 Dietary registration...................................................................................................... 38
3.4.2 Diet analysis................................................................................................................. 39
3.4.3 Body composition ......................................................................................................... 40
3.4.4 Thyroid hormones ........................................................................................................ 41
3.4.5 Indirect calorimetry...................................................................................................... 42
3.5 STATISTICAL ANALYSIS ..................................................................................................... 43
3.5.1 Sample size estimation ................................................................................................. 43
3.5.2 Missing data................................................................................................................. 44
4. RESULTS................................................................................................................................. 45
4.1 SUBJECTS........................................................................................................................... 45
4.2 DIET................................................................................................................................... 46
4.3 BODY COMPOSITION .......................................................................................................... 47
4.3.1 Body weight.................................................................................................................. 47
4.3.2 Fat mass and body fat percent ..................................................................................... 47
4.3.3 Lean body mass ............................................................................................................ 48
4.3.4 Bone mineral density (BMD)........................................................................................ 49
4.4 THYROID HORMONES ......................................................................................................... 50
4.5 BASAL METABOLIC RATE ................................................................................................... 51
4.6 COMPLIANCE ..................................................................................................................... 53
5. DISCUSSION........................................................................................................................... 55
5.1 SUBJECTS........................................................................................................................... 55
5.1.1 Gender and age ............................................................................................................ 55
9
Master thesis in Clinical Nutrition, Anu Koivisto 2009
5.1.2 Compliance .................................................................................................................. 56
5.1.3 Training hours and types of sports............................................................................... 57
5.1.4 Previous weight reduction............................................................................................ 57
5.2 METHODS .......................................................................................................................... 58
5.2.1 Design .......................................................................................................................... 58
5.2.2 Diet............................................................................................................................... 58
5.2.3 DEXA ........................................................................................................................... 60
5.2.4 Indirect calorimeter...................................................................................................... 60
5.3 RESULT INTERPRETATIONS ................................................................................................ 61
5.3.1 Body composition ......................................................................................................... 61
5.3.2 Thyroid hormones ........................................................................................................ 63
5.3.3 BMR ............................................................................................................................. 65
5.4 STRENGTHS AND WEAKNESSES OF THE STUDY ................................................................... 67
6. CONCLUSION ........................................................................................................................ 68
PRACTICAL IMPLICATIONS....................................................................................................... 69
REFERENCES.....................................................................................................................................70
LIST OF APPENDICES......................................................................................................................84

10
Master thesis in Clinical Nutrition, Anu Koivisto 2009
1. Introduction
Body composition and body weight are two of many factors influencing athletic
performance. Athlete’s ability to sustain power and overcome resistance (drag) is
closely related to body composition.2 In most sports the typical elite athlete is expected
to be well trained, lean and toned due to hours of training combined with a proper diet.
It is generally believed that athletes’ weight and body composition are easily
regulated, but their body size and shape vary and many athletes experience difficulties
obtaining optimal body weight and/or composition.3;4 The weight loss methods used
by athletes are often counterproductive and may cause loss of lean body mass (LBM),
and impair performance and health.5;6;6-8 Furthermore energy restriction seems to
reduce basal metabolic rate (BMR) but it is still unresolved whether it is caused by
changes in LBM, thyroid hormones or other factors 9. Weight loss literature represents
mostly overweight and obese population thus specific research in athletes is required.
Per date recommended weekly weight loss for athletes is 0.5-1 kg10 but no study has
evaluated the extremes of these guidelines in athletes. This study aims to determine the
effect and potential difference of these guidelines on body composition, thyroid
hormones and LBM in elite athletes.

11
Master thesis in Clinical Nutrition, Anu Koivisto 2009
2. Theory
2.1 Weight reduction and athletes
There are several reasons for weight regulation in sports. For most athletes it is
desirable to have a solid lean body mass and a low body fat percentage since this gives
an advantageous power to weight ratio.11 There are sports that require vertical (long
distance running, long jump) or horizontal (high jump) movements of the body where
excessive fat mass is considered as “dead weight”. High FM has also shown to
increase energy demands and therefore could affect performance negatively.12
Furthermore in sports where aerodynamics and reduced resistance or drag is important
(cycling, swimming) body composition plays an important role. Low body fat % can
also be desirable in sports for aesthetics reasons (figure skating, gymnastics,
bodybuilding/fitness and diving). And finally there are sports with weight categories
where athletes wish to get an advantage over their rivals by obtaining lowest possible
body weight with greatest reach and strength thus they often compete in weight class
under their natural body weight.7 When athletes with a relatively low body fat% wish
to reduce their body weight it needs to be planned carefully, since a desire to increase
LBM and reduce body fat % can lead to unhealthy training regimen and disordered
eating.13 A thorough evaluation of athletes’ physical and mental health, training
regimen and athletic goals is required. Especially in sports with weight categories
there has been an unhealthy tradition to reduce body weight rapidly during the last few
days before a weigh-in.7;14;15 Gradual weight loss is recommended and additional
dehydration up to 2% of body weight is acceptable.10;15 Larger dehydration and/or use
of laxatives and/or total food restriction should and could be avoided by providing
athletes and their coaches up to date information and guidance in optimal weight
regulation.
12
Master thesis in Clinical Nutrition, Anu Koivisto 2009
2.2 Weight reduction and diet
It is well documented that weight loss requires a negative energy balance. Though
dehydration can create a rapid transient weight loss it does not reduce fat mass or fat
free mass at the tissue level. Furthermore dehydration may cause adverse effects for
both health and performance.8;16 Negative energy balance by restricted energy intake
leads to a weight loss as long as physical activity is maintained. But the optimal
macronutrient composition of the calorie restricted diet and type of physical activity
for maximal FM and minimal LBM loss are still discussed.9
2.2.1 Energy metabolism during weight loss
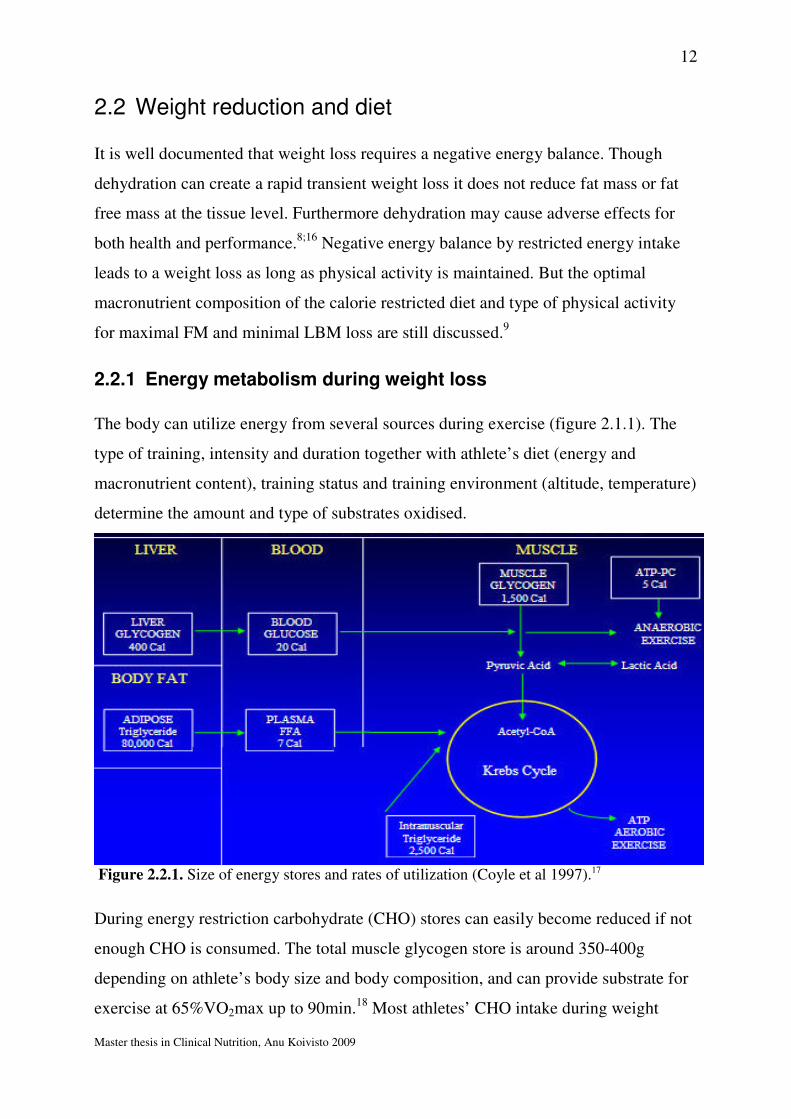
The body can utilize energy from several sources during exercise (figure 2.1.1). The
type of training, intensity and duration together with athlete’s diet (energy and
macronutrient content), training status and training environment (altitude, temperature)
determine the amount and type of substrates oxidised.
Figure 2.2.1. Size of energy stores and rates of utilization (Coyle et al 1997).17
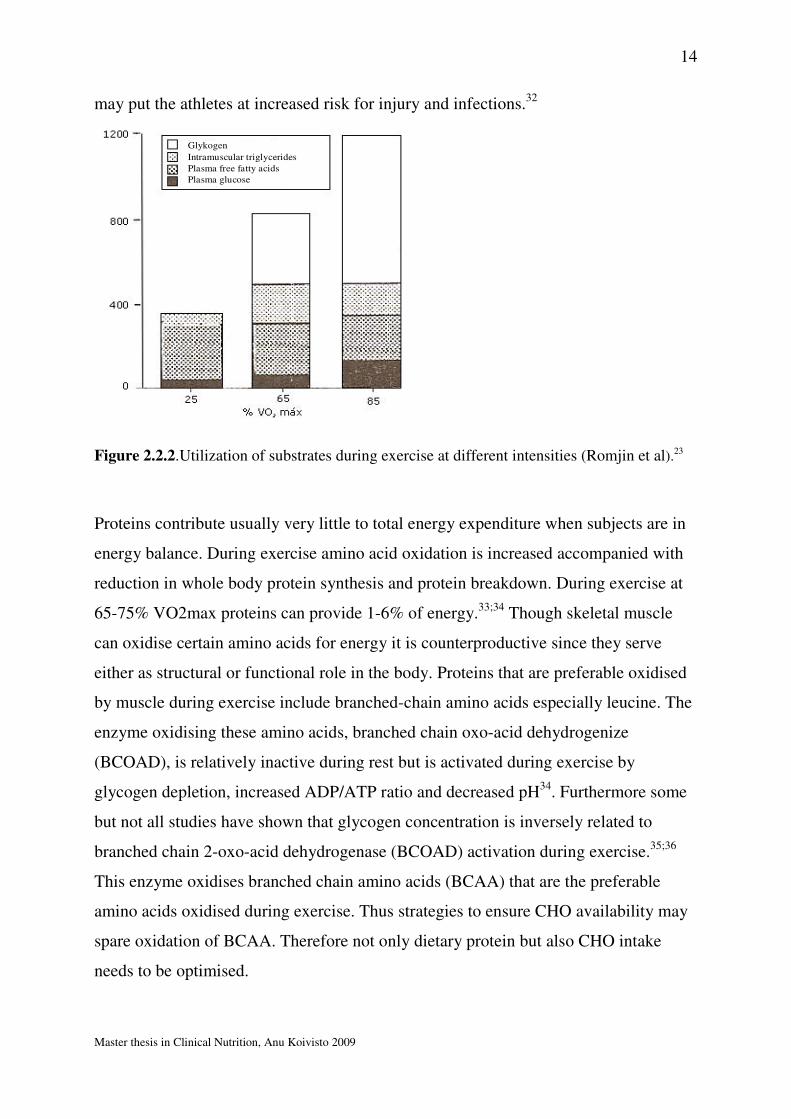
During energy restriction carbohydrate (CHO) stores can easily become reduced if not
enough CHO is consumed. The total muscle glycogen store is around 350-400g
depending on athlete’s body size and body composition, and can provide substrate for
exercise at 65%VO2max up to 90min.18 Most athletes’ CHO intake during weight
13
Master thesis in Clinical Nutrition, Anu Koivisto 2009
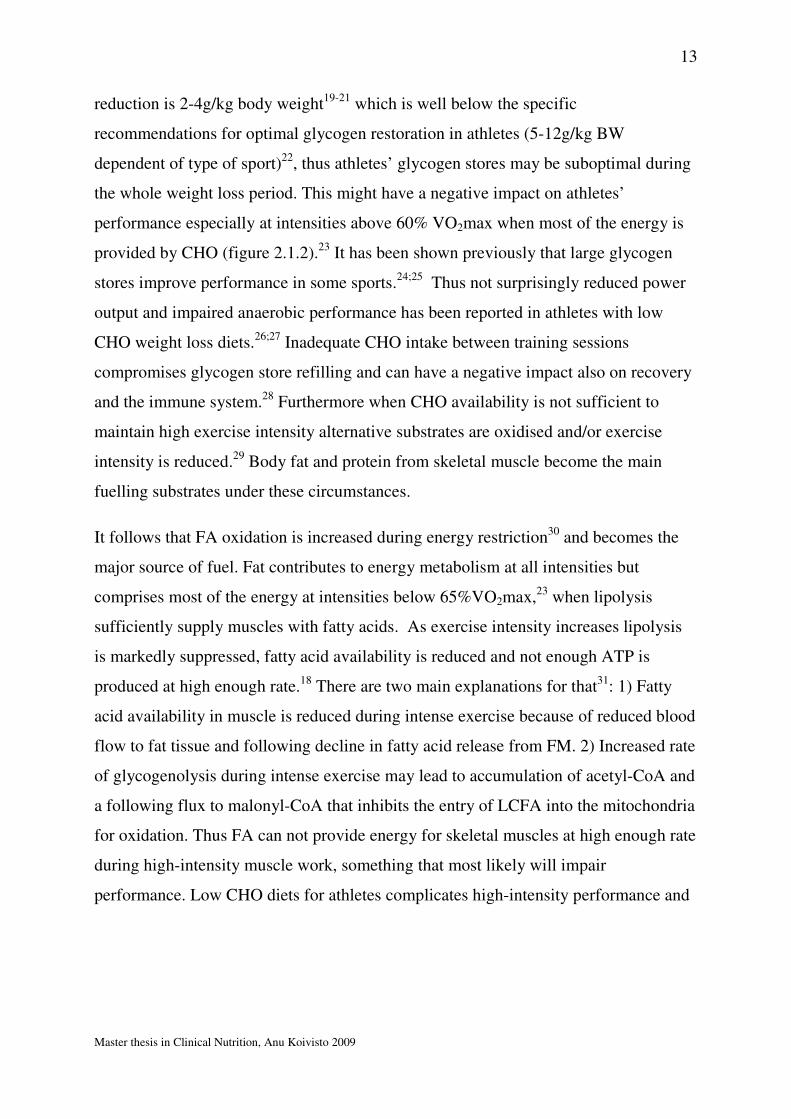
reduction is 2-4g/kg body weight19-21 which is well below the specific
recommendations for optimal glycogen restoration in athletes (5-12g/kg BW
dependent of type of sport)22, thus athletes’ glycogen stores may be suboptimal during
the whole weight loss period. This might have a negative impact on athletes’
performance especially at intensities above 60% VO2max when most of the energy is
provided by CHO (figure 2.1.2).23 It has been shown previously that large glycogen
stores improve performance in some sports.24;25 Thus not surprisingly reduced power
output and impaired anaerobic performance has been reported in athletes with low
CHO weight loss diets.26;27 Inadequate CHO intake between training sessions
compromises glycogen store refilling and can have a negative impact also on recovery
and the immune system.28 Furthermore when CHO availability is not sufficient to
maintain high exercise intensity alternative substrates are oxidised and/or exercise
intensity is reduced.29 Body fat and protein from skeletal muscle become the main
fuelling substrates under these circumstances.
It follows that FA oxidation is increased during energy restriction30 and becomes the
major source of fuel. Fat contributes to energy metabolism at all intensities but
comprises most of the energy at intensities below 65%VO2max,23 when lipolysis
sufficiently supply muscles with fatty acids. As exercise intensity increases lipolysis
is markedly suppressed, fatty acid availability is reduced and not enough ATP is
produced at high enough rate.18 There are two main explanations for that31: 1) Fatty
acid availability in muscle is reduced during intense exercise because of reduced blood
flow to fat tissue and following decline in fatty acid release from FM. 2) Increased rate
of glycogenolysis during intense exercise may lead to accumulation of acetyl-CoA and
a following flux to malonyl-CoA that inhibits the entry of LCFA into the mitochondria
for oxidation. Thus FA can not provide energy for skeletal muscles at high enough rate
during high-intensity muscle work, something that most likely will impair
performance. Low CHO diets for athletes complicates high-intensity performance and
14
Master thesis in Clinical Nutrition, Anu Koivisto 2009
may put the athletes at increased risk for injury and infections.32
Glykogen
Intramuscular triglycerides
Plasma free fatty acids
Plasma glucose
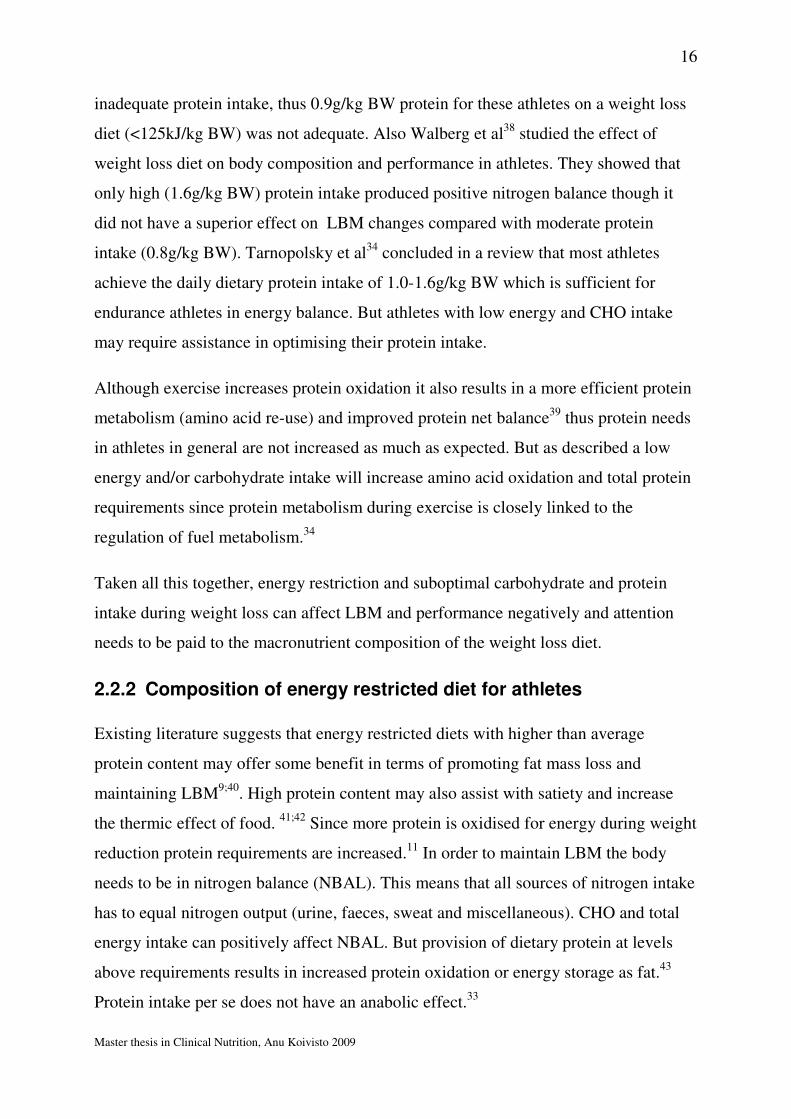
Figure 2.2.2.Utilization of substrates during exercise at different intensities (Romjin et al).23
Proteins contribute usually very little to total energy expenditure when subjects are in
energy balance. During exercise amino acid oxidation is increased accompanied with
reduction in whole body protein synthesis and protein breakdown. During exercise at
65-75% VO2max proteins can provide 1-6% of energy.33;34 Though skeletal muscle
can oxidise certain amino acids for energy it is counterproductive since they serve
either as structural or functional role in the body. Proteins that are preferable oxidised
by muscle during exercise include branched-chain amino acids especially leucine. The
enzyme oxidising these amino acids, branched chain oxo-acid dehydrogenize
(BCOAD), is relatively inactive during rest but is activated during exercise by
glycogen depletion, increased ADP/ATP ratio and decreased pH34. Furthermore some
but not all studies have shown that glycogen concentration is inversely related to
branched chain 2-oxo-acid dehydrogenase (BCOAD) activation during exercise.35;36
This enzyme oxidises branched chain amino acids (BCAA) that are the preferable
amino acids oxidised during exercise. Thus strategies to ensure CHO availability may
spare oxidation of BCAA. Therefore not only dietary protein but also CHO intake
needs to be optimised.
15
Master thesis in Clinical Nutrition, Anu Koivisto 2009
Also catabolic hormone profile during exercise in energy restriction can negatively
affect muscle protein breakdown. Glycogen depletion makes the muscle rely more on
blood sugar for energy/glucose supply leading to reductions in serum glucose
concentration.29 Hypoglycemia markedly stimulates epinephrine release in an attempt
to increase liver glucose output (gluconeogenesis) and attenuate blood sugar levels.
Glycogen depletion is also associated with elevation of plasma cortisol. These stress
hormones induce the proteolysis and muscle protein breakdown often seen in
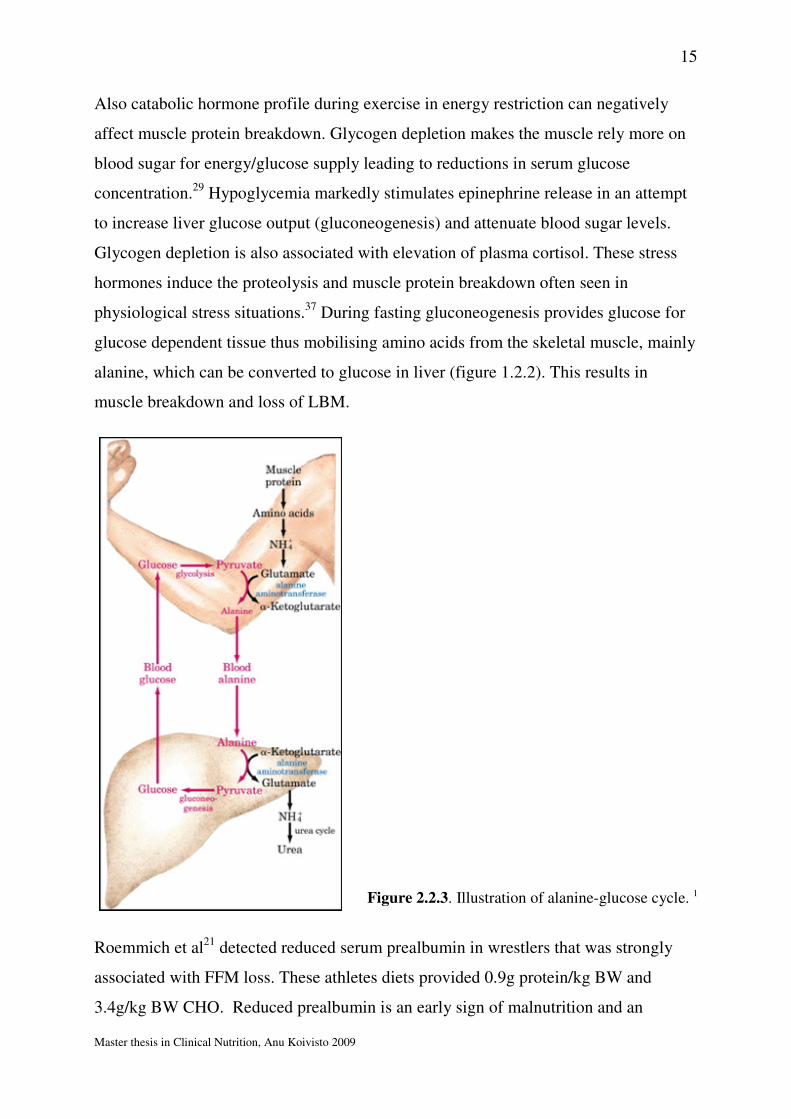
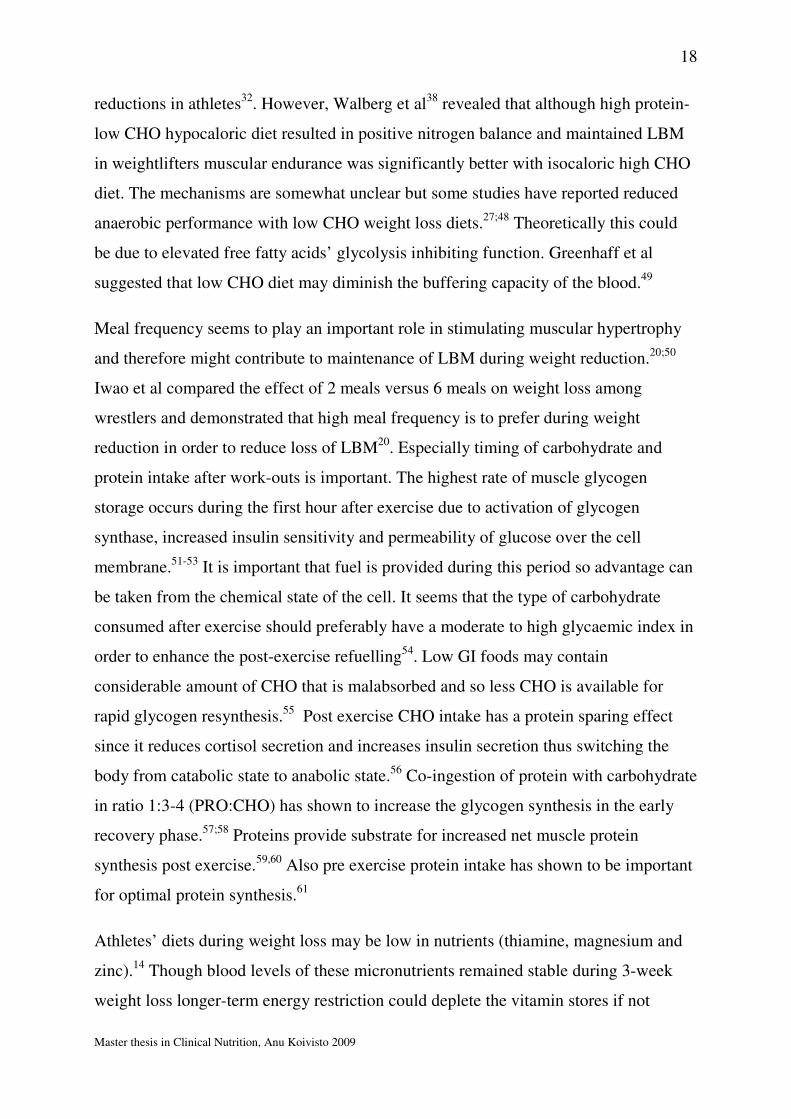
physiological stress situations.37 During fasting gluconeogenesis provides glucose for
glucose dependent tissue thus mobilising amino acids from the skeletal muscle, mainly
alanine, which can be converted to glucose in liver (figure 1.2.2). This results in
muscle breakdown and loss of LBM.
Roemmich et al21 detected reduced serum prealbumin in wrestlers that was strongly
associated with FFM loss. These athletes diets provided 0.9g protein/kg BW and
3.4g/kg BW CHO. Reduced prealbumin is an early sign of malnutrition and an
Figure 2.2.3. Illustration of alanine-glucose cycle. 1
16
Master thesis in Clinical Nutrition, Anu Koivisto 2009
inadequate protein intake, thus 0.9g/kg BW protein for these athletes on a weight loss
diet (<125kJ/kg BW) was not adequate. Also Walberg et al38 studied the effect of
weight loss diet on body composition and performance in athletes. They showed that
only high (1.6g/kg BW) protein intake produced positive nitrogen balance though it
did not have a superior effect on LBM changes compared with moderate protein
intake (0.8g/kg BW). Tarnopolsky et al34 concluded in a review that most athletes
achieve the daily dietary protein intake of 1.0-1.6g/kg BW which is sufficient for
endurance athletes in energy balance. But athletes with low energy and CHO intake
may require assistance in optimising their protein intake.
Although exercise increases protein oxidation it also results in a more efficient protein
metabolism (amino acid re-use) and improved protein net balance39 thus protein needs
in athletes in general are not increased as much as expected. But as described a low
energy and/or carbohydrate intake will increase amino acid oxidation and total protein
requirements since protein metabolism during exercise is closely linked to the
regulation of fuel metabolism.34
Taken all this together, energy restriction and suboptimal carbohydrate and protein
intake during weight loss can affect LBM and performance negatively and attention
needs to be paid to the macronutrient composition of the weight loss diet.
2.2.2 Composition of energy restricted diet for athletes
Existing literature suggests that energy restricted diets with higher than average
protein content may offer some benefit in terms of promoting fat mass loss and
maintaining LBM9;40. High protein content may also assist with satiety and increase
the thermic effect of food. 41;42 Since more protein is oxidised for energy during weight
reduction protein requirements are increased.11 In order to maintain LBM the body
needs to be in nitrogen balance (NBAL). This means that all sources of nitrogen intake
has to equal nitrogen output (urine, faeces, sweat and miscellaneous). CHO and total
energy intake can positively affect NBAL. But provision of dietary protein at levels
above requirements results in increased protein oxidation or energy storage as fat.43
Protein intake per se does not have an anabolic effect.33

17
Master thesis in Clinical Nutrition, Anu Koivisto 2009
Hypo caloric diet with varying macronutrient composition has been studied
extensively in overweight and obese subjects but relatively few studies are conducted
on athletes. Baba et al44 showed a significantly larger decrease in RMR with a high
CHO diet (-17.4%) compared with high protein diet (-5.9%). Torbay et al found
similar changes in BMR with identical diet composition (30E% fat, 45E% protein,
25E% CHO). Dietary protein recommendation for athletes is 1.2g/kg body weight
during weight loss10. It is important that the protein quality (content of essential amino
acids and bioavailability) of weight loss diet is high. The amount of protein that
contributes to total energy intake varies according to the amount of CHO and fat in the
diet.
Athletes’ CHO intake should be as high as possible within other dietary goals during
weight reduction since CHO play an important role in optimal performance and has a
net positive effect on nitrogen balance. Studies have shown the importance of
carbohydrates during weight reduction for maintenance of high-power performance
where high carbohydrate diet (66-70 E%) but not lower CHO diet (41-55 E%) was
required for wrestlers to perform at their best.27;45 To secure the minimum
carbohydrate and protein intake fat content needs to be substantially reduced but is not
recommended to be below 20E% for not to compromise essential fatty acid intake.
There are many fad diets promising superior weight reduction results. Low
carbohydrate, low GI, high protein, high fat, low fat and very low fat diets alone or in
combinations with each other are probably the most common strategies. Low CHO
diets have been reported to result in lower lactate threshold which is unfortunate for
elite athletes’ performance.32 There is also some evidence that the nutritional adequacy
of such a diet may be suboptimal (low in fibre, vitamins and minerals).46 Furthermore
low CHO diets result in glycogen depletion and a following fatigue, delayed recovery
and possibly a reduction in immune function. Depletion of carbohydrate stores has
also shown to result in increased s-cortisol which might affect LBM negatively.47
Though in a review from 2007 the authors (reviewed only 5 small clinical performance
studies) concluded that low FAT and low CHO diets appear indifferent relative to
performance (no change or improved time to exhaustion at 60-80%VO2max) in
endurance athletes and that low CHO diets seem to induce larger weight and FM
18
Master thesis in Clinical Nutrition, Anu Koivisto 2009
reductions in athletes32. However, Walberg et al38 revealed that although high protein-
low CHO hypocaloric diet resulted in positive nitrogen balance and maintained LBM
in weightlifters muscular endurance was significantly better with isocaloric high CHO
diet. The mechanisms are somewhat unclear but some studies have reported reduced
anaerobic performance with low CHO weight loss diets.27;48 Theoretically this could
be due to elevated free fatty acids’ glycolysis inhibiting function. Greenhaff et al
suggested that low CHO diet may diminish the buffering capacity of the blood.49
Meal frequency seems to play an important role in stimulating muscular hypertrophy
and therefore might contribute to maintenance of LBM during weight reduction.20;50
Iwao et al compared the effect of 2 meals versus 6 meals on weight loss among
wrestlers and demonstrated that high meal frequency is to prefer during weight
reduction in order to reduce loss of LBM20. Especially timing of carbohydrate and
protein intake after work-outs is important. The highest rate of muscle glycogen
storage occurs during the first hour after exercise due to activation of glycogen
synthase, increased insulin sensitivity and permeability of glucose over the cell
membrane.51-53 It is important that fuel is provided during this period so advantage can
be taken from the chemical state of the cell. It seems that the type of carbohydrate
consumed after exercise should preferably have a moderate to high glycaemic index in
order to enhance the post-exercise refuelling54. Low GI foods may contain
considerable amount of CHO that is malabsorbed and so less CHO is available for
rapid glycogen resynthesis.55 Post exercise CHO intake has a protein sparing effect
since it reduces cortisol secretion and increases insulin secretion thus switching the
body from catabolic state to anabolic state.56 Co-ingestion of protein with carbohydrate
in ratio 1:3-4 (PRO:CHO) has shown to increase the glycogen synthesis in the early
recovery phase.57;58 Proteins provide substrate for increased net muscle protein
synthesis post exercise.59,60 Also pre exercise protein intake has shown to be important
for optimal protein synthesis.61
Athletes’ diets during weight loss may be low in nutrients (thiamine, magnesium and
zinc).14 Though blood levels of these micronutrients remained stable during 3-week
weight loss longer-term energy restriction could deplete the vitamin stores if not
19
Master thesis in Clinical Nutrition, Anu Koivisto 2009
counterbalanced with increased intake or supplementation. Furthermore weight loss
diets may be low in iron and fat (including omega 3 fatty acids) and fat soluble
vitamins48 and could theoretically affect the immune system and performance
negatively.62
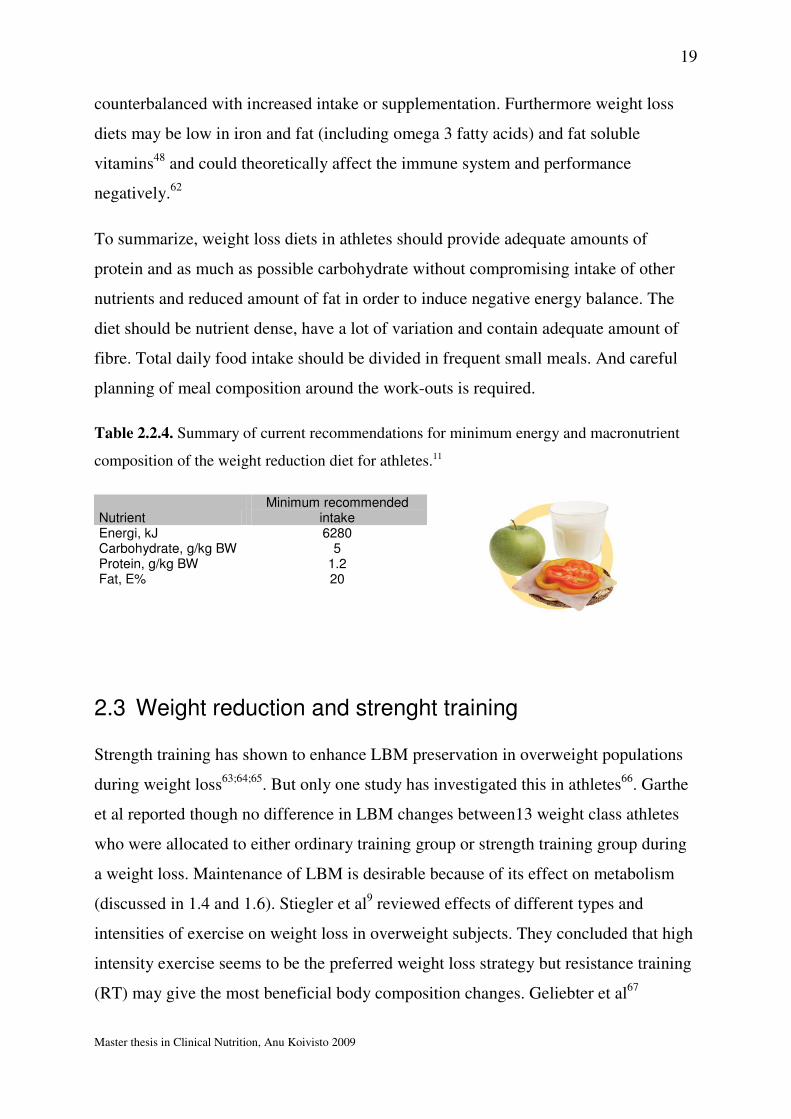
To summarize, weight loss diets in athletes should provide adequate amounts of
protein and as much as possible carbohydrate without compromising intake of other
nutrients and reduced amount of fat in order to induce negative energy balance. The
diet should be nutrient dense, have a lot of variation and contain adequate amount of
fibre. Total daily food intake should be divided in frequent small meals. And careful
planning of meal composition around the work-outs is required.
Table 2.2.4. Summary of current recommendations for minimum energy and macronutrient
composition of the weight reduction diet for athletes.11
Nutrient Minimum recommended
intake Energi, kJ 6280 Carbohydrate, g/kg BW 5 Protein, g/kg BW 1.2 Fat, E% 20
2.3 Weight reduction and strenght training
Strength training has shown to enhance LBM preservation in overweight populations
during weight loss63;64;65. But only one study has investigated this in athletes66. Garthe
et al reported though no difference in LBM changes between13 weight class athletes
who were allocated to either ordinary training group or strength training group during
a weight loss. Maintenance of LBM is desirable because of its effect on metabolism
(discussed in 1.4 and 1.6). Stiegler et al9 reviewed effects of different types and
intensities of exercise on weight loss in overweight subjects. They concluded that high
intensity exercise seems to be the preferred weight loss strategy but resistance training
(RT) may give the most beneficial body composition changes. Geliebter et al67
20
Master thesis in Clinical Nutrition, Anu Koivisto 2009
reported that despite the type of exercise (strength training versus aerobic training)
declines in RMR could not be prevented during 8-week weight loss, but the literature
is still inconclusive.9 Exercise alone often fails in BW reduction but combining
resistance training with energy restriction might be the best way to maintain LBM
while reducing BW and FM.68
2.4 Weight reduction and body composition
The main components of human body on tissue level are fat free mass (FFM) and fat
mass (FM). FFM is defined as all fat-free chemicals and tissue including water,
muscle, bone, connective tissue and organs. Very often FFM and lean body mass
(LBM) are used interchangeably. The only difference is that LBM includes in addition
to FFM also fat in cell membranes (~10% of FM).69 FFM consist of highly
metabolically active tissue and tissue with lower metabolic rate like bone and
connective tissue. High lean to fat mass ratio is advantageous for athletes and therefore
ideally a body composition change would lead to loss of FM and maintenance or even
increased LBM. But a simultaneous increase in LBM and a decrease in body fat % is
difficult to achieve since reduction in FM requires a negative energy balance whereas
LBM increase is stimulated by a positive energy balance.70 Restricted energy intake
and following weight loss in athletes and non-athletes is unfortunately often
accompanied with reductions in LBM.68;71 Koutedakis et al72 reported that 50% of
weight loss in elite rowers consisted of LBM. The rowers reduced their body weight
by 6-7% during a 2 or 4 months pre-season period. It seems that the larger the weight
reductions the larger loss of LBM both in athletes and non-athletes according to
several studies.71;73
Muscular hypertrophy during energy restriction has been detected only among rats.
Goldberg et al reported decades ago muscular hypertrophy in rats during energy
restriction.74 Lately results from clinical trials has strengthened the positive effect of
resistance training under weight reduction for the maintenance of LBM64;65;75;76, and
one study has shown an increase in LBM during a 12-week weight loss.75 But all these
studies are conducted on overweight/obese subjects thus the results cannot be
21
Master thesis in Clinical Nutrition, Anu Koivisto 2009
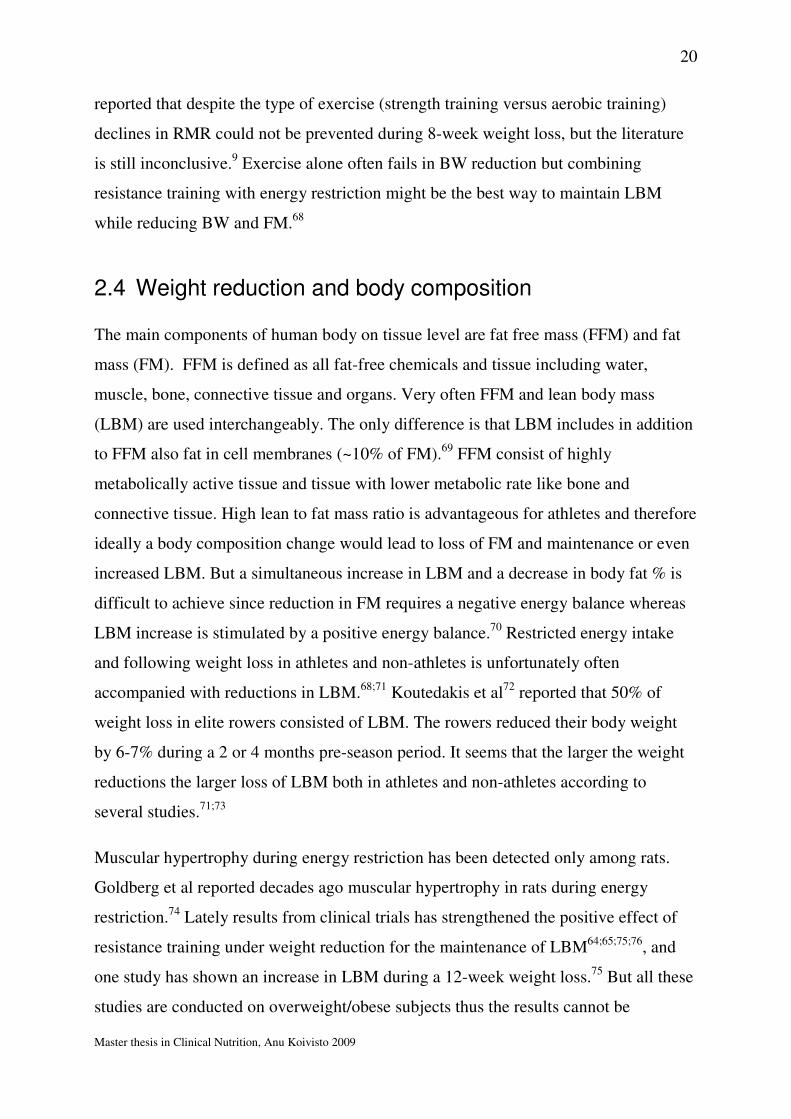
extrapolated to elite athletes. Forbes et al demonstrated that LBM loss is related to
initial body fat content, indicating that lean subjects will lose larger proportion of FFM
during weigh loss than subjects with higher % body fat.70
Figure 2.4.1. Anatomic skeletal muscle components at the first four body composition
levels.77
FM loss during weight reduction seems to affect several other aspects than sole body
composition. FM loss has been linked to reduced serum leptin.78 Leptin is a signal
substance released from adipose tissue (adipokine) reflecting the state of the fat stores.
It acts as a long-term satiety signal in the hypothalamus satiety centre. Low plasma
leptin signals to hypothalamus of reduced energy stores (FM) and thus promotes
hunger and suppresses satiety. As fat stores decline during weight loss leptin release is
reduced which might have an affect on BMR as reported by Dionne et al79.
Furthermore reduced energy availability but not the exercise stress seems to suppress
leptin.80 Thus exercise does not induce hunger to same extent than energy restriction
does, emphasizing the importance of exercise in weight loss regimen in improving
satiety and perhaps adherence to the regimen. Also athletes with low energy intakes
have shown to have low serum leptin indicating low fat stores and low energy
availability.81 But there are no studies looking at changes in leptin as a result of weight
loss intervention. Interestingly leptin may execute its effect on thermogenesis via
thyroid hormones (see 1.5). Doucet et al82 showed that leptin could explain 28% of
22
Master thesis in Clinical Nutrition, Anu Koivisto 2009
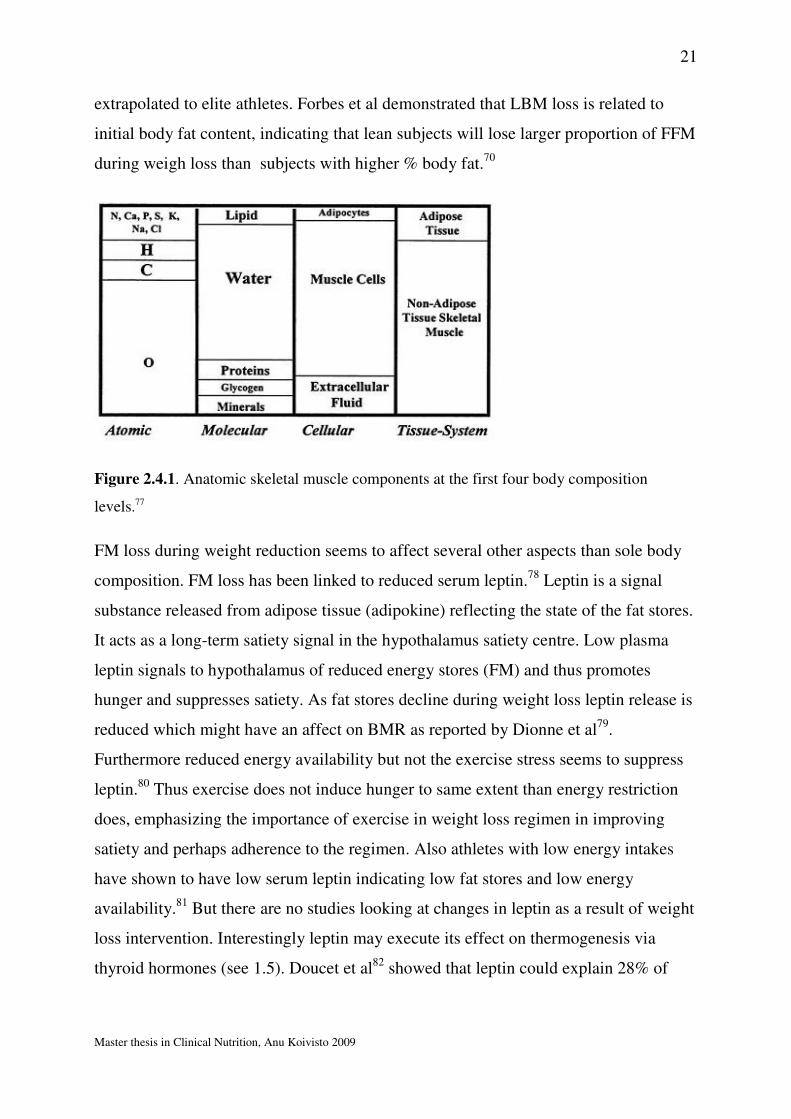
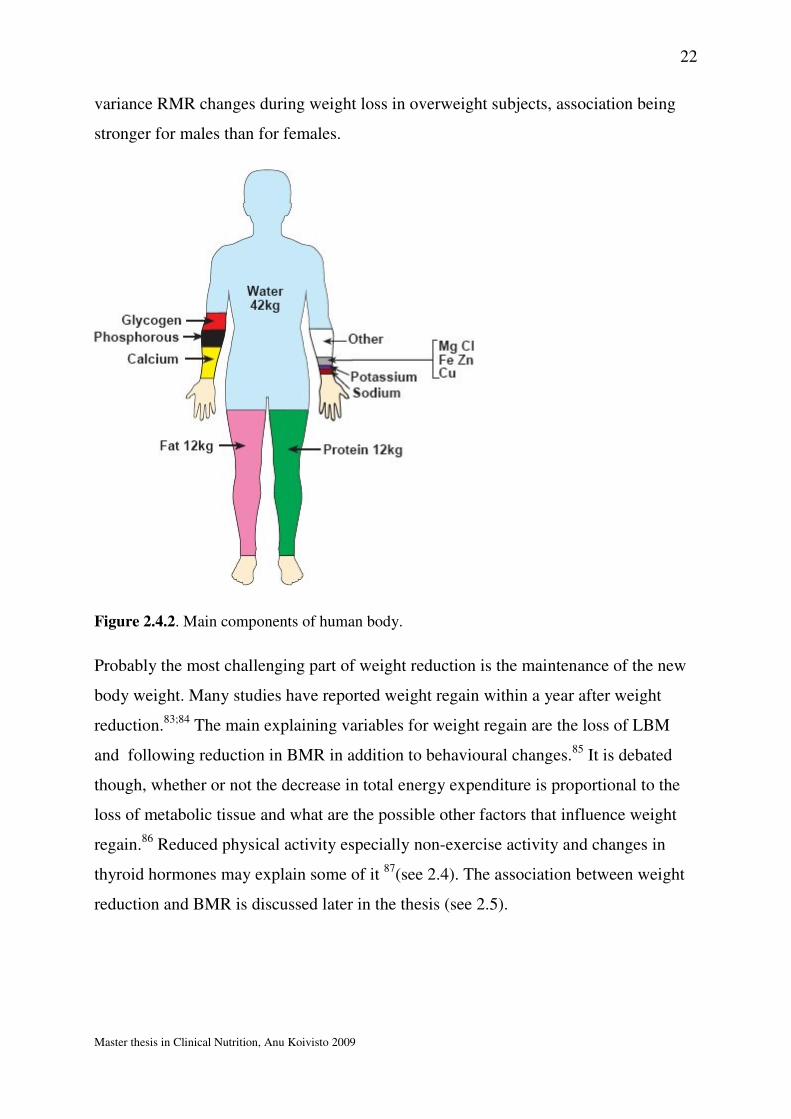
variance RMR changes during weight loss in overweight subjects, association being
stronger for males than for females.
Figure 2.4.2. Main components of human body.
Probably the most challenging part of weight reduction is the maintenance of the new
body weight. Many studies have reported weight regain within a year after weight
reduction.83;84 The main explaining variables for weight regain are the loss of LBM
and following reduction in BMR in addition to behavioural changes.85 It is debated
though, whether or not the decrease in total energy expenditure is proportional to the
loss of metabolic tissue and what are the possible other factors that influence weight
regain.86 Reduced physical activity especially non-exercise activity and changes in
thyroid hormones may explain some of it 87(see 2.4). The association between weight
reduction and BMR is discussed later in the thesis (see 2.5).
23
Master thesis in Clinical Nutrition, Anu Koivisto 2009
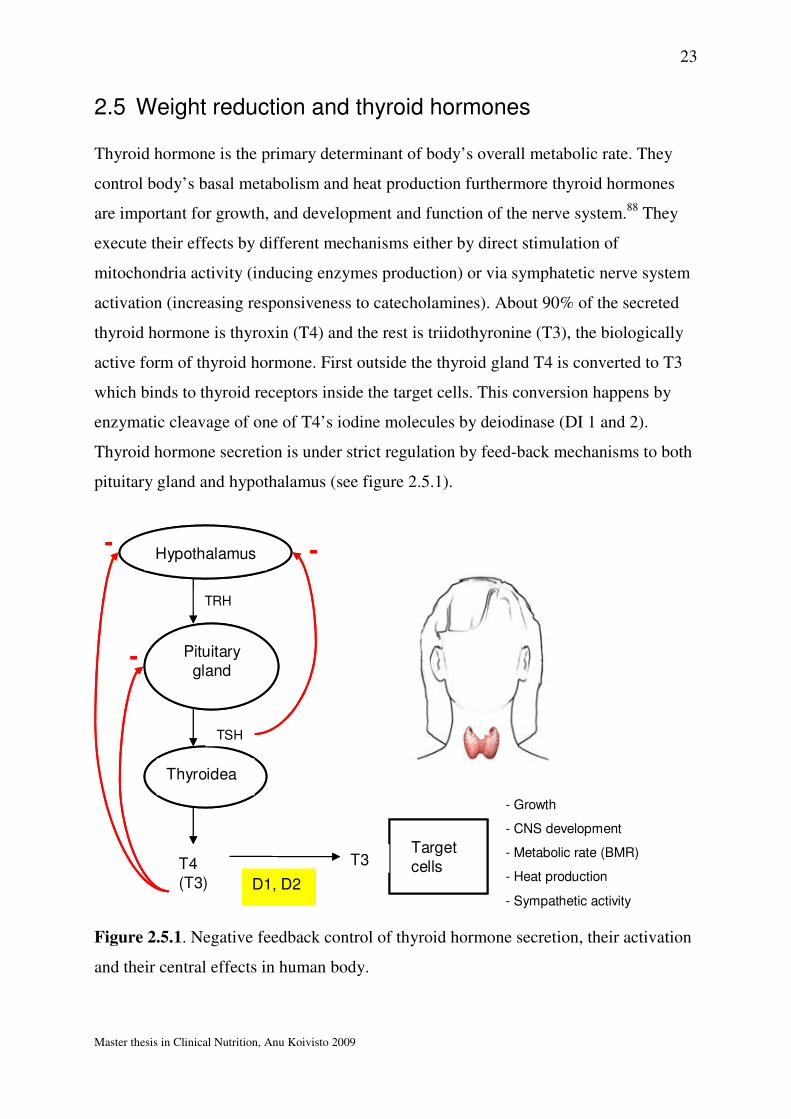
2.5 Weight reduction and thyroid hormones
Thyroid hormone is the primary determinant of body’s overall metabolic rate. They
control body’s basal metabolism and heat production furthermore thyroid hormones
are important for growth, and development and function of the nerve system.88 They
execute their effects by different mechanisms either by direct stimulation of
mitochondria activity (inducing enzymes production) or via symphatetic nerve system
activation (increasing responsiveness to catecholamines). About 90% of the secreted
thyroid hormone is thyroxin (T4) and the rest is triidothyronine (T3), the biologically
active form of thyroid hormone. First outside the thyroid gland T4 is converted to T3
which binds to thyroid receptors inside the target cells. This conversion happens by
enzymatic cleavage of one of T4’s iodine molecules by deiodinase (DI 1 and 2).
Thyroid hormone secretion is under strict regulation by feed-back mechanisms to both
pituitary gland and hypothalamus (see figure 2.5.1).
Hypothalamus
TRH
TSH
Pituitary gland
Thyroidea
TSH
T4(T3)
T3T3D1, D2
Target cellsT3
- Growth
- CNS development
- Metabolic rate (BMR)
- Heat production
- Sympathetic activity
--
-
Hypothalamus
TRH
TSH
Pituitary gland
Thyroidea
TSH
T4(T3)
T3T3D1, D2
Target cellsT3
- Growth
- CNS development
- Metabolic rate (BMR)
- Heat production
- Sympathetic activity
--
-
Figure 2.5.1. Negative feedback control of thyroid hormone secretion, their activation
and their central effects in human body.
24
Master thesis in Clinical Nutrition, Anu Koivisto 2009
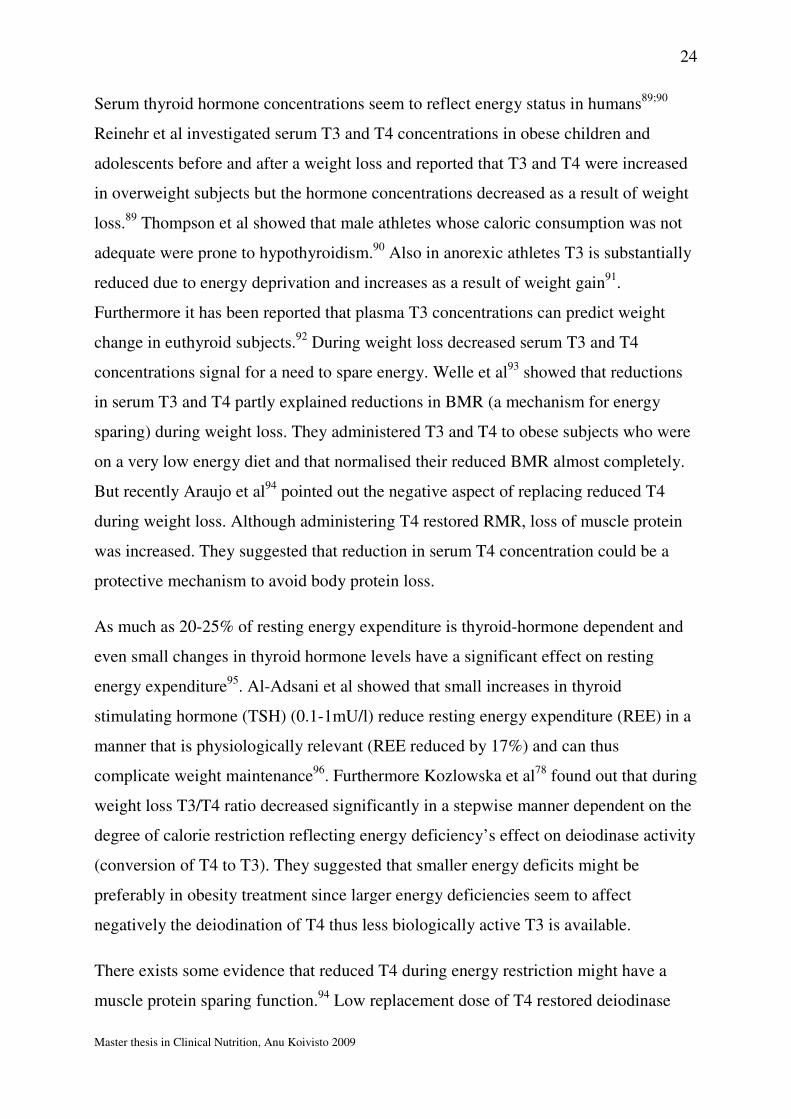
Serum thyroid hormone concentrations seem to reflect energy status in humans89;90
Reinehr et al investigated serum T3 and T4 concentrations in obese children and
adolescents before and after a weight loss and reported that T3 and T4 were increased
in overweight subjects but the hormone concentrations decreased as a result of weight
loss.89 Thompson et al showed that male athletes whose caloric consumption was not
adequate were prone to hypothyroidism.90 Also in anorexic athletes T3 is substantially
reduced due to energy deprivation and increases as a result of weight gain91.
Furthermore it has been reported that plasma T3 concentrations can predict weight
change in euthyroid subjects.92 During weight loss decreased serum T3 and T4
concentrations signal for a need to spare energy. Welle et al93 showed that reductions
in serum T3 and T4 partly explained reductions in BMR (a mechanism for energy
sparing) during weight loss. They administered T3 and T4 to obese subjects who were
on a very low energy diet and that normalised their reduced BMR almost completely.
But recently Araujo et al94 pointed out the negative aspect of replacing reduced T4
during weight loss. Although administering T4 restored RMR, loss of muscle protein
was increased. They suggested that reduction in serum T4 concentration could be a
protective mechanism to avoid body protein loss.
As much as 20-25% of resting energy expenditure is thyroid-hormone dependent and
even small changes in thyroid hormone levels have a significant effect on resting
energy expenditure95. Al-Adsani et al showed that small increases in thyroid
stimulating hormone (TSH) (0.1-1mU/l) reduce resting energy expenditure (REE) in a
manner that is physiologically relevant (REE reduced by 17%) and can thus
complicate weight maintenance96. Furthermore Kozlowska et al78 found out that during
weight loss T3/T4 ratio decreased significantly in a stepwise manner dependent on the
degree of calorie restriction reflecting energy deficiency’s effect on deiodinase activity
(conversion of T4 to T3). They suggested that smaller energy deficits might be
preferably in obesity treatment since larger energy deficiencies seem to affect
negatively the deiodination of T4 thus less biologically active T3 is available.
There exists some evidence that reduced T4 during energy restriction might have a
muscle protein sparing function.94 Low replacement dose of T4 restored deiodinase

25
Master thesis in Clinical Nutrition, Anu Koivisto 2009
activity and RMR in rats during calorie restriction but increased body protein loss.
This illustrates that decline in T4 during energy deprivation is an important survival
mechanism since body proteins due to their structural and functional role are the last
resort to meet other energy needs.
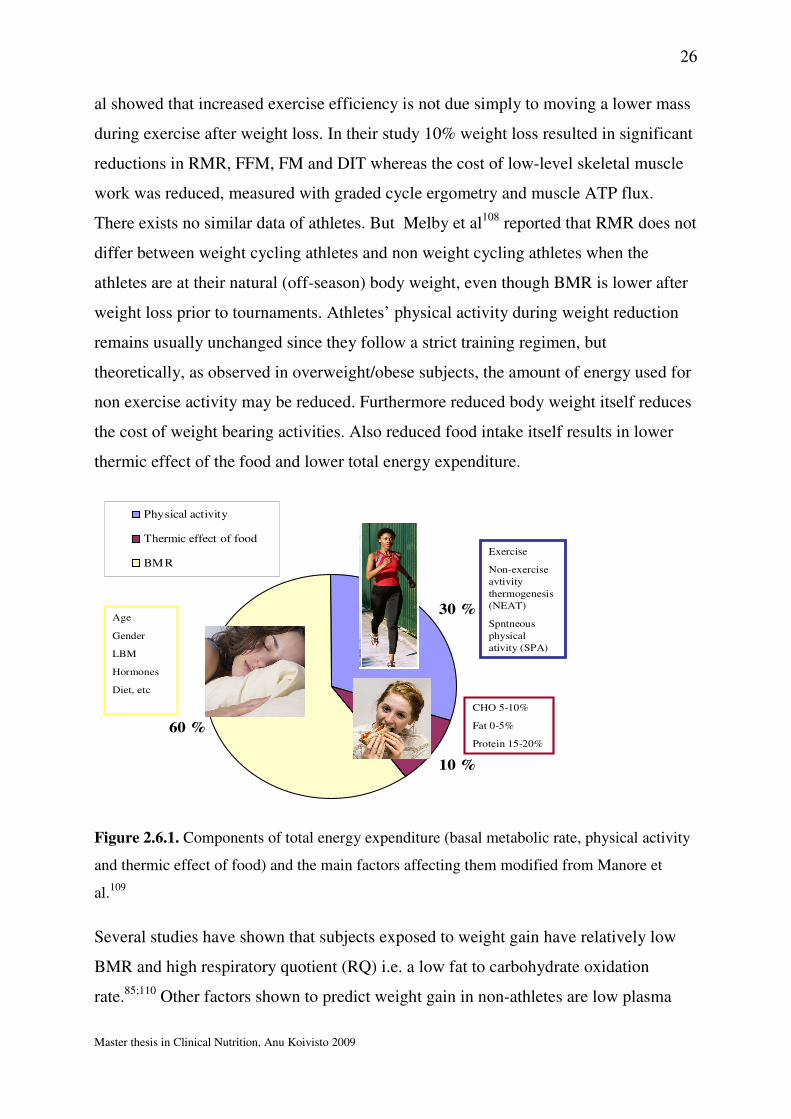
2.6 Weight reduction and basal metabolic rate
Basal metabolic rate (BMR) is the energy expended by cells to maintain normal body
functions at rest. BMR stands for approximately 60-70% of total daily energy
expenditure. Other components of the total energy expenditure are diet induced
thermogenesis (also called thermic effect of food) and activity thermogenesis, both
non-exercise and exercise energy expenditure (figure 1.6.1). Per date following factors
are considered to have an impact on BMR: age, gender, height, growth, genetics,
LBM, disease (fever), diet (over/underfeeding), environmental temperature, altitude,
stress hormones, pre menstrual hormone profile and thyroid hormones.97-99 There is
evidence that weight loss induced with calorie restriction leads to reduced BMR.86
Maintenance of new body weight is complicated by reduced energy expenditure which
favours weight regain.100;101 Reduced BMR as a result of weight reduction has been
proposed as one of the main factors for poor long term weight maintenance. Some
studies102;103, but not all63;104, have reported larger BMR losses than predicted from
changes in LBM. Suggesting that 1) there must be other important factors affecting
changes in BMR during acute weight reduction 2) there is great inter-individual
variability in metabolic reactions to energy restriction.
Several studies have reported that weight loss induced reduction in energy expenditure
persists long after the actual weight loss when the new body weight is maintained, a
sort of metabolic adaptation occurs.105;106 Whereas other studies have shown that
reduced energy expenditure is a transient response to low energy availability and is
normalised simultaneously with stabilization of body weight.107 The reduced energy
expenditure after weight loss seems to result from reduced sleeping metabolic rate,
reduced plasma concentration of thyroid hormones, hypoleptinemia, reduced
spontaneous activity and increased skeletal muscle work-efficiency.105 Rosenbaum et
26
Master thesis in Clinical Nutrition, Anu Koivisto 2009
al showed that increased exercise efficiency is not due simply to moving a lower mass
during exercise after weight loss. In their study 10% weight loss resulted in significant
reductions in RMR, FFM, FM and DIT whereas the cost of low-level skeletal muscle
work was reduced, measured with graded cycle ergometry and muscle ATP flux.
There exists no similar data of athletes. But Melby et al108 reported that RMR does not
differ between weight cycling athletes and non weight cycling athletes when the
athletes are at their natural (off-season) body weight, even though BMR is lower after
weight loss prior to tournaments. Athletes’ physical activity during weight reduction
remains usually unchanged since they follow a strict training regimen, but
theoretically, as observed in overweight/obese subjects, the amount of energy used for
non exercise activity may be reduced. Furthermore reduced body weight itself reduces
the cost of weight bearing activities. Also reduced food intake itself results in lower
thermic effect of the food and lower total energy expenditure.
60 %
10 %
30 %
Physical activity
Thermic effect of food
BMRExercise
Non-exercise
avtivity
thermogenesis
(NEAT)
Spntneous
physical
ativity (SPA)
CHO 5-10%
Fat 0-5%
Protein 15-20%
Age
Gender
LBM
Hormones
Diet, etc
Figure 2.6.1. Components of total energy expenditure (basal metabolic rate, physical activity
and thermic effect of food) and the main factors affecting them modified from Manore et
al.109
Several studies have shown that subjects exposed to weight gain have relatively low
BMR and high respiratory quotient (RQ) i.e. a low fat to carbohydrate oxidation
rate.85;110 Other factors shown to predict weight gain in non-athletes are low plasma
27
Master thesis in Clinical Nutrition, Anu Koivisto 2009
leptin, low physical activity and low insulin sensitivity.111 It appears that weight loss
regimen with very low calorie diet especially when no programme for physical activity
is included leads to larger BMR reductions.9
Taken all this together attenuating the decline in BMR under weight reduction is
desirable for successful weight maintenance. And the mechanisms for maintaining
BMR under these circumstances need further studying.
2.7 Potential adverse effects of weight reduction
There are potential metabolic, physical and mental adverse effects with energy
restriction and weight regulation. Metabolically reduced carbohydrate intake and
depletion of glycogen stores during weight loss may lead to increased cortisol release
during strenuous exercise.47 This can lead to loss of LBM as often seen during weight
loss and thus contribute to reduced metabolic rate. It can also compromise immune
system by inhibiting the innate immune system.112 Athletes undergoing weight
reduction are recognised as being more prone to infection. Kowatari et al showed that
neutrophil function was reduced following a 20-day weight reduction in judoists.6 Also
Imai et al showed impaired immune function as a result of 4% body weight loss.113
Inadequate protein and micronutrient intake as well will affect the immune system
negatively47 pointing out the importance of well planned, balanced weight loss diet.
Dehydration as a weight loss method commonly used in weight class sports leads to
plasma volume loss, reduces the body’s ability to produce sweat and increases
susceptibility to heat illness.10 Dehydration may have severe outcomes as
demonstrated by the deaths of three American collegiate wrestlers in 1998 who had
used extreme dehydration methods for making weight prior to competition.16
Cognitive function in dieting athletes has been assessed by Choma et al.8 A reduced
short-term memory and transient mood reduction was observed as a result of rapid
weight loss in 14 collegiate wrestlers. Also Horswill et al reported changes in mood in
athletes during a 4-day weight loss. Energy restriction regardless of diet resulted in
elevated tension, anger, depression and fatigue measured with the profile of mood
28
Master thesis in Clinical Nutrition, Anu Koivisto 2009
states (POMS)26. Filaire et al reported similar findings during a 7-day weight loss in
judoists.48
Energy restriction has an impact on bone mineral density as it decreases bone
formation.114 Energy deficiency’s effect on BMD has been studied in female athletes
with menstrual disturbances (the female athlete triad).115;116 Energy deficiency and
following hypo estrogenism is associated with suppressed bone formation and
increased bone repression and thus bone mass loss. Recent review by Voskowi et al
concluded that the most successful and indeed essential strategy for improving BMD
in females with amenorrhea is to increase caloric intake such that body mass is
increased and there is a resumption of menses. This is important to keep in mind when
working with young athletes since BMD reaches its peak at the age of 20-30.117;118
Adequate amounts of micronutrients important for bone mass (calcium, vitamin D and
K) need to be included in weight reduction diets for athletes.
Increased focus on body composition and body weight might theoretically increase the
prevalence of disordered eating (DE).119 DE is not uncommon in sports where body
weight control is considered important. Prevalence of eating disorders(DE) in female
elite athletes in leanness sports has been reported to be 46.7% respectively.120
Sundgot-Borgen et al suggested that dieting and frequent weight cycling are important
risk factors for the development of eating disorders in athletes.121
Screening for ED or potential disordered eating is an important part of evaluating
whether an athlete should be allowed to undergo a weight reduction.
Furthermore weight loss may lead to impaired performance in athletes10 either due to
reduced strength and sprint abilities,21;26;122 dehydration or LBM loss or impairment of
cognitive function as discussed earlier. Roemmich et al showed in a prospective study
of wrestlers that body weight, FM and strength decreased during the competitive
season.
Long-tem adverse effects of weight reduction are not well established, but Saarni et
al123 showed that athletes with repeated weight gains and reductions defined as weight
29
Master thesis in Clinical Nutrition, Anu Koivisto 2009
cyclers had significantly higher BMI increase from their twenties until reached middle
age than their controls. The amount of obese subjects was significantly higher among
the weight cyclers, thus past weight cycling had made them more prone for obesity.
To avoid these potential adverse effects athletes and coaches need clear guidelines
about the optimal weight loss methods. It should be emphasized also that thorough
medical and psychological screening of the athlete is required prior to weight
reduction.
2.8 Weight reduction rate
There exist no studies comparing the effects of two different weight reduction rates on
body composition, thyroid hormones or BMR. Some studies have compared small
versus large weight reduction or rapid versus slow weight reduction and looked at
body composition, performance, immunological and psychological parameters in
addition to metabolic changes (see summary of weight loss studies with athletes in
appendix 1). Only a few studies have included a dietary intervention for the weight
loss, most of the studies are observational studies where weight class athletes have
used their own weight loss methods. In most studies dietary composition and the
energy content of the diets has been analysed after the study has been conducted. The
small number of studies might be due to the difficulty in reaching a specific weight
reduction rate because of the large inter-individual variation in response to calorie
restriction and following problems in compliance, and secondly because of the
invasive nature of such a study. Undoubtedly, information about weight reduction’s
effects for athletes’ body composition and metabolism is important for fine-tuning the
weight loss recommendations for this special population.
2.9 Aim of the study
The aim of the study was to determine whether weight reduction at the extremes of the
current recommendations for athletes (0.7%BW/week versus 1.4%BW/week) (SLOW
30
Master thesis in Clinical Nutrition, Anu Koivisto 2009
versus FAST) affects body composition, thyroid hormones and BMR differently. We
hypothesized following:
1. FAST weight reduction results in greater loss of LBM than SLOW weight
reduction.
2. FAST weight reduction results in larger decline in thyroid hormones than
SLOW weight reduction.
3. And thus FAST weight reduction results in larger BMR reduction than SLOW
weight reduction.
4. We expect to find an association between changes in body composition, thyroid
hormones and BMR.
31
Master thesis in Clinical Nutrition, Anu Koivisto 2009
3. Subjects and methods
3.1 Subjects
Thirty-six well trained Norwegian females (n=20) and males (n=17), junior and senior
athletes aged 17-28 years were included in this study. All the athletes were national
team members or students at the Norwegian elite athlete college (Norges
Toppidrettsgymnas, Wang Toppidrettsgymnas). The following types of sports were
represented in this study: technical, endurance, aesthetic, weight-class, ball game,
power and anti-gravitation. The athletes obtained information about the study either
from their sport federations where information bullets and invitation letters were sent
to or when they contacted the department of sports nutrition at the Norwegian Olympic
Sport Centre in order to get assistance in body weight regulation (appendix 4 and 5).
3.1.1 Inclusion and exclusion criteria
Inclusion and exclusion criteria for the subjects in this study are shown in table 3.1.1.
32
Master thesis in Clinical Nutrition, Anu Koivisto 2009
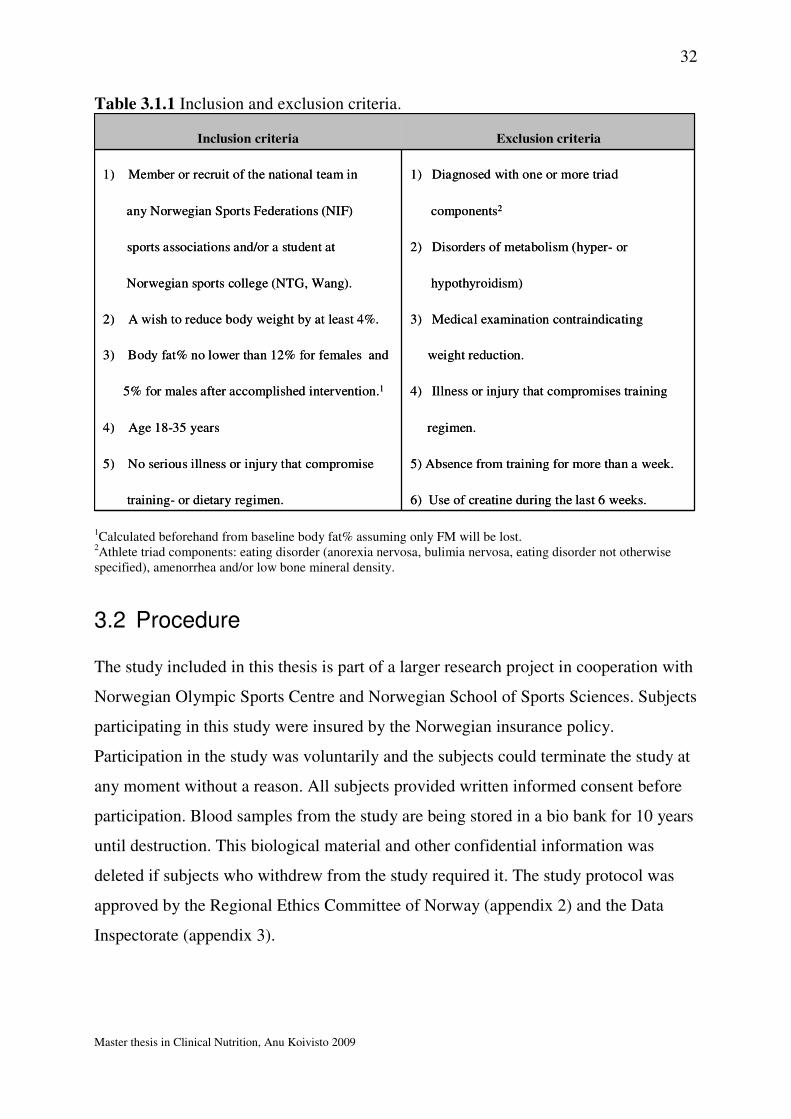
Table 3.1.1 Inclusion and exclusion criteria.
6) Use of creatine during the last 6 weeks.training- or dietary regimen.
5) Absence from training for more than a week.5) No serious illness or injury that compromise
regimen.4) Age 18-35 years
4) Illness or injury that compromises training5% for males after accomplished intervention.1
weight reduction.3) Body fat% no lower than 12% for females and
3) Medical examination contraindicating 2) A wish to reduce body weight by at least 4%.
hypothyroidism)Norwegian sports college (NTG, Wang).
2) Disorders of metabolism (hyper- or sports associations and/or a student at
components2any Norwegian Sports Federations (NIF)
1) Diagnosed with one or more triad 1) Member or recruit of the national team in
Exclusion criteriaInclusion criteria
1Calculated beforehand from baseline body fat% assuming only FM will be lost. 2Athlete triad components: eating disorder (anorexia nervosa, bulimia nervosa, eating disorder not otherwise specified), amenorrhea and/or low bone mineral density.
3.2 Procedure
The study included in this thesis is part of a larger research project in cooperation with
Norwegian Olympic Sports Centre and Norwegian School of Sports Sciences. Subjects
participating in this study were insured by the Norwegian insurance policy.
Participation in the study was voluntarily and the subjects could terminate the study at
any moment without a reason. All subjects provided written informed consent before
participation. Blood samples from the study are being stored in a bio bank for 10 years
until destruction. This biological material and other confidential information was
deleted if subjects who withdrew from the study required it. The study protocol was
approved by the Regional Ethics Committee of Norway (appendix 2) and the Data
Inspectorate (appendix 3).
33
Master thesis in Clinical Nutrition, Anu Koivisto 2009
3.3 Design
3.3.1 Recruitment
Athletes who contacted the department of sports nutrition at Norwegian Olympic
Sports Centre (Olympiatoppen) or Norwegian School of Sports Sciences in order to
get assistance in body weight reduction got verbal and written information about the
research project (appendix 5). The same information was sent to several sports
federations as to recruit subjects (appendix 4). Next the athletes who wished to
participate were invited to a personal consultation where they were provided detailed
information about the project in person. After this consultation the athletes were
directed to a physician for a general medical examination. Their weight reduction
goals were evaluated towards their health, medical history, age, body composition and
athletic career goals. The athletes were also controlled for possible history and/or signs
of eating disorders by means of an initial questionnaire including the eating Disorder
Inventory (EDI)124 followed by a clinical interview. This interview was conducted by a
sports scientist, specialized in eating disorders. The screening included mental and
physical status, questions regarding menstrual history, oral contraceptive use and
pregnancy, weight history, training history and present training volume, dietary
history, possible eating disorders (ED), as well as illness and injury history (appendix
6).
3.3.2 Randomization
The athletes who full filled the inclusion criteria were block randomized to either
weight reduction group with slow weight reduction rate SLOW (weekly reduction of
0.7% of body weight) or to a weight reduction group with FAST weight reduction rate
(weekly reduction of 1.4% of body weight).
34
Master thesis in Clinical Nutrition, Anu Koivisto 2009
BMR = basal metabolic rate
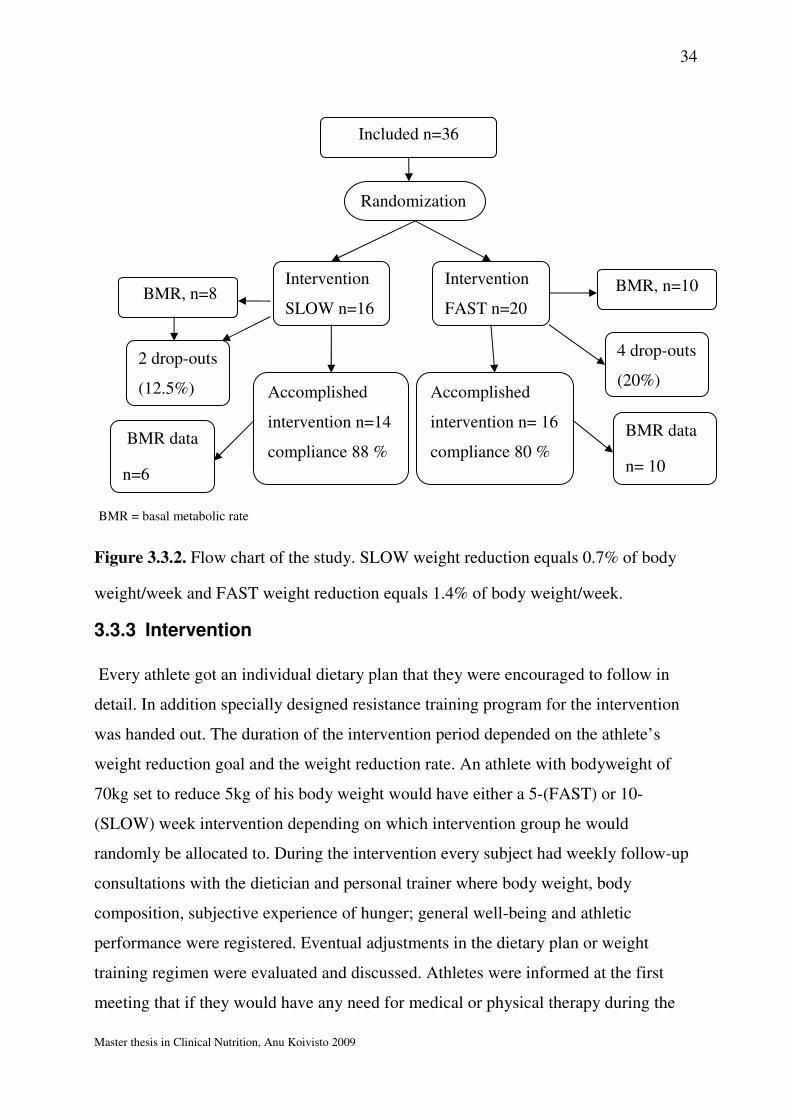
Figure 3.3.2. Flow chart of the study. SLOW weight reduction equals 0.7% of body
weight/week and FAST weight reduction equals 1.4% of body weight/week.
3.3.3 Intervention
Every athlete got an individual dietary plan that they were encouraged to follow in
detail. In addition specially designed resistance training program for the intervention
was handed out. The duration of the intervention period depended on the athlete’s
weight reduction goal and the weight reduction rate. An athlete with bodyweight of
70kg set to reduce 5kg of his body weight would have either a 5-(FAST) or 10-
(SLOW) week intervention depending on which intervention group he would
randomly be allocated to. During the intervention every subject had weekly follow-up
consultations with the dietician and personal trainer where body weight, body
composition, subjective experience of hunger; general well-being and athletic
performance were registered. Eventual adjustments in the dietary plan or weight
training regimen were evaluated and discussed. Athletes were informed at the first
meeting that if they would have any need for medical or physical therapy during the
Included n=36
Intervention
SLOW n=16
Intervention
FAST n=20
Accomplished
intervention n=14
compliance 88 %
Accomplished
intervention n= 16
compliance 80 %
4 drop-outs
(20%)
2 drop-outs
(12.5%)
Randomization
BMR, n=8 BMR, n=10
BMR data
n=6
BMR data
n= 10

35
Master thesis in Clinical Nutrition, Anu Koivisto 2009
intervention this would be provided by the medical staff at the Olympic Sports Centre.
The day before the intervention start and on the day finishing the intervention subjects
underwent the following tests.
1) Measuring the basal metabolic rate (BMR) with indirect calorimeter at 7am.
The subjects spent the night at the Olympic Sports Centre hotel and were
awakened carefully in the morning. The subjects were lying in their beds
relaxed but awake. They were encouraged to avoid any large muscular
movements during the gas sampling.
2) Fasting blood samples for analysis of thyroid stimulating hormone (TSH) and
free thyroxin (f-T4) were collected at 8am.
3) Body composition with DEXA (Dual energy X-ray absorptiometry) was
measured at 9am. The subjects were fasting prior to DEXA measurements.
4) Physical tests were conducted at 11am after the athletes had eaten a
standardized breakfast.
Athletes were encouraged to participate in the study long before the start of their
competitive season to minimize the interference of the intervention with their
competition schedule.
36
Master thesis in Clinical Nutrition, Anu Koivisto 2009
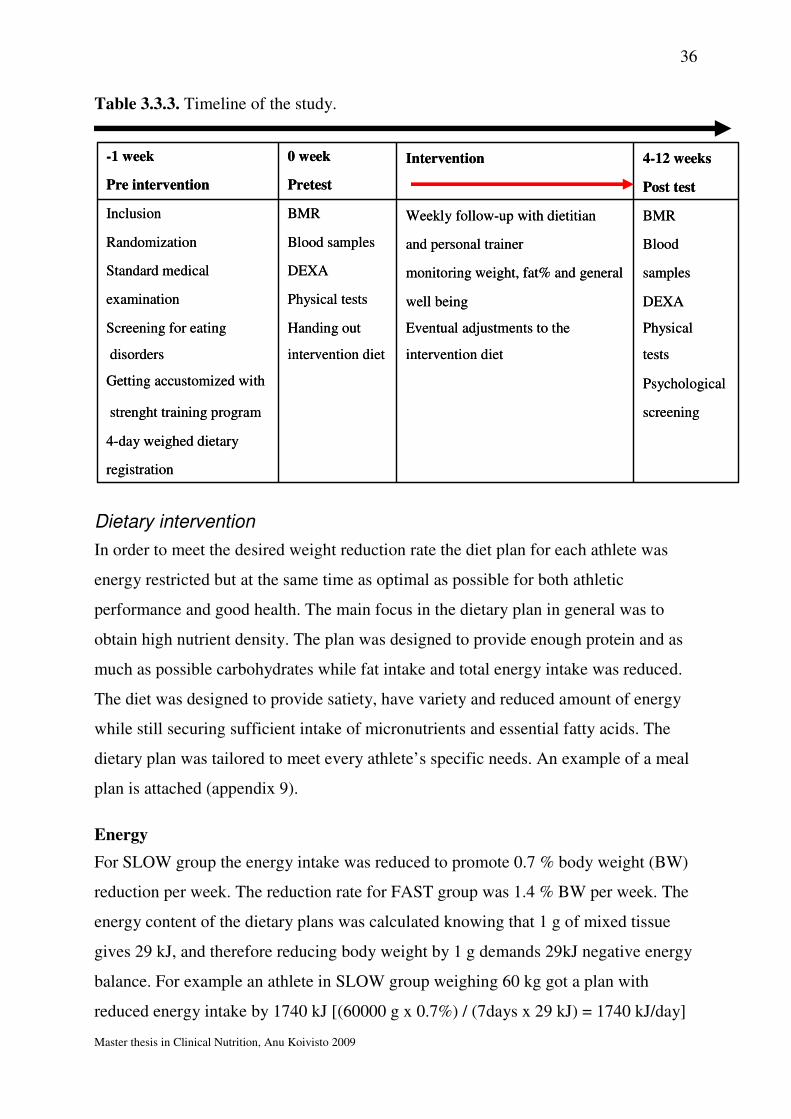
Table 3.3.3. Timeline of the study.
registration
4-day weighed dietary
screeningstrenght training program
PsychologicalGetting accustomized with
testsintervention dietintervention dietdisorders
PhysicalEventual adjustments to theHanding outScreening for eating
DEXAwell beingPhysical testsexamination
samplesmonitoring weight, fat% and general DEXAStandard medical
Bloodand personal trainerBlood samplesRandomization
BMRWeekly follow-up with dietitianBMRInclusion
Post testPretestPre intervention
4-12 weeksIntervention0 week-1 week
Dietary intervention
In order to meet the desired weight reduction rate the diet plan for each athlete was
energy restricted but at the same time as optimal as possible for both athletic
performance and good health. The main focus in the dietary plan in general was to
obtain high nutrient density. The plan was designed to provide enough protein and as
much as possible carbohydrates while fat intake and total energy intake was reduced.
The diet was designed to provide satiety, have variety and reduced amount of energy
while still securing sufficient intake of micronutrients and essential fatty acids. The
dietary plan was tailored to meet every athlete’s specific needs. An example of a meal
plan is attached (appendix 9).
Energy
For SLOW group the energy intake was reduced to promote 0.7 % body weight (BW)
reduction per week. The reduction rate for FAST group was 1.4 % BW per week. The
energy content of the dietary plans was calculated knowing that 1 g of mixed tissue
gives 29 kJ, and therefore reducing body weight by 1 g demands 29kJ negative energy
balance. For example an athlete in SLOW group weighing 60 kg got a plan with
reduced energy intake by 1740 kJ [(60000 g x 0.7%) / (7days x 29 kJ) = 1740 kJ/day]
37
Master thesis in Clinical Nutrition, Anu Koivisto 2009
and would obtain a 420g-weight reduction per week. The lowest allowed energy intake
per day in the dietary plans was set to 6300 kJ. Athletes with the energy intakes below
6700 kJ/day who struggled to meet their weight reduction rate were encouraged to jog
2-3x20 min/week in order to increase their energy expenditure.
Macronutrients
In addition to energy intake the macronutrient intake was carefully planned providing
at least 1.2g protein/kg BW and as close to 5g carbohydrate/kg BW as possible while
still providing the minimum of 20E% from fat.
Micronutrients and supplements
Also micronutrient and fibre intake was to meet the dietary recommendations for the
age group. But a multi-vitamin-mineral supplement (Nycomed, Norwa) was prescribed
to secure the micronutrient intake when energy intake was very low (< 6700kJ). Since
the fat intake was relatively low every athlete was told to take cod liver oil (Møller’s
cod liver oil, Norway) daily either as 2 capsules or 5ml liquid supplement to provide
omega 3 supplements and A, D and E vitamins. Furthermore if the blood samples or
DEXA measurements indicated any other specific micronutrient needs (iron, calcium)
these vitamins were provided to the athletes and biochemical changes were monitored.
Meal pattern
A very important aspect in the dietary plan was meal pattern. The athletes were
recommended to eat every 3rd hour and have 5-7 meals depending on how many daily
work-outs they had. They ingested an recovery meal containing carbohydrates (26-35
g) and protein of high biological value (5-10 g) immediately after every work-out and
were exhorted to eat a balanced meal within 2 hours to obtain the recommended
amount of protein (6-12 g essential amino acids) and carbohydrate 1g/kg BW to
promote post exercise recovery.28 As the athletes began to follow the dietary plan they
were encouraged to use a kitchen scale to ensure correct portion sizes.
Fluids and snacks
They were persuaded to drink minimum 0.5L/hour of fluids during the work-outs and
2 litres of fluids otherwise during the day. Intake of low calorie beverages (non
38
Master thesis in Clinical Nutrition, Anu Koivisto 2009
sugared tea, light soft drinks, artificially sweetened fluids) were not restricted but
consumption was registered to avoid high (>1.5L) intakes. Artificially sweetened
chewing gum and candy intake was not limited either though athletes were warned
about the laxative effect of those products at high doses. If the athletes were unable to
follow the dietary plan they were instructed to write down every deviation from the
meal plan. The subjects had a possibility to snack vegetables in the evenings if they
wished to.
Resistance training intervention
Participants performed strength training four days per week. The strength training
program was designed to stimulate muscular hypertrophy and increase lean body mass
(LBM) and power under the weight reduction period. The program was designed by an
experienced strength training coach at the Norwegian Olympic Sports Centre
(appendix 8). Before the intervention started, all athletes got an appointment with their
personal trainer to go through the strength training program and the test exercises. The
training program was periodized and added to subjects’ existing training regimen only
replacing eventual strength training work-outs in their regular training regimen. One of
the four weekly work-outs had to be carried out at the Norwegian Olympic Sports
Centre under the supervision of a personal trainer working with the project. This
weekly control had an injury preventive purpose. It also provided an opportunity to
follow athletes’ progress closely and encourage them to follow the work-out plan. The
strength training program was adjusted for participants with shorter than 8-week
intervention so that they could complete the planned progression in the training
program.
3.4 Measurements
3.4.1 Dietary registration
During the last two weeks prior to intervention the athletes conducted a 4-day weighed
dietary registration, where 3 of the 4 consecutive days were weekdays and one of them
was either a Saturday or Sunday. Athletes received registration schemes (appendix 7),
39
Master thesis in Clinical Nutrition, Anu Koivisto 2009
kitchen scales (Philips Essence HR-2393) with accuracy of 1g and thorough
instructions from the dietician for conducting the registration as precisely as possible
(attachment 4). Athletes were guided to continue with their regular eating and training
habits during the whole registration period. They were told to weigh and write down
everything they ate and drank including information about the brands and types of the
food items consumed and the time of consumption. Athletes were also advised to write
down recipes for mixed dishes they prepared themselves or knew the type and amount
of the ingredients in. The kitchen scales had a reset function which made registration
of mixed meals easier. If athletes dined in restaurants or cafeterias where they didn’t
want to use the kitchen scale they were told to estimate the amount of foods with
regular household devices. Athletes were encouraged to avoid travelling during the
registration period to minimise consumption of dishes and food items with unknown
nutritional content. Intakes of any supplements that could contain illegal substances or
were in conflict with the guidelines provided by the nutrition department of the
Norwegian Olympic Sports Centre were forbidden.
3.4.2 Diet analysis
The dietary registrations were analysed with a computer program Mat på Data version
5.0.125 Mat på data is based on the Norwegian food composition table where the
energy and nutrient content of food items and prepared food dishes are presented 126.
All tabular values refer to content per 100g edible food i.e. without skin, shell, bone,
peel, core or other parts which are not normally eaten. The protein content in the food
composition table is calculated on the basis of the analysed content of nitrogen. The
software gives also the amount of total fat and fatty acids (saturated, trans unsaturated,
cis unsaturated and cis polyunsaturated) and cholesterol. Carbohydrates are divided
into following subgroups; fibre, total carbohydrate, starch, mono- and disaccharides
and added sugar. In our analysis we looked only at total carbohydrate and protein
intake in grams and how much these macronutrients in addition to fat contributed to
total energy intake. Based on the analysis of the dietary registration the same dietician
then designed an individual dietary plan for each athlete. Body weight changes were
40
Master thesis in Clinical Nutrition, Anu Koivisto 2009
controlled weekly during intervention and when weight reduction rate was not reached
the individual dietary plan was adjusted.
3.4.3 Body composition
Body composition measurements were done by dual energy x-ray absorptiometry
(DEXA) (GE Medical Systems, Lunar). DEXA was used for measuring body
composition before and after the intervention period. Harpenden caliper (Baty
International) was implicated weekly as a part of the follow-up monitoring body
composition changes during weight reduction, but caliper data is not shown in this
thesis. During the weekly follow-up also body weight was registered. For that purpose
athletes used their own regular scales at home. They were instructed to weigh
themselves with empty bladder right after waking-up and before eating breakfast.
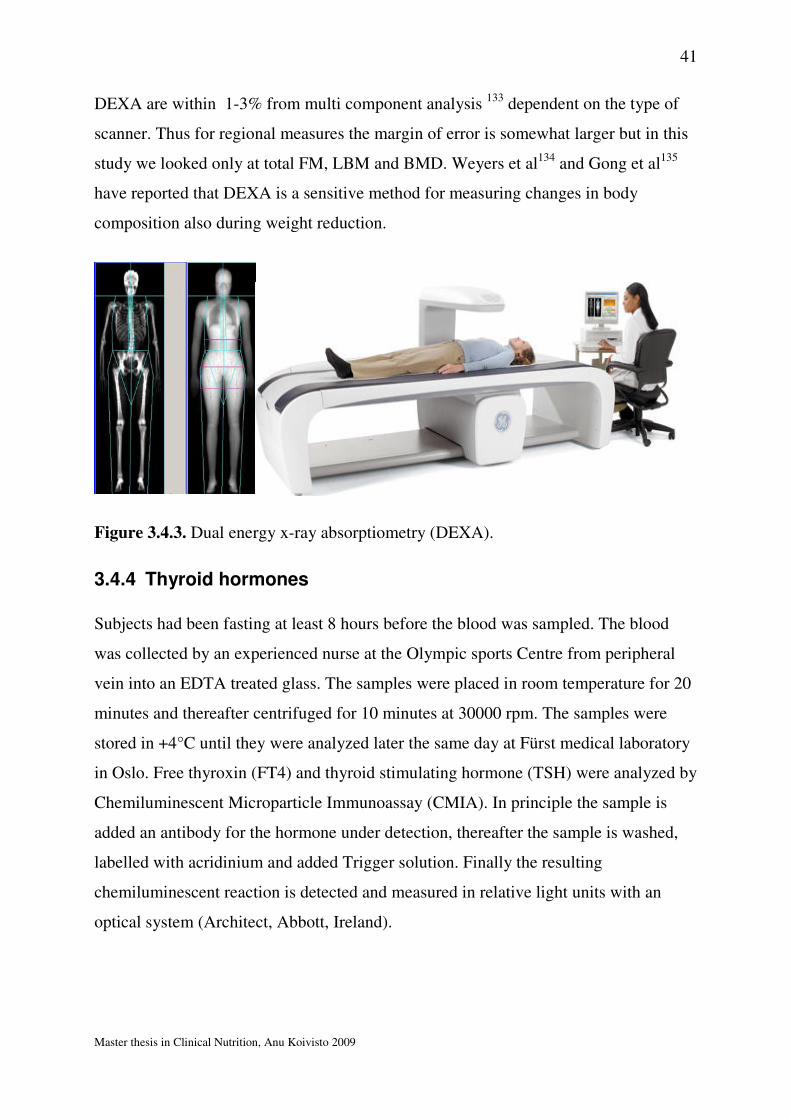
Dual energy X-ray absorptiometry (DEXA)
The amount of lean body mass (LBM) and fat mass (FM) as well as bone mineral
density (BMD) and fat percentage were measured with DEXA (GE Medical Systems,
Lunar) at the Volvat medical centre in Oslo. The DEXA machine sends a thin,
invisible beam of low dose x-rays with two distinct energy peaks through the body
parts being examined. One peak is absorbed mainly by the soft tissue and the other by
bone. This makes it possible to distinguish between the different tissue types. During
the measurement the patient is laying on his back with arms on the sides and palms
facing down. Legs and feet are loosely strapped together and toes are pointing upward.
The patient is directed to avoid any movement to minimize the motion artefacts. The
x-ray source is mounted under the bench and the detector is placed above the bench.
As the whole body scan takes only 20-30 minutes and the radiation dose is very low 1-
5µSv (which is equivalent with 10 chest x-rays) DEXA scan is a very lucrative method
for precise body composition measurements127. To obtain an accurate measurement the
personnel at the Volvat medical centre calibrate the DEXA system daily. This method
has been validated several times128;129;129-131. DEXA Lunar Prodigy Total body scan
has a coefficient of variation (CV) of ~1% for bone mineral density (BMD) and ~1 %
for total body, and up to 7% for regional measures132. Estimates of body fat with
41
Master thesis in Clinical Nutrition, Anu Koivisto 2009
DEXA are within 1-3% from multi component analysis 133 dependent on the type of
scanner. Thus for regional measures the margin of error is somewhat larger but in this
study we looked only at total FM, LBM and BMD. Weyers et al134 and Gong et al135
have reported that DEXA is a sensitive method for measuring changes in body
composition also during weight reduction.
Figure 3.4.3. Dual energy x-ray absorptiometry (DEXA).
3.4.4 Thyroid hormones
Subjects had been fasting at least 8 hours before the blood was sampled. The blood
was collected by an experienced nurse at the Olympic sports Centre from peripheral
vein into an EDTA treated glass. The samples were placed in room temperature for 20
minutes and thereafter centrifuged for 10 minutes at 30000 rpm. The samples were
stored in +4°C until they were analyzed later the same day at Fürst medical laboratory
in Oslo. Free thyroxin (FT4) and thyroid stimulating hormone (TSH) were analyzed by
Chemiluminescent Microparticle Immunoassay (CMIA). In principle the sample is
added an antibody for the hormone under detection, thereafter the sample is washed,
labelled with acridinium and added Trigger solution. Finally the resulting
chemiluminescent reaction is detected and measured in relative light units with an
optical system (Architect, Abbott, Ireland).
42
Master thesis in Clinical Nutrition, Anu Koivisto 2009
3.4.5 Indirect calorimetry
For measuring basal metabolic rate we used Douglas bag. Douglas bag technique is
highly operator dependent and under optimal conditions the margin of error is small
<3%.128 It is an indirect calorimetry method that is used for examining energy
expenditure and substrate oxidation in humans. It is an open-circuit calorimeter where
the system’s both ends are open for atmospheric pressure and where the subject’s
inhaled and exhales air is kept separate by means of a three-way respiratory valve. The
expired gasses are collected to an air tight Douglas bag for analysis. When gas
collections were made the subjects had been fasting for 12 hours and had restrained
from hard physical activity 24 hours before. During the measurements the subjects
were lying relaxed in the bed in a silent, dark and temperate environment (22-24°C)
with the mouth piece correctly placed and a nose clip to avoid respiration through the
nose. The pulse was monitored throughout the night and during gas collection with a
pulse watch (Polar, RS400) as to see if subjects’ heart rate increased due to the
procedure. The gas collection lasted 20-30 min and the gasses were collected in 2
separate bags with maximum volume of 100 litres. The collected gas volume (Flow
turbine type K202, KL Engineering Madison, WI, USA) and gas concentration
(oxygen analyser type S-3A; carbon dioxide analyser type CD-3A, Amatek Corporate,
Paoli, PA, USA) of the bags were analysed within 15min after collection. The gas
analysers were calibrated against certiWed gasses of known concentration prior to
each test and the ventilation sensors were calibrated frequently with a 3l-syringe. The
following formula was applied to calculate the daily basal metabolic rate (BMR) from
the data obtained from gas analysis: VO2 (l) x [(1.1 x RQ1) + 3.9].136 The ratio between
the gasses (respiratory quotient, RQ) tells which substrates (carbohydrate, fat, protein)
the body is oxidising. Some equations require collection of diurnal urine for
establishing nitrogen balance and estimating protein turnover in addition to BMR. We
used Weir’s equation that doesn’t require urine collection to minimize the stress for
subjects.
43
Master thesis in Clinical Nutrition, Anu Koivisto 2009
Cunningham equation was also applied to estimate resting metabolic rate (RMR) in
every subject [RMR = 500 + 22 (LBM)]137. Cunningham equation is based on LBM
and is considered to be the best equation in predicting RMR values in athletes.138
3.5 Statistical analysis
For all statistical analysis SPSS version 14.0 (SPSS Inc., Chicago, IL, USA) was
applied. Distribution of data was analysed with Kolmogorov- Smirnov and Shapiro-
Wilk tests. The changes in body weight, LBM, FM, fat%, TSH, f-T4 and BMR within
the groups from baseline were analysed with paired samples t-test (for variables with
normal distribution) or Wilcoxon ranked sign test (for variables that were not normally
distributed). Whether the changes resulting from the interventions were statistically
different between the groups was analysed by independent samples t-test or Mann
Whitney’s test for nonparametric data. Correlation analysis was conducted either with
Spearman (non parametric correlation) or Pearson’s method. To evaluate the linear
relationship between two variables simple linear regression analysis were performed.
For analysis of frequency tables Chi squared distribution was used. The significance
level was set to p< 0.05 and all the tests were analysed two-sided. Trend is defined as
p< 0.1.
3.5.1 Sample size estimation
The sample size was estimated using Altman’s nomogram 139. The power of the study
was set to 80% (1-ß=80) and the two-sided significance level to 0.05 (α=0.05).
Standardised difference was calculated for f-T4 which was expected to require the
greatest number of subjects. Clinically relevant difference (δ) for %change for f-T4
was set to 5% and standard deviation was estimated to be 8.5%. Standardised
difference was calculated by the following formulae for paired data: 2δ/s= 1.18 and for
two independent samples analysis δ/s=0.6. This equals a sample size of 23 and 85
subjects respectively. In our study due to ethical and economic reasons in addition to
time pressure sample size was set to 30 subjects. This gives an appropriate power of

44
Master thesis in Clinical Nutrition, Anu Koivisto 2009
the study for paired analysis but for the in between group comparisons the power is
somewhat reduced.
3.5.2 Missing data
In FAST weight reduction group one subject’s pre intervention blood sample analysis
was lacking data of TSH and free T4. This missing data was replaced with the group
mean of successfully analysed blood samples for TSH and free T4.
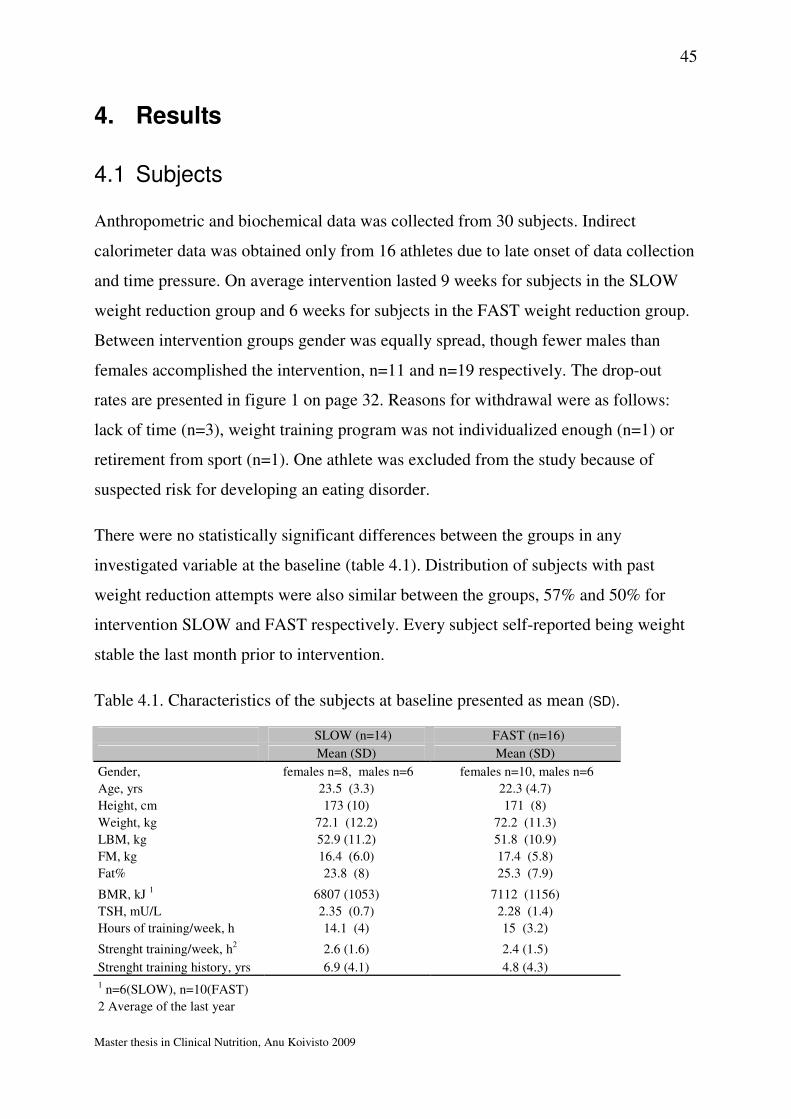
45
Master thesis in Clinical Nutrition, Anu Koivisto 2009
4. Results
4.1 Subjects
Anthropometric and biochemical data was collected from 30 subjects. Indirect
calorimeter data was obtained only from 16 athletes due to late onset of data collection
and time pressure. On average intervention lasted 9 weeks for subjects in the SLOW
weight reduction group and 6 weeks for subjects in the FAST weight reduction group.
Between intervention groups gender was equally spread, though fewer males than
females accomplished the intervention, n=11 and n=19 respectively. The drop-out
rates are presented in figure 1 on page 32. Reasons for withdrawal were as follows:
lack of time (n=3), weight training program was not individualized enough (n=1) or
retirement from sport (n=1). One athlete was excluded from the study because of
suspected risk for developing an eating disorder.
There were no statistically significant differences between the groups in any
investigated variable at the baseline (table 4.1). Distribution of subjects with past
weight reduction attempts were also similar between the groups, 57% and 50% for
intervention SLOW and FAST respectively. Every subject self-reported being weight
stable the last month prior to intervention.
Table 4.1. Characteristics of the subjects at baseline presented as mean (SD).
SLOW (n=14) FAST (n=16)
Mean (SD) Mean (SD)
Gender, females n=8, males n=6 females n=10, males n=6
Age, yrs 23.5 (3.3) 22.3 (4.7)
Height, cm 173 (10) 171 (8)
Weight, kg 72.1 (12.2) 72.2 (11.3)
LBM, kg 52.9 (11.2) 51.8 (10.9)
FM, kg 16.4 (6.0) 17.4 (5.8)
Fat% 23.8 (8) 25.3 (7.9)
BMR, kJ 1 6807 (1053) 7112 (1156)
TSH, mU/L 2.35 (0.7) 2.28 (1.4)
Hours of training/week, h 14.1 (4) 15 (3.2)
Strenght training/week, h2 2.6 (1.6) 2.4 (1.5)
Strenght training history, yrs 6.9 (4.1) 4.8 (4.3)
1 n=6(SLOW), n=10(FAST)
2 Average of the last year

46
Master thesis in Clinical Nutrition, Anu Koivisto 2009
4.2 Diet
The average energy intake was reduced from 9708 kJ to 7999 kJ in the SLOW weight
reduction group and from 9788kJ to 7018 kJ in the FAST weight reduction group. The
percentage change in energy intake was significantly greater for the FAST (p=0.02)
than for the SLOW weight reduction group as planned. The intervention diet was not
statistically different between the groups in any other parameter than energy intake.
The energy and macronutrient content in gram per kg body weight of the 4 day
weighed registration and intervention diets for the SLOW and the FAST weight
reduction groups are presented in table 4.2, and the composition of the diets is shown
in figure 4.3.
Table 4.2. Energy, carbohydrate (CHO) and protein (PRO) intake.
Nutrient Group 4-d weighed registration
Intervention
Diet % Change
median (95% CI) median (95% CI) median (95%CI) p-value*
Energy, MJ SLOW1 9.7 (7.4 , 12.6) 8.0 (6.6 , 10.5) -20 %** (-3 , -32) 0.004
FAST2 9.8 (8.1 , 11.5) 7.0 (6.4 , 7.4) -31 %** (-21 , -37) 0.001
CHO, g/kg BW SLOW 3.9 (2.8 , 5.2) 3.5 (2.9 , 4.5) -9 % (-21 , 11) 0.053
FAST 4.0 (3.2 , 4.5) 3.2 (2.6 , 3.6) -22 % (-28 , -3) <0.001
PRO, g/kg BW SLOW 1.4 (1.1 , 1.7) 1.6 (1.2 , 1.9 15 % (-7 , 33) 0.025
FAST 1.5 (1.0 , 1.7) 1.4 (1.2 , 1.5) -9 % (-22 , 20) 0.297
* Difference between 4-d weighed registration and intervention diet ** Between groups comparison, p <0.05 1 n=14 2 n=16
51 %
25 %
30 %
54 %
25 %21 %
0 %
10 %
20 %
30 %
40 %
50 %
60 %
E%CHO E% PRO E%FAT
Dietary registration
Intervention diet
50 %
24 %
31 %
56 %
24 %20 %
0 %
10 %
20 %
30 %
40 %
50 %
60 %
E%CHO E% PRO E%FAT
Figure 4.3 Macronutrient composition of the 4-day dietary registrations and
intervention diets.
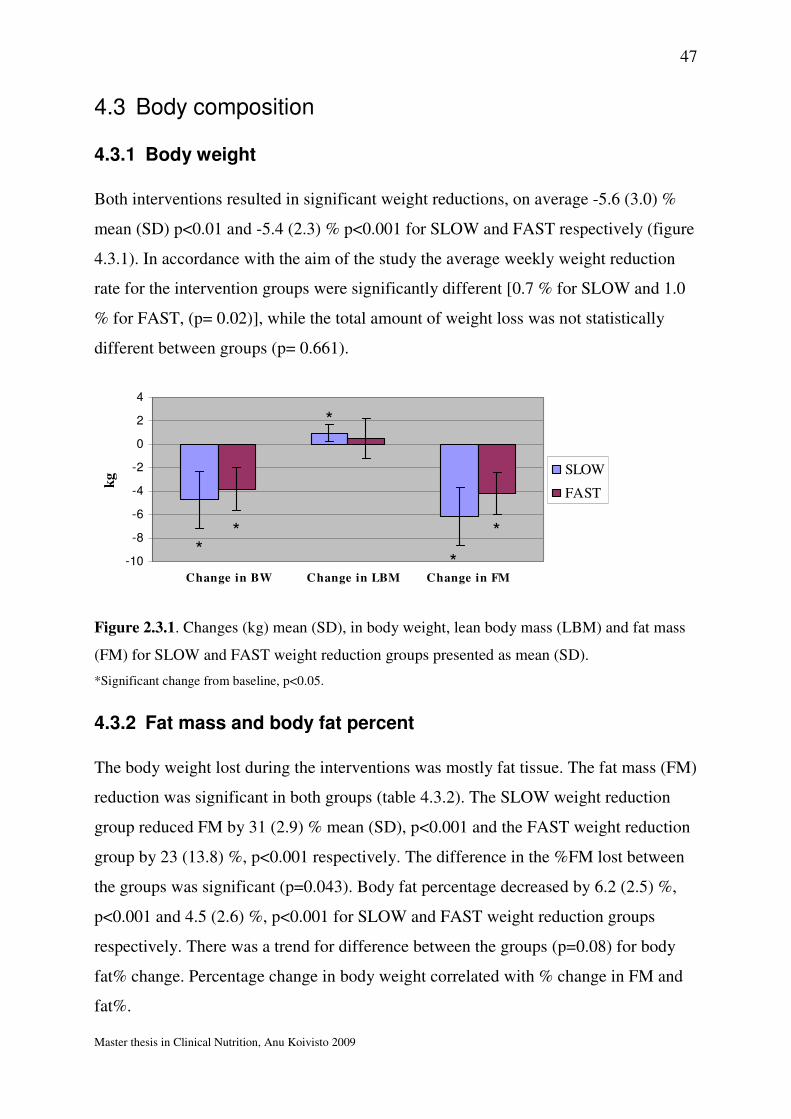
47
Master thesis in Clinical Nutrition, Anu Koivisto 2009
4.3 Body composition
4.3.1 Body weight
Both interventions resulted in significant weight reductions, on average -5.6 (3.0) %
mean (SD) p<0.01 and -5.4 (2.3) % p<0.001 for SLOW and FAST respectively (figure
4.3.1). In accordance with the aim of the study the average weekly weight reduction
rate for the intervention groups were significantly different [0.7 % for SLOW and 1.0
% for FAST, (p= 0.02)], while the total amount of weight loss was not statistically
different between groups (p= 0.661).
-10
-8
-6
-4
-2
0
2
4
Change in BW Change in LBM Change in FM
kg SLOW
FAST
**
*
*
*
Figure 2.3.1. Changes (kg) mean (SD), in body weight, lean body mass (LBM) and fat mass
(FM) for SLOW and FAST weight reduction groups presented as mean (SD).
*Significant change from baseline, p<0.05.
4.3.2 Fat mass and body fat percent
The body weight lost during the interventions was mostly fat tissue. The fat mass (FM)
reduction was significant in both groups (table 4.3.2). The SLOW weight reduction
group reduced FM by 31 (2.9) % mean (SD), p<0.001 and the FAST weight reduction
group by 23 (13.8) %, p<0.001 respectively. The difference in the %FM lost between
the groups was significant (p=0.043). Body fat percentage decreased by 6.2 (2.5) %,
p<0.001 and 4.5 (2.6) %, p<0.001 for SLOW and FAST weight reduction groups
respectively. There was a trend for difference between the groups (p=0.08) for body
fat% change. Percentage change in body weight correlated with % change in FM and
fat%.

48
Master thesis in Clinical Nutrition, Anu Koivisto 2009
Table 4.3.2. Body composition pre and post intervention in SLOW and FAST weight
reduction groups presented as mean (SD).
Group N Weight, kg LBM, kg FM, kg Body fat %
SLOW 14 Pre 72.1 (12.2) 52.9 (11.2) 16.4 (6.0) 23.8 (8.0)
Post 68.0 (11.0)* 53.9 (11.2)* 11.3 (4.4)* 17.6 (7.1)*
FAST 16 Pre 72.2 (11.3) 51.8 (10.9) 17.4 (5.8) 25.3 (7.9)
Post 68.3 (10.3)* 52.2 (9.9) 13.7 (5.9)* 20.8 (8.1)*
*Significantly different from baseline p-value <0,001
4.3.3 Lean body mass
The weight reduction interventions in this study did not result in lean body mass
(LBM) losses (table 4.3.2). The SLOW weight reduction group had a significant
increase in LBM [2.0 (1.3) % mean (SD), p < 0.001] during weight reduction, while
the FAST intervention did not result in any significant changes in LBM [1.1 (3.0) %,
p=0.3] from baseline. LBM changes did not differ significantly between the
interventions.
But when LBM changes were analysed by gender, males in the SLOW weight
reduction had a significantly greater increase in LBM [1.8 (1.0) %, p=0.003] compared
with the FAST weight loss [-2.0 (2.2) %, p=0.115], (p=0.004). Females in both SLOW
and FAST weight reduction had significant increases in LBM (figure 4.3.3). But the
changes between the groups did not differ significantly (p=0.7). Females obtained a
larger %LBM gain than males (p=0.008) regardless of intervention.
-4
-3
-2
-1
0
1
2
3
Males Females
Change
in L
BM
, kg
SLOW
FAST
* * *
Figure 4.3.3.Change in LBM [mean(SD)] by gender in SLOW and FAST weight reduction.
*Change from baseline, p<0.05

49
Master thesis in Clinical Nutrition, Anu Koivisto 2009
There was an inverse relationship between relative change in LBM and baseline LBM
(r2=0.24, 95% CI (-0.002, 0.00), p=0.006) (figure 3.3.4.). There was also an
association between subjects’ weight, but not FM, at the baseline and percentage
change in LBM (r=0.431, p=0.018).
Figure 3.3.4. Relationship between baseline LBM and %change in LBM with 95% CI
for mean.
Weekly weight reduction rate was not correlated with any body composition
parameter. But there was a significant correlation between time in intervention and
changes in LBM (r=0.4, p=0.045).
4.3.4 Bone mineral density (BMD)
There were no statistical differences in BMD at the baseline between the groups. BMD
did not change significantly for either SLOW (p= 0.657) or FAST (p=0.375) weight
reduction group.
7.5 5.0 2.50.0-2.5 -5.0
% change in LBM
80.0
70.0
60.0
50.0
40.0
LB
M a
t b
asel
ine,
kg
FAST SLOW
R Sq Linear = 0.24
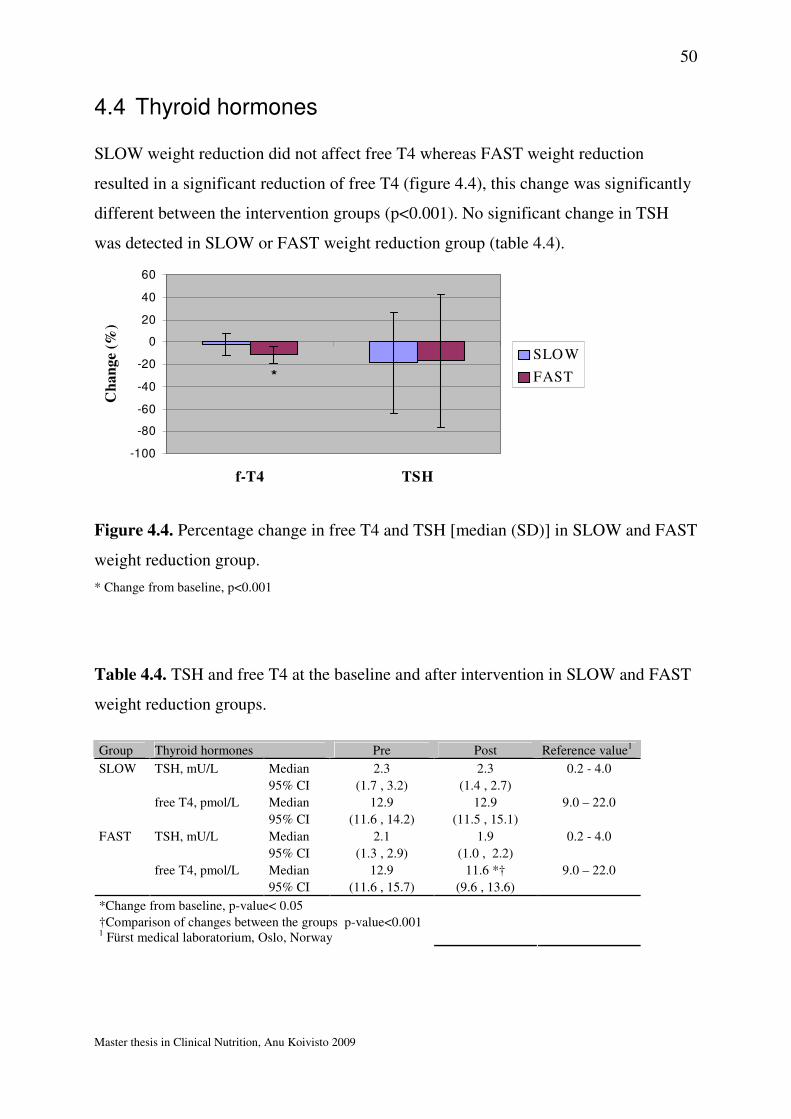
50
Master thesis in Clinical Nutrition, Anu Koivisto 2009
4.4 Thyroid hormones
SLOW weight reduction did not affect free T4 whereas FAST weight reduction
resulted in a significant reduction of free T4 (figure 4.4), this change was significantly
different between the intervention groups (p<0.001). No significant change in TSH
was detected in SLOW or FAST weight reduction group (table 4.4).
-100
-80
-60
-40
-20
0
20
40
60
f-T4 TSH
Ch
an
ge
(%)
SLOW
FAST*
Figure 4.4. Percentage change in free T4 and TSH [median (SD)] in SLOW and FAST
weight reduction group.
* Change from baseline, p<0.001
Table 4.4. TSH and free T4 at the baseline and after intervention in SLOW and FAST
weight reduction groups.
Group Thyroid hormones Pre Post Reference value1
SLOW TSH, mU/L Median 2.3 2.3 0.2 - 4.0
95% CI (1.7 , 3.2) (1.4 , 2.7)
free T4, pmol/L Median 12.9 12.9 9.0 – 22.0
95% CI (11.6 , 14.2) (11.5 , 15.1)
FAST TSH, mU/L Median 2.1 1.9 0.2 - 4.0
95% CI (1.3 , 2.9) (1.0 , 2.2)
free T4, pmol/L Median 12.9 11.6 *† 9.0 – 22.0
95% CI (11.6 , 15.7) (9.6 , 13.6)
*Change from baseline, p-value< 0.05
†Comparison of changes between the groups p-value<0.001 1 Fürst medical laboratorium, Oslo, Norway
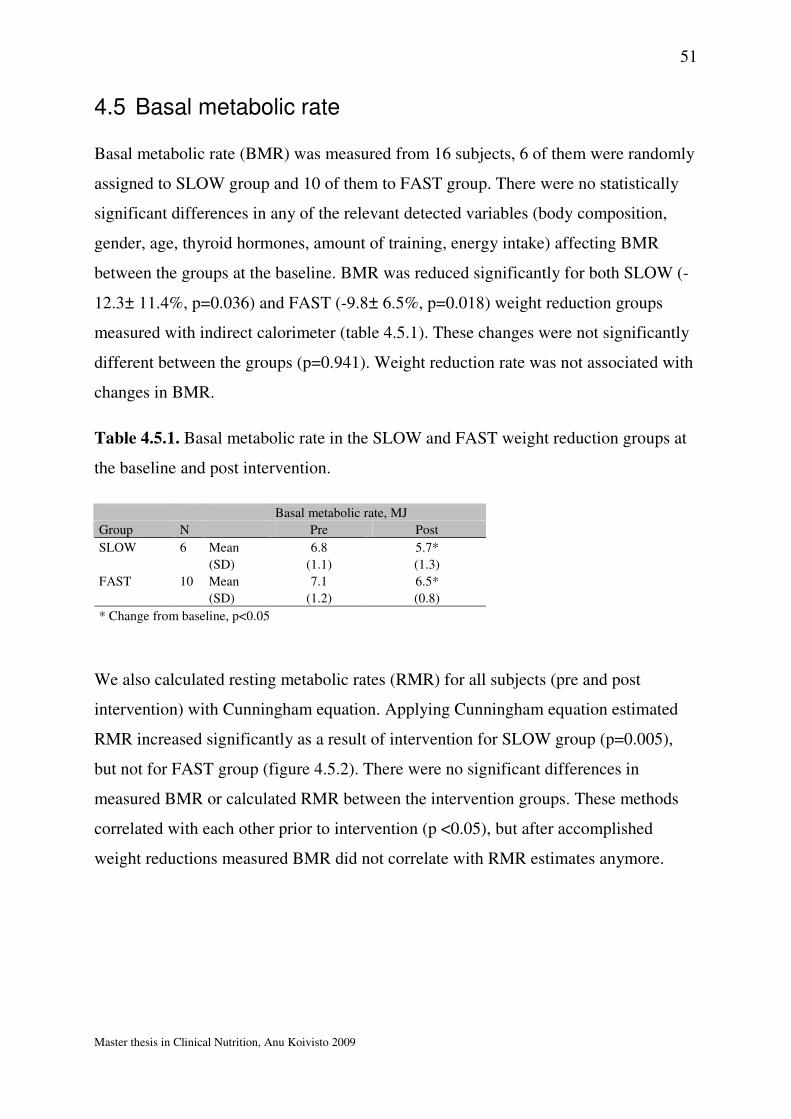
51
Master thesis in Clinical Nutrition, Anu Koivisto 2009
4.5 Basal metabolic rate
Basal metabolic rate (BMR) was measured from 16 subjects, 6 of them were randomly
assigned to SLOW group and 10 of them to FAST group. There were no statistically
significant differences in any of the relevant detected variables (body composition,
gender, age, thyroid hormones, amount of training, energy intake) affecting BMR
between the groups at the baseline. BMR was reduced significantly for both SLOW (-
12.3± 11.4%, p=0.036) and FAST (-9.8± 6.5%, p=0.018) weight reduction groups
measured with indirect calorimeter (table 4.5.1). These changes were not significantly
different between the groups (p=0.941). Weight reduction rate was not associated with
changes in BMR.
Table 4.5.1. Basal metabolic rate in the SLOW and FAST weight reduction groups at
the baseline and post intervention.
Basal metabolic rate, MJ
Group N Pre Post
SLOW 6 Mean 6.8 5.7*
(SD) (1.1) (1.3)
FAST 10 Mean 7.1 6.5*
(SD) (1.2) (0.8)
* Change from baseline, p<0.05
We also calculated resting metabolic rates (RMR) for all subjects (pre and post
intervention) with Cunningham equation. Applying Cunningham equation estimated
RMR increased significantly as a result of intervention for SLOW group (p=0.005),
but not for FAST group (figure 4.5.2). There were no significant differences in
measured BMR or calculated RMR between the intervention groups. These methods
correlated with each other prior to intervention (p <0.05), but after accomplished
weight reductions measured BMR did not correlate with RMR estimates anymore.
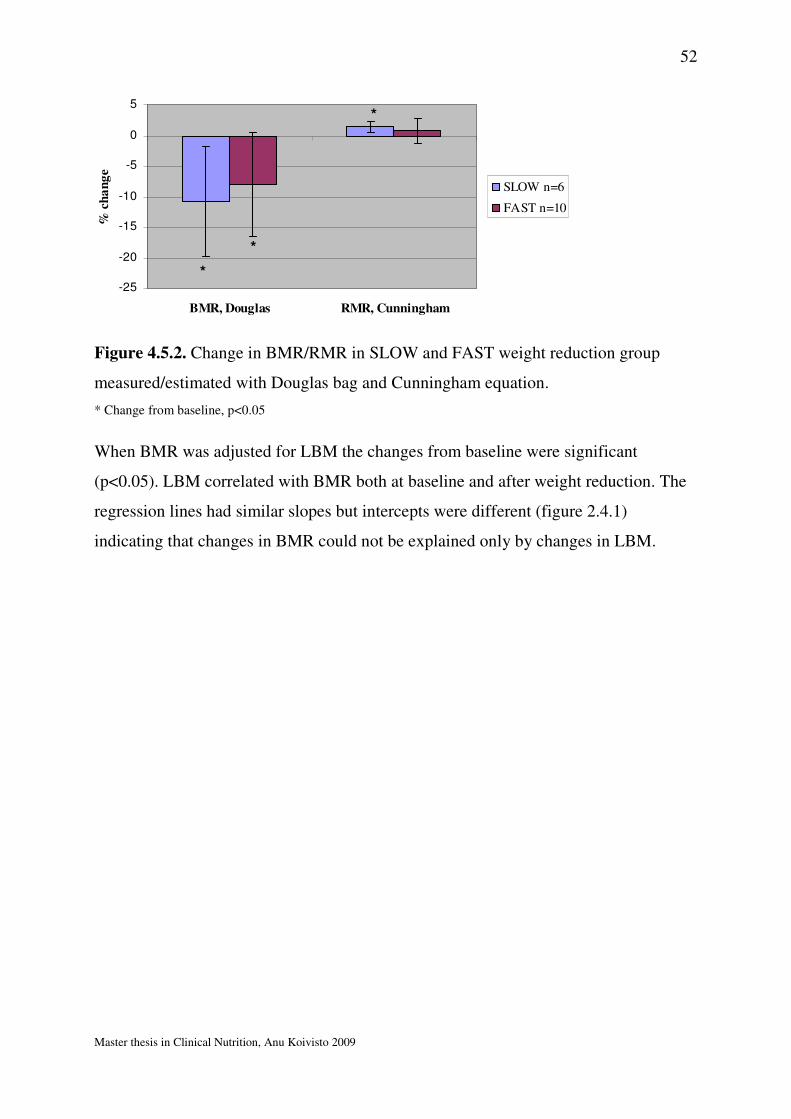
52
Master thesis in Clinical Nutrition, Anu Koivisto 2009
-25
-20
-15
-10
-5
0
5
BMR, Douglas RMR, Cunningham
% c
ha
ng
e
SLOW n=6
FAST n=10
*
*
*
Figure 4.5.2. Change in BMR/RMR in SLOW and FAST weight reduction group
measured/estimated with Douglas bag and Cunningham equation.
* Change from baseline, p<0.05
When BMR was adjusted for LBM the changes from baseline were significant
(p<0.05). LBM correlated with BMR both at baseline and after weight reduction. The
regression lines had similar slopes but intercepts were different (figure 2.4.1)
indicating that changes in BMR could not be explained only by changes in LBM.
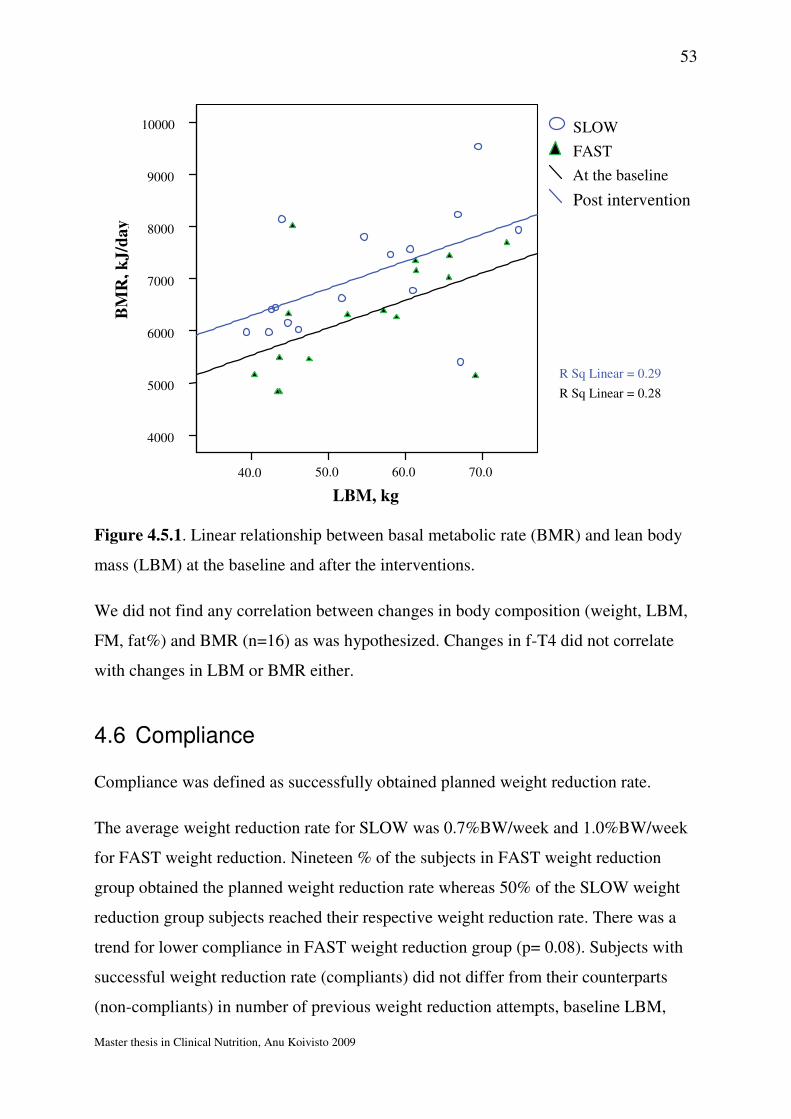
53
Master thesis in Clinical Nutrition, Anu Koivisto 2009
Figure 4.5.1. Linear relationship between basal metabolic rate (BMR) and lean body
mass (LBM) at the baseline and after the interventions.
We did not find any correlation between changes in body composition (weight, LBM,
FM, fat%) and BMR (n=16) as was hypothesized. Changes in f-T4 did not correlate
with changes in LBM or BMR either.
4.6 Compliance
Compliance was defined as successfully obtained planned weight reduction rate.
The average weight reduction rate for SLOW was 0.7%BW/week and 1.0%BW/week
for FAST weight reduction. Nineteen % of the subjects in FAST weight reduction
group obtained the planned weight reduction rate whereas 50% of the SLOW weight
reduction group subjects reached their respective weight reduction rate. There was a
trend for lower compliance in FAST weight reduction group (p= 0.08). Subjects with
successful weight reduction rate (compliants) did not differ from their counterparts
(non-compliants) in number of previous weight reduction attempts, baseline LBM,
70.0 60.0 50.040.0
10000
9000
8000
7000
6000
5000
4000
Post intervention
At the baseline
FAST
SLOW
R Sq Linear = 0.28
R Sq Linear = 0.29
LBM, kg
BM
R,
kJ
/da
y
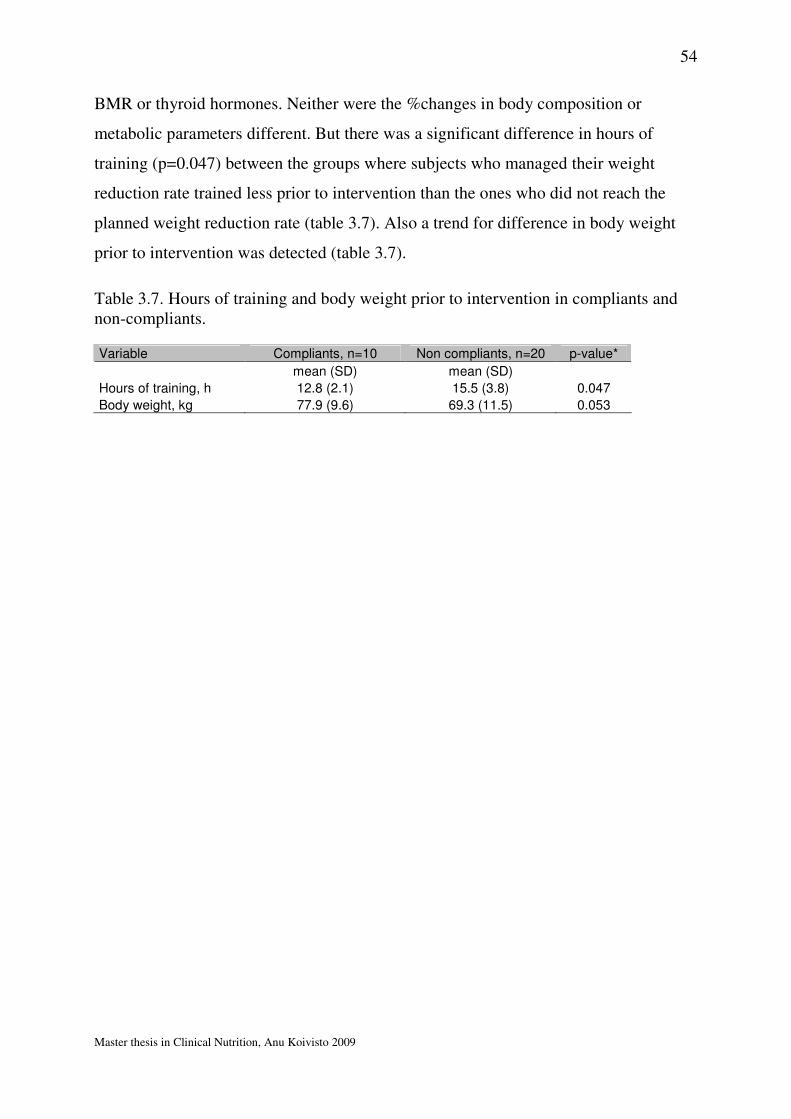
54
Master thesis in Clinical Nutrition, Anu Koivisto 2009
BMR or thyroid hormones. Neither were the %changes in body composition or
metabolic parameters different. But there was a significant difference in hours of
training (p=0.047) between the groups where subjects who managed their weight
reduction rate trained less prior to intervention than the ones who did not reach the
planned weight reduction rate (table 3.7). Also a trend for difference in body weight
prior to intervention was detected (table 3.7).
Table 3.7. Hours of training and body weight prior to intervention in compliants and non-compliants.
Variable Compliants, n=10 Non compliants, n=20 p-value*
mean (SD) mean (SD)
Hours of training, h 12.8 (2.1) 15.5 (3.8) 0.047
Body weight, kg 77.9 (9.6) 69.3 (11.5) 0.053
55
Master thesis in Clinical Nutrition, Anu Koivisto 2009
5. Discussion
We studied the effect of two different weight reduction rates on body composition,
thyroid hormones and basal metabolic rate. Both interventions resulted in significant
reduction of body weight, FM, fat% and BMR. Only SLOW weight reduction resulted
in significant increase of LBM. And only FAST weight reduction resulted in
significant reduction of f-T4. The differences between the groups were significant only
in %change in FM, LBM for males and f-T4.
5.1 Subjects
There were 38 potential athletes of whom 36 were included in this study. Thirty
athletes accomplished the study and 10 of them managed to obtain the planned weight
reduction rate (see compliance 5.1.2). Athletes were highly motivated to participate in
the project and were grateful for the help they received. Though weight reductions
were seemingly easy to accomplish it is important to emphasize that athletes were
followed up closely and the results need to be carefully interpreted because of the large
inter individual variation. Furthermore since negative energy balance itself may be a
key component in development of the female triad140 extra attention needs to be paid
in athletes in weight conscious sports during weight reduction in order to capture any
possible sign of disordered eating. We included EDI (eating disorder inventory)124
screening of all athletes before and after intervention for this purpose. One of the
athletes was excluded because of suspected risk for developing an eating disorder.
5.1.1 Gender and age
Eighteen females and 12 males accomplished the study and the gender was equally
spread between the groups. Since males have a larger LBM and higher BMR we
controlled for gender in these variables and found significantly differing results
between males and females which are discussed later. Davidsen et al reviewed the role
of menstrual cycle on weight loss attempts and concluded that it may play an
56
Master thesis in Clinical Nutrition, Anu Koivisto 2009
important role in adherence to weight loss programs98. We could not find any
significant difference in compliance between females and males. Furthermore sleeping
metabolic rate (SMR) increases in luteal phase by 6-8% of the menstrual cycle and
ideally BMR measurements should be taken at the same time in the cycle98. Because
of the varying intervention length (5-12 weeks) in our study the pre and post tests
would not necessarily collide with the same point of time in menstrual cycle thus this
control was not included in our study. The average age of subjects was 23 which is
reported by others as the average age of Norwegian elite athlete illustrating our
population’s representativeness regarding age.141
5.1.2 Compliance
Athletes met weekly for follow-up and were vigorously encouraged to follow the meal
plans and training regimen to manage the weight reduction rate. Athletes’ self-reported
adherence to intervention diet was very good. It might be due to inclusion of some of
the athletes’ preferred food items in the meal plan, close follow-up and/or motivational
factors. But anyhow some of the athletes did not obtain planned weight reduction rate
despite following the meal plan in detail thus the energy content of their plans were
adjusted or eventually extra low intensity endurance exercise (2 x 20min/week) was
implemented (n=5). Weight reduction rates were 0.7% BW/week and 1.0% BW/week
for SLOW and FAST weight reduction groups. Compared with the planned 0.7%
BW/week and 1.4% BW/week it was apparently harder to obtain the faster weight
reduction rate and analysis did show a trend in lower compliance in FAST
intervention.
We compared subjects who managed their weight reduction rate with those who did
not. Earlier studies have reported that previous weight reduction attempts, baseline
body weight, BMR and thyroid hormones could predict successful weight loss
therefore these parameters were investigated78;92;142. Subjects with successful weight
reduction rate did not differ from the subjects with unsuccessful weight reduction rate
in any of the mentioned parameters. Thus, these factors could not explain the struggle
some athletes experienced with obtaining weight reduction rate during the
57
Master thesis in Clinical Nutrition, Anu Koivisto 2009
intervention. But interestingly we found a significant difference in baseline training
hours and a trend in baseline body weight between the compliants and non-compliants,
suggesting that athletes who trained the least and had the highest body weight prior to
intervention were most likely to reach the assigned weight reduction rate. For athletes
with good compliance additional training might have contributed more to total energy
expenditure than for athletes who already had high training volumes. It has been
reported previously that high baseline body weight is an important predictor of
successful weight reduction in overweight subjects.142
5.1.3 Training hours and types of sports
The subjects were recruited from several types of sports (combat sports, endurance,
other) with different types of training regimen thus the study population is relatively
heterogeneous. There were no significant differences between the groups in the
amount of weekly training hours or strength training history. However results need to
be interpreted with caution since type of sport could theoretically affect the body
composition results.
5.1.4 Previous weight reduction
The study population was composed of athletes who wished to reduce their body
weight. Sixty percent of them had attempted weight reduction previously where
weight-class sport athletes had the highest prevalence. Other studies have reported
similar prevalence of weight reduction attempts among athletes illustrating just how
common weight regulation is.4;119 Several studies have shown that a single weight
reduction induced by calorie restriction can affect BMR.143;144 Repeated weight
reductions’ negative effect on athletes’ BMR has also been shown.145 In our study
athletes with previous weight reduction attempts were equally spread between the
intervention groups, thus eventual effect on BMR would be similar for both groups.
58
Master thesis in Clinical Nutrition, Anu Koivisto 2009
5.2 Methods
5.2.1 Design
This was a prospective randomised clinical trial. We have experimented how two
different levels of energy restriction effect athletes’ body composition, BMR and
thyroid hormones. Energy content of the meal plans and the duration of intervention
were the only differing variables between the groups. Other weight loss studies on
athletes have for the most part looked at weight class athletes’ attempts to lose weight
prior to competition (making weight). Those interventions have been either very short
< 1 week (rapid weight loss) or relatively long >3 weeks (gradual weight loss)5;14 (see
appendix 1). Our intervention lasted on average 9 weeks for SLOW and 6 weeks for
FAST thus both categorised as gradual weight loss interventions. The inclusion of a
control group was evaluated before start but since we analyse paired data and
percentage change in the variables of interest subjects function as their own controls
and therefore the control group was abandoned. In addition finding matching controls
is extremely difficult due to limited number of athletes at this performance level. For
paired data analysis our study has appropriate power ß>80 but for detection of
differences between the groups the study population should preferably have been
larger (n=85). This means that we can not be sure that differences between the
interventions that we did not find do not exist in real life.
5.2.2 Diet
4-day weighed registration
Information about subjects’ dietary habits before intervention start was collected with
a 4-day weighed dietary registration. Earlier studies have shown that a 7-day
registration period gives a precision (CV) between 20 and 26% for energy and
macronutrient intake146 and this is the preferred duration of registration. A 3-day
record is considered to be the minimum to indicate the usual intake of a group of
athletes (data on group level) but the period needs to include both weekdays and
weekends in order to avoid bias.147;148 We chose a 4-day weighed registration
consisting of 3 weekdays and a weekend in order to minimize the burden and poor
59
Master thesis in Clinical Nutrition, Anu Koivisto 2009
compliance. In addition athletes tendency to eat routinely and stick to stable training
timetables may justify a shorter registration period. Furthermore weekly measurements
of body weight and skin fold thickness (data not shown) enabled us to control for
potential underreporting and adjust to the meal plan when weight reduction rate was
not reached.
Energy and macronutrient composition of the intervention diet
The energy intake for the athletes was restricted on average by -18% for SLOW and -
29% for FAST intervention group. Athletes’ diets were manipulated so that the
amount of protein in the intervention diet was kept constant whereas the amount of fat
was reduced and the amount of carbohydrate maintained whenever possible. Filaire et
al48 demonstrated the need for dietary guidance for athletes during weight loss. In their
post hoc diet analysis athletes’ diets (self chosen) included too little of carbohydrate
45E% and micronutrients, unnecessary large amount of fat 37E% but fortunately
adequate amount of protein 1.2g/kg BW. Although fat content of the intervention diet
in our study were kept above the recommended minimum (>20E%) for some athletes
this reduction from their usual diet was very large. The absolute carbohydrate content
had to be reduced for most of the athletes (n=22) in order to reduce energy intake and
maintain adequate protein supply. But carbohydrates still provided 54-56% of the total
energy intake as recommended by American College of Sports Medicine (ACSM)149.
Energy derived from protein in the intervention diets was 24% and 25% for SLOW
and FAST weight reduction groups respectively. Protein content in the meal was
prioritized to ensure adequate amino acid supply to the muscles and possibly induce
thermo genesis and satiety.42;150
It is important to point out that theoretical recommendations of optimal macronutrient
composition for athletes’ in weight reduction are not always achievable in real life. To
exemplify this; an athlete on a 6280 kJ/day meal plan (the lowest recommended
energy intake for an athlete in weight reduction11) must weigh no more than 43 kg in
order to achieve the recommended protein (1.2g/kg BW) and carbohydrate (5g/kg
BW) intake while the fat content is no lower than 20E%. This illustrates the need for
adjustments in macronutrient composition in some cases.
60
Master thesis in Clinical Nutrition, Anu Koivisto 2009
The meal frequency for all subjects averaged at 6 meals per day (breakfast, recovery
meal, lunch, snack, dinner and supper), providing energy and macronutrients in a
manner that enables good quality work-outs and improves satiety. Several of the
studies cited in this thesis have not declared their macronutrient composition or meal
pattern of the calorie restricted diets complicating interpretations the effects of such
interventions on body composition, especially LBM.
5.2.3 DEXA
We chose DEXA for body composition measures because it is a precise and
convenient method and gives information not just about FM and LBM but also about
bone mineral density. There are three different DEXA softwares which might
theoretically give varying results though they all are based on the same principles, thus
using the same machine, software and technician in repetitive measures as performed
in this thesis increases the reliability of the results. DEXA measurements assume that
the hydration of FFM remains constant, but hydration of FFM in athletes can vary and
increase the possibility of false result (dehydration underestimates LBM151). We did
not control for hydration status in our athletes thus LBM might have been
underestimated in some cases.
Dehydration effects on body fat% estimates are relatively small; 5% dehydration
results in changed fat% estimate by 1-2.5%133. This makes DEXA an excellent method
for measuring body fat% in weight class sports where dehydration unfortunately often
is used as a weight loss strategy. To avoid inaccuracies due to stomach contents
(overestimated LBM151), all the DEXA measurements were done fasting and at the
same time of the day. Although the radiation dose is relatively small corresponding to
a transcontinental flight possible pregnancy in subjects was unravelled.127
5.2.4 Indirect calorimeter
There are several indirect calorimeter methods with 2 main classifications; open circuit
and closed circuit. We chose Douglas back, which is an open circuit method, because
it is portable and convenient to use. We calibrated the gas analyser prior to each
61
Master thesis in Clinical Nutrition, Anu Koivisto 2009
analysis in with atmospheric amounts of carbon dioxide (0.03%) and oxygen (20.93%)
as required to ensure valid results.152 Furthermore the time from collection to analysis
should be minimised to avoid loss of CO2 by molecular diffusion. All gas analysis in
our study were performed within 15 minutes after collection, an approved time interval
by Mills.153 Due to possible loss of carbon dioxide in large volume Douglas bags we
chose 2 small volume bags (volume= 100 l) where the gas volumes never exceeded
85l. Weir’s equation that converts gasses to kJ assumes that the protein content of diet
is constant (15 E%). The protein content in intervention diets and at the baseline was
somewhat higher, but it did not differ between the groups.
5.3 Result interpretations
5.3.1 Body composition
Both interventions resulted in significant weight losses. Despite the weight loss
athletes in SLOW weight reduction group gained LBM during the intervention while
their FM decreased by 31% improving their power to weight ratio. Our study is the
first to report increased LBM during weight loss study in athletes. Even in FAST
weight reduction group LBM was maintained despite the large calorie restriction (-
26%). Previous studies with similar calorie restrictions and/or body weight loss
interventions in athletes have all resulted in LBM loss5;66;72 (see summary in appendix
1).
There are several potential explanations for our findings. First, heavy resistance
training was included in our study. Several studies have reported strength training’s
beneficial effect on LBM maintenance.64;65 Whereas calorie restrictions without
training regimen results in significant reduction of LBM.143 There are a few studies,
although conducted on non athletes that have shown increases in LBM during weight
reduction when strength training was included.75;154 Importantly, both of these studies
resulted only in relatively small body weight reductions in contrary to other studies
where larger weight reductions have caused loss of LBM. There is scarce data on
resistance training’s effect on LBM during weight loss in athletes. Only one study has
62
Master thesis in Clinical Nutrition, Anu Koivisto 2009
looked at the combinatory effect of energy restriction and resistance training on body
composition in athletes. This 6-week weight loss study with additional resistance
training in weight-class athletes gave no benefit regarding LBM changes compared
with control group.66
There are also other potential factors that might have an impact on the maintenance of
LBM during weight reduction. Chaston et al73 concluded in a review, where they
identified LBM’s contribution of total body weight loss among overweight subjects,
that the degree of calorie restriction, exercise and weight reduction rate seem to be the
main factors predicting LBM loss during weight reduction. Also Umeda et al5
demonstrated that the degree of energy restriction is related to the decrease in FFM.
They looked at judoists reducing BW either <4% or >4% during 20 days and showed
larger FFM loss and increased blood nitrogen urea concentration in the large weight
loss group compared with the moderate weight loss group, thus catabolism of muscle
proteins was enhanced by the larger energy restriction. Though no LBM was lost in
our study the finding that only SLOW weight loss group gained LBM confirms
findings from earlier studies that the degree of weight reduction rate has a strong
impact on LBM changes.
Weight loss diets in our study provided adequate amounts of protein which probably
has contributed to the maintenance of LBM. Several other weight loss studies on
athletes have reported LBM losses with lower protein content of the energy restricted
diets.38 Observational studies have reported that athletes often consume too little
protein during weight loss periods5;21;155 and thus risk being in a negative nitrogen
balance. Walberg et al38 tested the effect of high versus low protein hypocalorie diet
on FFM. They found that only high protein diet produced positive protein balance
though no difference in FFM changes between the groups was detected. Short duration
of their study might explain that lack of difference in FFM between the groups. Other
dietary factors may also play a role in LBM maintenance during weight loss in athletes
(meal pattern, timing of meals around work-outs, snacking etc), but few studies have
investigated them.20
63
Master thesis in Clinical Nutrition, Anu Koivisto 2009
We found an association between LBM gain and duration of the intervention. This is
probably explained by the time aspect of muscular hypertrophy giving an advantage
for the long intervention. Subjects with the longest interventions had smaller energy
restriction which also could partly explain the finding. Contrary to our finding several
studies on athletes have suggested that long/gradual weight reduction leads to larger
LBM loss compared with rapid weight loss.14;71 Rapid weight loss in these studies
refers to weight loss due to fasting and dehydration few days prior to weigh-in. In our
study both weight reductions belong in gradual weight reduction category, but despite
the relative long duration no LBM was lost.
In our study females’ LBM increase was significantly greater than males regardless of
strength training background. Since we did find a linear relationship between LBM at
the baseline and change in LBM this gender difference might be due to females low
baseline LBM compared with males and thus larger capacity to increase LBM.
Theoretically it could also be due to weight loss induced reduction in testosterone as
previously reported in male athletes during weight reduction.11 Thus our results
suggest that males, especially with large LBM at the baseline, have limited possibility
to increase LBM during weight reduction, whereas LBM increase for females during
weight reduction appears to be easier independent of weight reduction rate.
Furthermore a longer duration of energy restriction combined with muscular
hypertrophy stimulating weight training seems to be the preferred weight reduction
method for optimal body composition changes.
Finally the maintenance of LBM is important for improving physical performance,
thus not surprisingly several studies but not all30 have reported decreased performance
associated with LBM loss in athletes.5;48;156 (Physical test data not shown in this
thesis.)
5.3.2 Thyroid hormones
We detected a significant reduction in f-T4 for FAST but not for SLOW weight
reduction. Thus degree of calorie restriction seems to have an impact on thyroid
hormones. Kozlowska et al detected a decline in T3/T4 ratio during weight loss
64
Master thesis in Clinical Nutrition, Anu Koivisto 2009
correlating with the magnitude of energy restriction. Other studies have reported
reductions in f-T4 as a result of low energy intake and weight reduction.87;90;143, while
some have shown no difference in T4, only reduced T3.87
Since thyroxin needs to be activated by deiodination to the biologically active T3 a
decrease in deiodinase activity may affect the T3 feedback mechanism so that TSH is
increased simultaneously with T4, while T3 is decreased. This theory is supported by
Ortega et al’s finding that only T3 was associated with sleeping metabolic rate and
weight change.92 We did not find any association between T4 and TSH and
unfortunately we have no data on T3.
THS did not change in either of our intervention groups during energy restriction. It
has been reported previously that athletes with low energy intakes were prone to
hypothyroidism; a reduced metabolic state where TSH is increased.157,158
All the values for free T4 and TSH (except TSH for one athlete post intervention) in
our study were within reference values and that raises a question whether these
relatively small changes can affect metabolism (BMR) which we, due to low sample
size, could not detect? Previous studies in non-athletes have reported that even small
reduction in TSH has a significant impact on BMR.96 We could not detect an
association between TSH and BMR in our subjects. Although thyroid hormones are
the major endocrine regulators of metabolic rate (BMR),159 there are only a few studies
that have investigated thyroid hormones and/or metabolic rate among healthy athletes
as a result of weight reduction.143;144 These studies all report reduced metabolism. We
observed significant reduction in T4 and BMR but could not find them to be associated
as hypothesized.
Araujo et al94 showed the that reductions in T4 during weight reduction (40% calorie
restriction) seem to have a LBM protective role. We were not able to detect an
association between T4 and changes in LBM.
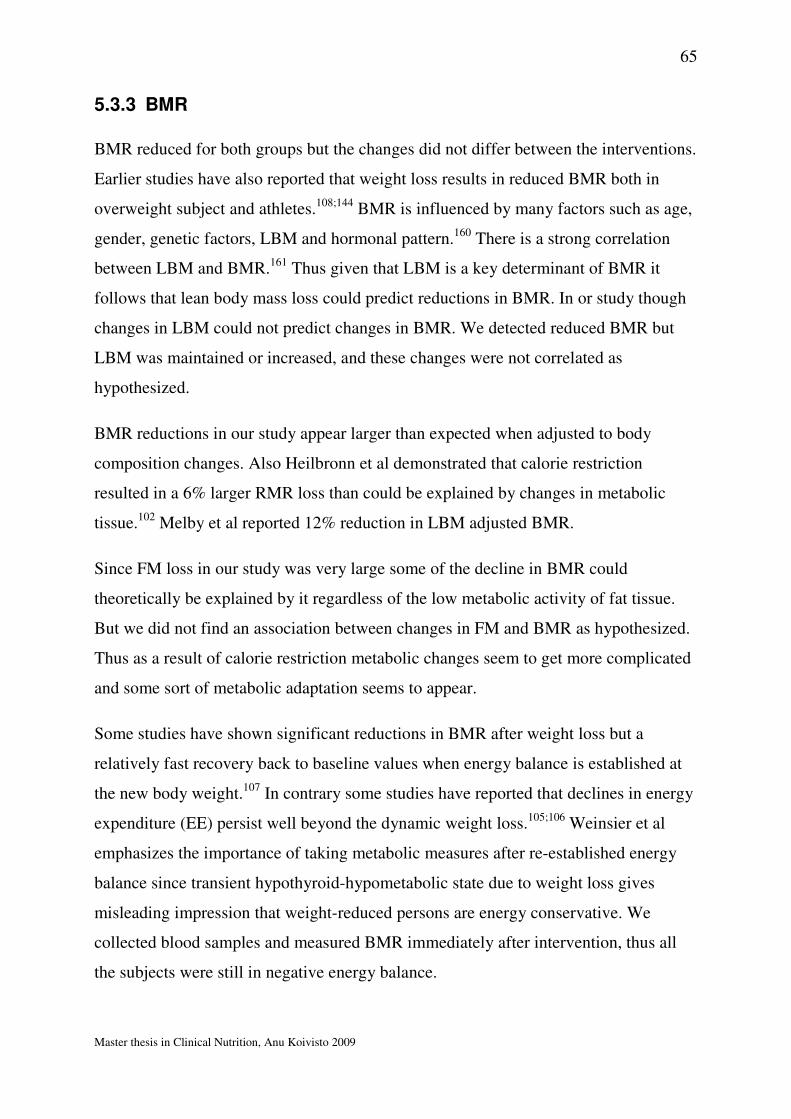
65
Master thesis in Clinical Nutrition, Anu Koivisto 2009
5.3.3 BMR
BMR reduced for both groups but the changes did not differ between the interventions.
Earlier studies have also reported that weight loss results in reduced BMR both in
overweight subject and athletes.108;144 BMR is influenced by many factors such as age,
gender, genetic factors, LBM and hormonal pattern.160 There is a strong correlation
between LBM and BMR.161 Thus given that LBM is a key determinant of BMR it
follows that lean body mass loss could predict reductions in BMR. In or study though
changes in LBM could not predict changes in BMR. We detected reduced BMR but
LBM was maintained or increased, and these changes were not correlated as
hypothesized.
BMR reductions in our study appear larger than expected when adjusted to body
composition changes. Also Heilbronn et al demonstrated that calorie restriction
resulted in a 6% larger RMR loss than could be explained by changes in metabolic
tissue.102 Melby et al reported 12% reduction in LBM adjusted BMR.
Since FM loss in our study was very large some of the decline in BMR could
theoretically be explained by it regardless of the low metabolic activity of fat tissue.
But we did not find an association between changes in FM and BMR as hypothesized.
Thus as a result of calorie restriction metabolic changes seem to get more complicated
and some sort of metabolic adaptation seems to appear.
Some studies have shown significant reductions in BMR after weight loss but a
relatively fast recovery back to baseline values when energy balance is established at
the new body weight.107 In contrary some studies have reported that declines in energy
expenditure (EE) persist well beyond the dynamic weight loss.105;106 Weinsier et al
emphasizes the importance of taking metabolic measures after re-established energy
balance since transient hypothyroid-hypometabolic state due to weight loss gives
misleading impression that weight-reduced persons are energy conservative. We
collected blood samples and measured BMR immediately after intervention, thus all
the subjects were still in negative energy balance.

66
Master thesis in Clinical Nutrition, Anu Koivisto 2009
Few studies have looked at long-term effects of intentional weight reduction on RMR
in athletes.108;162 In one study athletes reduced their body weight repeatedly during the
competitive season108. Both LBM and BMR were reduced after weight reduction
periods but returned to baseline after season when the wrestlers’ body weight was
normalised. McCargar et al162 reported no difference in RMR between weight-cyclers
and non weight-cyclers before or during the competitive season, but they detected a
trend for lower RMR in weight cyclers during off-season (5 months after last weight
loss) when body weight was normalised. It remains to be determined whether BMR
remains reduced and for how long after new lower body weight is established. Future
research in this field should focus on investigating the duration of this hypometabolic
state in athletes.
In our study estimated RMR (Cunningham equation) did not correlate with measured
BMR (indirect calorimeter) after weight loss. Cunningham equation is based on LBM
and due to LBM gain in our study RMR was overestimated (by 784kJ). This
information is of clinical importance since applying Cunningham equation for
estimating energy needs for an athletes after weight loss will be incorrect (too high).
The lack of difference in BMR changes between the intervention groups might be
explained by the duration of the intervention. Since changes in BMR happen relatively
slowly the duration of FAST weight reduction might have been too short for detecting
a greater BMR fall that could have happened if the weight loss had lasted longer at the
same rate. Anyhow we did not find a correlation between duration of intervention and
changes in BMR.
BMR can also be affected by heavy exercise up to 48 hours (extra post exercise
oxygen consumption, EPOC).163 In our study heavy exercise was restricted 24 hours
prior to BMR measures, thus real reductions in BMR could have been masked by
metabolic after-effects of intense exercise. Though this effect would be similar for
both interventions, and therefore can not explain the lack of difference in BMR
between the groups.
67
Master thesis in Clinical Nutrition, Anu Koivisto 2009
5.4 Strengths and weaknesses of the study
Our study is the first experimental weight loss study to look at how specific weight
reduction rates effect body composition, thyroid hormones and BMR. In our study
weight loss diet was defined in detail and controlled through out the study thus
confounding from dietary factors was minimised. The sample size in the study is
adequate for paired analysis but lacks power for between group comparisons,
especially for BMR (n=16) though compared with other weight loss studies in athletes
our sample size is superior.
Random allocation minimised systematic bias and the similarity of groups at the
baseline reduced confounding. Though separate control group might have been ideal it
is not needed when studying within subject changes from baseline. Athletes’ weight
stability prior to the intervention was controlled only verbally which might not be
adequate. Furthermore we probably should have collected diurnal urine, measured
nitrogen content and established whether any of the athletes were in negative nitrogen
balance. But it was considered to be too large a burden for the athletes. For detection
of TEE and underreporting we should preferentially have used DLW but since the
weekly follow-up allowed for adjustments, information from 4-day weighed food
record and 1-day activity registration was considered adequate. Seasonal variation in
BMR was not taken into consideration (impossible due to competitive season) and
could theoretically impact BMR results though block allocation secured similar
number of subjects in the interventions at any time thus the potential effect would be
alike for both groups. We should have measured T3 or T3/T4 ratio since those
parameters are affected by low energy availability into a larger extent than f-T4.
Ideally the study should have been designed to allow control for menstrual cycle and
it’s potential effect on BMR.
Finally, drop-out rate in the study was very small. And there were no differences
between the athletes who accomplished or aborted the study.

68
Master thesis in Clinical Nutrition, Anu Koivisto 2009
6. Conclusion
Despite the energy restriction and significant body weight reduction neither of the
interventions resulted in LBM losses. Subjects in SLOW weight reduction group
actually gained LBM. Free T4 plasma concentration decreased only in FAST weight
reduction group suggesting that the faster weight reduction rate is more likely to
initiate energy preserving mechanisms although we were not able to detect this in
BMR changes. The basal metabolism reductions did not differ between the
interventions. Changes in LBM, thyroid hormones or BMR were not associated as a
result of weight reduction. Thus for optimal body composition changes in athletes a
moderate energy restriction combined with resistance training leading to a weekly
weight loss of 0.7% seems preferable and should be the recommended protocol.
Despite maintained or increased LBM, athletes experienced reductions in BMR.
Several weight loss studies combining energy restriction and strength training need to
be conducted to better understand the mechanisms that lead to BMR reductions in
athletes. Also the duration of the weight loss induced hypo-metabolic state in athletes
needs to be established.
69
Master thesis in Clinical Nutrition, Anu Koivisto 2009
Practical Implications
Based on existing literature and findings from our study the following guidelines for
weight loss in athletes are suggested.
•••• Careful evaluation of athletes’ medical, anthropometric, nutritional and
psychological status together with an assessment of their performance goals is
required prior to weight reduction.
•••• Weight reduction needs to be planned in advance and timed to avoid
interference with sports specific goals and competitions.
•••• It is not recommended that athletes reduce body weight on their own. Regular
follow-up with nutritionist is recommended.
•••• Energy restriction should be combined with strength training to avoid some of
the detrimental effects of weight reduction on LBM.
•••• The recommended weight loss rate is 0.7% of body weight per week.
•••• Weight loss diet should contain minimum 1.2g protein/kg body weight and as
much carbohydrate as possible while fat content is reduced, but to no lower
than 20E%.
•••• The diet should be nutrient rich and high in fibre. Eventual supplementing with
a multivitamin-mineral and essential fatty acids should be considered with low
energy intakes (<8000kJ).
•••• Total daily energy intake should be divided in frequent small meals that match
athletes’ work-out schedule and provide fuel and satiety throughout the day.
70
Master thesis in Clinical Nutrition, Anu Koivisto 2009
Reference List
(1) http://chem.csusb.edu/ . 2009. Ref Type: Online Source
(2) Benardot D. Body composition and weight. Advanced sports nutrition. Champaign, IL: Human Kinetics; 2006;209-232.
(3) Davis C, Cowles M. A comparison of weight and diet concerns and personality factors among female athletes and non-athletes. J Psychosom Res 1989;33:527-536.
(4) Fogelholm M, Hiilloskorpi H. Weight and diet concerns in Finnish female and male athletes. Med Sci Sports Exerc 1999;31:229-235.
(5) Umeda T, Nakaji S, Shimoyama T, Yamamoto Y, Totsuka M, Sugawara K. Adverse effects of energy restriction on myogenic enzymes in judoists. J
Sports Sci 2004;22:329-338.
(6) Kowatari K, Umeda T, Shimoyama T, Nakaji S, Yamamoto Y, Sugawara K. Exercise training and energy restriction decrease neutrophil phagocytic activity in judoists. Med Sci Sports Exerc 2001;33:519-524.
(7) Steen SN, Brownell KD. Patterns of weight loss and regain in wrestlers: has the tradition changed? Med Sci Sports Exerc 1990;22:762-768.
(8) Choma CW, Sforzo GA, Keller BA. Impact of rapid weight loss on cognitive function in collegiate wrestlers. Med Sci Sports Exerc 1998;30:746-749.
(9) Stiegler P, Cunliffe A. The role of diet and exercise for the maintenance of fat-free mass and resting metabolic rate during weight loss. Sports Med 2006;36:239-262.
(10) Rankin JW. Making weight in sports. In: Burke L, Deakin V, eds. Clinical
sports nutrition. 3rd edition ed. Australia: McGraw-Hill Australia Pty Ltd; 2006;175-200.
(11) O'Connor H, Caterson I. Weight loss and the athlete. In: Burke L, Deakin V, eds. Clinical sports nutrition. 3rd edition ed. McGraw-Hill; 2006;135-174.

71
Master thesis in Clinical Nutrition, Anu Koivisto 2009
(12) Olds TS, Norton KI, Craig NP. Mathematical model of cycling performance. J Appl Physiol 1993;75:730-737.
(13) Rankin JW. Weight loss and gain in athletes. Curr Sports Med Rep 2002;1:208-213.
(14) Fogelholm GM, Koskinen R, Laakso J, Rankinen T, Ruokonen I. Gradual and rapid weight loss: effects on nutrition and performance in male athletes. Med
Sci Sports Exerc 1993;25:371-377.
(15) Garthe I. Vektregulering blant landslagsutøvere i vektklasseidretter i Norge-en undersøkelse gjort av Olympiatoppen for å kartlegge vektreduksjonsmetoder og rutiner hos norske vektklasseutøvere. Olympiatoppen., editor. 2005.
Ref Type: Report
(16) From the Centers for Disease Control and Prevention. Hyperthermia and dehydration-related deaths associated with intentional rapid weight loss in three collegiate wrestlers--North Carolina, Wisconsin, and Michigan, November-December 1997. JAMA 1998;279:824-825.
(17) Coyle EF. Fuels for sports performance. Perspectives in exercise science and
sports medicine. Indiana: Cooper publishing group; 1997;95-129.
(18) Hawley J, Burke L. Nutritional strategies to enhance fat oxidation. In: Burke L, Deakin V, eds. Clinical sports nutrition. 3rd edition ed. Australia: McGraw-Hill; 2006;455-483.
(19) Rankin JW, Ocel JV, Craft LL. Effect of weight loss and refeeding diet composition on anaerobic performance in wrestlers. Med Sci Sports Exerc 1996;28:1292-1299.
(20) Iwao S, Mori K, Sato Y. Effects of meal frequency on body composition during weight control in boxers. Scand J Med Sci Sports 1996;6:265-272.
(21) Roemmich JN, Sinning WE. Weight loss and wrestling training: effects on nutrition, growth, maturation, body composition, and strength. J Appl Physiol 1997;82:1751-1759.
(22) Burke LM, Cox GR, Culmmings NK, Desbrow B. Guidelines for daily carbohydrate intake: do athletes achieve them? Sports Med 2001;31:267-299.
72
Master thesis in Clinical Nutrition, Anu Koivisto 2009
(23) Romijn JA, Coyle EF, Sidossis LS et al. Regulation of endogenous fat and carbohydrate metabolism in relation to exercise intensity and duration. Am J
Physiol 1993;265:E380-E391.
(24) Bangsbo J, Norregaard L, Thorsoe F. The effect of carbohydrate diet on intermittent exercise performance. Int J Sports Med 1992;13:152-157.
(25) Hawley JA, Schabort EJ, Noakes TD, Dennis SC. Carbohydrate-loading and exercise performance. An update. Sports Med 1997;24:73-81.
(26) Horswill CA, Hickner RC, Scott JR, Costill DL, Gould D. Weight loss, dietary carbohydrate modifications, and high intensity physical activity [abstract]Horswill CA, Hickner RC, Scott JR, Costill DL, Gould D. Med Sci
Sports Exerc 1990;22:470-477
(27) McMurray RG, Proctor CR, Wilson WL. Effect of caloric deficit and dietary manipulation on aerobic and anaerobic exercise. Int J Sports Med 1991;12:167-172.
(28) Burke L. Nutrition for recovery after training and competition. In: Burke L, Deakin V, eds. Clinical sports nutrition. 3rd edition ed. Australia: McGraw-Hill; 2006;415-453.
(29) Coyle EF. Physical activity as a metabolic stressor. Am J Clin Nutr 2000;72:512S-520S.
(30) Parkes SC, Belcastro AN, McCargar LJ, McKenzie D. Effect of energy restriction on muscle function and calcium stimulated protease activity in recreationally active women. Can J Appl Physiol 1998;23:279-292.
(31) Frayn K. Metabolic regulation: a human perspective. 2nd edition ed. Portland: Blakcwell Science, 2003.
(32) Cook CM, Haub MD. Low-carbohydrate diets and performance. Curr Sports
Med Rep 2007;6:225-229.
(33) Tarnopolsky MA. Protein and amino acid needs for training and bulking up. Clinical sports nutrition. 3rd edition ed. Australia: McGraw-Hill; 2006;73-111.
(34) Tarnopolsky M. Protein requirements for endurance athletes. Nutrition 2004;20:662-668.
73
Master thesis in Clinical Nutrition, Anu Koivisto 2009
(35) Wagenmakers AJ, Beckers EJ, Brouns F et al. Carbohydrate supplementation, glycogen depletion, and amino acid metabolism during exercise. Am J Physiol 1991;260:E883-E890.
(36) Jackman ML, Gibala MJ, Hultman E, Graham TE. Nutritional status affects branched-chain oxoacid dehydrogenase activity during exercise in humans. Am J Physiol 1997;272:E233-E238.
(37) Wolfe RR. Control of muscle protein breakdown: effects of activity and nutritional states. Int J Sport Nutr Exerc Metab 2001;11 Suppl:S164-S169.
(38) Walberg JL, Leidy MK, Sturgill DJ, Hinkle DE, Ritchey SJ, Sebolt DR. Macronutrient content of a hypoenergy diet affects nitrogen retention and muscle function in weight lifters. Int J Sports Med 1988;9:261-266.
(39) Rennie MJ, Bohe J, Smith K, Wackerhage H, Greenhaff P. Branched-chain amino acids as fuels and anabolic signals in human muscle. J Nutr 2006;136:264S-268S.
(40) Phillips SM. Dietary protein for athletes: from requirements to metabolic advantage. Appl Physiol Nutr Metab 2006;31:647-654.
(41) Potier M, Darcel N, Tome D. Protein, amino acids and the control of food intake. Curr Opin Clin Nutr Metab Care 2009;12:54-58.
(42) Halton TL, Hu FB. The effects of high protein diets on thermogenesis, satiety and weight loss: a critical review. J Am Coll Nutr 2004;23:373-385.
(43) Tarnopolsky MA, Atkinson SA, MacDougall JD, Chesley A, Phillips S, Schwarcz HP. Evaluation of protein requirements for trained strength athletes. J Appl Physiol 1992;73:1986-1995.
(44) Baba NH, Sawaya S, Torbay N, Habbal Z, Azar S, Hashim SA. High protein vs high carbohydrate hypoenergetic diet for the treatment of obese hyperinsulinemic subjects. Int J Obes Relat Metab Disord 1999;23:1202-1206.
(45) Horswill CA. Weight loss and weight cycling in amateur wrestlers: implications for performance and resting metabolic rate. Int J Sport Nutr 1993;3:245-260.
(46) Williams L, Williams P. Evaluation of a tool for rating popular diet books [abstract]Williams L, Williams P. Nutr Diet 2003;60:185-197

74
Master thesis in Clinical Nutrition, Anu Koivisto 2009
(47) Gleeson M. Can nutrition limit exercise-induced immunodepression? Nutr
Rev 2006;64:119-131.
(48) Filaire E, Maso F, Degoutte F, Jouanel P, Lac G. Food restriction, performance, psychological state and lipid values in judo athletes. Int J Sports
Med 2001;22:454-459.
(49) Greenhaff PL, Gleeson M, Maughan RJ. The effects of diet on muscle pH and metabolism during high intensity exercise. Eur J Appl Physiol Occup Physiol 1988;57:531-539.
(50) Hulmi JJ, Volek JS, Selanne H, Mero AA. Protein ingestion prior to strength exercise affects blood hormones and metabolism. Med Sci Sports Exerc 2005;37:1990-1997.
(51) Ivy JL, Katz AL, Cutler CL, Sherman WM, Coyle EF. Muscle glycogen synthesis after exercise: effect of time of carbohydrate ingestion. J Appl
Physiol 1988;64:1480-1485.
(52) Richter EA, Mikines KJ, Galbo H, Kiens B. Effect of exercise on insulin action in human skeletal muscle. J Appl Physiol 1989;66:876-885.
(53) Wojtaszewski JF, Nielsen P, Kiens B, Richter EA. Regulation of glycogen synthase kinase-3 in human skeletal muscle: effects of food intake and bicycle exercise. Diabetes 2001;50:265-269.
(54) Burke LM, Collier GR, Hargreaves M. Muscle glycogen storage after prolonged exercise: effect of the glycemic index of carbohydrate feedings. J
Appl Physiol 1993;75:1019-1023.
(55) Jozsi AC, Trappe TA, Starling RD et al. The influence of starch structure on glycogen resynthesis and subsequent cycling performance. Int J Sports Med 1996;17:373-378.
(56) Biolo G, Williams BD, Fleming RY, Wolfe RR. Insulin action on muscle protein kinetics and amino acid transport during recovery after resistance exercise. Diabetes 1999;48:949-957.
(57) Ivy JL, Goforth HW, Jr., Damon BM, McCauley TR, Parsons EC, Price TB. Early postexercise muscle glycogen recovery is enhanced with a carbohydrate-protein supplement. J Appl Physiol 2002;93:1337-1344.
(58) Kerksick C, Harvey T, Stout J et al. International Society of Sports Nutrition position stand: Nutrient timing. J Int Soc Sports Nutr 2008;5:17.
75
Master thesis in Clinical Nutrition, Anu Koivisto 2009
(59) Tipton KD, Rasmussen BB, Miller SL et al. Timing of amino acid-carbohydrate ingestion alters anabolic response of muscle to resistance exercise. Am J Physiol Endocrinol Metab 2001;281:E197-E206.
(60) Ivy JL, Ding Z, Hwang H, Cialdella-Kam LC, Morrison PJ. Post exercise carbohydrate-protein supplementation: phosphorylation of muscle proteins involved in glycogen synthesis and protein translation. Amino Acids 2008;35:89-97.
(61) Wolfe RR. Effects of amino acid intake on anabolic processes. Can J Appl
Physiol 2001;26 Suppl:S220-S227.
(62) Pedersen BK, Bruunsgaard H, Jensen M, Toft AD, Hansen H, Ostrowski K. Exercise and the immune system--influence of nutrition and ageing. J Sci Med
Sport 1999;2:234-252.
(63) Bryner RW, Ullrich IH, Sauers J et al. Effects of resistance vs. aerobic training combined with an 800 calorie liquid diet on lean body mass and resting metabolic rate. J Am Coll Nutr 1999;18:115-121.
(64) Ballor DL, Katch VL, Becque MD, Marks CR. Resistance weight training during caloric restriction enhances lean body weight maintenance. Am J Clin
Nutr 1988;47:19-25.
(65) Ballor DL, Poehlman ET. Exercise-training enhances fat-free mass preservation during diet-induced weight loss: a meta-analytical finding. Int J
Obes Relat Metab Disord 1994;18:35-40.
(66) Garthe I. Betydningen av styrketrening i en vektreduksjonsperiode hos
toppidrettsutøvere i vektklasseidretter [ Norges Idrettshøgskole; 2002.
(67) Geliebter A, Maher MM, Gerace L, Gutin B, Heymsfield SB, Hashim SA. Effects of strength or aerobic training on body composition, resting metabolic rate, and peak oxygen consumption in obese dieting subjects. Am J Clin Nutr 1997;66:557-563.
(68) Tsai AC, Sandretto A, Chung YC. Dieting is more effective in reducing weight but exercise is more effective in reducing fat during the early phase of a weight-reducing program in healthy humans. J Nutr Biochem 2003;14:541-549.
(69) Heyward VH, Wagner DR. Applied body composition. 2nd edition ed. Champaign, Illinois: Human Kinetics, 2004.
76
Master thesis in Clinical Nutrition, Anu Koivisto 2009
(70) Forbes GB. Body fat content influences the body composition response to nutrition and exercise. Ann N Y Acad Sci 2000;904:359-365.
(71) Slater GJ, Rice AJ, Jenkins D, Gulbin J, Hahn AG. Preparation of former heavyweight oarsmen to compete as lightweight rowers over 16 weeks: three case studies. Int J Sport Nutr Exerc Metab 2006;16:108-121.
(72) Koutedakis Y, Pacy PJ, Quevedo RM et al. The effects of two different periods of weight-reduction on selected performance parameters in elite lightweight oarswomen. Int J Sports Med 1994;15:472-477.
(73) Chaston TB, Dixon JB, O'Brien PE. Changes in fat-free mass during significant weight loss: a systematic review. Int J Obes (Lond) 2007;31:743-750.
(74) Goldberg AL, Etlinger JD, Goldspink DF, Jablecki C. Mechanism of work-induced hypertrophy of skeletal muscle. Med Sci Sports 1975;7:185-198.
(75) Demling RH, DeSanti L. Effect of a hypocaloric diet, increased protein intake and resistance training on lean mass gains and fat mass loss in overweight police officers. Ann Nutr Metab 2000;44:21-29.
(76) Weiss EP, Racette SB, Villareal DT et al. Lower extremity muscle size and strength and aerobic capacity decrease with caloric restriction but not with exercise-induced weight loss. J Appl Physiol 2007;102:634-640.
(77) Committee on military nutrition research, Committee on body composition nah, Board institute of medicine. The role of protein and amino acids in sustaining and enhancing performance. 1999. Washington, National academy press.
Ref Type: Report
(78) Kozlowska L, Rosolowska-Huszcz D. Leptin, thyrotropin, and thyroid hormones in obese/overweight women before and after two levels of energy deficit. Endocrine 2004;24:147-153.
(79) Dionne I, Despres JP, Bouchard C, Tremblay A. Gender difference in the effect of body composition on energy metabolism. Int J Obes Relat Metab
Disord 1999;23:312-319.
(80) Hilton LK, Loucks AB. Low energy availability, not exercise stress, suppresses the diurnal rhythm of leptin in healthy young women. Am J
Physiol Endocrinol Metab 2000;278:E43-E49.

77
Master thesis in Clinical Nutrition, Anu Koivisto 2009
(81) Saris WH. The concept of energy homeostasis for optimal health during training. Can J Appl Physiol 2001;26 Suppl:S167-S175.
(82) Doucet E, St PS, Almeras N, Mauriege P, Richard D, Tremblay A. Changes in energy expenditure and substrate oxidation resulting from weight loss in obese men and women: is there an important contribution of leptin? J Clin
Endocrinol Metab 2000;85:1550-1556.
(83) Ayyad C, Andersen T. Long-term efficacy of dietary treatment of obesity: a systematic review of studies published between 1931 and 1999. Obes Rev 2000;1:113-119.
(84) Glenny AM, O'Meara S, Melville A, Sheldon TA, Wilson C. The treatment and prevention of obesity: a systematic review of the literature. Int J Obes
Relat Metab Disord 1997;21:715-737.
(85) Filozof C, Gonzalez C. Predictors of weight gain: the biological-behavioural debate. Obes Rev 2000;1:21-26.
(86) Martin CK, Heilbronn LK, de JL et al. Effect of calorie restriction on resting metabolic rate and spontaneous physical activity. Obesity (Silver Spring) 2007;15:2964-2973.
(87) Rosenbaum M, Hirsch J, Murphy E, Leibel RL. Effects of changes in body weight on carbohydrate metabolism, catecholamine excretion, and thyroid function. Am J Clin Nutr 2000;71:1421-1432.
(88) Sherwood L. The peripheral endocrine glands. Human physiology - from cells
to systems. 3rd edition ed. Belmont, CA: West Publishing Company; 2009;654-699.
(89) Reinehr T, Andler W. Thyroid hormones before and after weight loss in obesity. Arch Dis Child 2002;87:320-323.
(90) Thompson JL, Manore MM, Skinner JS, Ravussin E, Spraul M. Daily energy expenditure in male endurance athletes with differing energy intakes. Med Sci
Sports Exerc 1995;27:347-354.
(91) Reinehr T, Isa A, de SG, Dieffenbach R, Andler W. Thyroid hormones and their relation to weight status. Horm Res 2008;70:51-57.
(92) Ortega E, Pannacciulli N, Bogardus C, Krakoff J. Plasma concentrations of free triiodothyronine predict weight change in euthyroid persons. Am J Clin
Nutr 2007;85:440-445.
78
Master thesis in Clinical Nutrition, Anu Koivisto 2009
(93) Welle SL, Campbell RG. Decrease in resting metabolic rate during rapid weight loss is reversed by low dose thyroid hormone treatment. Metabolism 1986;35:289-291.
(94) Araujo RL, de Andrade BM, de Figueiredo AS et al. Low replacement doses of thyroxine during food restriction restores type 1 deiodinase activity in rats and promotes body protein loss. J Endocrinol 2008;198:119-125.
(95) Douyon L, Schteingart DE. Effect of obesity and starvation on thyroid hormone, growth hormone, and cortisol secretion. Endocrinol Metab Clin
North Am 2002;31:173-189.
(96) al-Adsani H, Hoffer LJ, Silva JE. Resting energy expenditure is sensitive to small dose changes in patients on chronic thyroid hormone replacement. J
Clin Endocrinol Metab 1997;82:1118-1125.
(97) Poehlman E, Horton E. Energy needs:assessment and requirements in humans. Modern nutrition in health and disease. 9th edition ed. Baltimore: Lippincott Williams & Wilkins; 1999;95-104.
(98) Davidsen L, Vistisen B, Astrup A. Impact of the menstrual cycle on determinants of energy balance: a putative role in weight loss attempts. Int J
Obes (Lond) 2007;31:1777-1785.
(99) Butterfield GE, Gates J, Fleming S, Brooks GA, Sutton JR, Reeves JT. Increased energy intake minimizes weight loss in men at high altitude. J Appl
Physiol 1992;72:1741-1748.
(100) Lazzer S, Boirie Y, Montaurier C, Vernet J, Meyer M, Vermorel M. A weight reduction program preserves fat-free mass but not metabolic rate in obese adolescents. Obes Res 2004;12:233-240.
(101) Menozzi R, Bondi M, Baldini A, Venneri MG, Velardo A, Del RG. Resting metabolic rate, fat-free mass and catecholamine excretion during weight loss in female obese patients. Br J Nutr 2000;84:515-520.
(102) Heilbronn LK, de JL, Frisard MI et al. Effect of 6-month calorie restriction on biomarkers of longevity, metabolic adaptation, and oxidative stress in overweight individuals: a randomized controlled trial. JAMA 2006;295:1539-1548.
(103) Byrne HK, Wilmore JH. The effects of a 20-week exercise training program on resting metabolic rate in previously sedentary, moderately obese women. Int J Sport Nutr Exerc Metab 2001;11:15-31.
79
Master thesis in Clinical Nutrition, Anu Koivisto 2009
(104) Carey DG, Pliego GJ, Raymond RL. Body composition and metabolic changes following bariatric surgery: effects on fat mass, lean mass and basal metabolic rate: six months to one-year follow-up. Obes Surg 2006;16:1602-1608.
(105) Rosenbaum M, Hirsch J, Gallagher DA, Leibel RL. Long-term persistence of adaptive thermogenesis in subjects who have maintained a reduced body weight. Am J Clin Nutr 2008;88:906-912.
(106) Weyer C, Walford RL, Harper IT et al. Energy metabolism after 2 y of energy restriction: the biosphere 2 experiment. Am J Clin Nutr 2000;72:946-953.
(107) Weinsier RL, Nagy TR, Hunter GR, Darnell BE, Hensrud DD, Weiss HL. Do adaptive changes in metabolic rate favor weight regain in weight-reduced individuals? An examination of the set-point theory. Am J Clin Nutr 2000;72:1088-1094.
(108) Melby CL, Schmidt WD, Corrigan D. Resting metabolic rate in weight-cycling collegiate wrestlers compared with physically active, noncycling control subjects. Am J Clin Nutr 1990;52:409-414.
(109) Manore MM, Thompson JL. Energy requirements of the athlete: assessment and evidence of energy efficiency. Clinical sports nutrition. 3rd edition ed. Ausralia: McGraw-Hill; 2006;113-134.
(110) Seidell JC, Muller DC, Sorkin JD, Andres R. Fasting respiratory exchange ratio and resting metabolic rate as predictors of weight gain: the Baltimore Longitudinal Study on Aging. Int J Obes Relat Metab Disord 1992;16:667-674.
(111) Ravussin E, Gautier JF. Metabolic predictors of weight gain. Int J Obes Relat
Metab Disord 1999;23 Suppl 1:37-41.
(112) Venkatraman JT, Pendergast DR. Effect of dietary intake on immune function in athletes. Sports Med 2002;32:323-337.
(113) Imai T, Seki S, Dobashi H, Ohkawa T, Habu Y, Hiraide H. Effect of weight loss on T-cell receptor-mediated T-cell function in elite athletes. Med Sci
Sports Exerc 2002;34:245-250.
(114) Talbott SM, Shapses SA. Fasting and energy intake influence bone turnover in lightweight male rowers. Int J Sport Nutr 1998;8:377-387.

80
Master thesis in Clinical Nutrition, Anu Koivisto 2009
(115) De Souza MJ, West SL, Jamal SA, Hawker GA, Gundberg CM, Williams NI. The presence of both an energy deficiency and estrogen deficiency exacerbate alterations of bone metabolism in exercising women. Bone 2008;43:140-148.
(116) Nattiv A, Loucks AB, Manore MM, Sanborn CF, Sundgot-Borgen J, Warren MP. American College of Sports Medicine position stand. The female athlete triad. Med Sci Sports Exerc 2007;39:1867-1882.
(117) Torres-Mejia G, Guzman PR, Tellez-Rojo MM, Lazcano-Ponce E. Peak bone mass and bone mineral density correlates for 9 to 24 year-old Mexican women, using corrected BMD. Salud Publica Mex 2009;51 Suppl 1:S84-S92.
(118) Khan AA, Brown JP, Kendler DL et al. The 2002 Canadian bone densitometry recommendations: take-home messages. CMAJ 2002;167:1141-1145.
(119) Torstveit MK, Sundgot-Borgen J. The female athlete triad: are elite athletes at increased risk? Med Sci Sports Exerc 2005;37:184-193.
(120) Torstveit MK, Rosenvinge JH, Sundgot-Borgen J. Prevalence of eating disorders and the predictive power of risk models in female elite athletes: a controlled study. Scand J Med Sci Sports 2008;18:108-118.
(121) Sundgot-Borgen J. Risk and trigger factors for the development of eating disorders in female elite athletes. Med Sci Sports Exerc 1994;26:414-419.
(122) Buford TW, Rossi SJ, Smith DB, O'Brien MS, Pickering C. The effect of a competitive wrestling season on body weight, hydration, and muscular performance in collegiate wrestlers. J Strength Cond Res 2006;20:689-692.
(123) Saarni SE, Rissanen A, Sarna S, Koskenvuo M, Kaprio J. Weight cycling of athletes and subsequent weight gain in middleage. Int J Obes (Lond) 2006;30:1639-1644.
(124) Garner DM, Olmsted MP, Polivy J. Manual of eating disorder inventory [abstract]Garner DM, Olmsted MP, Polivy J. Psychological assesments
resources 1984;1-19
(125) Mattilsynet, Sosial -og helsedirektoratet, Universitet i Oslo. Mat på data 5.0. 2006. Oslo.
Ref Type: Report
81
Master thesis in Clinical Nutrition, Anu Koivisto 2009
(126) Statens råd for ernæring og fysisk aktivitet, Satens næringsmiddeltilsyn, Institutt for ernæringsforskning U. Den store matvaretabellen. 2 ed. Oslo: Gyldendal Undervisning, 2001.
(127) Lewis MK, Blake GM, Fogelman I. Patient dose in dual x-ray absorptiometry. Osteoporos Int 1994;4:11-15.
(128) Levine JA, Abboud L, Barry M, Reed JE, Sheedy PF, Jensen MD. Measuring leg muscle and fat mass in humans: comparison of CT and dual-energy X-ray absorptiometry. J Appl Physiol 2000;88:452-456.
(129) Visser M, Fuerst T, Lang T, Salamone L, Harris TB. Validity of fan-beam dual-energy X-ray absorptiometry for measuring fat-free mass and leg muscle mass. Health, Aging, and Body Composition Study--Dual-Energy X-ray Absorptiometry and Body Composition Working Group. J Appl Physiol 1999;87:1513-1520.
(130) Mazess RB, Barden HS, Bisek JP, Hanson J. Dual-energy x-ray absorptiometry for total-body and regional bone-mineral and soft-tissue composition. Am J Clin Nutr 1990;51:1106-1112.
(131) Bolanowski M, Nilsson BE. Assessment of human body composition using dual-energy x-ray absorptiometry and bioelectrical impedance analysis. Med
Sci Monit 2001;7:1029-1033.
(132) Margulies L, Horlick M, Thornton JC, Wang J, Ioannidou E, Heymsfield SB. Reproducibility of pediatric whole body bone and body composition measures by dual-energy X-ray absorptiometry using the GE Lunar Prodigy. J Clin
Densitom 2005;8:298-304.
(133) Lohman TG, Harris M, Teixeira PJ, Weiss L. Assessing body composition and changes in body composition. Another look at dual-energy X-ray absorptiometry. Ann N Y Acad Sci 2000;904:45-54.
(134) Weyers AM, Mazzetti SA, Love DM, Gomez AL, Kraemer WJ, Volek JS. Comparison of methods for assessing body composition changes during weight loss. Med Sci Sports Exerc 2002;34:497-502.
(135) Going SB, Massett MP, Hall MC et al. Detection of small changes in body composition by dual-energy x-ray absorptiometry. Am J Clin Nutr 1993;57:845-850.
(136) WEIR JB. New methods for calculating metabolic rate with special reference to protein metabolism. J Physiol 1949;109:1-9.
82
Master thesis in Clinical Nutrition, Anu Koivisto 2009
(137) Cunningham JJ. A reanalysis of the factors influencing basal metabolic rate in normal adults. Am J Clin Nutr 1980;33:2372-2374.
(138) Thompson J, Manore MM. Predicted and measured resting metabolic rate of male and female endurance athletes. J Am Diet Assoc 1996;96:30-34.
(139) Altman DG. Clinical Trials: Sample size. Practical Statistics for Medical
Research. USA: Chapman and Hall/CRC; 1991;455-460.
(140) Manore MM. Dietary recommendations and athletic menstrual dysfunction. Sports Med 2002;32:887-901.
(141) Sundgot-Borgen J, Berglund B, Torstveit MK. Nutritional supplements in Norwegian elite athletes--impact of international ranking and advisors. Scand
J Med Sci Sports 2003;13:138-144.
(142) Teixeira PJ, Going SB, Sardinha LB, Lohman TG. A review of psychosocial pre-treatment predictors of weight control. Obes Rev 2005;6:43-65.
(143) Kajioka T, Tsuzuku S, Shimokata H, Sato Y. Effects of intentional weight cycling on non-obese young women. Metabolism 2002;51:149-154.
(144) Leibel RL, Rosenbaum M, Hirsch J. Changes in energy expenditure resulting from altered body weight. N Engl J Med 1995;332:621-628.
(145) Steen SN, Oppliger RA, Brownell KD. Metabolic effects of repeated weight loss and regain in adolescent wrestlers. JAMA 1988;260:47-50.
(146) Black AE. Dietary assessment for sports dietetics [abstract]Black AE. British
Nutrition Bulletin 2001;26:29-42
(147) Magkos F, Yannakoulia M. Methodology of dietary assessment in athletes: concepts and pitfalls. Curr Opin Clin Nutr Metab Care 2003;6:539-549.
(148) Deakin V. Measuring nutritional status of athletes. In: Burke L, Deakin V, eds. Clinical sports nutrition. 3rd edition ed. Australia: McGraw-Hill; 2006;21-51.
(149) Oppliger RA, Case HS, Horswill CA, Landry GL, Shelter AC. American College of Sports Medicine position stand. Weight loss in wrestlers. Med Sci
Sports Exerc 1996;28:ix-xii.
83
Master thesis in Clinical Nutrition, Anu Koivisto 2009
(150) Brehm BJ, D'Alessio DA. Benefits of high-protein weight loss diets: enough evidence for practice? Curr Opin Endocrinol Diabetes Obes 2008;15:416-421.
(151) Horber FF, Thomi F, Casez JP, Fonteille J, Jaeger P. Impact of hydration status on body composition as measured by dual energy X-ray absorptiometry in normal volunteers and patients on haemodialysis. Br J Radiol 1992;65:895-900.
(152) SHEPHARD RJ. A critical examination of the Douglas bag technique. J
Physiol 1955;127:515-524.
(153) Mills J. The use of an infra red analyser in testing properties of Douglas bag [abstract]Mills J. J Physiol 1951;116:22-23
(154) Ryan AS, Pratley RE, Elahi D, Goldberg AP. Resistive training increases fat-free mass and maintains RMR despite weight loss in postmenopausal women. J Appl Physiol 1995;79:818-823.
(155) Finaud J, Degoutte F, Scislowski V, Rouveix M, Durand D, Filaire E. Competition and food restriction effects on oxidative stress in judo. Int J
Sports Med 2006;27:834-841.
(156) Koral J, Dosseville F. Combination of gradual and rapid weight loss: Effects on physical performance and psychological state of elite judo athletes. J
Sports Sci 2009;27:115-120.
(157) Ciloglu F, Peker I, Pehlivan A et al. Exercise intensity and its effects on thyroid hormones. Neuro Endocrinol Lett 2005;26:830-834.
(158) Fatourechi V. Subclinical hypothyroidism: an update for primary care physicians. Mayo Clin Proc 2009;84:65-71.
(159) Luke A, Schoeller DA. Basal metabolic rate, fat-free mass, and body cell mass during energy restriction. Metabolism 1992;41:450-456.
(160) Ravussin E, Bogardus C. A brief overview of human energy metabolism and its relationship to essential obesity. Am J Clin Nutr 1992;55:242S-245S.
(161) Cunningham JJ. Body composition as a determinant of energy expenditure: a synthetic review and a proposed general prediction equation. Am J Clin Nutr 1991;54:963-969.
84
Master thesis in Clinical Nutrition, Anu Koivisto 2009
(162) McCargar LJ, Simmons D, Craton N, Taunton JE, Birmingham CL. Physiological effects of weight cycling in female lightweight rowers. Can J
Appl Physiol 1993;18:291-303.
(163) Speakman JR, Selman C. Physical activity and resting metabolic rate. Proc
Nutr Soc 2003;62:621-634.
85
Master thesis in Clinical Nutrition, Anu Koivisto 2009
List of appendices
Appendix 1: Summary of weight loss studies with athletes
Appendix 2: Approval from Regional Ethics Committee of Norway
Appendix 3: Approval from
Appendix 4: Information letter to sport federations
Appendix 5: Information letter to participants
Appendix 6: Dietary registration scheme
Appendix 7: Screening questionnaire
Appendix 8: Strength training programme
Appendix 9: Example meal plan
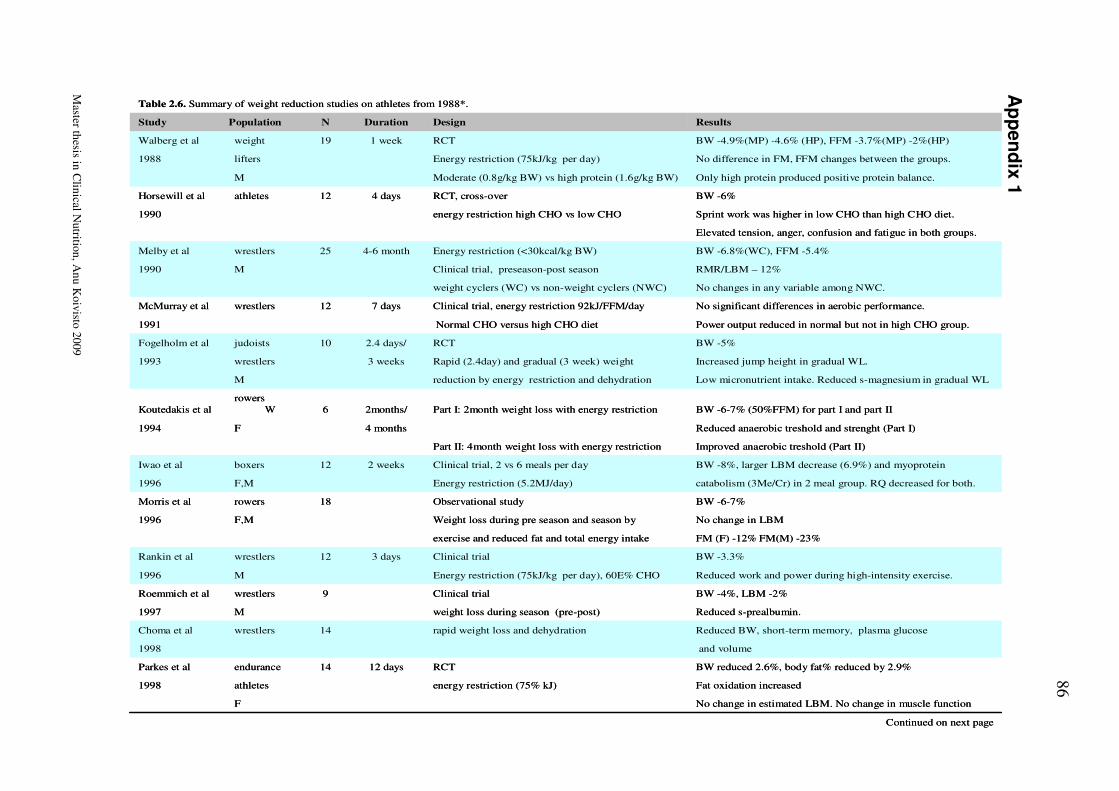
86
Master th
esis in C
linical N
utritio
n, A
nu
Koiv
isto 2
009
Ap
pen
dix 1
Continued on next page
No change in estimated LBM. No change in muscle functionF
Fat oxidation increased energy restriction (75% kJ)athletes1998
BW reduced 2.6%, body fat% reduced by 2.9%RCT12 days14endurance Parkes et al
and volume1998
Reduced BW, short-term memory, plasma glucoserapid weight loss and dehydration14wrestlersChoma et al
Reduced s-prealbumin.weight loss during season (pre-post)M1997
BW -4%, LBM -2%Clinical trial9wrestlersRoemmich et al
Reduced work and power during high-intensity exercise.Energy restriction (75kJ/kg per day), 60E% CHOM1996
BW -3.3%Clinical trial3 days12wrestlersRankin et al
FM (F) -12% FM(M) -23%exercise and reduced fat and total energy intake
No change in LBMWeight loss during pre season and season byF,M1996
BW -6-7%Observational study18rowersMorris et al
catabolism (3Me/Cr) in 2 meal group. RQ decreased for both.Energy restriction (5.2MJ/day)F,M1996
BW -8%, larger LBM decrease (6.9%) and myoprotein Clinical trial, 2 vs 6 meals per day2 weeks12boxersIwao et al
Improved anaerobic treshold (Part II)Part II: 4month weight loss with energy restriction
Reduced anaerobic treshold and strenght (Part I)4 monthsF1994
BW -6-7% (50%FFM) for part I and part IIPart I: 2month weight loss with energy restriction2months/6rowers
WKoutedakis et al
Low micronutrient intake. Reduced s-magnesium in gradual WLreduction by energy restriction and dehydrationM
Increased jump height in gradual WL.Rapid (2.4day) and gradual (3 week) weight 3 weekswrestlers1993
BW -5%RCT2.4 days/10judoistsFogelholm et al
Power output reduced in normal but not in high CHO group.Normal CHO versus high CHO diet1991
No significant differences in aerobic performance.Clinical trial, energy restriction 92kJ/FFM/day7 days12wrestlersMcMurray et al
No changes in any variable among NWC.weight cyclers (WC) vs non-weight cyclers (NWC)
RMR/LBM – 12% Clinical trial, preseason-post season M1990
BW -6.8%(WC), FFM -5.4%Energy restriction (<30kcal/kg BW)4-6 month25wrestlersMelby et al
Elevated tension, anger, confusion and fatigue in both groups.
Sprint work was higher in low CHO than high CHO diet.energy restriction high CHO vs low CHO1990
BW -6%RCT, cross-over 4 days12athletesHorsewill et al
Only high protein produced positive protein balance.Moderate (0.8g/kg BW) vs high protein (1.6g/kg BW)M
No difference in FM, FFM changes between the groups.Energy restriction (75kJ/kg per day)lifters1988
BW -4.9%(MP) -4.6% (HP), FFM -3.7%(MP) -2%(HP)RCT 1 week19weight Walberg et al
ResultsDesignDurationNStudy Population
Table 2.6. Summary of weight reduction studies on athletes from 1988*.
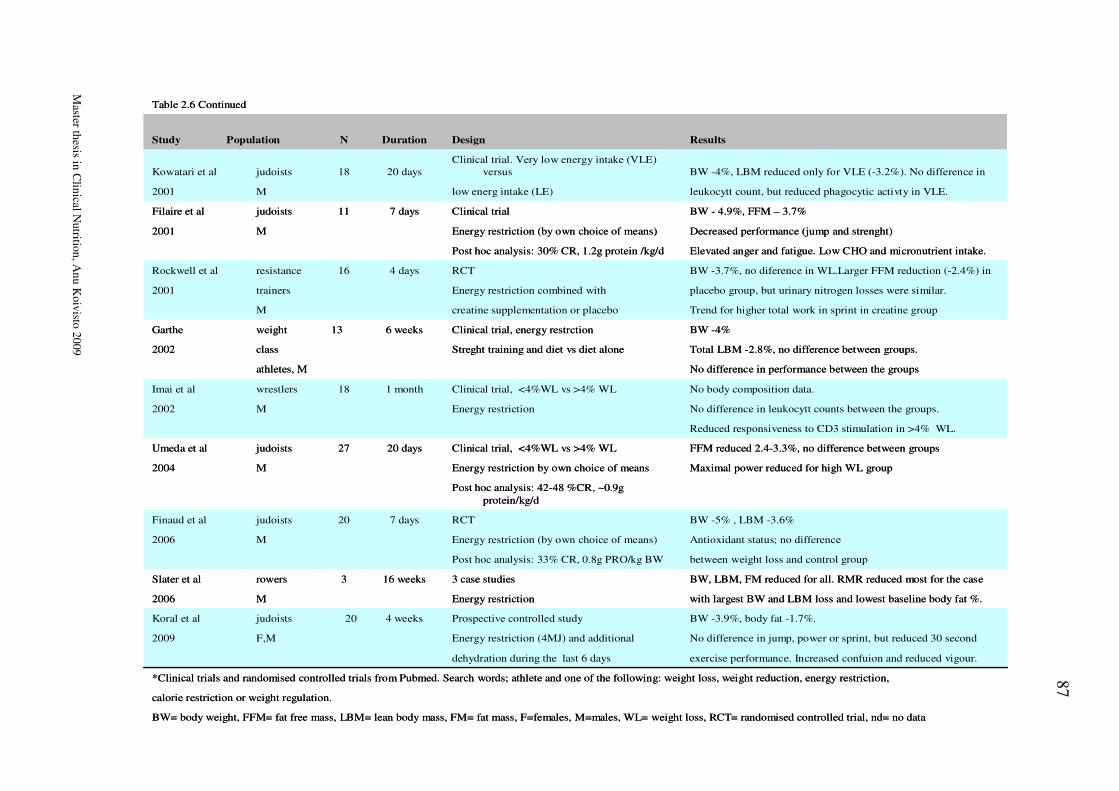
87
Master th
esis in C
linical N
utritio
n, A
nu
Koiv
isto 2
009
BW= body weight, FFM= fat free mass, LBM= lean body mass, FM= fat mass, F=females, M=males, WL= weight loss, RCT= randomised controlled trial, nd= no data
calorie restriction or weight regulation.
*Clinical trials and randomised controlled trials from Pubmed. Search words; athlete and one of the following: weight loss, weight reduction, energy restriction,
exercise performance. Increased confuion and reduced vigour.dehydration during the last 6 days
No difference in jump, power or sprint, but reduced 30 secondEnergy restriction (4MJ) and additionalF,M2009
BW -3.9%, body fat -1.7%.Prospective controlled study4 weeks20judoistsKoral et al
with largest BW and LBM loss and lowest baseline body fat %.Energy restriction M2006
BW, LBM, FM reduced for all. RMR reduced most for the case 3 case studies16 weeks3rowersSlater et al
between weight loss and control groupPost hoc analysis: 33% CR, 0.8g PRO/kg BW
Antioxidant status; no difference Energy restriction (by own choice of means)M2006
BW -5% , LBM -3.6%RCT7 days20judoistsFinaud et al
Post hoc analysis: 42-48 %CR, ~0.9g
protein/kg/d
Maximal power reduced for high WL groupEnergy restriction by own choice of meansM2004
FFM reduced 2.4-3.3%, no difference between groupsClinical trial, <4%WL vs >4% WL20 days27judoistsUmeda et al
Reduced responsiveness to CD3 stimulation in >4% WL.
No difference in leukocytt counts between the groups.Energy restrictionM2002
No body composition data. Clinical trial, <4%WL vs >4% WL1 month18wrestlersImai et al
No difference in performance between the groupsathletes, M
Total LBM -2.8%, no difference between groups.Streght training and diet vs diet aloneclass 2002
BW -4%Clinical trial, energy restrction 6 weeks13weightGarthe
Trend for higher total work in sprint in creatine groupcreatine supplementation or placeboM
placebo group, but urinary nitrogen losses were similar.Energy restriction combined withtrainers2001
BW -3.7%, no diference in WL.Larger FFM reduction (-2.4%) inRCT4 days16resistance Rockwell et al
Elevated anger and fatigue. Low CHO and micronutrient intake.Post hoc analysis: 30% CR, 1.2g protein /kg/d
Decreased performance (jump and strenght)Energy restriction (by own choice of means)M2001
BW - 4.9%, FFM – 3.7%Clinical trial7 days11judoistsFilaire et al
leukocytt count, but reduced phagocytic activty in VLE.low energ intake (LE)M2001
BW -4%, LBM reduced only for VLE (-3.2%). No difference in Clinical trial. Very low energy intake (VLE)
versus20 days18judoistsKowatari et al
ResultsDesignDurationNStudy Population
Table 2.6 Continued
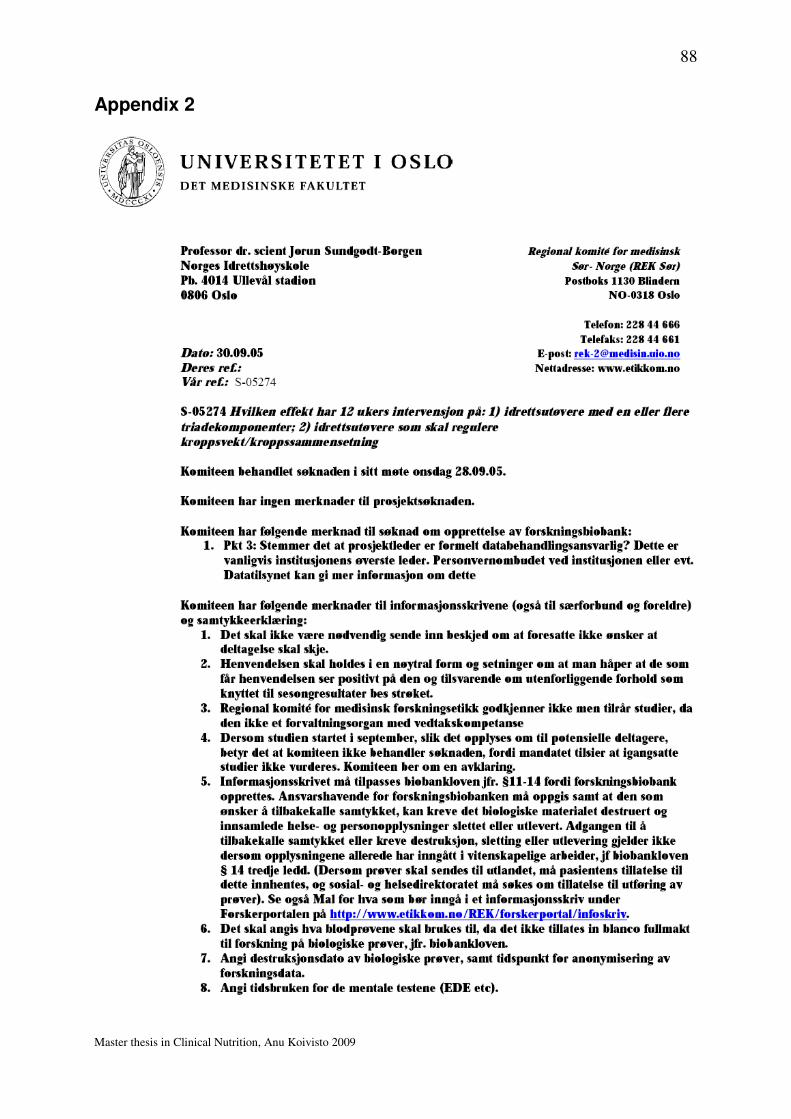
88
Master thesis in Clinical Nutrition, Anu Koivisto 2009
Appendix 2
89
Master thesis in Clinical Nutrition, Anu Koivisto 2009
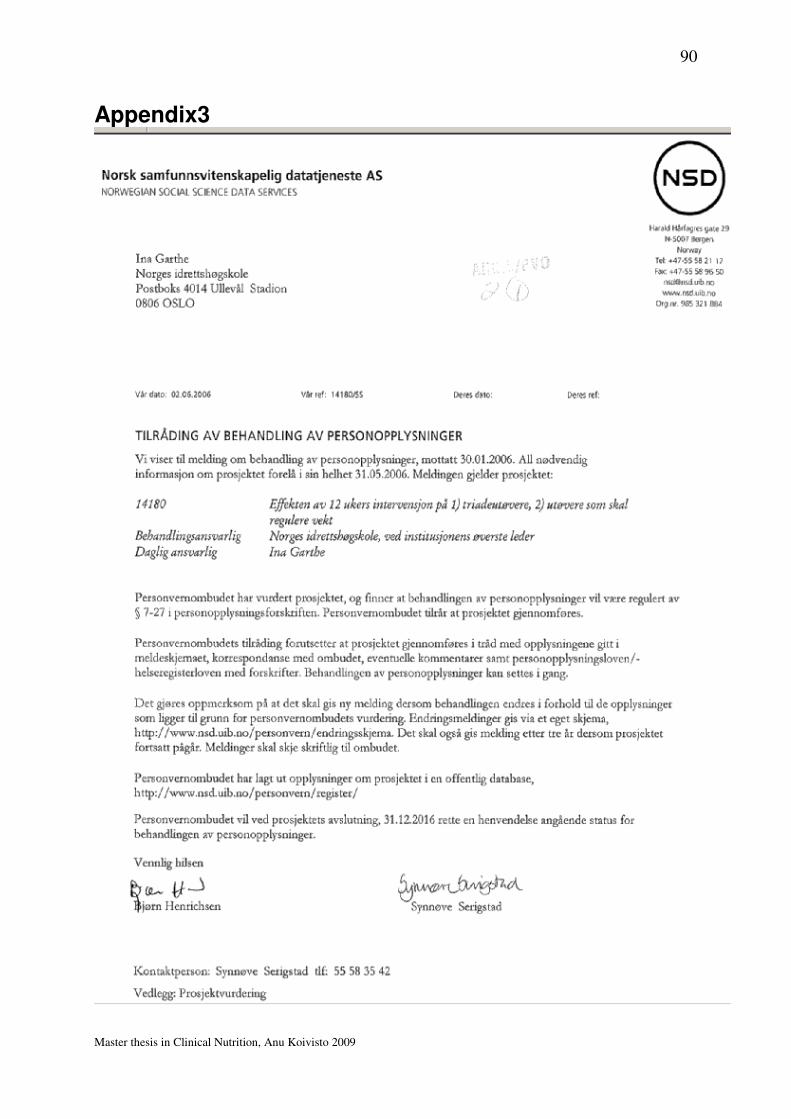
90
Master thesis in Clinical Nutrition, Anu Koivisto 2009
Appendix3

91
Master thesis in Clinical Nutrition, Anu Koivisto 2009
92
Master thesis in Clinical Nutrition, Anu Koivisto 2009
Appendix 4
Informasjon til særforbund om deltakelse i forskningsprosjekt for Idrettsutøvere
Vi henvender oss til idrettstøvere i utvalgte særforbund for å spør om de kan tenke seg å være med på en studie i regi av Norges Idrettshøgskole og Olympiatoppen. Hensikten med forskningsprosjektet er å se hvordan den veiledningen som gis på Olympiatoppen når det gjelder ernæring, vektregulering og forstyrret spiseatferd virker.
Bakgrunn Idrettsutøvere har et økt behov for energi og næringsstoffer. Valg av matvarer, måltidsfrekvens, timing av måltider og restitusjon er viktige faktorer i et treningsregime for å få maksimalt utbytte av utøvers potensial. Dette kan by på flere utfordringer for noen utøvere: energiinntak (kaloriinntak) i forhold til forbruk, tilstrekkelig inntak av makro- og mikronæringsstoffer og planlegging og tilrettelegging av måltider. Ernæringsavdelingen, treningsavdelingen og helseavdelingen på Olympiatoppen har i de siste årene tilbudt veiledning på styrketrening, vektregulering og behandling av utøvere med forstyrret spiseatferd/spiseforstyrrelser. Vi ønsker nå å teste ut effekten av de veiledningsregimene vi tilbyr. Regimene inkluderer kost- og treningsveiledning og vil bli tilrettelagt din idrett i samarbeid med deg og evt. din trener.
Formål Formålet med denne studien er følgende:
1) Se på effekten av en 24 ukers behandling/veiledning av utøvere med forstyrret spiseatferd/spiseforstyrrelse, menstruasjonsforstyrrelser og redusert beinmasse
2) Se på effekten av 6-12 ukers veiledning på vektreduksjon 3) Se på effekten av 6-12 ukers veiledning på vektøkning
Metode Utøvere som henvender seg til Olympiatoppens helseavdeling og ernæringsavdeling vil få avtale om tid for en samtale med Professor Jorunn Sundgot-Borgen. I forbindelse med denne samtalen vil det bli klargjort hvilke behov utøveren har og hva han/hun ønsker hjelp til, og utøverne blir således delt inn i: triade, vektreduksjon og vektøkning.Utøverne blir så randomisert inn i to grupper, veiledning I og veiledning II, der vi ønsker å se på effekten av de ulike veiledningsregimene.
Hvem blir forespurt om å delta? Juniorer og seniorer (landslagsutøvere – A, B og rekrutter) i utvalgte særforbund som er
93
Master thesis in Clinical Nutrition, Anu Koivisto 2009
medlem av Norges Idrettsforbund, samt elever/utøvere ved Norges Toppidrettsgymnas, Wang Toppidrettsgymnas. Primært vil det være utøvere som henvender seg til Olympiatoppens helseavdeling, ernæringsavdeling eller treningsavdeling for følgende veiledning:
1) Vektøkning (vektøkning i form av økt muskelmasse) 2) Vektreduksjon (vektreduksjon i form av tap av fettmasse) 3) Veiledning i forhold til forstyrret spiseadferd/spiseforstyrrelser,
menstruasjonsforstyrrelser eller påvist tap av beinmasse
Hva skal du gjøre dersom du blir med?
•••• En samtale med Jorunn Sundgot-Borgen •••• Fylle ut spørreskjema
Målinger som blir gjort i forbindelse med studien
•••• Måle kroppssammensetning (DXA og kaliper) •••• Blodprøve: Østradiol, progesteron, LH, FSH, DHEA, testosteron, kortisol, T3, T4,
TSH, IGF-1, jern, B12, kolesterol, HDL, LDL, triglyserider, albumin, kalsium. •••• Styrketester •••• 4 dagers veid kostregistrering •••• Mat og treningsdagbok •••• Mental evaluering: EDE, EDI, Contingent self-esteem Scale.
De involverte i prosjektet er underlagt taushetsplikt og prosjektet er meldt til personvernombudet for forskning. Blodprøvene vil bli oppbevart i en biobank uten kommersielle interesser (vurdert av Regional Etisk Komité). Prøvene vil bli lagret i inntil 10 år. Andre forskningsdata vil bli anonymisert i utgangen av 2016. Ansvarlig for biobanken er Professor Jorunn Sundgot-Borgen ved NIH. Dersom utøver/foreldre ønsker å tilbakekalle samtykket, kan dere kreve det biologiske materialet destruert og innsamlede helse- og personopplysninger slettet eller utlevert. Vi startet undersøkelsen i januar 2006 og regner med å avslutte desember 2008.
Det er selvfølgelig frivillig å delta i undersøkelsen og om du ønsker det, kan du trekke seg fra studien uten grunn når du vil. Dersom du vil være med på studien, ber vi deg skrive under på en samtykkeerklæring på neste side. Dersom du er under 18 år skal dine foreldre informeres om studien. De har således mulighet til å nekte deltakelse på vegne av deg (se vedlagt skriv). Dersom du er under 16 år må vi ha dine forelders skriftlige godkjennelse (se vedlagt skriv).
Vi vil samarbeide med trenere og ledere slik at forsøket legges til rette med tanke på å forstyrre sesongen minst mulig. Du vil få mulighet til å gå igjennom en del tester som en vanligvis ikke får anledning til, og det er ikke knyttet risiko eller smerte til noen av testene. Du vil også få en profesjonell vurdering av kostholdet, og nøye oppfølging gjennom den perioden du er med på undersøkelsen. Som forsøksperson er du forsikret gjennom forsøket, slik at de er sikret økonomisk kompensasjon for eventuelle skader eller komplikasjoner.
Olympiatoppens helseavdeling, ernæringsavdeling og treningsavdeling er med i teamet. Prosjektleder for studien er Professor Jorunn Sundgot-Borgen og dr.grad stipendiat Ina Garthe (som for tiden er erstattet av Anu Koivisto) . Medisinsk ansvarlig er Olympiatoppens sjefslege Professor Lars Engebretsen.
94
Master thesis in Clinical Nutrition, Anu Koivisto 2009
For spørsmål, kontakt Anu eller Ina: Anu Koivisto: [email protected] / 45465743 Ina Garthe: [email protected]
Med vennlig hilsen
Jorunn Sundgot-Borgen (sign.) Ina Garthe (sign.) Jarle Aambø (sign.)
Professor dr.grad stipendiat Toppidrettssjef
Norges idrettshøgskole Norges idrettshøgskole Olympiatoppen
Olympiatoppen Olympiatoppen
95
Master thesis in Clinical Nutrition, Anu Koivisto 2009
Appendix 5
Forespørsel om deltakelse i forskningsprosjekt for Idrettsutøvere
Vi henvender oss til deg som utøver og spør om du kan tenke deg å være med på en studie i regi av Norges Idrettshøgskole og Olympiatoppen. Hensikten med forskningsprosjektet er å se hvordan den veiledningen som gis på Olympiatoppen når det gjelder ernæring, vektregulering og forstyrret spiseatferd virker.
Bakgrunn
Idrettsutøvere har et økt behov for energi og næringsstoffer. Valg av matvarer, måltidsfrekvens, timing av måltider og restitusjon er viktige faktorer i et treningsregime for å få maksimalt utbytte av utøvers potensial. Dette kan by på flere utfordringer for noen utøvere: energiinntak (kaloriinntak) i forhold til forbruk, tilstrekkelig inntak av makro- og mikronæringsstoffer og planlegging og tilrettelegging av måltider. Ernæringsavdelingen og helseavdelingen på Olympiatoppen har i de siste årene tilbudt veiledning på vektregulering og behandling av utøvere med forstyrret spiseatferd/spiseforstyrrelser. Vi ønsker nå å teste ut effekten av de veiledningsregimene vi tilbyr.
Formål
Formålet med denne studien er følgende:
4) Se på effekten av en 24 ukers behandling/veiledning av utøvere med forstyrret spiseatferd/spiseforstyrrelse, menstruasjonsforstyrrelser og redusert beinmasse
5) Se på effekten av 6-12 ukers veiledning på vektregulering (vektøkning, vektreduksjon) 6) Se på effekten av kostoptimalisering
Metode
Utøvere som henvender seg til Olympiatoppens helseavdeling og ernæringsavdeling vil få avtale om tid for en samtale med Professor Jorunn Sundgot-Borgen. I forbindelse med denne samtalen vil det bli klargjort hvilke behov utøveren har og hva han/hun ønsker hjelp til, og utøverne blir således delt inn i: triade, vektreduksjon, vektøkning og kostoptimalisering.
Utøverne blir så randomisert inn i to grupper, veiledning I og veiledning II, der vi ønsker å se på effekten av de ulike veiledningsregimene.
Hvem blir forespurt om å delta?

96
Master thesis in Clinical Nutrition, Anu Koivisto 2009
Juniorer og seniorer (landslagsutøvere – A, B og rekrutter) i utvalgte særforbund som er medlem av Norges Idrettsforbund, samt elever/utøvere ved Norges Toppidrettsgymnas, Wang Toppidrettsgymnas. Primært vil det være utøvere som henvender seg til Olympiatoppens helseavdeling, ernæringsavdeling eller treningsavdeling for følgende veiledning:
1) kostoptimalisering (optimalisering av kostholdet i forhold til din idrett) 2) Vektøkning (vektøkning i form av økt muskelmasse) 3) Vektreduksjon (vektreduksjon i form av tap av fettmasse) 4) Veiledning i forhold til forstyrret spiseadferd/spiseforstyrrelser,
menstruasjonsforstyrrelser eller påvist tap av beinmasse
Hva skal du gjøre dersom du blir med?
•••• En samtale med Jorunn Sundgot-Borgen •••• Fylle ut et spørreskjema
Målinger som blir gjort i forbindelse med studien
•••• Måle kroppssammensetning (DXA og kaliper) •••• Blodprøve: Østradiol, progesteron, LH, FSH, DHEA, testosteron, leptin, kortisol, T3,
T4, TSH, IGF-1, jern, B12, kolesterol, HDL, LDL, triglyserider, albumin, kalsium. •••• Styrketester •••• 4 dagers veid kostregistrering •••• Mat og treningsdagbok •••• Mental evaluering: EDE, EDI, Contingent self-esteem Scale.
De involverte i prosjektet er underlagt taushetsplikt og prosjektet er meldt til personvernombudet for forskning. Blodprøvene vil bli oppbevart i en biobank uten kommersielle interesser (vurdert av Regional Etisk Komite). Prøvene vil bli lagret i inntil 10 år. Andre forskningsdata vil bli anonymisert i utgangen av 2016. Ansvarlig for biobanken er Professor Jorunn Sundgot-Borgen ved NIH. Dersom utøver/foreldre ønsker å tilbakekalle samtykket, kan dere kreve det biologiske materialet destruert og innsamlede helse- og personopplysninger slettet eller utlevert.
Vi starter undersøkelsen i løpet av januar 2006.
Det er selvfølgelig frivillig å delta i undersøkelsen og om du ønsker det, kan du trekke seg fra studien uten grunn når du vil. Dersom du vil være med på studien, ber vi deg skrive under på en samtykkeerklæring på neste side. Dersom du er under 18 år skal dine foreldre informeres om studien. De har således mulighet til å nekte deltakelse på vegne av deg (se vedlagt skriv). Dersom du er under 16 år må vi ha dine forelders skriftlige godkjennelse (se vedlagt skriv).
Vi vil samarbeide med trenere og ledere slik at forsøket legges til rette med tanke på å forstyrre sesongen minst mulig. Du vil få mulighet til å gå igjennom en del tester som en vanligvis ikke får anledning til, og det er ikke knyttet risiko eller smerte til noen av testene. Du vil også få en profesjonell vurdering av kostholdet, og nøye oppfølging gjennom den perioden du er med på undersøkelsen. Som forsøksperson er du forsikret gjennom forsøket, slik at de er sikret økonomisk kompensasjon for eventuelle skader eller komplikasjoner.
97
Master thesis in Clinical Nutrition, Anu Koivisto 2009
Olympiatoppens helseavdeling, ernæringsavdeling og treningsavdeling er med i teamet. Prosjektleder for studien er Professor Jorunn Sundgot-Borgen og stipendiat er Cand.Scient Ina Garthe. Medisinsk ansvarlig er Olympiatoppens sjefslege Professor Lars Engebretsen.
Jorunn Sundgot-Borgen: 23262335 [email protected]
Ina Garthe: 2300000/99003916 [email protected]
Anu Koivisto:45465743 [email protected]
Med vennlig hilsen
Jorunn Sundgot-Borgen Ina Garthe Jarle Aambø
Professor Cand.Scient Toppidrettssjef
Norges idrettshøgskole Norges idrettshøgskole Olympiatoppen
Olympiatoppen Olympiatoppen
98
Master thesis in Clinical Nutrition, Anu Koivisto 2009
Samtykkeerklæring for utøver
Ja, jeg har lest informasjonsskrivet og blitt muntlig informert om studien og vet hva inklusjonen innebærer. Jeg vet at jeg kan trekke meg når som helst underveis, uten grunn. Jeg samtykker herved å delta i studien.
Dato:………….. Sted:……………….
Underskrift utøver:……………………………………………………………………………
Samtykkeerklæring for foresatte dersom utøver er under 16 år
Ja, jeg har lest informasjonsskrivet og sier meg enig i at min sønn/datter kan delta i studien.
Dato:………….. Sted:……………….
Underskrift foresatt:………………………………………………………………………
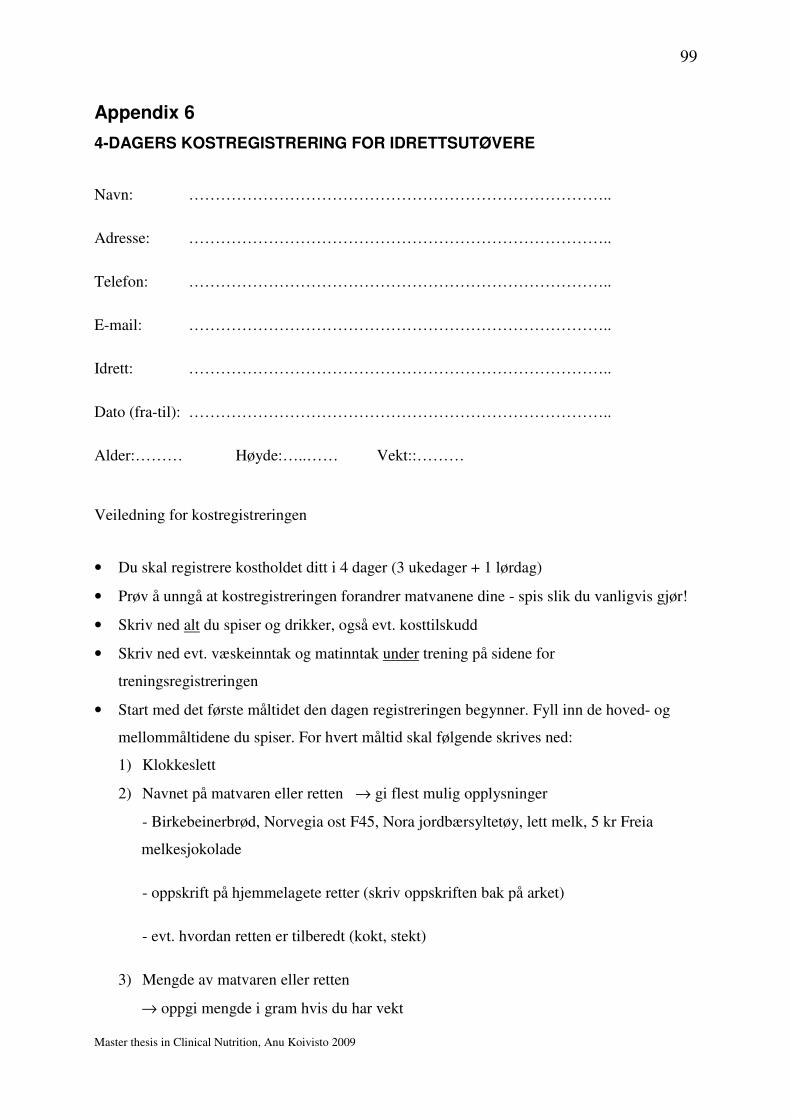
99
Master thesis in Clinical Nutrition, Anu Koivisto 2009
Appendix 6
4-DAGERS KOSTREGISTRERING FOR IDRETTSUTØVERE
Navn: ……………………………………………………………………..
Adresse: ……………………………………………………………………..
Telefon: ……………………………………………………………………..
E-mail: ……………………………………………………………………..
Idrett: ……………………………………………………………………..
Dato (fra-til): ……………………………………………………………………..
Alder:……… Høyde:…..…… Vekt::………
Veiledning for kostregistreringen
• Du skal registrere kostholdet ditt i 4 dager (3 ukedager + 1 lørdag)
• Prøv å unngå at kostregistreringen forandrer matvanene dine - spis slik du vanligvis gjør!
• Skriv ned alt du spiser og drikker, også evt. kosttilskudd
• Skriv ned evt. væskeinntak og matinntak under trening på sidene for
treningsregistreringen
• Start med det første måltidet den dagen registreringen begynner. Fyll inn de hoved- og
mellommåltidene du spiser. For hvert måltid skal følgende skrives ned:
1) Klokkeslett
2) Navnet på matvaren eller retten → gi flest mulig opplysninger
- Birkebeinerbrød, Norvegia ost F45, Nora jordbærsyltetøy, lett melk, 5 kr Freia
melkesjokolade
- oppskrift på hjemmelagete retter (skriv oppskriften bak på arket)
- evt. hvordan retten er tilberedt (kokt, stekt)
3) Mengde av matvaren eller retten
→ oppgi mengde i gram hvis du har vekt
100
Master thesis in Clinical Nutrition, Anu Koivisto 2009
→ oppgi mengde i husholdningsmål hvis du ikke har vekt
- antall, stykker, spiseskje, teskje, glass, kopp, dl
• Ring mg hvis du har noen spørsmål: # 45465743 eller mail:
• Send eller e-mail registreringen på Toppidrettsenteret så snart du er ferdig
Toppidrettssenteret /Anu Koivisto
Postboks 4004 Ullevål Stadion
N-0806 Oslo
Lykke til!
Hilsen Anu Koivisto
101
Master thesis in Clinical Nutrition, Anu Koivisto 2009
Dag 1Måltid 1 Kl. …………..Matvarer/retter Mengde…………………………………………………………. …………………………….…………………………………………………………. …………………………….…………………………………………………………. …………………………….…………………………………………………………. …………………………….Måltid 2 Kl. …………..Matvarer/retter Mengde…………………………………………………………. …………………………….…………………………………………………………. …………………………….…………………………………………………………. …………………………….…………………………………………………………. …………………………….Måltid 3 Kl. …………..Matvarer/retter Mengde…………………………………………………………. …………………………….…………………………………………………………. …………………………….…………………………………………………………. …………………………….…………………………………………………………. …………………………….Måltid 4 Kl. …………..Matvarer/retter Mengde…………………………………………………………. …………………………….…………………………………………………………. …………………………….…………………………………………………………. …………………………….…………………………………………………………. …………………………….Måltid 5 Kl. …………..Matvarer/retter Mengde…………………………………………………………. …………………………….…………………………………………………………. …………………………….…………………………………………………………. …………………………….…………………………………………………………. …………………………….Måltid 6 Kl. …………..Matvarer/retter Mengde…………………………………………………………. …………………………….…………………………………………………………. …………………………….…………………………………………………………. …………………………….…………………………………………………………. …………………………….

102
Master thesis in Clinical Nutrition, Anu Koivisto 2009
TRENINGSREGISTRERING Dag 1NB! Skriv ned væskeinntak og matinntak (mengde og type) hvis du bruker det under trening
DAG 1Økt 1 Kl. ………..……..
Type trening og intensitet Varighet……………………………………………………………..…. …………………….……………………………………………………………..…. …………………….Type væske-mat inntak Mengde
……………………………………………………………..…. …………………….Økt 2 Kl. ………..……..
Type trening og intensitet Varighet……………………………………………………………..…. …………………….……………………………………………………………..…. …………………….Type væske-mat inntak Mengde
……………………………………………………………..…. …………………….Kommentarer til kostregistrering/treningsregistrering:……………………………………………………………………………………………………………………………………………………………………………………………………………………………………………………………………………………………………………………………………………………………………………………………………………………………………………………………………………………………………………………………………………………………………………………………………………………………………………………………………………………………………………………………………………………………………………………………………………………………………………………………………………………………………………………………………………………………………………………
103
Master thesis in Clinical Nutrition, Anu Koivisto 2009
Dag 2Måltid 1 Kl. …………..
Matvarer/retter Mengde
…………………………………………………………. …………………………….
…………………………………………………………. …………………………….…………………………………………………………. …………………………….
…………………………………………………………. …………………………….
Måltid 2 Kl. …………..Matvarer/retter Mengde
…………………………………………………………. …………………………….
…………………………………………………………. …………………………….
…………………………………………………………. …………………………….…………………………………………………………. …………………………….
Måltid 3 Kl. …………..
Matvarer/retter Mengde
…………………………………………………………. ……………………………. …………………………………………………………. …………………………….
…………………………………………………………. …………………………….
…………………………………………………………. …………………………….Måltid 4 Kl. …………..
Matvarer/retter Mengde
…………………………………………………………. …………………………….
…………………………………………………………. …………………………….…………………………………………………………. …………………………….
…………………………………………………………. …………………………….
Måltid 5 Kl. …………..
Matvarer/retter Mengde…………………………………………………………. …………………………….
…………………………………………………………. …………………………….
…………………………………………………………. …………………………….…………………………………………………………. …………………………….
Måltid 6 Kl. …………..
Matvarer/retter Mengde
…………………………………………………………. …………………………….…………………………………………………………. …………………………….
…………………………………………………………. …………………………….
…………………………………………………………. …………………………….
104
Master thesis in Clinical Nutrition, Anu Koivisto 2009
TRENINGSREGISTRERING Dag 2NB! Skriv ned væskeinntak og matinntak (mengde og type) hvis du bruker det under treningDAG 1Økt 1 Kl. ………..……..
Type trening og intensitet Varighet……………………………………………………………..…. …………………….……………………………………………………………..…. …………………….Type væske-mat inntak Mengde
……………………………………………………………..…. …………………….Økt 2 Kl. ………..……..
Type trening og intensitet Varighet……………………………………………………………..…. …………………….……………………………………………………………..…. …………………….
Type væske-mat inntak Mengde……………………………………………………………..…. …………………….Kommentarer til kostregistrering/treningsregistrering:…………………………………………………………………………………………………………………………………………………………………………………………………………………………………………………………………………………………………………………………………………………………………………………………………………………………………………………………………………………………………………………………………………………………………………………………………………………………………………………………………………………………………………………………………………………………………………
105
Master thesis in Clinical Nutrition, Anu Koivisto 2009
Dag 3Måltid 1 Kl. …………..
Matvarer/retter Mengde
…………………………………………………………. …………………………….
…………………………………………………………. …………………………….…………………………………………………………. …………………………….
…………………………………………………………. …………………………….
Måltid 2 Kl. …………..Matvarer/retter Mengde
…………………………………………………………. …………………………….
…………………………………………………………. …………………………….
…………………………………………………………. …………………………….…………………………………………………………. …………………………….
Måltid 3 Kl. …………..
Matvarer/retter Mengde
…………………………………………………………. …………………………….…………………………………………………………. …………………………….
…………………………………………………………. …………………………….
…………………………………………………………. …………………………….
Måltid 4 Kl. ………….Matvarer/retter Mengde
…………………………………………………………. …………………………….
…………………………………………………………. …………………………….
…………………………………………………………. …………………………….…………………………………………………………. …………………………….
Måltid 5 Kl. …………..
Matvarer/retter Mengde…………………………………………………………. …………………………….
…………………………………………………………. …………………………….
…………………………………………………………. …………………………….
…………………………………………………………. …………………………….Måltid 6 Kl. …………..
Matvarer/retter Mengde
…………………………………………………………. …………………………….
…………………………………………………………. …………………………….…………………………………………………………. …………………………….
…………………………………………………………. …………………………….
106
Master thesis in Clinical Nutrition, Anu Koivisto 2009
TRENINGSREGISTRERING Dag 3NB! Skriv ned væskeinntak og matinntak (mengde og type) hvis du bruker det under treningDAG 1Økt 1 Kl. ………..……..
Type trening og intensitet Varighet……………………………………………………………..…. …………………….……………………………………………………………..…. …………………….Type væske-mat inntak Mengde
……………………………………………………………..…. …………………….Økt 2 Kl. ………..……..
Type trening og intensitet Varighet……………………………………………………………..…. …………………….……………………………………………………………..…. …………………….Type væske-mat inntak Mengde……………………………………………………………..…. …………………….Kommentarer til kostregistrering/treningsregistrering:……………………………………………………………………………………………………………………………………………………………………………………………………………………………………………………………………………………………………………………………………………………………………………………………………………………………………………………………………………………………………………………………………………………………………………………………………………………………………………………………………………………………………………………………………………………………………………………………………………………………………………………………………………………
107
Master thesis in Clinical Nutrition, Anu Koivisto 2009
Dag 4Måltid 1 Kl. …………..
Matvarer/retter Mengde
…………………………………………………………. …………………………….
…………………………………………………………. …………………………….…………………………………………………………. …………………………….
…………………………………………………………. …………………………….
Måltid 2 Kl. …………..Matvarer/retter Mengde
…………………………………………………………. …………………………….
…………………………………………………………. …………………………….
…………………………………………………………. …………………………….…………………………………………………………. …………………………….
Måltid 3 Kl. …………..
Matvarer/retter Mengde
…………………………………………………………. …………………………….…………………………………………………………. …………………………….
…………………………………………………………. …………………………….
…………………………………………………………. …………………………….
Måltid 4 Kl. ………...Matvarer/retter Mengde
…………………………………………………………. …………………………….
…………………………………………………………. …………………………….
…………………………………………………………. …………………………….…………………………………………………………. …………………………….
Måltid 5 Kl. …………..
Matvarer/retter Mengde…………………………………………………………. …………………………….
…………………………………………………………. …………………………….
…………………………………………………………. …………………………….
…………………………………………………………. …………………………….Måltid 6 Kl. …………..
Matvarer/retter Mengde
…………………………………………………………. …………………………….
…………………………………………………………. …………………………….…………………………………………………………. …………………………….
…………………………………………………………. …………………………….
108
Master thesis in Clinical Nutrition, Anu Koivisto 2009
TRENINGSREGISTRERING Dag 4NB! Skriv ned væskeinntak og matinntak (mengde og type) hvis du bruker det under treningDAG 1Økt 1 Kl. ………..……..
Type trening og intensitet Varighet……………………………………………………………..…. …………………….……………………………………………………………..…. …………………….Type væske-mat inntak Mengde
……………………………………………………………..…. …………………….Økt 2 Kl. ………..……..
Type trening og intensitet Varighet……………………………………………………………..…. …………………….……………………………………………………………..…. …………………….Type væske-mat inntak Mengde……………………………………………………………..…. …………………….Kommentarer til kostregistrering/treningsregistrering:………………………………………………………………………………………………………………………………………………………………………………………………………………………………………………………………………………………………………………………………………………………………………………………………………………………………………………………………………………………………………………………………………………………………………………………………………………………………………………………………………………………………………………………………………………………………………………………………………………………………………………………………………………………………………………………………………………………………………………………………

109
Master thesis in Clinical Nutrition, Anu Koivisto 2009
Appendix 7
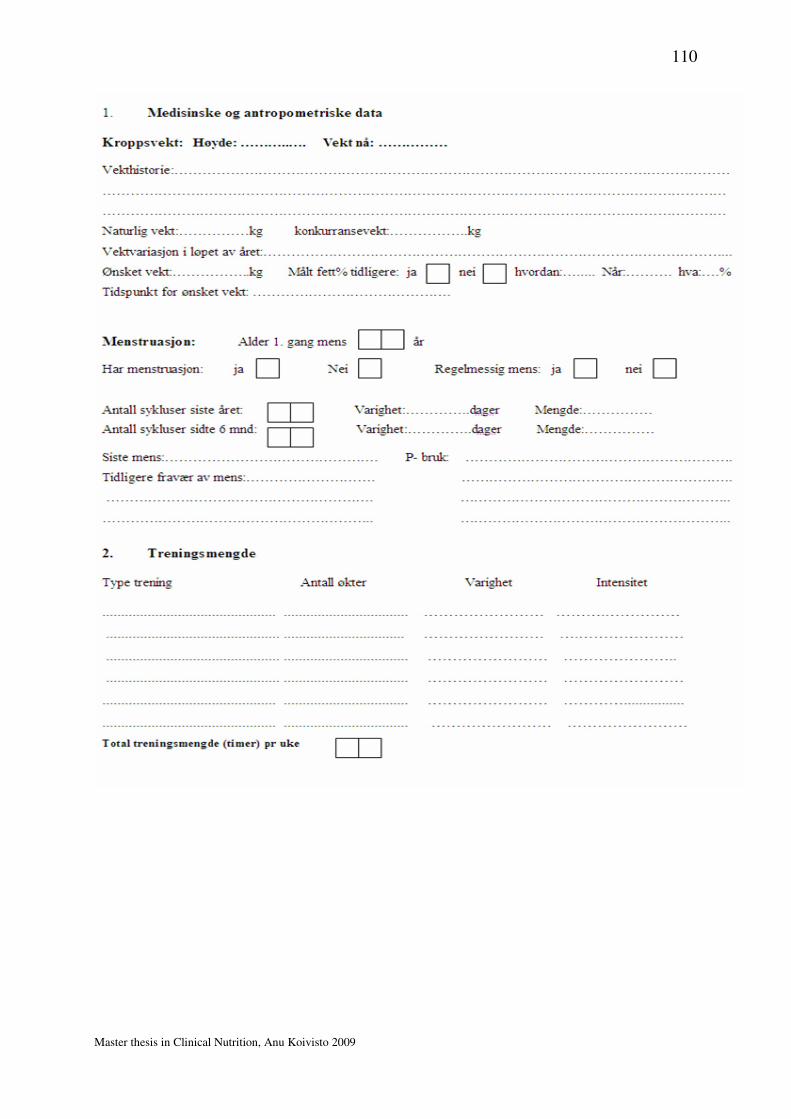
110
Master thesis in Clinical Nutrition, Anu Koivisto 2009

111
Master thesis in Clinical Nutrition, Anu Koivisto 2009
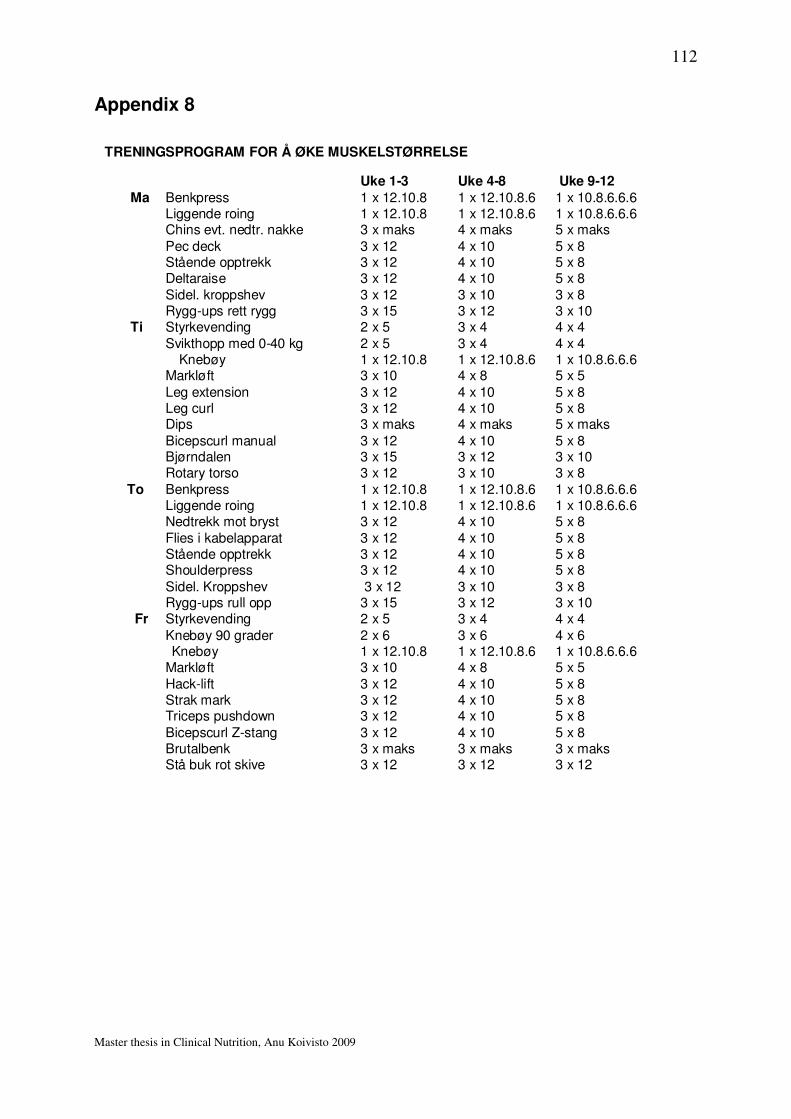
112
Master thesis in Clinical Nutrition, Anu Koivisto 2009
Appendix 8
TRENINGSPROGRAM FOR Å ØKE MUSKELSTØRRELSE
Uke 1-3 Uke 4-8 Uke 9-12Ma Benkpress 1 x 12.10.8 1 x 12.10.8.6 1 x 10.8.6.6.6
Liggende roing 1 x 12.10.8 1 x 12.10.8.6 1 x 10.8.6.6.6Chins evt. nedtr. nakke 3 x maks 4 x maks 5 x maks
Pec deck 3 x 12 4 x 10 5 x 8Stående opptrekk 3 x 12 4 x 10 5 x 8Deltaraise 3 x 12 4 x 10 5 x 8Sidel. kroppshev 3 x 12 3 x 10 3 x 8Rygg-ups rett rygg 3 x 15 3 x 12 3 x 10
Ti Styrkevending 2 x 5 3 x 4 4 x 4Svikthopp med 0-40 kg 2 x 5 3 x 4 4 x 4
Knebøy 1 x 12.10.8 1 x 12.10.8.6 1 x 10.8.6.6.6Markløft 3 x 10 4 x 8 5 x 5
Leg extension 3 x 12 4 x 10 5 x 8Leg curl 3 x 12 4 x 10 5 x 8Dips 3 x maks 4 x maks 5 x maks
Bicepscurl manual 3 x 12 4 x 10 5 x 8Bjørndalen 3 x 15 3 x 12 3 x 10Rotary torso 3 x 12 3 x 10 3 x 8
To Benkpress 1 x 12.10.8 1 x 12.10.8.6 1 x 10.8.6.6.6Liggende roing 1 x 12.10.8 1 x 12.10.8.6 1 x 10.8.6.6.6Nedtrekk mot bryst 3 x 12 4 x 10 5 x 8Flies i kabelapparat 3 x 12 4 x 10 5 x 8Stående opptrekk 3 x 12 4 x 10 5 x 8Shoulderpress 3 x 12 4 x 10 5 x 8
Sidel. Kroppshev 3 x 12 3 x 10 3 x 8Rygg-ups rull opp 3 x 15 3 x 12 3 x 10
Fr Styrkevending 2 x 5 3 x 4 4 x 4
Knebøy 90 grader 2 x 6 3 x 6 4 x 6Knebøy 1 x 12.10.8 1 x 12.10.8.6 1 x 10.8.6.6.6
Markløft 3 x 10 4 x 8 5 x 5Hack-lift 3 x 12 4 x 10 5 x 8Strak mark 3 x 12 4 x 10 5 x 8Triceps pushdown 3 x 12 4 x 10 5 x 8
Bicepscurl Z-stang 3 x 12 4 x 10 5 x 8Brutalbenk 3 x maks 3 x maks 3 x maksStå buk rot skive 3 x 12 3 x 12 3 x 12
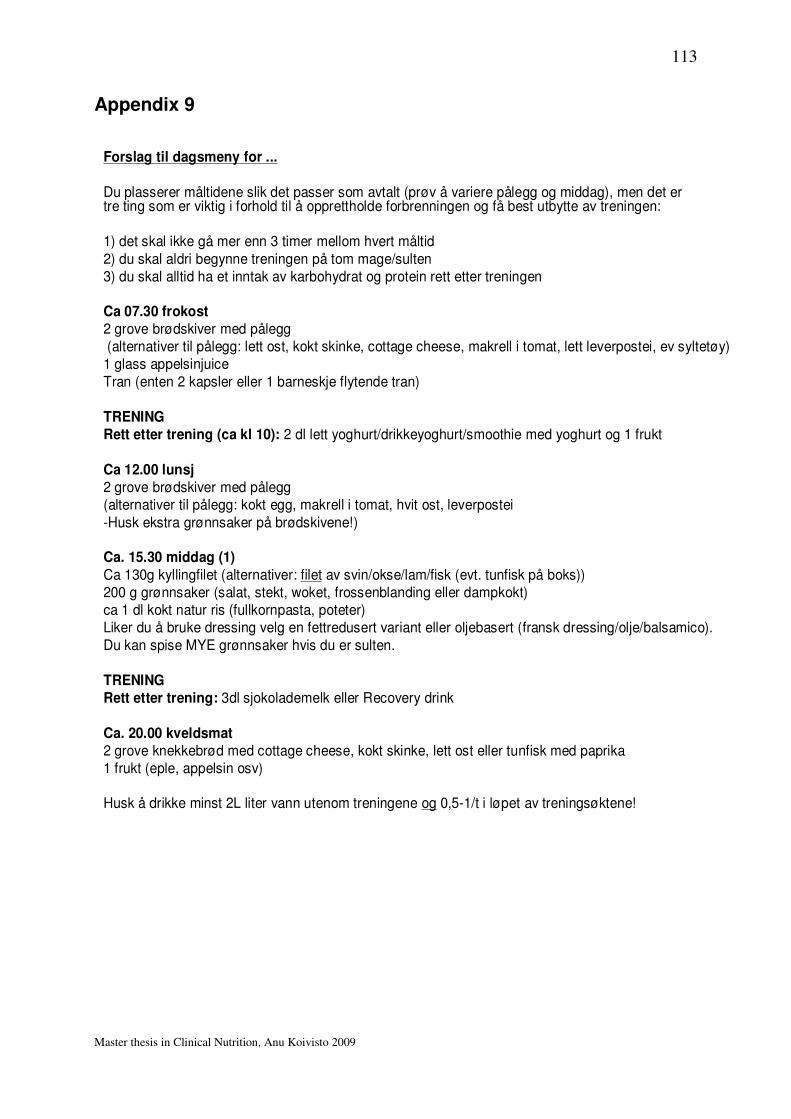
113
Master thesis in Clinical Nutrition, Anu Koivisto 2009
Appendix 9
Forslag til dagsmeny for ...
Du plasserer måltidene slik det passer som avtalt (prøv å variere pålegg og middag), men det er tre ting som er viktig i forhold til å opprettholde forbrenningen og få best utbytte av treningen:
1) det skal ikke gå mer enn 3 timer mellom hvert måltid
2) du skal aldri begynne treningen på tom mage/sulten3) du skal alltid ha et inntak av karbohydrat og protein rett etter treningen
Ca 07.30 frokost2 grove brødskiver med pålegg(alternativer til pålegg: lett ost, kokt skinke, cottage cheese, makrell i tomat, lett leverpostei, ev syltetøy)1 glass appelsinjuice
Tran (enten 2 kapsler eller 1 barneskje flytende tran)
TRENINGRett etter trening (ca kl 10): 2 dl lett yoghurt/drikkeyoghurt/smoothie med yoghurt og 1 frukt
Ca 12.00 lunsj2 grove brødskiver med pålegg(alternativer til pålegg: kokt egg, makrell i tomat, hvit ost, leverpostei
-Husk ekstra grønnsaker på brødskivene!)
Ca. 15.30 middag (1)Ca 130g kyllingfilet (alternativer: filet av svin/okse/lam/fisk (evt. tunfisk på boks))200 g grønnsaker (salat, stekt, woket, frossenblanding eller dampkokt)ca 1 dl kokt natur ris (fullkornpasta, poteter)Liker du å bruke dressing velg en fettredusert variant eller oljebasert (fransk dressing/olje/balsamico).
Du kan spise MYE grønnsaker hvis du er sulten.
TRENINGRett etter trening: 3dl sjokolademelk eller Recovery drink
Ca. 20.00 kveldsmat2 grove knekkebrød med cottage cheese, kokt skinke, lett ost eller tunfisk med paprika1 frukt (eple, appelsin osv)
Husk å drikke minst 2L liter vann utenom treningene og 0,5-1/t i løpet av treningsøktene!