weeding out needy households and welcoming the better off
TRANSCRIPT

*I would like to thank my thesis advisor, Professor David Card for not only his guidance, tips, and encouragement for this thesis but also for teaching me Microeconomics and Econometric foundations.
Weeding out Needy Households and Welcoming the
Better Off? Impacts of Transactional Barriers on SNAP
Participation Rates
Kevin Woo
April 2021
University of California, Berkeley
Department of Economics
Undergraduate Honors Thesis
Advisor: David Card*

Abstract
The Supplemental Nutrition Assistance Program (SNAP) was designed to help families in need
to purchase the basic necessity of food. Eligibility rules, transaction barriers, and stigma are the
three main factors that influence SNAP participation in the United States. This paper analyzes
the effects of transaction costs on SNAP take up rates across different household income levels.
Transaction costs are different from administrative costs in that transaction costs refer to the
barriers applicants face in applying and retaining SNAP benefits such as long wait times, missed
interview, and miscommunication. The role of transaction barriers is to validate and confirm a
household’s eligibility and for households to demonstrate their need through their willingness to
go through an extensive application process. My findings suggest that this perception of
transaction barriers is not represented in the data and that households in the lower income groups
(0-100% of poverty) are more negatively impacted by transaction barriers compared to
households earning above poverty.
1. Introduction
The Supplemental Nutrition Assistance Program (SNAP) is one of the largest social
programs in the United States serving over 38 million people in 2019 (Hall, 2021). SNAP is a
federal program, but the application process, approval, and administering of SNAP are under the
jurisdiction of the state. How much a family receives in food assistance depends on the size of
the family, the total income, and the makeup of the family. The benefits follow a sliding scale
where benefits decrease as household income rises. States differ on eligibility rules, transaction
costs, and overall stigma regarding SNAP benefits. A prospective household would apply
through a social service office in their county of residence and the office confirms whether or not
a household qualifies according to state guidelines. States can vary widely in terms of eligibility

rules with some states having asset limits while others don’t even check, and some have an
income limit of 200% of poverty while others have an income limit of 130% of poverty.
Eligibility rules influence SNAP take up rates, but does not explain the complete picture.
Transaction barriers serve to filter and validate applicants so that those who are really in need
receive benefits. The commonly accepted notion is that households in need would have the
willingness to go through the burdensome process of applying and reapplying because of their
need. However, my results show that transaction barriers are adversely affecting certain cohorts
of families below poverty (100% of FPL) and insignificant for the remaining cohorts, which is
contrary to the notion that those in greater need would be more willing to apply for SNAP. This
paper will explore the effects of transaction costs on participation rates and how they vary across
different groups of individuals in the SNAP qualification spectrum.
2. Current State of SNAP
The long run trend of SNAP enrollment has been steadily increasing in the United States due
to many factors such as the lasting impacts of the Financial Crisis and improved application
systems that make applying to SNAP easier than before. Traditionally, SNAP and business
cycles have a lagged pro-cyclical relationship, but that relationship seemed to break down post
Financial Crisis when SNAP participation remained high and did not fall back down as fast as
anticipated (Ganong, 2018). Ganong’s findings showed that unemployment is estimated to
explain about 80% of the increase in SNAP participation, and policy changes such as working
requirement waivers and broader eligibility rules explain the remaining 18% of the increase in
SNAP (Ganong, 2018). States vary widely in terms of eligibility rules to qualify and to keep
SNAP recipiency. One popular requirement that has gained a lot of research attention are work
requirements. The overall work requirement applies to 18-60-year-old SNAP recipients where

they are required to be employed if they are able, and they cannot purposely quit a job for the
sake of qualifying for SNAP assistance (USDA, 2021). Another aspect of the working
requirement is the Able-Bodied Adult Without Dependents (ABAWD) requirement where 18-49
year olds without kids under the age of 18 and without disabilities are required to either work 20
hours a week, attend a job training, or volunteer for 20 hours or more. The ABAWD requirement
is much stricter and undergoes more stringent review during the recertification process.
However, states can apply for waivers through the Federal agency especially when the economic
conditions of the state or area are poor due to a recession. The requirements for a state to apply
for a waiver is not entirely clear, as states such as California with the largest economy in the U.S
has applied and been approved for ABAWD waivers ever since the Great Recession, whereas
other states such as Virginia and Texas have reinstated ABAWD requirements a few years after
the Financial Crisis. ABAWD requirements have negative effects on SNAP take up rates and
contrarian to common beliefs that SNAP recipients do not join SNAP because they do not want
to work, the literature suggests that SNAP recipients do not stop working when receiving
benefits or when they reach the cutoff age of 50 (Cuffey, 2015). Other requirements are directly
related to eligibility such as income, wealth, age, and legal status. SNAP take up is particularly
low amongst the elderly and immigrants. Even in states with little to no added restrictions for
immigrants, we observe low take up rates in SNAP. There is a myriad of reasons for this
observation including language barriers, fear of adversely affecting immigration status, and lack
of knowledge about the application process.
3. Transaction Costs and SNAP:
Another dimension regarding SNAP participation are the transaction costs involved with
applying and retaining SNAP benefits. Applying to SNAP requires of a lot of paper work,
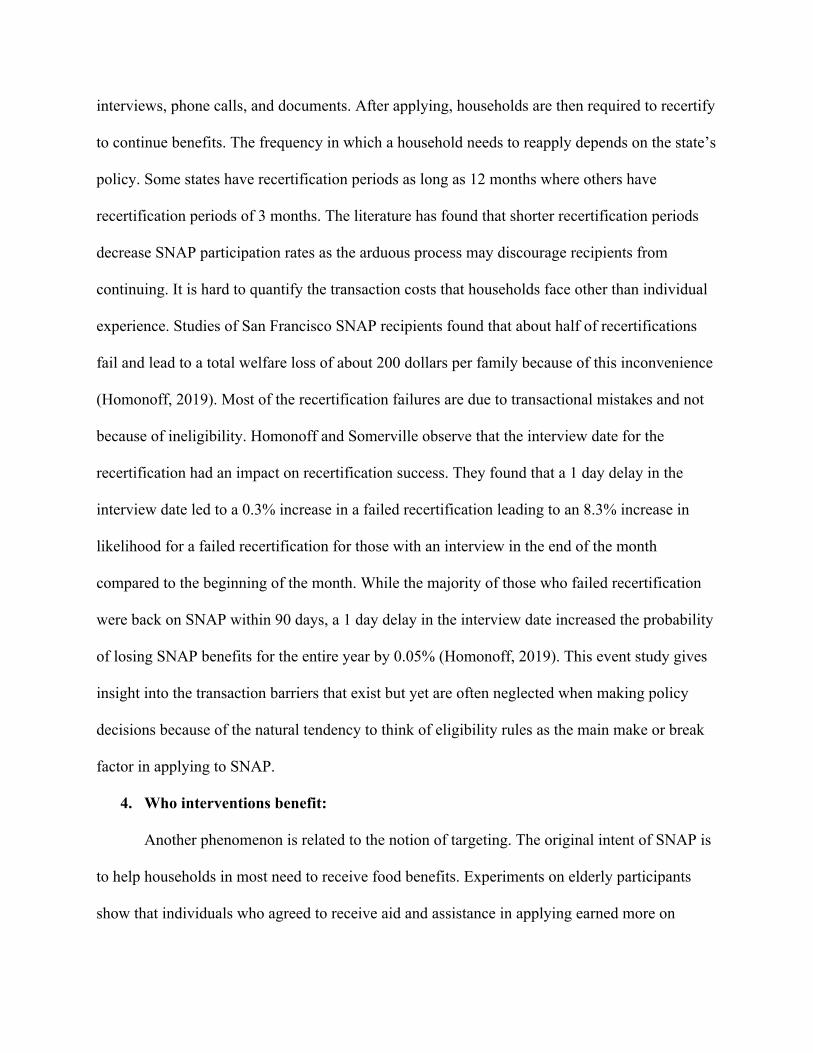
interviews, phone calls, and documents. After applying, households are then required to recertify
to continue benefits. The frequency in which a household needs to reapply depends on the state’s
policy. Some states have recertification periods as long as 12 months where others have
recertification periods of 3 months. The literature has found that shorter recertification periods
decrease SNAP participation rates as the arduous process may discourage recipients from
continuing. It is hard to quantify the transaction costs that households face other than individual
experience. Studies of San Francisco SNAP recipients found that about half of recertifications
fail and lead to a total welfare loss of about 200 dollars per family because of this inconvenience
(Homonoff, 2019). Most of the recertification failures are due to transactional mistakes and not
because of ineligibility. Homonoff and Somerville observe that the interview date for the
recertification had an impact on recertification success. They found that a 1 day delay in the
interview date led to a 0.3% increase in a failed recertification leading to an 8.3% increase in
likelihood for a failed recertification for those with an interview in the end of the month
compared to the beginning of the month. While the majority of those who failed recertification
were back on SNAP within 90 days, a 1 day delay in the interview date increased the probability
of losing SNAP benefits for the entire year by 0.05% (Homonoff, 2019). This event study gives
insight into the transaction barriers that exist but yet are often neglected when making policy
decisions because of the natural tendency to think of eligibility rules as the main make or break
factor in applying to SNAP.
4. Who interventions benefit:
Another phenomenon is related to the notion of targeting. The original intent of SNAP is
to help households in most need to receive food benefits. Experiments on elderly participants
show that individuals who agreed to receive aid and assistance in applying earned more on

average compared to the rest of the sample (Finkelstein, 2018). This experiment had over thirty
thousand participants who were put into three groups at random: receive information, receive
information and assistance, and a control group. The results showed that SNAP enrollment rates
were about 300% higher for the information plus assistance group and 100% higher for the
information only group when compared to the control group. The results also show that
applicants in the intervention groups were less needy on average, and there were less minorities
compared to those that applied from the control group (Finkelstein, 2018). Although assistance
was helpful in increasing participation rates, it also showed that assistance in applying can lead
to misplaced targeting where those who are in most need are not the ones benefiting from the
assistance provided.
5. Current Participation Rates by state:
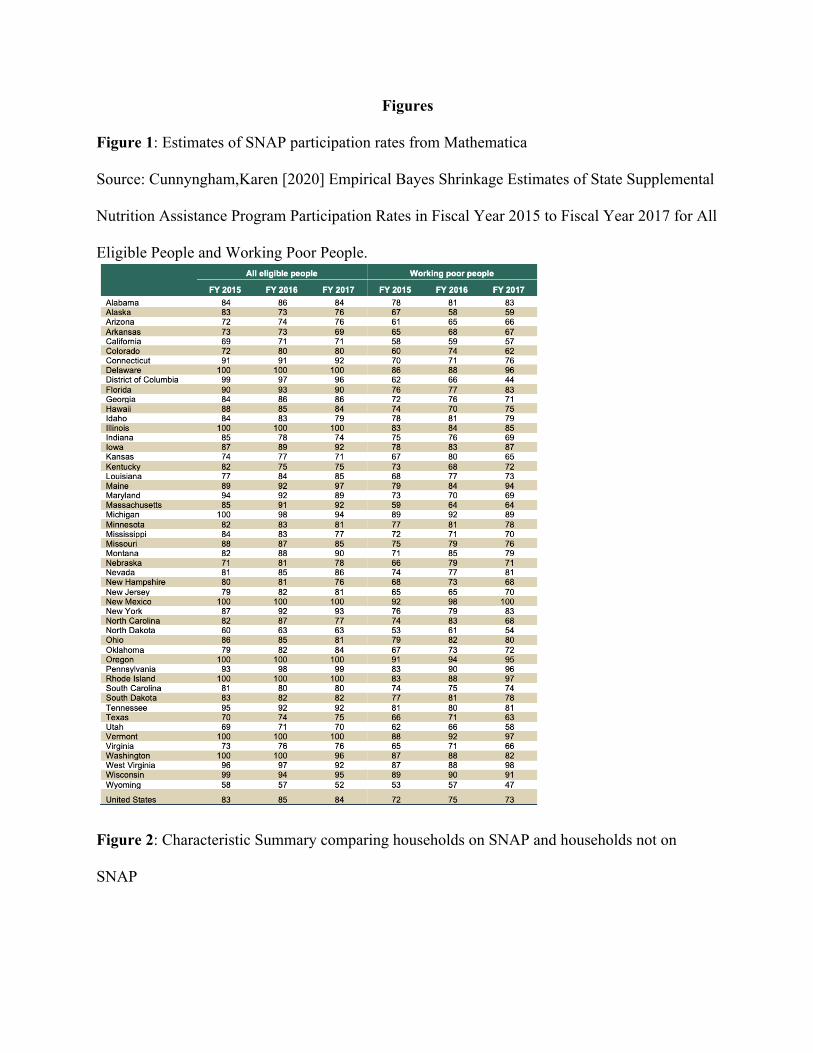
SNAP participation varies by state with some states like New Mexico with estimated
100% participation and others at around 70% participation (Cunnyngham,2020). There is wide
uncertainty in the estimates of SNAP participation and studies usually show a SNAP take-up rate
in terms of individuals who are eligible, and in terms of the working poor. In Figure 1 we see the
overall proportion of SNAP recipients in a state estimated from Mathematica. SNAP households
are also characteristically different from the general public beyond the fact that they earn less on
average. Figure 2 is a summary table that includes both individual and household metrics using
Current Population Survey(CPS) data from 1996 to 2014. Individual metrics such as citizenship
refer to the head of the household and household metrics such as family size refer to the entire
household. Some variables that I found interesting were that a higher percentage of SNAP
households are led by women, SNAP householders are more likely to report a disability that
affects work, and report that they have been absent or not in the labor force.

6. Data Analysis Vision:
SNAP participation is mainly centered on three components: eligibility, transaction costs,
and stigma. The framework for my data analysis regarding SNAP take-up rates is to understand
what is driving differences in SNAP participation across different cohorts of households and
states. I want to first test the hypothesis that states with lenient eligibility rules have higher take-
up rates than states with more restrictions such as asset limits, strict work requirements, and
lower income cutoffs. If this hypothesis seems to be violated for some groups, then it may
suggest that transaction costs are playing a factor. Then, I want to explore ways to quantify
transactional barriers such as waiting times and recertification period lengths. The reason why I
would think that transaction costs are more likely to play a role is because stigma around SNAP
in the United States is relatively constant because of the wide use of EBT cards that reduces the
opportunity for others in the public to judge those who have SNAP benefits.
7. Data Description:
The datasets I used were from the CPS March Survey and Annual Social and Economic
(ASEC) Supplement from 1996 to 2014. I chose these years to align with the SNAP policy index
data which provides a quantitative measure of transaction costs. The way I computed the SNAP
take-up rates was to take the number of households who responded “Yes” to receiving SNAP
benefits and multiply by the household size, and divide by the total amount of people in the
sample. I also computed the Federal Poverty Level (FPL) values for each household by dividing
household income by the official poverty cutoff rate for that household. I split the data into FPL
20% increment buckets from 0% to 200% of FPL and reported the take-up rates in each bucket. I
observe a downward trend in participation as the FPL increases which is consistent with the
literature and the nature of the program. However, the values from my data are generally lower
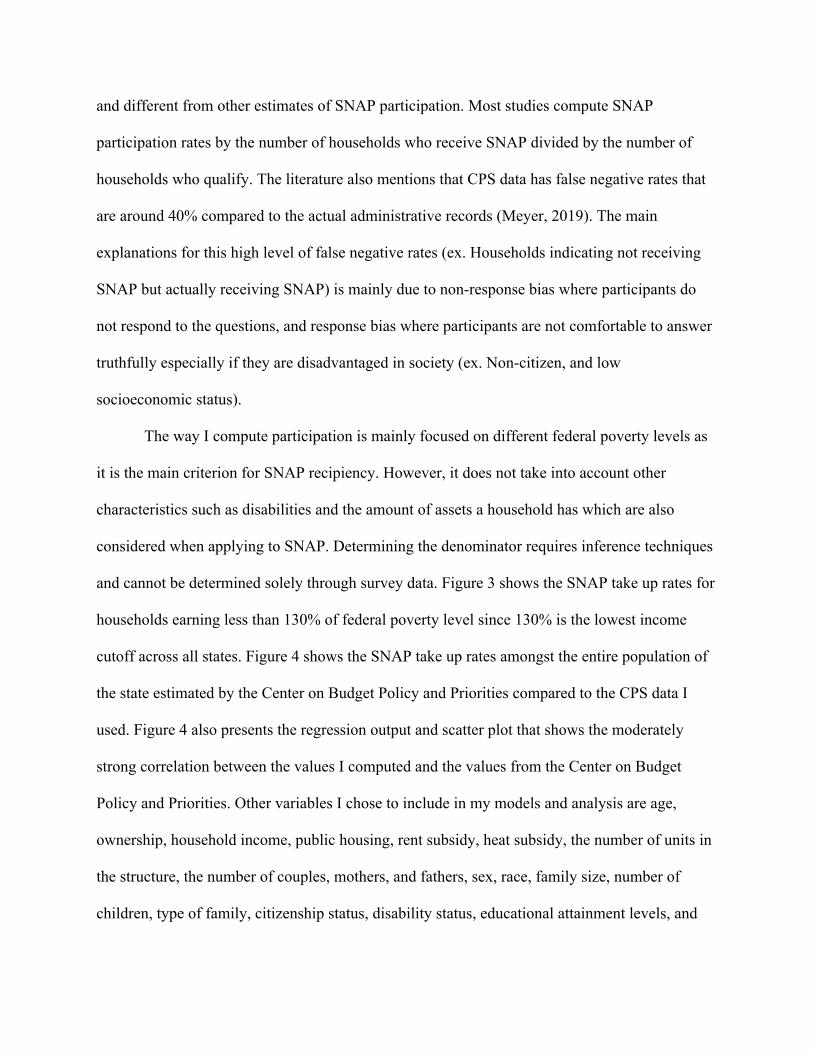
and different from other estimates of SNAP participation. Most studies compute SNAP
participation rates by the number of households who receive SNAP divided by the number of
households who qualify. The literature also mentions that CPS data has false negative rates that
are around 40% compared to the actual administrative records (Meyer, 2019). The main
explanations for this high level of false negative rates (ex. Households indicating not receiving
SNAP but actually receiving SNAP) is mainly due to non-response bias where participants do
not respond to the questions, and response bias where participants are not comfortable to answer
truthfully especially if they are disadvantaged in society (ex. Non-citizen, and low
socioeconomic status).
The way I compute participation is mainly focused on different federal poverty levels as
it is the main criterion for SNAP recipiency. However, it does not take into account other
characteristics such as disabilities and the amount of assets a household has which are also
considered when applying to SNAP. Determining the denominator requires inference techniques
and cannot be determined solely through survey data. Figure 3 shows the SNAP take up rates for
households earning less than 130% of federal poverty level since 130% is the lowest income
cutoff across all states. Figure 4 shows the SNAP take up rates amongst the entire population of
the state estimated by the Center on Budget Policy and Priorities compared to the CPS data I
used. Figure 4 also presents the regression output and scatter plot that shows the moderately
strong correlation between the values I computed and the values from the Center on Budget
Policy and Priorities. Other variables I chose to include in my models and analysis are age,
ownership, household income, public housing, rent subsidy, heat subsidy, the number of units in
the structure, the number of couples, mothers, and fathers, sex, race, family size, number of
children, type of family, citizenship status, disability status, educational attainment levels, and
employment variables. These are the variables that influence eligibility for SNAP and account
for barriers that may affect one from applying such as race, state of residence and work status.
8. Cross Classification Model:
The first empirical exercise I applied is to calculate the difference of SNAP participation
rates across different FPL buckets between two select states between the years 2016 and 2018
through a cross classification method. I chose to focus on these years instead of 1996 to 2014
because I wanted to focus on a time period of economic stability to control for economic
indicators. 2016 to 2018 were years of economic stability as marked by low unemployment and
stable GDP growth across all states. The state combinations I chose were Texas and California,
and Indiana and California because of California’s consistent history of relatively lenient
eligibility policies and harsher transaction barriers based off of the USDA transaction barrier
index (USDA, 2020). California and Texas both have large economies and population size, but
they differ widely in terms of eligibility. Indiana is also another state with less lenient eligibility
rules compared to California and I chose to compare these states to see if lenient eligibility rules
really improve take-up rates significantly. The goal is to try to limit confounding variables in
hopes that the main difference in SNAP-participation rate is due to transaction cost and
eligibility rules. As a result, I focused on just U.S citizens for this comparison to remove the
potential effects from immigration status because states apply different policies and rules toward
immigrant eligibility for SNAP.
Based off of eligibility alone, I would expect SNAP take up rates to be much higher in
California than in Texas and Indiana. The first step in this analysis is to fit a classification model
for each state. I fit a random forest model and a logistic model to classify whether or not a
household is a SNAP recipient, taking into account a wide range of characteristic variables of the

household. This SNAP take-up rate computation will be on the lower end because SNAP
households tend to have larger families, and I am computing the proportion of households
expected to be on SNAP rather than the proportion of the entire population. The Random Forest
Classifier I fitted uses a maximum depth of 10 layers, minimum sample size split of 10, and 3
maximum features. Random forest models can be interpreted as decision trees where the depth is
how many “branches” the tree breaks down to, where the higher the number, the greater the risk
of overfitting. The maximum number of features and minimum sample split give boundaries to
the number of variables and the sample size used at each iteration to form the decision tree. The
classification accuracy, false negative rate, false positive rate and the ROC curve are listed in
Figure 5. ROC stands for Receiving Operating Characteristic and it shows the performance of
the classifier at variable false positive rates. A concave shape is a good sign as it means the
classifier performs better than random chance. However, one of the main weaknesses of my
classifier are the high false negative rates. The classifier classifies most households as not
receiving SNAP benefits because SNAP take up rates are not super high in any specific group as
it maxes out at around 50% for families in Low FPL buckets in the CPS data. Another issue is
that there are many households with similar characteristics but have different outcome variables,
which leads the training set for the model to be unclear for the classifier. To try to mitigate this
issue, my sample focuses on households who earn incomes that are less than 200% of federal
poverty level. However, the false negative rates are still high because of factors not included in
the CPS data like different eligibility policies across different states, non-response bias especially
amongst households in the lowest FPL buckets, and the significant false negative rate in the CPS
data itself (Meyer, 2019).

After fitting the classification models for each state, I cross apply the models where I
apply the classification model for California to Texas and the classification model for Texas to
California, and the same combination for Indiana. This provides the hypothetical SNAP
participation if California was Texas (Indiana) and if Texas (Indiana) was California in terms of
eligibility, transaction, and a wide array of factors. The graph on the left in Figure 5 compares
SNAP take up rates in California versus SNAP take up rates if California behaved like Texas
(Indiana) in terms of eligibility and transaction. The graph on the right in Figure 5 compares
SNAP take up rate in Texas (Indiana) versus SNAP take up rates if Texas (Indiana) behaved like
California in terms of eligibility and transaction. The results in Figure 5 are from the Random
Forest classifier because of higher accuracy compared to the logistic model. Figure 6 compares
the actual take-up rates from the CPS data for the two states of interest.
From the graphs listed in Figure 5, we see an interesting pattern where SNAP
participation rates are higher in California for higher FPL level buckets, but lower for very low
FPL buckets. When a Texas or Indiana model is applied to California, we observe that the SNAP
take up rate would be higher for low FPL households (below 100% of poverty) and lower for
high FPL households (above 100% of poverty). When we apply the California model to Texas
and Indiana we see that the California model results in higher SNAP take up rates for higher FPL
levels and lower take up rates for low FPL levels. The reason why the California model outputs
different values for Texas and Indiana is because it is taking in different data and then classifying
the outputs. The input into the California model is different when using Indiana and Texas data
because of the different characteristics of each state, which leads to a different classification that
leads to a different SNAP take-up rate. What we observe in SNAP take up rates amongst low
FPL groups is contrary to what we would expect if just taking to account eligibility. One would

expect that more lenient eligibility rules for SNAP would increase SNAP take-up rates across all
groups of households, but how come California, which has more lenient policies than Texas and
Indiana, has lower participation rates for households in lower income buckets? This suggests that
other dimensions other than eligibility rules are leading to this difference. To expand on this
observation, I utilize the USDA SNAP policy index measurement which includes a transaction
index that gives a quantitative measure of transactional barriers for each state.
9. Regressions:
The USDA SNAP policy index includes both weighted and unweighted indexes for
transaction, stigma, and eligibility from 1996 to 2014. The USDA also combines all three
dimensions into a policy index to construct one concise measure of how lenient a state is in
administrating SNAP. I utilize the unweighted transactions cost index which considers three
variables that affect transactional barriers: recertification period, online application availability,
and simplified reporting. The original index was constructed so that a higher number means that
the transaction barrier is low, meaning that it is expected to benefit participation rates (Stacy,
2018). The general trend of the indexes is that states have been more accommodating with
indexes increasing over time (Stacy, 2018). The unweighted transaction index is a sum of three
variables: Online application availability, short recertification period (1-3 months), and
simplified reporting (Stacy, 2018). To make the direction consistent, I converted online
application availability to no online application availability, and simplified reporting availability
to no simplified reporting availability by negating the variable and adding the max value, which
is 1, to reverse the order of magnitudes.
𝑁𝑜𝑜𝑛𝑙𝑖𝑛𝑒𝑎𝑝𝑝𝑙𝑖𝑐𝑎𝑡𝑖𝑜𝑛𝑎𝑣𝑎𝑖𝑙𝑎𝑏𝑖𝑙𝑖𝑡𝑦 = −𝑂𝑛𝑙𝑖𝑛𝑒𝑎𝑝𝑝𝑙𝑖𝑐𝑎𝑡𝑖𝑜𝑛𝑎𝑣𝑎𝑖𝑙𝑎𝑏𝑖𝑙𝑖𝑡𝑦 + 1
𝑁𝑜𝑠𝑖𝑚𝑝𝑙𝑖𝑓𝑖𝑒𝑑𝑟𝑒𝑝𝑜𝑟𝑡𝑖𝑛𝑔𝑎𝑣𝑎𝑖𝑙𝑎𝑏𝑖𝑙𝑖𝑡𝑦 = −𝑆𝑖𝑚𝑝𝑙𝑖𝑓𝑖𝑒𝑑𝑟𝑒𝑝𝑜𝑟𝑡𝑖𝑛𝑔𝑎𝑣𝑎𝑖𝑙𝑎𝑏𝑖𝑙𝑖𝑡𝑦 + 1

I then sum all the variables and normalize these variables by year to make a transaction index.
The way to interpret this new transaction index is that a higher value means that the state has
more barriers and a lower value means that the state has less barriers.
I then combine the CPS data set from 1996 to 2014 and the normalized transaction cost
index and run a regression with SNAP take-up rate as the dependent variable with state fixed
effects, transaction cost index, time fixed effects, FPL buckets divided into 20% increments up to
200%, and an interaction term between transaction cost index and FPL buckets as independent
variables. If the notion that transaction barriers are put in place to ensure that those who really
need the benefits would go through the hassle of applying holds true, I would expect the
interaction between the transaction index and federal poverty level to be positive for low income
households and turn negative as the federal poverty level bucket increases. From the regression
results in Figure 6, I observe that most of the interactions are insignificant at the 10%
significance level except for households between 40% and 80% of poverty level. This suggests
that transaction costs may have negative and significant impacts on families between 40% to
80% of poverty. These results are inconsistent with the notion that transaction costs weed out
families who are not“really”in need, but on the contrary, a certain cohort of families below
poverty have SNAP participation rates negatively impacted by transaction barriers. I also
observe that higher FPL households seem to not be affected by transaction barriers which is also
inconsistent with the notion that transaction barriers discourage higher income and less needy
households from applying.
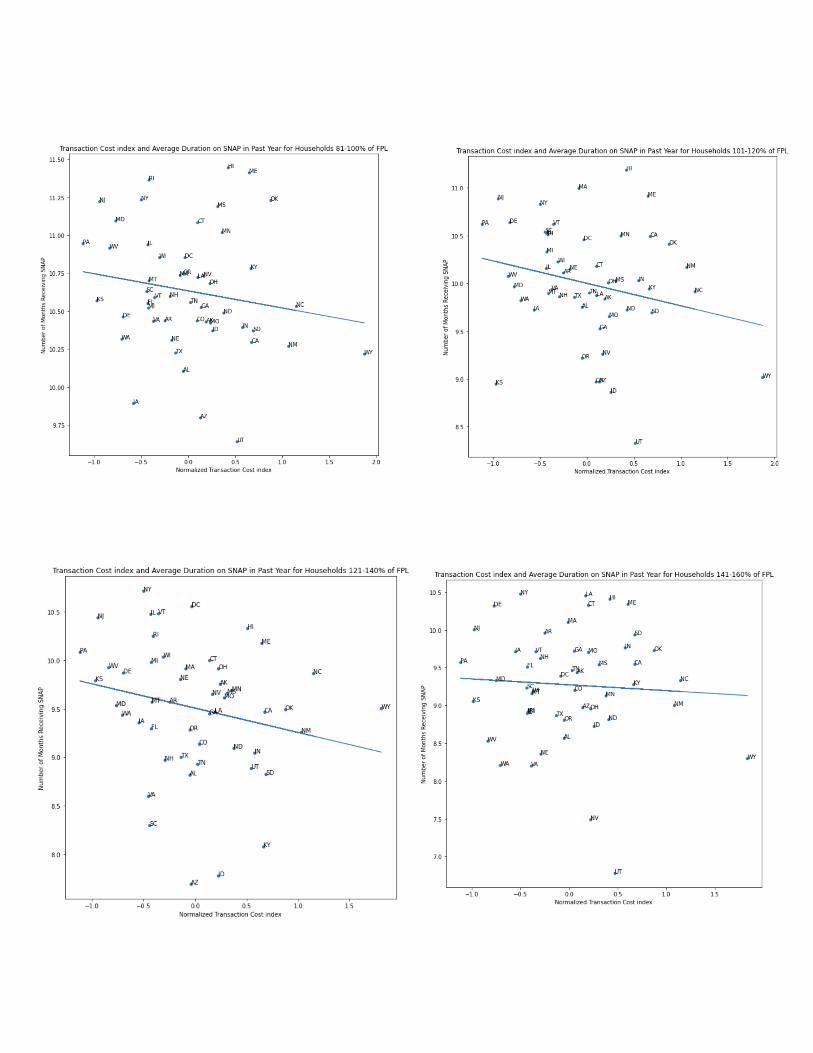
Recertification failure is the most common form of transaction barrier that exists for
many households seeking to continue SNAP benefits. I grouped the household level data by state
and FPL bucket and took the average duration on SNAP for each group as the outcome variable.

Figure 7 are the results from the ordinary least squares regression where the sample is
households who have received SNAP in the year. The results show that all the interactions
between Transaction and FPL bucket are negative and significant for all FPL buckets below
160% of poverty. Unlike the regression for SNAP participation, we see that transaction barriers
have negative impacts on the duration of SNAP recipiency for all FPL buckets except for the top
earners (160-200% of FPL). These findings suggest that a state with more barriers lead to a
lower average duration on SNAP per year which gives context to the barrier that many
households face in terms of recertification. Losing months of benefits can discourage families
from continuing SNAP benefits because of this loss. Analogous to discouraged workers in the
labor force, transaction barriers resulting in broken up SNAP recipiency can lead to discouraged
beneficiaries.
Instead of grouping by FPL bucket and state, I kept the entire sample at a household level
and fitted an ordered logit model where the number of months, 1 to 12, are treated as categorical
groups where the logit model classifies the observations into. Figure 9 shows that all the
interactions between transaction cost and FPL bucket are insignificant at a five percent
significance level for all income levels. This outcome differs from that of the ordinary least
squares model aggregated by state, and FPL bucket. This may suggest that on an individual level,
transaction barriers do not change the duration a household receives benefits, but on an aggregate
level, the average duration on SNAP across SNAP recipients decreases when a household lives
in a state with more transactional barriers. This may suggest an accumulation of small
differences in SNAP duration across families in a state can lead to a significant difference in
terms of the average duration a SNAP household receives benefits.
10. Discussion:

The results from my analysis suggest that states with more transaction barriers adversely
impact low FPL households more than higher FPL households. Transaction barriers serve their
purpose in validating and confirming a household’s need and also serves as a litmus test to show
how in need a family is in order to go through the hassle of applying and reapplying. If this
purpose held true, we would expect the interaction between transaction barriers and FPL bucket
to be positive. However, I observe that it is either negative or insignificant for households below
poverty. One example of a major change to transaction cost barriers the United States is the
advent of online application forms. Today, most states offer an online application platform for
applicants. This policy is an example of a perverse policy that benefits the not as needy but hurts
those in most need. Households who earn less than poverty are less likely to own a computer and
are less likely to have stable internet access which makes it much more difficult for them to
apply than a household at 180% of poverty. Documents can now be uploaded via the online
application system which reduces the time needed to travel or send copies of required documents
to the social service office. However, even if a very low-income household has internet access,
they may not have a smartphone, printer, or scanner to scan documents to upload. This then
forces them to mail the documents, or travel to the social service office, putting them at a
disadvantage as longer application processes decrease the probability of success due to human
error and administrative hiccups as shown in the recertification process in San Francisco
(Homonoff, 2019). This means that a higher income household that qualifies for SNAP can
successfully apply to SNAP in less time and the processing can go along faster compared to
lower income households who qualify for SNAP. A household that has no choice but to travel to
the social security office because of their lack of resources is more likely to have to take time off
of their job which further reduces their earnings and that tradeoff can deter householders from

taking that time off to apply. This is just one example of how transaction barriers do not affect all
SNAP eligible households in the same way, and more research and experiments on aspects of
transaction are needed to level the transaction barriers across all SNAP eligible households.
11. Limitations:
The USDA SNAP transaction index is limited in that it does not capture all the transaction
costs associated with applying and reapplying to SNAP. The transaction index is a weighted
average of three factors, whether or not there is an online application, whether or not the
recertification period is 1-3 months, and if there is expedited processing available for needy
households. If the index was robust, we would expect average SNAP participation in a state to
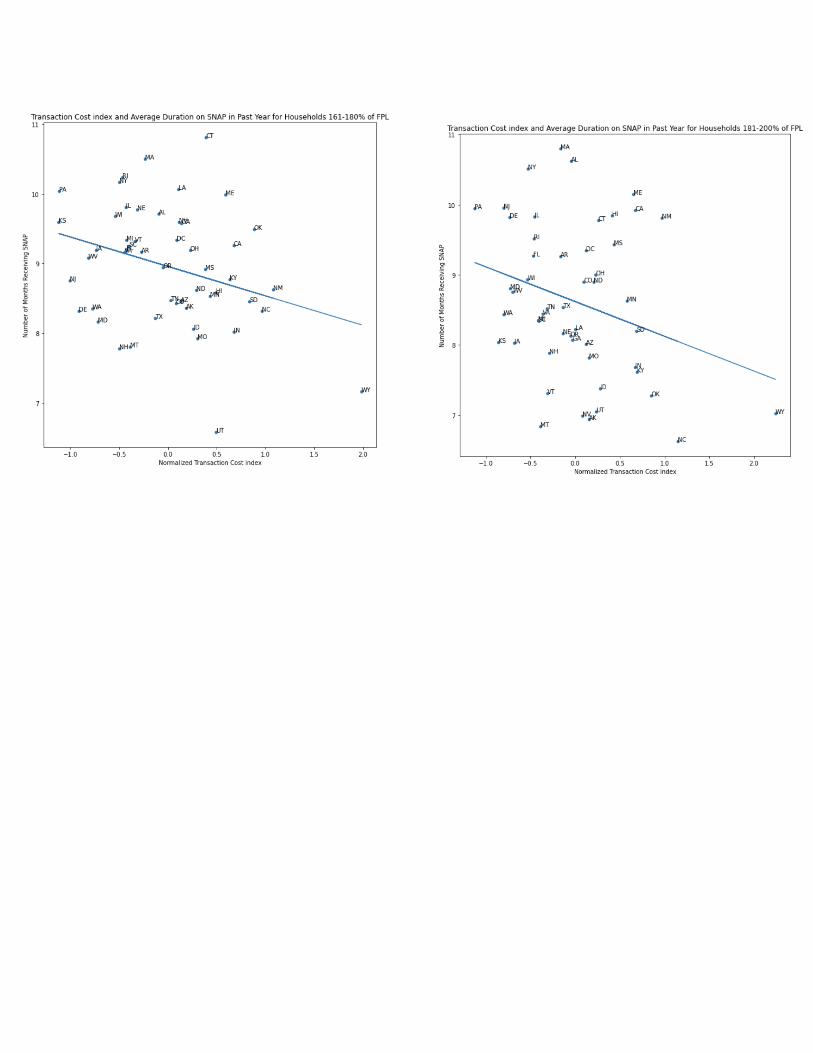
decrease as transaction costs increase. The graphs in Figure 10 plot the relationship between the
transaction cost index (adjusted for direction) and participation rates of each state for each FPL
bucket. I observe that the relationship is weakly negative, where, as the transaction barrier
increases, SNAP participation decreases for all FPL buckets except for Households between 0-
20% of poverty, but none of the relationships are statistically significant. I do the same exercise
for the duration on SNAP for the year and figure 11 shows that in general, as states have higher
transaction costs, the average duration on SNAP per year decreases. This shows that maybe the
transaction index provided by the USDA does a better job in explaining the duration of how long
a family receives SNAP for a year compared to whether or not a family participates in SNAP.
However, this slope is not significant for six out of the ten income groups (21-40% of FPL and
61-160% of FPL).
These two outcomes may suggest two propositions: 1. There is little to no relationship
between transaction costs and SNAP participation rates, 2. The index is not a strong
measurement of transaction costs due to missing confounding variables in the data. I believe

there is stronger support for the latter because the three main factors regarding SNAP
participation are eligibility, transaction costs and stigma. Stigma is relatively constant across
states especially in recent years due to the introduction of the Electronic Benefits Card which
reduces the visibility of SNAP participants to the general public. As a result, we are left with
eligibility and transaction costs as the major factors in SNAP participation. In my analysis
comparing California and Texas, we see that although California has much more accommodating
policies, SNAP participation is much lower for low income households, which suggests that the
relationship between transaction cost and participation is negative, and in the case for low FPL
households, the negative effects outweigh the benefits of accommodating policies.
A short coming of this transaction cost index is that it uses criterion that is outdated, as
most states have the policies that are referred to as lenient policies such as simplified reporting
and online application availability. The index does not include further details of the transaction
barriers such as wait times, recertification success rate, interview duration, missed interview
forgiveness, proximity of social service office, social service office hours, number of required
documents, and other barriers. The limited and outdated criteria used to compute the transaction
index and the analysis of the current literature leads one to lean toward the proposition that the
transaction index is not a strong measure of transaction costs.
Another limitation is the data itself. The CPS data has a high false negative rate in that
some households do not respond or they do not respond in a way that reflects their true situation
(Meyer, 2019). Fitting a classification model on data that has a false negative rate of about 40%
when compared to administrative records will lead to results that are not entirely accurate and
potential leads to large measurement bias due to the nature of the data.

The largest limitation in my analysis is potential omitted variable bias. Although I
included many household and economic variables, it is likely I missed other variables such as
duration of unemployment and city unemployment rate that could explain SNAP participation
rates in a specific state. This potential omitted variable bias will bias the interaction terms of
interest.
12. Next Steps
I would like to expand on this research by trying to use instrumental variables,
differences in differences, or other inference techniques to prove causality. I could not find an
instrument that would relate to transaction cost without affecting SNAP participation directly and
did not observe parallel trends in state participation with a defining event that could have
affected SNAP take up rates related to transaction cost. This would be more likely to achieve if I
could link survey data with administrative records from social security offices across the United
States and this linkage will help reduce the high false negative rates when just relying on survey
data alone. I would also like to do interviews with administrators of SNAP and other SNAP
participants to hear more about their perspective on transaction barriers and what they experience
on a day to day basis regarding transaction barriers because my perspective in this thesis has
largely been my personal experience in applying and recertifying for SNAP benefits. This
broader perspective will give me greater insight and ideas in what policies can be implemented
to ensure families in need are receiving the benefits they need to thrive. I would also like to dig
deeper into factors that influence participation rather than just cherry-picking variables
mentioned in the literature, to improve my classification performance to provide sounder
quantitative comparisons of the impact on transactional barriers on SNAP take up rates across
different cohorts of households.

13. Conclusion:
The literature on SNAP has put a heavy emphasis on eligibility and how different aspects of
eligibility rules affect SNAP participation. Eligibility plays a significant role in SNAP
participation, but does not explain the complete picture. In this paper, I focus on transaction
barriers which are the costs associated with applying and reapplying for SNAP benefits such as
wait times, administrative error, and required documentation. From comparing SNAP
participation rates between California and Texas and California and Indiana, I observe that
although California has more accommodating eligibility rules compared to Texas and Indiana,
SNAP take up rates are lower for households at lower poverty levels in California. Objectively,
households at lower percentage levels of poverty are in more need of SNAP benefits compared
to households above poverty (Income cutoffs range between 130% to 200% of poverty). My
findings suggest that accommodating policies may lead to a lack of targeting, and limit access to
those who are in need of SNAP benefits. The role of transactional barriers is to verify a
household’s eligibility and filter applicants based off of demonstrated need. In other words, the
hypothesis is that transactional barriers should have a positive interaction with income level for
households at low poverty levels and a negative interaction with income level for households
earning a higher level of income. However, my findings suggest that the original intent of
transactional barriers is not supported by the data, as there is no evidence that very low-income
households are demonstrating their need via the application process, nor that better off
households are deterred from applying. This suggests that the transaction barriers are adversely
impacting households at lower levels of poverty more than households in higher levels of
poverty, which challenges the original intent of SNAP in providing benefits and support for
those in most need.
Figures
Figure 1: Estimates of SNAP participation rates from Mathematica
Source: Cunnyngham,Karen [2020] Empirical Bayes Shrinkage Estimates of State Supplemental
Nutrition Assistance Program Participation Rates in Fiscal Year 2015 to Fiscal Year 2017 for All
Eligible People and Working Poor People.
Figure 2: Characteristic Summary comparing households on SNAP and households not on
SNAP

Source: Sarah Flood, Miriam King, Renae Rodgers, Steven Ruggles and J. Robert Warren. Integrated Public Use Microdata Series, Current Population Survey: Version 8.0 [dataset]. Minneapolis, MN: IPUMS, 2020. https://doi.org/10.18128/D030.V8.0
Figure 3: SNAP take-up rates amongst families earning less than 130% of poverty
Source: Sarah Flood, Miriam King, Renae Rodgers, Steven Ruggles and J. Robert Warren. Integrated Public Use Microdata Series, Current Population Survey: Version 8.0 [dataset]. Minneapolis, MN: IPUMS, 2020. https://doi.org/10.18128/D030.V8.0

Figure 4: SNAP take up rates (%) over the entire state population compared with numbers from
Center on Budget Policy and Priorities

Sources: Lauren Hall [2021] A Closer Look at Who Benefits from SNAP: State-by-State Fact Sheets
Sarah Flood, Miriam King, Renae Rodgers, Steven Ruggles and J. Robert Warren. Integrated Public Use Microdata Series, Current Population Survey: Version 8.0 [dataset]. Minneapolis, MN: IPUMS, 2020. https://doi.org/10.18128/D030.V8.0
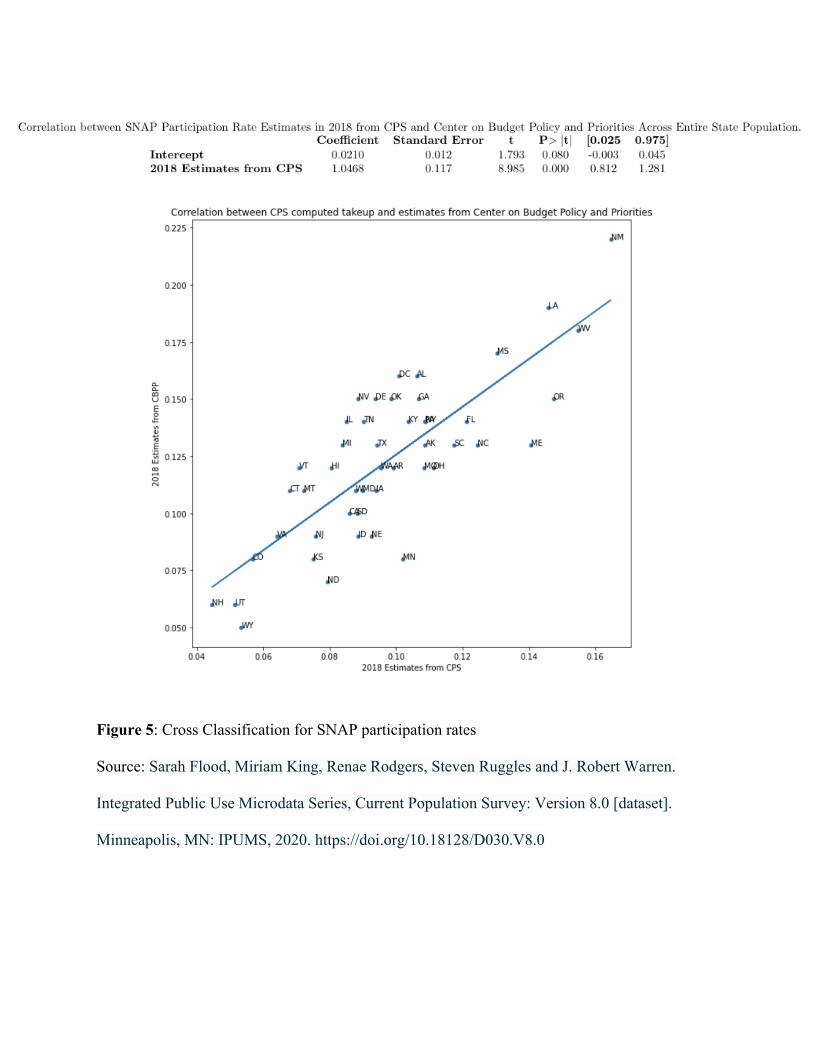
Figure 5: Cross Classification for SNAP participation rates
Source: Sarah Flood, Miriam King, Renae Rodgers, Steven Ruggles and J. Robert Warren.
Integrated Public Use Microdata Series, Current Population Survey: Version 8.0 [dataset].
Minneapolis, MN: IPUMS, 2020. https://doi.org/10.18128/D030.V8.0

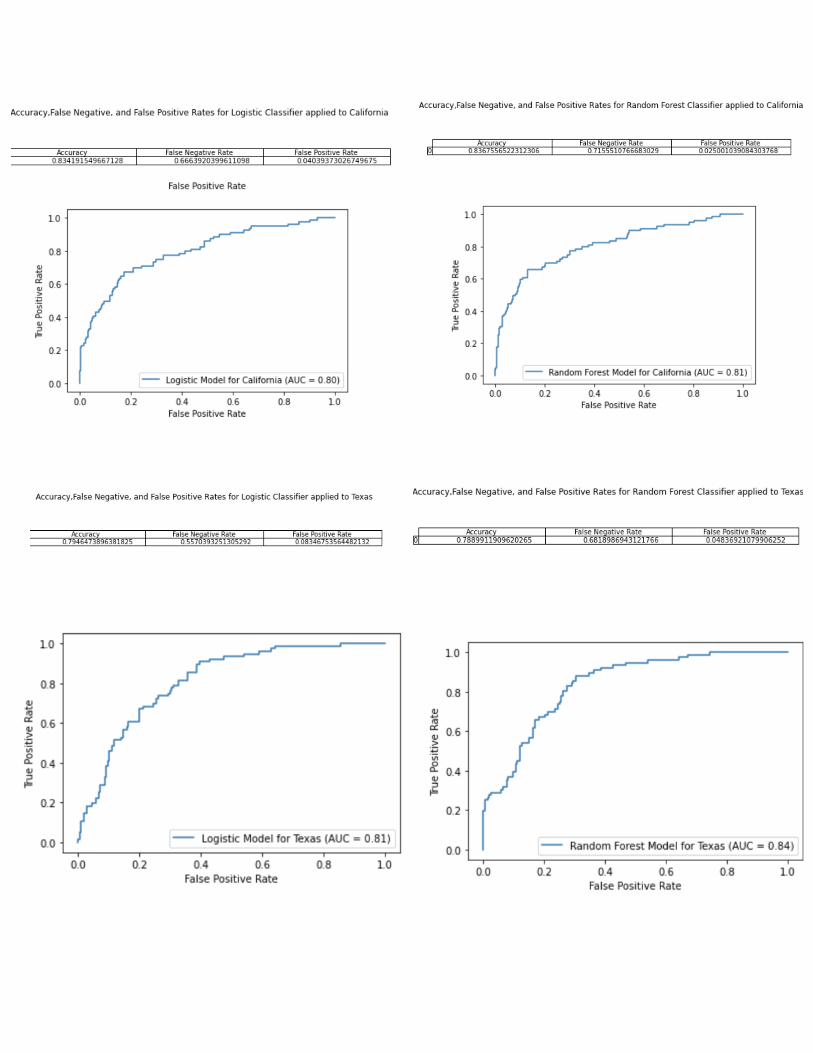

Figure 6: Actual Data for California and Texas without Cross Applying Years 2016-2018
Source: Sarah Flood, Miriam King, Renae Rodgers, Steven Ruggles and J. Robert Warren.
Integrated Public Use Microdata Series, Current Population Survey: Version 8.0 [dataset].
Minneapolis, MN: IPUMS, 2020. https://doi.org/10.18128/D030.V8.0

Figure 7: Ordinary Least Squares Regression with SNAP take-up rate as dependent variable
Source: Sarah Flood, Miriam King, Renae Rodgers, Steven Ruggles and J. Robert Warren.
Integrated Public Use Microdata Series, Current Population Survey: Version 8.0 [dataset].
Minneapolis, MN: IPUMS, 2020. https://doi.org/10.18128/D030.V8.0

Figure 8: Ordinary least squares regression with the fraction of year on SNAP as the dependent
variable
Source: Sarah Flood, Miriam King, Renae Rodgers, Steven Ruggles and J. Robert Warren.
Integrated Public Use Microdata Series, Current Population Survey: Version 8.0 [dataset].
Minneapolis, MN: IPUMS, 2020. https://doi.org/10.18128/D030.V8.0

Figure 9: Ordinal logistic regression with number of months on SNAP as the dependent variable
Source: Sarah Flood, Miriam King, Renae Rodgers, Steven Ruggles and J. Robert Warren.
Integrated Public Use Microdata Series, Current Population Survey: Version 8.0 [dataset].
Minneapolis, MN: IPUMS, 2020. https://doi.org/10.18128/D030.V8.0
Figure 10: Robustness check for transaction cost index on SNAP take-up

Source: Sarah Flood, Miriam King, Renae Rodgers, Steven Ruggles and J. Robert Warren.
Integrated Public Use Microdata Series, Current Population Survey: Version 8.0 [dataset].
Minneapolis, MN: IPUMS, 2020. https://doi.org/10.18128/D030.V8.0


Figure 11: Robustness check for transaction cost index on SNAP duration
Source: Sarah Flood, Miriam King, Renae Rodgers, Steven Ruggles and J. Robert Warren.
Integrated Public Use Microdata Series, Current Population Survey: Version 8.0 [dataset].
Minneapolis, MN: IPUMS, 2020. https://doi.org/10.18128/D030.V8.0

Works Cited
Anders, Jenna, and Charlie Rafkin. “The Welfare Effects of Eligibility Expansions: Theory and
Evidence from SNAP,” n.d., 107.
Bellows, Anna Gassman-Pines, Laura. “Food Instability and Academic Achievement: A Quasi-
Experiment Using SNAP Benefit Timing - Anna Gassman-Pines, Laura Bellows, 2018.”
American Educational Research Journal, March 20, 2018. https://journals-sagepub-
com.libproxy.berkeley.edu/doi/10.3102/0002831218761337.
Center on Budget and Policy Priorities. “Who Are the Low-Income Childless Adults Facing the Loss
of SNAP in 2016?,” February 8, 2016. https://www.cbpp.org/research/food-assistance/who-are-
the-low-income-childless-adults-facing-the-loss-of-snap-in-2016.
Center on Budget and Policy Priorities. “A Closer Look at Who Benefits from SNAP: State-by-State
Fact Sheets.” Accessed March 9, 2021. https://www.cbpp.org/research/food-assistance/a-closer-
look-at-who-benefits-from-snap-state-by-state-fact-sheets.
Center on Budget and Policy Priorities. “Most Working-Age SNAP Participants Work, But Often in
Unstable Jobs.” Accessed April 13, 2021. https://www.cbpp.org/research/food-assistance/most-
working-age-snap-participants-work-but-often-in-unstable-jobs.
Cuffey, Joel, Elton Mykerezi, Timothy Beatty, Joel Cuffey, Elton Mykerezi, and Timothy Beatty.
“Food Assistance and Labor Force Outcomes of Childless Adults: Evidence from the CPS,”
2015. https://doi.org/10.22004/AG.ECON.205821.
Cunnyngham, Karen. “Reaching Those in Need: Estimates of State Supplemental Nutrition
Assistance Program Participation Rates in 2017.” Final report submitted to the U.S. Department
of Agriculture, Food and Nutrition Service. Washington, DC: Mathematica, March 2019.

Cunnyngham, Karen. “Empirical Bayes Shrinkage Estimates of State Supplemental Nutrition
Assistance Program Participation Rates in Fiscal Year 2015 to Fiscal Year 2017 for All Eligible
People and Working Poor People.” Final report submitted to the U.S. Department of Agriculture,
Food and Nutrition Service. Washington, DC: Mathematica, August 2020. A
Dickert-Conlin, Stacy, Katie Fitzpatrick, Brian Stacy, and Laura Tiehen. “The Downs and Ups of the
SNAP Caseload: What Matters?” Applied Economic Perspectives and Policy n/a, no. n/a
(September 23, 2020). https://doi.org/10.1002/aepp.13076.
Finkelstein, Amy, and Matthew J. Notowidigdo. Take-up and Targeting: Experimental Evidence from
SNAP. NBER Working Paper Series, no. w24652. Cambridge, Mass: National Bureau of
Economic Research, 2018.
Ganong, Peter, and Jeffrey B. Liebman. “The Decline, Rebound, and Further Rise in SNAP
Enrollment: Disentangling Business Cycle Fluctuations and Policy Changes.” American
Economic Journal: Economic Policy 10, no. 4 (November 1, 2018): 153–76.
https://doi.org/10.1257/pol.20140016.
Gray, Colin, Adam Leive, Elena Prager, Kelsey Pukelis, and Mary Zaki. “Employed in a SNAP? The
Impact of Work Requirements on Program Participation and Labor Supply.” SSRN Electronic
Journal, 2020. https://doi.org/10.2139/ssrn.3676722.
Harris, Timothy F. “Do SNAP Work Requirements Work?,” n.d., 52.
Herd, Pamela. “How Administrative Burdens Are Preventing Access to Critical Income Supports for
Older Adults: The Case of the Supplemental Nutrition Assistance Program.” Public Policy &
Aging Report 25, no. 2 (March 1, 2015): 52–55. https://doi.org/10.1093/ppar/prv007.

Homonoff, Tatiana, and Jason Somerville. Program Recertification Costs: Evidence from SNAP.
NBER Working Paper Series, no. w27311. Cambridge, Mass: National Bureau of Economic
Research, 2020.
Hoynes, Hilary Williamson, and Diane Whitmore Schanzenbach. “Work Incentives and the Food
Stamp Program.” Journal of Public Economics 96, no. 1 (February 1, 2012): 151–62.
https://doi.org/10.1016/j.jpubeco.2011.08.006.
Isaacs, Julia, and Margaret Andrews. “The Costs of Benefit Delivery in the Food Stamp
Program: Lessons From a Cross-Program Analysis,” n.d., 67.
Laird, Jennifer, Isaac Santelli, Jane Waldfogel, and Christopher Wimer. “Forgoing Food Assistance
out of Fear: Simulating the Child Poverty Impact of a Making SNAP a Legal Liability for
Immigrants.” Socius 5 (January 1, 2019): 2378023119832691.
https://doi.org/10.1177/2378023119832691.
Meyer, Bruce, and Nikolas Mittag. “Combining Administrative and Survey Data to Improve Income
Measurement.” Cambridge, MA: National Bureau of Economic Research, April 2019.
https://doi.org/10.3386/w25738.
Murphy, Jonathan, SNAP Take-Up and Transaction Costs: An Analysis Using the Food Security
Survey (June 26, 2020).
Scherpf, Erik, and Benjamin Cerf. “Local Labor Demand and Program Participation Dynamics:
Evidence from New York SNAP Administrative Records.” Journal of Policy Analysis &
Management 38, no. 2 (March 2019): 394–425. https://doi.org/10.1002/pam.22113.
Skinner, Curtis. “State Immigration Legislation and SNAP Take-Up Among Immigrant Families with
Children.” Journal of Economic Issues 46, no. 3 (September 1, 2012): 661–82.
https://doi.org/10.2753/JEI0021-3624460304.
Stacy, Brian. “Using a Policy Index To Capture Trends and Differences in State Administration of
USDA’s Supplemental Nutrition Assistance Program,” n.d., 38.
Statistics, National Research Council (US) Committee on National, Youth National Research Council
(US) and Institute of Medicine (US) Board on Children, Institute of Medicine (US) Food and
Nutrition Board, Elizabeth Evanson, Charles F. Manski, and Terri M. Scanlan. Research Issues
in Evaluating Food Assistance Programs. Evaluating Food Assistance Programs in an Era of
Welfare Reform: Summary of a Workshop. National Academies Press (US), 1999.
https://www.ncbi.nlm.nih.gov/books/NBK224455/.
Vigil, Alma. “Trends in Supplemental Nutrition Assistance Program Participation Rates: Fiscal Year
2010 to Fiscal Year 2017.” Final report submitted to the U.S. Department of Agriculture, Food
and Nutrition Service. Washington, DC: Mathematica, September 2019.