€¦ · web viewjuly – august 2010. list of abbreviations: cdr crude mortality rate. ci...
TRANSCRIPT
KILIFI DISTRICT NUTRITION SURVEY
July – August 2010

List of Abbreviations:
CDR Crude Mortality Rate
CI Confidence Interval
FGDs Focus Group Discussions
GAM Global Acute Malnutrition
MOH Ministry of Health
MUAC Middle Upper Arm Circumference
OR Odds Ratio
RMR Retrospective Mortality Rate
SAM Severe Acute Malnutrition
UNICEF United Nations Children’s Fund
W/H Weight for Height
WFP World Food Programme
WHM Weight for Height Percentage Median
WHO World Health Organization
WHZ Weight for Height Z scores
Operational definition of terms 1. Diarrhea: Case definition = every episode of more than three liquid stools per day.2. Measles: Case definition = every episode of fever associated with eruption with skin
rashes (especially on the face) and with or without conjunctivitis.3. Acute respiratory infection (ARI): Case definition = every episode where fever-cough are
associated and at least one of the following signs: expectoration, chest pain, dysponea (shortness of breath), wheezing.

Table of contents
List of Abbreviations:.........................................................................................................................................1Operational definition of terms.........................................................................................................................1Table of contents................................................................................................................................................2Acknowledgements.......................................................................................................................................3Executive Summary............................................................................................................................................4Recommendations:............................................................................................................................................6Introduction.....................................................................................................................................................8Figure 1...............................................................................................................................................................8Methodology....................................................................................................................................................3Objectives...........................................................................................................................................................4Survey Methodology..........................................................................................................................................5Sample size calculations......................................................................................................................................5Training of Survey Personnel...............................................................................................................................5Data Collected....................................................................................................................................................5Other variables Measured.................................................................................................................................2Equipment Used.................................................................................................................................................2Quality Control...................................................................................................................................................3INDICATORS, GUIDELINES AND FORMULAS USED............................................................................................3Acute Malnutrition.............................................................................................................................................3Chronic malnutrition and underweight indices................................................................................................3COMMUNITY SENSITIZATION:...........................................................................................................................5DATA ANALYSIS...................................................................................................................................................5Limitations of the study:....................................................................................................................................5Results.................................................................................................................................................................6Descriptive data Anthropometric results: children (based on WHO standards 2005)....................................6Prevalence of Underweight and Stunting.......................................................................................................10Prevalence of malnutrition expressed by MUAC.............................................................................................11Mortality results (retrospective over 90 days prior to survey).......................................................................11Child morbidity.................................................................................................................................................12Measles Vaccination Results............................................................................................................................12Vitamin A supplementation and de-worming:...............................................................................................14Infant and young feeding...........................................................................................................................14Household food consumption and dietary diversity........................................................................................2Water and Sanitation.........................................................................................................................................3Malaria:...............................................................................................................................................................5General Food Aid and Nutrition interventions being implemented in Kilifi district:......................................5Demographic features of sampled household..................................................................................................2Livelihood analysis.............................................................................................................................................2Coping mechanisms...........................................................................................................................................2Wealth ranking:..................................................................................................................................................2Conclusions....................................................................................................................................................4Recommendations.........................................................................................................................................5Annexes..............................................................................................................................................................7ANNEX 1: Participants of the Survey.................................................................................................................7ANNEX 3: UNICEF Conceptual Framework on Causes of Malnutrition..........................................9Annex 4: Wealth ranking.............................................................................................................................10Annex 5: Documents reviewed..................................................................................................................2ANNEX 6: SURVEY TRAINING....................................................................................................................3ANNEX 7: Survey Work Plan.......................................................................................................................4

AcknowledgementsThis report was produced for UNICEF by FHI/APHIA II Coast in collaboration with the Ministry of Public Health and Sanitation and Ministry of Medical Services. FHI/APHIA II Coast would like to thank the following individuals who participated in the survey and contributed to this document.
Esther Ogonda McOyoo, the consultant who conducted the Research Assistants’ training, supervised the survey and wrote the report, Ronald Mbunya, Kilifi District Nutrition Officer who coordinated the survey planning, implementation and report writing , MoH staff and the survey teams for the hard work and tolerance during the entire period of the survey; Sophie Yaa, Brenda Opanga, Bibiana Jumwa of FHI/APHIA II Coast who worked hard and long hours to ensure the success of this survey; support from APHIA ll Coast office through Ruth Odindo, Dr. Dickson Mwakangalu and Dr. Frank Mwangemi; and James Orondo for data entry and supervision. Additionally, we wish to thank World vision and Arid Lands as stakeholders for availing additional information needed for this survey.
We would like to thank the mothers and the fathers who pleasantly allowed the team to measure their children and patiently sat through the interviews and shared with the team valuable information.
APHIA II Coast would like to acknowledge the contribution to the survey of the following staff: Margaret Kaseje, MaryStella Barasa, Lisa Dulli and Peter Mwarogo.
Finally we wish to thank UNICEF who funded this survey which was undertaken under the APHIA ll Coast Project funded by USAID.

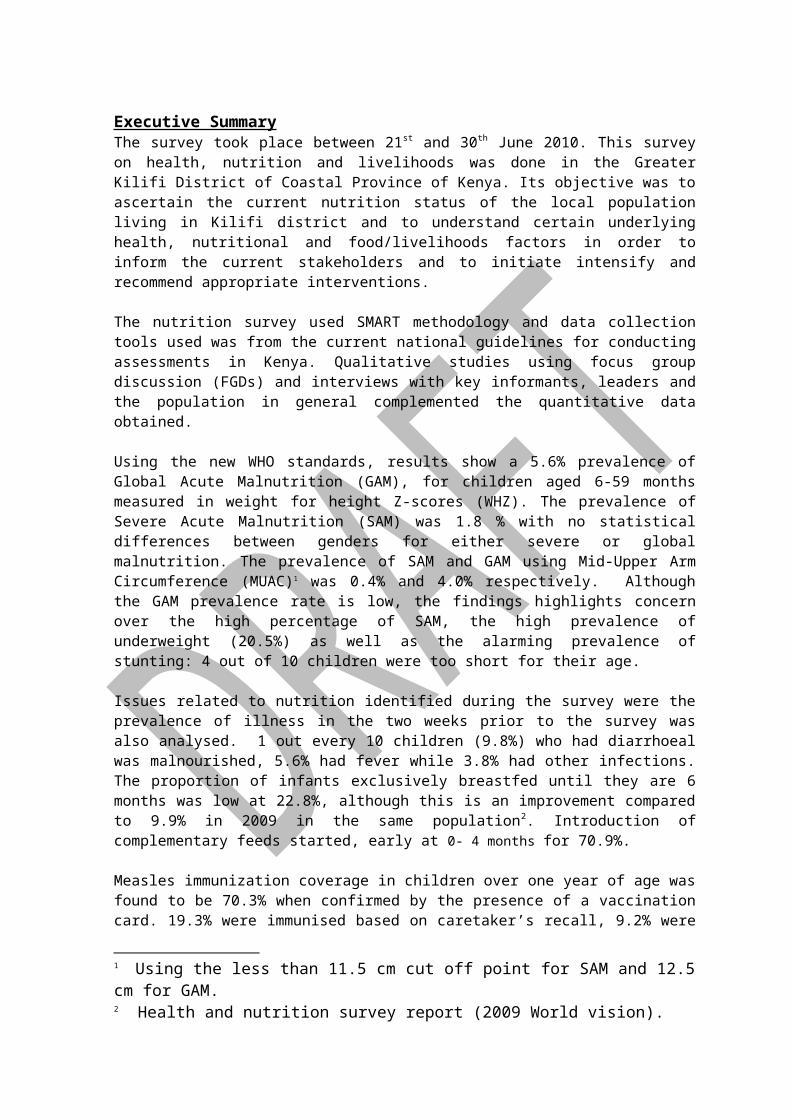
Executive Summary The survey took place between 21st and 30th June 2010. This survey on health, nutrition and livelihoods was done in the Greater Kilifi District of Coastal Province of Kenya. Its objective was to ascertain the current nutrition status of the local population living in Kilifi district and to understand certain underlying health, nutritional and food/livelihoods factors in order to inform the current stakeholders and to initiate intensify and recommend appropriate interventions.
The nutrition survey used SMART methodology and data collection tools used was from the current national guidelines for conducting assessments in Kenya. Qualitative studies using focus group discussion (FGDs) and interviews with key informants, leaders and the population in general complemented the quantitative data obtained.
Using the new WHO standards, results show a 5.6% prevalence of Global Acute Malnutrition (GAM), for children aged 6-59 months measured in weight for height Z-scores (WHZ). The prevalence of Severe Acute Malnutrition (SAM) was 1.8 % with no statistical differences between genders for either severe or global malnutrition. The prevalence of SAM and GAM using Mid-Upper Arm Circumference (MUAC)1 was 0.4% and 4.0% respectively. Although the GAM prevalence rate is low, the findings highlights concern over the high percentage of SAM, the high prevalence of underweight (20.5%) as well as the alarming prevalence of stunting: 4 out of 10 children were too short for their age.
Issues related to nutrition identified during the survey were the prevalence of illness in the two weeks prior to the survey was also analysed. 1 out every 10 children (9.8%) who had diarrhoeal was malnourished, 5.6% had fever while 3.8% had other infections. The proportion of infants exclusively breastfed until they are 6 months was low at 22.8%, although this is an improvement compared to 9.9% in 2009 in the same population2. Introduction of complementary feeds started, early at 0- 4 months for 70.9%.
Measles immunization coverage in children over one year of age was found to be 70.3% when confirmed by the presence of a vaccination card. 19.3% were immunised based on caretaker ’s recall, 9.2% were not immunised, while 1.3% did not know their measles immunisation status. 85.2%) (n=23) of the malnourished children (had been vaccinated for measles meaning that 14.8% (n=4) malnourished children had not been immunised. Vitamin A supplementation was very good, 98.9%: 53.8% have received the supplement once; 31.7% have received the supplement twice.
Both Crude Mortality and Under 5 (U5) Mortality rates were below the alert levels at 0.64 and 1.60 deaths/10,000 people /day according to WHO 1995 standards.
1 Using the less than 11.5 cm cut off point for SAM and 12.5 cm for GAM.2 Health and nutrition survey report (2009 World vision).

Table 1: Summary of key findings
Index INDICATORSRESULTS N= 550
WHO WASTINGZ-score
Global Acute Malnutrition W/H<-2 z and /or oedemas
5.6 % (3.3 - 8.0 95% C.I.) (n= 31)
Severe Acute MalnutritionW/H <-3 z and /or oedemas
1.8 % (0.5 - 3.1 95% C.I.) (n = 10)
% MUAC
Global Acute Malnutrition MUAC <125 mm
4.0 % (n=20)
Severe Acute MalnutritionMUAC <115 mm
0.4 % (n=2)
STUNTING Z-score Global Acute Malnutrition W/H<-2 z and /or oedemas
43.6% (n = 240)
Severe Acute MalnutritionW/H <-3 z and /or oedemas
16% (n = 88)
UNDERWEIGHT Z-score Global Acute Malnutrition W/H<-2 z and /or oedemas
20.5% (n = 112)
Severe Acute MalnutritionW/H <-3 z and /or oedemas
6%(n = 33)
RMR Crude Mortality rates (person/ 10,000/ day)
0.64 (0.31-0.98) (95% CI)
Under 5 Mortality (person/ 10,000/ day)
1.60 (0.41-2.79) (95% CI)
Measles immunisation coverage for 9 to 59 months (n= )
Total immunized Yes with cardYes without cardNo vaccinationUnknown
(479) 89.6%(376) 70.3%(103) 19.3%(49) 9.2%(7) 1.3%
OPV 1 coverage Total immunized Yes with card Yes without card No vaccination Unknown
(418) 77.1%(106) 19.6%(7) 1.3%(11) 2%
OPV 3 coverage Total immunized Yes with cardYes without cardNo vaccinationUnknown
(397) 73.7%(107) 19.9%(23) 4.3%(11) 2%
Index INDICATORSRESULTS N= 550
Frequency of Vit A in the last 6 months
ZeroOnceTwice
(5) 1.1%(249) 53.8%(147) 31.7%
De-worming frequency in the last 6 months
Not given1-2 times by card1- 2 times by recallDon’t know
1) 0.2%(71) 13.7%(79) 15.3%(13) 2.5%
Frequency of child feeding
OnceTwiceThree times4 times5 or more times
(15) 2.8%(70) 13.1%(374) 69.9%(60) 11.2%(16) 3%
Timing for introducing complementary feeding
0- 4 months4- 5 months6 months and above
70.9%6.3%22.2%
Other underlying factors/ Indicator
Main source 2nd most common 3rd most common
Water source3 Tap water (181) 59.2%
Protected well (23) 7.5%
Unprotected well (15) 4.9%
Source of income Casual labor: 33% Wage labor: 13.6% Salary: 13.3%
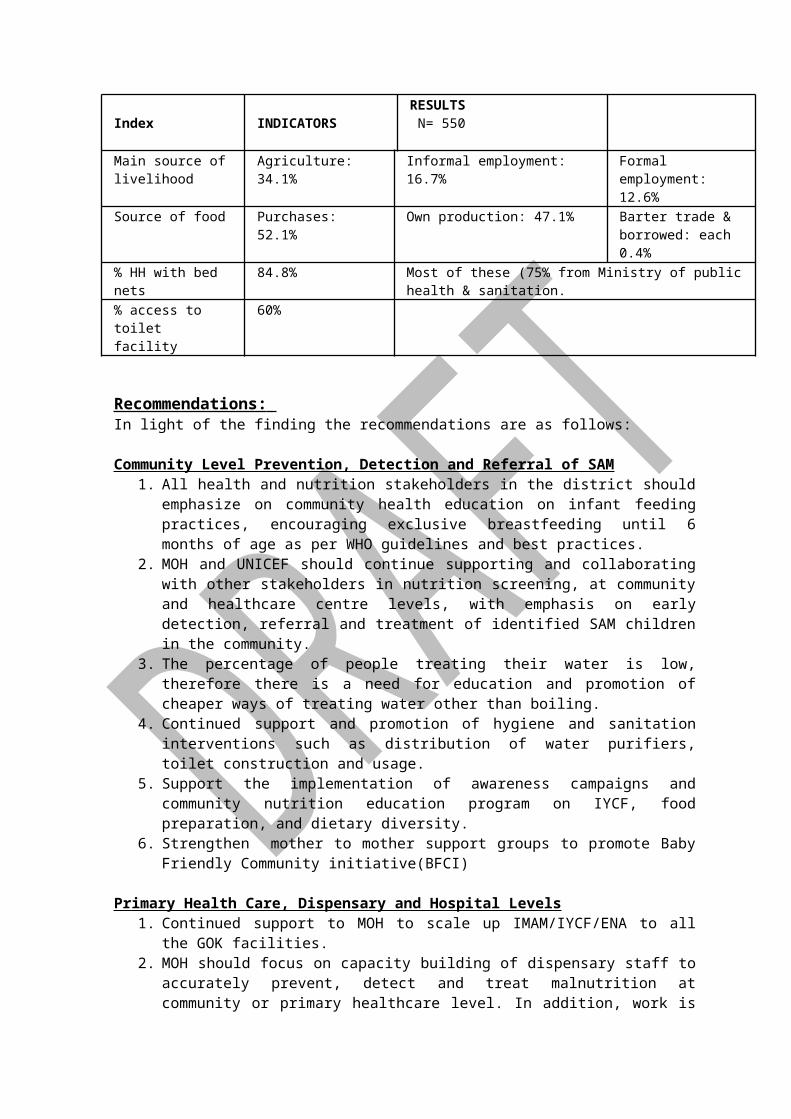
Main source of livelihood
Agriculture: 34.1% Informal employment: 16.7% Formal employment: 12.6%
Source of food Purchases: 52.1% Own production: 47.1% Barter trade & borrowed: each 0.4%
% HH with bed nets 84.8% Most of these (75% from Ministry of public health & sanitation.
% access to toilet facility
60%
Recommendations: In light of the finding the recommendations are as follows:
Community Level Prevention, Detection and Referral of SAM1. All health and nutrition stakeholders in the district should emphasize on community
health education on infant feeding practices, encouraging exclusive breastfeeding until 6 months of age as per WHO guidelines and best practices.
2. MOH and UNICEF should continue supporting and collaborating with other stakeholders in nutrition screening, at community and healthcare centre levels, with emphasis on early detection, referral and treatment of identified SAM children in the community.
3. The percentage of people treating their water is low, therefore there is a need for education and promotion of cheaper ways of treating water other than boiling.
4. Continued support and promotion of hygiene and sanitation interventions such as distribution of water purifiers, toilet construction and usage.
5. Support the implementation of awareness campaigns and community nutrition education program on IYCF, food preparation, and dietary diversity.
3 N. b. 79.1% Do not treat their water at before drinking.
6. Strengthen mother to mother support groups to promote Baby Friendly Community initiative(BFCI)
Primary Health Care, Dispensary and Hospital Levels1. Continued support to MOH to scale up IMAM/IYCF/ENA to all the GOK facilities. 2. MOH should focus on capacity building of dispensary staff to accurately prevent, detect
and treat malnutrition at community or primary healthcare level. In addition, work is needed to strengthen and standardize the admission and discharge criteria at the healthcare facilities.
3. Strengthening and Harmonization of referral and cross-referral procedures between levels of the health care system will allow prompt transfer of patients to hospitals as well as follow up of discharged children by the primary health care centers or by community health workers or volunteers to ensure total recovery of these children.
4. Scale up Community Growth Monitoring to all sites with trained Community Health Workers
5. Continued support on health outreach programs to maintain access especially for immunization services and improved de-worming and Vitamin A supplementation, with appropriate education of communities on importance of these services.
6. Encourage the continued use of mosquito nets and support distribution in areas and or population not yet targeted.
7. Enhanced joint program monitoring support, supervision and mentorship activities for the technical staff by MoH, UNICEF and NGOs implementing related health and nutrition programs
8. Support integrated health outreaches and focus more on preventive and promoting health services
9. Scale up Positive Deviance Hearth mechanism approach of combating community malnutrition to all divisions of the district
10. Scale up the Community Led Total Sanitation Program that is already in the district to all the villages to improve on proper disposal of human waste
Food aid distribution and Livelihood interventions1. Continue General food distribution (GFD)/ food for asset to poor and vulnerable
households.2. Initiate and support income generating activities for the poor households especially
among mothers with children under five years old.3. Liaise with key stake holders to promote use of drought resistant crops like sorghum,
millet, cassava etc.4. Support interventions relating to livestock production which is a major source of the
community livelihood.
General
1. Sharing nutrition data and information with all stakeholders during the District Health stakeholders’ forum is critical for inputs from partners and for ease of resource mobilization.
Introduction Figure 1

The greater Kilifi district is situated in Coast Province. The district borders Taita Taveta District to the west, Malindi District to the northwest and Mombasa and Kwale Districts to the south. The district covers an area of 4,779 km2 19 % of which is arable. According to the district statistics office, the total population in Kilifi district is 471,115, with high population densities in Bahari, Kikambala, Kaloleni and Chonyi divisions. Sparsely populated divisions are Ganze, Vitengeni, Bamba and some parts of Kaloleni division. The nutrition assessment was conducted by MOH and FHI/APHIA II Coast, targeting the most vulnerable age groups (children under fives as well as caretakers) in both urban and rural areas in this catchments
area.
Poverty in Kilifi district manifests itself in the inability by the majority of the people to access basic needs such as food, shelter, clothing, health, water, education, land and good roads due to geographical, economic and socio-cultural barriers. Agriculture contributes to 80 % of the household income in the district. However the performance of agriculture for the last couple of years has not been able to meet the expectations. Famine and drought are recurrent disasters in the district. The hunger gap period in the district is normally experienced from March to June, during the planting and weeding season, just before the long rains harvest as per the seasonal calendar seen below.
Table 2: Seasonal calendar
Short rains harvests Short dry spell
Planting/Weeding Long rains
Long rains harvests A long dry spell
Short rains Planting/weeding
Jan Feb Mar Apr May Jun Jul Aug Sept Oct Nov Dec
However, for the population residing in urban areas with markets well supplied all year long, their difficult food situation is related to inadequate economic power, as opposed to lack of food availability. Fluctuations of food prices has particularly affected the inhabitants in the districts, especially increase in the price of cereals, coupled with the 2009 global economic recession that had negative effects to the purchasing power and food availability at household level.

Health care services are provided by 2 district government and 1 FBO hospitals,6 health centres, 25 dispensaries, 26 private nursing homes and medial clinics.
Table 3: Summary distribution of Health Facilities by Division Division Hospital Health
centers
Dispensaries Nursing
homes
Medical Clinics
Bahari 1 0 2 2 3
Bamba 0 1 1 0 2
Chonyi 0 1 3 0 0
Ganze 0 0 2 0 1
Kaloleni 2 2 9 0 5
Kikambala 0 1 5 1 12
Vitengeni 0 1 3 0 0
Total 3 6 25 3 23
Source: Kilifi A Performance Status report on Kilifi District 2006/2007 Annual report
Several organisations implement various health and nutrition programs in the district. These include: 1. MOH: Management of SAM and MAM at the health facilities 2. FHI/APHIA II ( in collaboration with UNICEF)3. World Vision (in collaboration with WFP): Food for asset distribution4. Arid lands: Nutrition surveillance
The Management of acute malnutrition takes place in the MOH health facilities in the district and targets all acutely malnourished children less than five years of age. 8.5% of children were found to be at risk for malnutrition to moderately and severely malnourished in the May 2010 surveillance done by arid lands and the early warning stage for the entire region is normal with a stable trend.
Targeted nutrition interventions in the area include:
1. Inpatient care – The MOH targets an average of 30 children less than five years per month at the district hospital. The criteria used to admit the children are those with MUAC less than 11.5cm with medical complications or WHM percentage of less than 70% or WAZ of less than -3, failed appetite test and presence of oedema +++.
2. Outpatient Programs: It has 3 program components: a) Food by prescription for people living with HIV/AIDS. Implemented by the MOH also, admission criteria is based on being HIV positive, on Anti Retro Virals, BMI less than 18.5 or MUAC less than 22 for pregnant women or lactating women whose children are less than six months. This intervention is also limited to Orphaned and Vulnerable Children that access services at the Kilifi district hospital comprehensive care centre.
b) Supplementary Feeding Program: World Vision and the MOH implement SFP in 1 hospital, 1 sub hospital 9 dispensaries and 1 health centre across the surveyed divisions4. Targets children under five
4 In Bahari division: Kilifi district hospital, Matsangoni dispensary and Roka maweni dispensary; Vitengeni division- Dida dispensary, Madamani dispensary, Dzikunze
dispensary , Vitengeni health center and Mryachakwe dispensary; Ganze division- Ganze dispensary; Jaribuni division- Jaribuni dispensary; Bamba division- Bamba sub district
years who have MUAC between 11.5 to 12.5 without Medical complications, pregnant women with a MUAC less than 22cm, and lactating women with infants with a MUAC less than 22cm. The SFP aims at meting 50% of the RDA of the index client.
C) Outpatient Therapeutic Feeding Program: Targets an average of 266 severely malnourished children less than five years with a MUAC of less than 11.5 cm per month, pregnant women with a MUAC of less than 21 cm and lactating women with infants with a MUAC of less than 21cm. OTP aims at meeting 100% of the RDA of the enrolled beneficiaries and is currently being implemented in 1 hospital, 1 sub hospital, 12 dispensaries, and 2 health centres5.
3. Promotion and preventive activities have also been carried out for the past 3 monthsa) Training of health workers on Infant and Young Child Feeding (IYCF)/ baby friendly hospital initiative/ Baby Friendly Community Initiative (BFHI)/Essential Nutrition Actions (ENA)b) Training of health workers on Integrated Management of Acute Malnutrition (IMAM)c) Monitoring and mentorship of health workers on IMAM/IYCF/BFHI/ENAd) Training of community health workers on Family/Household level screening and referral of acute malnutritione) Sensitization of health facility management teams on IMAM/IYCF/BFHI/ENAf) Formation of support groups to encourage appropriate infant and young child feeding practices
4) Vitamin A supplementation and de-worming for children
MOH data from the health facilities indicated that severe malnutrition was prevalent in the population. There was need to conduct nutrition and food security survey to establish and monitor the situation. This would provide information to stakeholders to help in understanding the context and if need be to re-design its program appropriately.
MethodologySurvey date: 14th to 30th June 2010
Area of coverage: 7 divisions6 of the Greater Kilifi District of Costal province. All the 41 sub locations were given equal opportunities of being selected in the sample
Target Population: 471,115 with an estimated under 5 population size of 94,223 children (20% of total population).
Methodology: Based on SMART methodology the survey used cluster sampling to select children surveyed, with a village being the cluster. A five days training, including a pilot survey was conducted to all the data collectors prior to the actual fieldwork. Several focus group discussions (FDG) were also conducted with key informants, leaders, men and women belonging to the target population.
Target group: Kilifi district residents households with or without children less than 5 years
hospital, Mirihini dispensary
5 Bahari division: Kilifi district hospital, Matsangoni dispensary and Roka maweni dispensary; Vitengeni division- Dida dispensary, Madamani dispensary, Dzikunze dispensary,
Vitengeni health center and Mryachakwe dispensary; Ganze division- Ganze dispensary; Jaribuni division- Jaribuni dispensary; Bamba division- Bamba sub district hospital,
Mirihini dispensary; Kikambala division-Takaungu dispensary, Vipingo health center, Bomani dispensary and Mtwapa dispensary; Chonyi division- Chasimba health center
6 These are Bamba, Kaloleni, Chonyi, Ganze, Vitengeni, Bahari and ……

old (6-59 months for anthropometry, livelihood, household and mortality questionnaires)
Sample size: 550 children aged 6 months to 5 years for anthropometry, 2849 people for mortality.
Purpose: To prioritise health, nutritional and food/livelihoods needs in order to understand context, intensify and/or recommend appropriate interventions.
Objectives Main objective: To determine the prevalence of malnutrition and related immediate and
underlying causes among the residents of Kilifi district.
Specific Objectives: The specific objectives of the nutrition survey were:
1. To estimate the prevalence of acute and chronic malnutrition in children aged 6-59 months;
2. To estimate the crude and under five mortality rate and causes of death;
3. To estimate the coverage of food and nutrition interventions Public health interventions (Vaccination, Vitamin A supplementation, de worming, mosquito net
4. To estimate the Morbidity rates of children 6-59 months 2 weeks prior to the survey.
5. To determine the food and livelihoods status of the families in Kilifi by: Analysing the composition and frequency of the feeding patterns at household levels Describing the household living conditions Analysing food consumption patterns and food sources. Determining households’ income and its sources. Determining households expenses and priorities To assess possible underlying causes of malnutrition (HHD water consumption,
Hygiene and sanitation issues, Food consumption and dietary diversity, To begin an identification on possible wealth groups and HH profiles To make recommendations for the stakeholders.
Focus group discussions were also conducted with the objectives of ascertaining some of the quantitative information e.g. on food aid, water, wealth ranking.

Survey MethodologyCluster sampling methodology was used using a village as a cluster. 35 clusters of 16 children were targeted for the Nutrition and Food Security Survey questionnaire and 231 households for the mortality. The sample sizes were calculated using ENA using the following information.
Sample size calculations
NUTRITION QUESTIONAIREChildren under 5 years of age = 94,223 (estimated 20%)Estimated prevalence of GAM = 9% Precision: 3.5Cluster effect design: 2100% Sample size of 512105% sample size: 53816 children per cluster/ village
MORTALITY QUESTIONAIREEstimated prevalence CMR= 1/10,000/day Precision: +1Cluster effect design: 2Recall period= 90 days100% Sample size of 1674110% sample size: 1842No. of households = 231 HHD (average household size is 8) 8 household per village
All villages and children were randomly selected giving all individuals and households an equal opportunity of being included in the survey. Children between the ages of 6 and 59 months were included in the survey for anthropometric analysis. All households with or without children were however included for the mortality assessment.
For planning purposes, the sample sizes for anthropometry and mortality were increased by 5% and 10% respectively to cater for missing or flagged data. In reality however, the actual numbers of households and children sampled for mortality and anthropometry were 389 and 550 respectively.
Training of Survey Personnel Training took place in five days, which covered the all aspects of the survey as well as survey design and methodology, ethical considerations, interviewing skills and focus group discussion. The training was conducted for all the 15 survey enumerators and team leaders from the 16 th to 21st June, 2010. A standardisation exercise was done with all participants measuring four children each in their respective teams and the results compared against that of the supervisor as per SMART standards. A pilot survey exercise was done in addition to the standardisation of anthropometry data collection with all the participants. The data collection forms were then edited appropriately following the pilot exercise. Under the leadership of the consultant, the supervision team consisted of the DNO, UNOPS nutritionist, DSO, FHI monitoring officer and Project Officer. Five teams of three people each were grouped to facilitate the data collection. A full list of participants is presented in annex 1.
Following the training, the survey team took two days to edit and photocopy the data collection tools. Data collection began on 22nd June and ended on 30thth June. Two data entry clerks were trained and supervised while completing data entry in the office which was done concurrently with the data collection.
Data Collected Questionnaires adopted from the Guidelines for Nutrition Assessments in Kenya (2008) and translated in Swahili were used to collect data. Anthropometric data on children sampled were as follows:

Age: The exact age of the child was recorded in months, based on information gathered from the caregiver and confirmed with health records. Most of the caregivers had birth certificates and child health cards with children’s birth dates. However a local calendar of events (see annex) was used to where records were not available as well as to convert the age from years to months.
Weight: Children were measured using a 25 kg hanging spring Salter scale to the nearest 100g.
Height: Recumbent length was taken for children less than 85 cm or less than 2 years of age while those greater or equal to 85 cm or more than 2 years of age were measured standing up.
MUAC: Mid Upper Circumference (MUAC) was measured using standard methodology, in mm. In the event of a disability or for the left-handed, the right arm was used.
Bilateral oedema: Assessed by the application of normal thumb pressure for at least 3 seconds to both feet at the same time.
Other variables MeasuredVaccination status: For all children 6-59 months, information on Measles vaccination status, whether with or without MCH cards was gathered. To estimate measles coverage, only children older than 1 year were considered. OPV 1 and OPV 3 were also assessed.
Diarrhoea: Retrospective incidence of diarrhoea in children 2 weeks prior to the survey.
Mortality data: Retrospective mortality (under five and total population mortality rates) were calculated using SMART mortality questionnaire. All households, with or without children, were included. Recall period was established from the beginning of voter registration (on 22nd March 2010), giving a recall period of 90 days at the beginning of the survey (on 21 st June 2010). Census of population coming in and going out of the households during the recall period was also done. The probable causes of death were also taken.
Vitamin A supplementation status: For all children 6-59 months of age information on Vitamin A supplementation was collected using recall and cards from caregivers who were shown samples of the Vitamin A available locally.
Information on child Feeding Practices: Information on exclusive breastfeeding and time of complementary feeding was also gathered.
Food consumption and dietary diversity data of the households: Information on living conditions, food consumption, food frequency and the number of meals eaten per day (24 hr recall) in addition to 7 days consumption was solicited to establish the food status of the households. Additionally, information on household income and coping strategies was also collected.
Causes of malnutrition: Information on the immediate causes of malnutrition and other underlying factors of concern (like water, toilet facilities, food aid, wealth ranking and livelihood were collected. Qualitative Information: The supervisors also selected groups of 8-15 people with almost similar backgrounds for a few focus group discussions. The research targeted people of various backgrounds representing the Kilifi residents to form focal groups i.e. women, men, and community leaders. A total of 13 focus group discussions were held.
Equipment UsedStandard UNICEF height boards, 25kg Salter scales and MUAC tapes were used to measure anthropometry and the measurements were recorded to the nearest 0.1 cm. Clothing and shoes

were taken off for measurement of weight, but 100 grams were deducted from the pointed weight to account for the clothes’ weight which could not be removed for cultural reasons which were duly respected.
Quality ControlQuality control followed standard procedures: During the survey the teams checked forms during data collection and before leaving the site to ensure all data was taken with further checks done with the supervisors. The trained and more experienced supervisors also performed field visits during data collection to support and supervise enumerators. The data entry team followed up any ambiguous or identified as incorrect answers. Double data entry was also done to ensure data was not compromised at entry level.
INDICATORS, GUIDELINES AND FORMULAS USED
Acute Malnutrition For the children, acute malnutrition rates were estimated from the weight for height (W/H) indices values combined with the presence of oedema. The W/H indices are compared with WHO 2005 references, which have been accepted and are use in the country. W/H indices are expressed in Z-scores and as percentage of the median (see Table 4), with differentiation on the prevalence of moderate and severe acute malnutrition (see table 3).
MUAC: Severe malnutrition defined by measurements <115mm (new WHO cut off point)
Chronic malnutrition and underweight indices Chronic malnutrition is estimated from the height and age indexes in comparison with the WHO 2005 reference mentioned above. The indicator is also expressed in Z scores. The underweight classification of malnutrition gives the characteristics of the actual Childs’ weight in comparison to that of a reference child of the same age and weight. This system is used for public health screening and to evaluate the impact of such interventions although it has limited clinical use for individuals, as it does not differentiate between acute and chronic malnutrition.
Table 4: Acute Malnutrition classification (using WHO z-score)
Global Acute Malnutrition
Moderate Acute Malnutrition Severe Acute Malnutrition
Bilateral Pitting Oedema**
No No Yes(Oedematous malnutrition)
Weight-for-Height
<-2 z-scores <-2 z-scores to -3 z-scores(minus cases of oedematous malnutrition)
<-3 z-scores(Severe wasting) (plus all cases of oedematous malnutrition)
Height-for-Age <-2 z-scores <-2 z-scores to -3 z-scores <-3 z-scores(Severe Stunting)
Bench marks used for interpreting stunting, wasting and underweight are adopted from WHO guidelines.
Table 5: Interpreting prevalence rates of various forms of malnutrition
Index Stunting <- 2 SD % Wasting <- 2 SD % Underweight <- 2 SD %

Acceptable < 20% <5% <10%
Serious 20- 29% 5- 9% 10- 19%
Critical 30- 39% 10- 14% 20- 29%
Emergency = 40% = 15% = 30%
Mortality Rates and stages of Alert: Retrospective mortality rate (RMR) was determined for children under 5 years old (U-5s) and crude rate per 10,000 per day7 according to standard methodology. Interpretation of results is included in Table 6.
Table 6: Interpreting results of mortality rates
CMR U5MRAverage for the developing world
0.27 to 0.5 deaths/10,000 people/day 1.0 deaths/10,000 children under 5/day
In an emergency:Not critical
<1 death/10,000 people/day <2.0 deaths/10,000 children under 5/day
In an emergency:Serious
1-2 deaths/10,000 people/day 2-4 deaths/10,000 children under 5/day
In an emergency:Out of Control
>2 deaths/10,000 people/day >4 deaths/10,000 children under 5/day
Famine/major catastrophe 5.0 10.0
Source: SCN, 1995
7 RNIS (Nutrition Situation of Refugees and Displaced people) benchmark
COMMUNITY SENSITIZATION:The Provincial and district administration were informed about the survey 1- 2 months prior to the exercise. Once all details had been planned and the survey team was trained, and villages randomly selected, messages were sent at least a day prior to the survey to sensitize the community leaders and members of the impending survey.
DATA ANALYSISData was entered in the ENA Software 2007 version, used to analyze anthropometric and mortality questions. Statistical Analysis Software SPSS versions 16.0 and MS Excel 2007 were used to analyze the nutrition and food survey data respectively. In order to validate the accuracy of data entry, double data entry was carried out by two different individuals and the files were then compared using the ENA. Differences in the two entries were reconciled and a final file for cleaning was produced. Qualitative information was analyzed thematically.
Limitations of the study: 1. The standard data collection tool was not adopted to the context: e.g. due to early marriages
and grandmothers being primary care givers, it would have been more appropriate to modify the age of child bearing mothers whose nutritional status were being measured from the standard 15- 49 yrs.
2. The questionnaire used could not give all the minimum, WHO indicators especially on
breastfeeding and child food diversity.
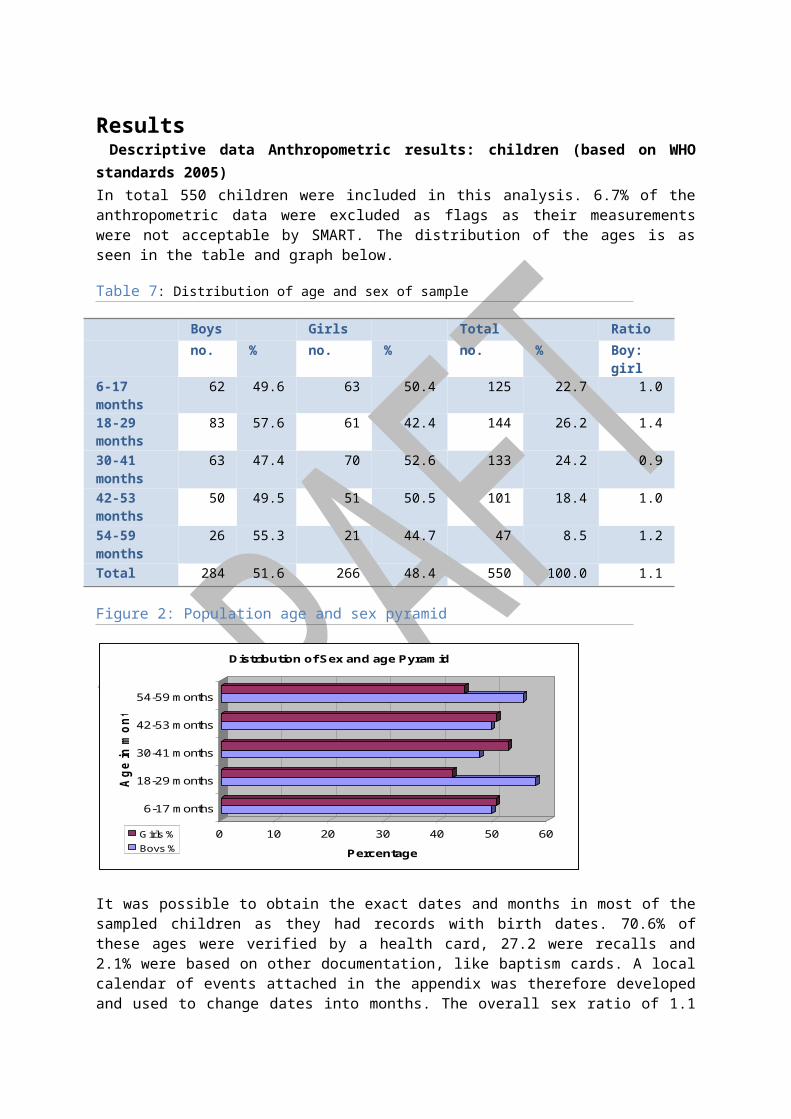
Results Descriptive data Anthropometric results: children (based on WHO standards 2005)In total 550 children were included in this analysis. 6.7% of the anthropometric data were excluded as flags as their measurements were not acceptable by SMART. The distribution of the ages is as seen in the table and graph below.
Table 7: Distribution of age and sex of sample
Boys Girls Total Rationo. % no. % no. % Boy: girl
6-17 months 62 49.6 63 50.4 125 22.7 1.0
18-29 months
83 57.6 61 42.4 144 26.2 1.4
30-41 months
63 47.4 70 52.6 133 24.2 0.9
42-53 months
50 49.5 51 50.5 101 18.4 1.0
54-59 months
26 55.3 21 44.7 47 8.5 1.2
Total 284 51.6 266 48.4 550 100.0 1.1
Figure 2: Population age and sex pyramid
0 10 20 30 40 50 60
Percentage
6-17 months
18-29 months
30-41 months
42-53 months
54-59 months
Age
in m
onth
s
Distribution of Sex and age Pyramid
Girls %Boys %
It was possible to obtain the exact dates and months in most of the sampled children as they had records with birth dates. 70.6% of these ages were verified by a health card, 27.2 were recalls and 2.1% were based on other documentation, like baptism cards. A local calendar of events attached in the appendix was therefore developed and used to change dates into months. The overall sex ratio of 1.1 is within acceptable range and validates sample selection.
Table 8: Prevalence of acute malnutrition based on weight-for-height z-scores (and/or oedema) and by sexMean and 95% confidence intervals All
n = 550Boys
n = 284Girls
n = 266Prevalence of global malnutrition (<-2 z-score and/or oedema)
(31) 5.6 %(3.3 - 8.0 95%
C.I.)
(22) 7.7 %(4.0 - 11.5 95%
C.I.)
(9) 3.4 %(0.5 - 6.3 95%
C.I.)Prevalence of moderate malnutrition (<-2 z-score and >=-3 z-score, no oedema)
(21) 3.8 %(2.1 - 5.6 95%
C.I.)
(14) 4.9 %(2.3 - 7.5 95%
C.I.)
(7) 2.6 %(-0.1 - 5.4 95%
C.I.)Prevalence of severe malnutrition (<-3 z-score and/or oedema)
(10) 1.8 %(0.5 - 3.1 95%
C.I.)
(8) 2.8 %(0.3 - 5.3 95%
C.I.)
(2) 0.8 %(-0.6 - 2.1 95%
C.I.)The prevalence of oedema is 0.7 %
4 cases of oedema were identified. The prevalence of oedema was therefore calculated at 0.7 %. The prevalence of global acute malnutrition (GAM) among children under five was 5.6%; 3.8% were moderately malnourished, whereas 1.8 % were severely malnourished., Whereas the GAM rates are poor/ low, just above acceptable levels based on the WHO standards8, concerns are for the relatively high proportion of severely malnourished children 1.8% (<-3 Z scores). The national 2008- 09 KDHS found 7% of children to wasted and 2% severely wasted in the whole country.
As detailed in the table above, boys were also found to be more moderately malnourished (4.9% compared to the girls (2.6%) as well as in severe malnutrition 2.8% and 0.8% respectively. However the number of cases was low, confidence intervals overlap and statistical analysis indicate there is no statistical difference between the two groups and observed differences are likely due to chance (p>0.05).
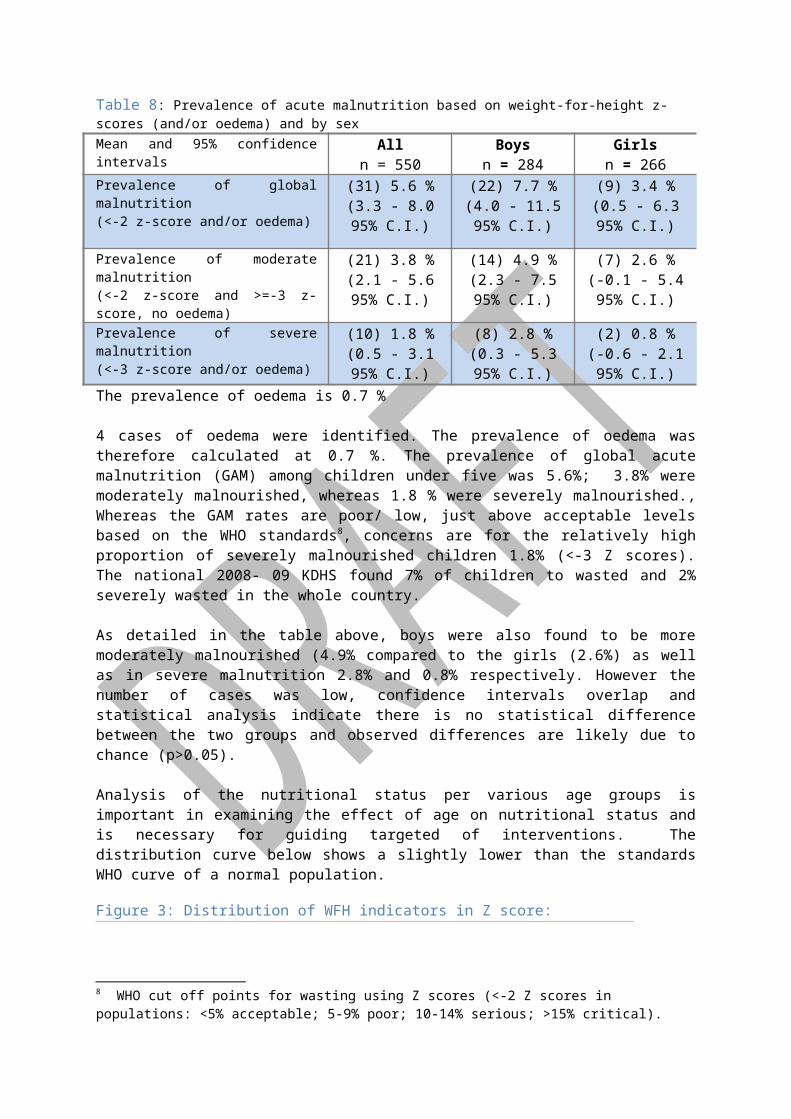
Analysis of the nutritional status per various age groups is important in examining the effect of age on nutritional status and is necessary for guiding targeted of interventions. The distribution curve below shows a slightly lower than the standards WHO curve of a normal population.
Figure 3: Distribution of WFH indicators in Z score:
Table 8 below shows these analyses.
8 WHO cut off points for wasting using Z scores (<-2 Z scores in populations: <5% acceptable; 5-9% poor; 10-14% serious; >15% critical).

Table 9: Prevalence of acute malnutrition by age based on weight-for-height z-scores and/or oedema
Severe wasting(<-3 z-score)
Moderate wasting
(>= -3 and <-2 z-score )
Normal(> = -2 z score)
Oedema
Age (months)
Total no.
No. % No. % No. % No. %
6-17 125 2 1.6 8 6.4 114 91.2 1 0.8
18-29 144 0 0.0 3 2.1 140 97.2 1 0.7
30-41 133 2 1.5 4 3.0 125 94.0 2 1.5
42-53 101 2 2.0 3 3.0 96 95.0 0 0.0
54-59 47 0 0.0 3 6.4 44 93.6 0 0.0
Total 550 6 1.1 21 3.8 519 94.4 4 0.7
Moderate malnutrition was highest in the younger children aged between 6 to 17 months, and 54- 59 months, the former being a time when the effects of poor inappropriate feeding practices are usually experienced. SAM was however highest amongst the 42- 53 months. As a note, rates of severe malnutrition were also found to be highest among children 6- 17 months of age, while moderate malnutrition was highest amongst the 18-29 months in the 2009 World vision survey in the same geographical area.
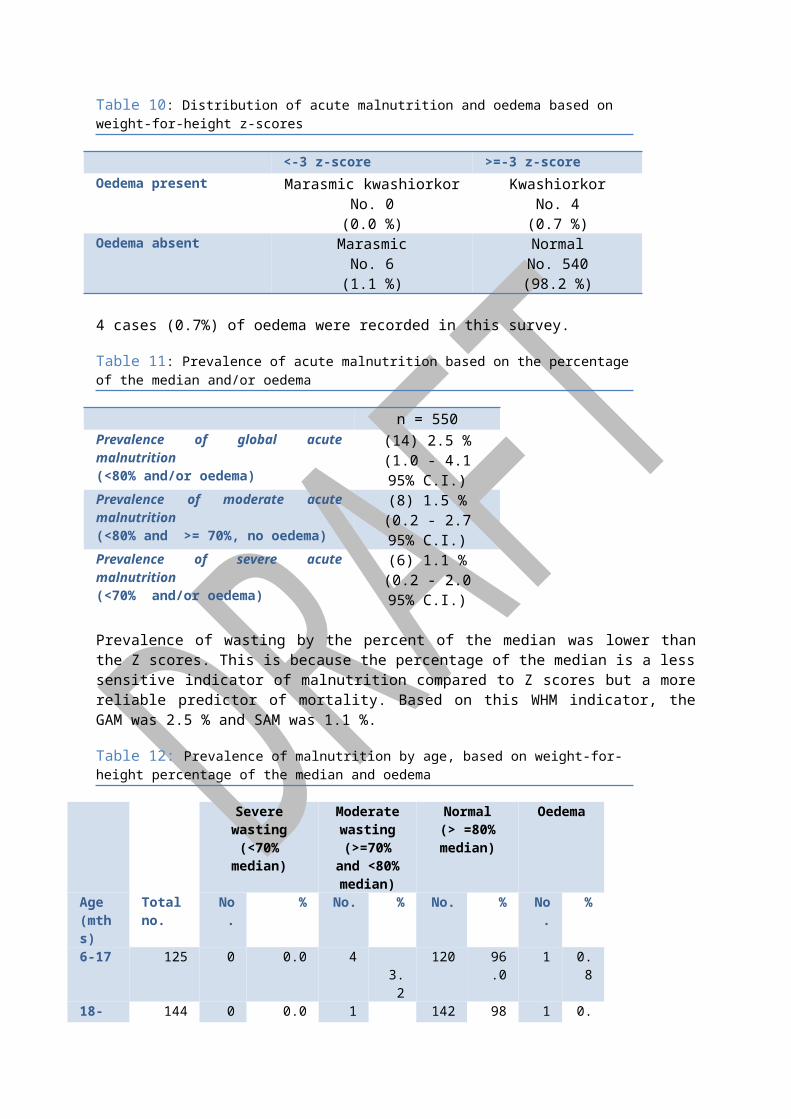
Table 10: Distribution of acute malnutrition and oedema based on weight-for-height z-scores
<-3 z-score >=-3 z-scoreOedema present Marasmic kwashiorkor
No. 0(0.0 %)
KwashiorkorNo. 4
(0.7 %)Oedema absent Marasmic
No. 6(1.1 %)
NormalNo. 540(98.2 %)
4 cases (0.7%) of oedema were recorded in this survey.
Table 11: Prevalence of acute malnutrition based on the percentage of the median and/or oedema
n = 550Prevalence of global acute malnutrition (<80% and/or oedema)
(14) 2.5 %(1.0 - 4.1 95% C.I.)
Prevalence of moderate acute malnutrition (<80% and >= 70%, no oedema)
(8) 1.5 %(0.2 - 2.7 95% C.I.)
Prevalence of severe acute malnutrition (<70% and/or oedema)
(6) 1.1 %(0.2 - 2.0 95% C.I.)
Prevalence of wasting by the percent of the median was lower than the Z scores. This is because the percentage of the median is a less sensitive indicator of malnutrition compared to Z scores but a more reliable predictor of mortality. Based on this WHM indicator, the GAM was 2.5 % and SAM was 1.1 %.
Table 12: Prevalence of malnutrition by age, based on weight-for-height percentage of the median and oedema
Severe wasting(<70% median)
Moderate wasting
(>=70% and <80%
median)
Normal(> =80% median)
Oedema
Age (mths)
Total no.
No. % No. % No. % No. %
6-17 125 0 0.0 4 3.2 120 96.0 1 0.8
18-29 144 0 0.0 1 0.7 142 98.6 1 0.7
30-41 133 1 0.8 2 1.5 128 96.2 2 1.542-53 101 1 1.0 1 1.0 99 98.0 0 0.0
54-59 47 0 0.0 0 0.0 47 100 0 0.0Total 550 2 0.4 8 1.5 536 97.5 4 0.
7
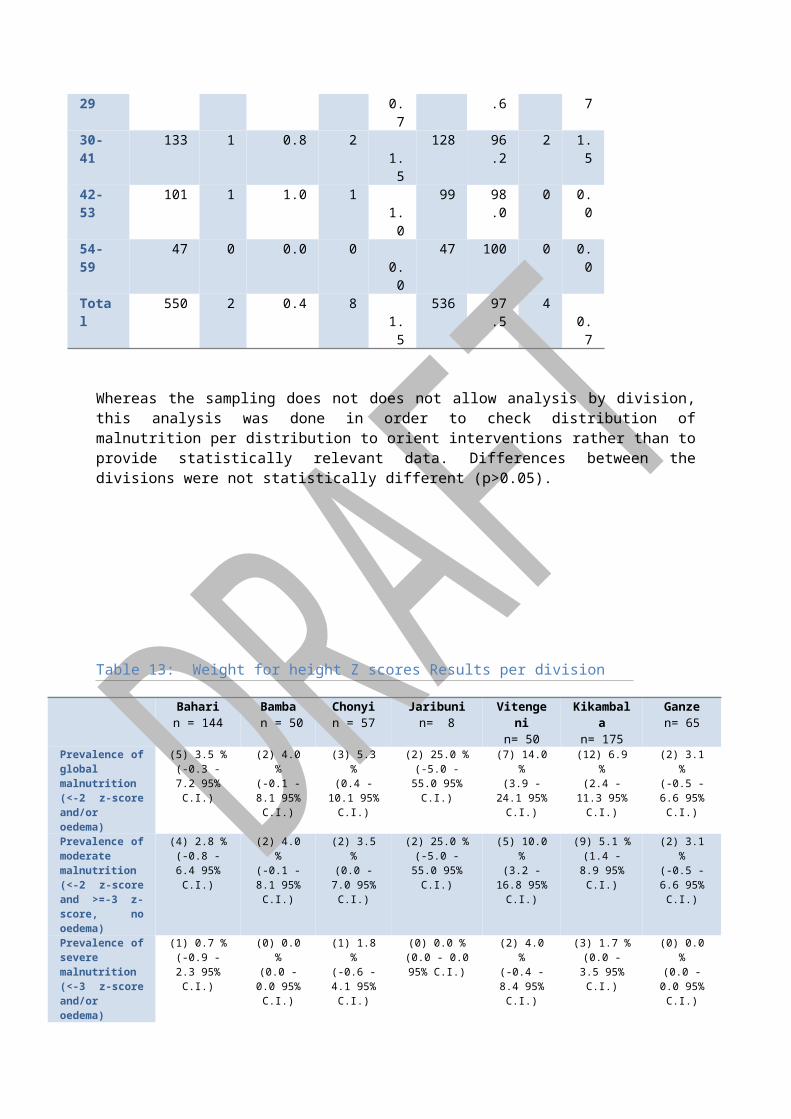
Whereas the sampling does not does not allow analysis by division, this analysis was done in order to check distribution of malnutrition per distribution to orient interventions rather than to provide statistically relevant data. Differences between the divisions were not statistically different (p>0.05).
Table 13: Weight for height Z scores Results per division
Baharin = 144
Bamba n = 50
Chonyin = 57
Jaribunin= 8
Vitengenin= 50
Kikambala n= 175
Ganzen= 65
Prevalence of global malnutrition (<-2 z-score and/or oedema)
(5) 3.5 %(-0.3 - 7.2 95% C.I.)
(2) 4.0 %(-0.1 - 8.1 95% C.I.)
(3) 5.3 %(0.4 - 10.1 95% C.I.)
(2) 25.0 %(-5.0 - 55.0 95% C.I.)
(7) 14.0 %(3.9 - 24.1 95% C.I.)
(12) 6.9 %(2.4 - 11.3 95% C.I.)
(2) 3.1 %(-0.5 - 6.6 95% C.I.)
Prevalence of moderate malnutrition (<-2 z-score and >=-3 z-score, no oedema)
(4) 2.8 %(-0.8 - 6.4 95% C.I.)
(2) 4.0 %(-0.1 - 8.1 95% C.I.)
(2) 3.5 %(0.0 - 7.0 95% C.I.)
(2) 25.0 %(-5.0 - 55.0 95% C.I.)
(5) 10.0 %(3.2 - 16.8 95% C.I.)
(9) 5.1 %(1.4 - 8.9 95% C.I.)
(2) 3.1 %(-0.5 - 6.6 95% C.I.)
Prevalence of severe malnutrition (<-3 z-score and/or oedema)
(1) 0.7 %(-0.9 - 2.3 95% C.I.)
(0) 0.0 %(0.0 - 0.0 95% C.I.)
(1) 1.8 %(-0.6 - 4.1 95% C.I.)
(0) 0.0 %(0.0 - 0.0 95%
C.I.)
(2) 4.0 %(-0.4 - 8.4 95% C.I.)
(3) 1.7 %(0.0 - 3.5 95% C.I.)
(0) 0.0 %(0.0 - 0.0 95% C.I.)
Prevalence of Oedema
0.7% 0% 0% 0% 0% 1.7% 0%
Prevalence of Underweight and Stunting

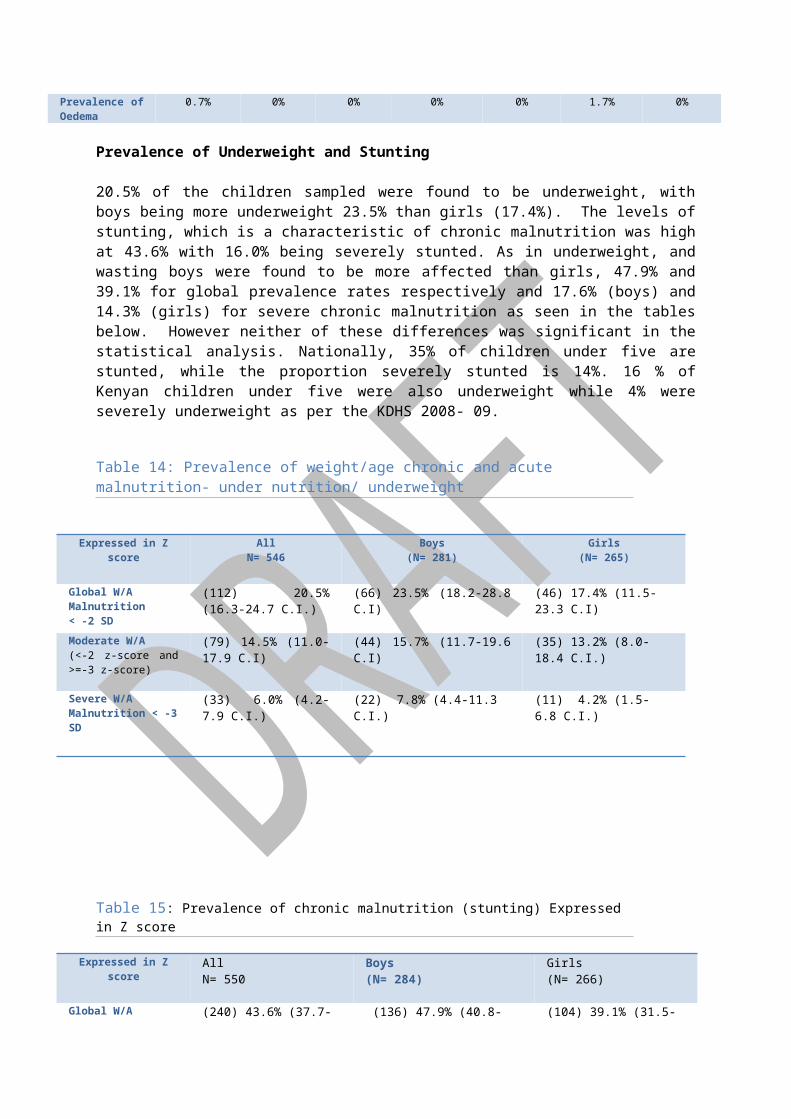
20.5% of the children sampled were found to be underweight, with boys being more underweight 23.5% than girls (17.4%). The levels of stunting, which is a characteristic of chronic malnutrition was high at 43.6% with 16.0% being severely stunted. As in underweight, and wasting boys were found to be more affected than girls, 47.9% and 39.1% for global prevalence rates respectively and 17.6% (boys) and 14.3% (girls) for severe chronic malnutrition as seen in the tables below. However neither of these differences was significant in the statistical analysis. Nationally, 35% of children under five are stunted, while the proportion severely stunted is 14%. 16 % of Kenyan children under five were also underweight while 4% were severely underweight as per the KDHS 2008- 09.
Table 14: Prevalence of weight/age chronic and acute malnutrition- under nutrition/ underweight
Expressed in Z score AllN= 546
Boys (N= 281)
Girls(N= 265)
Global W/A Malnutrition< -2 SD
(112) 20.5% (16.3-24.7 C.I.)
(66) 23.5% (18.2-28.8 C.I) (46) 17.4% (11.5-23.3 C.I)
Moderate W/A (<-2 z-score and >=-3 z-score)
(79) 14.5% (11.0-17.9 C.I) (44) 15.7% (11.7-19.6 C.I) (35) 13.2% (8.0-18.4 C.I.)
Severe W/A Malnutrition < -3 SD
(33) 6.0% (4.2- 7.9 C.I.) (22) 7.8% (4.4-11.3 C.I.) (11) 4.2% (1.5- 6.8 C.I.)
Table 15: Prevalence of chronic malnutrition (stunting) Expressed in Z score
Expressed in Z score AllN= 550
Boys (N= 284)
Girls(N= 266)
Global W/A Malnutrition < -2 SD
(240) 43.6% (37.7-49.5 C.I.) (136) 47.9% (40.8-54.9 C.I.) (104) 39.1% (31.5-46.7 C.I.)
Moderate W/A (<-2 z-score and >=-3 z-score)
(152) 27.6% (23.0-32.3 C.I.) (86) 30.3% (23.9-36.6 C.I) (66) 24.8% (18.8-30.8 C.I)
Severe W/A Malnutrition < -3 SD
(88) 16.0% (12.3-19.7 C.I) (50) 17.6% (12.8-22.4 C.I) (38) 14.3% (9.4-19.2 C.I.)
Prevalence of malnutrition expressed by MUACMUAC was used to determine the nutritional status of children 6-59 months of age and their caretaker mothers aged between 15- 49 years. MUAC does not change significantly with children less than 5 year old and therefore there was no need to segment by age. Using the new WHO cut off point of 11.5 cm the prevalence of severe acute malnutrition was 0.4% (2 children) and GAM was

4.0% (20 children).
In comparing the MUAC findings with surveillance data from Arid Lands, it was noted that prevalence of GAM reduced from 8.5% in May to 4% in this June survey.
Table 16: MUAC prevalence trends based on Arid land surveillance system
MUAC was taken for 318 female caretakers. 1.9% of these had a MUAC less than 210 mm and 10.7% had MUAC between 210 to 230 mm.
Mortality results (retrospective over 90 days prior to survey)
Table 16: Mortality rates
CMR (total deaths/10,000 people /day): 0.64 (0.31-0.98) (95% CI)
U5MR (deaths in children under five/10,000 children under five /day): 1.60 (0.41-2.79) (95% CI)
A total of 643 households with 2849 current residents were included in the mortality sample, whether or not they had a child less than 5 years old. Although secondary information indicates the household size in Kilifi to be 8, the mean household size was found to be 4, with a S.D of 3, mode of 1 and range of 13, meaning some households had up to 14 members, while some constituted of 1 person. During the recall period 11 people joined the households while 186 people left. There were a total of 691 children aged less than five years of age in the sampled households.
A total of 12 births and 10 death of children less than 5 years, and 17 overall deaths were reported over the recall period giving a crude mortality rate of 0.03/10,000 people/day and under-five mortality rate of 0.18/10000 children /day, both below normal in a developing country and similar to previous surveys. The main causes of death was also analysed as given by the respondents. 12.5% died of diarrhoeal diseases, 37.5% died of Acute Respiratory infections and 6.2% of HIV/ AIDS related complications. 43.8% (7 cases) of the deaths were attributed to other factors, old age 2 cases and drowning, typhoid, fits, a stomach disease and yellow fever each responsible for 1 death.
Child morbidity
53.5% of children sampled had suffered some illness 2 weeks prior to the survey. 7.8% suffered from diarrhoea, 1.4% had vomiting, 10.1% had Fever with malaria like chills, and 21% had Fever, cough

with breathing difficulties. 1.7% of the children had skin infections, 0.4% had stomach aches while Intestinal parasite, eye infections, accidents each scores 0.2%. 10.3% suffered from other ailments. There was no significant relationship noticed in cross tabulation illness and nutritional status.
Treatment and health seeking practices were also assessed on 280 respondents. Majority of those sick (53.6%) were taken to a public clinic, while 17.5% went to private clinics. 0.8% use both private and public clinics/ or a mobile clinic. 11.8% bought drugs over the shops/ kiosks. 0.7% of those sick went to a traditional healer with another 0.7% seeking help from CHWs. 1.8% sought for help from a relative or friend while 13.2% sought no assistance at all for their sick children.
Measles Vaccination ResultsMeasles immunization percentage was calculated for all children aged 9 months and above who had received at least one dose of the vaccination. Out of 508 children under five, 69.7% showed an immunization card indicating they had been vaccinated against measles, 19.5% acknowledged immunisation but by recalling, 9.4% had not been immunised while 1.4% of the respondents did not know about their children measles immunisation status.
Figure 4: Vaccination coverage for measles for 9-59 months
Measles vaccination Percentage amngst 9 months and above
69.7
19.5
9.4 1.4
Yes by card
Yes by recall
No
Don’t Know
Table 17: Cross tabulation of Measles immunisation against malnutrition
WHZ scores Yes by card Yes by recall No Don’t Know Total
3.1 and >3 0 0 0 3
2.1 to 3 7 3 2 0 12
1.1 to 2 39 7 7 0 53
0.1 to 1 104 33 9 1 147
-1.1 to 0 139 40 16 3 198
-2.1 to -1 62 15 11 3 91
-3.1 to -2 14 4 3 0 21
-4.1 to -3 4 1 1 0 6
Total 372 103 49 7 531
23 of the malnourished children (85.2%) had been vaccinated for measles meaning that 14.8% (4 children) malnourished children had not been immunised.
Table 18: Pentavalent coverage
Pentavalent 1 received Frequency Percent
Pentavalent 3 received Frequency
Percent
Yes by card 418 77.1 397 73.7
Yes by recall 106 19.6 107 19.9
No 7 1.3 23 4.3
Don’t Know 11 2.0 11 2.0
Total 542 100.0 539 100.0
Vitamin A supplementation and de-worming:
Vitamin A is an essential micronutrient for the immune system and plays an important role in maintaining the epithelial tissue in the body. Severe vitamin A deficiency (VAD) can cause eye damage. VAD can also increase severity of infections such as measles and diarrhoeal diseases especially in children and slow recovery from illness. Periodic dosing (usually every six months) of vitamin A supplements is one method of ensuring that children at risk do not develop VAD. Out of 463 children sampled, 53.8% (249 cases) had received Vitamin A once in the last one year. 31.7% (147 cases) received Vit A twice, while 9.3% (43 cases) received three times. 4% (23 cases) have been left out as they indicated they received the supplement more than three times, indicating a possibility that the question was not limited to the last 1 year. Children are de-wormed at 1 year. Analysis done for children aged 1 year and above indicate a low coverage rate with 66.2% of children not de-wormed even once in the last 6 months. Only 14.2% were de-wormed at least once with a card, and 16.2% recalled having de-wormed their children.
Figure 5: De-worming percentages
14.216.8
66.2
3.2
0.0
10.0
20.0
30.0
40.0
50.0
60.0
70.0
Perc
enta
ge
1-2 by card 1-2 by recall none don’t know
Percentage of children 1 (year and above) dewormed
Infant and young feeding
A majority of mothers interviewed did not exclusively breastfeed for 6 months. 29% of mothers introduced other foods, including water, juices) when the child was less than 1 month old, 18.2% gave at 2nd month, 12.4% by 3rd month, 11.3% gave 5th month and 6.3% introduced other foods by 5th

month. As mentioned in the limitations, key WHO infant feeding indicators like Colostrum intake, reasons for not exclusively breastfeeding, complementary feeding, and child dietary diversity score for children were not assessed in this survey. However the table shows that majority of children (69.9 %%) were found to be fed 3 times a day, and a few (2.2%) were fed 5 times a day. Percentages for those fed once, twice, four times were 2.8%, 13.1%, and 11.2% respectively. The frequency of feeding was generally found to be reducing as the children became older.
Table 19: Feeding frequencies
Feeding Times Frequency Percent
Once 15 2.8
Twice 70 13.1
Thrice 374 69.9
Four times 60 11.2
Five times 12 2.2
Six times and more 4 0.8
Household food consumption and dietary diversityMost households (12.7%) consumed foods from 9 groups based on the categories outlined below. 11.9% eat from 3 groups.
Table 20: Food groups’ consumption based on the food categories below
% of people consuming the food groups above
1 =1.3% 2= 11.4% 3= 11.9% 4= 8.5% 5=8.5% 6=8.1% 7= 5.5% 8= 8.9%
9= 12.7% 10= 8.5% 11= 5.9% 12= 5.1% 13= 2.5% 14= 0.8% 15= 0.4% 16=0%
Most people eat cereals, with 97% having consumed it within the last 24 hours prior to the survey, consuming it for at least 6 out of 7 days in a week. Consumption of dark green vegetables also seems adequate (95% for 5.4 days a week). Concern however arises over the low consumption of Vit A rich vegetables (18% for 3 days a week), organ meat (8.8% for 1.2 days a week) and eggs (16.8% for 2 days a week),
Table 21: Feeding frequency
Food group consumed% feeding in the last 1 week
Average No. of days consumed in the last 1 week
Consumed in the last 24 hrs
1. Cereals and cereal products (e.g sorghum, maize, spaghetti, pasta, caanjera, bread)
99.3% 6.7 days 97%
2.Vit A rich veges & tubers: Pumpkins, carrots, orange ,sweet potatoes
18.2% 3.1 days 6%
3.White tubers and roots: White potatoes, 21.8% 3 days 5%4. Dark green leafy veges: Including white ones +Locally available vit A rich leaves e.g. cassava leaves etc.
95.1% 5.4 days 72.2%
5.Other veges (e.g tomatoes, egg plant, onions 50% 5.0 days 21.7%
6.Vit A rich fruits :Ripe mangoes, papayas + other locally available vitamin A rich fruits
58.6% 4.4 days 21.6%
7.Other fruits 20.5% 3.6 days 7%8.Organ meat (iron rich: Liver, Kidney, heart or other organ meats or blood based foods
8.8% 1.2 days 1.7%
9.Flesh meats & offal; Meat, poultry, (e.g. chicken/poultry, Carmel/ goat meat, beef)
40.2% 1.9 days 10.3%
10.Eggs 16.8% 2 days 2.7%11.Fish:Fresh or dried fish or shell fish 66.8% 2.8 days 27%12.Pulses/Legume,nuts(e.g beans, lentils, green grams, cowpeas) 67.8% 2.9 days 28.3%13.Milk and milk products (goat/ carmel/ fermented milk, milk powder)
38.6% 4.5 days 12.3%
14. Oils/fats* (e.g. cooking fat or oil, butter, ghee margarine)? 71% 5.1 days 38.1%15.Sweets, Sugar, honey, sweetened soda or sugary foods such as chocolates, sweets or candies.
57.5% 5.8 days 44.6%
16.Condiments,Spices and beverages: 46.3% 5.1 days 32.3%
The main source of the main food groups was from purchases- 51.7%, followed by own production combined with purchases (21.8%) and then own production combined with food aid (16.8%).
Table 22: Sources of food
Source of food at the HHLDs Percent
Own production 7.1
Own production & purchases 21.8
own production & food aid 16.8
Own production & gifts from friends/ families 0.4
Own production & trade 0.4
Own production & borrowed 0.4
Own production & gathering wild foods 0.4
Purchases 51.7
Traded or Battered 0.4
Borrowed 0.4
Water and SanitationEnvironmental health issues, such as water and waste disposal, continue to be of concern, given the relationship with health and nutrition. Although water was available in most of the areas with 70.6% depending on tap water as the main water source for household activities, and 75% of tap water for drinking, concern over water treatment is of concern as 79.1% did not treat their water through any means before drinking. Tap water quality should however be controlled and treated by the authorities. The “other” source of water was mainly water pans.
Figure 6: sources of water for household use and drinking

0.3 1 0.3
75.370.9
3.94.6 4.6 4.9 4.67.5
3.94.20.3 0.3
3.63.60.3 0.3
2.62.6
0.0
10.0
20.0
30.0
40.0
50.0
60.0
70.0
80.0
Perc
enta
ge
River Lake Water tap Borehole Unprotectedwell
Protected well Public pan Tanker Dam Laga Other
Water source
Water sources for HHLD and Drinking
Drinking water %
HHLD water %
On average, households use 98 Litres of water per day (at an average cost of 4 Ksh. per 20 L although this ranges from 3 L to 1500 L. Majority of households (23.1%) use 60 L per day. Surveillance by AL ALRMP EWS indicate that distances walked in accessing water by households in April and May reduced from 1.6 km to 1.0 km and they expected the distances to reduce further in the coming months to come owing to the on-going rains. The longest distances in search of water were however recorded in the marginal zone mixed farming zone at 2.8 km and shortest in the ranching at 1.93km
If human faeces are left uncontained, disease may spread by direct contact or by animal contact with the faeces. Hence, the proper disposal of children’s stools is extremely important in preventing the spread of disease. 60% of sampled households had access to a toilet facility. Majority of these (76.7%) used traditional pit latrines, with another 12.3% using ventilated improved pit latrine and 9.2% using flush toilets. For the 40% that lacked a toilet facility, 91.2% use bushes, 1.6% use open field and 7.2% came up with other sources of faeces disposal. 80% of the children faeces were disposed off hygienically, 2 % were not disposed and fasces could be seen scattered in the compound. 17.3% disposed off the wastes through other ways which included burying and using a neighbour’s toilet facility.
It was observed that hand washing practices was mainly common after defecating and before feeding the child, with this combination scoring 52.5%. 22.3% washed their hands after defecating and before eating. Table below indicates the overall percentages without any combinations.
Table 23: Washing hands practices
Occasions when hands are washed PercentAfter defecation, visiting toilet 77.7
Before feeding the child 3.3
Before eating 16.1
Before preparing food 0.7
When I think they are dirty 1.3
When water is available 0.7
Others 0.3
Malaria:
84.8% of 302 of the sampled households had a mosquito net. Majority of these nets (75.9%) were received from the ministry of Public health and Sanitation. Other sources of the nets included buying from a shop, donations from an agency as well as a combination from various sources where there was more than one net.
Table 24: Mosquito net source and usage
Mosquito net source Percent
Shop 9.9
Shop and agency 1.2
Shop and MOPH 7.5
Shop and others 0.4
An agency 1.6
Agency and MOPH 0.8
MOPH 75.9
MOPH and others 0.8
Others2.0
Who sleeps under net Percent
Children < 5 yrs 2.6
Children < 5 yrs and > 5 yrs 60.9Children < 5 yrs and Pregnant mother 1.1
Children < 5 yrs and mother 29.3
Children > 5 yrs 0.4
Children > 5 yrs and mother 0.4
Mother 1.1
No body uses net 4.1
70.2% of those who had bought from the shops had treated their nets, 28.1% had not treated any at all while 1.8% had treated some, not all of what they had bought. 13.2% had treated the nets less than 1 month prior to the survey, 29.4% between 1 and 6 months. 38.2% more than 6 months and 19.1% could not remember when they last treated the nets. It was also observed that children are the ones who mostly slept under the mosquito nets, (60.9%), followed by children and their mothers (29.3%).
General Food Aid and Nutrition interventions being implemented in Kilifi district: Pockets of Kilifi district are food insecure. Food distribution is done by World Vision on behalf of WFP. A total of 71,688 residents in Kilifi are registered and receive food aid under the food for asset project, once every month, getting 50% of the RDA9. The food basket per each registered beneficiary consists of 3.4 kg of cereals, 0.6 kg of pulses, 0.18 kg vegetable oil, 0.075 salt and 0.4 kg CSB per month. Using Nut Val calculator, the food basket above gives 567 Kcal per person per day, supplying only 27% of the minimum WHO requirement of 2100 Kcal per person per day, Also not all beneficiaries get the complete basket, as none sampled had received CSB. The last distribution before this survey took place in June 2010.
Of those sampled, 1.7% was found to be OTP beneficiaries (1 out the 27 malnourished, while 1.9% were in the SFP programs (1 out of 27 malnourished. 96.3% were not enrolled in any program, while 0.2% (1 case) did not know whether or not the child was in any program. Most of those in the targeted interventions scored WHZ of between -1.1 to -1 as seen in the table below.
Table 25: cross tabulation of malnutrition against SFP/ OTP attendance
WHZYes-OTP Yes-SFP No Don’t Know Total
3.1 and > 0 0 3 0 3
2.1 to 3 1 0 11 0 12
9 The Kenya Food security steering group defines the ration size and the number of beneficiaries targeted per district.
1.1 to 2 0 0 55 0 55
0.1 to 1 0 0 149 0 149
-1.1 to 0 4 5 187 0 196
-2.1 to -1 3 4 84 1 92
-3.1 to -2 1 1 19 0 21
-4.1 to -3 0 0 6 0 6
Total 9 10 514 1 534
6.7% of the sampled households had received food aid in the last 3 months, with 27.3% of these receiving the aid less than 1 month prior to the survey, 36.4% received between 1 and 2 months and 18.2% received over 2 months before the survey. 18.2% were not sure how long ago they had received the aid. Most FGDs also indicated that communities were not aware of the nutrition interventions in place.
Demographic features of sampled householdA majority of families (82%) of the 295 families included in the survey are men headed; 13.2% are women-headed households, 4.2% headed by a grand parent and 0.3% was found to be headed by a child.
Livelihood analysis The food survey aimed at categorising the vulnerability and wealth ranking profiles of the Kilifi residents regarding their food situation and livelihoods. Kilifi district is divided in to 3 different livelihoods:
1. Pastoralists: they mainly keep animals and depend a lot on animal products, which are protein in nature. Hence in general, their diets lack carbohydrates. Pastoralists live mainly in Bamba and Mariakani divisions.
2. Mixed pastoralist and agriculturalists: These are the most affected during drought as they have few animals and little land parcels which they can not sell during the hunger peak seasons. These live in Vitengeni division, Ganze, Jaribuni, Bahari and parts of Kaloleni.
3. Mixed livelihood zone: these are mainly found along the coastline and earn their livelihood from a number of activities e.g. trading, plantations. Apart from the IDPs and slum dwellers in town centres like Kiwandani and Kilifi town, the mixed livelihood persons generally do not lack food and are in better health generally.
The main source of livelihood for the Kilifi residents according to the data collected from sampled households is agriculture (34.1%) followed by the informal employment (16.7%) and formal employment (12.6%) respectively. Other forms of income generation for all households sampled can bee seen in the graph below:
Figure 7: Sources of Livelihood amongst sampled households
Main source of livelihood for the HHLD
0.0
5.0
10.0
15.0
20.0
25.0
30.0
35.0
40.0
Agro P
astra
lism
Agro P
astra
lism & pe
tty tra
ding
Agro P
astal
ism & fo
rmal
employ
emen
t
Agro P
astal
ism & in
formal
emplo
yemen
t
Fishing
Fishing
& agric
ulture
Fishing
& infor
mal em
ploye
ment
Petty t
rading
Petty t
rading
& agric
ulture
Petty t
rading
& infor
mal em
ploye
ment
Petty t
rading
& others
Agricu
lture
Agricu
lture
& petty
tradin
g
Agricu
lture
& form
al em
ploym
ent
Agricu
lture
& infor
mal em
ploye
nt
Agricu
lture
& natural
reso
urce
Agricu
lture
& othe
rs
Formal
employm
ent
Formal
& inform
al emplo
ymen
t
Infor
mal em
ploym
ent
Natural
reso
urce d
epen
dants
Others
Perc
enta
ge
The main source of income was noted to be casual labour (33%- with combinations), followed by wage labour (13.6%) and then salary (13.3%) the table below shows the specific percentages per income source and with specific combinations.
Table 26: source of income
Source of Income PercentSale of livestock 0.7Sale of livestock & livestock products 0.7
Sale of livestock & wage labour 1.0Sale of livestock & remittance 2.0Sale of livestock product 0.3Wage labour & others 0.7Sale of livestock & others 0.3Sale of livestock & salary 0.3Sale of own crop 2.0Sale of own crop & others 0.3Sale of own crop & wage labour 0.3Sale of own crop & remittance 0.6Sale of own crop & salary 0.3wage labour 6.8Wage labour & sale of livestock products 0.3
Wage labour & remittance 2.4Wage labour & petty trade 2.4Wage labour & salary 0.3Remittances 3.8
Remittances & others 0.3Remittances & petty trade 1.4Remittances & salary 0.3Petty trade 8.2petty trade & sale of livestock 0.7Petty trade & others 1.0Petty trade & salary 1.7Salary 11.3Salary & others 1.7Salary & charcoal 0.3Casual labour 26.3Casual labour & sale of livestock 0.3Casual labour & others 2.4Casual labour & sale of livestock products 0.3
Casual labour & sale of own crops 0.7Casual labour & wage labour 0.7Casual labour & remittance 1.0Casual labour & petty trade 0.3Casual labour & casual labour 1.0Others 14.0
Coping mechanisms

The most common coping mechanisms and strategies adopted is reduction in number and size of meals (with 42.1% and 35.7% households doing this between 2 to 6 times per week respectively). Begging or involvement in degrading jobs as well as purchasing food on credit are amongst the most common day to day coping strategies as seen in the table below
Table 27: coping mechanisms
Coping strategyRelative Frequency
Never Once per week
Twice per week
3-6 times per week
Everyday
Reduction in the number of meals per day 29.50% 18.90% 23.20% 18.90% 8.30%Skip food consumption for an entire day 60.50% 12.70% 12% 10.40% 3.00%Reduction in size of meals 34.70% 24% 19.70% 16.00% 5.30%Restrict consumption of adults to allow more for children 51% 16.40% 14.70% 13.40% 3.40%Feed working members at the expense of nonworking 84.60% 8.40% 3.70% 2.30% 1%Swapped consumption to less prepared or cheaper foods 51% 19% 12.30% 4.70% 13%Borrow food from a friend or relative 67.60% 12.70% 10.40% 6.70% 1.70%Purchase food on credit 43.90% 25.30% 11.80% 11.80% 6.80%Consume wild foods (normal wild food) 77.40% 9.10% 3.70% 5.40% 4%consume immature crop 79.70% 8.10% 4.70% 2.70% 4.10%Consume decomposed fish 95% 3.30% 0.70% 0.30% 0.70%Consume toxic taboo foods 97% 1% 1.30% 0.70% Food consumption of seed stock 73.50% 11.70% 5.70% 5.00% 3%Send household members to eat elsewhere 88% 6.40% 2.30% 2.70% 0.70%Withdraw children from school 77.80% 7.10% 3.70% 5.40% 4.70%Begging or engaging in degrading jobs 78.10% 4.70% 4.70% 3.30% 8.60%Individual migration out of the area 97% 1.70% 0.70% 0.30% 0.30%Household migration out of the area 96.70% 2.30% 0.70% 0 0.30%Sale of firm implements 93% 6% 0.30% 0.30% 0.30%Sale of milking livestock 93.60% 4.10% 0.70% 0 1.70%Sale of household goods 92.70% 4.60% 2% 0.30% 0.30%Disintegration of families 95.40% 2% 1% 0.30% 1%Abandonment of children or elderly 98% 1% 0.30% 0.30% 0.30%Sell of charcoal and or firewood 82.20% 4.90% 3.80% 3.10% 5.20%Part of family migrating with animals to look for grazing 98.90% 0.40% 0.40% 0.40% 0
Wealth ranking: Focus group discussions with community leaders indicate that wealth status could be determined by type of housing, land owned/ cultivated and livestock size. Generally a poor household would have a grass thatched, mud walled and mud, sand floor; an average household would have a “makuti”/ coconut reed roofing, with mud/ stick walls with a mud or sand floor. A wealth homestead is one that has corrugated iron sheets for roofing; walls made of coral blocks and cemented floors. People who owned or cultivated less than 2 acres were poor, average households had 2- 5 acres while rich households had more than 5 acreage of land. Livestock definition of wealth status could be summarised as follows:
Poor households: 1 -5 poultry, 1- 4 goats, and 1 – 3 cattle Average households: 6- 10 poultry, 5- 9 goats, and 5- 9 cattle Wealthy households: more than 10 poultry, > 10 goats, and > 10 cattle
Most households sampled (53.6%) had makuti roofing, 27.6% were iron roofed while 15.8% were grass thatched. 78.3% lived in mud walled houses, and 17.2% in brick/ stone walled. Most floors (76.9%) were mud, with 19.1% being concrete floor on average the houses were 2 roomed. Based on

these house type statistics, most of the households visited in Kilifi were of averagely wealthy individuals.
On land cultivation, 57.8% cultivated 1- 2 acres in the last season, indicating a poor wealth status, for half of the population. Most people (30%) had an average of 2 bulls, 50 % had 2 oxen, 25% had 1 cow, and 22.5% had 2 cows, while 15% had over 10 cows. Those with 2- 4 goats were 52.2%, 2-3 sheep were 37.5% and 44.4% had 2 donkeys. 11.2% of households had 4 poultry. These data also indicate that households sampled could be defined as mainly poor. See appendix for complete list of wealth possession.
The main types of livestock kept in the districts are cattle, chicken, goats and sheep. Although 4.3% of sampled households did not have any livestock, 29.1% had little animals, 38.7% had small size, 21.5% had medium and 6.5% considered themselves having large herd of animals. Livestock size was affected by several factors with 32.1% of farmers loosing their livestock due to disease. Livestock size was also reduced due to deaths related to drought and raid (7.2%), while 14.3% were lost due to raids. 25% of the households however confirmed increased livestock size due to animal reproduction, while 17.9% bought more animals.

ConclusionsThe assignment indicates a low proportion of moderately malnourished children as the GAM and MAM rates are 5.6% and 3.8%. These prevalence rates of acute malnutrition are comparable to the provincial average GAM of 6.0 % (KDHS 2003). Major concerns are the relatively high proportion of severely malnourished children (1.8%) and the presence of oedema (0.7%) as well as the high chronic stunting rate of 43.6%. Prevalence rates per gender, age groups or division are not statistically significant although moderate acute malnutrition was highest in the younger children aged between 6 to 17 months, and 54- 59 months. SAM was however highest amongst the 42- 53 months.
Mortality rates of 1.60 and 0.64 are within acceptable average benchmark for children under five and the general population respectively. Although many live in considerable good health and nutrition status seem to remain stable. However, high poverty levels, minimal, unreliable income sources and leads to reduction in access to food could lead to inadequate intake of food over a long time, hence the high chronic malnutrition levels.
Underlying causes of malnutrition like Infant feeding and child care practices should be looked at further: there is indication that nutritional status among the younger children is lower than that of the older ones, probably due to poor breastfeeding and poor weaning practices. The number of mothers practicing exclusive breastfeeding up to 6 months is low (22.2%).
Preventive measures like Immunisation of children, Vitamin A supplementation and de-worming are the most cost effective preventive measures for child survival and maintenance of nutritional status. Although measles immunization coverage of 89.2% is satisfactory10, (69.7% with card and 19.5% based on caretaker recall), Vitamin A supplementation (53.8% having received it once and 31.7% having received it twice in the 6 months prior to the survey 10.9%) was considerably low. Vitamin A supplementation in the district is higher than the national A supplementation coverage for children under five, 30% of children age 6-59 months and 38.3% of coast province as per the 2008- 09 KDHS.
Access and/or use of safe water at the household level remains a great concern as one of the underlying factors associated in prevention of disease and malnutrition. The insufficiency of safe, treated water could be linked to poor hygiene practices reported (majority of people only wash hands after toileting) and closely associated to diarrhoea diseases which were found to be high – 7.8% of all children, and also usually prevalent among malnourished children as well as being one of the main causes of deaths in the population (12.5% died of diarrhoeal diseases). The cause of these could be related lack of treatment of drinking water, hence limited accessibility to safe water and/ or lack of adequate preventive health education services.
In conclusion, while the local Kilifi residents may not be suffering from high alarming rates of acute malnutrition or unusually high mortality rates; there is considerable concerns over issues that affect their day to day nutrition that lead to high levels of severe acute malnutrition as well as long tem chronic malnutrition. Current nutrition situation in this population is indicative of underlying factors that could aggravate both chronic and acute malnutrition. It is therefore, important to address the problem with more long-term strategic food and public health programs that tackle the underlying problems of malnutrition in addition to managing the existing acute malnutrition through the existing health infrastructure and sensitizing the community of such interventions.
10 The national measles immunisation coverage for 1 year old is 73.5% according to the KDHS 2008- 09 survey
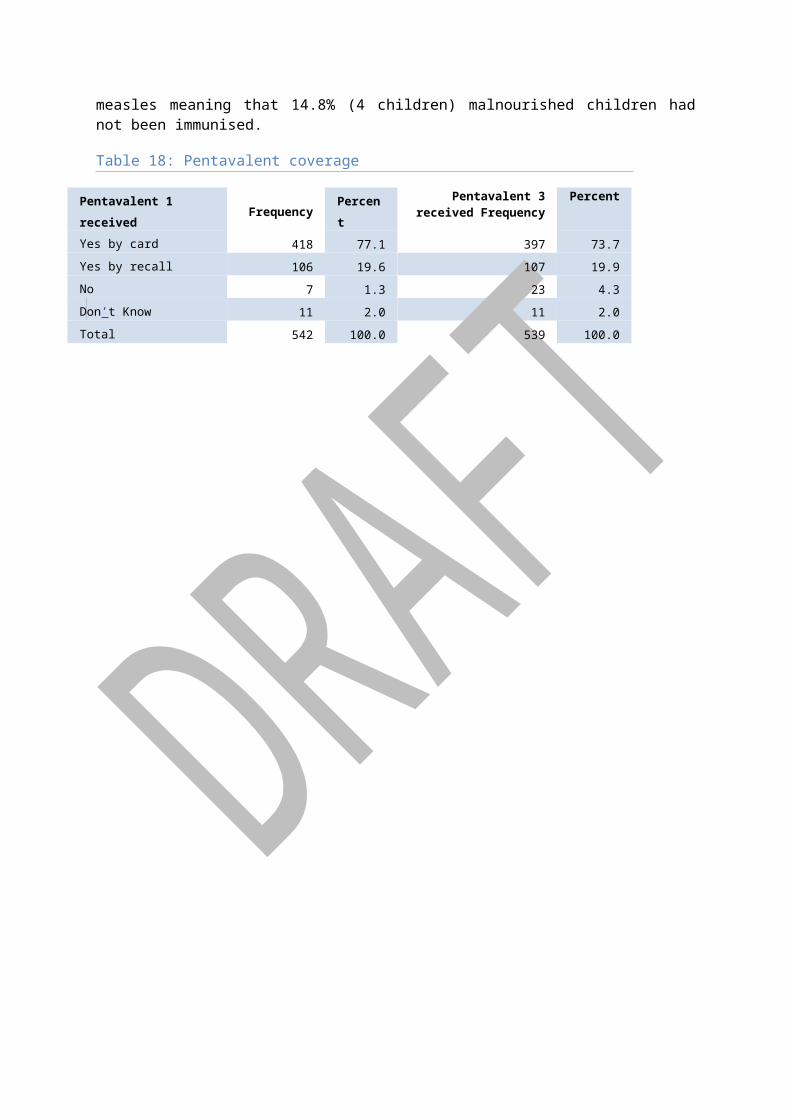
RecommendationsIn light of the findings discussed, the recommendations are as follows:
Community Level Prevention, Detection and Referral of SAM1. All health and nutrition stakeholders in the district should emphasize on community health
education on infant feeding practices, encouraging exclusive breastfeeding until 6 months of age as per WHO guidelines and best practices.
2. MOH and UNICEF should continue supporting and collaborating with other stakeholders in nutrition screening, at community and healthcare centre levels, with emphasis on early detection, referral and treatment of identified SAM children in the community.
3. The percentage of people treating their water is low, therefore there is a need for education and promotion of cheaper ways of treating water other than boiling.
4. Continued support and promotion of hygiene and sanitation interventions such as distribution of water purifiers, toilet construction and usage.
5. Support the implementation of awareness campaigns and community nutrition education program on IYCF, food preparation, and dietary diversity.
6. Strengthen mother to mother support groups to promote Baby Friendly Community initiative(BFCI)
Primary Health Care, Dispensary and Hospital Levels1. Continued support to MOH to scale up IMAM/IYCF/ENA to all the GOK facilities. 2. MOH should focus on capacity building of dispensary staff to accurately prevent, detect and
treat malnutrition at community or primary healthcare level. In addition, work is needed to strengthen and standardize the admission and discharge criteria at the healthcare facilities.
3. Strengthening and Harmonization of referral and cross-referral procedures between levels of the health care system will allow prompt transfer of patients to hospitals as well as follow up of discharged children by the primary health care centers or by community health workers or volunteers to ensure total recovery of these children.
4. Scale up Community Growth Monitoring to all sites with trained Community Health Workers
5. Continued support on health outreach programs to maintain access especially for immunization services and improved de-worming and Vitamin A supplementation, with appropriate education of communities on importance of these services.
6. Encourage the continued use of mosquito nets and support distribution in areas and or population not yet targeted.
7. Enhanced joint program monitoring support, supervision and mentorship activities for the technical staff by MoH, UNICEF and NGOs implementing related health and nutrition programs
8. Support integrated health outreaches and focus more on preventive and promoting health services
9. Scale up Positive Deviance Hearth mechanism approach of combating community malnutrition to all divisions of the district
10. Scale up the Community Led Total Sanitation Program that is already in the district to all the villages to improve on proper disposal of human waste
Food aid distribution and Livelihood interventions1. Continue General food distribution (GFD)/ food for asset to poor and vulnerable households.2. Initiate and support income generating activities for the poor households especially among
mothers with children under five years old.

3. Liaise with key stake holders to promote use of drought resistant crops like sorghum, millet, cassava etc.
4. Support interventions relating to livestock production which is a major source of the community livelihood.
General
1. Sharing nutrition data and information with all stakeholders during the District Health stakeholders forum is critical for inputs from partners and for ease of resource mobilization.
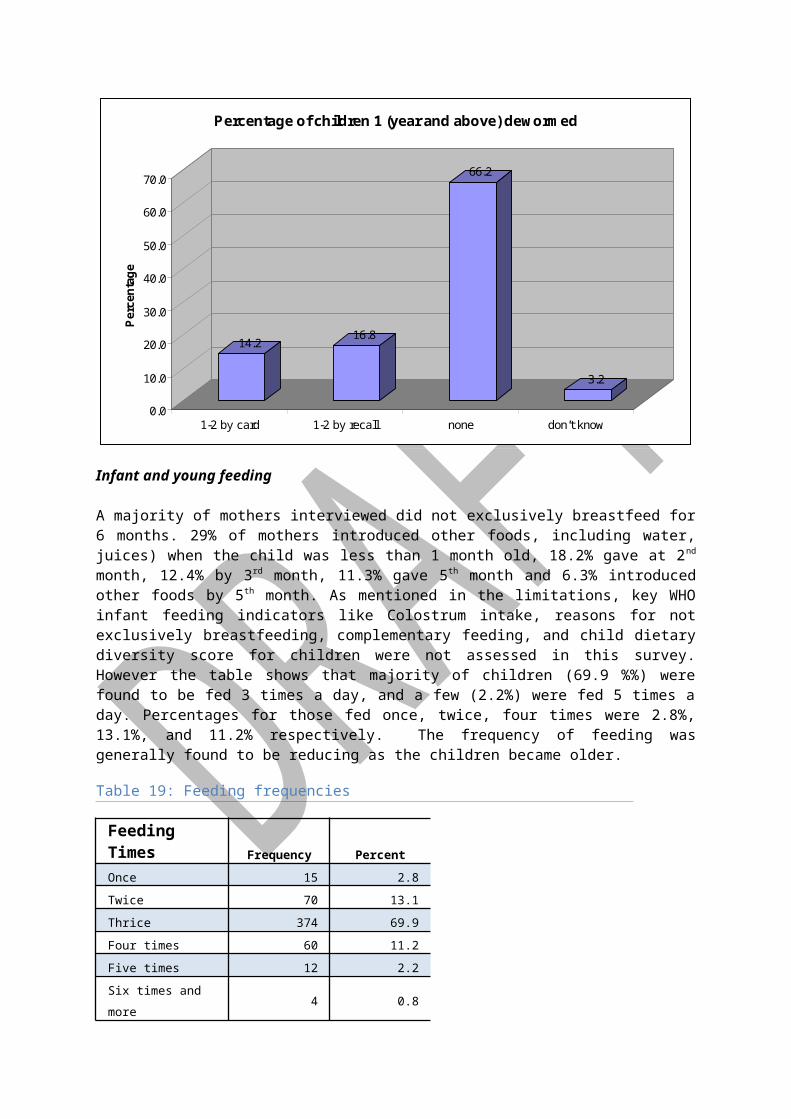
Annexes
ANNEX 1: Participants of the Survey
Nutrition Survey Supervision and support Team:
1. Esther Ogonda McOyoo Nutritionist, E’ Hadassah Consultants2. Sophie Yaa Program Officers (FHI)3. Brenda Opanga Monitoring Officer (FHI)4. Ronald Mbunya DNO- District Nutrition Officer (MoH)5. Geraldine Kaari Nutritionist (UNOPS)6. Rodgers Kazungu DSO- District Statistics Officer7. James Otieno Orondo Data Entry Clerk & Supervisor E, Hadassah Consultants8. Leonida Chepchirchir Data Entry Clerk
Research Assistants
NamesTeam 1
1 Angela Wali Mwambi2 Julius Saroh Ngowa3 Beatrice Kadzo Katana
Team 21 Faith S. Mangisi2 Sharlet Maua3 Susan Jepkoech Kiprono
Team 31 Helen Kimanga2 Nancy Mbeyu Mwangome3 Saida Juma Jefwa
Team 41 Esther Mkarye Gwabi2 Billy C. Chigube3 Eveyline Wanjala
Team 51 Sarah Ngetsa Mzerera2 Dr. Cecilia Wamalwa3 Fatime Cheusi Mohammed

Annex 2: Assignment of Cluster numbers
No Sub location Villages selected Cluster no.
1 KONJORA Mafumbini university 1
2 SOKONI Mtaani village 2
3 MNARANI Kilifi plantation, skuli village 3, 4
4 MTONDIA/MAJAONI Matsanjeni village 5
5 KIBARANI Mikingirini village 6
6 ZOWERANI Zowerani village 7
7 CHUMANI Kararacha 8
8 MKONGANI Matsanjeni 9
9 KIZINGO Donicha village 10
10 PINGILIKANI Ng’ombeni village 11
11 CHASIMBA Chigojoni village 12
12 MWAKAMBI Swere mwenzang’ombe 13
13 ZIANI Katikirieni village 14
14 KIJIPWA Kikambala B 15
15 SHIMO LA TEWA Mzambaraini, Mwanjuni, Becharo yaa 16, 17, 18
16 KANAMAI Mwendo wa panya 19
17 GONGONI/VIPINGO Duka village 20
18 JUNJU Kindogo village 21
19 KURUWITU Shariani B 22
20 KIRIBA/WANGWANI Kiriba/ Wangani 23
21 MKWAJUNI/MKOMANI
Mbogolo/ Boyani 24
22 MAGOGONI Ezamoyo 25
23 DUNGICHA/MUHONI Muhoni B 26
24 PALAKUMI/MIGUMONI
Boyani 27
25 MADAMANI Madamani 28
26 DULUKIZA Kashogeni/ Majengo 29
27 DZIKUNZE Usafi/ mji wa usafi 30
28 RARE Sosoni/ mkaladzaini/ Kijembeche 31
29 DIDA Kafitsoni A/ B/ Ngamani 32
30 KIDEMU Mnyezini B 33
31 PAZIANI Bada villa 34
32 MTSARA WA TSATSU Muyuni 35
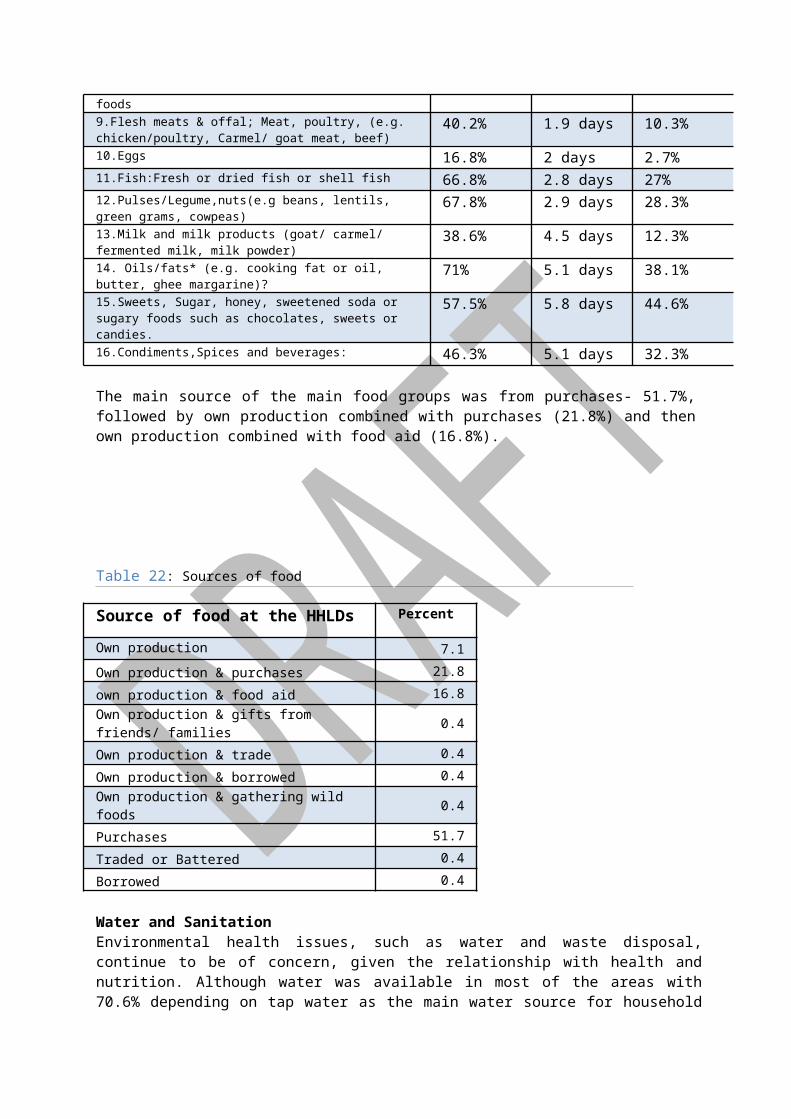
ANNEX 3: UNICEF Conceptual Framework on Causes of Malnutrition
Malnutrition concerns:1.8% prevalence of SAM20.5% prevalence of underweight43.6% prevalence of stunting
IMMEDIATE CAUSESInsufficient food intake Only 8.8% of the population frequently take Iron rich foods- organ meat.Morbidity rates: …% of children suffered like diarrhoea 2 weeks prior to survey.
UNDERLYING CAUSESHousehold food insecurity and socio-economic factors:
Random and unreliable sources of income: 33% depend on casual labourLarge size households with 8 members on averageLow income Increase of food prices at the local markets
Public Health factors: Low (22.2%) exclusive breastfeeding % until 6 monthsLow proportion of people treating drinking water- 79.1% do not treat.Low de-worming coverage- 29%.Low vitamin A coverage- only 31.7% received twice, although 53.8% received once.Poor health seeking behaviour attendance
Inadequate care for women and children: Poor breastfeeding practices: 18% exclusive up to 6 months,
BASIC CAUSES
Chronic crisis and uncertain livelihood conditions in the near futureEffects of the continuous drought on food prices and household food security

Annex 4: Wealth rankingWealth indicator PercentageMakuti house typeGrass thatchedPlastic sheet roofIron roofSkin roofOthers roofingMud wallSkin wallPlastic sheet wallBrick stone wallOthers wall typesMud floorPlastic sheet floorConcrete floorOther types offloorwater tankDrip bucketParafin stovePressure lampBicycleHand grain millerOx ploughDonkey cartMotorizd vehicleBedsFood granaryRadio
Tape player/ recorder 7.60%TV 5.60%TV and Videoplayer 7.90%Mobile phone 57.90%Shop kiosk 7.20%Shallow well 1.30%Boats 1.30%Fishing nets 4.60%Cooking pots 84.20%No of matresses Metalic boxes 51.70%other key wealth Items indicators 8.90%Average No of rooms 2No of co-wives 1= 44.4%; 2 =32.7%Cultivated acres 1 - 2 acres = 57.8%Average Livestock size SmallBulls 2 = 30%Cows 2 =22.5%Oxen 2 = 50%Camels Goats 2 - 4 = 52.2%Sheep 2- 3 =37.5%Donkeys 2= 25%, 0= 22.2%Poultry 10= 11.2%; 4= 11.2%
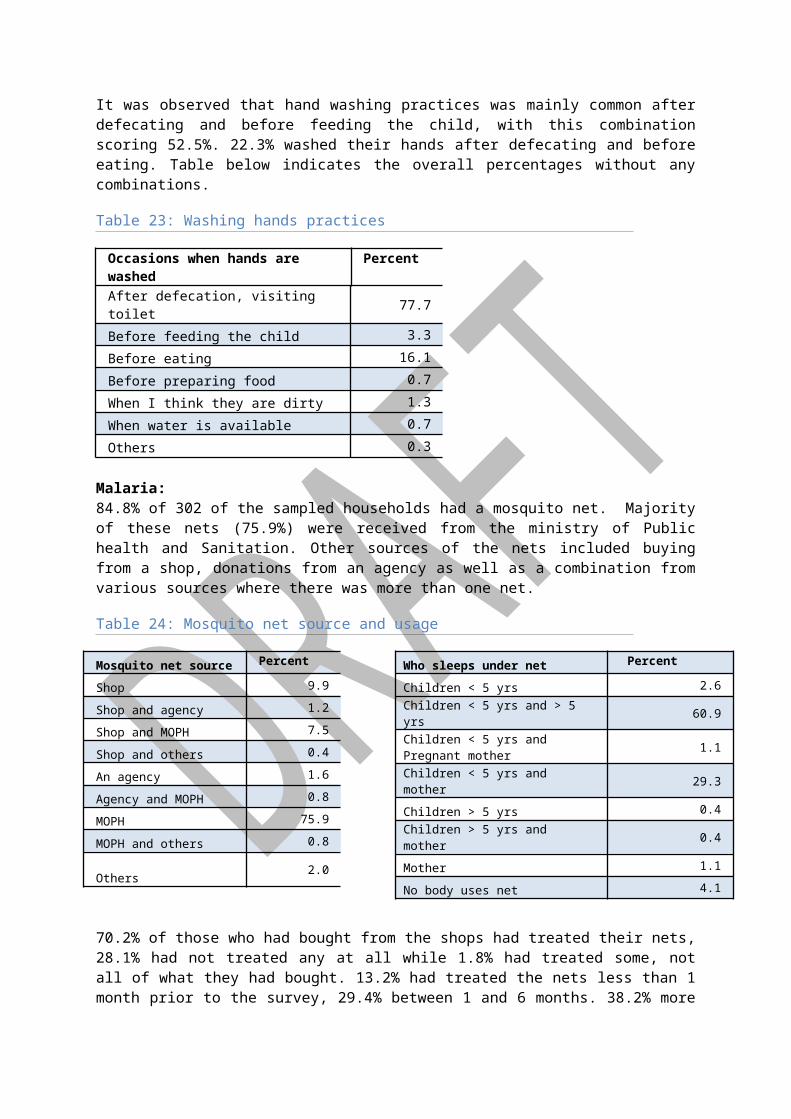
Annex 5: Documents Reviewed
1. Guidelines for Nutrition Assessments in Kenya- 1st edition 20082. Health and Nutrition survey report- Word Vision 20093. Kenya Demographic health and survey- 2008- 09 Kenya National Bureau of Statistics et al 4. Kilifi/ Kaloleni/ Ganze districts EWS drought monitoring bulletin: January to May 2010. Office
of the prime minister: Ministry of State for the development of Northern Kenya and other arid lands resource management project ii
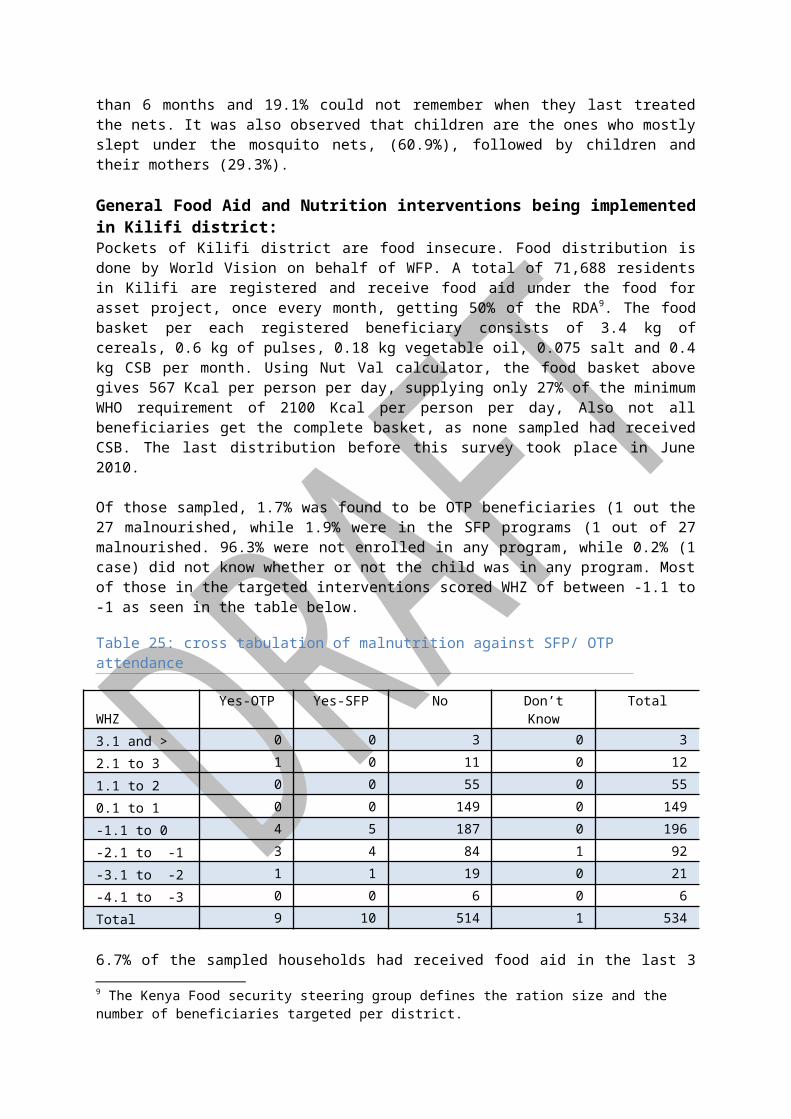
ANNEX 6: SURVEY TRAINING Dates: 15th to 18th June 2010
Time/ Day
Day 1
Day 2 Day 3 Day 4 Day 5
8.00- 10.00 AM
Introductions Participants expectationsObjectives of the training Setting of ground rules
RecapLocal calendar Evaluation toolsAnthropometry
RecapCausal analysis -UNICEF conceptual framework
Feedback from pilot survey
Any further clarifications
10.00- 10.15 AM
Tea Break Tea Break Tea Break
10.15 – 1.00 PM
Introduction to survey and its components-
Other questionnaire questions
Research ethicsConsent form
Logistic & administration arrangements
Wealth ranking theory
1.00- 2.00 PM
Lunch break Lunch break Lunch break
2.00- 3.45 PM
Anthropometric measurements
Weight.HeightMUACOedema
Age determination
3. Mortality data Practical testing of questionnaire and skills- Pilot survey
Meeting with team leaders/ supervisors
Wealth ranking role play
3.45- 4.00
Break Break Break
4.00 – 5.00 PM
PracticalStandardization exercise
Methodology Practical testing of questionnaire and skills- Pilot survey
AOB
2
ANNEX 7: Survey Work Plan
Date Main activity Any comment
Preparation of survey methodology, questionnairesSensitization of government officials
Administration issues and meeting with UNICEF 1
Travel Nairobi- Mombasa and document review 1
Introductions to MoH and FHI Kilifi/ Mombasa 1
Training data collectorsPilot exercise
5
Preparing for data entry trainingEditing questionnaire Finalising survey finer details/logistics
2
Data collection 9
Data entry training 1
Survey supervision and support 3
Work with data entry 3
Travel to Nairobi 1
Read some back ground documents 2
Data entry 11
Data cleaning 2
Initial basic analysis 4
12th July 2010
Presentation of minimum indicators in Nairobi 1
Detailed Data analysis 7
Read Focus group Discussion Reports 1
Report writing 7
31st July ROUGH Draft report
Draft report discussion
Report editing
Final report writing/editing, incorporating all comments
7th August Submit final Report.
3

ANNEX 8: Local Calendar of Events
MONTH Seasons2005 2006 2007 2008 2009 2010
JANUARY mwezi wa kwanza
WinterKazikazi
XxxxxxxxxxxxxxxxxxXxxxxxxxxxxxxxxxxxxxxxxxxxxxxxxxxxxxxxxxxxxxxxxxxxxxxx
53 41 Rift valley fever
29 POST ELECTION VIOLENCE BEGIN
17 5 Eclipse of the sun xxxxxxxxxxxxxxxxx
FEBRUARYMwezi wa hiri
WinterKazikazi
xxxxxxxxxxxxxxxxxxxxxxxxxxxxxxxxxxxxxxxxxxxxxxxxxxxxxxxxxxxxxxxxxxxxxxxx
52 40 28KOFFI ANNAN PEACE ACCORD Elder Kahindi Mzerara dies
16 4 xxxxxxxxxxxxxxxxxxxxxxxxxxxxxxxxxx
MARCHMwezi wa hahu
WinterKazikazi
xxxxxxxxxxxxxxxxxxxxxxxxxxxxxxxxxxxxxxxxxxxxxxxxxxxxxxxxxxxxxxxxxxxx
51 339339 27 15 3 xxxxxxxxxxxxxxxxxxxxxxxxxxxxxxxxxx
APRILMwezi wnne
Planting/ Easter seasn MVUA YA MWAKA
xxxxxxxxxxxxxxxxxxxxxxxxxxxxxxxxxxxxxxxxxxxxxxxxxxxxxxxxxxxxxxxxxxxx
50 38 26 14 2 VOTING CARDs REGISTRATION Heavy rains in Sabaki
MAYMwezi wa Tsano
SpringMVUA YA MWAKA
xxxxxxxxxxxxxxxxxxxxxxxxxxxxxxxxxxxxxxxxxxxxxxxxxxxxxxxxxxxxxxxxxxxx
49 Floods in Kilifi districtMeasles vaccination campaigns
37 25 13 1 Karabu diesCholera outbreak Matsongoni
JUNEMwezi wa Handahu
SpringMVUA YA MWAKA ends
xxxxxxxxxxxxxxxxxxxxxxxxxxxxxxxxxxxxxxxxxxxxxxxxxxxxxxxxxxxxxxxxxxx
48 36 24 12
JULY Fungahe
SummerReho
59 47 35 23 11
AUGUSTNane
SummerHarvesting season
58 46 34 22Ramadhan
10 National census
SEPTEMBERWa chenda
Summer 57 45 33 21 9 Ramadhan
OCTOBERWa kumi
FallVuri
56Eclipse of the sun
44 32 20Vaccine inadequacies
8
NOVEMBERKumi na mwenga
WinterShort rainsYuri
55 Referundum: Bananas & Oranges
43MVUA YA VULI
31Ramadhan
19Obama wins USA elections
7 Swine flu outbreak
DECEMBERKumi na mbiri
WinterSiku kuuKuvuna
54 42BEBA- (witch )
30 National general elections- Mp Joe Hamisi
18 6 Bin Hare- local singer dies
4

looses seat
ANNEX 9: Local calendar of events
MONTH Seasons
2005 2006 2007 2008 2009 2010
JANUARY mwezi wa kwanza
WinterKazikazi
XxxxxxxxxxxxxxxxxxXxxxxxxxxxxxxxxxxxxxxxxxxxxxxxxxxxxxxxxxxxxxxxxxxxxxxx
53 41 Rift valley fever
29 POST ELECTION VIOLENCE BEGIN
17 5 Eclipse of the sun xxxxxxxxxxxxxxxxx
FEBRUARYMwezi wa hiri
WinterKazikazi
xxxxxxxxxxxxxxxxxxxxxxxxxxxxxxxxxxxxxxxxxxxxxxxxxxxxxxxxxxxxxxxxxxxxxxxx
52 40 28KOFFI ANNAN PEACE ACCORD Elder Kahindi Mzerara dies
16 4 xxxxxxxxxxxxxxxxxxxxxxxxxxxxxxxxxx
MARCHMwezi wa hahu
WinterKazikazi
xxxxxxxxxxxxxxxxxxxxxxxxxxxxxxxxxxxxxxxxxxxxxxxxxxxxxxxxxxxxxxxxxxxx
51 339339 27 15 3 xxxxxxxxxxxxxxxxxxxxxxxxxxxxxxxxxx
APRILMwezi wnne
Planting/ Easter seasn MVUA YA MWAKA
xxxxxxxxxxxxxxxxxxxxxxxxxxxxxxxxxxxxxxxxxxxxxxxxxxxxxxxxxxxxxxxxxxxx
50 38 26 14 2 VOTING CARDs REGISTRATION Heavy rains in Sabaki
MAYMwezi wa Tsano
SpringMVUA YA MWAKA
xxxxxxxxxxxxxxxxxxxxxxxxxxxxxxxxxxxxxxxxxxxxxxxxxxxxxxxxxxxxxxxxxxxx
49 Floods in Kilifi districtMeasles vaccination campaigns
37 25 13 1 Karabu diesCholera outbreak Matsongoni
JUNEMwezi wa Handahu
SpringMVUA YA MWAKA ends
xxxxxxxxxxxxxxxxxxxxxxxxxxxxxxxxxxxxxxxxxxxxxxxxxxxxxxxxxxxxxxxxxxx
48 36 24 12
JULY Fungahe
SummerReho
59 47 35 23 11
AUGUSTNane
SummerHarvesting season
58 46 34 22Ramadhan
10 National census
SEPTEMBERWa chenda
Summer 57 45 33 21 9 Ramadhan
OCTOBERWa kumi
FallVuri
56Eclipse of the sun
44 32 20Vaccine inadequacies
8
NOVEMBERKumi na mwenga
WinterShort rains
55 Referundum: Bananas & Oranges
43MVUA YA VULI
31Ramadhan ????
19Obama wins USA
7 Swine flu outbreak
5
Yuri electionsDECEMBERKumi na mbiri
WinterSiku kuuKuvuna
54 42BEBA- (witch )
30 National general elections- Mp Joe Hamisi looses seat
18 6 Bin Hare- local singer dies
6

Annex 9: Nutrition and Food Security Survey Questionnaire
7
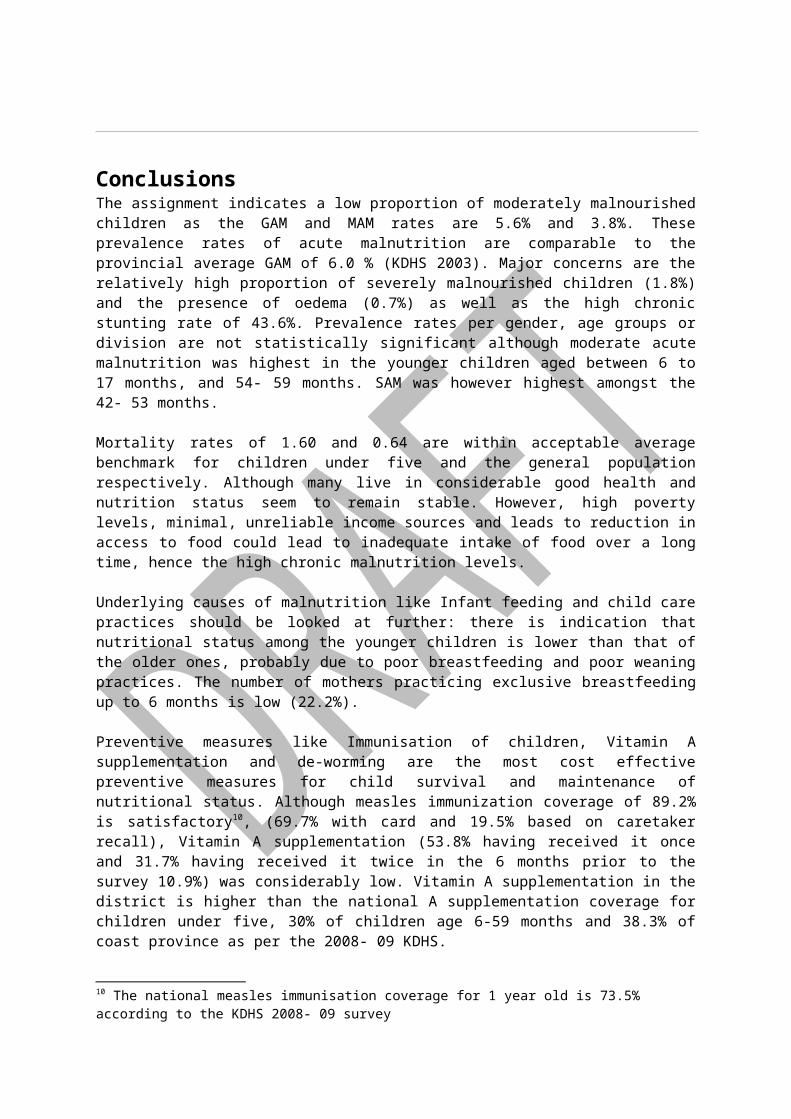
GOK and FHI / UNICEFNutrition and Food Security Survey Questionnaire
English Version
Name of District Name of Division
Name of Village Cluster Number
House hold Number
Date of Interview (dd/mm/yy)
Name of interviewer
Name of Team Leader
SECTION 1: HOUSE HOLD AND MORTALITY DATA 1.0 How many people live in this household together and share meals? ________ (House hold size)

1.1 Age group
a.
1.2 Person ID or NAME
1.3 Approx.*Age Enter months for children <5 yrs and years for over 5’s
1.4 Child’s age verified by
1= Health Card2=Birth Certificate /notification3= Baptism Card4= Recall
1.5 Sex1=Male2=Female
1.6 Main Occupation (enter code)
1=Agricultural Labor2=Livestock herding3=Own farm labour4=Employed (salaried)5= Waged Labour (Casual)6=Petty trade7=Unemployed8=Student9=Merchant trader10=Mining11=Housewife12=Domestic help13=Hunting, gathering14=Firewood/Charcoal15=Brewing16=Handicraft17=Fishing18=Others(Specify)
1.7 If over 5 and under 18 is child attending school
1=YES2=NO
1.8 Reason for not attending school(Enter code from list)1=Not enrolled2=Currently sick3=Religious/Cultural festivities4=Sickness/Poor health of Child5=Weather (rain, floods, storms6=Family Labour responsibilities7=Working outside home8=Teacher absenteeism9-Too poor to buy school items10= Other social responsibilities11=Unruly child/Lack of parental control12=House hold doesn’t see value of schooling13=No food in the schools14=No one to take children to school15=Migrated/moved from school area16= Insecurity17=No schools nearby18=Married19=Others(Specify)
1.9 Arrived since voter registration i.e within the last 8 months (Reason –enter code from list)
1-a) Civil insecurityb) Civil insecurity due to post election violence
2-Food insecurity3-Employment4-Divorce5-Visiting6-Others-(specify)
Years Months
Under 5 years
1234567
5 to 18years
12345
2
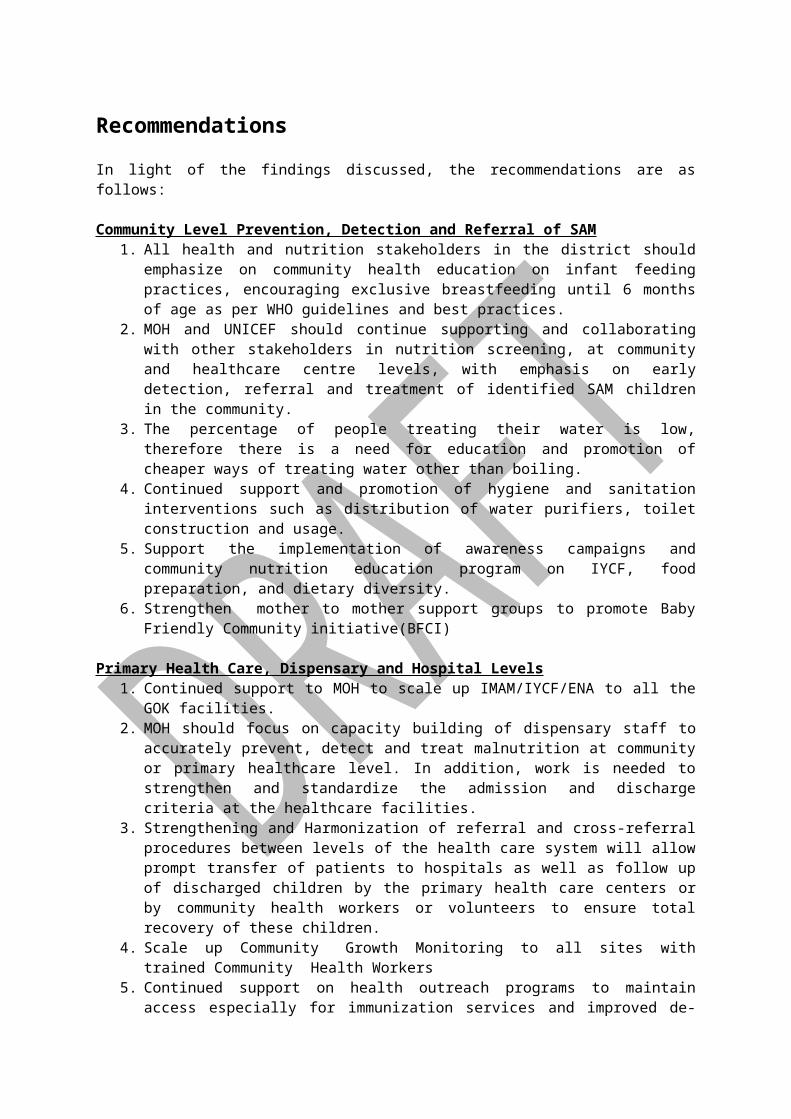
1.1 Age group
a.
1.2 Person ID or NAME
1.3 Approx.*Age Enter months for children <5 yrs and years for over 5’s
1.4 Child’s age verified by
1= Health Card2=Birth Certificate /notification3= Baptism Card4= Recall
1.5 Sex1=Male2=Female
1.6 Main Occupation (enter code)
1=Agricultural Labor2=Livestock herding3=Own farm labour4=Employed (salaried)5= Waged Labour (Casual)6=Petty trade7=Unemployed8=Student9=Merchant trader10=Mining11=Housewife12=Domestic help13=Hunting, gathering14=Firewood/Charcoal15=Brewing16=Handicraft17=Fishing18=Others(Specify)
1.7 If over 5 and under 18 is child attending school
1=YES2=NO
1.8 Reason for not attending school(Enter code from list)1=Not enrolled2=Currently sick3=Religious/Cultural festivities4=Sickness/Poor health of Child5=Weather (rain, floods, storms6=Family Labour responsibilities7=Working outside home8=Teacher absenteeism9-Too poor to buy school items10= Other social responsibilities11=Unruly child/Lack of parental control12=House hold doesn’t see value of schooling13=No food in the schools14=No one to take children to school15=Migrated/moved from school area16= Insecurity17=No schools nearby
1.9 Arrived since voter registration i.e within the last 8 months (Reason –enter code from list)
1-a) Civil insecurityb) Civil insecurity due to post election violence
2-Food insecurity3-Employment4-Divorce5-Visiting6-Others-(specify)
Years Months
6789
House hold head
10 1112
Over 18years
12345678
3
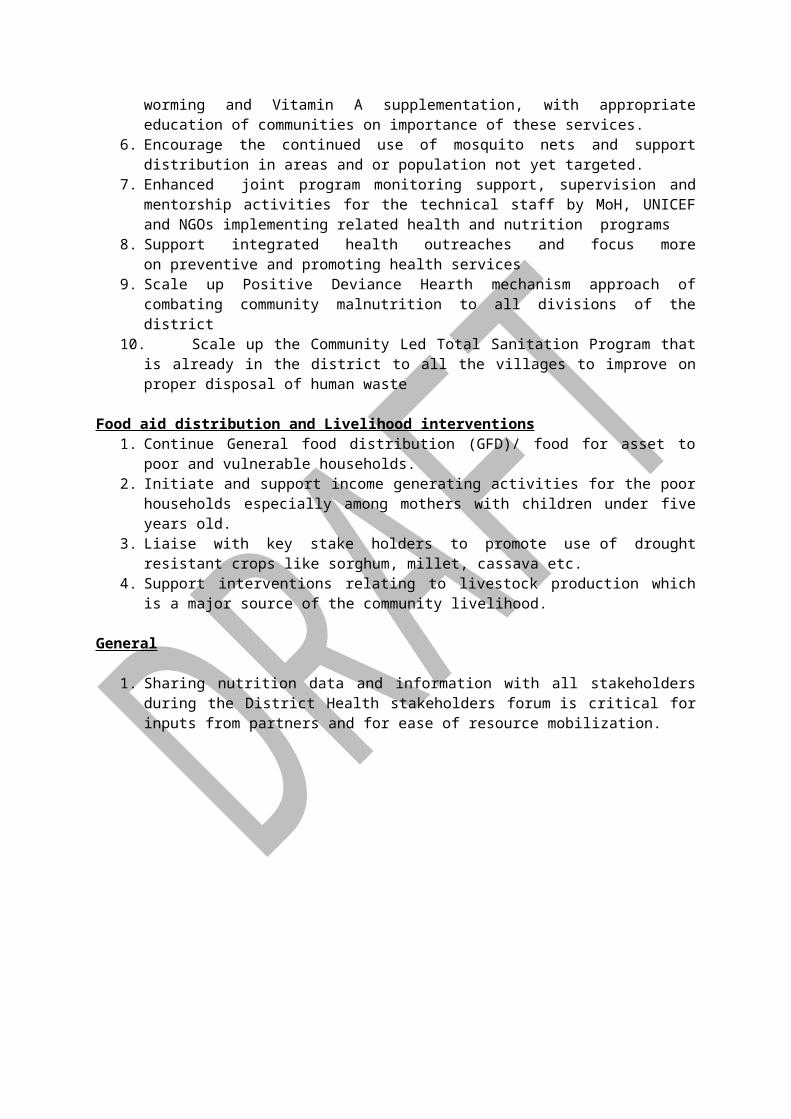
1.1 Age group
a.
1.2 Person ID or NAME
1.3 Approx.*Age Enter months for children <5 yrs and years for over 5’s
1.4 Child’s age verified by
1= Health Card2=Birth Certificate /notification3= Baptism Card4= Recall
1.5 Sex1=Male2=Female
1.6 Main Occupation (enter code)
1=Agricultural Labor2=Livestock herding3=Own farm labour4=Employed (salaried)5= Waged Labour (Casual)6=Petty trade7=Unemployed8=Student9=Merchant trader10=Mining11=Housewife12=Domestic help13=Hunting, gathering14=Firewood/Charcoal15=Brewing16=Handicraft17=Fishing18=Others(Specify)
1.7 If over 5 and under 18 is child attending school
1=YES2=NO
1.8 Reason for not attending school(Enter code from list)1=Not enrolled2=Currently sick3=Religious/Cultural festivities4=Sickness/Poor health of Child5=Weather (rain, floods, storms6=Family Labour responsibilities7=Working outside home8=Teacher absenteeism9-Too poor to buy school items10= Other social responsibilities11=Unruly child/Lack of parental control12=House hold doesn’t see value of schooling13=No food in the schools14=No one to take children to school15=Migrated/moved from school area16= Insecurity17=No schools nearby
1.9 Arrived since voter registration i.e within the last 8 months (Reason –enter code from list)
1-a) Civil insecurityb) Civil insecurity due to post election violence
2-Food insecurity3-Employment4-Divorce5-Visiting6-Others-(specify)
Years Months
91.10 Do you have any member of the house hold who has died within the last three months (Probe using “beginning of voter registration ” as a calendar event)? 1. Yes 2. No1.11 If a member of the household died, please provide me with the following details?
SECTION 2: CHILDREN AGED 6 - 59 MONTHS DATA2.1Child ID
2.2MUACTo the nearest 0.1 cm
2.3Oedema in both feet? (U 5 only)
1=Yes2=No
2.4Height to nearest 0.1 cm ( U 5 only)
2.5WeightToNearest100gm(U 5 only)
2.6Is the child currently enrolled in a feeding programme?
(Confirmed by a
2.7Has the child received measles immunization?
(enter code)
2.8Has child received pentavalent 1/OPV1?
Yes= (by card)2=Yes (by recall)
2.9Has Child received pentavalent3/OPV3?
1=Yes (by card)2=Yes (by
2.10How many times did the child receive Vitamin A the last one
2.11At what age in WEEKS did the child start to receive food other
2.12How many times is the child usually fed in a day?
2.13How many times was the child De-wormed
2.14Sickness in the last two weeks (Enter code)(More than one response possible)
2.15When the child was sick did you seek assistance? (Enter code)
ID/Name Years Months Sex Arrived < 8MonthsReason
Cause of Death(Use code on side)
1234
4
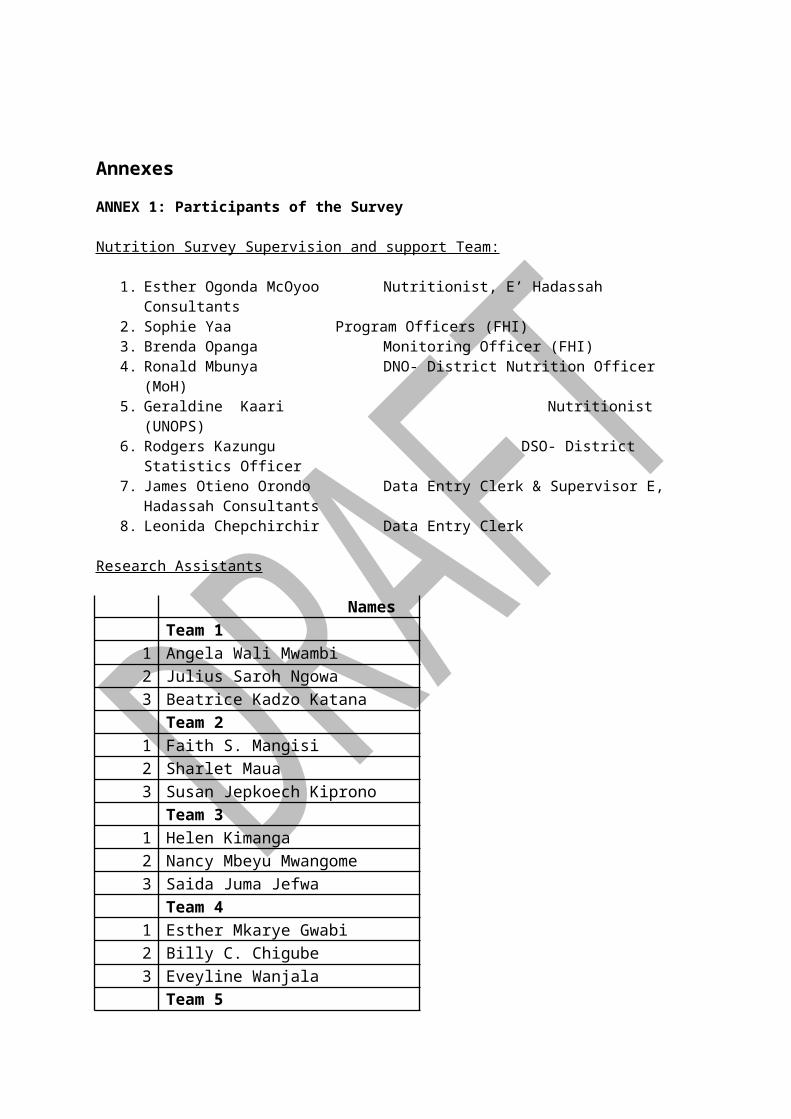
card if the child is currently enrolled)
1= Yes (OTP)2= Yes (SFP)3= No4= Don’t K
(U5 only)
1= Yes (by Card)2= Yes(by recall)3= No4= Don’t K
3=No4=Don’t know
recall)3=No4=Don’t know
year? (U 5 only)
(show the mother the capsule so that she recall or understands)
than breast milk? (U5 only)
(Food includes water, juice, syrup, porridge, fruits etc)
1-once2-twice3-3 times4- 4 times or more
within the last 6 months
(Enter code)
1=1-2 times (by card)
2=1-2 times (by recall)
3=None
4=Don’t know
1=Not applicable ,not sick2=Diarrhea3=Vomiting4=Fever with chills like malaria 5=Fever,cough,difficult in breathing,6=Intestinal parasite7=Measles8=Eye infections9=Skin infections10=Accident11=Malnutrition12=Stomachache13=Tooth ache14=Other (Specify) _______________
(U 5 Only)
If YES Where (More than one response possible)
1=Traditional healer
2=Community health worker3=Private clinic/Pharmacy4=Shop/Kiosk5=Public clinic6=Mobile Clinic7=Relative or friend8=No assistance sought9=Local herbs10-NGO/FBO
12345
5

SECTION 3: HOUSEHOLD WATER CONSUMPTION3.1 What is your main current water source for household?
1=River2=Lake3=Water tap4=Borehole5=Unprotected well6=Protected well7=Public Pan8=Tanker9=Dam10=Laga11=Other
3.2 How long does it take to go to the main source of water and come back in (minutes)
3.3 On average how many LITRES of water does the household use per day?
3.4 How much do you pay for a 20lt jerican (enter zero if water is free)
3.5 What is your main source of drinking water?1=River2=Lake3=Water tap4=Borehole5=Unprotected well6=Protected well7=Public Pan8=Tanker9=Dam10=Laga11=Other………………
3.6 Do you do anything to the water before drinking it?
(More than one response possible)
1=Boiling2=Use traditional herbs3=Use chemicals4=Filters/Sieves5=Decant6=Nothing7=Others (Specify)…………………
SECTION 4: SANITATION TOILET FACILITY 4.1 Does your house hold have access to a toilet facility?
1=YES2=NO
4.2 If YES, What type of toilet facility?
1=Bucket2=Traditional Pit latrines3=Ventilated improved pit latrine4=Flush toilet5=Other (specify)…………………………………
4.3 If NO, where do you go/use? (probe further)
1=Bush2=Open field3=Near the river4=Behind the house5=Other specify
4.4 How is Children’s fasces disposed (OBSERVE)
1=Disposed off immediately and hygienically2=Not disposed (scattered in the compound)3=Others (Specify)
4.5 At what times do you wash your hands? (Multiple answers possible)
1=After defecation/visiting toilet?2=Before feeding the child3=Before eating4=Before preparing food5=When I think they are dirty6=When water is available7=Other (Specify)
6
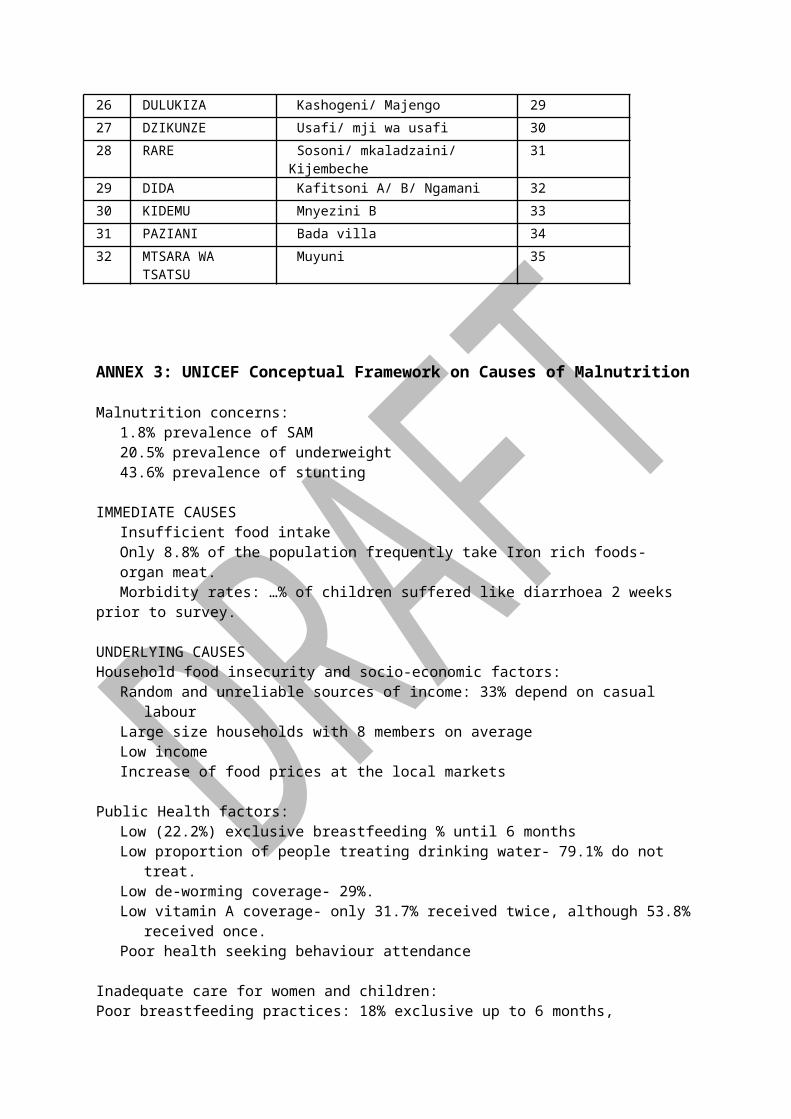
SECTION 5: FOOD CONSUMPTION AND DIETARY DIVERSITYTwenty four hour and seven day recall for food consumption in the households; The interviewers should establish whether the previous day and night/seven days were usual /normal for the households. If unusual feasts, funerals or most members absent, then another day should be selected.
Food group Consumed 5.1 Did a member of your household consume any food from these food groups in the last 7 days?
1=Yes2=No
5.2 If YES how many days was the food consumed in the last 7 days?
5.3 Did a member of your household consume food from any of these food groups in the last 24 hours
(from this time yesterday to now?) Include any snacks consumed
5.4 What is the main source of the dominant food item consumed? 1=Own production 2=Purchases 3=Gifts from friends /families 4=Food aid5=traded or Battered 6=Borrowed7=Gathering/Wild8=Others (Specify)
1. Cereals and cereal products (e.g sorghum, maize, spaghetti, pasta, anjera, bread,)?2. Vitamin A rich vegetables and tubers: Pumpkins, carrots, orange, sweet potatoes3. White tubers and roots: White potatoes4. Dark green leafy vegetables: Including white ones +Locally available vitamin A rich leaves such as cassava leaves etc.5. Other vegetables (e.g, tomatoes, egg plant, onions)?6. Vitamin A rich fruits :Ripe mangoes, papayas + other locally available vitamin A rich fruits7. Other fruits 8. Organ meat (iron rich: Liver, Kidney, heart or other organ meats or blood based foods9. Fresh meats and offals ;Meat, poultry, offal (e.g chicken/poultry, camel/goat meat, beef)10.Eggs11. Fish: Fresh or dries fish or shell fish12. Pulses/Legume, nuts (e.g beans, lentils, green grams, cowpeas)13. Milk and milk products (e.g. goat/camel/fermented milk, milk powder)14. Oils/fats*(e.g. cooking fat or oil, butter, ghee, margarine)?15. Sweets, Sugar, honey, sweetened soda or sugary foods such as chocolates, sweets or candles.
7

16. Condiments, Spices and beverages:5.5 In general what is the main source of food in household? (Use codes above) [ ]
5.6 Total number of food groups consumed (filled by enumerator) [ ]SECTION 6: FOOD AID 6.1 Have you received food aid in the last three (3) months? (Please Circle) 1=Yes 2=No (If NO go to section 7)6.2. If YES When? (Please Circle) 1=Less than one month ago 2=1 and 2 months 3=over 2 months
Please indicate the food commodities received in the last distribution, quantity received, duration each food item lasted and how it was utilized.
Of the food aid received what proportion was used for each of these purposes?(Please tick were appropriate)
6.3 FOOD AID COMMODITY
6.4 QUANTITY (KGS) Verify by using distribution cards)
6.5 Resold in the Market
6.6 Bartered for other item
6.7 Shared with kin
6.8 Saved for seed?
6.9 Consumed by household members
6.10 Others specify
6.11 How many days did each food community last?
8

SECTION 7: COPING STRATEGIESIn the previous month, has the household done any of the following? Tick as appropriate
Never Once per week
Twice per week
3-6 times per week
All the time?Everyday
7.1 Reduction in the number of meals per day7.2 Skip food consumption for an entire day7.3 Reduction in size of meals 7.4 Restrict consumption of adults to allow more for children 7.5 Feed working members at the expense of nonworking 7.6 Swapped consumption to less prepared or cheaper foods 7.7 Borrow food from a friend or relative 7.8 Purchase food on credit 7.9 Consume wild foods (normal wild food)7.10 consume immature crop 7.11Consume decomposed fish 7.12 Consume toxic taboo foods 7.13 Food consumption of seed stock 7.14 Send household members to eat elsewhere 7.15 Withdraw children from school 7.16 Begging or engaging in degrading jobs 7.17 Individual migration out of the area 7.18 Household migration out of the area 7.19 Sale of firm implements7.20 Sale of milking livestock 7.21 Sale of household goods 7.22 Disintegration of families 7.23 Abandonment of children or elderly 7.24 Sell of charcoal and or firewood 7.25 Part of family migrating with animals to look for grazing 7.26 Others
9

SECTION 8: MALARIA8.1 Does this household have a mosquito net? If NO go section 9
1= Yes2=No
8.2 Where did you get it from? (multiple answers possible)
1= A shop2= An agency3= Ministry of public, Health and Sanitation4= Others specify
8.3 If you got it from the shop, have you ever treated your net (soaked or treated it in dawa or chemical to repel mosquito or insects)
1=Yes2=No
8.4 If YES,When did you last treat it? Circle code
1) Less than one month ago?2) Between one and six months ago3) More than 6 Months ago4) Can not remember
8.5 Who slept under the mosquito net last night? (Probe- circle all responses mentioned )1) Children less than 5 years2) Children over 5 years old3) Pregnant woman4) Mother5) Father6) Nobody uses
SECTION 9: ADULTS NUTRITIONAL STATUS QUESTIONS TO BE ANSWERED IF CARE GIVER IS A FEMALE
Measure MUAC of caregiver only if a child from her household was measured in SECTION 2 Care giver must be female between 15 and 49 years of age If there are multiple caregivers, interview only the one who is a primary care giver
9.1 How old are you? 9.2 What is the woman’s current physiological status? (Ask carefully and Circle)1=Currently pregnant2=Breastfeeding(<6 months infant)3=Breastfeeding(6-24 months)4=Pregnant and breastfeeding5=Not pregnant /not breastfeeding6=breastfeeding(>24 months)
9.3. MUAC (CM), Left arm *(To the nearest 0.1cm), do not round up. Cm
10

SECTION 10: Wealth Ranking/Source of income
Does your household own any of the following Assets?
Item Please Tick 10.1 Type of House ( Please Observe)
a Grass Thatch b Plastic sheet roof c Iron Roof d Skin roof e Other roof (specify)__________________________ f Mud Wall g Skin wall h Plastic sheet wall i Brick/stone wall j Other wall (specify)__________________________ k Mud floor l Plastic sheet floor
m Concrete floor n Other floor (specify)__________________________
10.21 Water Tank
10.22 Drip Bucket
10.23 Paraffin Stove
10.24 Pressure Lamp
10.25 Bicycle
10.26 Hand Grain Miller
10.27 Ox-Plough
10.28 Donkey Cart
10.29 Motorized Vehicle
10.30 Beds
10.31 Food Granary
10.32 Radio
10.33 Tape player/ recorder
10.34 Television
10.35 Television and video player
10.36 Mobile phone
10.37 Shop/kiosk
10.38 Shallow well
10.39 Boats
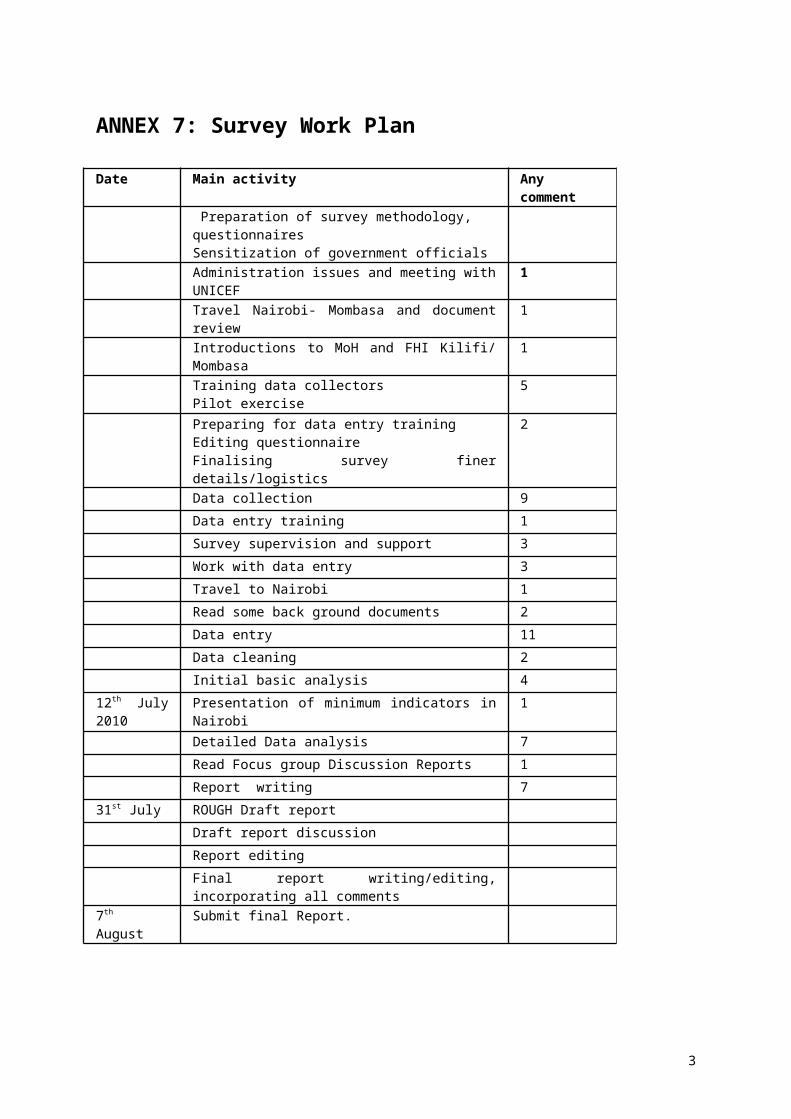
Item Please Tick 10.4
0 Fishing nets 10.4
1 Cooking pot 10.4
2 No of mattresses 10.4
3 Metallic boxes 10.4
4 Others specify
2
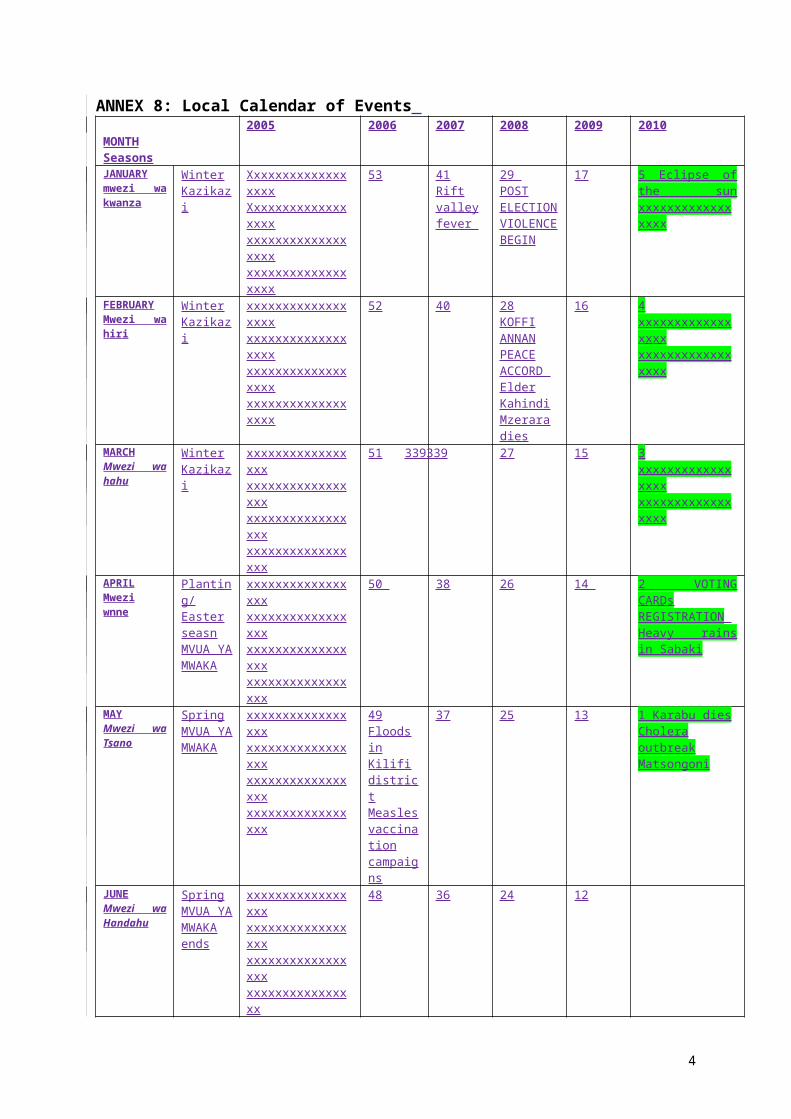
Item Please Tick How many? Please indicate (Number/size)
10.5 Number of Rooms in the dwelling place 10.6 Number of co-wives 10.7 Cultivated Land (acres) last season 10.8 What is the size of your livestock? 0=no livestock, 1=little, 2=small,
3=medium, 4=Large) 10.8
1 Bulls (number) 10.8
2 Cows (Number) 10.8
3 Oxen (number) 10.8
4 Camels (number) 10.8
5 Goats (number) 10.8
6 Sheep (number) 10.8
7 Donkeys (number) 10.8
8 Poultry (number) 10.8
9 Others (specify)_________________________ 10.8
9 Total Livestock Units (TLU) 10.9 Has the size of your livestock herd changed since last rain?
(1=increased, 2=reduced, 3=remained the same) 10.9
1 If increased/decreased what are the reasons ( 1=animals gave birth, 2=bought, 3=given, 4=death because of drought, 5=death because diseases, 6=sold, 7=raid, 8=Other (specify)
10.10 Source of income
What were your sources of income the last three months (please indicate the three most important in order of priority) 1=sell of live stock, 2=sale of livestock product, 3= sale of ration food, 4=sale of own crop, 5=wage labor, 6=Remittance charcoal/firewood, 7=basket weaving, 8=petty trade, 9=salary,10= casual labour, 11=Others(specify)
10.11 LIVELIHOOD
What is the main source of livelihood for the household? 1=Pastoralism 2=Agro-pastoralism, 3=Fishing, 4=Petty trading, 5= Agriculture, 6=Formal employment, 7=Informal employment, 8= natural resource dependents. 9= others specify _______________________________
3

Annex 10 Mortality QuestionnaireGOK and FHI / UNICEF
Nutrition and Food Security Survey Questionnaire
Name of District
Name of Division
Name of Village
Cluster Number
House hold Number
Date of Interview (dd/mm/yy)
Name of interviewer
Name of Team Leader
7.2 Standard mortality questionnaire No.
1:First Name
2:Sex(1=M:2=F) 3:Age(yrs) 4:Born since(Specify recall date)
5:Arrived since (Specify recall date)
6:Reason for leaving
7.Cause of death
a) How many members are there in this household now? List them.
b) How many members have left this house hold (out migrants since (specify recall date)?List them
c) Do you have any member of the house hold who has died since (specify recall date)? List them
4

7.3 CodesReason for migration Cause of death1= Civil insecurity2= Food insecurity3= Employment4=Divorce5= Visiting6 = Other, specify
1= Diarrhoeal diseases2=ARI3= Measles4= Malaria5= HIV/AIDS
6= Anemia7= Birth complications8= Other, Specify
Summary*Total U5
Current HH MembersArrivals during the recall periodNumber who have Left During Recall PeriodBirths During Recall Deaths during recall period
*For supervisor only
7.4 For Anthropometric standardization of weight and heightName of person measuring…………………………………………….Date:………………………………………
5