web analytics an intro
TRANSCRIPT

Web Analytics
A SHORT INTRODUCTION

Web Analytics – What is it?
Gartner defines Web Analytics as
“A market of specialized analytic applications used to understand and improve online channeluser experience, visitor acquisition and actions, and to optimize digital marketing and advertisingcampaigns. Commercial products offer reporting, segmentation, analytical and performancemanagement, historical storage and integration with other data sources and processes. The toolsare used by marketing professionals, advertisers, content developers and the website’s operationsteam, and increasingly provide input to automated tools that target improved customerexperience”
A much simpler definition from Wikipedia
“Measurement, collection, analysis and reporting of internet data for purposes of understandingand optimizing web usage”
Simply put it’s a tool for measuring traffic to improve the effectiveness of a web site
Helps in effectively carrying out business and market research
Helps measure the results of advertising campaigns
Helps estimate traffic changes on launch of new advertisement campaign
Helps gauge traffic and popularity trends
Web Analytics helps you track every click of every person on your site…
2
Categories
Off-site Web Analytics
A measure of web sites opportunity (potential audience), visibility (share) and buzz (comments)that’s happening on the whole irrespective of whether or not you own the website.
Provides insight on where competitors advertise, how better position a website and helpsidentify new marketing initiatives
Tools like Google Insight for Search, and Compete.com provide off-site analytics data
On-site Web Analytics
Measure of visitors behavior on a website. It tracks the visitors journey through the website. Itmeasures the performance of the website in commercial context.
Data from on-site web analytics is typically compared against key performance indicators.Helps derive for example how different landing pages are associated with online purchases.
Google Analytics is the most widely used on-site web analytics service
This deck provides details of the on-site web analytics techniques and tools
3

Web analytics Technologies
Log file analysis
Web servers record request details in a log file. Log analyzer software read this file to statisticsof the website usage
It was helpful in the early days when websites were simple and consisted of mostly single pagehtml’s
The increasing complexity of the websites coupled with development in related web andnetwork technologies posed problems with form of measurement of websites popularity
Web caches where second and subsequent requests get served from caches, posed a criticalproblem to log file analysis techniques.
Page Tagging
Collects website data using third party data collection server. When a page is loaded, a Ajaxcomponent on the page passes on data about the client to the server
Since its JavaScript based, it can be used for any events – click, focus, blur, mouse over, etc.
Even activities on pages that are cached can be tracked
Page tagging method has become a standard in web analytics
A majority of web analytics solutions uses Page Tagging approach
4

Why Web Analytics is essential
It provides the ability to capture, track over time and report on the behavior of visitors to
the website. Without this data it is difficult to improve the website
It helps in tracking website key engagement metrics like no. of pages per visit, average
time spent on site, return visitors vs. new visitors, etc.
Provides overview of different sources of traffic. A view of the direct traffic vs. referral
traffic vs. search engine traffic
Provides details on the geographic distribution of the visitor. Helps identify potential
regions that are currently under covered or not served by the business
Helps understand which content is viewed most often and which content is viewed least
often
Measure impact of multi-channel marketing – how a television commercial on a certain
date drive traffic to the website
Helps define and track sales funnels. For example, email signup, contract request
submission can provide leads for sales which can be tracked.
It provides the ability to track and measure top referring sites
Provides details on the visitor’s browser segmentation
Provides details on which search engines are driving the most visits
5
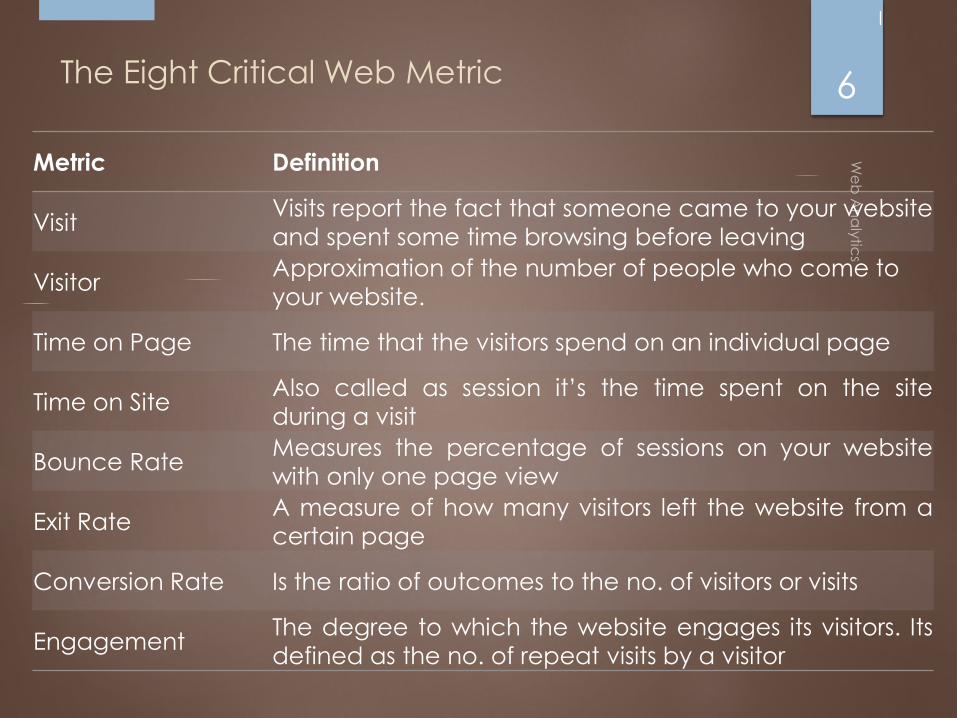
The Eight Critical Web Metric
Metric Definition
VisitVisits report the fact that someone came to your website
and spent some time browsing before leaving
VisitorApproximation of the number of people who come to
your website.
Time on Page The time that the visitors spend on an individual page
Time on SiteAlso called as session it’s the time spent on the site
during a visit
Bounce RateMeasures the percentage of sessions on your website
with only one page view
Exit RateA measure of how many visitors left the website from a
certain page
Conversion Rate Is the ratio of outcomes to the no. of visitors or visits
EngagementThe degree to which the website engages its visitors. Its
defined as the no. of repeat visits by a visitor
6

Metrics - No. of visits to purchase,
No. of days to purchase
Helps understand customer
behavior, optimize how each
item are sold, how to advertise
and market them, and even helps
optimize inventory
Metrics - Site Overlay Report
Shows how people browse
the website, which methods
are working and which are
not on the website
Metrics - Top Entry Pages,
keywords, Bounce
Identifies which of the multiple site
entries are not resulting in sale,
which keyword searches does not
produce relevant results
Metrics – Traffic sources – Direct
Traffic, Referring Sites, Search
Engines
Shows where the visitors are
coming from , effectiveness of
marketing and provides direction
on where to spend on marketing
Metrics - Visits, Bounce Rate, Page
Views, Pages/Visit, Avg. Time on Site,
and % New Visits
Indicates how the website is
performing on the surface and its
trend
Web Analytics - Usage 7
Basic Health Check
Visitor Acquisition
Top Entry Pages,
keywords, Bounce
Click Density Analysis
Visits to Purchase

Products 8
And many more…

Key Products & Features 9
Google Analytics
Free, Easy to use, User-friendly dashboards
Provides features for targeted ads, track sales, track goal conversions, see what site variant generates the most revenue, track specific campaigns and transactions
Provides tools to understand the customer and what they are searching for.
Also has paid program for larger and more complicated websites
Adobe SiteCatalyst
Quickly identify the most profitable paths through the website.
Most concise segmentation through real-time visitor information
Automatically scan a website for opportunities to improve tag structure, links and keywords to optimize site health
Provide insight about the best channels to expose customers to products
WebTrends
One of the founding companies in the web analytics industry.
Has created important and lasting relationships with huge retailers and companies around the world.
Offer comparative data and information on other companies in the same or similar business so companies can compare themselves to others.
CoreMetrics
In addition to other features, provides impression monitoring. An advertisement showing up on a page is counted as an impression and used to count the no. of times a visitor saw an ad before actually clicking on it.
Allows import of legacy data from other web analytics tool to be used in historical reports.
Offers a pay per click (PPC) campaign management tool that allows to keep track of ads, keywords, and landing pages from one convenient console.

Web Analytics – Generic Architecture
How it works
When the visitor browses the website, the page contains the code snippet to download a JavaScript.
This JavaScript has tracks user activity and sends data to the analytics server on various events
The analytics server stores the data which are then processed
The processed data is stored typically in a database
Analytics reports gets served from this database
10

Parameters for Tool Selection
Why not a free tool. Tools like Piwik, Google Analytics, Mixpanel are offered free for
limited usage. What limitations does a free tool pose
Total cost of ownership
Metrics needed
Data democratization - Metrics and dashboards for different people, User
management, Training
Ease of use
Options for exporting data
Training and consulting
Access to knowledge base and type of support
Advanced features - Mobile analytics, Social analytics, Cost data import, Attribution
modeling, Advanced segmentation, A/B Testing, Real time features
Future roadmap of the tool
Reasons for lost business for the tool
11
Limitations of Web Analytics
Third party cookies – A majority of the web analytics vendors use third party
cookies (that are sent from vendors domain and not from the domain of the
website being browsed). This allows tracking of user across other sites as well.
This leads to privacy concern and some users (though in minority now) block
third party cookies
Cookie deletion – User at anytime can delete the cookies. Web analytics tools
use this cookie to identity unique visitors. The user will look to be a first time visitor
if he/she deletes the cookies.
Network and security limitation – There could be limitations from private
networks that prevent site data to go to third parties. The service provider and
in some cases the countries may also impose such restrictions.
Data accuracy – Due to the above factors the data gathered may not be
accurate. Also the methods used in web analytics is prone to manipulation.
Data from the web analytics should be considered as approximate data and
never be trusted to be accurate
12

Competition Analysis Techniques
Toolbar Data – Toolbars in browsers collect limited data about browsing and keyword
used by the user. This data can be used for gathering competitive intelligence
Panel Data – Sampling based on panel members who install the monitoring software
which collects data sends it to a central server for reporting
ISP Data – The internet service providers collects data from all the users it services which
can be analyzed
Search Engine Data – the search engines are providing tools to mine their search
behavior data which can be used for search data analysis
Benchmarks from Web Analytics Vendors – Web analytics vendors aggregate multiple
vendor data and publish benchmarks which can be used to compare against industry
segment
Self Reported Data – Some websites publicize their own data which can be leveraged
for competition analysis
Web Traffic Analysis – Tools like Google trends provide data on web traffic which can be
used to compare against competition and industry segment
Overlap and Opportunities – Also visited data from Google trends provides insight on
the biggest competitor and where to place advertisements
Referrals and Destinations – Study of the referring sites for the competitor website.
13

Thank you
14