viability of rural areas - forsiden - regjeringen.no on the importance of agriculture for the...
TRANSCRIPT

Agriculture’s Importance for the Viability of Rural Norway
Arild Blekesaune
Centre for Rural Research Norwegian University of Science and Technology 7491 Trondheim Norway
Agriculture’s Importance for the Viability of Rural Norway 1
Preface In the summer 1998 the Norwegian Ministry of Agriculture started several research projects organised under a program on the multifunctionality of agriculture. Centre for Rural Research at the Norwegian University of Science and Technology has been involved in three of these projects. This report shows the results from one of them, focusing on the importance of agriculture for the viability of rural areas. The aim has been to analyse two approaches formulated by the Ministry of Agriculture. These approaches were: 1. To what extent are rural districts important to the Norwegian society, and to what extent is agriculture
important to rural development? 2. To what extent is budgetary support necessary to maintain rural settlement pattern, employment, and
sustainable development in rural areas, and is it necessary to link this support to levels of production? In the organisation of this work, I have chosen to break down these approaches into four targets, by splitting each of the original approaches. I emphasise that these targets cannot be regarded as independent, but should rather be read as an analytical division of an extensive subject. My hope is that this analytical structure will make it easy to draw up logical, stringent and analytically consistent relations between the targets in this project. The targets I will touch in this report are: 1. to analyse to what extent rural districts represent an important part of the Norwegian society. 2. to analyse the degree to which agriculture is of importance in maintaining rural settlement pattern, employment,
and sustainable development in rural areas. and if agriculture is of importance: 3. to analyse the extent to which budgetary support is a necessary condition for maintaining rural settlement,
employment, and sustainable development in rural areas. 4. and to assess to what extent budgetary support has to be linked to quantity of production. The analysis of target 1 is mainly based on studies of relevant literature about Norwegian policy and Norwegian culture. The analysis of the other three targets also draws on empirical analysis of census and survey data. During the project period I have also had the pleasure to present various aspects from this report through speeches in several meetings and through participation in different groups examining connections between international negotiations on reductions in national support and protection of agriculture and a national policy for rural development. The information obtained through these activities also constitutes an important input in my analysis of these topics.

2 Agriculture’s Importance for the Viability of Rural Norway
Agriculture’s Importance for the Viability of Rural Norway 3
Index 1 INTRODUCTION........................................................................................................................................... 5
2 STRUCTURAL CHANGES WITHIN NORWEGIAN AGRICULTURE IN THE POST-WAR PERIOD..................................................................................................................................................................... 6
2.1 AGRICULTURE IN RURAL AREAS .................................................................................................................... 8 2.2 NORWEGIAN AGRICULTURE AND INTERNATIONAL NEGOTIATIONS................................................................. 8
3 THE POSITION OF RURAL DISTRICTS IN THE NORWEGIAN SOCIETY ................................... 11
3.1 WHAT IS ACTUALLY THE NORWEGIAN?....................................................................................................... 12 3.2 NATIONAL IDENTITY.................................................................................................................................... 13
4 THE POLITICAL PRESSURE FROM AGRICULTURE ....................................................................... 14
5 METHOD FOR ANALYSES OF PARTICULARITIES OF RURAL AGRICULTURE...................... 17
5.1 THE RURAL DIMENSION ............................................................................................................................... 17 5.2 CHARACTERISATION OF RURAL AREAS IN NORWAY .................................................................................... 20 5.3 THE MICRO-SOCIOLOGICAL ANALYSIS OF RURAL AGRICULTURE.................................................................. 21
6 HOW IMPORTANT IS RURAL FARMING FOR RURAL SETTLEMENT PATTERN, RURAL EMPLOYMENT, AND SUSTAINABLE DEVELOPMENT IN RURAL AREAS? ........................................ 23
6.1 DIFFERENT WAYS OF MAKING A LIVING AMONG FARM FAMILIES ................................................................. 24 6.2 ADVANTAGES OF PART-TIME FARMING IN RURAL AREAS............................................................................. 26
7 INCOME INEQUALITIES BETWEEN FARMERS IN DIFFERENT AREAS .................................... 28
8 THE NECESSITY OF BUDGETARY SUPPORT .................................................................................... 30
9 IS IT REALLY NECESSARY TO CONNECT THE BUDGETARY SUPPORT WITH QUANTITY PRODUCED?.......................................................................................................................................................... 39
10 CONCLUSIONS............................................................................................................................................ 42

4 Agriculture’s Importance for the Viability of Rural Norway
Tables Table 1. Number of municipalities and inhabitants within each area. ...................................................................... 20 Table 2. Population density in different areas........................................................................................................... 20 Table 3. Some demographic and economic characteristics of rural and urban areas................................................ 20 Table 4. Distribution of farms in farm census 1989 and farm survey 1995 according to rurality. ........................... 21 Table 5. Distribution of farms by size of agriculture area in different areas. Percentages. ...................................... 21 Table 6. Employment in farming as percent of total employment in different areas in 1950, 1960, 1970, 1980, and
1990................................................................................................................................................................. 23 Table 7. The entire employment in farming, forestry and fisheries as percent of total employment among men and
women in 1970, 1980 and 1990. ..................................................................................................................... 23 Table 8. Employment in farming in percent of total employment among men and women in 1990. ....................... 24 Table 9. A typology of farm households’ income combinations after rurality. Percents.......................................... 25 Table 10. Total farm income before tax in different areas. Percentages................................................................... 28 Table 11. Farmer and spouse’s entire incomes from different sources in 1994 on farms where the farmer is less than
67 years old. Mean NOK................................................................................................................................. 28 Table 12. Overview of different kinds of budgetary support to Norwegian agriculture in 1997 (Norwegian terms in
parenthesis)...................................................................................................................................................... 30 Table 13. Different direct payments in Norway in 1997 and Rounded to 1000 NOK.............................................. 31 Table 14. Main farm production on farms in different areas. Percentages. .............................................................. 32 Table 15. Number of farms and direct area and animal support after rurality. ......................................................... 33 Table 16. Distribution of holdings by extent of agriculture area in use in different areas. Percentages................... 33 Table 17. Parameter estimates of linear regression models estimating received direct support to farmers in different
areas................................................................................................................................................................. 35 Table 18. Test of subsets of variables against the full regression model in table 17. ............................................... 36 Table 19. Rates of payments per hectare through area and cultural landscape support in different zones. NOK per
hectare. ............................................................................................................................................................ 37 Table 20. Relations between area zones and cultural landscape support and rurality. Percentages. ........................ 37 Table 21. Mean farm incomes and mean received production subsidies in different regions. Mean NOK.............. 39 Table 22. Parameter estimates of linear regression models of farm incomes among farmers in different areas. ..... 39

Agriculture’s Importance for the Viability of Rural Norway 5
1 Introduction During the last decade, national and international pressure has brought Norwegian agriculture to the centre of the national political agenda. The income policy and the market regulation policy are probably shifting ground as agricultural policy responds to both international pressure for greater freedom of trade (i.e., World Trade Organisation), domestic concerns about the environmental effects of modern intensive farming systems, and the consumers' increased focus on lower food prices and reduction in production costs and subsidies. The farmers’ optimism from the 70’s has disappeared and political support for agriculture has been weakened. The new agricultural policy has not developed into a coherent system yet, although new structural tendencies have emerged. Norwegian agriculture has for a long time been supported through administered prices, market regulations, supply control measures, and import restrictions. However, these market price supports are supplemented even more by different forms of direct payments. In recent years, the decrease in direct payments with strong links to production has been compensated by payments with weaker links to production, like direct payments to farmers on the basis of number of animals, amount of arable land, or size and location of farms. The main purpose of this shift has been to reduce over-production, and simultaneously support farm income, maintaining farming and settlement, providing incentives for reducing pollution and soil erosion, and maintaining food production capacity and the cultural landscape. During the last decade, the OECD’s PSE1 index, which measures the amount of national support to agriculture, has hardly changed, while the CSE2 index, which measures the long-term decline in share of support provided via market support mechanisms, shows a sharp decline steep (OECD 1998). This indicates that Norwegian agriculture has maintained the level of total support, but the sector’s channel of support has changed from production dependent to more production independent transfers. This report aims to show how agriculture and agricultural policy exert influences on rural settlement and rural economy, and to analyse to what extent our national agricultural policy has been an essential condition for the viability of rural areas in Norway. The report will mainly focus on agriculture’s multifunctional roles from a micro-sociological view, but in such an analysis it is always necessary to emphasise the structural changes that will influence individual agency within the agriculture sector. Therefore, the report starts with a historical presentation of changes in the Norwegian agrarian structure and the agricultural policy during the post-war period. The intention with this presentation is to show that multifunctionality is not a new objective within the Norwegian agricultural policy. In chapter three, I will contribute to an ongoing discussion about the position of rural districts and rural culture in the Norwegian society, and try to clarify whether the high level of public support to Norwegian agriculture is based on peculiar cultural factors within the Norwegian society. In chapter four, I discuss whether the amount of public subsidies in Norwegian agriculture is a result of lobbying and political pressure from organised groups within farming, or whether these subsidies are based on distinctive sympathy on the part of the public. Chapter five is used to clarify some methodological problems connected to analyses of rural areas. In this chapter, I introduce a method for classification of municipalities which is based on the rural characteristics of different geographical areas. In chapter six, I have used survey and census data to analyse the degree to which farming is important to maintain rural settlement, rural employment, and to ensure a sustainable development in rural areas. The next three chapters analyse the necessity of budgetary support to sustain agriculture in rural areas. Chapter seven focuses on income inequalities between farmers in different areas. Chapter eight analyses the budgetary support more generally, while chapter nine looks more specifically on the needs for production dependent support. Chapter ten draws some conclusions from this report, and launches some topics for further research on agriculture’s multifunctional roles in rural areas.
1 Producer Subsidy Equivalent 2 Consumer Subsidy Equivalent
6 Agriculture’s Importance for the Viability of Rural Norway
2 Structural changes within Norwegian agriculture in the post-war period
Norwegian agriculture is marginal in many respects, including climatic conditions, poor quality of land, hilly topography, and small farms. With an average farm size of 11 hectares, and average dairy herds of 12 cows, Norwegian agricultural policy is a deviant case with its goal set in 1975 of equal incomes for farmers and industrial workers. Even though this goal has never been achieved (Almås 1993), it has given Norwegian farmers substantial welfare gains. In some ways Norwegian agrarian history is quite unique in an European context. Special importance has been attached to the fact that peasant ownership of land, ownership based on the old Norse allodial law, survived during the Middle Ages. Norwegian agriculture has never contributed the necessary surplus to support a large non-working rural class of landowners, which might be the main reason why Norway was under Danish and later Swedish colonial rules up to 1905. Another important factor to understand the agriculture’s position in Norway is that the rural population surplus from the first part of the 19th century, owing to a comparatively late industrialisation and urbanisation, resulted in there being many crofters. From the first part of this century, crofting was abolished, and many of these crofters became smallholders. These smallholders have constituted the majority of the agrarian population throughout this century. The large share of small and marginal farms in the Norwegian agrarian structure has been maintained by an agricultural policy with an extended focus on agriculture’s contribution to the whole society. Agricultural policy has not only been prepared to control food production, but has also been an important tool to ensure rural development. During recent years environmental preservation has also been an integrate objective in agricultural policy. In that way, the objective of Norwegian agricultural policy has been multifunctional for several decades. Since many rural districts are highly dependent on farming, the viability of rural areas has been an important part of Norwegian agricultural policy during recent decades. This accumulation of multifunctional elements is not an unique feature in agricultural policy. Multifunctional elements are an integral part of most policies. For instance, regional policies in Norway are both administrated in an independent sector (the “small” regional policy), and are integrated into most other sectoral policies (the “big” regional policy). In that way, Norwegian agricultural policy has also been ascribed particular importance for the viability of rural economies and the entire welfare of rural areas. The focus on non-food aspects within agriculture policy is not unique for Norway. After the Second World War, all of the advanced industrialised countries in the western world kept social peace with the farmers through subsidy arrangements in order to prevent the market power from having a free hand to undermine agriculture so rapidly that it could lead to serious political unrest (Friedmann 1978). The political architects of post-war Europe wanted to avoid any repetition of the polarisation that took place during the period between the wars, when the agricultural population’s varied social strata had supported extreme solutions of both right and left in politics (Almås 1992). Simultaneously it became clear that agriculture in these countries had too much manpower. In Norway, the Social Democracy started to rationalise the farm structure in order to transfer labour force and capital from the agricultural sector to meet the growing demand for labour in the industry. There was a political consensus to sustain those family farms which would be necessary to supply the population with food. The first focus on negative effects of the rationalisation of farm structure arose from the mid-50s. The reports from “The Agricultural Committee” of 1956 and “The Agricultural Appropriation Committee” of 1956 both discussed the negative consequences of an unconditional rationalisation of the farm structure. The subsequent Report to Storting No. 64 (1963-64), which was based on these committee reports, recommended strong protection of the Norwegian food market in order to maintain the welfare of the farm population, and introduced operating subsidies to avoid unintended consequences of structural rationalisation.
Agriculture’s Importance for the Viability of Rural Norway 7
Ten years later, a report from the Øknes committee (NOU 1974: 26) concluded that the post-war policy, which aimed at increasing agricultural efficiency through phasing out small holdings, had been effective, but the report admitted that this policy had led to large income inequalities between different regions and among different types of holdings. In this period it was obvious that the negative effects of the structure-rationalisation policy had brought the mutual dependence between agriculture and rural areas to the centre of the national political agenda. In 1975, the Norwegian Storting (Parliament) voted to equalise incomes between farmers and industrial workers by 1982. At that time, the professional debate over problems with a policy that supported large farm units had already been raging for more than a decade (Almås 1989). This debate was raised by the social scientist Ottar Brox (1966) who defended the smallholders justification and argued that pluri-active fisherman-farmer households in Northern Norway often experienced higher living standards than urban families, even though their cash incomes were lower. Instead of viewing the traditional way of life as irrational, Brox focused on the rationality within the tradition. He described the economical rationality in the small-scale coastal fishery combined with farming. This small-scale fisherman and peasant became the symbol for the North Norwegian identity and life form3. In the short run, the effect of the 1975 resolution was strong optimism in the agricultural sector (Blekesaune & Almås 1992). Prices and subsidies increased relatively fast after 1975 (Vatn 1991). In current terms, average farm income more than doubled from 1975 to 1982 (Almås 1985). In real terms, the increase was 28 per cent. One might expect these rising incomes to lead to increased production, and gradually to an overproduction problem. However, Vatn’s analysis indicates that it is difficult to show any greater increase in production after 1975 than before, in spite of the much increased income possibilities. He asserts that the overproduction problems actually started because of reduced demand, due to cuts in consumer subsidies in the early 1980’s (Vatn 1991). On the other hand, Almås (1990) and Brox (1988) have argued that it was only farmers with excess production capacity in the middle of the 70’s who profited from the more expansive agricultural policy. Farmers who increased their production capacity after 1980, when the State reduced its subsidies and made other interventions in order to cut production, became the ‘losers’. These two perspectives represent different views about farmers’ production behaviour. Vatn’s analysis indicates that improvements in income possibilities have a minor influence on the development of production, while Almås and Brox assert an increasingly competitive climate after 1975. This does not mean that Vatn ignores rational behaviour among farmers. He rather upholds farmers' expectations of price development as more important than past and current prices to explain adjustments in their behaviour (Vatn 1991). In my opinion, it is still possible to combine these two explanations of production behaviour in one model. Vatn’s analysis indicates that expectations about future policy are more important within agriculture than in many other sectors because of particular characteristics of family farming compared with other production systems. These characteristics are for instance that all comprehensive production changes involve long-term planning and relatively limited production flexibility after investment in one particular line of production. The need for long-term planning follows from the fact that the investment cycle follows the generation cycle to a great extent (Vatn 1991).
3 Saugestad Larsen (1980) challenged Brox’s idea about the fishing peasant and proposed that ‘he’ was a ‘she’, as it was the fisherman’s wife who commonly was operating the small farm.
8 Agriculture’s Importance for the Viability of Rural Norway
2.1 Agriculture in rural areas Predictions from Statistics Norway shows that all of Norway's counties except for the county of Hedmark will increase in population over the next 10 years. The strongest growth will be expected to take place in the urban counties of Akershus, Oslo and Rogaland. In these counties the number of inhabitants will grow by nearly one percent per year. This is double the expected growth rate of the country as a whole. Even if there is an increase in population in nearly all counties, there will be large variations at the municipality level4. The population of rural municipalities is expected to decline, while it will increase in urban municipalities. Predictions from Statistics Norway indicate that 230 of Norway’s 435 municipalities will see their population decline over the next decade5. This expected out-migration from rural areas can be a serious threat in many rural municipalities. Each municipality requires a minimum population level to maintain service institutions and their social capital. The result of the population decline in the most rural municipalities will probably be a demographic thinning out of the periphery. Aasbrenn (1989) argues that such processes threaten the existence of local and public services institutions, voluntary organisations, cultural activities, informal social networks and so forth. In other words, we can assume that the expected population decline will threaten the level of welfare of inhabitants in many rural areas. As mentioned above, agricultural policy is an important part of the entire regional policy in Norway. Even the last parliamentary bill (St.prp. no 8, 1992-93), which removed the income goal from agricultural policy, emphasises that agricultural policy should contribute to a more comprehensive regional policy. This shows that the preservation of the settlement pattern in rural areas is still a goal in agriculture policy, even if the income policy and the market regulation policy are weakened as response to both international pressure from the World Trade Organisation for greater freedom of trade, and the consumers' increased sensitivity to food prices and subsidies going to large farms in central parts of the country. During the 1980s, increasing differences in income among farmers were observed, in spite of the fact that a large part of the subsidies and other income payments were supposed to provide special support for smallholders in marginal areas. Brox (1988) argues that a relatively big share of these transfers went to agricultural households in central parts of the country, where we find the largest farms. The arrangements made to implement the policy of special support for marginal farming areas were not substantial enough to counterbalance the impact of the subsidies and transfers that vary with the volume of productive activity at the individual farm level. From the mid-1990s, the GATT agreement from the Uruguay Round negotiation provides a framework for the long-term reform of agricultural trade and domestic agriculture policies for many years. The agricultural agreement makes a decisive move towards the objective of increased market orientation in agricultural trade, but it also includes some provisions that encourage the use of less trade-distorting domestic support policies to maintain the rural economies in the member countries.
2.2 Norwegian agriculture and international negotiations The World Trade Organisation (WTO) is an inter-governmental organisation, which is the only international agency overseeing the rules of international trade. The previous General Agreement on Tariffs and Trade (GATT) has since 1947 been an ad hoc organisation, without a solid legal foundation, and it only dealt with trade in goods. The Uruguay Round (1986-94) expanded the scope of the international trade rules to cover goods, services and intellectual property, and the WTO was created to be an international organisation with a firmer legal basis that could cover the full range of trade issues.
4 Norway consists of 19 counties and 435 municipalities 5 Statistics Norway, Weekly Bulletin issue no. 46, 1996

Agriculture’s Importance for the Viability of Rural Norway 9
Agriculture, which had since 1947 remained outside the scope of the GATT, was included in 1986 in the Uruguay Round of Multilateral Trade Negotiations. The Blair House Agreement, which was a compromise settlement between the USA and the EC in 1993 to prevent the possible collapse of the Uruguay Round, led to an agreement which was considerably less dramatic than the Norwegian negotiators could have expected during the first part of the Uruguay Round. In the end this agreement had the following consequences for Norwegian agricultural policy: • conversion of non-tariff import restrictions to fixed tariffs; • reduction of tariffs by an average of 36 percent, and minimum 15 percent for each commodity; • reduction of export subsidies by 36 percent; • reduction of national support measures for farmers by 20 percent. These points should have had enormous consequences for farming and rural life in Norway, had there been no exceptions. Especially the last point on this list has been subject to many adjustment. Domestic forms of support that have a minimal impact on trade, i. e so-called “green box” policies which include general government services like research, disease control, infrastructure and food security, are not subject to the GATT provisions on reducing domestic support. The Norwegian negotiators hoped to attain an agreement that this exception also should include direct payments to producers, and the Blair House Agreement allowed for certain forms of income support which were "decoupled" from production. The introduction of “blue box” policies, which were intended to support smaller economies or for environmental protection, made it possible for Norway to put the General Area and Cultural Landscape Payments within this box. These payments, which are given for all arable land, sown grassland and fertilised pasture, depend only on some very general conditions which most farmers are meeting (Rønningen 1998). The agreement from the Uruguay Round negotiations has been operative from 1995. The next WTO round on substantial reductions in support and protection of agriculture, that will start by the end of 1999, is mandated by Article 20 of the Agreement on Agriculture.
Article 20 Continuation of the Reform Process
Recognising that the long-term objective of substantial progressive reductions in support and protection resulting in fundamental reform is an ongoing process, Members agree that negotiations for continuing the process will be initiated one year before the end of the implementation period, taking into account: a. the experience to that date from implementing the reduction commitments; b. the effects of the reduction commitments on world trade in agriculture; c. non-trade concerns, special and differential treatment to developing country
Members, and the objective to establish a fair and market-oriented agricultural trading system, and the other objectives and concerns mentioned in the preamble to this Agreement; and
d. what further commitments are necessary to achieve the above mentioned long-term objectives.
Through Article 20, all WTO members are committed to initiating negotiations for continuing the reform process that began in Punta del Este in 1986. However, point c in Article 20 emphasises the importance of non-trade concerns and their implications for the multilateral trade system and national agricultural policy. The objectives and concerns mentioned in the preamble to this agreement are food security and the protection of the environment. Additionally, this exception will probably also include regional policies and other social aspects connected to non-

10 Agriculture’s Importance for the Viability of Rural Norway
trade concerns. Here we have to bear in mind that Norway stated, when the long-term objective and the non-trade concerns were discussed at the meeting of the Trade Negotiations Committee on 8 April 1989, that:
“With regard to the long-term part we must on the Norwegian side stress again the importance which we attach to the non-trade concerns or the non-economic factors. These are central elements in our agricultural policies and extend not only to food security, but comprise also elements such as environment, regional policies and social aspects. Within a broader context they are vital to us”.
This interpretation was later repeated by the March 1998 Communiqué of the OECD, when the Agriculture Ministers recommended that the long-term objective of substantial reductions should be in conformity with payments for non-trade concerns. This implies that the Agriculture Ministers in OECD have adopted a broad set of shared goals and policy principles covering all aspects of agricultural policy reform, and thereby allowing agriculture to manifest its multifunctional character in a transparent, targeted and efficient manner. The challenge in pursuing the shared goals is to find a range of well-targeted policy measures and approaches which can ensure that the growing concerns regarding food safety, food security, environmental protection and the viability of rural areas are met. The situation for Norwegian agriculture is also different from the prevailing situation when the Uruguay Round started. At the end of 1980s we had still large food surpluses and ambiguous and partly incompatible goals for national agriculture policy. Today the state subsidies have to a large extent shifted from support entirely dependent on output towards production-neutral support. While support linked to amount produced made up 31 percent of the agricultural budget in 1986, this was reduced to 18 percent ten years later (St.prp. 72 1995-96). An important factor behind this change is the introduction of the General Area and Cultural Landscape Payments in 1989. Even if agricultural policy has gone through comprehensive changes, it is most doubtful that an extended focus on agriculture’s multifunctional roles will protect us against further extensive re-adjustments. It is important to notice that multifunctionality is a newfangled concept which attempts to include quite a few aspects and spin-offs from agriculture. Therefore, different countries ascribe different meanings to this concept, and these meanings are closely connected with previous institutionalised targets in their respective national agricultural policies. In Norway, agricultural policies have to a large extent been legitimated through agriculture’s contribution to more general regional policies. Norwegian regional policy has two main goals: (1) to maintain the residential pattern and develop sustainable regions in all parts of the country (St.meld. 31, 1996-97), and (2) to guarantee a minimum welfare standard to everybody, wherever they live (Aasbenn 1989). Therefore, regional development has been one important aim within agricultural policy during the last four decades, and that is the main reason behind Norway’s emphasising of viability of rural areas within the concept of multifunctionality. By that very fact that all political regimes in Norway during the last three decades have continued this political practice, and the lack of real opposition against this policy, implies that sympathy for the rural is a deep-rooted part of the Norwegian identity. In the next two chapters I will discuss whether the amount of state subsidies to agriculture reflects Norwegian society's overall preferences for maintaining the viability of rural districts, or if the amount of public subsidies is a result of lobbying and political pressure from minority groups.

Agriculture’s Importance for the Viability of Rural Norway 11
3 The position of rural districts in the Norwegian society
Even if the countryside has come to play a central role in defining national identity in most countries, we can see that different countries emphasise different aspects of the rural in their construction of national identities. Two of the most prominent socio-political forces seeking to define the cultural significance of rurality have been the peasant movement in France and the preservation movement in Britain (Lowe & Buller 1990). We can see a similar distinction in these countries’ focus on the contemporary countryside crisis. In France, it is the perceived demise of rural society, through the decline of a traditional way of life associated with the peasantry, which attracts concern, while the British focus has been much more strongly expressed over the decline in the rural landscape. The countryside discourse in Norway has, in contrast to the France and British discourses, mainly focused on equalisation of living conditions between rural and urban areas as a part of the welfare state policy. It is often claimed that rural districts constitute an important part of Norwegians society, also compared with other European countries. Almås (1995) asserts that Norwegian culture is less centralised, less elitist, and more egalitarian than other European countries. Hompland (1991) claims that the transition between rural and urban is less clear in Norway than in other related countries. If rural culture plays a particularly important role in Norwegian society, it could be due to a number of aspects in Norwegian culture. The distinct strength of rural districts could be explained in several ways. First, Norway was relatively late to be urbanised. Due to our climate and topography, Norwegian agriculture could not contribute the necessary surplus to maintain a large urban population. The marginal conditions for agriculture and late industrialisation meant that the rural population surplus from the first part of the 19th century resulted in many crofters, and many of these crofters became smallholders during the first part of this century. The fact that about one third of Norwegian farms have less than 5 hectares of arable land shows that these smallholders still constitute an important part of the agrarian population. Second, many political and socio-political movements have tried to build a bridge over the traditional differences between urban and rural areas. The rural population has been an important electorate for all political parties, and the smallholders and part-time farmers have had particular influence on the labour movement. The working class was too small to make a strong enough basis for the socialdemocratic movement, which means that the Labour Party was partly dependent on support from the small farmers (Rønningen 1998). In 1933 the Norwegian Labour Party had the slogan “Town and countryside hand in hand” (By og land hand i hand) in their 1933 May Day parade, and “Better living conditions in urban and rural districts” (Bedre kår i by og bygd) in 1936. This shows that the rural population was an important constituency at least for the dominant Labour Party. According to Almås (1993), this political bridge-building led to the peculiar Norwegian political compromise between urban radicals and rural centrists, between people in Northern and Southern Norway, between working class and self-employed people in the primary industries – those political compromises which partly explain why Norwegian people are so reluctant to join EU. Third, the Norwegian nation-building, which started in the middle of the 19th century, always used rural areas as the main icon. Therefore, I will look further at research results which could weaken or strengthen these assumptions. A number of surveys of living conditions among the Norwegian population indicate that the equalisation policy, which aimed to break down the social and economic contradictions between town and country, has been so successful that today we can scarcely talk about differences in living conditions between rural and urban areas. However, it is less certain that this equalisation policy has been legitimated through the countryside’s importance in Norwegian culture. In order to say something about the causal relations between Norwegian culture and policy, I have to take a closer look at relations between rural culture and the equalisation policy. Is it possible to characterise the Norwegian society as a society where rural culture has penetrated state policy? The late urbanisation in Norway meant that the majority of urban citizens still have near relatives in the countryside. This could be one important cause behind the political support for rural areas. There could also be other, and less clear, causal links underlying the relation between late urbanisation and political support to rural areas. The concept of urbanisation is used to describe both (a) the statistical measure of the proportion of a county’s population living

12 Agriculture’s Importance for the Viability of Rural Norway
in cities or settlements of a size-defined criterion, and (b) the social processes which are both cause and consequence of the urban way of life. Late urbanisation could imply that urban values and attitudes are less dominant in Norway than in countries with an earlier urbanisation and a stronger degree of urbanisation.
3.1 What is actually the Norwegian? There are many who have discussed what “the Norwegian” really is, and the peculiarity of Norwegian culture. Most contributors in this debate agree that there is little scientific knowledge in this field. Berggreen (1998) and Østerud (1986) have pointed out that we are lacking scientific investigations of either the contents or the character of this subject. The few studies which have discussed the particularities of Norwegian culture have not been systematic in their argumentation and have neglected a comparative perspective (Østerud 1986). Østerud draw his analysis from Eckstein (1966) and Rokkan (1970) who argue that the strong community based on solidarity is a particular Norwegian phenomenon. Eckstein and Rokkan have described rural societies as communities which develop qualities like egalitarism and reserved modesty, and maintain that it was these common feelings which led to the fundamental political conflicts between farmers and the officials in towns. Østerud’s point of view is that this conflict is highly overstated, and he denies the idea of strong solidarity in rural areas. Østerud stresses the importance of a sparsely populated country, a scattered population, a small number of inhabitants, a limited urban tradition, a long history where Norway was subordinated other nations, the absence of a national nobility, and a history where only a few have received formal privilege. The anthropologists Nina Witoszek from Poland and Patrick Sheeran from Ireland are probably the two social scientists who most clearly maintain that rural districts are of importance in Norwegian culture. Their point of departure is that all national cultures have a meta narrative which contribute to the characterisation of a common cultural identity. For Norwegians, this meta narrative is the folktales about how the poor Espen Askeladd acquires the princess and the half of the kingdom. Witotsky and Sheeran explain this narrative in two ways. In the first place, this folktale shows how Norwegian mentality is psychologically and culturally associated with soil and rural values. Secondly, they assert that the close relation to nature in these stories reflects a view of life which is more common in the Orient than in other Western countries (Witotsky & Sheeran 1992). Kramer (1984) describes the Norwegian identity as a product of a tribal identity and underdevelopment, and maintains that the Norwegians’ identity as “Norwegians” could best be described as tribe ideologies based on particular dialects and local cultures. The considerable variation in dialects and local cultures brings Kramer to a rejection of the hypothesis that Norway is a homogeneous country. On the other hand, Kramer use his model of underdevelopment to show that Norwegian identity has a distinctive character. Because Norway was subordinated by Denmark and Sweden for more than 500 years, there was a growing interest in building up a national identity as Norway gained national independence. This construction of a common national identity was conducted by an urban bourgeoisie who created the idea of a distinctive Norwegian character based on the “weathered Norwegian peasant farmer”. As opposed to these contributors, the ethnogeographer Anders Johansen (1991) and the social anthropologist Thomas Hylland Eriksen (1993) have a quite opposite view when they reject the assertion of a peculiar Norwegian culture. Johansen (1991) maintains that the Norwegian culture is not typically Norwegian, and the strong Norwegian identity is not related to a distinctive Norwegian culture. Cultural identity is not dependent on real equality and unity, but is based on a our common national symbols. Hylland Eriksen (1993) asserts that the question of the uniqueness in Norwegian culture is absurd. According to Hylland Eriksen, it is easy to find arguments which might either verify or falsify such viewpoints. Therefore, none of these social scientists has given a precise answer to the question of the characteristics which are peculiarly Norwegian, but most of them agree to an existence of a strong national identity. This common national identity, which consists of both common national symbols and a population which chooses to make use of these symbols, does not necessarily presuppose a common culture. The construction of a Norwegian national sentiment has rather been an action taken in order to create a common ideology which deals with solidarity between town and country, and feelings of equality between rich and poor. If this ideology has simultaneously created a feeling of cultural equality, it is a confirmation of the success of this social construction. This shows that the ideology works as it was intended.

Agriculture’s Importance for the Viability of Rural Norway 13
3.2 National identity The construction of an integrated national identity is an important condition behind all nation building, and the first stage in the construction of the Norwegian national identity coincided with the commotion which spread to many European countries after the disturbance in France in 1848. Many of the Norwegian artists and intellectuals, who were frightened home in this year, started to seek out in accessible parts of Norway where they might find a rural culture which looked distinctively Norwegian. By the very fact that the culture in the most populous areas of Norway was strongly influenced by the former Danish colonialism, their work was exclusively concentrated on the most outlying valleys and mountain districts. Even if the national symbols provide a poor description of the way that Norwegians actually live, they have been used to produce a common national identity. The question about these national symbols’ observable effects on the everyday life of Norwegians is not central in our analysis, because such cultural descriptions give us insufficient information about the Norwegian society's overall preferences for maintaining the viability of rural districts. On the other hand, these a society’s overall preferences are observable in national policy. Every Norwegian know that if they travel across the border to Sweden, they will see that Norwegian rural communities flourish much more than their Swedish counterparts, and every Norwegian will explain this contrast as a result of unequal policies in Norway and Sweden.
14 Agriculture’s Importance for the Viability of Rural Norway
4 The political pressure from agriculture Analysis of regional dividing lines and contradictions in the Norwegian political landscape is usually based on sociological studies of social and cultural antagonisms between different regions. The contrast between the political cultures in Eastern and Western Norway are emphasised as a considerable conflict line in such studies. In order to grasp some patterns behind political pressure in agriculture policies, it is more helpful to base an analytical model on Rokkan’s descriptions of conflicts between centre and periphery. A quarter century ago, the Norwegian political analyst Stein Rokkan sketched "conceptual maps" of Europe to capture crucial geopolitical dimensions of variation in state formation. Rokkan looked backwards, concentrating on origins of twentieth-century variation: why Scandinavian regimes resemble each other while differing so greatly from Mediterranean regimes. He searched the past for phenomena that would explain such differences in the present, and identified two important axes in the European map: 1. Over the long sweep of history the continent’s regimes varied significantly along an east-west axis
differentiating a) the commercial-urban belt between central Italy and southern England from b) its more agrarian and landlord-dominated flanks.
2. Another north-south axis defined increasingly strong influence of international churches (notably the Roman Catholic church) with proximity to the Mediterranean; on the whole Reformation-based state churches, which prevailed toward the north, fostered national unification, while strong relations with Rome hindered it.
These axes were later used as the basis for Rokkan’s descriptions of the political structures in different countries. In their classic work on electoral cleavages Lipset and Rokkan (1967) described the party system in Western Europe in the 1960s as “frozen” in the mould established at the turn of the century with the enfranchisement of the working class. According to Lipset and Rokkan (1967) the cleavages which are dominant in a society at the time of the major expansion of the franchise will shape the system of parties which evolves. The system will essentially become frozen from this time on as new voters align themselves with one of the parties on their side of the cleavage, and voting patterns will change little over time. Four particular cleavages were specified (between church and state, centre and periphery, industry and agriculture, and workers and employers), and Lipset and Rokkan claimed that the party systems existent in Europe could be traced back to alignments around one or more of these cleavages. Because parties in Europe developed around these social conflicts there have always been social bases to their political systems. Based on the thesis of the “frozen” party system, Rokkan (1987) has described the distinctive character the five party system in the Nordic countries. On the left hand there are a communist party and a social democratic party, and then a non-socialist group which consists of an agrarian party, a liberal party, and a conservative party. The sociologist Lars Mjøset (1986) maintains on the other hand that there are such big differences between the Nordic countries that we have to operate with a different model for each country, where each model cultivates particular aspects of the Western European post-war model. Sweden has accomplished a class compromise, Denmark has induced a productivity policy, Finland has introduced a state capitalistic corporativism, Iceland has ended up with a partial dependence model like many Latin American countries, while Norway has cultivated a peculiar state intervention policy. All these models have been developed through particular mixes of protectionism and growth-promoting initiatives in the economic policy in each country. The peculiar state intervention policy in Norway has also influence the agricultural policy. According to Lipset and Rokkan (1967), all political institutions can be expected to maintain the status quo for long periods of time. Therefore, I will start this discussion with a presentation of the power structure between political institution round the agriculture sector. The power structure within the agricultural sector is described in the Power Report (NOU 1982:2). According to Hernes (1983), this report shows that political power within the agricultural sector has moved from the Parliament to the government administration and farmers’ unions. This has also been pointed out in studies of the segmented state (Egeberg et al 1978), which describe conflict and collaborative relations right through the public administration. Within this approach, the political system is described as systems of sectors or segments which are hooked up to different institutions like the Parliament, the public administration and the professional and industrial
Agriculture’s Importance for the Viability of Rural Norway 15
bodies. This approach also forms the basis behind the description of the iron triangle between the Ministry of Agriculture, the Parliament’s Agriculture Committee and the farmers’ unions (Hernes 1983; Nergaard 1988). There have been many changes in the political and institutional structures within agriculture since these studies were published. The former strong vertically integrated structure from the Ministry of Agriculture, through the county agent, to the public agricultural offices in each municipality has been abolished, and replaced by horizontally integrated administrations in each county and municipality (Gjerdåker 1995). Through this reorganisation the state-organised agricultural administration has been integrated into parts of the local administrations. Another result of this reorganisation has been the abolition of the parliamentary Agriculture Committee. Rural farming in Norway is based on protective public institutions which can only be maintained as long as their social and cultural contribution to the whole society are perceived as positive. The characteristic connection between economic activity and social organisation is threatened of there is no political sympathy from other sections of the population, because rural agriculture is dependent on payments from other member of society. Norwegian agriculture has never had more political sympathy than in the mid-1970s, when the Norwegian Storting (Parliament) voted to equalise incomes between farmers and industrial workers. In order to understand the political atmosphere in the mid-70s, we have to keep in mind both the Norwegian referendum of 1972 saying "No" to the EEC, and incomes from the relatively new oil drilling industry in the North Sea. The decision not to enter the EEC, promoted by a coalition of the urban left and the rural mainstream politicians, is not easily understood by social analysts from other countries. The result of the 1972 referendum created a national political context where it was impossible to avoid a new agricultural policy. Another important national factor in the early 1970s was the special financial situation of the Norwegian state. The opening up of the oil fields in the North Sea had just begun and the Government anticipated rising state income both from taxes and from the State Oil Company (Statoil). Following the tradition of the Norwegian policies of equality, the ‘fair’ distribution of these revenues was discussed. Farmers, as the major rural class, mobilised themselves to get their share (Almås 1989). Even if the attempts during the 1970s to equalise farmers’ incomes with those of industrial workers have been abandoned as an aim of present agricultural policy, this economic escalation gave the farmers important social benefits such as relief programmes for sickness, vacations, and holidays. In addition, the increased subsidies after 1975, generated a huge institutional profit within the sector. Even if Aanesland (1992) maintains that these surplus profits have been absorbed by distributors of farming technology, the building and construction industry, agro-industry, and lending institutions, it is obvious that much of this profit is still represented in existing farm capital. The fact that investment cycles in agriculture follow the generation cycle to a great extent, means that the agriculture sector is more resistant to fluctuation of prices than many other sectors.

16 Agriculture’s Importance for the Viability of Rural Norway

Agriculture’s Importance for the Viability of Rural Norway 17
5 Method for analyses of particularities of rural agriculture
5.1 The rural dimension An empirical analysis of the relation between agriculture and viability of rural areas, requires an operational definition of the rural. According to a classification of the OECD, regions are classified as rural, if the population density is below 150 residents per square kilometre (OECD 1992). In this sense rural areas are defined in a residual and negative way, because rural is all that is not urban. After this definition, 60 percent of the Norwegian population lives in rural areas, and 99 percent of the area is considered rural. This definition is in other words unsuitable for our use, because it regards the whole country as rural. Statistics Norway defines urban settlements as: 1. densely populated areas with an agglomeration of at least 200 residents, and 2. the distance between houses as a rule does not exceed 50 metres. This implies that each municipality can be divided into many densely populated and scattered populated areas. Therefore, the units in this classification are not defined as administrative units, and it is not possible to connect this classification with data from other administrative registers. This means that Statistics Norway’s classification of densely populated areas is unsuitable to most analysis in this report. In Norway, it is rare to find farms in densely populated areas, because we have so to speak no farming within villages. There has been some local tradition with concentrated courtyards in Western Norway, but this building tradition was phased out during the severance in the 1950s (Sevatdal 1980). The Norwegian standard for classification of municipalities (NOS C192) operates with different classifications of Norwegian municipalities, but in regional studies it is usual to distinguish between four levels of centrality. These levels are: • Centrality 3: Municipalities with towns with al least 50 000 inhabitants, and municipalities with less than 75
minutes travelling time to such towns (Oslo 90 minutes). • Centrality 2: Municipalities with towns with a population between 15 000 and 50 000 inhabitants, and
municipalities with less than 60 minutes travelling time to such towns. • Centrality 1: Municipalities with towns with a population between 5 000 and 15 000 inhabitants, and
municipalities with less than 45 minutes travelling time to such towns. • Centrality 0: Municipalities which fulfil none of these demands. If we sum up these definitions, we can see that this classification consists of two main criteria: (1) whether the municipality is within a densely populated area or not, and (2) if people a municipality live within a reasonable distance from a densely populated area. This indicates that this classification has a strong orientation to the size of labour markets and individuals’ possibility to reach labour markets as commuters. The four levels of centrality are therefore strongly orientated towards wage earners, and the labour market as the central distributor of incomes. It is problematic to transfer such approaches to an analysis of rural districts, and particularly to farm households. Such approaches imply (to use Polanyi’s classical concept from 1944) that the separation of the social and the economic sphere with human activities is complete for all groups within the society. This assumption is questionable when we study income activities within a group which still has strong connections between economic activity and social organisation at micro level. In farming, the interrelation between the farm family or the farming household on the one hand and the farm economy on the other makes it difficult to draw sharp boundaries between economic and social activities.

18 Agriculture’s Importance for the Viability of Rural Norway
Therefore, the municipalities should rather be defined according to a rural dimension, where we expand the focus on population density and distance from large centres with information about share of inhabitants occupied in agriculture and in self-employed activities more generally. Almås (1985) has argued that the rural characteristics of a municipality are determined by a combination of four indicators: (1) population density (2) distance from larger centres (3) the proportion of those who work in agriculture and (4) the proportion of self-employed. This rural dimension was first classified empirically by Almås and Elden in 1997, but their classification was based on the standard codes for municipalities before the changes in 1994, when the number of municipalities was 448. In 1994 this number was reduced to 435. In this analysis I have used their methods to classify an updated rural index based on municipality numbers after 1994. On each of the four indicators of rurality, a municipality might have a score between 0 and 3, where 0 means most rural and 3 most urban. This implies that each municipality might score between 0 and 12 on the cumulative index, where 0 means most rural and 12 means most urban. In the analysis this index has been recoded into 4 rural groups. Municipalities with score 0 to 2 on the index are most rural. They will be labelled rural municipalities, while municipalities with score 3 to 5; semi-rural. Municipalities with score 6 to 8 are labelled semi-urban, and finally the urban municipalities with score 9 to 12. The result of this classification is presented in figure 16.
6 A presentation of each municipality within the rural dimension is presented in Appendix.

Agriculture’s Importance for the Viability of Rural Norway 19
Figure 1. The rural dimension

20 Agriculture’s Importance for the Viability of Rural Norway
5.2 Characterisation of rural areas in Norway Table 1. Number of municipalities and inhabitants within each area. Number of
municipalities Percent of
municipalities Land area
in km2Percent of land area
Number of inhabitantsa)
Percent ofinhabitants
Rural 171 39 166 602 54 473 550 11Semi-rural 100 23 76 818 25 482 882 11Semi-urban 81 19 42 535 14 709 649 16Urban 83 19 20 301 7 2 751 518 62Total 435 100 306 253 100 4 417 599 100a) Source: Statistical Yearbook 1998, Statistics Norway. In this table we see that 39 percent of the municipalities are classified as rural, but these municipalities have only 11 percent of the Norwegian population. On the other end of this scale we see that the urban municipalities, which consist of 19 percent of the municipalities, have 62 percent of the total population. This implies that the urban areas have 135.5 persons per square kilometre, while the rural areas have only 2,8 persons per square kilometre. The real differences are not necessarily as big as first appears. In a country where the arable land represents only three percent of the total area, it is obvious that calculations of people per square kilometre will overstate the real differences. Therefore, it is better to compare the share of people who live in so-called densely populated areas. As mentioned above, it is not possible to use this measurement unit in further analysis of farm structure at the municipality level, but this classification give good information on settlement patterns in different municipalities. Table 2 shows the share of population within each area who live in densely populated areas. Table 2. Population density in different areas. Total
population1990
Population indensely populated areas
1990
Percent indensely populated areas
1990Rural 483 869 150 431 31Semi-rural 480 822 205 787 43Semi-urban 690 309 402 899 58Urban 2551411 2 262 725 89Total 4 206 411 3 021 842 72Source: Population census 1990, Statistics Norway Nine out of ten inhabitants in urban municipalities live within densely populated areas, while less than one of three in rural municipalities live within such areas. This shows clearly and crisply that rural municipalities have really scattered settlement pattern. The composition of the population (sex, age-groups) is also a central issue when discussing future development in rural areas. A high proportion of people of retirement age indicates an ageing of the population. A higher proportion of men than women in the age groups where most people establish their own family, indicates lopsided sex-patterns of out-migration with a bachelor problems in many rural areas. In order to give better insight in demographic and economic differences between urban and rural areas, table 3 points out some relevant variables. Table 3. Some demographic and economic characteristics of rural and urban areas.
Changes in population 1988-97a)
Share of people 67
years old or morea)
Women 20-39 per 100 men
1996b)
Income per inhabitant
1995b)
Wealth per inhabitant
1995b)
Means taxes per inhabitant
1995b)
Agriculture’s Importance for the Viability of Rural Norway 21
Rural -5.31 18 89 82 345 118 549 24 348Semi-rural -1.47 16 89 86 457 105 676 26 225Semi-urban 2.44 14 92 90 935 104 737 28 650Urban 9.11 12 97 101 610 101 691 33 620a) Source: Statistical Yearbook 1998, Statistics Norway. b) Source: Regional Statistics no. 3 1997, Statistics Norway. The general trend is a decline in population in rural and semi-rural municipalities, and an increase in population in semi-urban and urban areas. We can see a decline in population in the 171 rural municipalities of more than five percent during the last ten years, while the population in the urban municipalities has increased by more than nine percent during the same period. The demographic characteristics show that there is a higher share of people in retirement age in the rural areas and a higher proportion of men than women younger than 40. Both these characteristics of rural areas indicate a negative trend. There are also considerable differences in incomes between rural and urban areas. The average income per inhabitant in rural municipalities is 81 percent, and the average taxes is 72 percent, compared with the urban averages.
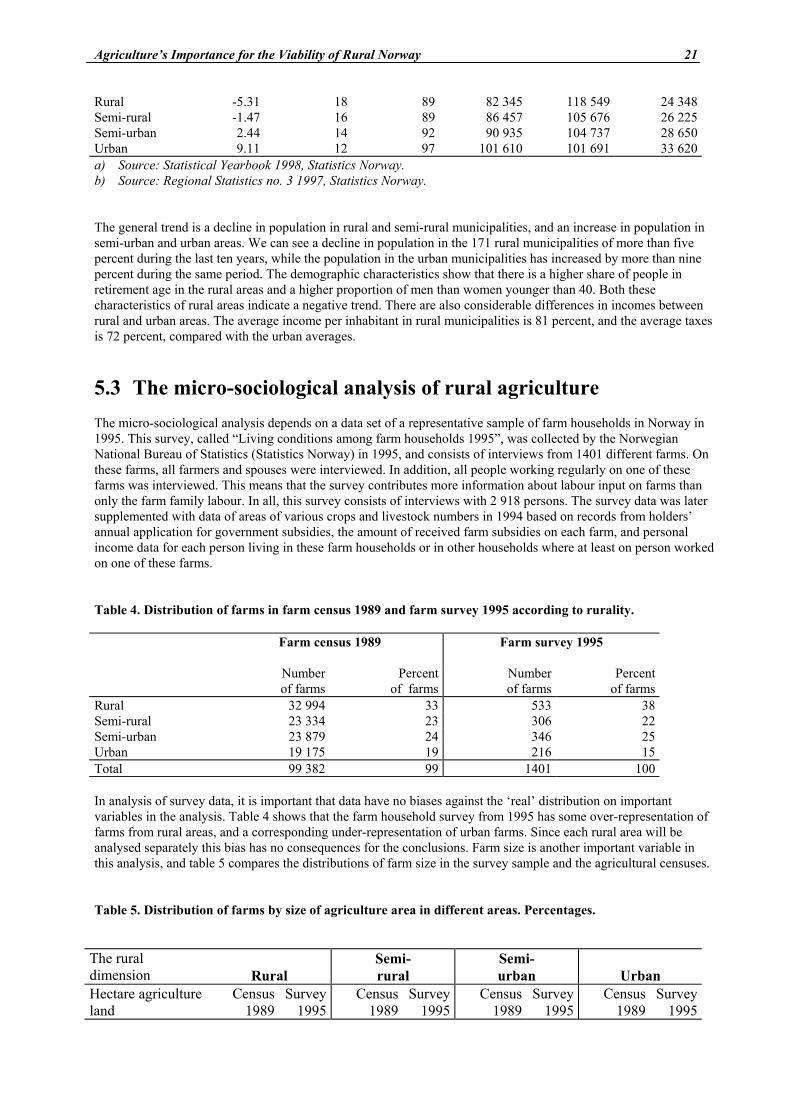
5.3 The micro-sociological analysis of rural agriculture The micro-sociological analysis depends on a data set of a representative sample of farm households in Norway in 1995. This survey, called “Living conditions among farm households 1995”, was collected by the Norwegian National Bureau of Statistics (Statistics Norway) in 1995, and consists of interviews from 1401 different farms. On these farms, all farmers and spouses were interviewed. In addition, all people working regularly on one of these farms was interviewed. This means that the survey contributes more information about labour input on farms than only the farm family labour. In all, this survey consists of interviews with 2 918 persons. The survey data was later supplemented with data of areas of various crops and livestock numbers in 1994 based on records from holders’ annual application for government subsidies, the amount of received farm subsidies on each farm, and personal income data for each person living in these farm households or in other households where at least on person worked on one of these farms. Table 4. Distribution of farms in farm census 1989 and farm survey 1995 according to rurality. Farm census 1989
Farm survey 1995
Number of farms
Percentof farms
Numberof farms
Percentof farms
Rural 32 994 33 533 38Semi-rural 23 334 23 306 22Semi-urban 23 879 24 346 25Urban 19 175 19 216 15Total 99 382 99 1401 100 In analysis of survey data, it is important that data have no biases against the ‘real’ distribution on important variables in the analysis. Table 4 shows that the farm household survey from 1995 has some over-representation of farms from rural areas, and a corresponding under-representation of urban farms. Since each rural area will be analysed separately this bias has no consequences for the conclusions. Farm size is another important variable in this analysis, and table 5 compares the distributions of farm size in the survey sample and the agricultural censuses. Table 5. Distribution of farms by size of agriculture area in different areas. Percentages.
The rural dimension
Rural
Semi- rural
Semi- urban
Urban
Hectare agriculture land
Census 1989
Survey 1995
Census 1989
Survey 1995
Census 1989
Survey 1995
Census 1989
Survey 1995
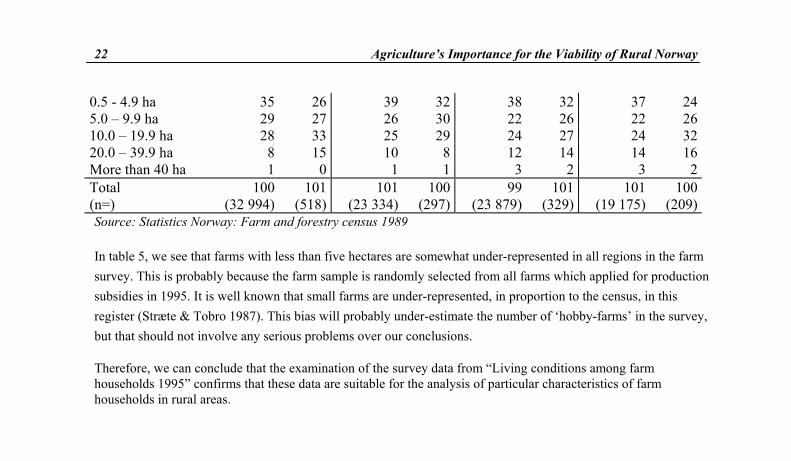
22 Agriculture’s Importance for the Viability of Rural Norway
0.5 - 4.9 ha 35 26 39 32 38 32 37 245.0 – 9.9 ha 29 27 26 30 22 26 22 2610.0 – 19.9 ha 28 33 25 29 24 27 24 3220.0 – 39.9 ha 8 15 10 8 12 14 14 16More than 40 ha 1 0 1 1 3 2 3 2Total 100 101 101 100 99 101 101 100(n=) (32 994) (518) (23 334) (297) (23 879) (329) (19 175) (209)Source: Statistics Norway: Farm and forestry census 1989 In table 5, we see that farms with less than five hectares are somewhat under-represented in all regions in the farm survey. This is probably because the farm sample is randomly selected from all farms which applied for production subsidies in 1995. It is well known that small farms are under-represented, in proportion to the census, in this register (Stræte & Tobro 1987). This bias will probably under-estimate the number of ‘hobby-farms’ in the survey, but that should not involve any serious problems over our conclusions. Therefore, we can conclude that the examination of the survey data from “Living conditions among farm households 1995” confirms that these data are suitable for the analysis of particular characteristics of farm households in rural areas.

Agriculture’s Importance for the Viability of Rural Norway 23
6 How important is rural farming for rural settlement pattern, rural employment, and sustainable development in rural areas?
Agricultural production is, unlike most other sectors, a localised and site-specific activity of particular importance to rural development and policies. Even if employment in farming has decreased during the last decades, farming still represents a substantial part of rural employment. In table 6, we can see the changes of employment in farming as a percent of the total employment in different areas from 1950 to 1990. Table 6. Employment in farming as percent of total employment in different areas in 1950, 1960, 1970, 1980,
and 1990. 1950 1960 1970 1980 1990Rural 40 36 35 21 16Semi-rural 32 27 23 13 9Semi-urban 27 22 17 9 6Urban 15 11 7 4 2Total Norway 18 14 11 7 5Source: Population census 1950, 1960,1970,1980 and 1990, Statistics Norway. Table 6 shows that the share of employment in farming has decreased in all areas, but the farm sector still employs more than one sixth of the labour force in rural municipalities. Many studies indicate that there has been a process of masculinisation of farm work within Norwegian agriculture in this period, where women’s roles have changed from being real farmers with distinct tasks, to being the male farmers’ assistant (Almås et al 1983; Blekesaune 1996). This change should indicate that agriculture is representing a more important employment sector for men than women. We lack data to test this hypothesis directly, but I have data on changes in the share of men and women employed in the primary sector in 1970, 1980, and 1990. In Norwegian statistics, the primary sector consists of farming, forestry, and fisheries. This means that there are more employed the total primary sector than in farming, and we can see this distinction if we compare the shares of total employment in primary sector with the shares of total employment in the former table. Table 7. The entire employment in farming, forestry and fisheries as percent of total employment among men
and women in 1970, 1980 and 1990.
1970 1980 1990 Municipalities classified as: Men Women Total Men Women Total Men Women TotalRural 42 46 44 30 21 27 28 13 22Semi-rural 31 33 32 20 14 18 17 8 13Semi-urban 21 22 22 13 9 11 11 5 8Urban 10 9 9 6 4 5 4 2 3Source: Census of population and housing 1970, 1980, and 1990
24 Agriculture’s Importance for the Viability of Rural Norway
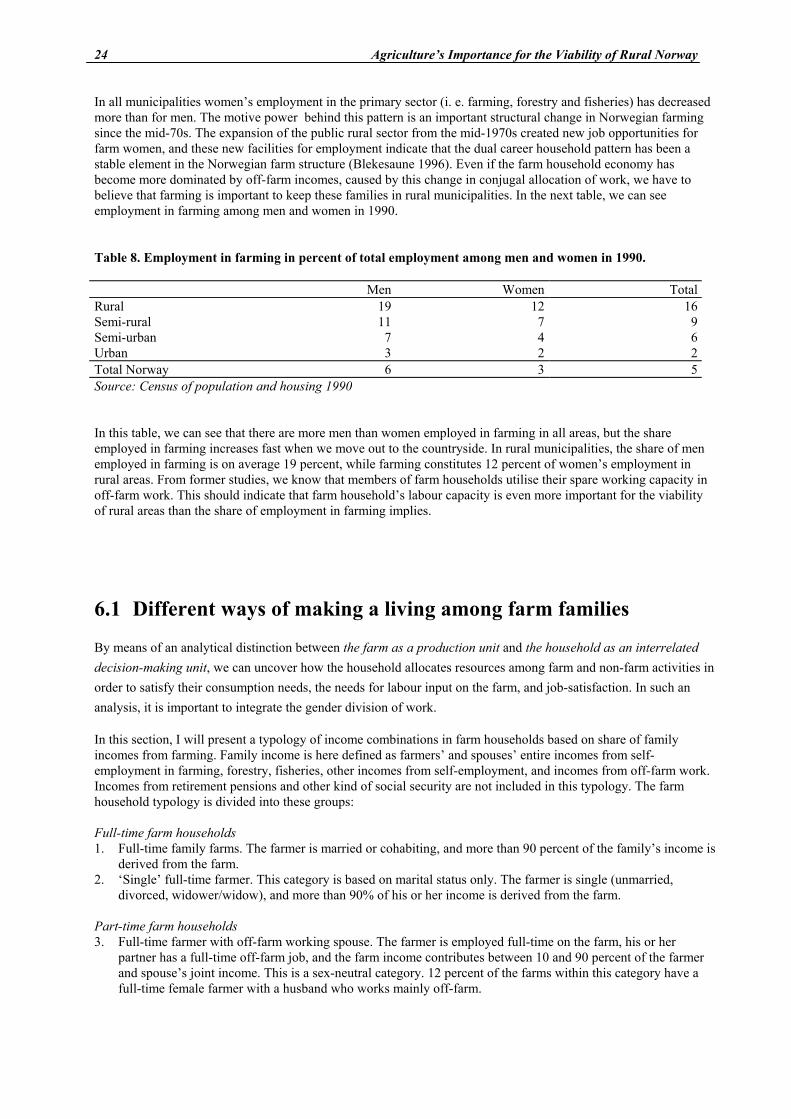
In all municipalities women’s employment in the primary sector (i. e. farming, forestry and fisheries) has decreased more than for men. The motive power behind this pattern is an important structural change in Norwegian farming since the mid-70s. The expansion of the public rural sector from the mid-1970s created new job opportunities for farm women, and these new facilities for employment indicate that the dual career household pattern has been a stable element in the Norwegian farm structure (Blekesaune 1996). Even if the farm household economy has become more dominated by off-farm incomes, caused by this change in conjugal allocation of work, we have to believe that farming is important to keep these families in rural municipalities. In the next table, we can see employment in farming among men and women in 1990. Table 8. Employment in farming in percent of total employment among men and women in 1990. Men Women TotalRural 19 12 16Semi-rural 11 7 9Semi-urban 7 4 6Urban 3 2 2Total Norway 6 3 5Source: Census of population and housing 1990 In this table, we can see that there are more men than women employed in farming in all areas, but the share employed in farming increases fast when we move out to the countryside. In rural municipalities, the share of men employed in farming is on average 19 percent, while farming constitutes 12 percent of women’s employment in rural areas. From former studies, we know that members of farm households utilise their spare working capacity in off-farm work. This should indicate that farm household’s labour capacity is even more important for the viability of rural areas than the share of employment in farming implies.
6.1 Different ways of making a living among farm families By means of an analytical distinction between the farm as a production unit and the household as an interrelated decision-making unit, we can uncover how the household allocates resources among farm and non-farm activities in order to satisfy their consumption needs, the needs for labour input on the farm, and job-satisfaction. In such an analysis, it is important to integrate the gender division of work. In this section, I will present a typology of income combinations in farm households based on share of family incomes from farming. Family income is here defined as farmers’ and spouses’ entire incomes from self-employment in farming, forestry, fisheries, other incomes from self-employment, and incomes from off-farm work. Incomes from retirement pensions and other kind of social security are not included in this typology. The farm household typology is divided into these groups: Full-time farm households 1. Full-time family farms. The farmer is married or cohabiting, and more than 90 percent of the family’s income is
derived from the farm. 2. ‘Single’ full-time farmer. This category is based on marital status only. The farmer is single (unmarried,
divorced, widower/widow), and more than 90% of his or her income is derived from the farm. Part-time farm households 3. Full-time farmer with off-farm working spouse. The farmer is employed full-time on the farm, his or her
partner has a full-time off-farm job, and the farm income contributes between 10 and 90 percent of the farmer and spouse’s joint income. This is a sex-neutral category. 12 percent of the farms within this category have a full-time female farmer with a husband who works mainly off-farm.
Agriculture’s Importance for the Viability of Rural Norway 25
4. ‘Single’ part-time farmers. The farmer is single (unmarried, divorced, widower/widow), and less than 90% of his or her income is derived from the farm.
5. Part-time farming. The family supplements income from the farm with non-farm incomes, where the farm income contributes between 10 and 90 percent of the farmer and spouse’s joint income. The conjugal division of labour within these families are not in accordance with the conditions for classification into group 3.
6. Spare-time farming. These families have less than 10 percent of their income derived from the farm, and the one or both partners have non-farm jobs.
Other farm households 7. Farm residence without agricultural production. These households had no agricultural production in 1994, but
they were in the register of producers in 1995. 8. Retirement farming. On these holdings incomes are insignificant compared to incomes from pensions or social
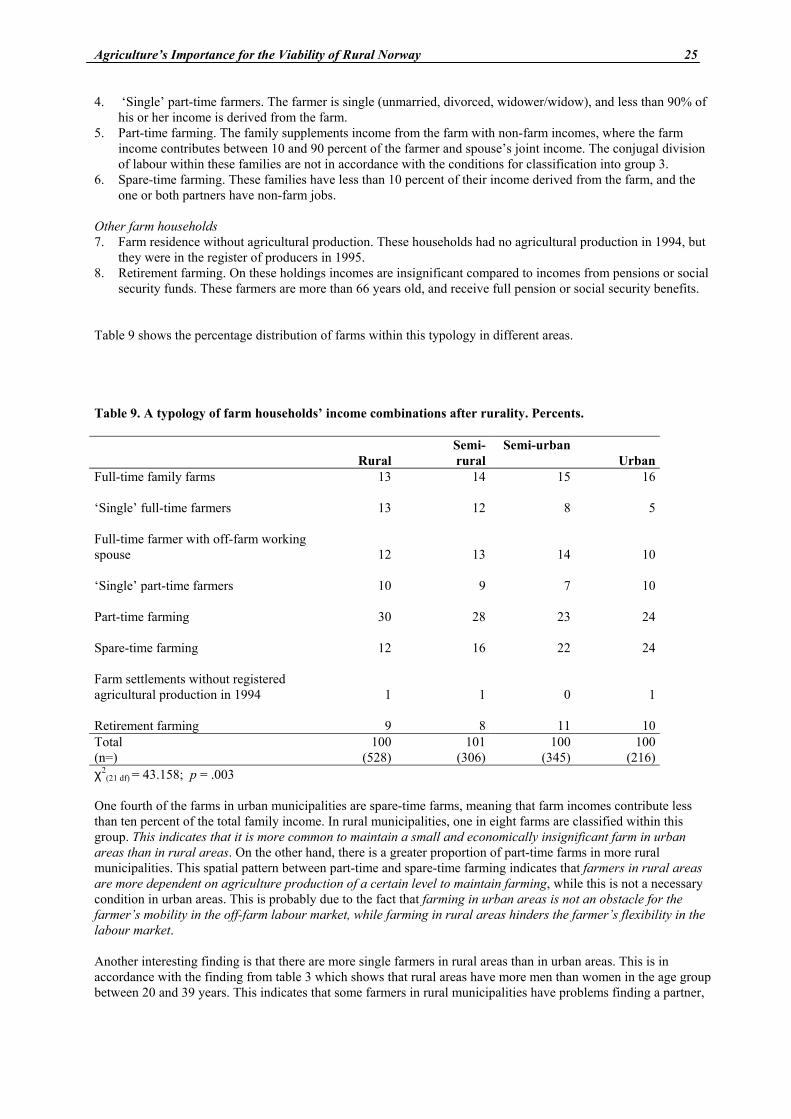
security funds. These farmers are more than 66 years old, and receive full pension or social security benefits. Table 9 shows the percentage distribution of farms within this typology in different areas. Table 9. A typology of farm households’ income combinations after rurality. Percents.
RuralSemi-rural
Semi-urban Urban
Full-time family farms
13 14 15 16
‘Single’ full-time farmers
13 12 8 5
Full-time farmer with off-farm working spouse
12 13
14 10
‘Single’ part-time farmers
10 9 7 10
Part-time farming
30 28 23 24
Spare-time farming
12 16 22 24
Farm settlements without registered agricultural production in 1994
1 1
0 1
Retirement farming 9 8 11 10Total 100 101 100 100(n=) (528) (306) (345) (216)χ2
(21 df) = 43.158; p = .003 One fourth of the farms in urban municipalities are spare-time farms, meaning that farm incomes contribute less than ten percent of the total family income. In rural municipalities, one in eight farms are classified within this group. This indicates that it is more common to maintain a small and economically insignificant farm in urban areas than in rural areas. On the other hand, there is a greater proportion of part-time farms in more rural municipalities. This spatial pattern between part-time and spare-time farming indicates that farmers in rural areas are more dependent on agriculture production of a certain level to maintain farming, while this is not a necessary condition in urban areas. This is probably due to the fact that farming in urban areas is not an obstacle for the farmer’s mobility in the off-farm labour market, while farming in rural areas hinders the farmer’s flexibility in the labour market. Another interesting finding is that there are more single farmers in rural areas than in urban areas. This is in accordance with the finding from table 3 which shows that rural areas have more men than women in the age group between 20 and 39 years. This indicates that some farmers in rural municipalities have problems finding a partner,
26 Agriculture’s Importance for the Viability of Rural Norway
and many of them have no off-farms incomes because they are probably more tied by farm work and have not a spouse who could contribute with off-farm income.
6.2 Advantages of part-time farming in rural areas A study of survival strategies among Norwegian farmers shows that farmers’ families continuing to derive an acceptable income from full-time farming, are those who are able to reproduce or enlarge the reproduction of their farm capital (Blekesaune 1991). In the present economic conjuncture, this indicates that all farm families ought to reproduce or enlarge their farm capital if they want to avoid decreased farm incomes. If families fail to keep up with the reproduction of farm capital, they have to accept reduced levels of consumption or increased off-farm work. This implies that a family farm can survive, at least for a period, with negative reproduction of the farm capital if the family can satisfy their consumption needs by means of off-farm work. It is this interdependency between the agricultural economy and the labour market economy that forms the bases of (1) the stability of part-time farms and (2) the increase in one-man farms, which indicates that the increased integration between farm and non-farm economy at the household level is of vital importance to the maintenance of the family-based agriculture structure. These structural changes should be considered as features which make family farming more resistant towards future changes in agricultural policy and other economic conditions, rather than an indication of the marginalisation of family-based farming. The increased integration of farm and off-farm work at the household level also implies that farm households are involved in many tasks outside agriculture. According to the hypothesis of demographic thinning out of the periphery (Aasbrenn 1989), that farm household labour is assumed to be of particular importance for maintaining service institutions in rural areas. The increase in part-time farming implies that farm household labour is much more important for non-farm economic activities in rural areas, than the employment in farm-related activities upstream and downstream of farming. This indicates that the economists’ estimates for multiplier effects from farming underestimate the real importance of farming in rural areas.

Agriculture’s Importance for the Viability of Rural Norway 27
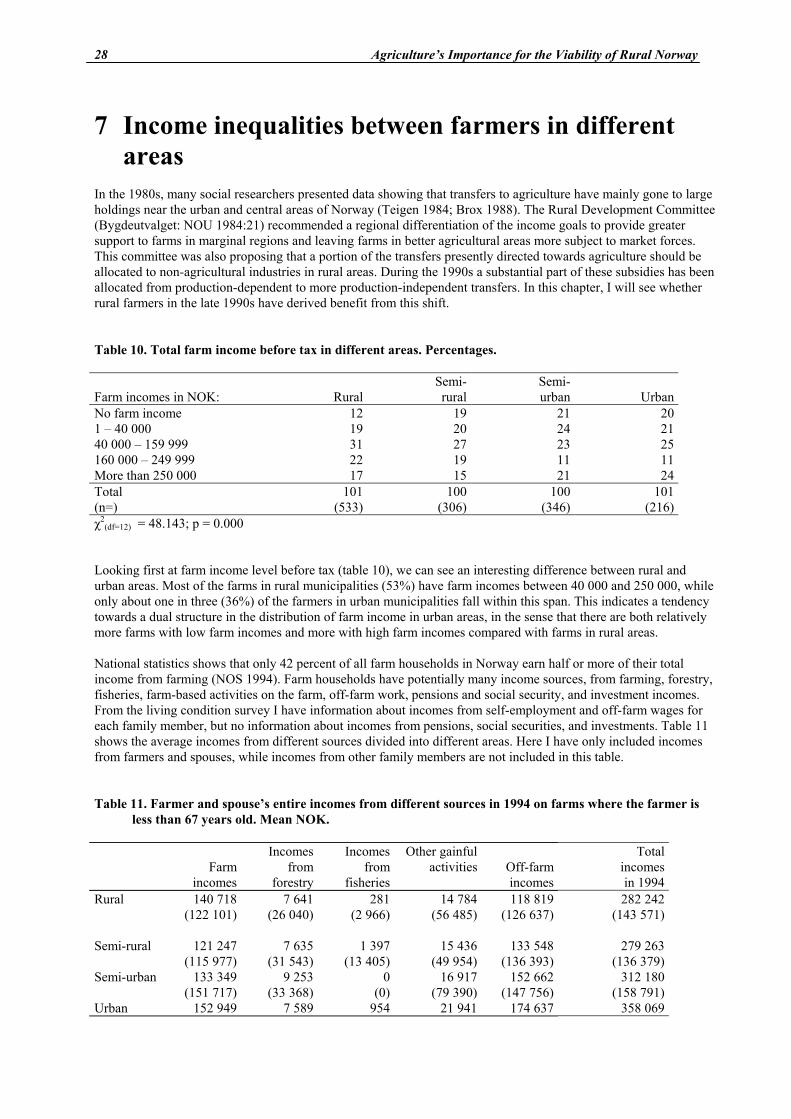
28 Agriculture’s Importance for the Viability of Rural Norway
7 Income inequalities between farmers in different areas
In the 1980s, many social researchers presented data showing that transfers to agriculture have mainly gone to large holdings near the urban and central areas of Norway (Teigen 1984; Brox 1988). The Rural Development Committee (Bygdeutvalget: NOU 1984:21) recommended a regional differentiation of the income goals to provide greater support to farms in marginal regions and leaving farms in better agricultural areas more subject to market forces. This committee was also proposing that a portion of the transfers presently directed towards agriculture should be allocated to non-agricultural industries in rural areas. During the 1990s a substantial part of these subsidies has been allocated from production-dependent to more production-independent transfers. In this chapter, I will see whether rural farmers in the late 1990s have derived benefit from this shift. Table 10. Total farm income before tax in different areas. Percentages. Farm incomes in NOK: Rural
Semi-rural
Semi- urban Urban
No farm income 12 19 21 201 – 40 000 19 20 24 2140 000 – 159 999 31 27 23 25160 000 – 249 999 22 19 11 11More than 250 000 17 15 21 24Total 101 100 100 101(n=) (533) (306) (346) (216)χ2
(df=12) = 48.143; p = 0.000 Looking first at farm income level before tax (table 10), we can see an interesting difference between rural and urban areas. Most of the farms in rural municipalities (53%) have farm incomes between 40 000 and 250 000, while only about one in three (36%) of the farmers in urban municipalities fall within this span. This indicates a tendency towards a dual structure in the distribution of farm income in urban areas, in the sense that there are both relatively more farms with low farm incomes and more with high farm incomes compared with farms in rural areas. National statistics shows that only 42 percent of all farm households in Norway earn half or more of their total income from farming (NOS 1994). Farm households have potentially many income sources, from farming, forestry, fisheries, farm-based activities on the farm, off-farm work, pensions and social security, and investment incomes. From the living condition survey I have information about incomes from self-employment and off-farm wages for each family member, but no information about incomes from pensions, social securities, and investments. Table 11 shows the average incomes from different sources divided into different areas. Here I have only included incomes from farmers and spouses, while incomes from other family members are not included in this table. Table 11. Farmer and spouse’s entire incomes from different sources in 1994 on farms where the farmer is
less than 67 years old. Mean NOK.
Farm incomes
Incomes from
forestry
Incomes from
fisheries
Other gainful activities Off-farm
incomes
Total incomesin 1994
Rural
140 718(122 101)
7 641 (26 040)
281(2 966)
14 784(56 485)
118 819(126 637)
282 242(143 571)
Semi-rural
121 247(115 977)
7 635 (31 543)
1 397(13 405)
15 436(49 954)
133 548(136 393)
279 263(136 379)
Semi-urban
133 349(151 717)
9 253 (33 368)
0(0)
16 917(79 390)
152 662(147 756)
312 180(158 791)
Urban 152 949 7 589 954 21 941 174 637 358 069

Agriculture’s Importance for the Viability of Rural Norway 29
(168 298) (30 239) (8 181) (98 327) (161 904) (161 214)
Mean
136 453(136 630)
8 024 (29 821)
564(7 336)
16 545(69 125)
138 896(141 179)
300 483(151 077)
N
1273 1273 1273 1273 1273 1273
F-value
2.338 0.232 2.262 0.528 8.702 14.746
p-value 0.072 0.874 0.080 0.663 0.000 0.000 Table 11 shows that farm incomes and off-farm incomes are the main income sources in farm households, and that off-farm incomes are the only significant source of differences in income composition between the areas. Farm households in rural municipalities have on average half of their incomes from the farm (50%), while this share is 43 percent in the other areas. That means that households in rural municipalities are more dependent of farm incomes than households in semi-rural, semi-urban, and urban municipalities.
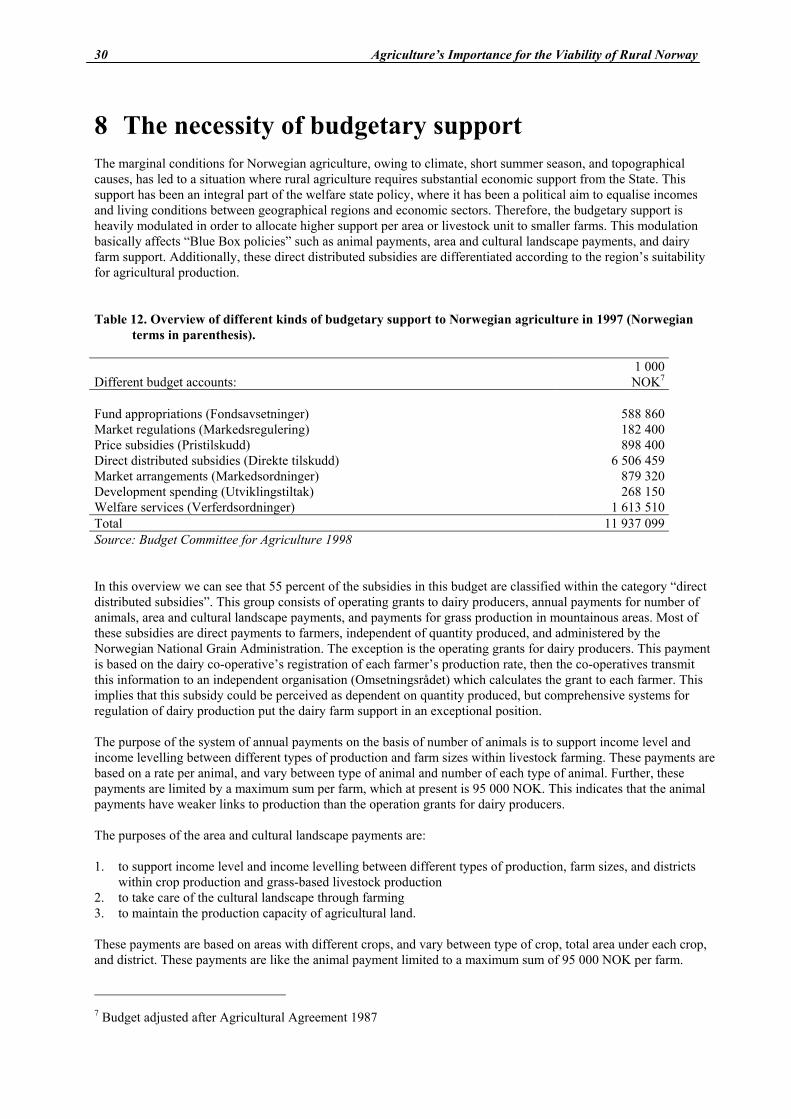
30 Agriculture’s Importance for the Viability of Rural Norway
8 The necessity of budgetary support The marginal conditions for Norwegian agriculture, owing to climate, short summer season, and topographical causes, has led to a situation where rural agriculture requires substantial economic support from the State. This support has been an integral part of the welfare state policy, where it has been a political aim to equalise incomes and living conditions between geographical regions and economic sectors. Therefore, the budgetary support is heavily modulated in order to allocate higher support per area or livestock unit to smaller farms. This modulation basically affects “Blue Box policies” such as animal payments, area and cultural landscape payments, and dairy farm support. Additionally, these direct distributed subsidies are differentiated according to the region’s suitability for agricultural production. Table 12. Overview of different kinds of budgetary support to Norwegian agriculture in 1997 (Norwegian
terms in parenthesis). Different budget accounts:
1 000NOK7
Fund appropriations (Fondsavsetninger) 588 860Market regulations (Markedsregulering) 182 400Price subsidies (Pristilskudd) 898 400Direct distributed subsidies (Direkte tilskudd) 6 506 459Market arrangements (Markedsordninger) 879 320Development spending (Utviklingstiltak) 268 150Welfare services (Verferdsordninger) 1 613 510Total 11 937 099Source: Budget Committee for Agriculture 1998 In this overview we can see that 55 percent of the subsidies in this budget are classified within the category “direct distributed subsidies”. This group consists of operating grants to dairy producers, annual payments for number of animals, area and cultural landscape payments, and payments for grass production in mountainous areas. Most of these subsidies are direct payments to farmers, independent of quantity produced, and administered by the Norwegian National Grain Administration. The exception is the operating grants for dairy producers. This payment is based on the dairy co-operative’s registration of each farmer’s production rate, then the co-operatives transmit this information to an independent organisation (Omsetningsrådet) which calculates the grant to each farmer. This implies that this subsidy could be perceived as dependent on quantity produced, but comprehensive systems for regulation of dairy production put the dairy farm support in an exceptional position. The purpose of the system of annual payments on the basis of number of animals is to support income level and income levelling between different types of production and farm sizes within livestock farming. These payments are based on a rate per animal, and vary between type of animal and number of each type of animal. Further, these payments are limited by a maximum sum per farm, which at present is 95 000 NOK. This indicates that the animal payments have weaker links to production than the operation grants for dairy producers. The purposes of the area and cultural landscape payments are: 1. to support income level and income levelling between different types of production, farm sizes, and districts
within crop production and grass-based livestock production 2. to take care of the cultural landscape through farming 3. to maintain the production capacity of agricultural land. These payments are based on areas with different crops, and vary between type of crop, total area under each crop, and district. These payments are like the animal payment limited to a maximum sum of 95 000 NOK per farm. 7 Budget adjusted after Agricultural Agreement 1987
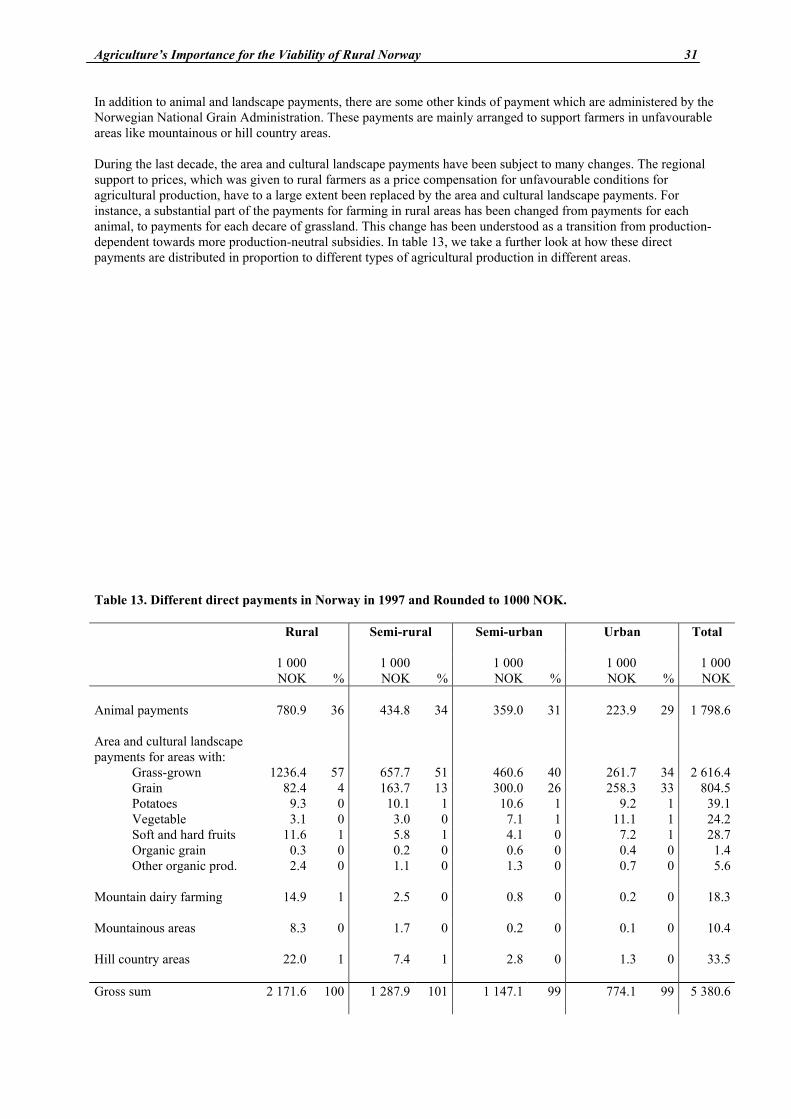
Agriculture’s Importance for the Viability of Rural Norway 31
In addition to animal and landscape payments, there are some other kinds of payment which are administered by the Norwegian National Grain Administration. These payments are mainly arranged to support farmers in unfavourable areas like mountainous or hill country areas. During the last decade, the area and cultural landscape payments have been subject to many changes. The regional support to prices, which was given to rural farmers as a price compensation for unfavourable conditions for agricultural production, have to a large extent been replaced by the area and cultural landscape payments. For instance, a substantial part of the payments for farming in rural areas has been changed from payments for each animal, to payments for each decare of grassland. This change has been understood as a transition from production-dependent towards more production-neutral subsidies. In table 13, we take a further look at how these direct payments are distributed in proportion to different types of agricultural production in different areas. Table 13. Different direct payments in Norway in 1997 and Rounded to 1000 NOK.
Rural Semi-rural Semi-urban Urban Total
1 000 NOK %
1 000 NOK %
1 000NOK
%
1 000 NOK %
1 000 NOK
Animal payments
780.9 36 434.8 34 359.0
31
223.9 29 1 798.6
Area and cultural landscape payments for areas with:
Grass-grown 1236.4 57 657.7 51 460.6 40 261.7 34 2 616.4 Grain 82.4 4 163.7 13 300.0 26 258.3 33 804.5 Potatoes 9.3 0 10.1 1 10.6 1 9.2 1 39.1 Vegetable 3.1 0 3.0 0 7.1 1 11.1 1 24.2 Soft and hard fruits 11.6 1 5.8 1 4.1 0 7.2 1 28.7 Organic grain 0.3 0 0.2 0 0.6 0 0.4 0 1.4 Other organic prod.
2.4 0 1.1 0 1.3 0 0.7 0 5.6
Mountain dairy farming
14.9 1 2.5 0 0.8 0 0.2 0 18.3
Mountainous areas
8.3 0 1.7 0 0.2 0 0.1 0 10.4
Hill country areas
22.0 1 7.4 1 2.8 0 1.3 0 33.5
Gross sum
2 171.6 100 1 287.9 101 1 147.1 99 774.1 99 5 380.6

32 Agriculture’s Importance for the Viability of Rural Norway
Various deductions
-204.2 -124.5 -111.7 -79.4 -519.7
Direct farm subsidies 1 967.4 1 163.4 1 035.4 694.7 4 860.9Source: Norwegian National Grain Administration As table 13 shows, there are considerable differences in the regional distribution of these payments. Area and cultural landscape subsidies for grain production constitute only four percent of the direct support to farmers in rural areas, while grain subsidies constitute one third of the direct payments in urban areas. This shows an important dividing line within Norwegian agriculture. Municipalities with good conditions for grain production are in Norway mainly located in urban and semi-urban areas in Eastern and Southern Norway and in the Trøndelag area (Dvergsdal 1978). Grain is also an important basis for pork and poultry production, and these enterprises are mainly located in urban areas too. Agriculture in rural areas mainly consists of dairy, livestock, and sheep farming based on grass production. We can also see this regional difference in table 13 when 93 percent of the direct payment to rural areas is given through grass-grown area support and animal support, while these two subsidies constitute 63 percent of the direct payments to urban areas. In the next table, the survey data from “Living conditions among farm families in 1995” shows the geographical distribution of agricultural production more straightforwardly. Table 14. Main farm production on farms in different areas. Percentages. Main production: Rural Semi-rural Semi-urban Urban Dairy production 45 37
35 25
Livestock production 38 40
34 23
Grain production 7 12
23 36
Other crop productiona) 7 9
6 10
Other production 3 2
3 6
Total 100 100 101 100(n=) (509) (294) (337) (211)χ2
(df = 12) = 131.431; p = 0.000 a) Included soft and hard fruits. In this table we can see that nearly half of the farmers in rural municipalities pursue dairy production, while one in four farmers in urban areas have dairy production. The distribution of grain farms show an opposite pattern; One third of the farmers in urban areas have grain as their main production, while only seven percent have this production in rural municipalities. This geographical distribution of agriculture production implies that a change in the budgetary support to a particular line of production produces different effects in different areas. There has been a political target to canalise different enterprises to areas with comparative advantages. This is done through an advanced system where each production has higher subsidies in areas where it is desirable to locate the production. Even if this system has been weakened during resent years, this canalisation of subsidies still leads to a structure where farms in rural areas have more labour intensive production than farms in urban areas. Table 13 shows only the total amount of money distributed to different regions thought direct payments. In table 15, I have divided these payments by number of farms within each area.
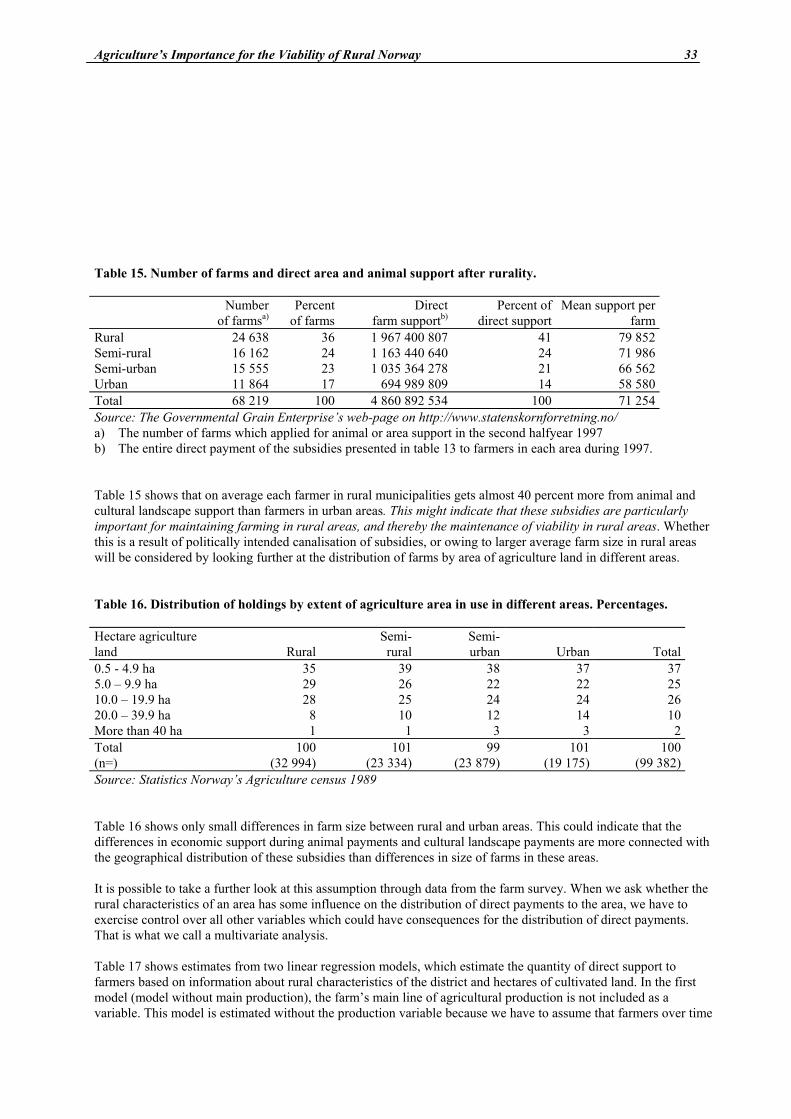
Agriculture’s Importance for the Viability of Rural Norway 33
Table 15. Number of farms and direct area and animal support after rurality. Number
of farmsa) Percent
of farms Direct
farm supportb)Percent of
direct supportMean support per
farmRural 24 638 36 1 967 400 807 41 79 852Semi-rural 16 162 24 1 163 440 640 24 71 986Semi-urban 15 555 23 1 035 364 278 21 66 562Urban 11 864 17 694 989 809 14 58 580Total 68 219 100 4 860 892 534 100 71 254Source: The Governmental Grain Enterprise’s web-page on http://www.statenskornforretning.no/ a) The number of farms which applied for animal or area support in the second halfyear 1997 b) The entire direct payment of the subsidies presented in table 13 to farmers in each area during 1997. Table 15 shows that on average each farmer in rural municipalities gets almost 40 percent more from animal and cultural landscape support than farmers in urban areas. This might indicate that these subsidies are particularly important for maintaining farming in rural areas, and thereby the maintenance of viability in rural areas. Whether this is a result of politically intended canalisation of subsidies, or owing to larger average farm size in rural areas will be considered by looking further at the distribution of farms by area of agriculture land in different areas. Table 16. Distribution of holdings by extent of agriculture area in use in different areas. Percentages. Hectare agriculture land
Rural
Semi-rural
Semi-urban
Urban Total
0.5 - 4.9 ha 35 39 38 37 375.0 – 9.9 ha 29 26 22 22 2510.0 – 19.9 ha 28 25 24 24 2620.0 – 39.9 ha 8 10 12 14 10More than 40 ha 1 1 3 3 2Total 100 101 99 101 100(n=) (32 994) (23 334) (23 879) (19 175) (99 382)Source: Statistics Norway’s Agriculture census 1989 Table 16 shows only small differences in farm size between rural and urban areas. This could indicate that the differences in economic support during animal payments and cultural landscape payments are more connected with the geographical distribution of these subsidies than differences in size of farms in these areas. It is possible to take a further look at this assumption through data from the farm survey. When we ask whether the rural characteristics of an area has some influence on the distribution of direct payments to the area, we have to exercise control over all other variables which could have consequences for the distribution of direct payments. That is what we call a multivariate analysis. Table 17 shows estimates from two linear regression models, which estimate the quantity of direct support to farmers based on information about rural characteristics of the district and hectares of cultivated land. In the first model (model without main production), the farm’s main line of agricultural production is not included as a variable. This model is estimated without the production variable because we have to assume that farmers over time

34 Agriculture’s Importance for the Viability of Rural Norway
will pursue types of production with comparative advantage for the areas they live in, and we know that agricultural production has higher subsidies in areas where it is politically desirable to locate their production. This implies that the coefficients on the three dummy variables (rural, semi-rural and semi-urban) measure amount of direct subsidies farmers in these areas receive compared with farmers in urban areas. In the first model, these subsidies are controlled for the effect of differences in farm size, and in the second model these subsidies in addition are controlled for different types of production.

Agriculture’s Importance for the Viability of Rural Norway 35
Table 17. Parameter estimates of linear regression models estimating received direct support to farmers in
different areas. Model without main production
Model with main production
Unstandardized Betas t-values p-values
Unstandardized Betas
t-values p-values
Ruralitya) Rural 27 905.78
(3 559.72)c)
7.84 0.00 9 858.86 (2 859.65)
3.45 0.00
Semi-rural 18 126.98 (3 927.18)
4.17 0.00 3 559.50 (3 114.09)
1.14 0.25
Semi-urban 13 978.61 (3 849.43)
3.63 0.00 2 454.96 (3 031.13)
0.81 0.42
Cultivated land in hectares
1 339.67 (97.38)
13.76 0.00 1239.96 (79.29)
15.64 0.00
Main productionb) Dairy 54 915.52
(3 015.42)
18.21 0.00
Livestock 24 766.74 (3 030.55)
8.17 0.00
Grain -20 342.45 (3 627.98)
-5.61 0.00
Constant 28 824.88 (3 308.56)
8.71 0.00 15 939.11 (3 425.47)
4.65 0.00
F 60.33 0.00 171.85 0.00R2 0.16 0.49 N= 1261 1261 a) Dummy variables with “Urban” as reference category b) Dummy variables with “Other productions” as reference category c) Standard errors in parenthesis The first of these models shows that farmers in rural areas receive on average nearly 30 000 NOK more in direct subsidies than farmer in urban areas, while farmers in semi-rural and semi-urban areas receive 18 000 and 14 000 more than farmers in urban areas. All these effects are pulled down in the second model, and here it is only the rural areas which are significantly different from urban areas. This indicates that even if we control for geographical differences in average farm size and agricultural production, and there are still some differences in the amount of direct distributed subsidies to rural and urban areas. This difference is an empirical manifestation of the compensation which is given to rural farmers in order to maintain the viability of rural areas. In the model with main production, we can also see that dairy farmers will on average get 55 000 more than farmers with “other production”, while grain farmers get 20 000 less than farmers with “other production”. This indicates that dairy farmer receive huge amounts of direct subsidies compared with other farmers, but this will probably not lead to more production because this production is in reality limited by quotas. In table 17, we have used dummy variables to estimate effects of different characteristics for farmers. It is also possible to simplify these effects into some more general effects of rurality, farm size and main production. In table 18, we can see the contribution of the different dummy set and variables to the explanation of variance in the amount of direct support.

36 Agriculture’s Importance for the Viability of Rural Norway
Table 18. Test of subsets of variables against the full regression model in table 17. Model without production Model with production
F p-valuesChange in
R2
F
p-values Change in
R2
Tests of subsets: Rurality 22.11 0.00 0.04 5.75 0.00 0.01 Cultivated land in hectares 189.26 0.00 0.13 244.53 0.00 0.10 Main production 272.95 0.00 0.33The full model 60.33 0.00 173.85 0.00 Here we can see that the distribution of direct support is strongly connected with area of cultivated land and production, while it is obviously less connected with the rural characteristics of areas. Even if there is a statistically significant relationship, this relation is relatively weak. This could be due to the fact that the support zones for direct payments are mainly differentiated according to ecological conditions for agriculture, and the regression estimates indicate that these zones have a relatively slight differentiation compared with the rural characteristics of the support zones. In table 19, we can see the way that direct payments are differentiated into zones, types of production and hectares of cultivated land.

Agriculture’s Importance for the Viability of Rural Norway 37
Table 19. Rates of payments per hectare through area and cultural landscape support in different zones.
NOK per hectare.
Zone Growth:
Interval (hectare) 1 2 3 4 5 6 7
Grass and turnip
0-10 10.1-25.0 25.1-40.0 over 40.0
3 600 1 950 1 300
0
2 850 1 720 1 300
0
4 020 1 950 1 300 0
5 050 2 170 1 300
0
5 600 2 320 1 300
0
6 100 2 450 1 300
0 Grain 0-40.0
›40.0 1 940 1 720
2 520 1 720
3 620 1 720
Potatoes 0-6.0 6.1-12.0 over 12.0
3 200 1 730 1 000
10 490 730
0
13 590 730
0 Vegetables 0-3.0
3.1-6.0 over 6.0
7 670 3 010 1 460
9 140 3 950 2 700
17 990 5 000 4 000
Soft and hard fruits
0-3.0 3.1-6.0 over 6.0
5 990 2 000 0
6 290 2 000 0
14 190 2 000 0
Source: Norwegian National Grain Administration 1998. In this overview, we can see that there are obviously great differences in direct payments between zones, production lines and hectares of cultivated land, but this pattern give us no information about the relation between this differentiation in zones and the rural characteristics of these support zones. In table 20, we can see the relation between these two classifications among farmers in the farm survey. Table 20. Relations between area zones and cultural landscape support and rurality. Percentages. Zone 1 2 3 4 5 6 7 Rural 5 0 4 29 50 50 52 Semi-rural 9 0 18 24 23 35 35 Semi-urban 30 29 36 29 15 11 13 Urban 57 71 42 18 12 5 0 Total 101 100 100 100 100 101 100 (N=) (44) (7) (45) (17) (233) (66) (23) Here we can see a weak but not obvious connection between zones for direct payments and rural characteristics of municipalities. Like the regression models, we can also see here that rural and urban areas are comparatively different from each other. This could indicate that a simple comparison between rural and urban areas, without semi-rural and semi-uban areas, will increase the differences between these two areas. A much more sophisticated way to do that is to show predictions of the amount of direct payments estimated from a regression model with interactions between farm size and areas. In the figure below, we can see the way that the amount of direct support increases with farm size in different areas.
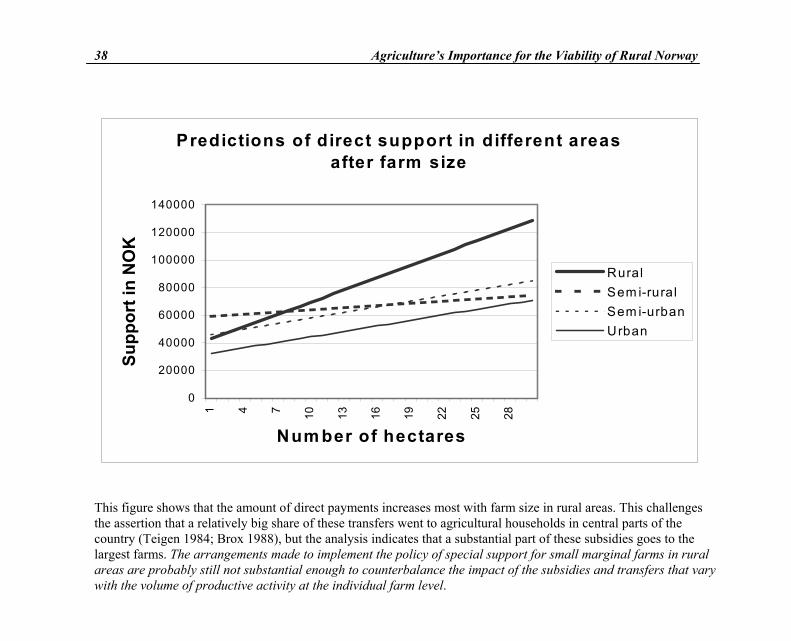
38 Agriculture’s Importance for the Viability of Rural Norway
Predictions of direct support in different areas after farm size
0
20000
40000
60000
80000
100000
120000
1400001 4 7 10 13 16 19 22 25 28
Num ber of hectares
Supp
ort i
n N
OK
RuralSem i-ruralSem i-urbanUrban
This figure shows that the amount of direct payments increases most with farm size in rural areas. This challenges the assertion that a relatively big share of these transfers went to agricultural households in central parts of the country (Teigen 1984; Brox 1988), but the analysis indicates that a substantial part of these subsidies goes to the largest farms. The arrangements made to implement the policy of special support for small marginal farms in rural areas are probably still not substantial enough to counterbalance the impact of the subsidies and transfers that vary with the volume of productive activity at the individual farm level.
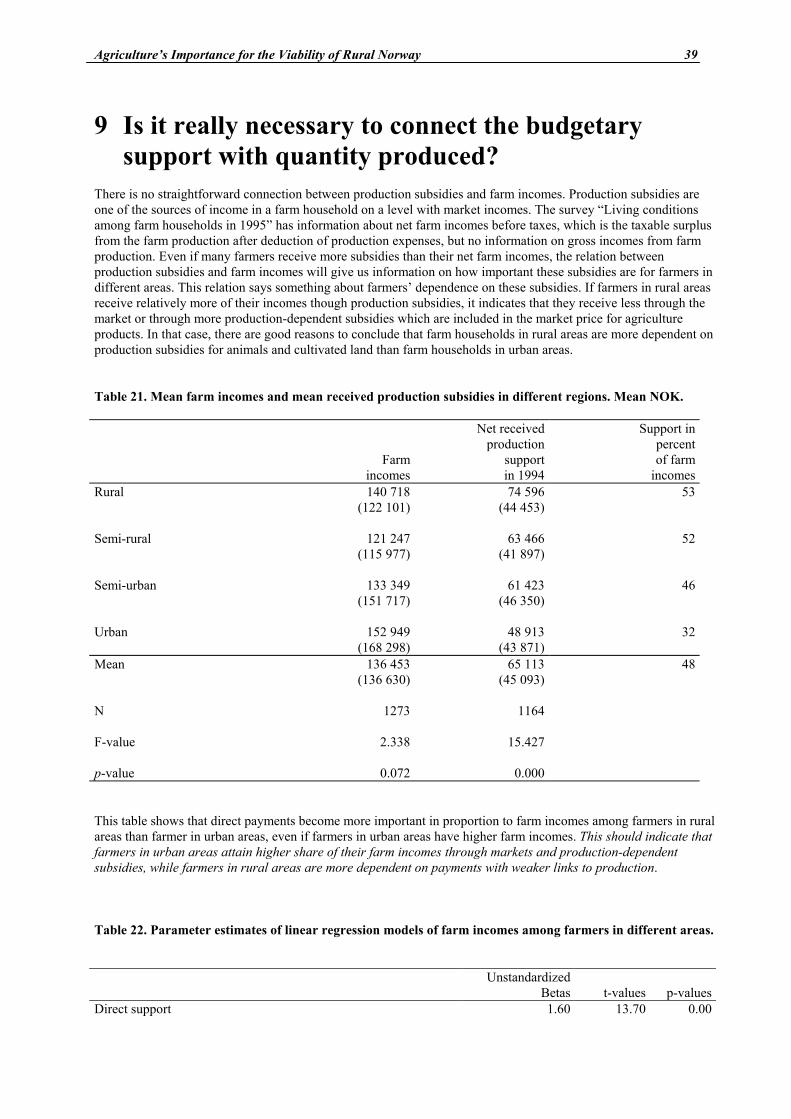
Agriculture’s Importance for the Viability of Rural Norway 39
9 Is it really necessary to connect the budgetary support with quantity produced?
There is no straightforward connection between production subsidies and farm incomes. Production subsidies are one of the sources of income in a farm household on a level with market incomes. The survey “Living conditions among farm households in 1995” has information about net farm incomes before taxes, which is the taxable surplus from the farm production after deduction of production expenses, but no information on gross incomes from farm production. Even if many farmers receive more subsidies than their net farm incomes, the relation between production subsidies and farm incomes will give us information on how important these subsidies are for farmers in different areas. This relation says something about farmers’ dependence on these subsidies. If farmers in rural areas receive relatively more of their incomes though production subsidies, it indicates that they receive less through the market or through more production-dependent subsidies which are included in the market price for agriculture products. In that case, there are good reasons to conclude that farm households in rural areas are more dependent on production subsidies for animals and cultivated land than farm households in urban areas. Table 21. Mean farm incomes and mean received production subsidies in different regions. Mean NOK.
Farmincomes
Net received production
support in 1994
Support in percent of farm
incomesRural
140 718(122 101)
74 596(44 453)
53
Semi-rural
121 247(115 977)
63 466(41 897)
52
Semi-urban
133 349(151 717)
61 423(46 350)
46
Urban
152 949(168 298)
48 913(43 871)
32
Mean
136 453(136 630)
65 113(45 093)
48
N
1273 1164
F-value
2.338 15.427
p-value 0.072 0.000 This table shows that direct payments become more important in proportion to farm incomes among farmers in rural areas than farmer in urban areas, even if farmers in urban areas have higher farm incomes. This should indicate that farmers in urban areas attain higher share of their farm incomes through markets and production-dependent subsidies, while farmers in rural areas are more dependent on payments with weaker links to production. Table 22. Parameter estimates of linear regression models of farm incomes among farmers in different areas. Unstandardized
Betas
t-values p-valuesDirect support 1.60 13.70 0.00

40 Agriculture’s Importance for the Viability of Rural Norway
(0.12)a)
Interactionsb) Additional effect of direct support in rural areas -0.56
(0.12)
-4.99 0.00
Additional effect of direct support in semi-rural areas -0.57 (0.13)
-4.56 0.00
Additional effect of direct support in semi-urban areas -0.42 (0.13)
-3.46 0.00
Cultivated land in hectares 11658 33 (223.43)
7.42 0.00
Constant 17 755.91 (4 515.32)
3.93 0.00
F 122.84 0.00R2 0.33 N= 1261 a) Standard errors in parenthesis b) Dummy variables with “Urban” as reference category, where their values are multiplied with direct support in
NOK. These additional effects are used to calibrate the main effect of direct support for non-urban areas. The three dummy variables in this regression model are estimates of the additional effects, which have to be used to calibrate the main effect of direct support for these areas. If we adjust the effect in each area, we will find that for each Norwegian krone the farmers receive in direct support, they will (independent of farmland) increase their farm incomes in the following ways: • farmers in urban areas will gain 1.60 NOK; • farmers in semi-urban areas will gain 1.18 NOK; • farmers in semi-rural areas will gain 1.01 NOK; and • farmers in rural areas will gain 1.04 NOK This calculation shows that direct support is less important for the level of farm incomes among urban farmers than rural farmers. This indicates that farmers in urban areas obtain more of their farm incomes from the market or production-dependent subsidies, than farmers in rural areas. This pattern could also indicate that an increase in direct payments through animal support and cultural landscape support can stimulate increased production in urban areas, while this will probably not be an incentive for increased production in rural areas.

Agriculture’s Importance for the Viability of Rural Norway 41
42 Agriculture’s Importance for the Viability of Rural Norway
10 Conclusions The main object in this report has been to analyse agriculture’s contribution to the viability of rural areas, and to show how this contribution can be integrated as one aspect within agriculture’s multifunctionality. The main focus has been on those micro-sociological processes within agriculture which influence the maintaining of rural settlement pattern, rural employment, and sustainable development in rural areas. In such an analysis it is also necessary to emphasise external structural changes which have influence on the individual agencies within the agriculture sector, and to integrate those exogenous and endogenous factors in a comprehensive analysis. The report starts with a historical presentation of changes in the Norwegian agrarian structure and the agricultural policy during the post-war period. In this period, the agricultural policy has not only been prepared to control food production, but has also been an important means to ensure rural development. In that way, it is warrantable to claim the Norwegian agricultural policy has focused on multifunctionality for several decades, and the agricultural policy has to some extent been legitimated through the sector’s contribution to fulfilling aims in the regional policy. The position of rural districts in the Norwegian society was analysed through a presentation of literature about Norwegian culture and Norwegian policy. This presentation indicates that it is difficult to identify particularities in the Norwegian culture which might explain or legitimate the relative high level of subsidies within Norwegian agriculture. However, most contributors in this debate emphasise the strong national identity among Norwegians, and that rural symbols have been a very important ingredient in the production of this common identity. In the present economic conjuncture, Norwegian farming is dependent of fairly amount of public subsidies because of climatic conditions, poor quality of land, hilly topography, and small farms. This unfavourable situation means that rural farming can only be maintained as long as farmers’ contribution to the whole society is perceived as positive. There is no doubt that the increase in subsidies from the mid-1970s was based on a distinctive sympathy in the public opinion. The new oil drilling in the North Sea in this period raised the state revenues, and it is obvious that the politically based distribution of this money was in accordance with the society’s sense of justice. During the last decade, national and international pressure have led to a new agricultural policy where the income target has been abandoned, and the import protection has been radically changed. It is obvious that these changes have weakened the optimism within Norwegian agriculture. The agricultural sector is (probably) the only economic sector of a certain size where we still can find a strong organisational connection between productive and reproductive activities. The connection between economic activities and social organisation at the farm level, implies that farmers’ political pressure to protect their economic base are connected to their struggle for a peculiar way of life. To push things to extremes, we can say that farmers and their political advocates, have a structural bias to seek traditional solutions. In a situation where farmers prefer the status quo policy, their political advocates have become reactive to existing problems and pressures rather than proactive towards potential problems and solutions. The general challenge for Norwegian politicians in the present situation is to develop better targeted support to rural agriculture. This analysis indicates that direct payments are particularly important for maintaining farming in rural areas, and by that the maintenance of viability in rural areas. Farmers in rural areas are more dependent on agricultural production of a certain level if they are to remain in farming, than farmers in urban areas. If the subsidies are going to be more orientated to payments for rural settlement and landscape care, and less orientated towards farm production, it is more likely that farmers in urban areas will derive benefit from this arrangement because they are more likely to maintain farming with insignificant production. Such changes would probably put many rural farmers out of business. Except for those areas with diversified economies, declining farm numbers would cause severe local consequences. Declining numbers of farm household could weaken the integration between farm and non-farm economy at the household level, which mean that part-time farms are of vital importance to the maintenance of rural agriculture and rural settlement. Decreased expenditures of remaining farm families would also threaten the viability of many local businesses and service institutions. In sum, these processes will increase the demographic imbalance in rural areas. The increase in part-time farming implies that farm household labour is also very important for non-farm economic activities in rural areas.
Agriculture’s Importance for the Viability of Rural Norway 43
It is obvious that agriculture still is an important sector in rural areas, and that budgetary support is a necessary condition to maintain rural farming. It is more problematic to decide to what extent these farm subsidies have to be connected to quantity produced. Even if it is possible to introduce non-trade concerns, like food security, environmental protection and the viability of rural areas, independent of farm production, it harder to find a system which legitimates payments for these types of production. It might be very difficult to bind such payments to proprietary rights. In Norway, the market for farmland has been strictly regulated by law in order to prevent farmland becoming a commodity. Any successor who takes over a farm, is obliged to live at the farm and operate the farm for some years. In order to maintain rural settlement, it is difficult to imagine how the production of non-trade concerns could be uncoupled from agricultural production in rural areas. If farmers are to be responsible for the future production of non-trade concerns, it is obvious that they have to farm. This report indicates that direct payments are particularly important for rural farmers, and thereby the maintenance of viability in rural areas.

44 Agriculture’s Importance for the Viability of Rural Norway
References Aanesland, N. (1992): "Kan landbruket unndra seg markedets dom?", Pp 40-51 in Simonsen, J. and Vatn, A. (eds.):
Landbruk i endring. Fra opptrapping til omstilling. Oslo: Universitetsforlaget. Aasbrenn, K. (1989): “Uttynningssamfunnet. Det demografisk uttynnede – men ikke avfolkede – utkanstsamfunn”,
Tidsskrift for Samfunnsforskning 8:509-519. Almås, R. (1985): ): Agricultural Policy in the Area of Overproduction - The Case of Norway. Paper to the Vienna
Center project "The Socio-Economic Consequences of Agricultural Modernization in Europe" (RUR IV, the meeting in GDR, 7 - 13 October)
Almås, R., K. Vik and J. Ødegård (1983): "Women in Rural Norway. Recent Tendencies in the Development of the Division of Labour in Agriculture and the Participation of Rural Women on the Labour Market", Rural Research Paper 1, Trondheim: Centre for Rural Research.
Almås, R. (1989): “Characteristics and Conflicts in Norwegian Agriculture”, Agriculture and Human Values, vol VI, No 1/2.
Almås, R. (1990): "Farm Policies and Farmer Strategies: The Case of Norway". Pp. 275-288 in: Friedland, W. (ed): Towards a New Political Economy of Agriculture. Boulder and London: Westview Press.
Almås, R. (1992): Changing Models of Agricultural Policy. From Paned Econimy to Green Liberalism. Paper to the 8th World Congress for Rural Sociology, The Pennsylvania State University, August 11-16 1992.
Almås, R. (1993): Norway’s Gift to Europe. Fifteen Selected Articles on Rural Persistence and Change. Report 2/93, Trondheim: Centre for Rural Research.
Almås, R. (1995): Bygdeutvikling. Oslo: Det Norske Samlaget. Berggreen, B. (1989): Da kulturen kom til Norge. Oslo: Aschehoug. Blekesaune, A. (1991): “Changes in Ways of Making a Living among Norwegian Farmers 1975 – 1990”,
Sociologia Ruralis Vol. XXXI-1. Blekesaune, A. and R. Almås (1992): ): "Bondehusholdets ulike strategier for å overleve". Pp. 138-164 in
Simonsen, J. and A. Vatn (eds.): Landbruk i endring - fra opptrapping til omstilling. Oslo: Universitetsforlaget.
Blekesaune, A. (1996): Family farming in Norway. An analysis of structural changes within farm households between 1975 and 1990. Dr. polit avhandling. Institutt for sosiologi og statsvitenskap. NTNU, Trondheim.
Brox, O. (1966): Hva skjer i Nord-Norge? En studie i norsk utkantpolitikk. Oslo: Pax. Brox, O. (1988): "Skaper jordbruksstøtten større likhet", NIBR-report 1988(5). Dvergsdal, O. (1978): Områdeinndeling i norsk jordbruk (Area delimitation in Norwegian Agriculture). Skrifter 31,
Bø: Telemark distrikthøgskole. Eckstein, H. (1966): Division and Cohesion in Democracy. A Study of Norway. Princeton University. Egeberg, M, J.P. Olsen and H. Sætren (1978): “Organisasjonssamfunnet og den segmenterte stat” in: Olsen, J.P.
(ed.): Politisk organisering. Bergen: Universitetsforlaget. Eriksen, T.H. (1993): Typisk norsk. Essays om kulturen i Norge. C. Huitfeldt forlag. Friedmann, H. (1978): “World market, state, and family farm: social bases of household production in a era of wage
labor.” Comparative Studies in Society and History 20:545-586. Gjerdåker, B. (1995): Bygdesamfunn i omveltning 1945-1996. vol. II. in: Hundre år for bygd og bonde 1896-1996,
Oslo: Landbruksforlaget. Hernes, G. (1983): ): Makt og styring. I det moderne Norge, bd. 5. Oslo: Gyldendal Hompland, A. (1991): “Rurbanization, Suburbia and Metropolis. Social Scenarios in Norway and Europe”, in:
Almås, R. and N. With (eds.): Rural Futures in an International World. Trondheim: Senter for bygdeforskning.
Johansen, A. (1991): ”Sjelen som forretningsidé”, Nytt Norsk Tidsskrift No 2: 99-116. Kramer, J. (1984): ”Norsk identitet – et produkt av underutvikling og stammetilhørighet”. p. 88-97 in: Klasen, A.M.
(ed.): Den norske væremåten. Antropologisk søkelys på norsk kultur. Oslo: J. W. Cappelsens Forlag. Lipset, S.M. and S. Rokkan, 1967: Party Systems and Voter Alignments. New York: The Free Press. Lowe, P. And H. Buller (1990): “The Historical and Cultural Context”, p. 5-52 in: Lowe, P. and M. Bodiguel (eds.):
Rural Studies in Britain and France. London: Belhaven Press. Mjøset, L. (1986) Norden dagen derpå: De nordiske økonomisk-politiske modellene og deres problemer på 70- og
80-tallet: Sluttrapport fra Økonomisk politikkprosjektet. Oslo: Universitetsforlaget. Nergaard, (1988): “Tingmenn og talsmenn. En analyse av stortingsrepresentantenes organisasjonskontakt med
utgangspunkt i segmenteringshypotesen”. Tidsskrift for samfunnsforskning, Vol 29. NOS (1994): Jordbruksstatistikk. Statistisk sentralbyrå. NOU (1974:26): Støtteordninger i landbruket. Norges offentlige utredninger NOU (1982:2): Maktutredningen. Sluttrapport. Norges offentlige utredninger NOU (1984:21): Statlig næringsstøtte i distriktene. Norges offentlige utredninger OECD (1992): Rural indicators. Paris: C/RUR (92) 1. OECD (1998): Agricultural Policies in OECD Countries: Monitoring and Evaluation 1998. Paris:
COM/AGR/APM/TD/WP(98)17. Polanyi, K. (1944): The Great Transformation. New York: Farrar & Rinehart.

Agriculture’s Importance for the Viability of Rural Norway 45
Reinert, E. (1997): Det tekno-økonomiske paradigmeskiftet - konsekvenser for norske distrikts og ressursbaserte næringer. Norsk Investorforum 1/97.
Rokkan, S. (1970): Citizens, Elections, Parties : Approaches to the Comparative Study of the Processes of Development. Oslo: Universitetsforlaget
Rokkan, S. (1987) Stat, nasjon, klasse. Oslo: Universitetsforlaget. Rønningen, K. (1998): Agricultural Policies and Countryside Management. A Comparative European Study. Dr.
polit avhandling. Geografisk institutt. NTNU, Trondheim. Sevatdal, H. (1980): Klynger og utflytting. Fortidsvern 2: 7-10. St.meld. 64, (1963-64): Om jordbrukspolitikken. Landbruksdepartementet. St.meld. 31, (1996-97): Om distrikts- og regionalpolitikken. Kommunal- og arbeidsdepartementet. Stræte, E.P. and R. Tobro (1987): Hvem forlater jordbruket - og hvorfor? En undersøkelse blant bruk som ble
nedlagt i perioden 1983-86. Hovedoppgave ved Institutt for landbruksøkonomi, Ås: Norges Landbrukshøgskole.
St.prp. 8, (1992-93): Landbruk i utvikling. Om retningslinjer for landbrukspolitikken og opplegget for jordbruksoppgjørene m.v. Landbruksdepartementet.
St.prp. 72, (1995-96): Jordbruksoppgjøret 1996. Administrasjonsdepartementet Teigen, H. (1984): Vil bygde-Norge overleve? Med storbukkar på bygdebeite. Lillehammer: Fagboklaget Ringsaker. Vatn, A. (1991): Landbrukspolitikk og bondeadferd. Ein studie av tilpassinga til 650 landbrukshushald frå 1975-
1990 (Agricultural Policy and the Behaviour of Farmers. A Study of 650 Agricultural Households from 1975-1990), Institutt for økonomi og samfunnsfag, Melding nr.4, Ås: NLH.
Østerud (1986): ”Nasjonalstaten Norge – en karakteriserende skisse”. p. 9-32 in: Alldén, L., N.R.Ramsøy and M. Vaa (eds.): Det norske samfunn. Oslo: Gyldendal norsk forlag.
Witoszek, N. & P. Sheeran (1992): “I pakt med naturen”, p. 183-187 in: Karlson, S. (ed.): Frihetens källa. Nordens betydelse för Europa. Stockholm: Nordisk Råd.
Appendix: Norwegian municipalities classified within the rural dimension.
Municipalities
Population density
Distance from
larger centres
Proportion in
agriculture
Proportion
of self-employed
The rural dimension
Rural groups
0101 Halden kommune 2 3 2 2 9 3
0104 Moss kommune 3 3 3 3 12 3
0105 Sarpsborg kommune 2 3 3 3 11 3
0106 Fredrikstad kommune 2 3 3 3 11 3
0111 Hvaler kommune 2 2 2 1 7 2
0118 Aremark kommune 2 0 0 0 2 0
0119 Marker kommune 2 1 0 1 4 1
0121 Rømskog kommune 0 1 0 1 2 0
0122 Trøgstad kommune 3 1 1 0 5 1
0123 Spydeberg kommune 3 2 2 1 8 2
0124 Askim kommune 3 3 3 2 11 3
0125 Eidsberg kommune 3 2 2 1 8 2
0127 Skiptvet kommune 3 1 2 1 7 2
0128 Rakkestad kommune 2 1 1 0 4 1
0135 Råde kommune 3 2 2 1 8 2
0136 Rygge kommune 3 3 3 2 11 3
0137 Våler kommune 3 2 1 1 7 2
0138 Hobøl kommune 3 2 1 2 8 2
0211 Vestby kommune 3 3 3 2 11 3
0213 Ski kommune 3 3 3 2 11 3
0214 Ås kommune 3 3 3 2 11 3
0215 Frogn kommune 3 3 3 2 11 3
0216 Nesodden kommune 3 3 3 2 11 3
0217 Oppegård kommune 3 3 3 3 12 3
0219 Bærum kommune 3 3 3 2 11 3
0220 Asker kommune 3 3 3 2 11 3
0221 Aurskog-Høland kommune 3 2 1 1 7 2
0226 Sørum kommune 3 3 2 2 10 3
0227 Fet kommune 3 3 2 2 10 3
0228 Rælingen kommune 3 3 3 2 11 3
0229 Enebakk kommune 3 3 2 2 10 3

46 Agriculture’s Importance for the Viability of Rural Norway
0230 Lørenskog kommune 3 3 3 3 12 3
0231 Skedsmo kommune 3 3 3 3 12 3
0233 Nittedal kommune 3 3 3 3 12 3
0234 Gjerdrum kommune 3 3 2 2 10 3
0235 Ullensaker kommune 3 3 3 2 11 3
0236 Nes kommune 3 2 1 2 8 2
0237 Eidsvoll kommune 3 2 2 2 9 3
0238 Nannestad kommune 3 2 1 2 8 2
0239 Hurdal kommune 3 2 0 2 7 2
0301 Oslo 3 3 3 3 12 3
0402 Kongsvinger kommune 1 2 1 2 6 2
0403 Hamar kommune 2 3 3 3 11 3
0412 Ringsaker kommune 2 2 1 2 7 2
0415 Løten kommune 2 1 1 2 6 2
0417 Stange kommune 2 2 1 2 7 2
0418 Nord-Odal kommune 2 2 1 2 7 2
0419 Sør-Odal kommune 3 2 1 1 7 2
0420 Eidskog kommune 1 1 1 1 4 1
0423 Grue kommune 1 0 0 1 2 0
0425 Åsnes kommune 1 1 0 1 3 1
0426 Våler kommune 1 1 0 1 3 1
0427 Elverum kommune 2 2 1 2 7 2
0428 Trysil kommune 0 0 0 1 1 0
0429 Åmot kommune 1 1 0 1 3 1
0430 Stor-Elvdal kommune 0 0 0 1 1 0
0432 Rendalen kommune 0 0 0 0 0 0
0434 Engerdal kommune 0 0 0 0 0 0
Municipalities
Population density
Distance from
larger centres
Proportion in
agriculture
Proportion
of self-employed
The rural dimension
Rural groups
0436 Tolga kommune 0 0 0 0 0 0
0437 Tynset kommune 0 0 0 0 0 0
0438 Alvdal kommune 0 0 0 0 0 0
0439 Folldal kommune 0 0 0 0 0 0
0441 Os kommune 0 0 0 0 0 0
0501 Lillehammer kommune 2 3 2 2 9 3
0502 Gjøvik kommune 2 2 2 2 8 2
0511 Dovre kommune 0 0 0 0 0 0
0512 Lesja kommune 0 0 0 0 0 0
0513 Skjåk kommune 0 0 0 0 0 0
0514 Lom kommune 0 0 0 0 0 0
0515 Vågå kommune 0 0 0 0 0 0
0516 Nord-Fron kommune 0 1 0 0 1 0
0517 Sel kommune 0 1 0 1 2 0
0519 Sør-Fron kommune 0 0 0 0 0 0
0520 Ringebu kommune 2 0 0 0 2 0
0521 Øyer kommune 2 1 0 0 3 1
0522 Gausdal kommune 2 0 0 0 2 0
0528 Østre Toten kommune 2 1 1 1 5 1
0529 Vestre Toten kommune 2 2 2 2 8 2
0532 Jevnaker kommune 3 2 1 1 7 2
0533 Lunner kommune 3 3 1 2 9 3
0534 Gran kommune 3 1 1 1 6 2
0536 Søndre Land kommune 2 2 0 1 5 1
0538 Nordre Land kommune 2 1 0 1 4 1
0540 Sør-Aurdal kommune 0 0 0 0 0 0
0541 Etnedal kommune 0 0 0 0 0 0
0542 Nord-Aurdal kommune 0 1 0 0 1 0
0543 Vestre Slidre kommune 0 0 0 0 0 0
0544 Øystre Slidre kommune 0 0 0 0 0 0
0545 Vang kommune 0 0 0 0 0 0
0602 Drammen kommune 3 3 3 3 12 3
0604 Kongsberg kommune 3 3 1 2 9 3
0605 Ringerike kommune 3 3 1 2 9 3
0612 Hole kommune 3 2 1 1 7 2
0615 Flå kommune 0 1 0 0 1 0
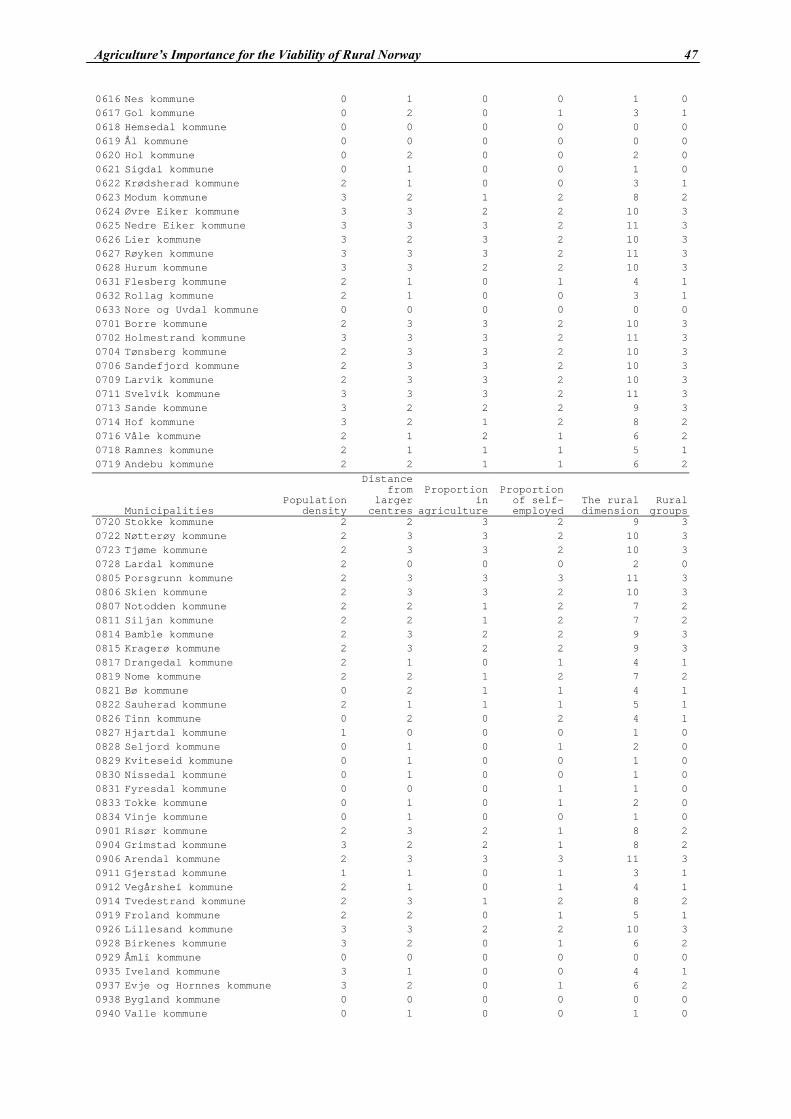
Agriculture’s Importance for the Viability of Rural Norway 47
0616 Nes kommune 0 1 0 0 1 0
0617 Gol kommune 0 2 0 1 3 1
0618 Hemsedal kommune 0 0 0 0 0 0
0619 Ål kommune 0 0 0 0 0 0
0620 Hol kommune 0 2 0 0 2 0
0621 Sigdal kommune 0 1 0 0 1 0
0622 Krødsherad kommune 2 1 0 0 3 1
0623 Modum kommune 3 2 1 2 8 2
0624 Øvre Eiker kommune 3 3 2 2 10 3
0625 Nedre Eiker kommune 3 3 3 2 11 3
0626 Lier kommune 3 2 3 2 10 3
0627 Røyken kommune 3 3 3 2 11 3
0628 Hurum kommune 3 3 2 2 10 3
0631 Flesberg kommune 2 1 0 1 4 1
0632 Rollag kommune 2 1 0 0 3 1
0633 Nore og Uvdal kommune 0 0 0 0 0 0
0701 Borre kommune 2 3 3 2 10 3
0702 Holmestrand kommune 3 3 3 2 11 3
0704 Tønsberg kommune 2 3 3 2 10 3
0706 Sandefjord kommune 2 3 3 2 10 3
0709 Larvik kommune 2 3 3 2 10 3
0711 Svelvik kommune 3 3 3 2 11 3
0713 Sande kommune 3 2 2 2 9 3
0714 Hof kommune 3 2 1 2 8 2
0716 Våle kommune 2 1 2 1 6 2
0718 Ramnes kommune 2 1 1 1 5 1
0719 Andebu kommune 2 2 1 1 6 2
Municipalities
Population density
Distance from
larger centres
Proportion in
agriculture
Proportion
of self-employed
The rural dimension
Rural groups
0720 Stokke kommune 2 2 3 2 9 3
0722 Nøtterøy kommune 2 3 3 2 10 3
0723 Tjøme kommune 2 3 3 2 10 3
0728 Lardal kommune 2 0 0 0 2 0
0805 Porsgrunn kommune 2 3 3 3 11 3
0806 Skien kommune 2 3 3 2 10 3
0807 Notodden kommune 2 2 1 2 7 2
0811 Siljan kommune 2 2 1 2 7 2
0814 Bamble kommune 2 3 2 2 9 3
0815 Kragerø kommune 2 3 2 2 9 3
0817 Drangedal kommune 2 1 0 1 4 1
0819 Nome kommune 2 2 1 2 7 2
0821 Bø kommune 0 2 1 1 4 1
0822 Sauherad kommune 2 1 1 1 5 1
0826 Tinn kommune 0 2 0 2 4 1
0827 Hjartdal kommune 1 0 0 0 1 0
0828 Seljord kommune 0 1 0 1 2 0
0829 Kviteseid kommune 0 1 0 0 1 0
0830 Nissedal kommune 0 1 0 0 1 0
0831 Fyresdal kommune 0 0 0 1 1 0
0833 Tokke kommune 0 1 0 1 2 0
0834 Vinje kommune 0 1 0 0 1 0
0901 Risør kommune 2 3 2 1 8 2
0904 Grimstad kommune 3 2 2 1 8 2
0906 Arendal kommune 2 3 3 3 11 3
0911 Gjerstad kommune 1 1 0 1 3 1
0912 Vegårshei kommune 2 1 0 1 4 1
0914 Tvedestrand kommune 2 3 1 2 8 2
0919 Froland kommune 2 2 0 1 5 1
0926 Lillesand kommune 3 3 2 2 10 3
0928 Birkenes kommune 3 2 0 1 6 2
0929 Åmli kommune 0 0 0 0 0 0
0935 Iveland kommune 3 1 0 0 4 1
0937 Evje og Hornnes kommune 3 2 0 1 6 2
0938 Bygland kommune 0 0 0 0 0 0
0940 Valle kommune 0 1 0 0 1 0

48 Agriculture’s Importance for the Viability of Rural Norway
0941 Bykle kommune 0 3 0 2 5 1
1001 Kristiansand kommune 3 3 3 3 12 3
1002 Mandal kommune 3 3 2 2 10 3
1003 Farsund kommune 0 2 2 2 6 2
1004 Flekkefjord kommune 1 2 1 2 6 2
1014 Vennesla kommune 3 3 2 2 10 3
1017 Songdalen kommune 3 2 1 1 7 2
1018 Søgne kommune 3 3 2 2 10 3
1021 Marnardal kommune 3 0 0 0 3 1
1026 Åseral kommune 0 0 0 0 0 0
1027 Audnedal kommune 3 0 0 0 3 1
1029 Lindesnes kommune 3 1 1 0 5 1
1032 Lyngdal kommune 1 2 1 1 5 1
1034 Hægebostad kommune 0 0 0 0 0 0
1037 Kvinesdal kommune 1 2 0 1 4 1
1046 Sirdal kommune 0 1 0 1 2 0
1101 Eigersund kommune 1 2 1 2 6 2
1102 Sandnes kommune 3 3 3 2 11 3
1103 Stavanger kommune 3 3 3 3 12 3
1106 Haugesund kommune 2 3 3 2 10 3
1111 Sokndal kommune 1 2 1 1 5 1
1112 Lund kommune 1 1 0 1 3 1
1114 Bjerkreim kommune 3 0 0 0 3 1
1119 Hå kommune 3 0 2 1 6 2
1120 Klepp kommune 3 0 3 1 7 2
1121 Time kommune 3 1 3 2 9 3
1122 Gjesdal kommune 3 2 1 2 8 2
Municipalities
Population density
Distance from
larger centres
Proportion in
agriculture
Proportion
of self-employed
The rural dimension
Rural groups
1124 Sola kommune 3 2 3 2 10 3
1127 Randaberg kommune 3 2 3 2 10 3
1129 Forsand kommune 3 0 0 0 3 1
1130 Strand kommune 3 2 2 2 9 3
1133 Hjelmeland kommune 0 0 0 0 0 0
1134 Suldal kommune 0 0 0 0 0 0
1135 Sauda kommune 0 3 1 2 6 2
1141 Finnøy kommune 3 0 1 0 4 1
1142 Rennesøy kommune 3 0 2 0 5 1
1144 Kvitsøy kommune 0 0 3 0 3 1
1145 Bokn kommune 3 0 1 0 4 1
1146 Tysvær kommune 2 0 1 1 4 1
1149 Karmøy kommune 2 2 3 2 9 3
1151 Utsira kommune 0 0 2 1 3 1
1154 Vindafjord kommune 0 0 1 0 1 0
1201 Bergen kommune 3 3 3 3 12 3
1211 Etne kommune 0 0 0 0 0 0
1214 Ølen kommune 0 0 1 0 1 0
1216 Sveio kommune 2 1 1 1 5 1
1219 Bømlo kommune 0 2 2 2 6 2
1221 Stord kommune 1 3 3 2 9 3
1222 Fitjar kommune 0 1 1 1 3 1
1223 Tysnes kommune 0 1 1 1 3 1
1224 Kvinnherad kommune 0 1 1 2 4 1
1227 Jondal kommune 0 0 0 1 1 0
1228 Odda kommune 1 3 0 3 7 2
1231 Ullensvang herad 0 0 0 0 0 0
1232 Eidfjord kommune 0 2 0 1 3 1
1233 Ulvik herad 0 0 0 0 0 0
1234 Granvin herad 0 0 0 1 1 0
1235 Voss kommune 1 1 0 1 3 1
1238 Kvam herad 0 1 1 2 4 1
1241 Fusa kommune 3 0 0 1 4 1
1242 Samnanger kommune 3 2 0 2 7 2
1243 Os kommune 3 3 3 3 12 3
1244 Austevoll kommune 0 0 2 2 4 1
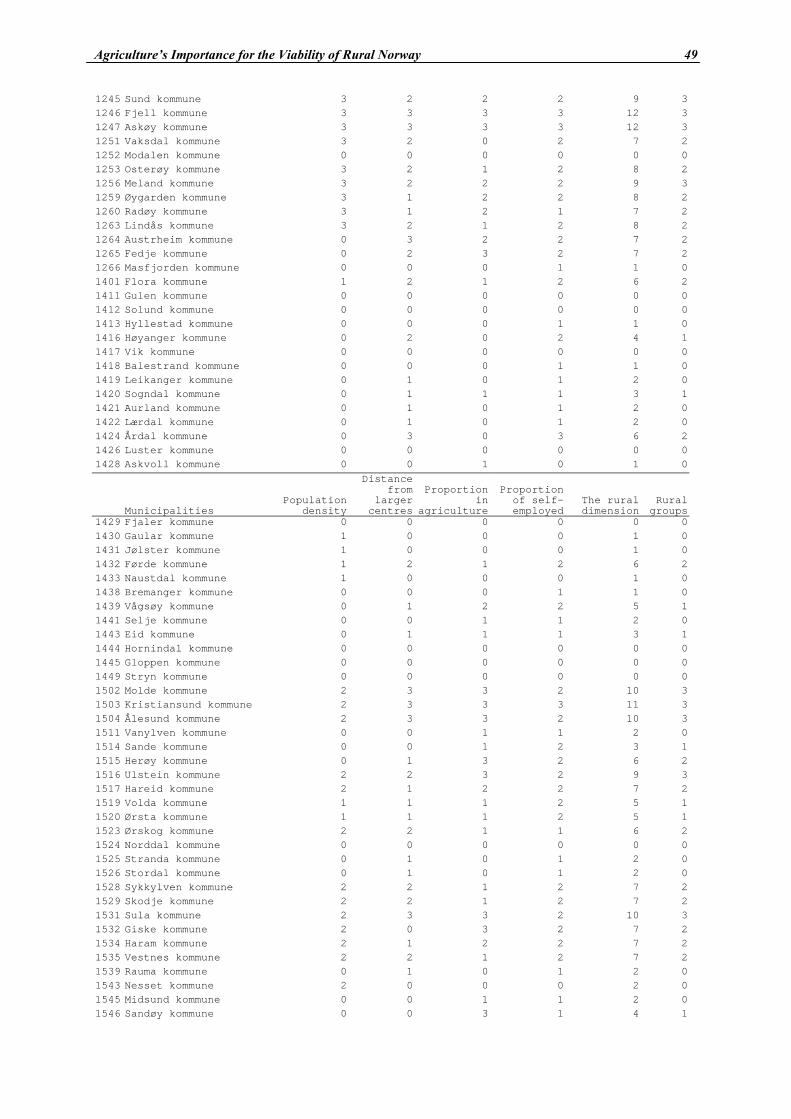
Agriculture’s Importance for the Viability of Rural Norway 49
1245 Sund kommune 3 2 2 2 9 3
1246 Fjell kommune 3 3 3 3 12 3
1247 Askøy kommune 3 3 3 3 12 3
1251 Vaksdal kommune 3 2 0 2 7 2
1252 Modalen kommune 0 0 0 0 0 0
1253 Osterøy kommune 3 2 1 2 8 2
1256 Meland kommune 3 2 2 2 9 3
1259 Øygarden kommune 3 1 2 2 8 2
1260 Radøy kommune 3 1 2 1 7 2
1263 Lindås kommune 3 2 1 2 8 2
1264 Austrheim kommune 0 3 2 2 7 2
1265 Fedje kommune 0 2 3 2 7 2
1266 Masfjorden kommune 0 0 0 1 1 0
1401 Flora kommune 1 2 1 2 6 2
1411 Gulen kommune 0 0 0 0 0 0
1412 Solund kommune 0 0 0 0 0 0
1413 Hyllestad kommune 0 0 0 1 1 0
1416 Høyanger kommune 0 2 0 2 4 1
1417 Vik kommune 0 0 0 0 0 0
1418 Balestrand kommune 0 0 0 1 1 0
1419 Leikanger kommune 0 1 0 1 2 0
1420 Sogndal kommune 0 1 1 1 3 1
1421 Aurland kommune 0 1 0 1 2 0
1422 Lærdal kommune 0 1 0 1 2 0
1424 Årdal kommune 0 3 0 3 6 2
1426 Luster kommune 0 0 0 0 0 0
1428 Askvoll kommune 0 0 1 0 1 0
Municipalities
Population density
Distance from
larger centres
Proportion in
agriculture
Proportion
of self-employed
The rural dimension
Rural groups
1429 Fjaler kommune 0 0 0 0 0 0
1430 Gaular kommune 1 0 0 0 1 0
1431 Jølster kommune 1 0 0 0 1 0
1432 Førde kommune 1 2 1 2 6 2
1433 Naustdal kommune 1 0 0 0 1 0
1438 Bremanger kommune 0 0 0 1 1 0
1439 Vågsøy kommune 0 1 2 2 5 1
1441 Selje kommune 0 0 1 1 2 0
1443 Eid kommune 0 1 1 1 3 1
1444 Hornindal kommune 0 0 0 0 0 0
1445 Gloppen kommune 0 0 0 0 0 0
1449 Stryn kommune 0 0 0 0 0 0
1502 Molde kommune 2 3 3 2 10 3
1503 Kristiansund kommune 2 3 3 3 11 3
1504 Ålesund kommune 2 3 3 2 10 3
1511 Vanylven kommune 0 0 1 1 2 0
1514 Sande kommune 0 0 1 2 3 1
1515 Herøy kommune 0 1 3 2 6 2
1516 Ulstein kommune 2 2 3 2 9 3
1517 Hareid kommune 2 1 2 2 7 2
1519 Volda kommune 1 1 1 2 5 1
1520 Ørsta kommune 1 1 1 2 5 1
1523 Ørskog kommune 2 2 1 1 6 2
1524 Norddal kommune 0 0 0 0 0 0
1525 Stranda kommune 0 1 0 1 2 0
1526 Stordal kommune 0 1 0 1 2 0
1528 Sykkylven kommune 2 2 1 2 7 2
1529 Skodje kommune 2 2 1 2 7 2
1531 Sula kommune 2 3 3 2 10 3
1532 Giske kommune 2 0 3 2 7 2
1534 Haram kommune 2 1 2 2 7 2
1535 Vestnes kommune 2 2 1 2 7 2
1539 Rauma kommune 0 1 0 1 2 0
1543 Nesset kommune 2 0 0 0 2 0
1545 Midsund kommune 0 0 1 1 2 0
1546 Sandøy kommune 0 0 3 1 4 1
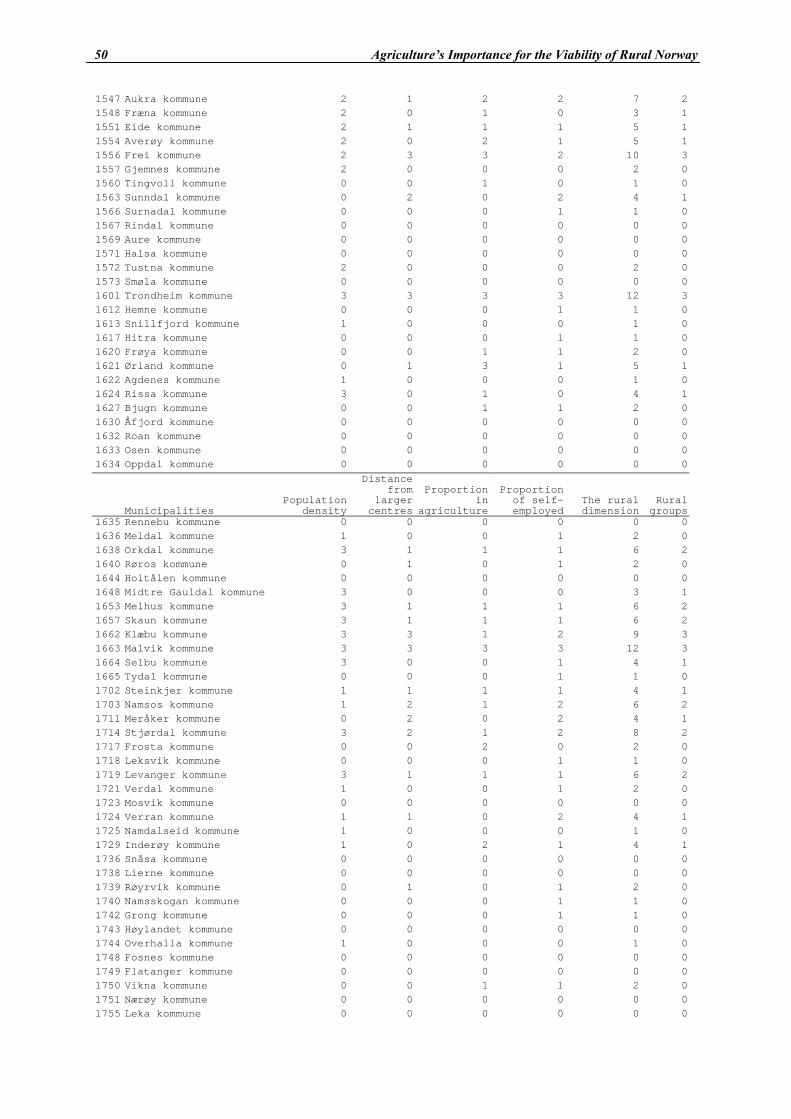
50 Agriculture’s Importance for the Viability of Rural Norway
1547 Aukra kommune 2 1 2 2 7 2
1548 Fræna kommune 2 0 1 0 3 1
1551 Eide kommune 2 1 1 1 5 1
1554 Averøy kommune 2 0 2 1 5 1
1556 Frei kommune 2 3 3 2 10 3
1557 Gjemnes kommune 2 0 0 0 2 0
1560 Tingvoll kommune 0 0 1 0 1 0
1563 Sunndal kommune 0 2 0 2 4 1
1566 Surnadal kommune 0 0 0 1 1 0
1567 Rindal kommune 0 0 0 0 0 0
1569 Aure kommune 0 0 0 0 0 0
1571 Halsa kommune 0 0 0 0 0 0
1572 Tustna kommune 2 0 0 0 2 0
1573 Smøla kommune 0 0 0 0 0 0
1601 Trondheim kommune 3 3 3 3 12 3
1612 Hemne kommune 0 0 0 1 1 0
1613 Snillfjord kommune 1 0 0 0 1 0
1617 Hitra kommune 0 0 0 1 1 0
1620 Frøya kommune 0 0 1 1 2 0
1621 Ørland kommune 0 1 3 1 5 1
1622 Agdenes kommune 1 0 0 0 1 0
1624 Rissa kommune 3 0 1 0 4 1
1627 Bjugn kommune 0 0 1 1 2 0
1630 Åfjord kommune 0 0 0 0 0 0
1632 Roan kommune 0 0 0 0 0 0
1633 Osen kommune 0 0 0 0 0 0
1634 Oppdal kommune 0 0 0 0 0 0
Municipalities
Population density
Distance from
larger centres
Proportion in
agriculture
Proportion
of self-employed
The rural dimension
Rural groups
1635 Rennebu kommune 0 0 0 0 0 0
1636 Meldal kommune 1 0 0 1 2 0
1638 Orkdal kommune 3 1 1 1 6 2
1640 Røros kommune 0 1 0 1 2 0
1644 Holtålen kommune 0 0 0 0 0 0
1648 Midtre Gauldal kommune 3 0 0 0 3 1
1653 Melhus kommune 3 1 1 1 6 2
1657 Skaun kommune 3 1 1 1 6 2
1662 Klæbu kommune 3 3 1 2 9 3
1663 Malvik kommune 3 3 3 3 12 3
1664 Selbu kommune 3 0 0 1 4 1
1665 Tydal kommune 0 0 0 1 1 0
1702 Steinkjer kommune 1 1 1 1 4 1
1703 Namsos kommune 1 2 1 2 6 2
1711 Meråker kommune 0 2 0 2 4 1
1714 Stjørdal kommune 3 2 1 2 8 2
1717 Frosta kommune 0 0 2 0 2 0
1718 Leksvik kommune 0 0 0 1 1 0
1719 Levanger kommune 3 1 1 1 6 2
1721 Verdal kommune 1 0 0 1 2 0
1723 Mosvik kommune 0 0 0 0 0 0
1724 Verran kommune 1 1 0 2 4 1
1725 Namdalseid kommune 1 0 0 0 1 0
1729 Inderøy kommune 1 0 2 1 4 1
1736 Snåsa kommune 0 0 0 0 0 0
1738 Lierne kommune 0 0 0 0 0 0
1739 Røyrvik kommune 0 1 0 1 2 0
1740 Namsskogan kommune 0 0 0 1 1 0
1742 Grong kommune 0 0 0 1 1 0
1743 Høylandet kommune 0 0 0 0 0 0
1744 Overhalla kommune 1 0 0 0 1 0
1748 Fosnes kommune 0 0 0 0 0 0
1749 Flatanger kommune 0 0 0 0 0 0
1750 Vikna kommune 0 0 1 1 2 0
1751 Nærøy kommune 0 0 0 0 0 0
1755 Leka kommune 0 0 0 0 0 0

Agriculture’s Importance for the Viability of Rural Norway 51
1804 Bodø kommune 2 3 2 3 10 3
1805 Narvik kommune 2 3 0 3 8 2
1811 Bindal kommune 0 0 0 0 0 0
1812 Sømna kommune 1 0 1 0 2 0
1813 Brønnøy kommune 1 1 0 1 3 1
1815 Vega kommune 0 0 0 0 0 0
0
0
0
1
2
0
1
2
1816 Vevelstad kommune 0 0 0 0 0 0
1818 Herøy kommune 0 0 2 1 3 1
1820 Alstahaug kommune 1 2 1 2 6 2
1822 Leirfjord kommune 1 0 0 0 1
1824 Vefsn kommune 1 2 0 2 5 1
1825 Grane kommune 0 0 0 1 1 0
1826 Hattfjelldal kommune 0 0 0 0 0
1827 Dønna kommune 0 0 0 0 0 0
1828 Nesna kommune 0 0 0 0 0
1832 Hemnes kommune 2 1 0 1 4
1833 Rana kommune 2 3 0 2 7
1834 Lurøy kommune 0 0 0 0 0 0
1835 Træna kommune 0 0 2 0 2 0
1836 Rødøy kommune 0 0 0 0 0 0
1837 Meløy kommune 0 1 0 2 3 1
1838 Gildeskål kommune 0 0 0 1 1 0
1839 Beiarn kommune 0 0 0 0 0
1840 Saltdal kommune 1 2 0 2 5
1841 Fauske kommune 1 3 0 2 6
1842 Skjerstad kommune 0 0 0 0 0 0
1845 Sørfold kommune 1 2 0 2 5 1
Population density
Municipalities
Distance from
larger centres
Proportion in
agriculture
Proportion
of self-employed
The rural dimension
Rural groups
1848 Steigen kommune 0 0 0 0 0 0
1849 Hamarøy kommune 0 1 0 1
0
0
2
0
2
1
0
1
2 0
1850 Tysfjord kommune 0 2 0 1 3 1
1851 Lødingen kommune 0 2 0 1 3 1
1852 Tjeldsund kommune 2 2 0 2 6 2
1853 Evenes kommune 0 2 0 2 4 1
1854 Ballangen kommune 0 2 0 1 3 1
1856 Røst kommune 0 0 3 0 3 1
1857 Værøy kommune 0 0 2 2 0
1859 Flakstad kommune 0 0 0 0 0 0
1860 Vestvågøy kommune 0 0 1 1 0
1865 Vågan kommune 1 2 1 2 6 2
1866 Hadsel kommune 0 1 1 4 1
1867 Bø kommune 0 0 1 1 0
1868 Kksnes kommune 0 0 1 1 2 0
1870 Sortland kommune 0 1 2 5 1
1871 Andøy kommune 0 1 0 2 3 1
1874 Moskenes kommune 0 0 1 0 1 0
1901 Harstad kommune 2 3 3 2 10 3
1902 Tromsø kommune 3 3 1 2 9 3
1911 Kvæfjord kommune 2 1 0 1 4
1913 Skånland kommune 2 2 0 2 6 2
1915 Bjarkøy kommune 0 0 0 0 0 0
1917 Ibestad kommune 0 0 0 1 1 0
1919 Gratangen kommune 0 2 0 1 3 1
1920 Lavangen kommune 0 2 0 1 3 1
1922 Bardu kommune 0 2 0 2 4 1
1923 Salangen kommune 0 1 0 1 2
1924 Målselv kommune 0 2 0 2 4 1
1925 Sørreisa kommune 0 3 0 2 5
1926 Dyrøy kommune 0 0 0 1 1 0
1927 Tranøy kommune 0 0 0 1 1 0
1928 Torsken kommune 0 0 0 0 0 0
1929 Berg kommune 0 0 0 1 1 0
1931 Lenvik kommune 0 2 1 2 5 1
1933 Balsfjord kommune 0 0 0 1 1 0
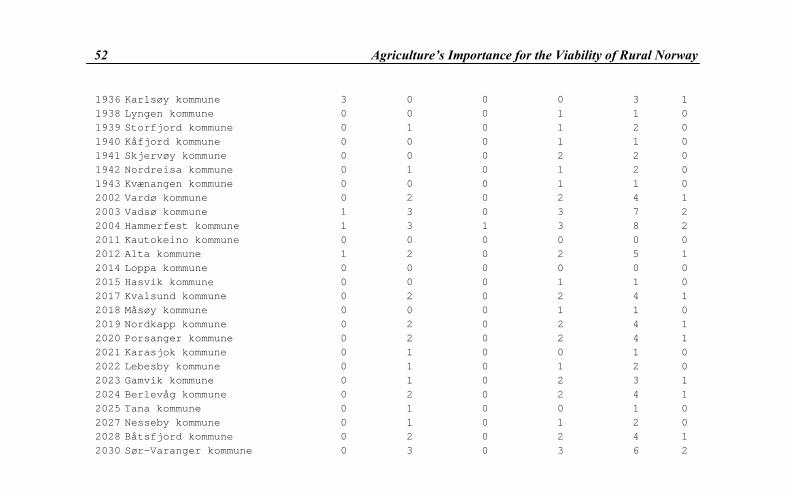
52 Agriculture’s Importance for the Viability of Rural Norway
1936 Karlsøy kommune 3 0 0 0 3 1
0
0
0
0
0
1
0
1
0
1
2
1938 Lyngen kommune 0 0 0 1 1
1939 Storfjord kommune 0 1 0 1 2
1940 Kåfjord kommune 0 0 0 1 1 0
1941 Skjervøy kommune 0 0 0 2 2
1942 Nordreisa kommune 0 1 0 1 2
1943 Kvænangen kommune 0 0 0 1 1
2002 Vardø kommune 0 2 0 2 4
2003 Vadsø kommune 1 3 0 3 7 2
2004 Hammerfest kommune 1 3 1 3 8 2
2011 Kautokeino kommune 0 0 0 0 0
2012 Alta kommune 1 2 0 2 5
2014 Loppa kommune 0 0 0 0 0 0
2015 Hasvik kommune 0 0 0 1 1
2017 Kvalsund kommune 0 2 0 2 4 1
2018 Måsøy kommune 0 0 0 1 1 0
2019 Nordkapp kommune 0 2 0 2 4 1
2020 Porsanger kommune 0 2 0 2 4 1
2021 Karasjok kommune 0 1 0 0 1 0
2022 Lebesby kommune 0 1 0 1 2 0
2023 Gamvik kommune 0 1 0 2 3 1
2024 Berlevåg kommune 0 2 0 2 4
2025 Tana kommune 0 1 0 0 1 0
2027 Nesseby kommune 0 1 0 1 2 0
2028 Båtsfjord kommune 0 2 0 2 4 1
2030 Sør-Varanger kommune 0 3 0 3 6