validation of non-destructive testing techniques for
TRANSCRIPT
Validation of non-destructive testing techniques foradditive manufacturing
Joana [email protected]
Instituto Superior Tecnico, Universidade de Lisboa, Portugal
November 2019
Abstract
This work consolidates the application of both eddy current (EC) and ultrasonic (UT) techniques forthe in-line inspection of defects on large Wire Arc Additive Manufacturing (WAAM) steel parts. WAAMtechnology is being recognized as one of the most cost-effective manufacturing processes for large partproduction in industries such as aerospace, oil and gas, architecture, renewable energies, among others.However, before WAAM can be successfully implemented in these sectors, non-destructive testing (NDT)systems must be developed in order to produce quality assured finished components.
Carbon-steel lacks investigation in the WAAM NDT field as progress on this topic was achieved mainlyon allumium. This material faces many inspection challenges due to its ferromagnetic proprieties, surfacetexture and high temperatures during deposition. Regarding EC, a new customized probe was developedto reach higher penetration depths than its predecessors and overcome the magnetic limitations. In the UTfield, a realistic computational model for phased array UT (PAUT) was designed to evaluate the wavinesseffect on defect detectability, which was experimentally validated. Moreover, the effect of using solderpaste as UT couplant for high temperature inspection was also studied.
Experimental outcomes show the potential of both inspection methods for being used complementaryin both non-ferromagnetic and ferromagnetic materials depending on part geometry. Both EC and UTtechniques were able to detect defects on the required depths and the solder paste showed great potentialto be used as a couplant on a realistic inspection scenario.Keywords: Wire and arc additive manufacturing, non-destructive-testing, eddy current testing, ultrasonictesting.
1. IntroductionAdditive Manufacturing (AM) is a technique inwhich parts are built layer by layer. This process isincreasingly gaining relevance in the manufactur-ing industry and holds the potential to completelychange the way products are designed and builtin sectors such as aerospace, oil and gas, archi-tecture, renewable energies, among others. Com-pared to other AM techniques for metals, Wire ArcAdditive Manufacturing (WAAM) seems to be ”oneof the most promising techniques for fabricatinglarge components with moderate complexity andrelatively low costs”, according to [4]. However,significant research is still required to reach reli-able industrial implementation for part production.Before this technology becomes standard, one ofthe main aspects to address is the developmentof non-destructive techniques (NDT) to assure thequality of the parts produced.
According to [2], both ultrasonic (UT) and eddycurrent (EC) techniques have been identified hashaving the potential to be used in the in-line inspec-
tion of AM metal parts fabricated using WAAM.However, most of this previous research was cen-tred on aluminium. On the other hand, carbon steelis one of the most accessible metals in the AMprinting market, and can be used under differenttypes of alloys making it highly attractive for indus-tries with their own requirements. However, thismaterial faces many inspection challenges due toits ferromagnetic proprieties, surface texture andhigh temperatures during deposition [5, 8]. Thatbeing said, the main focus of this work was the con-solidation of the mentioned NDT techniques for thecase of steel, as the use of this material impliessurpassing many technological challenges beforeproper inspection.
2. Manufacture and characterization of samples
Before being able to evaluate the different NDTtechniques, WAAM walls were deposited on the topof a substrate plate using ER70S-6 carbon-steelweld wire. Cold Metal Transfer (CMT) was usedas the arc welding process, which is a modified
1

GMAW variant that ”relies on controlled dip trans-fer mode mechanism to provide beads with goodquality, lower thermal heat input and nearly withoutspatter”, according to [6]. The motion of the torchwas provided by a six-axis Kuka Robot.
The deposition parameters were selected in or-der to ensure structural integrity and overall ac-ceptable surface texture in order to benefit inspec-tion. The systematic procedure was conductedusing a oscillation deposition strategy varying theWire Feed Speed (WFS) and WFS/Travel Speed(TS) ratio. The addition of this last term servesto control the added material per unit length.The samples’ microstrure was checked and radio-graphic testing was performed to ensure no defectswere created during deposition.
Although most samples had an acceptable tex-ture to the unaided eye, it is of great interest to min-imize it as much as possible in order to avoid theextra step of machining the top of the walls. Withthis objective in mind, a triangular weaving depo-sition strategy was attempted, where the weldingtorch swings along the leading line. In the robotprogramming, there were two main parameters forthe weaving motion of the torch, namely, amplitude(Wa) and weave length (Wl). Increasing these pa-rameters leads to a more ”spread” bead as increas-ing the Wa transversely stretches the welding poolwhile increasing the Wl tends to extend it. Thisleads to a flatter welding bead with a decreasedcontact angle. After optimizing the mentioned pa-rameters, a Stil Initial chromatic confocal sensorwas used to measure texture. A 1-D median filteron MATLAB was applied to the acquired data toreduce the noisesome results, which consequentlyreduced part of the roughness variations, meaningthat the graphs obtained are an approximation ofthe waviness profile. Figure 1 shows the obtainedresults compared with the oscillation samples man-ufactured with the same welding parameters.
This results permitted to conclude that the tri-angular weaving deposition was beneficial for thesamples’ waviness when compared to the oscilla-tion strategy. However, one can also see that thebest results were obtained for the lowest WFS. Ac-cording to [9], this can be explained by the factthat an increase of WFS tends to decrease surfacequality due to the combining effects of the layerheight and arc force.
Finally, the microstructure of the samples wasanalysed and no defects were detected. Bothweaving and oscillation samples shared identicalmicroconstituents on equivalent portions of thesamples along with simillar grain size.
Identical samples to figure 1 a) and b) were usedfor the EC and UT inspection respectively.
Figure 1: Weaving influence on waviness for different weldingparameters: a) WFS = 3 m/min, WFS/TS = 10; b) WFS = 7m/min, WFS/TS = 40.
3. Non-destructive testing techniques3.1. Eddy Current testingThe development of customized EC IOnic probes[1] proved to surpass the limitations of its commer-cial predecessors when considering the in-line in-spection of aluminium WAAM samples. Althoughthese preliminary results represented an importantstep towards the development of NDT systems forWAAM, its important to access the capabilities ofthis inspection technique in steel and other ferro-magnetic materials.
Materials which possess a high relative perme-ability value, µr � 1, are called ferromagnetic ma-terials because of their own innate ability to ex-hibit magnetic effects. In contrast to other sub-stances, ferromagnetic materials are magnetizedeasily and in strong magnetic fields the magnetiza-tion does not return to its original value - hystere-sis. In figure 2 one can see the standard depth ofpenetration, δ [m] which is presented as:
δ(f,µ,σ) =1√
π · f · µ · σ(1)
Where f [Hz] is the excitation frequency used,µ [H/m] is the magnetic permeability of the testedmaterial, and σ [S/m] the electrical conductiv-ity. Two different materials were considered: alu-minium, with σ ≈ 30% IACS and µ = 1 H/m; mild-steel with σ ≈ 5% IACS and µ = 2000 H/m .
Although the values of µ and σ used were merelyexamples as both can vary depending on sev-eral conditions, one can observe that the standarddepth of penetration in steel is almost 95% less thatin aluminium due to the ferromagnetic character-istics of the first, confirming the importance of themagnetic characteristics for the effectiveness of theECT method.
2

Figure 2: Standard penetration of aluminum (a) and mild-steel(b) in function of the frequency used.
The previously developed IOnic #3 probe [1] wasput to test on a steel bar with a 3 mm diameterdriller hole, 2 mm under the top surface. Althoughit detected the defect, the SNR was low and the re-sults weren’t as satisfactory as the previously ob-tained in aluminium. For this reason it was decidedto further investigate on different EC Ionic probedesigns and working principles, with the objectiveof developing a more promising model for the in-line inspection of WAAM steel parts.
3.1.1 Probe development
With the purpose of detecting internal defects inWAAM samples and improving the SNR while in-specting ferromagnetic materials: the SidewaysExcitation Probe (SEP) was developed. This cus-tomized probe was designed under the hypothesisthat an higher perturbation of the EC field wouldbe achieved by having two ferrite cored excitationcoils, one on each side of the sample, with thewinding in the same direction. To back up thisnew design, numerical simulations based on finiteelement analysis (FEA) were performed to solveand illustrate the electromagnetic phenomena ofthe EC probes. The software used was ANSYSElectronics – Maxwell 3D.
The selected material for steel bar was steel witha bulk conductivity of 5.86 x 10⁻⁶ s/m and relativepermeability of 3000 (the B-H curve effect was ne-glected). The bar had some curvature to its topsurface in order to approximate the model to a typ-ical WAAM surface, while ignoring the texture tosimplify the analysis. The defect was a 350 µm x5 mm (XZ) rectangle that went through all of thesamples’ width in the y direction. The results ofthis simulation for a frequency of 1 kHz are shownon figure 3.
(a) Steel bar without defect.
(b) Steel bar with 350 µm x 5 mm (XZ) rectangular defectthrough widht.
Figure 3: The magnitude of the component Y of the field ~J inthe XZ plane for SEP probe using f = 1 kHz.
One can observe that the current density is fo-cused all around the laterals and the top of thesample. The defect is clearly perturbed the EC flowas expected since this probe configuration concen-trates the EC on the laterals of the bar. Due tothe promising simulation results, a prototype of theSEP probe was 3D printed in Polylactic Acid (PLA)and the molds for the sensitive coils were madeof Polyvinyl Alcohol (PVA), a water-soluble poly-mer that is dissolved after the sensitive coil windingaround the mold is completed. The cores of the ex-citation coils were made of ferrite cylinders with 4mm diameter. Two PLA screws were added for thepossibility to adapt the gap between the excitationcoils to the width of the inspection sample. Thisalso allows to adapt the angle between the exci-tation and sensitive coils. The final design can beseen in figure 4.
Figure 4: SEP probe final design. Dimensions in cm.
Similar to the simulation, the sensitive coils were40 turns each wound up in opposite directions and
3

the excitation coils had both 200 turns wound upin the same direction. The SEP probes have a re-flection absolution configuration therefore it is ex-pected that a defect is signalized by only one peak.
Wire electrical discharge machining (WEDM)was used to create a 350 µm x 5 mm defect, iden-tical to the last simulation. The slot’s top was 2 mmbelow the surface of the sample and went through-out all of the wall’s width, as shown on figure 5.
Figure 5: ECT results for defect 350 µm x 5 mm defect.
It can be observed that the probe detects the de-fect as a peak in the impedance is clear on the x= 50 mm mark. These results were accomplishedby using a frequency of 1 kHz and a gain of 75 dB.After the successful result, this probe configurationwas challenged by attempting to inspect an inter-nal defect. To do so, the last WEDM defect wasclosed by welding each side of the WAAM wall us-ing Tungsten Inert Gas (TIG). Chalk powder, a non-conductive material, was placed inside the slot be-fore closing it. Radiographic testing was performedin order to verify if the defect was still present afterthe welding procedure.
The internal defect was then inspected using awide range of frequencies. The best results wereachieved for f = 1 kHz and 82 dB of gain, as seenin figure 6.
Figure 6: ECT results for an internal defect 350 µm thicknessand 5 mm in length.
Similarly to the inspection of the open defect,the peak can be seen in the x = 50 mm mark butthe SNR decreased, as expected. Although theimpedance peak indicates a successful detection,the fact that the steel filler material used wasn’t ofthe same exact steel as the WAAM wall might beinfluencing the results causing the impedance vari-ation. Nevertheless, this new SEP probe designshowed improvements in the detection capabilitiesof internal defects and ECT proved to be a promis-ing solution for the in-line control of WAAM steelparts.
3.2. Ultrasonic testingAccording to [3], phased array ultrasonic testing(PAUT) was indicated as one of the most promis-ing techniques for the in-line inspection of WAAMparts. PAUT systems utilise multi-element probes,which are individually excited. By exciting eachelement in a controlled manner, a focused beamcan be generated and steered by the use of propersoftware. Two and three dimensional views can begenerated showing the sizes and locations of anyflaws detected. The present work analysed two as-pects of the PAUT inspection of WAAM producedparts in order to improve its capabilities: surfacetexture and coupling medium.
3.2.1 Inspection modeling
Regarding surface texture, one of the first objec-tives was developing a realistic PAUT inspectionmodel on the commercial simulation and analysissoftware CIVA in order to understand the influenceof waviness in inspection. CIVATM NDE is a simula-tion and analysis commercial software specificallydeveloped for NDT applications, whence why it wasused in this work. This software permits the con-trol of a wide range of options from types of probesto different defect scattering models, allowing theprediction of various inspection techniques.
In order to introduce waviness into CIVA, severalCAD models were experimented. The data fromfigure 1 was imported to Solidworks which createdsplines through the discrete points. This attemptwas not successful as the data resolution was tohigh for CIVA to process. For a realistic inspec-tion the mesh would have to be extremely refinedleading to a unacceptably long computation time.For this reason, a simplified approach was usedand a CAD surface was manually designed with amaximum height variation of 0.04 mm in 10 mmsteps. Then, a parallelepiped CAD specimen wascreated with two halves having different surfaces:one planar and the other wavy, as seen in figure 7.Because of CIVA’s comparative scale, having twodifferent surfaces in the same specimen instead oftwo models permitted a direct comparison of the
4

inspection simulations results.
Figure 7: Final inspection model.
The chosen material for the specimen wasisotropic carbon steel with density, ρ = 7.8 g cm−3
and longitudinal wave velocity of 5900 ms−1.An immersion type probe with linear phased
array pattern and 32 elements with flat focusingwas selected. The chosen frequency was 5 MHz.Taking in consideration the average layer heightin WAAM, single point focusing in the inspectionplane was selected along the longitudinal axis Z= 2.5 mm as this was the region of interest. Theuniform delay laws were calculated for longitudinalwaves accounting for backwall reflection. Finally, awater path of 20 mm between the specimen andthe UT probe was selected, with ρ = 1 g cm3 andprimary wave velocity of 1483 ms−1. The attenua-tion laws were neglected both in the specimen andwater medium, to simplify the analysis.
Having set most computation parameters, theprobe active aperture was studied in order to op-timize the number of elements needed for inspec-tion. 12 elements were selected as the mostpromising aperture as the maximum pressure wasfocused on the region of interest and shortly dis-tanced from the top surface (avoiding high ampli-tudes on the first echo which tend to camouflagethe defects). Secondly two simulations were car-ried out placing the probe over the two differentsurfaces. The results of this beam computationsare shown on figure 8.
Figure 8: Visualization of the beam spread for different surfacetextures for 12 active elements.
The main difference between the two simulationscan be seen in the 3.5 to 7 mm mark. One canclearly note a significant decrease in acoustic pres-sure (dark blue area) on the wavy surface example,which can compromise the probe’s ability to detectdeeper defects. This test confirms that micrometricvariations in the sample waviness generate signifi-cant changes in the ultrasonic beam.
After evaluating the impact of surface wavinesson the UT beam spread, a defect inspection simu-lation was performed by introducing two 3 mm di-ameter flat bottom hole defects, 2.5 mm under thesurface, as illustrated on figure 9. Flat bottom holesare a type of reflector commonly used in referencestandards where the end (bottom) surface of thehole is the reflector. Defect A is placed under thesmooth surface where roughness is the only sur-face condition, and defect B under a top that com-plies both roughness and waviness. One can alsosee the scanning path trajectory which was madeover 2 mm steps to minimize computation time, fol-lowing the x direction.
Figure 9: UT inspection model used with two 3 mm diameterflat bottom holes, 2.5 mm under the top surface.
On figure 10, the two defects are shown in theirB-scan view. The B-scan refers to the image pro-duced when the data collected from an ultrasonicinspection is plotted on a cross-sectional view ofthe component. These examples were took byplacing the inspection window only over the defectsin order to neglect the surface echo to facilitate thecomparison.
Figure 10: B-scan view of two flat bottom hole defects underdifferent surface conditions.
One can clearly see that both defects appearto have similar acoustic pressure distributions, al-though there’s slight decrease in the wavy surfaceexample. This means that if this decline is signifi-cant enough depending on the degree of waviness,the defect detection might be compromised.
Ultimately, the developed model presents a real-istic method to understand the effect of surface tex-
5

ture in the inspection of WAAM parts. This enablesa better selection of probes, apertures and otherinspection parameters, allowing to predict how thesound pressure behaves within the part. However,this analysis can only be qualitative due to CIVA’scomparative scale. For this reason, an experimen-tal validation was followed.
3.2.2 Experimental validation
The followed experiments were made in immersionwater coupling with two PAUT probes: an IMA-SONIC 3.25 MHz with 20 elements plus mechan-ical focus, and an OlYMPUS 5 MHz with 32 ele-ments. The last was identical to the probe usedon CIVA’s simulations. Both probes can be seen infigure 11.
Figure 11: Phased array UT probes used: a) IMASONIC 3.25MHz 20 elements, b) OlYMPUS 5 MHz 32 elements.
Half of a WAAM wall’s top was machined seek-ing to remove as less material as possible whilethe other half was kept with its original texture. Twopairs of 3 mm flat bottom holes were placed 4 mmunder surface and radiography tests were done toverify the measurements and positioning of the de-fects, as can be seen in figure 12 a).
Figure 12: a) Radiography results; b) C-scan view for OLYM-PUS 5 MHz probe.
Both 3.25 and 5 MHz probes detected all fourdefects, but the best and clearer results wereachieved with the last for only one active element.Figure 12 b) shows the C-scan of this inspection.A c-scan refers to the image produced when thedata collected from an ultrasonic inspection is plot-ted on a plan view of the component. This last fig-ure shows that defects A and B on the machinedhalf are clearly detected and exhibit very similaracoustic pressure distributions. In contrast, de-fects C and D on the original wavy side appear
more muted. Moreover, defect D is more easily de-tectable than C which shows that for the inspectionof WAAM parts, the defect detectability is highlydependent on the local waviness that the probe en-counters.
Defects A and D were selected to be comparedand the A-scan results of the first can be seen infigure 13 were the amplitude peak after the firstecho clearly exposes the defect.
Figure 13: A-scan results for defect A under WAAM surface,inspected with a 5 MHz PAUT probe.
The difference between the peaks of the firstecho and the defect was measured indicating adistance of 4.2 mm which is proximate to the realdepth of the defect. Although an effort was made toremove as less material as possible while machin-ing, this process also flattened the surface elimi-nating the characteristic curvature of the sampleswhich might have also contributed for the success-ful result of this inspection.
Figure 14 shows the A-scan results for defect Dunder the original wavy surface. As can be seen,the defect was still detected although a general de-crease in amplitude is evident compared to defectA on the machined side, as was predicted on theprevious simulations. The defect echo amplitudedecreased around 80% on the wavy side which isnotably significant.
Figure 14: A-scan results for defect D under WAAM surface,inspected with a 5 MHz PAUT probe.
While every defect was able to be detected moreor less clearly depending on its localization, thereare some considerations to be done relatively tothe dimensioning said defects. For defects A andB on the machined half, both could be dimensionedusing the same 6 dB rule which is a commonly un-derstood practice for length sizing discontinuities
6

in welds. This technique defines the defect lengthas half (6dB) of the maximum amplitude obtainedwhile the transducer is scanned over the flaw. Bothholes were measured as having 2.9 mm using thisrule, which is acceptable as it is only 0.1 mm awayfrom the real diameter. On the other hand, defectD wasn’t able to be correctly dimensioned with thepast method, needing a more constricted rule of 3dB. Defect C was not possible to be dimensionedaccurately with any of the mentioned rules, whichmeans that the capabilities of correctly sizing a de-fect on a typical WAAM surface might be compro-mised depending on what local waviness the probeencounters.
In conclusion, PAUT proved to be a reliablemethod for inspecting WAAM steel samples al-though sizing can be difficult depending on thesurface conditions. However, to improve inspec-tion, machining the sample’s top might be favorablewhen applicable.
3.3. Solder pasteWhen regarding the in-line inspection of WAAMsteel parts, there are some challenges concerningcoupling that need to be overcome, mostly relatedto the high temperatures involved in the process.If water is used, it will vaporize instantly at 100◦Cwhich hinders the chance of active coupling. Thisproblem is even more evident in steel, as temper-ature cycles can range between 300 - 1150 ◦C orhigher depending on the heat input [5]. One of thesolutions for this problem is to increase the coolingtime between layers, but that would consequentlyincrease the lead time of manufacturing which isone of the biggest advantages in WAAM [7].
In alternative to water, high temperature UT cou-plants are usually used in welds, but these tend toleave residues between layers which makes themunsuitable for in-line inspection [LASIMM - internalreport]. Therefore, the possibility of using solderpaste as UT coupling was tested. The premisewas that this paste would be suitable as it formu-lated to withstand higher temperatures. Moreover,because it is water based, the UT signal should notbe compromised.
The conducted tests were done for two samplesmanufactured with the same welding parameters.The control sample with no solder paste was des-ignated as P1. For sample P2, the solder pastewas applied to every layer 1 to 2 minutes after thebead was deposited as to allow some time for cool-ing to avoid instant vaporization of the liquid. Thisinformation is summarized on table 1.
Firstly, it was necessary to understand if the useof the solder past would have any detrimental ef-fect on the microstructure and structural integrityof the WAAM steel parts. To do so, a traversal sec-
Table 1: Samples production strategy.
Sample Couplant between layers
P1 -P2 ×
tion of the samples was removed, resin-wrappedand polished. Finally, 2% Nital was used as con-trast. The results from a equivalent central portionof both samples are presented on figure 15.
Figure 15: Grain size variation with and without solder pasteapplication.
As can be seen, the main difference observedwhen comparing the two samples is the grain size.On the sample with solder paste between layers(P2), the grain size is smaller on average and moreuniform compared to sample P1. This could be ex-plained by the fact that some of the heat is trans-ferred to the liquid when the paste is being applied,meaning that the welding bead will tend to coolmore rapidly. The results are consistent with thetheory that rapid cooling is associated to smallergrain formation. Besides grain size variations, nei-ther sample P1 or P2 presented visible defects andsimilar microconstituents were observed throughboth samples in equivalent regions. This servesto show that the use of the solder paste does notsignificantly influence the deposited material at amicrostructural level.
Secondly, the mechanical properties of the sam-ples with and without application of the solderpaste were studied as they relate to the mate-rial’s performance. Therefore, tensile and hard-ness tests were conducted.
Typically, AM produced parts have an orientedgrain structure, which means that the mechani-cal properties can differ in direction. For this rea-son, the tensile test specimens were removed fromthe WAAM walls according to the orientation ofthe build as illustrated on figure 16. These spec-imens were fabricated following the ISO 6892-1-2009 standard.
The uniaxial tensile tests were performed in aInstron 4507 electromechanically actuated staticload frame machine, with a maximum load capac-ity of 200 kN. Specimens were tested at roomtemperature using an extensometer to measure
7

Figure 16: Scheme of the tensile test specimens extracted fromWAAM samples according to ISO 6892-1-2009 standard.
changes in the length. The stress-strain curves areshown on figure 17 a) for a more visual examina-tion for 2 pairs of selected specimens. Figure 17b) shows the statistical representation of all testedspecimens. On figure 17 a) the selected stress-
(a) Stress–strain curve.
(b) Ultimate tensile strength (UTS) and elongation to fractureof the tested samples.
Figure 17: Tensile test results.
strain curves are representative of a typical mild-steel curve with discontinuous yielding (the mate-rial reaches an upper yield point before droppingrapidly to a lower yield point) and ductile behaviour.Some differences can be seen for the transver-sal (y) and longitudinal (z) components which maybe related to preferential orientation of austenite
grains during solidification. Ultimately, one can in-fer that the solder paste usage did not adverselyaffect the mechanical proprieties of the depositedmaterial.
Finally, hardness tests were conducted by calcu-lating the Vickers Hardenss (VH) along the buildingdirection of the samples using a Duramin Struersmachine. The results are presented on figure 18.
Figure 18: Hardness test results and marked indentations.
Both samples P1 and P2 presented similar be-haviour. Although small deviations can be ob-served, the differences between the peak val-ues are not significant, allowing to conclude thatthe mechanical properties are homogeneous overeach layer, despite variations of the involved tem-peratures. This was true except for the initial andlast layers where the hardness was comparativelyhigher. The fast cooling rate in the first depositedlayers, aided by the cold substrate and its capac-ity for heat dissipation, justify the higher hardnessobserved in this region. In the top layers, the mi-crostructure is similar to a single pass weld wereacicular ferrite and grain boundary ferrite formationis promoted. This exhibits a predominantly colum-nar grain structure with relatively higher hardnessvalues.
In brief, the tensile and harness tests revealedsimilar mechanical behaviour between the sampleswith and without solder paste, which is a good in-dicative that its application as couplant will not in-jure the parts’ performance.
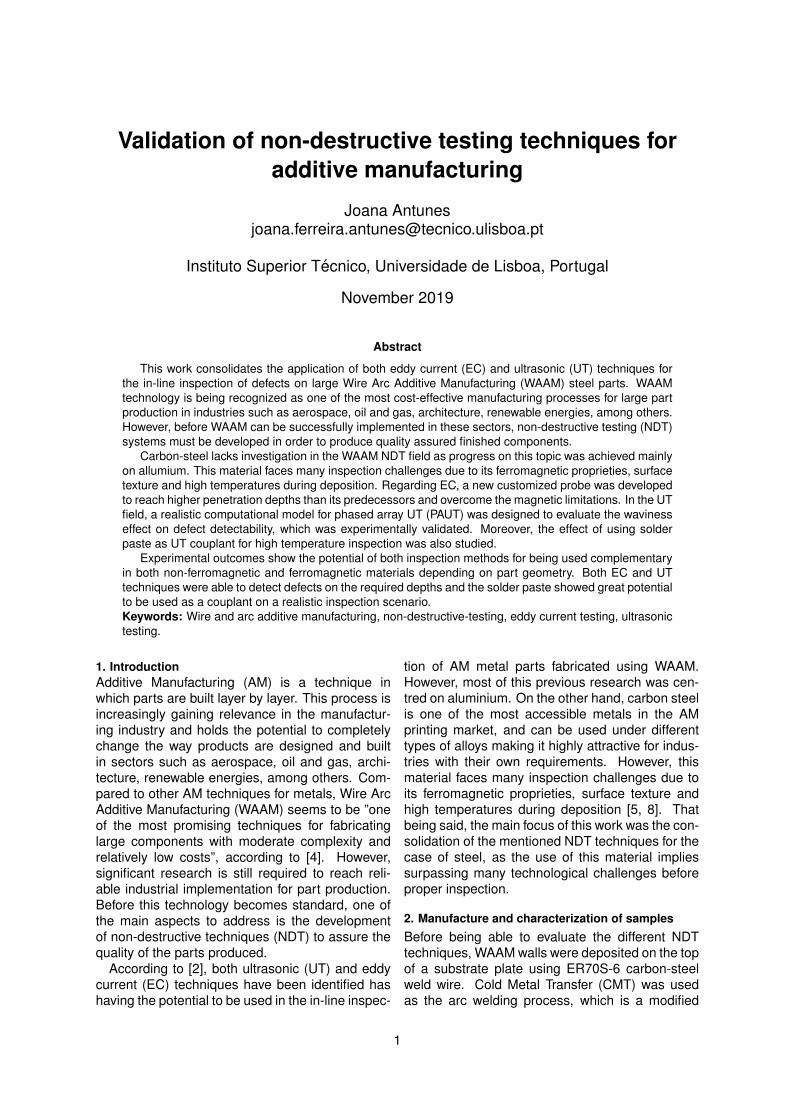
Last but not least, scanning electron microscopy(SEM) was conducted in order to verify if the solderpaste application had any influence on the chem-ical composition of the steel samples. The ele-mental composition of microscopic particles or re-gions on a sample’s surface is analysed using a en-ergy dispersive x-ray spectrometer (EDS) attachedto the SEM. EDS micro analysis is performed bymeasuring the energy and intensity of the signalsgenerated by the focused electron beam scannedacross the specimen. The results are shown onfigure 19.
These figures show that both samples P1 andP2 had identical chemical composition as the samenumber of elements were present (C, Mn, Fe, Si)and in approximately the same quantities. This
8
(a) P1.
(b) P2.
Figure 19: Elemental composition of the samples.
means that the application of the solder paste didnot alter the sample’s elemental composition.
3.3.1 Experimental validation
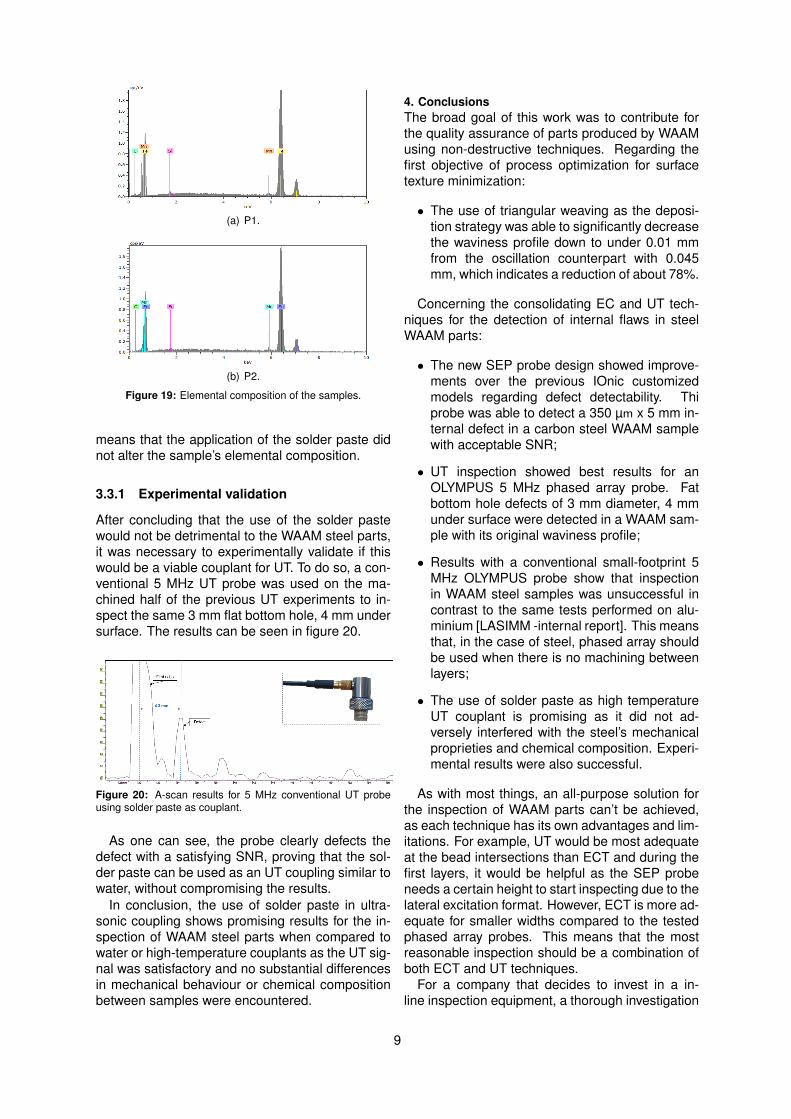
After concluding that the use of the solder pastewould not be detrimental to the WAAM steel parts,it was necessary to experimentally validate if thiswould be a viable couplant for UT. To do so, a con-ventional 5 MHz UT probe was used on the ma-chined half of the previous UT experiments to in-spect the same 3 mm flat bottom hole, 4 mm undersurface. The results can be seen in figure 20.
Figure 20: A-scan results for 5 MHz conventional UT probeusing solder paste as couplant.
As one can see, the probe clearly defects thedefect with a satisfying SNR, proving that the sol-der paste can be used as an UT coupling similar towater, without compromising the results.
In conclusion, the use of solder paste in ultra-sonic coupling shows promising results for the in-spection of WAAM steel parts when compared towater or high-temperature couplants as the UT sig-nal was satisfactory and no substantial differencesin mechanical behaviour or chemical compositionbetween samples were encountered.
4. ConclusionsThe broad goal of this work was to contribute forthe quality assurance of parts produced by WAAMusing non-destructive techniques. Regarding thefirst objective of process optimization for surfacetexture minimization:
• The use of triangular weaving as the deposi-tion strategy was able to significantly decreasethe waviness profile down to under 0.01 mmfrom the oscillation counterpart with 0.045mm, which indicates a reduction of about 78%.
Concerning the consolidating EC and UT tech-niques for the detection of internal flaws in steelWAAM parts:
• The new SEP probe design showed improve-ments over the previous IOnic customizedmodels regarding defect detectability. Thiprobe was able to detect a 350 µm x 5 mm in-ternal defect in a carbon steel WAAM samplewith acceptable SNR;
• UT inspection showed best results for anOLYMPUS 5 MHz phased array probe. Fatbottom hole defects of 3 mm diameter, 4 mmunder surface were detected in a WAAM sam-ple with its original waviness profile;
• Results with a conventional small-footprint 5MHz OLYMPUS probe show that inspectionin WAAM steel samples was unsuccessful incontrast to the same tests performed on alu-minium [LASIMM -internal report]. This meansthat, in the case of steel, phased array shouldbe used when there is no machining betweenlayers;
• The use of solder paste as high temperatureUT couplant is promising as it did not ad-versely interfered with the steel’s mechanicalproprieties and chemical composition. Experi-mental results were also successful.
As with most things, an all-purpose solution forthe inspection of WAAM parts can’t be achieved,as each technique has its own advantages and lim-itations. For example, UT would be most adequateat the bead intersections than ECT and during thefirst layers, it would be helpful as the SEP probeneeds a certain height to start inspecting due to thelateral excitation format. However, ECT is more ad-equate for smaller widths compared to the testedphased array probes. This means that the mostreasonable inspection should be a combination ofboth ECT and UT techniques.
For a company that decides to invest in a in-line inspection equipment, a thorough investigation
9

on the part’s material, geometrical complexity, andtype of defects to inspect must be done a priori inorder to understand what technique is the most ad-vantageous, if not both.
References[1] J. B. Bento, A. Lopez, I. Pires, L. Quintino,
and T. G. Santos. Non-Destructive Testingfor Wire + Arc Additive Manufacturing of alu-minium parts. Additive Manufacturing, 27:440–450, 2019.
[2] A. Lopez, R. Bacelar, I. Pires, T. G. Santos, J. P.Sousa, and L. Quintino. Non-destructive test-ing application of radiography and ultrasoundfor wire and arc additive manufacturing. Addi-tive Manufacturing, 21:298–306, 2018.
[3] A. Lopez, J. Santos, J. P. Sousa, T. G. Santos,and L. Quintino. Phased Array Ultrasonic In-spection of Metal Additive Manufacturing Parts.Journal of Nondestructive Evaluation, 38:62,2019.
[4] J. L. Prado-Cerqueira, A. M. Camacho, J. L.Dieguez, Rodrıguez-Prieto, A. M. Aragon,C. Lorenzo-Martın, and Yanguas-Gil. Anal-ysis of Favorable Process Conditions for theManufacturing of Thin-Wall Pieces of Mild SteelObtained by Wire and Arc Additive. Materials,11:1449, 2018.
[5] T. A. Rodrigues, V. Duarte, R. M. Miranda, T. G.Santos, and J. P. Oliveira. Current Status andPerspectives on Wire and Arc Additive Manu-facturing (WAAM). Materials, 12:1121, 2019.
[6] P. M. Sequeira Almeida and S. Williams. In-novative Process Model of Ti-6Al-4V AdditiveLayer Manufacturing Using Cold Metal Transfer(Cmt). SFF Symposium, pages 25–36, 2010.
[7] S. W. Williams, F. Martina, A. C. Addison,J. Ding, G. Pardal, and P. Colegrove. Wire +Arc Additive Manufacturing. Materials Scienceand Technology, 32:641–647, 2015.
[8] B. Wu, Z. Pan, D. Ding, D. Cuiuri, H. Li, J. Xu,and J. Norrish. A review of the wire arc ad-ditive manufacturing of metals: properties, de-fects and quality improvement. Journal of Man-ufacturing Processes, 35:127–139, 2018.
[9] J. Xiong, Y. Li, R. Li, and Z. Yin. Influencesof process parameters on surface roughnessof multi-layer single-pass thin-walled parts inGMAW-based additive manufacturing. Journalof Materials Processing Technology, 252:128–136, 2018.
10