user interface for situational awareness for openpdc · user interface for situational awareness...
TRANSCRIPT
User Interface for Situational
Awareness for openPDC
Nickolas Gellerman, B.S.E.E Student
Ranganath Vallakati, M.S.E.E Student
Anupam Mukherjee, M.S.E.E Student
Advisor: Dr. Prakash Ranganathan, Assistant Professor
1
Need for Situational Awareness
in Electric Utilities Data
World becoming increasingly dependent on electrical energy.
� Communication Systems
� Transportation Systems
� Medical Equipment/Devices
Situational awareness involves being aware of what is happening in the electrical grid in order
to understand how information, events, and operator actions will impact goals and objectives,
both immediately and in the near future.
Benefits of a situational awareness tool:
� Real-time monitoring of electrical grid status.
� Address anomalies (phase, frequency, voltage, current) as they happen, shortening
downtime in the grid.
� Detect patterns and prevent future outage problems
Nick G, et.al. User Interface for Situational Awareness for
OpenPDC. IEEE NAPS 2014
2
Phasor Measurement Units (PMU)
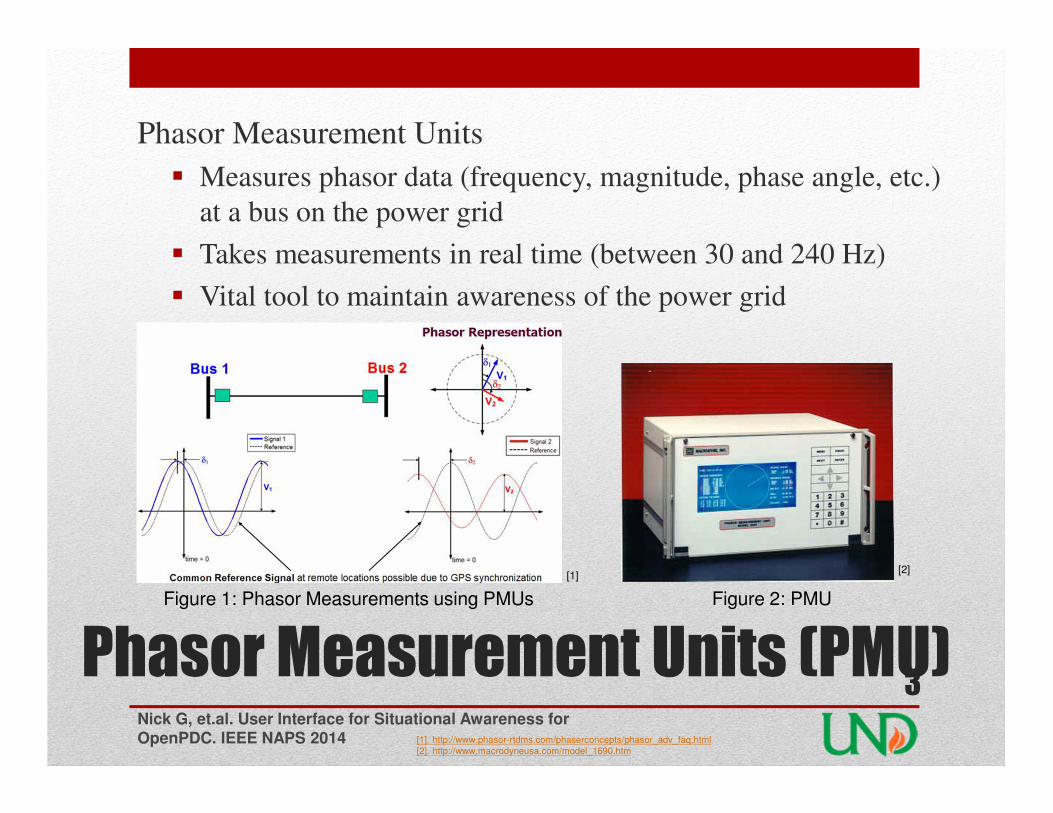
Phasor Measurement Units
� Measures phasor data (frequency, magnitude, phase angle, etc.)
at a bus on the power grid
� Takes measurements in real time (between 30 and 240 Hz)
� Vital tool to maintain awareness of the power grid
Nick G, et.al. User Interface for Situational Awareness for
OpenPDC. IEEE NAPS 2014
3
[1]. http://www.phasor-rtdms.com/phaserconcepts/phasor_adv_faq.html
[2]. http://www.macrodyneusa.com/model_1690.htm
[1][2]
Figure 1: Phasor Measurements using PMUs Figure 2: PMU
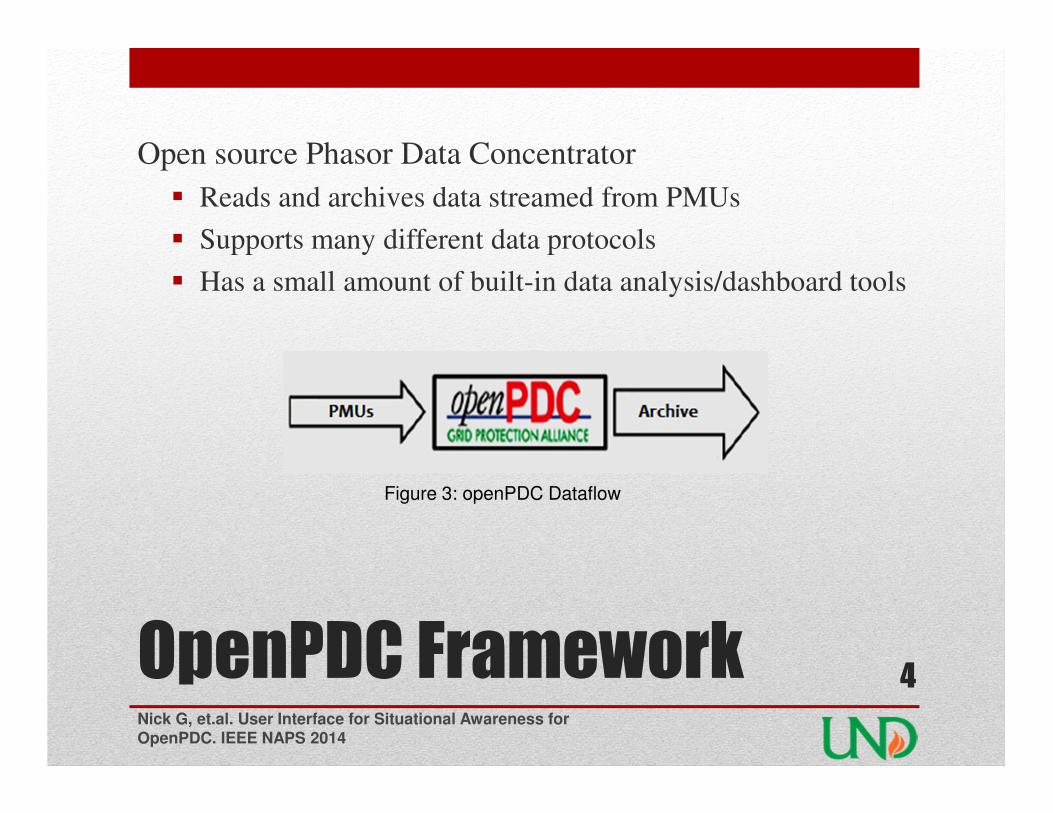
OpenPDC Framework
Open source Phasor Data Concentrator
� Reads and archives data streamed from PMUs
� Supports many different data protocols
� Has a small amount of built-in data analysis/dashboard tools
Nick G, et.al. User Interface for Situational Awareness for
OpenPDC. IEEE NAPS 2014
4
Figure 3: openPDC Dataflow
Objectives
� Create tools for more robust data monitoring
� Email alerts upon alarm activation
� Expand upon data analysis tools
� Give geographic representation of data
� Prototype K-Means clustering on received data
Nick G, et.al. User Interface for Situational Awareness for
OpenPDC. IEEE NAPS 2014
5
Methodology
� C# used for all coding
� Visual Studio 2012 IDE used for development
� External libraries utilized:
� Grid Solutions Framework
� Google Static Maps API
� .NET Framework 4.5
Nick G, et.al. User Interface for Situational Awareness for
OpenPDC. IEEE NAPS 2014
6

Email Adapter
� Action Adapter add-on to
openPDC
� Uses SMTP protocol
� Gmail SMTP server used
during testing
Nick G, et.al. User Interface for Situational Awareness for
OpenPDC. IEEE NAPS 2014
7
Figure 4: Email Alert Message
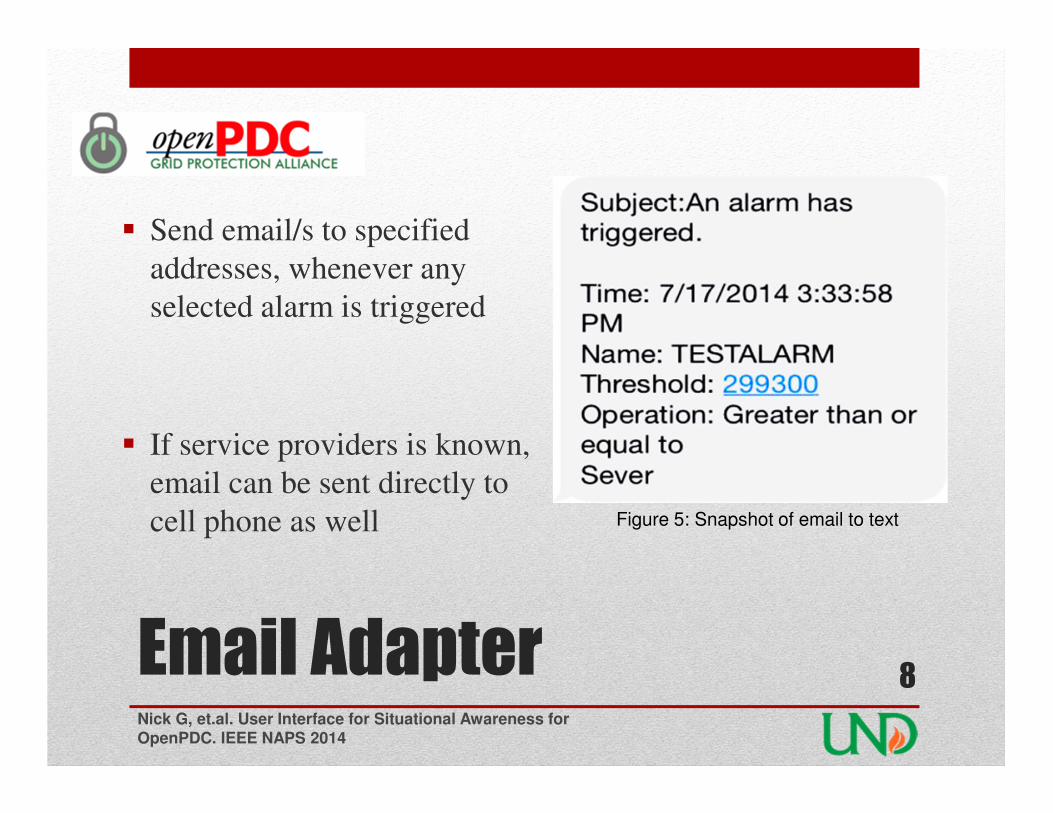
Email Adapter
� Send email/s to specified
addresses, whenever any
selected alarm is triggered
� If service providers is known,
email can be sent directly to
cell phone as well
Nick G, et.al. User Interface for Situational Awareness for
OpenPDC. IEEE NAPS 2014
8
Figure 5: Snapshot of email to text
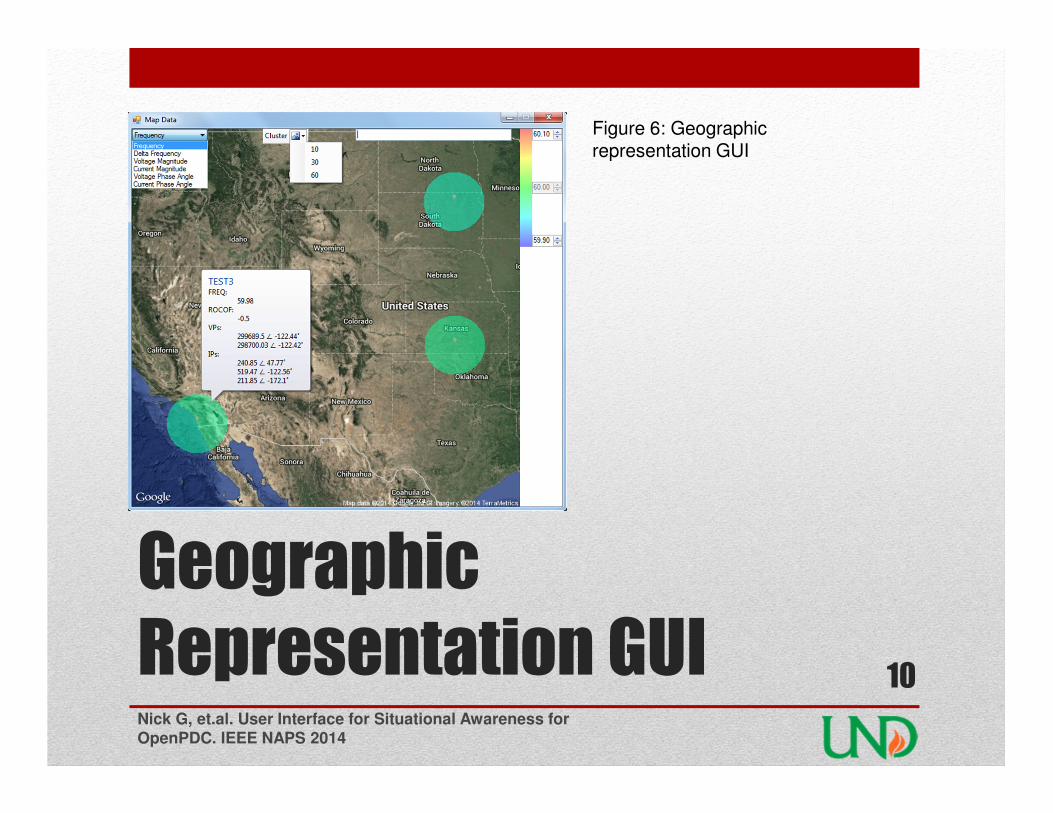
Geographic
Representation
� Windows Forms application
� Uses the Google Static Maps API as basis for location
mapping
� Individual PMUs placed on top of Static Map map using
Mercator Projection
Nick G, et.al. User Interface for Situational Awareness for
OpenPDC. IEEE NAPS 2014
9
Geographic
Representation GUINick G, et.al. User Interface for Situational Awareness for
OpenPDC. IEEE NAPS 2014
10
Figure 6: Geographicrepresentation GUI
Geographic
Representation GUINick G, et.al. User Interface for Situational Awareness for
OpenPDC. IEEE NAPS 2014
11
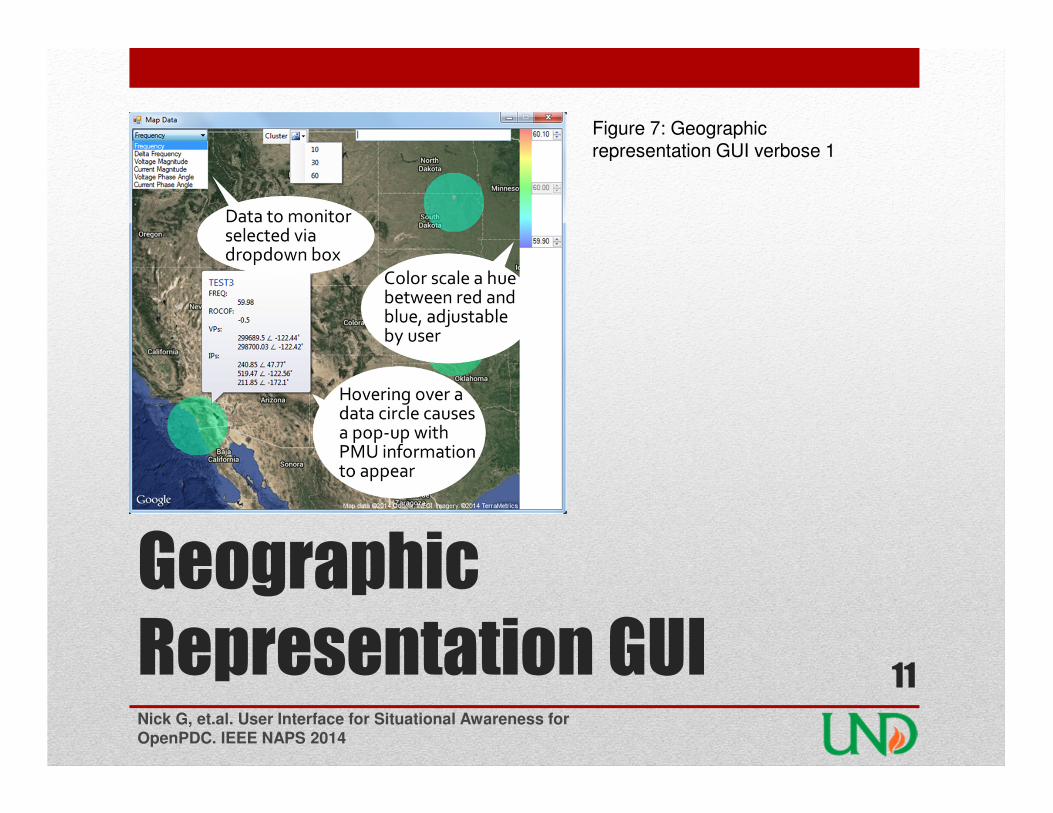
Figure 7: Geographic representation GUI verbose 1

Geographic
Representation GUINick G, et.al. User Interface for Situational Awareness for
OpenPDC. IEEE NAPS 2014
12
Figure 8: Geographic representation GUI verbose 2
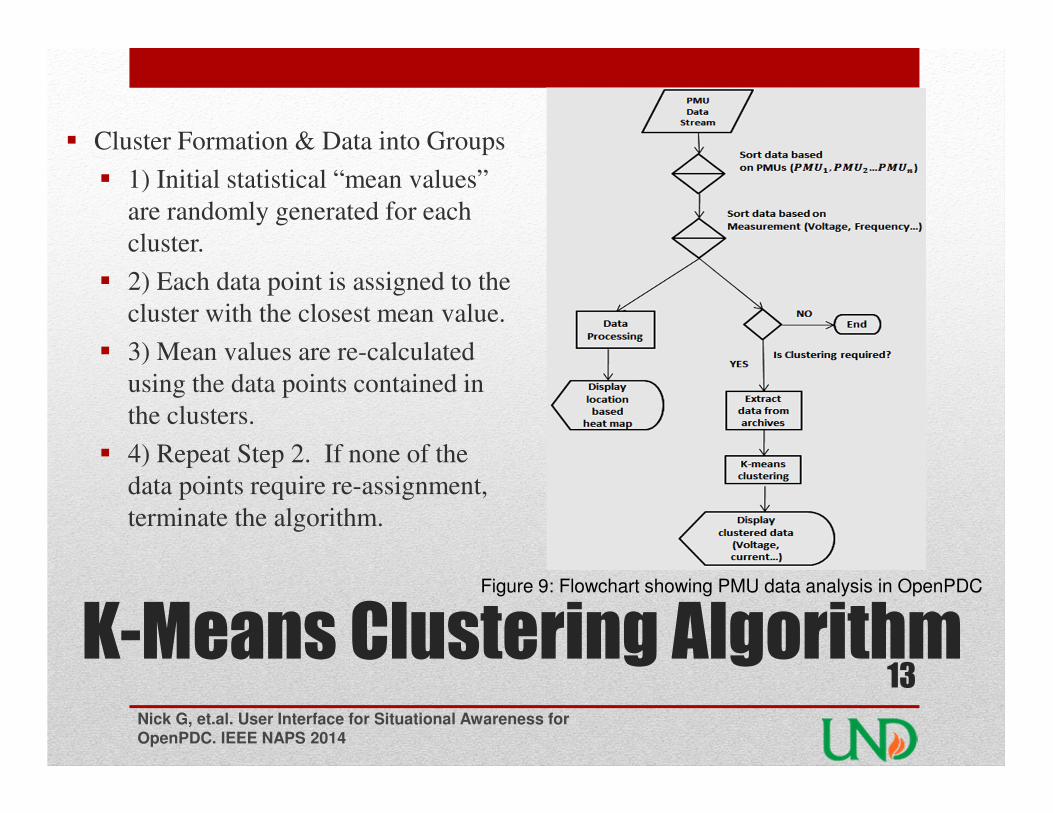
K-Means Clustering Algorithm
� Cluster Formation & Data into Groups
� 1) Initial statistical “mean values”
are randomly generated for each
cluster.
� 2) Each data point is assigned to the
cluster with the closest mean value.
� 3) Mean values are re-calculated
using the data points contained in
the clusters.
� 4) Repeat Step 2. If none of the
data points require re-assignment,
terminate the algorithm.
Nick G, et.al. User Interface for Situational Awareness for
OpenPDC. IEEE NAPS 2014
13
Figure 9: Flowchart showing PMU data analysis in OpenPDC
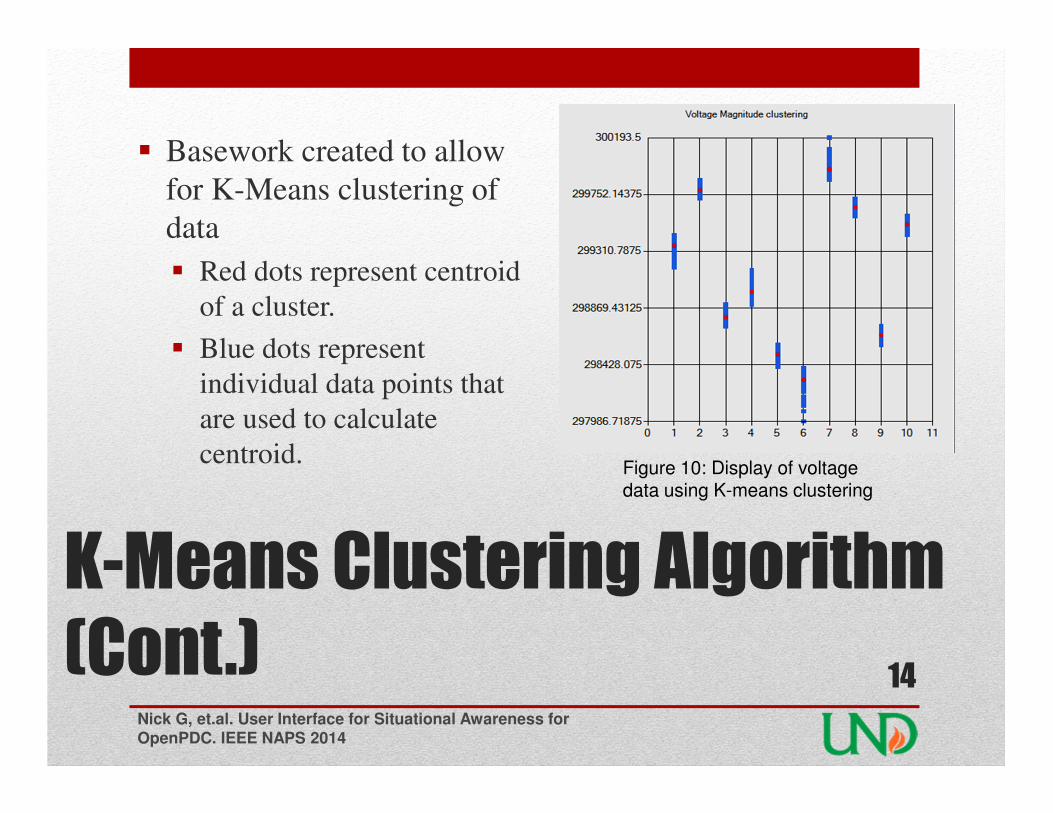
K-Means Clustering Algorithm
(Cont.)
� Basework created to allow
for K-Means clustering of
data
� Red dots represent centroid
of a cluster.
� Blue dots represent
individual data points that
are used to calculate
centroid.
Nick G, et.al. User Interface for Situational Awareness for
OpenPDC. IEEE NAPS 2014
14
Figure 10: Display of voltage data using K-means clustering
Future Work
� Change colored circle data representation to true heat-
map using openGL
� Make clustering through the GUI more flexible
� Selectable samples, time period, etc.
� Improve general user-friendliness of GUI
� Expand data mining research using other
classification/clustering algorithms.
Nick G, et.al. User Interface for Situational Awareness for
OpenPDC. IEEE NAPS 2014
15
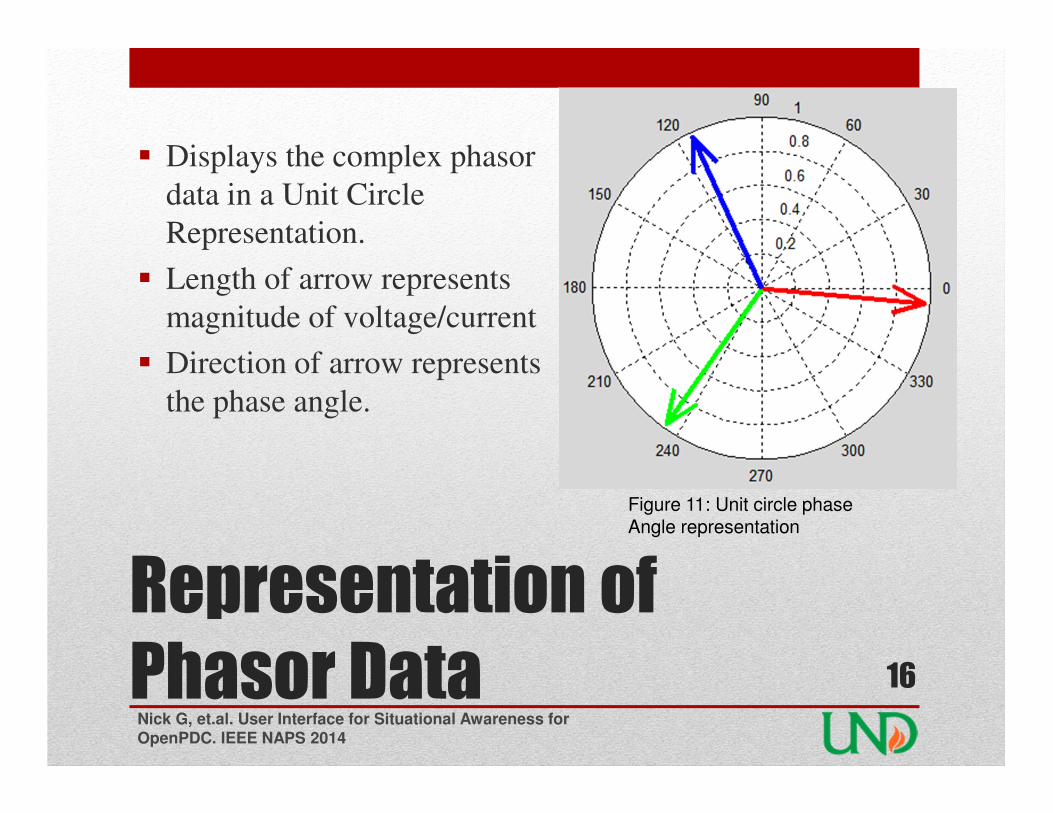
Representation of
Phasor Data
� Displays the complex phasor
data in a Unit Circle
Representation.
� Length of arrow represents
magnitude of voltage/current
� Direction of arrow represents
the phase angle.
Nick G, et.al. User Interface for Situational Awareness for
OpenPDC. IEEE NAPS 2014
16
Figure 11: Unit circle phase Angle representation
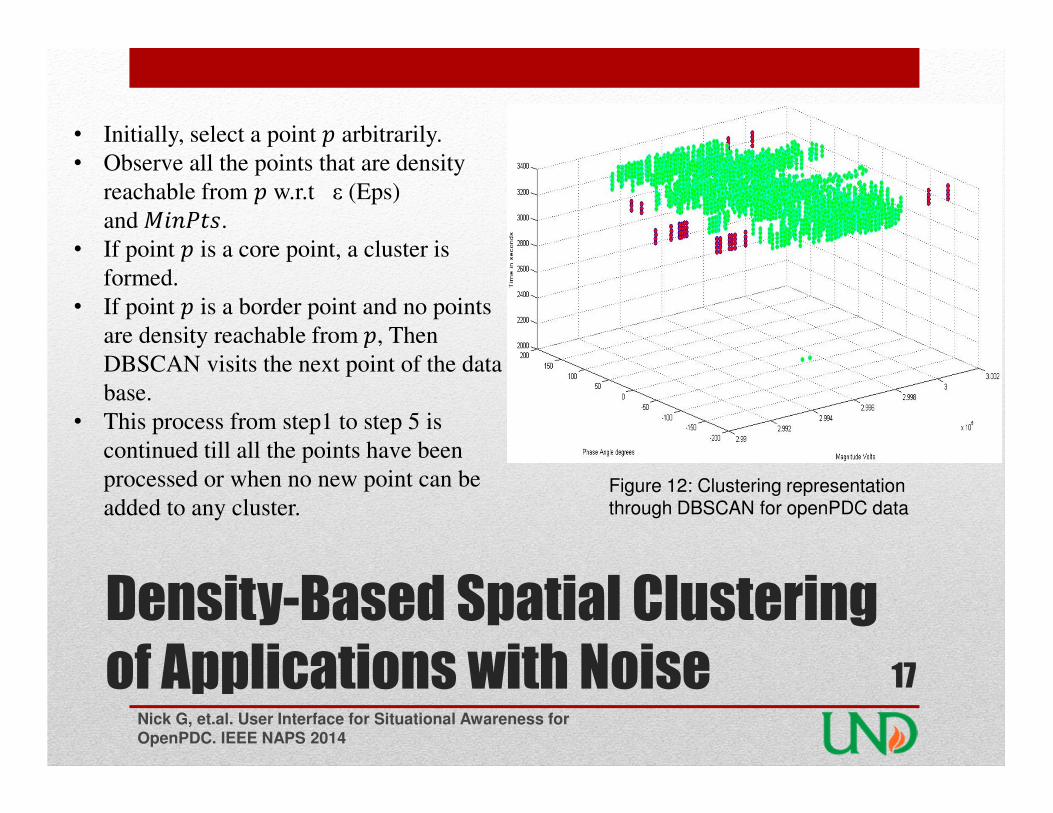
Density-Based Spatial Clustering
of Applications with NoiseNick G, et.al. User Interface for Situational Awareness for
OpenPDC. IEEE NAPS 2014
17
• Initially, select a point � arbitrarily.
• Observe all the points that are density
reachable from � w.r.t ε (Eps)
and������.
• If point � is a core point, a cluster is
formed.
• If point � is a border point and no points
are density reachable from�, Then
DBSCAN visits the next point of the data
base.
• This process from step1 to step 5 is
continued till all the points have been
processed or when no new point can be
added to any cluster.Figure 12: Clustering representation through DBSCAN for openPDC data

Summary
� Our research explores ways to improve the situational
awareness of the grid using OpenPDC
� E-mail adapter added to the OpenPDC environment to
provide real-time alerts on grid status
� K-means clustering explored to provide more
sophisticated data analysis tools
Nick G, et.al. User Interface for Situational Awareness for
OpenPDC. IEEE NAPS 2014
18
References
A. G. Phadke, “Synchronized phasor measurements in power systems,” IEEE Comput. Appl. Power, vol. 6, no. 2, pp. 10–15,
Apr. 1993.
J.Phadke, A.G., Thorp, Synchronized Phasor Measurements and Their Applications. 2008.
“Use of Synchrophasor Measurements in Protective Relaying Applications,” 2013.
B. K. Greene, “Novel Applications for Phasor Measurement Units and Synchrophasor Data,” 2013.
B. Singh, N. K. Sharma, A. N. Tiwari, K. S. Verma, and S. N. Singh, “Applications of phasor measurement units ( PMUs ) in
electric power system networks incorporated with FACTS controllers,” vol. 3, no. 3, pp. 64–82, 2011.
W. U. Rahman, M. Ali, A. Ullah, H. U. Rahman, and M. Iqbal, “Advancement in Wide Area Monitoring Protection and Control
Using PMU ’ s Model in MATLAB / SIMULINK,” vol. 2012, no. November, pp. 294–307, 2012.
E. Schweitzer and D. Whitehead, “Real-time power system control using synchrophasors,” Prot. Relay Eng. …, pp. 1–11,
2008.
Y. Chompoobutrgool, S. Member, L. Vanfretti, and A. N. M. S, “A Fundamental Study on Damping Control Design using
PMU signals from Dominant Inter-Area Oscillation Paths,” no. 3, pp. 3–8.
M. Rihan, M. Ahmad, and M. S. Beg, “Vulnerability Analysis of Wide Area Measurement System in the Smart Grid,” vol. 2013,
no. September, pp. 1–7, 2013.
K. Koellner, “Generator black start validation using synchronized phasor measurement,” Prot. Relay Eng.…, pp. 1–7, 2007.
M. Mills-Price and M. Scharf, “Solar generation control with time-synchronized phasors,” … , 2011 64th Annu. …, pp. 1–8,
2011.
B. K. Johnson, S. Jadid, and S. E. Laboratories, “Validation of Transmission Line Relay Parameters Using Synchrophasors,”
pp. 1–8.
“Grid Protection Alliance.” [Online]. Available: http://openpdc.codeplex.com/.
“Documentation of openPDC.” [Online]. Available: http://openpdc.codeplex.com/documentation. [Accessed: 15-Jul-2014].
“Microsoft Developer Network.” [Online]. Available: http://msdn.microsoft.com/en-us/library/.
“RGB to HSL / HSL to RGB in C#.” [Online]. Available: www.geekymonkey.com/Programming/CSharp/RGB2HSL_HSL2RGB.htm.
G. Nagy, “State of the Art in Pattern Recognition,” vol. 56, no. 5, pp. 836–857, 1968.
J. Hartigan and M. Wong, “Algorithm AS 136: A k-means clustering algorithm,” Appl. Stat., vol. 28, no. 1, pp. 100–108, 1979.
C. Cortes, V. Vapnik, and L. Saitta, “Support-vector networks,” Mach. Learn., vol. 20, no. 3, pp. 273–297, 1995.
N. Alon, Y. Matias, and M. Szegedy, “The space complexity of approximating the frequency moments,” in Proceedings of the
twenty-eighth annual ACM symposium on Theory of computing - STOC ’96, 1996, pp. 20–29.
Nick G, et.al. User Interface for Situational Awareness for
OpenPDC. IEEE NAPS 2014
19

Questions?• GROUP PHOTO
Nick G, et.al. User Interface for Situational Awareness for
OpenPDC. IEEE NAPS 2014
20

Thank You.
Nick G, et.al. User Interface for Situational Awareness for
OpenPDC. IEEE NAPS 2014
21