clustering algorithms for streaming … · clustering algorithms for streaming openpdc data sets...
TRANSCRIPT

This Research acknowledges ND EPSCoR (UND0014140), the Office of RD&C (21418-4010-02294), and the UND Graduate School for the grant support.
CLUSTERING ALGORITHMS FOR STREAMING OPENPDC DATA SETS
ANUPAM MUKHERJEE & RANGANATH VALLAKATI
DEPARTMENT OF ELECTRICAL ENGINEERING
UNIVERSITY OF NORTH DAKOTA
ADVISOR: DR. PRAKASH RANGANATHAN
2015 GPA USER’S FORUM AND TUTORIAL, AUGUST 4 & 5, 2015

OUTLINE OF THE PRESENTATION
Introduction : Need for Situational Awareness of Smart-grid
Proposed Situational Awareness Framework
Development of User Interface for openPDC
Data Visualization
Data Clustering
DBSCAN Clustering
k-means Clustering
Multi-Tier k-means Clustering
Results and Discussions
Conclusion2

NEED FOR SITUATIONAL AWARENESS OF SMART GRID
3
Blackout Events Affected Areas Cause
August 14, 2003 – Northeast Blackout.
Northeastern and Mid-western United States and Canadian province of Ontario. People affected – 55 million.
Software bug in the alarm system.
July 31, 2012 – Blackout in India. 22 states and union territories. People affected – 600 million.
Collapse of Northern and Eastern grids.
December 22, 2013 – Major ice-storm caused power failure.
Ontario to the maritime province in the far east and Michigan People affected –1.1 million.
Ice storm
March 31, 2015 – Black-out, caused by technical failure, affected about 90% of Turkey.
90% of Turkey. People affected – 70 million.
Probable cyber attack.
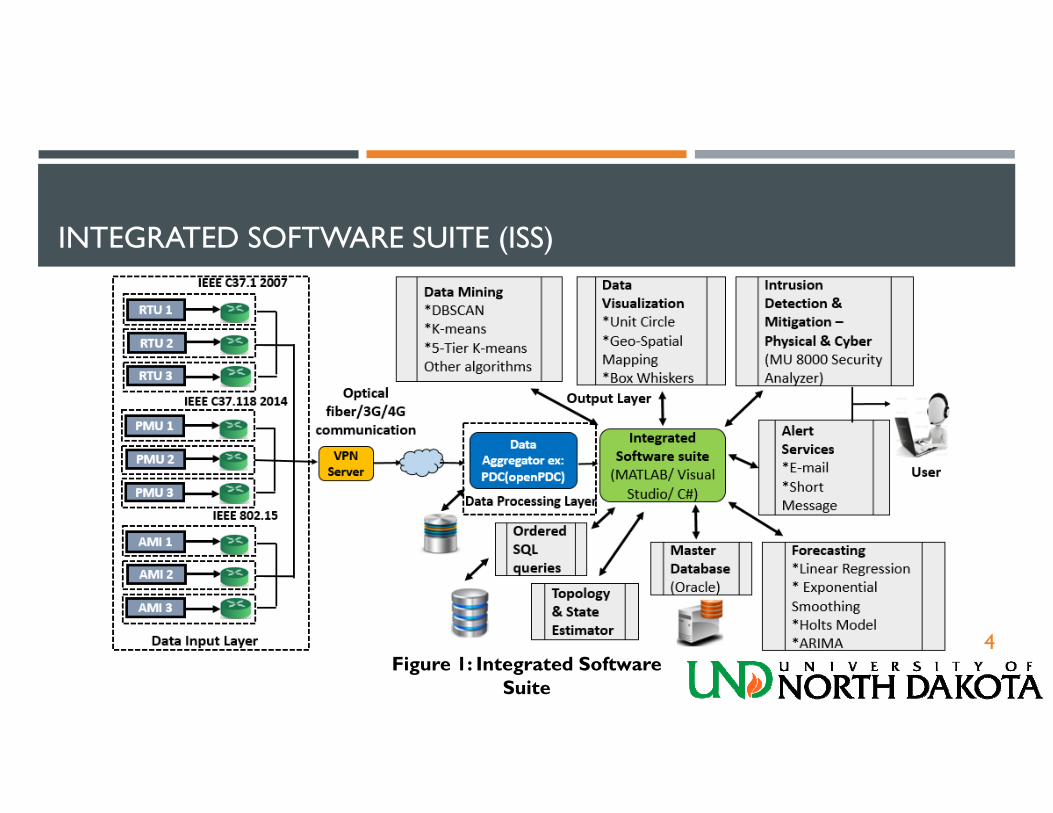
INTEGRATED SOFTWARE SUITE (ISS)
Figure 1: Integrated Software Suite
4

DEVELOPMENT OF USER INTERFACE
5
OpenPDC functions by receiving data broadcasted by a PMU and concentrating it, enabling archiving, rebroadcasting, and analysis of the phasor data. It provides around 30 samples per second.
Functionalities: E-mail Alarm
Short Message Service alarm
Location based monitoring
Figure 2: Data Processing Layer
Methodologies
C# used for all coding
Visual Studio 2012 IDE used for development
External libraries utilized:
Grid Solutions Framework
Google Static Maps API
.NET Framework 4.5

ALERT SYSTEMS DEVELOPED FOR OPENPDC
6Figure 5: Location Based Monitoring SystemFigure 4: E-mail AlarmFigure 3: Short Message
Service Alarm
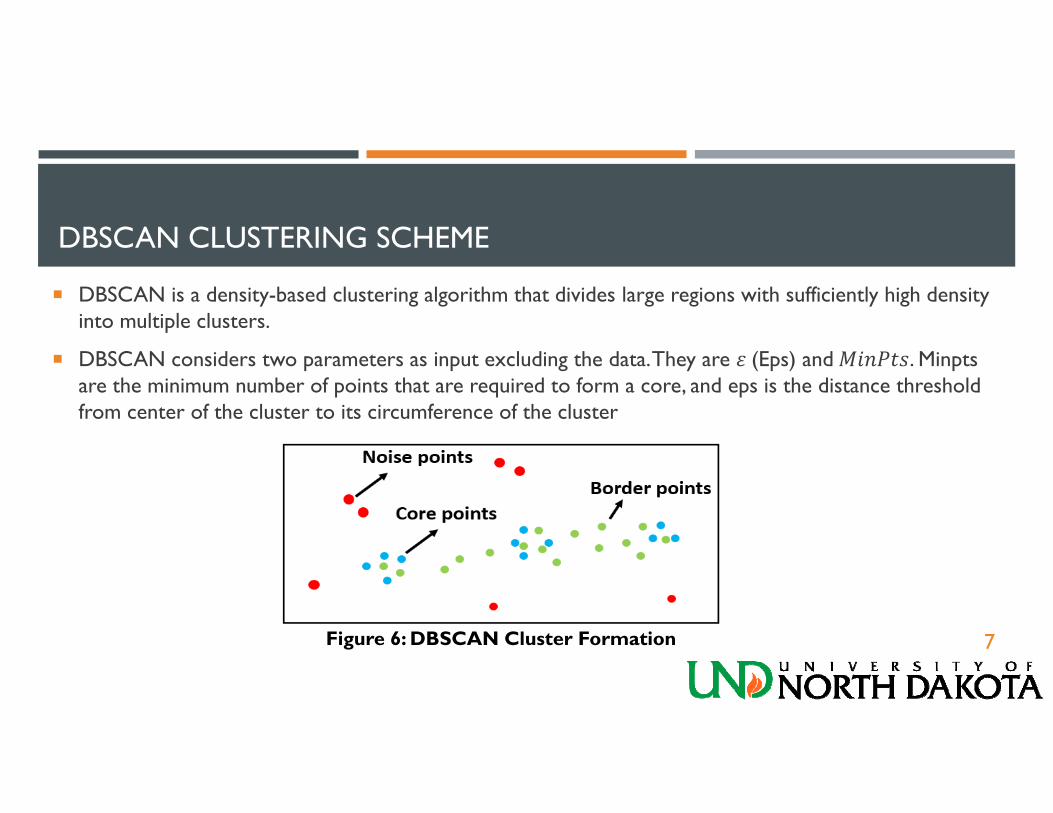
DBSCAN CLUSTERING SCHEME
DBSCAN is a density-based clustering algorithm that divides large regions with sufficiently high density into multiple clusters.
DBSCAN considers two parameters as input excluding the data. They are (Eps) and . Minpts are the minimum number of points that are required to form a core, and eps is the distance threshold from center of the cluster to its circumference of the cluster
Figure 6: DBSCAN Cluster Formation 7

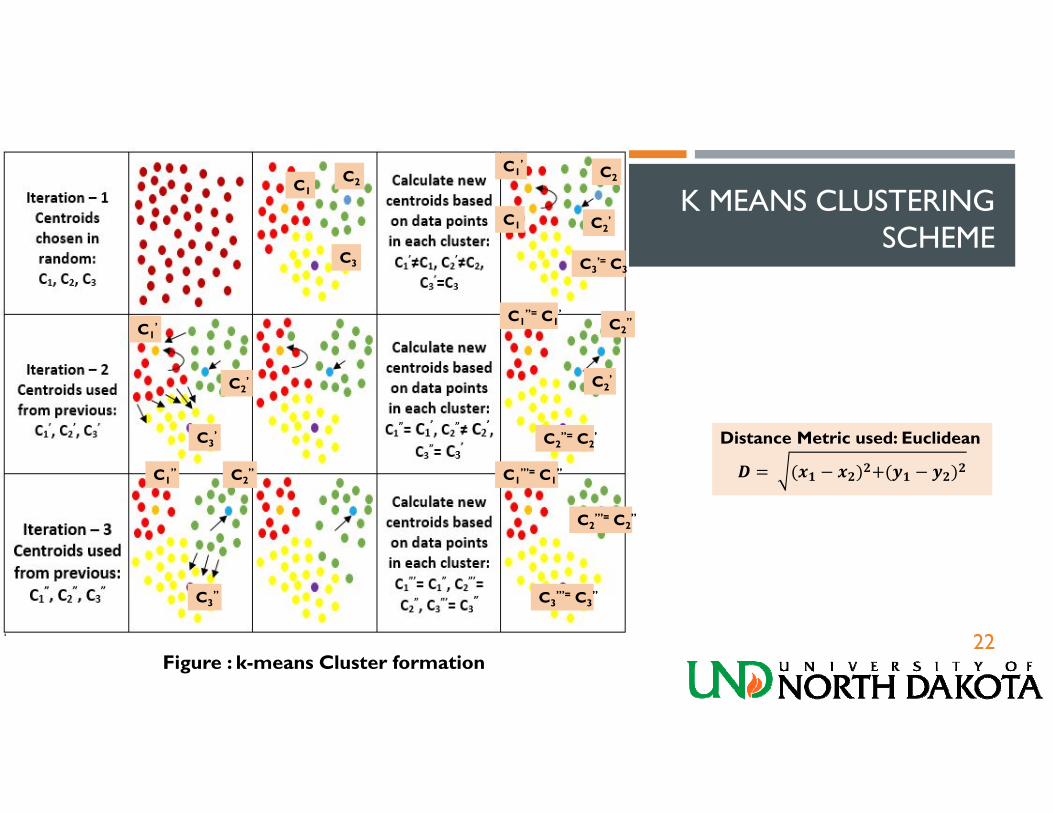
K-MEANS CLUSTERING SCHEME
The k-means technique is a well-known and popular algorithm which was first proposed by Lloyd.
Here, each cluster is represented by an adaptively changing centroid (also called a cluster center), starting from some initial values
Figure 7: k-means Clustering 8

MULTI-TIER K-MEANS CLUSTERING SCHEME
Figure 8: Multi-tier k-means Cluster Formation
This paper presents a different version of k-means which we refer as multi-tier k-means clustering tailored for power system data sets.
The proposed approach dynamically forms clusters from 1 to 5 clusters depending on the data thresholds and fault type. They are : High Noise, High Border, Good Data, Low Border, and Low Noise points
Capable of clearly distinguish the good, bad and the noisy data with the threshold inputs from the operator.
9

DATA CLUSTERING SCHEME
Figure 9: Smart Grid Data Management Framework (SGDMF)
10

RESULTS AND DISCUSSIONS
Data Visualization Box Plot
Circle Representation
Data Clustering DBSCAN Clustering
k-means Clustering
Multi-Tier k-means Clustering
11

DATA VISUALIZATION
12Figure 11: Circle Representation of
openPDC Voltage DataFigure 10: Box Whisker Representation of openPDC Voltage Data
As phase angle varies between -π to +π (0 to 360 degrees) and the magnitudes are above 0 for the electric signals, unit circle representation is ideal smart-grid data
The "Box Whiskers" is a statistical tool that allows observing a time-series data with minimum and maximum values in the series, standard deviations, mean and median values.

TEST SCENARIO: STEADY-STATE CONDITION
(a) (b) (c)
Figure 12: Clustering Schemes Applied on openPDC data under steady state condition (a) DBSCAN, (b) k-means, (c) Multi-Tier
13

TEST SCENARIO: HEAVY LOAD (HIGH DEMAND) CONDITION
(a) (b) (c)
Figure 13: Clustering Schemes Applied on openPDC data under Heavy Load Conditions (a) DBSCAN, (b) k-means, (c) Multi-Tier
14
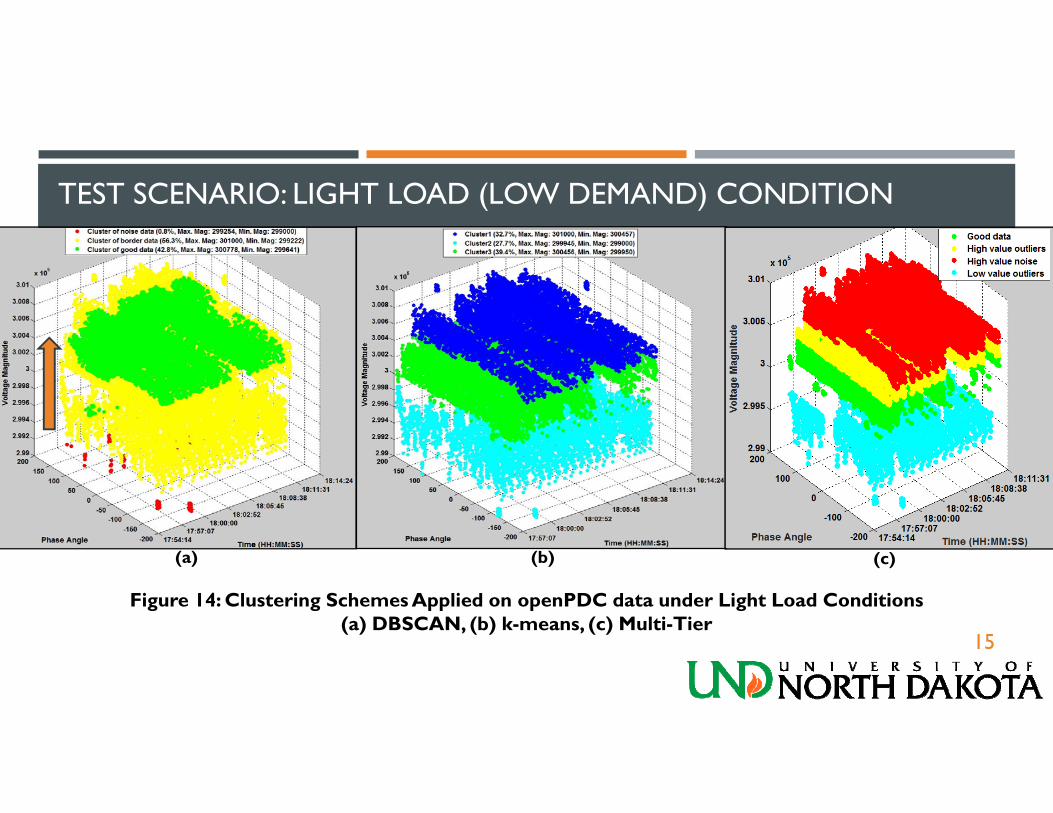
TEST SCENARIO: LIGHT LOAD (LOW DEMAND) CONDITION
(a) (b) (c)
Figure 14: Clustering Schemes Applied on openPDC data under Light Load Conditions (a) DBSCAN, (b) k-means, (c) Multi-Tier
15

TEST SCENARIO: SLG FAULT CONDITION (SHORT-CIRCUIT)
16
(b) (c)(a)
Figure 15: Clustering Schemes Applied on openPDC data Under SLG Fault Conditions(a) DBSCAN, (b) k-means, (c) Multi-Tier

DISTRIBUTION OF DATA POINTS
Steady-state condition: Multi-tier k-means performs best.
Heavy-load condition: DBSCAN performs best.
Light-load condition: DBSCAN performs best.
Fault condition: Multi-tier performs the best.17
Table 3: % distribution of data points with multi-tier k-means
Table 1: % distribution of data points with DBSCAN
Table 2: % distribution of data points with k-means
CONCLUSION
An Integrated Software Suite (ISS) has been developed to apply decision-making data-mining algorithms on time-synchronized synchrophasor data.
A novel, Multi-Tier variation of the k-means algorithm is presented, and its performance metrics are studied against common clustering techniques to classify and detect bad data, event detection, and alarm service applications.
A comparative analysis has been carried out between the three data clustering algorithms, DBSCAN, k-means and the Multi-Tier k-means.
It is believed that such a framework will enable the grid’s system operators to utilize novel algorithms in order to enhance situational awareness about the grid. The framework is scalable and suitable for streaming time-series data sets.
18

FUTURE WORK
Study application of forecasting algorithms like:
Time Series Data Analysis
Linear Regression
Exponential Smoothing
Holt’s Model
Topology based State Estimator
Intrusion Detection and Mitigation Systems
19

REFERENCES:
[1] M. Panteli and D. S. Kirschen, “Situation awareness in power systems: Theory, challenges and applications,” Electr. Power Syst. Res., vol. 122, pp. 140–151, May 2015.[2] A. G. Phadke, “Synchronized phasor measurements in power systems,” IEEE Comput. Appl. Power, vol. 6, no. 2, pp. 10–15, Apr. 1993.[3] A. J.Phadke, A.G., Thorp, Synchronized Phasor Measurements and Their Applications. 2008.[4] J. Chen and A. Abur, “Placement of PMUs to Enable Bad Data Detection in State Estimation,” IEEE Trans. Power Syst., vol. 21, no. 4, pp. 1608–1615, Nov. 2006.[5] J. Quintero and V. M. Venkatasubramanian, “Oscillation monitoring system based on wide area synchrophasors in power systems,” in 2007, iREP Symposium -
Bulk Power System Dynamics and Control - VII. Revitalizing Operational Reliability, 2007, pp. 1–13.[6] A. Pal, I. Singh, and B. Bhargava, “Stress assessment in power systems and its visualization using synchrophasor based metrics,” in 2014 North American Power
Symposium (NAPS), 2014, pp. 1–6.[7] A. Pal, J. S. Thorp, T. Khan, and S. S. Young, “Classification Trees for Complex Synchrophasor Data,” Electr. Power Components Syst., vol. 41, no. 14, pp. 1381–1396,
Oct. 2013.[19][8] Z. Li and W. Wu, “Phasor Measurements-Aided Decision Trees for Power System Security Assessment,” in 2009 Second International Conference on Information
and Computing Science, 2009, vol. 1, pp. 358–361.[9] “IEEE Guide for Phasor Data Concentrator Requirements for Power System Protection, Control, and Monitoring,” 2013.[10] S. Ma and J. L. Hellerstein, “Ordering categorical data to improve visualization,” Infovis-99, no. 1, pp. 1–4, 1999.[11] T. J. Overbye, D. A. Wiegmann, and A. M. Rich, “Human factors aspects of power system voltage contour visualizations,” IEEE Trans. Power Syst., vol. 18, no. 1,
pp. 76–82, Feb. 2003.[12] K. R. Žalik, “An efficient k′-means clustering algorithm,” Pattern Recognit. Lett., vol. 29, pp. 1385–1391, 2008.[13] R. Cordeiro de Amorim and B. Mirkin, “Minkowski metric, feature weighting and anomalous cluster initializing in K-Means clustering,” Pattern Recognit., vol.
45, no. 3, pp. 1061–1075, Mar. 2012. 20

THANK YOU…
21
Questions???
K MEANS CLUSTERINGSCHEME
22
22
Figure : k-means Cluster formation
C1C2
C3
C1
C2
C3’= C3
C1’
C2’
C1’
C2’
C3’
C1”= C1
’
C2”= C2
’
C2’
C2”
C1”’= C1
”
C3”’= C3
”
C2”C1
”
C3”
C2”’= C2
”
Distance Metric used: Euclidean

DBSCAN CLUSTERING SCHEME
2323
C1
C2 C3
Core
B1
B2
B3
B4
B5
Border
N1 N2Noise
23
Inputs for the AlgorithmX = DatasetEps = Min. distance between two pointsD = Min. number of points required to make core
Distance Metric used: Euclidean

MULTI-TIER K-MEANS CLUSTERING SCHEME
24
C1
C2
C3
C1
C2
NormalRegion
BorderRegion
NoiseRegion
NormalRegion
BorderRegion
NoiseRegion
Inputs for the AlgorithmX = DatasetV = Expected voltage of Transmission lineS = Allowable range for the line voltage to fluctuate
Distance Metric used: Euclidean