use of domestic minerals for vegetable oil bleaching master of science
TRANSCRIPT

Use of Domestic Minerals for Vegetable Oil Bleaching
By
Yasemin ERTEN
A Dissertation Submitted to the Graduate School in Partial Fulfillment of the
Requirements for the Degree of
MASTER OF SCIENCE
Department: Food Engineering Major: Food Engineering
�zmir Institute of Technology �zmir, Turkey
August, 2004

We approve the thesis of Yasemin ERTEN
Date of Signature ...................................................... 09.08.2004 Assist. Prof. Dr. Handan ERTÜRK Supervisor Department of Food Engineering ...................................................... 09.08.2004 Assist. Prof. Dr. S. Fehime ÖZKAN Co-Supervisor Department of Chemical Engineering ...................................................... 09.08.2004 Prof. Dr. �ebnem HARSA Department of Food Engineering ...................................................... 09.08.2004 Assoc. Prof. Dr. Ahmet YEMEN�C�O�LU Department of Food Engineering ...................................................... 09.08.2004 Assoc. Prof. Dr. Mehmet POLAT Department of Chemical Engineering ...................................................... 09.08.2004 Prof. Dr. �ebnem HARSA Head of Food Engineering Department

ACKNOWLEDGEMENTS
I would like to express my gratitude to my adviser, Assist. Prof. Dr. Handan
Ertürk, for her supervision, support, guidance, and encouragement throughout this
study. I am also grateful to Assist. Prof. Dr. S. Fehime Özkan for her valuable
suggestion and recommendation.
I am grateful to Prof. Dr. �ebnem Harsa, Dr. Hasan Çebi, Dr. Fahri Yemi�çio�lu
and Ferhan Tuncel for their great help in this study.
I would like to thank research specialists: Nesrin Tatlıdil, Filiz Özmıhçı, Evrim
Yakut, Instructor Huriye Göksungur, for their contributions to the characterization
studies and laboratory technicians for their help.
I am especially grateful to my family and my friends for their support, help,
encouragement and understanding.
This thesis is dedicated to my mother Gülten ERTEN.

ABSTRACT
In this thesis, acid activation and characterization studies were conducted for
different clay samples and bleaching capacity of the selected acid activated clay samples
for sunflower oil were determined. The samples selected for this study were naturally
occuring clays from Ankara and Eski�ehir regions. The acid activated zeolite was also
used for the purpose to compare its bleaching performance with commercial bleaching
clay, Tonsil and the acid activated clays.
The clay minerals were activated with hydrochloric acid (HCl) at three acid
concentrations (1 N, 3 N, 5 N), activation times (1h, 2h, 3h) and different dry clay/acid
ratios. The clay samples from the Ankara and Eski�ehir regions were defined as
montmorillonite according to X- ray diffraction (XRD). XRD results proved that acid
activation caused structural changes in the treated montmorillonites, montmorillonite
peaks gradually disappearing and yielding to an amorphous montmorillonite structure.
The TGA results showed a significant weight loss between 30° - 200°C ( ≈15%) for the
Ankara clay and between 20° - 200°C ( ≈12%) for the Eski�ehir clay. This was most
probably due to the removal of free and hydrogen-bonded water molecules. Maximum
surface area was obtained for the acid activated Ankara clay treated with 1 N HCl for 3
hours. It was determined to be 849.1 m2/g. Also, maximum surface area was 269.7 m2/g
for the acid activated Eski�ehir clay treated with 5 N HCl for 1hour. Then the surface
area of the acid activated clays decreased sharply with the acid activation. The chemical
compositions of the solutions and clays after acid activation were determined using ICP
and EDX analysis, respectively. According to the results, the dissolution amount of
CaO, Na2O, MgO, K2O, Fe2O3 and Al2O3 increased along with increasing acid
concentration and treatment time. The SiO2 content and the Si02/Al2O3 ratio increased
as a result of dissolving of aluminium ions. This ratio increased from 6.0 to 7.5 for the
acid activated Eski�ehir clay and from 2.7 to 3.9 for acid activated Ankara clay.
Acid activated clays were tested for the assessment of their bleaching efficiency
for sunflower oil in the laboratory. Bleaching tests were carried out with earths prepared
at different acid activation conditions such as acid concentration and activation times.
The absorbance value was measured at 455 nm and found to be 0.429 for the
neutralized sunflower oil. Peroxide value and free-fatty acid content of the neutralized
oil were found to be 16.8 meq/kg and 0.07 %, respectively. The oil bleached with the

v
acid activated Ankara clay had a peroxide value of 46.2 meq/kg first, which decreased
to 22.4 meq/kg and the free-fatty acid content was observed to be around 0.08 %. For
acid activated Eski�ehir clay, peroxide value of the bleached oil initially increased up to
31.2 meq/kg, then decreased under the peroxide value of neutralized oil (16.8 meq/kg)
and free-fatty acid content of bleached oil approximately was around 0.09 %.
The bleaching parameters which were used for testing were 1 % earth
concentration and 30 minutes contact time at 100°C bleaching temperature. At these
selected parameters, acid activated Eski�ehir clay (5 N 1h HCl treatment), Ankara clay
(1 N 3h HCl treatment) and zeolite (2 N 6h HNO3 treatment) were compared with the
commercial bleaching clay, Tonsil. The smallest value of absorbance and bleaching
efficiency were found to be 0.084 and 80 %, respectively with the Eski�ehir clay and
these values were determined to be 0.083 and 81 % with the Tonsil under the same
conditions. The absorbance value and bleaching efficiency of the bleached oil with acid
activated Ankara clay were determined to be 0.114 and 73 %, respectively using the
selected bleaching parameters. Bleaching performance of Ankara clay was found to be
lower when compared with the result of Eski�ehir clay.
At the selected bleaching point, results of lovibond red and yellow color of
bleached oil indicated that the Eski�ehir clay and Tonsil were close to each other in
bleaching efficiency (Red color: 0.8 and 1.1; yellow color: 20 and 20 for Tonsil and
Eski�ehir clay, respectively). Zeolite did not reach the required bleaching performance.
The bleaching efficiency was 25 % with raw zeolite and it hardly increased to 46 %
with the acid activated zeolite. In addition, red and yellow color values were higher than
the other clays (red color:2.6; yellow color: 30).
As a result, Eski�ehir clay gave a better bleaching performance compared to
Ankara clay and Zeolite. Maximum bleaching efficiency was achieved after 30 minutes
of contact time with 1 % earth concentration at 100 °C bleaching temperature following
5 N 1h HCl treatment for Eski�ehir clay.

ÖZ
Bu çalı�mada farklı kil çe�itlerinin asit aktivasyonu ve karakterizasyonu
gerçekle�tirilmi� ve seçilen aktive edilmi� kil çe�itlerinin ayçiçek ya�ındaki renk açma
kapasiteleri belirlenmi�tir. Çalı�ma için seçilen kil örnekleri Ankara ve Eski�ehir
bölgelerinden temin edilmi�tir. Ayrıca aktive edilmi� zeolit örne�i de ayçiçek ya�ının
renk açma i�leminde kullanılmı�, renk açma performansı ticari a�artma topra�ı olan
Tonsil ve asitle aktive edilen kil örnekleri ile kar�ıla�tırılmı�tır.
Kil örnekleri hidroklorik asit ile farklı asit konsantrasyonlarında (1 N, 3 N, 5 N),
aktivasyon zamanlarında (1 saat, 2 saat, 3 saat) ve farklı asit kil oranlarında aktive
edilmi�tir. X-ı�ınları kırınımı (XRD) sonuçlarına göre Ankara ve Eski�ehir killerinin
montmorillonit mineraline sahip oldukları görülmü�tür. Asit aktivasyon ile killerin
yapısında de�i�ikliklerin meydana geldi�i, montmorillonit piklerinin yava� yava�
kaybolmaya ba�ladı�ı ve amorf bir yapının olu�tu�u X-ı�ınları kırınım sonuçları ile
gözlemlenmi�tir. Termal analiz (TGA) sonuçlarına göre, Ankara kili için 30°C ile
200°C arasında (≈15%), Eski�ehir kili için ise 20 °C ile 200 °C arasında (≈12%)
muhtemelen serbest ve hidrojen ba�lı su moleküllerinden kaynaklanan a�ırlık kaybı
oldu�u gözlenmi�tir. Ankara kili için maksimum yüzey alanı 1 N HCl konsantrasyonu
ve 3 saat asit aktivasyon i�lemi sonucunda elde edilmi� ve 849.1 m2/g olarak
bulunmu�tur. Bu de�er Eski�ehir kili için 5 N HCl konsantrasyonu ve 1 saatlik i�lem
sonucunda 269.7 m2/g olarak bulunmu�tur. Asit aktivasyonuna devam edilmesi
durumunda yüzey alanında dü�me gözlenmi�tir. Asit aktivasyon sonrası elde edilen
çözeltinin ve killerin kimyasal kompozisyonları sırasıyla ICP ve EDX analizleri
kullanılarak tespit edilmi�tir. Sonuçlar ı�ı�ında CaO, Na2O, MgO, K2O, Fe2O3 ve Al2O3
çözünme oranları artan asit konsantrayonu ve zamanla artmı�tır. SiO2 içeri�i ve
Si02/Al2O3 oranı ise Aluminyum iyonunun çözünmesine ba�lı olarak artmı�tır. Bu oran
aktive edilen Eski�ehir kili için 6.0’den 7.5’ye, aktive edilen Ankara kili için 2.7’den
3.9’a yükselmi�tir.
Aktive edilen killer laboratuvarda ayçiçek ya�ının renk açma i�lemi için test
edilmi�tir. Renk açma i�lemi, farklı aktivasyon ko�ullarında örne�in farklı asit
konsantrasyon ve aktivasyon zamanlarında yapılmı�tır. Nötralize ayçiçek ya�ının
absorbans de�eri (455 nm) 0.429, peroksit de�eri 16.8 meq/kg, serbest ya� asit içeri�i
%0.07 olarak bulunmu�tur. Asit ile aktive edilmi� Ankara kili ile yapılan renk açma

vii
i�lemi sonucunda ya�ın peroksit de�eri ba�langıçta 46.2 meq/kg iken daha sonra 22.4
meq/kg’a dü�mü�tür. Serbest ya� asit de�eri % 0.08 civarında bulunmu�tur. Asit ile
aktive edilmi� Eski�ehir kili ile yapılan renk açma i�leminde ise peroksit de�eri 31.2’e
yükselmi� fakat bu de�er 16.8 meq/kg de�erinin altına dü�mü�tür. Serbest ya� asit
içeri�i ise % 0.09 civarında gözlenmi�tir.
Renk açma i�lemi için uygulanan parametrelerden 100°C de %1 toprak
konsantrasyonu ve 30 dakika i�lem zamanı seçilmi� ve bu noktalarda aktive edilmi�
Eski�ehir (5 N, 1 saat HCl), Ankara (1 N, 3 saat HCl), ve Zeolit (2 N, 6 saat HNO3)
topraklarıyla elde edilen sonuçlar ticari olarak aktive edilen kil (Tonsil) ile
kar�ıla�tırılmı�tır. Eski�ehir kili ile yapılan renk açma i�leminden elde edilen en küçük
absorbans de�eri ve renk açma verimi 0.084 ve % 80 olarak bulunmu� ve bu de�erler
aynı ko�ullarda yapılan Tonsil ile 0.083 ve % 81 olarak bulunmu�tur. Aktive edilen
Ankara kili ile yapılan renk açma i�lemi sonucunda ise absorbans de�eri ve renk açma
verimi 0.114 ve %73 olarak tespit edilmi�, renk açma performansı Eski�ehir kiline göre
dü�ük bulunmu�tur.
Renk açma i�lemi için seçilen parametrelerde, aktive edilen Eski�ehir kili ile
Tonsilin lovibond kırmızı ve sarı de�erleri yakın bulunmu�tur (Kırmızı renk : 0.8 ve 1.1
sırasıyla Tonsil ve Eski�ehir kili için, sarı renk: 20 her iki kil için). Aktive edilmi� zeolit
ise istenen renk açma performansını gösterememi�tir. Ham zeolit ile yapılan renk açma
i�leminden elde edilen verim % 25 iken bu de�er ancak aktive edilmi� Zeolit ile % 46
ya yükselebilmi�tir. Ayrıca lovibond kırmızı ve sarı de�erleri (2.6 ;30) di�er örnekler ile
yapılan renk açma i�lemi sonuçlarına göre yüksek bulunmu�tur.
Sonuç olarak Eski�ehir kili ile yapılan renk açma i�lemi en iyi sonucu vermi�tir.
Maksimum renk açma i�lemi 5 N, 1 saat asit aktivasyon sonucunda elde edilen
Eski�ehir kili ile %1 toprak konsantrasyonu ve 30 dakika renk açma parametreleriyle
elde edilmi�tir.

TABLE OF CONTENTS
LIST OF FIGURES .....................................................................................................
x
LIST OF TABLES.......................................................................................................
xii
Chapter 1. INTRODUCTION......................................................................................
1
Chapter 2. THE MINERAL SOURCES ..................................................................... 3
2.1. Definition .................................................................................................. 3
2.2. The Origin of Earths ................................................................................. 3
2.3. Montmorillonite ........................................................................................ 4
2.3.1. Structure ..................................................................................... 4
2.3.2. Applications ............................................................................... 6
2.4. Zeolite ................................................................................................... 7
2.4.1. Structure ..................................................................................... 7
2.4.2. Applications ............................................................................... 8
2.5. Characterization of Mineral Sources ........................................................ 9
2.5.1. X-ray Diffraction Technique ..................................................... 9
2.5.2. Scanning Electron Microscopy and Energy Dispersive X-
ray Analysis .............................................................................. 9
2.5.3. Thermal Analysis ....................................................................... 10
2.5.4 Inductively Coupled Plasma Atomic Emission Spectroscopy
;ICP-AES .................................................................................... 10
2.5.5. Physical Adsorption Method ..................................................... 10
2.6. Acid Activation of Mineral Sources ......................................................... 14
2.6.1. Introduction................................................................................ 14
2.6.2. The Process of Acid Activation and Effects of the Acid
Treatment ....................................................................................
14
Chapter 3. OIL PROCESSING.................................................................................... 17
3.1. Introduction............................................................................................... 17
3.2. Bleaching of Edible Oils........................................................................... 18
3.2.1. The Mechanism of Pigment Adsorption .................................... 21

ix
3.2.2. Important Bleaching Criteria......................................................
24
Chapter 4. EXPERIMENTAL ..................................................................................... 25
4.1. Materials ................................................................................................... 25
4.2. Methods..................................................................................................... 25 4.2.1. Characterization Studies ............................................................ 25
4.2.2. Acid Activation Studies .............................................................. 26
4.2.3. Bleaching Studies ....................................................................... 28
4.2.4. Analysis of Oil and Montmorillonite.......................................... 30
4.2.4.1. Moisture Determination of Montmorillonite ............... 30
4.2.4.2. Moisture Determination of Sunflower Oil................... 30
4.2.4.3. Free Fatty Acid Content............................................... 30
4.2.4.4. Peroxide Value Determination .................................... 30
4.2.4.5. Color Determination .................................................... 31
4.2.4.6. Oil Retention by Adsorbent .........................................
31
Chapter 5. RESULTS AND DISCUSSION ................................................................ 32
5.1. Characterization Studies ........................................................................... 32
5.1.1. Thermal Gravimetric Analysis ................................................... 32
5.1.2. X-Ray Diffraction ...................................................................... 33
5.1.3. Physical Adsorption Measurement ............................................ 36
5.1.4. Scanning Electron Microscopy and Energy Dispersive
X- ray Analysis ....................................................................................
39
5.1.5. Determination of the Chemical Composition by ICP-AES ....... 41
5.2. Bleaching of Sunflower Oil .....................................................................
42
Chapter 6. CONCLUSIONS........................................................................................
56
REFERENCES ............................................................................................................
58
APPENDIX.................................................................................................................. 62
A.1. Characteristics of Acid Activated Clay Samples ..................................... 62
A.2. Characteristics of Commercial and Neutralized Sunflower Oil ............... 65
A.3. Characteristics of Bleached Oils .............................................................. 66

LIST OF FIGURES
Figure 2.1. Figure of SiO4 tetrahedron and Al(OH)6 octahedra ............................ 4
Figure 2.2. The structure of 2:1 type montmorillonite ........................................... 5
Figure 2.3. Schematic drawing of the zeolite pore structure .................................. 7
Figure 2.4. The IUPAC classification for adsorption isotherm ............................. 12
Figure 2.5. Processing of acid activation................................................................ 15
Figure 3.1. Common process for crude vegetable oil refining ............................... 18
Figure 3.2. Decomposition and dehydration of peroxides and secondary
products ................................................................................................
20
Figure 3.3. Flow sheet of bleaching edible oil 21
Figure 3.4. The mechanism of carotenoid adsorption on Brönsted and
Lewis acid sites ....................................................................................
22
Figure 3.5. Acid activation of clay and adsorption of pigment
molecules..............................................................................................
23
Figure 4.1. Flowchart of acid activation of clay..................................................... 28
Figure 4.2. Experimental flowchart of bleaching ................................................... 29
Figure 4.3. Mechanism of bleaching of sunflower oil............................................ 29
Figure 5.1. Thermogravimetry curves of Ankara and Eski�ehir clays ................... 32
Figure 5.2. X-ray diffractogram of natural Eski�ehir clay...................................... 33
Figure 5.3. X-ray diffractogram of natural Ankara clay......................................... 34
Figure 5.4. X-ray diffractogram of the acid activated Eski�ehir clays ................... 35
Figure 5.5. X-ray diffractogram of the acid activated Ankara clays ...................... 35
Figure 5.6. Nitrogen adsorption isotherms of the natural and
representative acid activated Eski�ehir clays and Tonsil .....................
36
Figure 5.7. Nitrogen adsorption isotherms of the natural and
representative acid activated Ankara clays and Tonsil ........................
37
Figure 5.8. Surface area of raw and acid activated Eski�ehir clays........................ 38
Figure 5.9. Surface area of raw and acid activated Ankara clays........................... 38
Figure 5.10. SEM microphotograph of natural form of the Eski�ehir clay .............. 39
Figure 5.11. SEM microphotograph of natural form of the Ankara clay ................. 39
Figure 5.12. UV absorbance spectra of neutralized oil and treated
sunflower oil.........................................................................................
43

xi
Figure 5.13. Absorbance value of bleached oil with acid activated
Ankara clay (A1-2) ..............................................................................
44
Figure 5.14. Absorbance value of bleached oil with acid activated
Ankara clay (A1-3) ..............................................................................
45
Figure 5.15. Peroxide value of bleached oil with acid activated Ankara
clay (A1-2) ...........................................................................................
45
Figure 5.16. Peroxide value of bleached oil with acid activated Ankara
clay (A1-3) ...........................................................................................
46
Figure 5.17. Free-fatty acid content of bleached oil with acid activated
Ankara clay (A1-2) ..............................................................................
46
Figure 5.18. Free-fatty acid content of bleached oil with acid activated
Ankara clay (A1-3) ..............................................................................
47
Figure 5.19. Absorbance value of bleached oil with acid activated
Eski�ehir clay (E1-1)............................................................................
48
Figure 5.20. Absorbance value of bleached oil with acid activated
Eski�ehir clay (E3-1)............................................................................
48
Figure 5.21. Absorbance value of bleached oil with acid activated
Eski�ehir clay (E5-1)............................................................................
49
Figure 5.22. Peroxide value of bleached oil with acid activated Eski�ehir
clay (E1-1)............................................................................................
49
Figure 5.23. Peroxide value of bleached oil with acid activated Eski�ehir
clay (E3-1)............................................................................................
50
Figure 5.24. Peroxide value of bleached oil with acid activated Eski�ehir
clay (E5-1)............................................................................................
50
Figure 5.25. Free-fatty acid content of bleached oil with acid activated
Eski�ehir clay (E1-1)............................................................................
51
Figure 5.26. Free-fatty acid content of bleached oil with acid activated
Eski�ehir clay (E3-1)............................................................................
51
Figure 5.27. Free-fatty acid content of bleached oils vs. time for
Eski�ehir clay (E5-1)...........................................................................
52
Figure 5.28. Absorbance value of bleached oil at selected points 53

xii
LIST OF TABLES
Table 4.1. Codes of raw and acid activated Eski�ehir and Ankara clays ................ 27
Table 5.1. Chemical composition of raw and acid activated Eski�ehir
clays ........................................................................................................
40
Table 5.2. Chemical composition of raw and acid activated Ankara
clays ........................................................................................................
40
Table 5.3. Chemical composition of acid activated Zeollite and
commercially activated bleaching clay,Tonsil .......................................
40
Table 5.4. Chemical compositions of the Ankara and Eski�ehir clay ................... 41
Table 5.5. The removal percentage of cations for Eski�ehir clay after
acid activation.........................................................................................
42
Table 5.6. The removal percentage of cations for Ankara clay after acid
activation ................................................................................................
42
Table 5.7. Lovibond red and yellow color of bleached oil at selected
point ........................................................................................................
54
Table 5.8. Oil retention values of representative acid activated clay
samples and zeolite............................................................................
55
Table A.1. Surface area and pore diameter of raw and acid activated
Eski�ehir clays ........................................................................................
62
Table A.2. Surface area and pore diameter of raw and acid activated
Ankara clays ..........................................................................................
63
Table A.3. Surface area and pore diameter of Tonsil ............................................... 63
Table A.4. Surface area and micropore volume of acid activated zeolite ................ 64
Table A.5. Moisture content of acid activated Eski�ehir and Ankara
clays ........................................................................................................
64
Table A.6. Characteristics of commercial sunflower oil .......................................... 65
Table A.7. Characteristics of neutralized oil before bleaching ................................ 65
Table A.8. Neutralized oil characteristics kept at 100°C bleaching
temperature without any acid activated clays.........................................
65
Table A.9. Results of bleaching experiments with 0.5 % earth
concentration (w/w), at 100°C and15 minutes........................................
66

xiii
Table A.10. Results of bleaching experiments with 1 % earth
concentration (w/w), at 100°C and 15 minutes.......................................
66
Table A.11. Results of bleaching experiments with 1.5 % earth
concentration (w/w), at 100°C and 15 minutes.......................................
67
Table A.12. Results of bleaching experiments with 0.5 % earth
concentration (w/w), at 100°C, 30 minutes.............................................
67
Table A.13. Results of bleaching experiments with 1 % earth
concentration (w/w), at 100°C and 30 minutes......................................
68
Table A.14. Results of bleaching experiments with 1.5 % earth
concentration (w/w), at 100°C and 30 minutes.......................................
68
1
CHAPTER 1
INTRODUCTION
In edible oil refining, either by chemical or physical process, the bleaching
treatment is a critical step and the conditions for bleaching step depend on the type of
crude oil and its quality. The main task of bleaching is the removal of color pigments
and the decomposition of hydroperoxides. This increases the shelf life and aesthetic
value of the product (Baranowsky et al. 2001).
For bleaching process, bleaching clays are used. Neutral clays, activated earths,
synthetic silicates and carbon black are the basic kinds of materials used in edible oil
bleaching (Wiedermann 1981). Bleaching earths mainly consist of bentonites or
montmorillonites, and these are finelly crystalline silicate of aluminium with various
amounts of alkali metals and transition metals (Tsai et al. 2002).
Compared to naturally active clays, activated bleaching earths indicate higher
activity. So acid treatment is applied to neutral clays to enhance sorptive properties. The
activation of montmorillonite is usually done with mineral acid (hydrochloric acid or
sulphuric acid) and the specific surface area (BET) is increased by this treatment. The
amount of acid and conditions depend on the raw clays used and the maximum activity
depends also on the type of oil (Baranowsky et al. 2001).
The principal goal of the use of bleaching clays is the elimination of a series of
contaminants that can be divided into three groups. That are primary, secondary and
tertiary. The primary contaminants are oil soluble components; proteins, sterols,
tocopherols, hydrocarbons and natural pigments. The secondary contaminants are
organic compounds; free fatty acids, peroxides, ketones, aldehydes. The tertiary
contaminants are chemical compounds; solvents, biocides, soaps, heavy metals (as Fe+3
and Cu+2), phosphoric and citric acid and others (Valenzuela Diaz and Souza Santos
2001).
Processing crude oils to finished edible food products is obtained by several
factors;
��Consumer preferences
��Sensory quality and stability characteristic of oils

2
��Preparation of hardened products from vegetable oils, such as margarines (Mounts
1981).
In Turkey, Tonsil has been used as commercially activated bleaching earth. Tonsil is
produced from natural bentonites by activation. Turkey exports raw bentonite especially
to Germany and then imports activated bleaching earth from the other countries.
Bentonitic earths do not evaluated enough for using in vegetable oil refining in the
domestic market. The scope of this study is the evaluation and activation of domestic
earths from Ankara and Eski�ehir regions with different process parameters for
activation and bleaching process and to compare their bleaching efficiency with Tonsil.
Also, acid activated zeolite was used in the bleaching of sunflower oil to see its
bleaching efficiency and compared with activated clay samples.

3
CHAPTER 2
THE MINERAL SOURCES
2.1. Definition
The term bentonite was first used to describe clay material hosted by the Benton
Shale of Wyoming, U.S.A. Subsequently a number of definitions have been used for
bentonite based on mineralogy and/or origin and/or end usage. With respect to industrial
minerals the following definition is useful: Clay consisting essentially of minerals of the
smectite clay mineral group and physical properties are dictated by the dominant
mineral, regardless of mode of origin and occurrence. Clay material with a capacity to
decolorize and purify oil to commercial grade is also composed of smectite clay
minerals, but the dominant mineral is calcium montmorillonite (Vancouver 1994).
Another mineral source is the alumino-silicate crystal structure known as
“zeolite” which has uniformly sized pores throughout its crystal structure. The crystal
structure for the types of zeolite is determined by the ratio of silicon to aluminum in the
crystal when the crystal is formed. All naturally occurring zeolite is hydrophilic and
contains aluminium. Dealuminizing natural zeolite makes it hydrophobic.
2.2. The Origin of Earths
Bentonites have formed for several million years through alteration such as
weathering of volcano ash which settles in valleys and shallow areas of ground and
multiple layers form and thus small bentonite deposits develop. Bentonite is a clay–rich
material mainly consisting of smectite. Smectite is including montmorillonite,
beidellite, nontronite, saponite, hectorite, sauconite, and stevensite (Mounts 1981). The
smectite is primarily montmorillonite. Bentonite contains also feldspar, chalcedony,
quarts, plagioclase, calcite, dolomite, analcite, pyrite, etc.
Natural zeolites are found in various settings such as solids and
land surfaces, marine deposit, alkaline lakebeds and geothermal deposits. There are
about 40 known naturally occuring zeolites species in addition to about 150 synthetic
species.The most common natural zeolites are clinoptilolite, mordenite, chabazite,

4
phillipsite, erionite, analcime and ferrierite. One of them, clinoptilolite is the most
abundant (Christie et.al 2002).
2.3. Montmorillonite 2.3.1. Structure
The clays are one of the more important industrial minerals defined as a natural,
earthy, fine-grained material and are composed mainly of silicon, aluminum, oxygen or
hydroxyl group but they may also contain appreciable quantities of iron, alkalies, and
alkaline earths. As seen from the Figure 2.1, the silicon atom is equidistant from four
oxygens or hydroxyls arranged in a tetrahedron and the tetrahedrons are combined to
form a hexagonal network and the aluminium is embedded at the centre of an
octahedron of six oxygens or hydroxyls. The network of octahedrons between the silica
layers share the oxygen-hydroxyl atoms.
Figure 2.1. Figure of SiO4 tetrahedron and Al(OH)6 octahedra.
Chemical composition of the clay mineral is based on a hydroxyl-
aluminosilicate framework and mainly composed of plate-like particles and layer
structure divided into three types, 1:1, 1:2 and 2:1:1 layers and also having slit-shaped
pores (Mounts 1981, Tsai et al. 2002). The individual layers are held together (i.e. Van
der Waals attractive forces, hydrogen bonding or weak electrostatic attraction)
(Rouquerol 1999). The structure of 2:1 type montmorillonite is represented in Figure
2.2.
The smectite group of clay mineral consists of several clay minerals and the
most important industrially minerals are sodium montmorillonite and calcium
montmorillonite (Murray 2000). If the dominant exchangeable cation is calcium, then
the mineral in the smectite group is calcium montmorillonite and if it is predominantly
sodium, it is sodium montmorillonite (Murray 2000). Sodium ions are monovalent and
lead to a higher swelling capacity compared to calcium ions which is bivalent and used

5
for the decolorization of vegetable, animal and mineral oils due to lower swelling
capacity. The acid activation of clays are made on non-swelling smectites (Ca-
bentonite). Because the swelling bentonites may show processing difficulties as high
viscosity dispersions and difficult mass transport on the acid activation process
(Valenzuela Diaz and Souza Santos 2001).
Figure 2.2. The structure of 2:1 type montmorillonite (Chitnis and Sharma 1997).
The properties of natural montmorillonite can be enhanced generally by alkaline
activation, organic modification and acid activation, due to the substitution of
exchangeable cations in the interlayered area or partially dissolving of the cations in the
octahedral area. The properties of the modified montmorillonite are related to structural
parameters and its modified chemical composition (Lu et al. 2003).
Isomorphic substitution is the substitution of one cation for another in the
mineral structure and major source of negative, permanent charge in soils. Substitution
in the octahedral sheet (Fe+2 and / or Mg+2 for Al+3) and in the tetrahedral sheet (Al+3 for

6
Si+4) causes negative charge on the outer basal oxygens (Bray and Redfern 1999). The
replacements leave a negative charge on the crystalline surface, which is neutralized by
positive ions such as Ca+2, Na+, Mg+2, K+, and H+. These ions are known as
exchangeable cations (Morgan et al. 1985). Due to the substitutions, the 2:1 layers are
not electrically neutral so they have a negative charge balanced by interlayer
exchangeable cations and their amount indicates the cation-exchange capacity (CEC) of
the clay (Valenzuela Diaz and Souza Santos 2001, Chitnis and Sharma 1997).
By the acid activation the aluminium ions are replaced with hydrogen ions, so
bleaching power of montmorillonite increased and montmorillonite readily taking up
water and organic molecules between the aluminosilicate sheets (Bray and Redfern
1999).
2.3.2. Applications
Some important properties of clay minerals that relate to their applications:
��2:1 layer,
��Tan, olive green, gray or white colors,
��Octahedral and tetrahedral substitutions which creates a charge imbalance in the 2:1
layer,
��High layer charge,
��High base exchange capacity,
��Thin flakes and laths,
��Very high surface area,
��High adsorption capacity,
��High viscosity (Murray 2000).
Clays are important in process industries, engineering, construction, agriculture,
geology and environmental applications. Some of them are used for decolorization,
chemical carriers, ceramics, paper, paint, drilling fluids, plastics, liquid barriers and
catalysis. Improvement of mining and processing techniques will lead to growth of
traditional clay applications (Murray 2000). In most these applications, uses of
montmorillonite are the consequence of its properties such as ion exchange, plasticity,
swelling, density, compaction, etc (Bala et al. 2000).

7
2.4. Zeolite
2.4.1. Structure
Zeolites are crystalline, porous 3-dimensional aluminosilicates of the alkaline-
earth (mainly Ca) and alkali (mainly Na and K) metals (Christie 2002). They belong to
the class of minerals known as “tectosilicates” with uniform nanometersized pores and
shape of the rings of oxygen contrasts with the wide range of pore sizes in activated
alumina, silica gel and activated carbon (Mumpton 1999). Their three dimensional
framework is composed of tetrahedral Al0-54 and SiO-4
4 units that are combined by
oxygen atoms (Christie 2002). Collective polyhedra from frameworks are generally
open and contain channels and cavities thus zeolites are able to gain and lose water
reversibly and to exchange extraframework cations without change of crystal structure.
Small molecules can pass through entrychannels, but larger molecules are excluded
(Mumpton 1999). All zeolites are molecular sieves that can selectively adsorb
molecules on the basis of their size, shape or electrical charge (Christie 2002). Because
of the strong local electrical dipole moment in the lattice framework, zeolites adsorb all
polar and non-polar molecules into their specific framework. The schematic drawing of
the zeolite pore structure is given in Figure 2.3.
Figure 2.3. Schematic drawing of the zeolite pore structure (Chau et al. 2002).

8
The extraframework cations weakly bonded can be exchanged by washing with
a strong solution of another cation. The CEC (cation exchange capacity) of a zeolite is a
function of the amount of Al. Al substitutes for Si in the framework tetrahedra so if the
Al content is greater, extraframework cations is needed to balance the charge (Mumpton
1999).
High-silica zeolites are important in refining and petrochemical applications.
The crystallization involves complete filling of the void regions by an organo-cation
guest molecule. Afterthat, the guest molecule is thermally decomposed (Wu et al.
2002).
Clinoptilolite is a zeolite of the heulandite group being the most abundant in
nature. This zeolite contains three channels, limited by a system of tetrahedral rings.
These channels are occupied by water molecules and compensating cations, which
neutralize the anionic charge of the framework. It is well established that the multiple
uses of these materials are based on their physicochemical properties, which explain
their wide range of applications in numerous agricultural and industrial areas (Rivera
2000).
Many of the naturally occuring zeolites can be created synthetically. One major
advantage of zeolites is that they are naturally occuring and they are often very cheap.
Natural zeolites do not compete with their synthetic counterparts (zeolites) in catalytic
and adsorption applications. Because they have lower adsorption capacities and most
natural materials have smaller pore openings than the others (Mumpton 1999).
2.4.2. Applications
Zeolites are used for a variety of applications ranging from catalytic cracking of
hydrocarbons in petroleum refining to separations.
Like talc, diatomite, vermiculite and bentonite, zeolite minerals possess;
��Cation exchange,
��Attractive adsorption,
��Dehydration-rehydration,
��Catalysis properties (Mumpton 1999).

9
2.5. Characterization of Mineral Sources
Characterization studies are necessary to characterize the clays obtained from
different regions to see whether they have desired properties or not.
In this section, five of characterization techniques used in this study are
summarized. These are;
��X-ray diffraction (XRD),
��Scanning electron microscopy and energy dispersive X-ray analysis,
��Termal analysis (TGA),
��Inductively coupled plasma atomic emission spectroscopy ; ICP-AES
��Physical adsorption measurement.
2.5.1. X-Ray Diffraction Technique
X-rays are photons produced easily by bombarding a material surface with a
wavelength of the order of a fraction of a nanometre compared with the hundreds of
nanometres of light waves. X-ray beam incident on a material penetrates many
micrometres into the bulk and the direction of the diffracted beam intensity is
determined by the periodicity of the atom planes in the crystalline solid (Flewitt and
Wild 2003).
Beam of characteristic X-rays of wavelength λ is incident on a single crystal
surface at an angle θ which produces a diffracted beam. The diffracted beam intensity
provides a measure of the distribution and position of atoms within the crystal. The
position of intensity peaks in the diffracted beam is characteristic of the material
examined and unknown phases can be identified by comparision with standards, JCPDS
Powder Diffraction File (Flewitt and Wild 2003).
2.5.2 Scanning Electron Microscopy and Energy Dispersive X-ray Analysis
The electron gun operates typically over a voltage range 0-30 keV sometimes
extending up to 60 keV depending upon the type of instrument. The specimen is
scanned by the incident electron beam and electrons emitted from the surface are

10
collected and amplified to form a video signal (Flewitt and Wild 2003). For examining
the microstructure of materials, SEM is one of the techniques.
2.5.3. Thermal Analysis (TGA)
Thermogravimetric analysis a complementary analytical technique that quantify
the details of thermally induced reactions in clays. It gives information about the water
content and types of water in the structure. Therefore, by thermogravimetric analysis
weight loss of samples can be determined as it is heated to elevated temperatures in a
certain atmosphere. Thermogravimetric analysis of the clay samples indicated the
removal of free water molecules around 100° C and hydrogen bonded and coordinated
water molecules around 200°C. Dehydroxylation of the samples takes place through a
wide range of temperature, but maximum dehydroxylation takes place at 600-750°C
(Bala et al. 2000).
2.5.4. Inductively Coupled Plasma Atomic Emission Spectroscopy ; ICPAES
Atmospheric-pressure inductively coupled plasmas (ICPs) are flamelike
electrical discharges and the practice of elemental and isotopic ratio analysis have been
revolutionized. In all major ICP-based methods (ICP-AES, ICP-AFS, ICP-MS), the test
sample is typically converted to an aerosol and transported into the plasma where the
desolvation, vaporization, atomization, excitation, ionization processes occur. ICP-MS
and ICP-AES are the two most powerful means for rapid, multielement determinations
among the cited methods (Montaser et al. 1998). Determining elemental concentrations
are translated to oxide formula to indicate the final composition of materials.
2.5.5. Physical Adsorption Method
Adsorption is a surface phenomenon which depends on the specific affinity
between solute and adsorbent (Rossi et al. 2003). Whenever a solid surface is exposed
to gas or liquid, adsorption occurs. Adsorption techniques also are used for the
characterization of the surface properties and texture of fine powders. In addition to
these, in many academic and industrial laboratories on porous materials such as clays,
ceramics and membranes undertake adsorption measurements. Especially, gas

11
adsorption procedures are used for determining the surface area of a diverse range of
powders and porous materials (Rouquerol et al. 1999).
In adsorption two kinds of forces are involved; physical adsorption
(physisorption) or chemisorption (Rouquerol et al. 1999). Weak forces are referred to
Van der Waals forces and promote a physical adsorption. Physical adsorption is
reversible at the same temperature by lowering the pressure (Patterson 1992). A second
type of the adsorption depends upon forces of chemical attraction between the surface
and solute molecules in a liquid. This is called chemisorption. Chemisorption of β-
carotene occurs on aluminosilicate surfaces with some of the exchangeable cations
acting as active sites (Kheok and Lim 1982). In the bleaching of oils with adsorbents
Van der Waals (physical) adsorption and chemical forces (chemisorption) can play a
part. This depends upon the adsorbent, the nature of the minor component (adsorbate)
and the conditions of their contact (Patterson 1992).
Bulk of the adsorption occurs in mesopores and micropores of the clay (Hajjaji et
al. 2001). These pores of minerals are classified by their sizes ;
��Pore < 2 nm called micropores
��2 nm< pore <50nm called mesopores
��Pore > 50 nm called macropores (Valenzulela Diaz and Souza Santos 2001)
Adsorption Isotherms
The adsorption isotherm is the relation between the amount adsorbed and the
equilibrium pressure or concentration at constant temperature. The overall shape of an
isotherm is managed by the nature of the gas-solid system, the operational temperature
and the pore structure of the adsorbent (Rouquerol et al.1999).
At very low surface coverage, linearity of the isotherm is usually observed. The
deviation from linearity may be toward the pressure depends on the scale of surface
heterogeneity and the magnitude of the adsorbate-adsorbate interactions. The various
physisorption mechanisms are discussed by using the six major types of isotherms in the
IUPAC classification as shown in Figure 2.4. (Rouquerol et al.1999).

12
Figure 2.4. The IUPAC classification for adsorption isotherm.
Clay minerals (which are aggregated powders) appear to give normal Type II
isotherms. Type II isotherms are obtained with aggregates of plate-like particles
(Rouquerol et al.1999).
BET (Brunauer-Emmett-Teller) Model
Gas adsorption technique is applied for the determination of surface area. The
BET method is still used as a standart procedure for surface area determination. The
original BET treatment obtained an extension of the Langmuir kinetic theory of
monomolecular adsorption to an infinite number of adsorbed layers. The adsorbed
molecules in one layer can act as adsorption sites for molecules in the next layer at any
pressure below the saturation vapour pressure p° fractions of the surface (θο, θ1,
θ2,…………θi,….) are covered by 0,1,2,….i,…layers of adsorbed molecules (θο represents
the fraction of bare surface) in the BET model. Nitrogen (at 77K) is the most suitable
adsorptive for standard surface area determination ( Rouquerol et al. 1999).
At equilibrium, characterized by the pressure p and θο (bare surface) and θi
(covered surface) remain constant. The rate of condensation on the bare surface can be
equated the rate of evaporation from the first layer:
a1pθο = b1θ1exp(-E1/RT) (2.1)

13
where a1, b1 : adsorption and desorption constant for the first layer,
E1 : the positive value of the so-called energy of adsorption in the first layer.
Assume that; a1, b1 and E1 are independent of the quantity of adsorbed molecules.
In the same way, at the equilibrium pressure p, the fractions of the surface θ2,
θ3,…. θI,..must remain constant, so;
a2pθ1 = b2θ2exp(-E2/RT)
a3pθ2 = b3θ3exp(-E3/RT)
. .
. .
aipθi-1 = biθiexp(-Ei/RT) (2.2)
where θi-1 : surface covered by i-1 layer
θI : surface covered by i layer,
ai and bi : adsorption and desorption constant respectively,
Ei : energy of adsorption in the ith layer.
The sum of the fractions of surface equals unity:
θ0 + θ1 +…….+θi +…..= 1 (2.3)
n = nm[1θ1 +2 θ2 +…….+iθi +…..] (2.4)
ai, bi and Ei are different for each adsorbed layer in pirinciple but two main assumption
are used for the derivation of the BET isotherm equation.
i) The energy of the adsorption Ei has the same value for the second and all higher
layers as the liquefaction anergy, EL, of the adsorptive (i.e. E2=Ei=EL).
ii) The multilayer has infinite thickness at p/p0=1 (i= ∞).
BET model can be described as:
nmn =
)1)(1( CXXXCX
+−− (2.5)
where X= p/p0
C ≈ exp (E1-EL) / RT
E1-EL : net molar energy of adsorption
Equation (2.5) can be written in the linear form:

14
p 1 C-1 p = * (2.6)
n(po-p) nmC nmC po
The BET plot (p / n(p0-p) versus p/po ) should be straight line with slope = (C-1)/nmC
and intercept = 1/(nmC) over the apprioximate range p/po = 0.05-0.3.
The specific surface area a (BET) is obtained from the BET monolayer capacity, nm.
a(BET) = nmLσ (2.7) where L: Avogadro constant,
σ: average area occupied by each molecule in the completed monolayer (σ = 16.2 Å2 for
N2 molecule).
2.6. Acid Activation of Mineral Sources
2.6.1. Introduction
Natural active clays possess some bleaching activity and show a high adsorption
capacity due to their high surface area. However, compared to naturally active clays,
activated bleaching clays show a much higher activity (Baranowsky et al. 2001).
Activated bleaching earth was first produced by Pfirschinger Mineralwerke in 1907 and
by Erdwerke Kronwinkl Franz Schmidt & Co. GmbH in 1909 (Baranowsky et al. 2001).
Acid treatment is carried out with concentrated mineral acids such as sulfuric,
hydrochloric and phosphoric acids (Chitnis and Sharma 1997). Chemical composition
and physical structure of montmorillonite changes during acid activation to maximize
specific properties (Morgan et al. 1985). In addition, by exchanging the inorganic
cations (Ca+2, Na+, K+) with organocations, the hydrophilic aluminosilicate surface of
montmorillonite can be rendered hydrophobic (Lu et al. 2003, Madejova 2002).
2.6.2. The Process of Acid Activation and Effects of the Acid Treatment
Adsorbents are activated by a mineral acid treatment resulting in the de-
lamination of the structure, a number of metal ions in the octahedral layer and
impurities such as calcite are also removed by leaching with an inorganic acid at
+

15
elevated temperatures (Sarıer and Güler 1987, Valenzulela Diaz and Souza Santos
2001). In addition to these, the edges of the platelets are opened and as a result of all
these changes, the pore diameters and the surface area increase. The pores with the
diameters and the surface area with acid treatment range from 2.0-6.0 nm and 200-400
m2 / g respectively (Valenzulela Diaz and Souza Santos 2001). The higher the degree of
activation, the higher the degree of cation substitution by the H+ ions of the acid in the
clay structure such as Ca-Bentonite + 2H+ ↔ H-bentonite + Ca+2. Such treatment leads
to leaching of aluminium, magnesium and iron cations from the octahedral layer to
partial removal of aluminium ions from the tetrahedral layer that relocated in the
interlayer space (Flessner 2001). The processing of acid activation is represented in
Figure 2.5.
Figure 2.5. Processing of acid activation (Richardson 1978).
Acid and catalytic properties of acid activated clays must be taken into account.
The change in surface area, porosity and the type and concentration of the ions in the
exchangeable site are observed due to the acid treatment of the clay. Al+3 and Mg+2 ions
are removed from the octahedral sites in the clay during acid activation and relocated in
the interlayer space and they act as acid centers. Thus acid activation promotes catalytic
activity by increasing the number of Brönsted and potential Lewis acid sites. The
Brönsted acidity of clay is either due to free acid or due to the dissociation of water
molecules (Chitnis and Sharma 1997). The acid properties of them increase free fatty
acids by splitting triglyceride molecules and the catalytic properties are responsible for
the decomposition of peroxides (Valenzulela Diaz and Souza Santos 2001).
The most bentonites are not suitable for activation because of high natural
bleaching power, however, most clays are poor in natural bleaching activity used for
activated clay products (Richardson 1978). Therefore, acid treated clays will be
Mining Crushing Acid treatment Washing
Filtering Drying Grinding Sizing

16
preferred over the natural clays due to large specific surface area and high adsorption
ability for most commercial applications (Lu and Cui 2001).
The nature and type of clay, concentration of the acid, temperature and the time
of treatment are the important parameters for acid activation process (Chitnis and
Sharma 1997).
Activated bleaching earth is a;
��Solid acid
��Acidic catalyst
��Adsorptive agent
��Cation exchanger
��Filter aid (Baranowsky et al. 2001)

17
CHAPTER 3
OIL PROCESSING
3.1. Introduction
About 70 % of all oils and fats produced in the world are vegetable origin. Oils
are provided from soya bean, olive, sunflower, cottonseed, palm, coconut, rapeseed,
nuts and seeds of plants such as corn (maize) and groundnut. Sunflower oil is obtained
from the seed of the plant Helianthus annuus and oil content of it is 22-36%. Color of
crude sunflower oil is light amber. When bleaching process is applied, color of it is a
pale yellow (Sontag 1979).
The principal impurities of oil are water, free-fatty acids (FFA), pigments,
phosphatides, partial glycerides, oxidation products and trace elements such as sulfur,
iron, copper, and halogens (Subramanian 1998). These impurities are removed at
various steps in the conventional chemical refining, which includes degumming,
neutralization, washing, drying, bleaching, filtration, and deodorization (Subramanian
1998). Degumming is done to remove phosphatides. Hydratable phosphatides can be
precipitated by adding water to the oil, nonhydratable phosphatides must be destroyed
by adding acids. Free-fatty acids are removed by neutralization with alkali hydroxides
leading to soaps which can be removed. Undesirable coloured impurities are removed
by bleaching with an adsorptive reagent. The undesirable compounds are adsorbed and
can be removed together with the adsorbent by filtration. The last step is deodorization
and by this step undesirable volatile and odoriferous materials are removed (Haas and
Mittelbach 2000). Common process for crude vegetable oil refining is given in Figure
3.1.

18
Seeds
Miscella
Crude oil Evaporation
water lecithin
Degummed oil
sodium hydroxyde soapstocks
water wastewater
Neutralized oil
earth spent earth
steam condensate
Refined, Bleached and Deodorized Oil
Figure 3.1. Common process for crude vegetable oil refining (Pioch et al. 1998).
3.2. Bleaching of Edible Oils
The bleaching process is applied after degumming and neutralization in the
chemical refining and it is more appropriately referred to as adsorption treatment. Crude
edible oil still contain undesirable substances such as free-fatty acids, gummy materials
and colouring matters. Colouring matters are due to the presence of pigments in the
Crushing
Extraction or pressing
Degumming
Neutralization
Washing
Drying
Bleaching
Deodorization

19
crude edible oil. These pigments consist of carotenoids, chlorophyll, gossypol and
related compounds (Reddy et al. 2001). In addition to these, crude edible oil contains
soap residues, phosphatides and metals at trace concentrations (Boukerroui and Ovalı
2002). These substances affect the quality of the end-product by alteration of its taste
and colour, the process efficieny and also affect its market value. These impurities from
crude oils are removed by using the materials with a strong adsorption power. These
materials are called bleaching earths which are usually bentonites activated by heating
with strong acids (Boukerroui and Ovalı 2002).
The oil must be dry before bleaching process. Because if the oil contains some
moisture, free-fatty acid content of it will increase. Soap should be removed by washing
after the neutralization process. Because soap content of oil effects the adsorbent
capacity (Mounts 1981).
Bleaching of oils is a process whereby the clay adsorbents is mixed with the oil
under specified conditions to remove unwanted color bodies and other contaminants
(Richardson 1978). The primary function of the bleaching process is to remove
peroxides and secondary oxidation products. In addition, pigments and any traces of
gums and soaps from refining are removed (Wiedermann 1981). The process affect
significant color reduction. Bleaching process is a combination of catalytic action such
as peroxide destruction and equilibrium adsorption for instance pigment removal from
oil (Reddy et al. 2001). The peroxides are decomposed into volatile aldehydes and
ketones due to further oxidation. Decomposition and dehydration of peroxides and
secondary products are represented in Figure 3.2. These products are also adsorbed by
bleaching earths (Subramanian et al. 2001).

20
-CH=CH-CH=CH-CH-CH2- (Peroxide) OOH
Activated Clay O
-CH=CH-CH=CH-C-CH2- + H2O
-CH=CH-CH=CH-CH=CH- + H2O
-CH=CH-CH2-CH-CH2- (Secondary Oxidation Product) OH
Activated Clay
-CH=CH-CH=CH-CH2- + H2O
Figure 3.2. Decomposition and dehydration of peroxides and secondary products
(Wiedermann 1981).
Bleaching process needs to be carried out under steam / nitrogen blanket or
vacuum. Because the activated clay may act as a catalyst for oxidation in the presence
of oxygen at the elevated temperatures. Then, oxidation products lead to degeneration
and short shelf life of the final product (Reddy et al. 2001).
The general bleaching process is carried out contact temperature in the range of
80-120 °C and contact time ranging from 20-40 minutes under vacuum. The dosage of
bleaching earth can vary depending on oil type. Chemical refining usually uses 0.5-2%
on a weight basis. However, 2-4 % bleaching earth can be used to meet final color
requirements (Valenzulela Diaz and Souza Santos 2001). Flow sheet of bleaching edible
oil is shown in Figure 3.3.

21
Bleaching Clay
Degummed and/or
neutralized oil Bleached oil
clay and adsorbed impurities
Figure 3.3. Flow sheet of bleaching edible oil.
Oil retention is the characteristic of activated bleaching clays. Acid activation
lowers the natural clay’s density and increases its oil retention. Because the lower the
density and the more void space, the more oil is retained in the used earth. Thus, less
amounts of the more activated clays are required to decrease the net oil loss
(Wiedermann 1981). Generally oil loss results from oil lost to filter cake (Bera et al.
2004).
For oil retention a typical value is approximately 40%. This value can be
reduced to 20-30% by suitable procedures such as steam or nitrogen at the end of the
filtration. That is for each 100kg of fresh bleaching earth 25-45 kg of oil are lost
(Baranowsky et al. 2001).
3.2.1. The Mechanism of Pigment Adsorption
The coloration in sunflower oil is mainly due to carotenoids (predominant red /
yellow color) and small amounts of chlorophyl pigments. The reduction in carotenoids
present in the oil results in mainly decolorization and maximum reduction in color are
observed during bleaching or decolorization step (Subramanian et al. 1998, Reddy et al.
2001).
Carotene is nutritionally valuable substances, as precursors of vitamin A and for
their antioxidant properties in the body. β-carotene is known for the rapid degradation
induced by the exposure to light or oxygen. Also the decomposition of β-carotene are
catalysed by metallic ions such as Fe+3 or Cu+2. These metallic ions highly probable are
present on the surface of the adsorbent. They catalyse the reaction or serve as active
sites for the chemisorption of β-carotene (Khoo et al. 1978).
Water removal
Oil/clay Suspension formed
Impurities adsorbed by the clay
Filter

22
Pigments are either disolved in the oil or present in the form of colloidally
dispersed particles. They has olefinic groups which can be protonated by the acidic
groups (Hui 1996, Srasra and Trabelsi-Ayedi 2000). Adsorption of carotenoid can be
catalysed by the Brönsted and the Lewis acidity as shown in Figure 3.4 (Srasra and
Trabelsi-Ayedi 2000). �-carotene attaches to the clay surface in the form of carbonium
ions either by forming coordination bonds with Lewis sites or by forming hydrogen
bonds with Brönsted sites of the activated clay mineral (Sarıer and Güler 1989).
Figure 3.4. The mechanism of carotenoid adsorption on Brönsted and Lewis acid sites
(Srasra and Trabelsi-Ayedi 2000).

23
�-carotene is both electron donor and acceptor and reacts with acid centers of
the activated clay surface by means of its seventh carbon atom (Richardson 1978). The
cations at the strongly acidic sites are ready to donate a proton to the pigment
molecules. Pigment molecules are ready to accept it because of containing electrophilic
bonds. As a result, the pigment molecules are held to the clay surface by electrostatic
attraction (Patterson 1992). Acid activation of clay and adsorption of pigment
molecules are represented in Figure3.5.
Figure 3.5. Acid activation of clay and adsorption of pigment molecules (Chitnis and
Sharma 1997).
Removal of color pigments is necessary from the viewpoint of shelf life as well
as aesthetic value (Reddy et al 2001). In the subsequent deodorization step, almost all
the thermally degradable pigments are removed (Subramanian et al. 1998).

24
3.2.2. Important Bleaching Criteria
Important bleaching criteria are activated earth, dosage, time, mixing,
temperature and atmospheric pressure vs. vacuum (Wiedermann 1981).
The dosage of activated clay should be the minimum amount to affect removal
of impurities as measured by peroxide reduction (Wiedermann 1981).
Finer particle sizes of clays produce better bleaching results. However, filtration
rate and oil retention can be affected reversely (Valenzulela Diaz and Souza Santos
2001). Therefore, efficient filtration, short filtration times and minimization of oil
retention of filter cake is necessary (Morgan et al. 1985).
Bleaching clays normally contain 10-18 % moisture. If the clay is completely
dried prior to use, the structure of it collapses, so bleaching power is reduced because of
decreased surface area. In addition to these, adsorptive capacity of acid activated clay is
reduced if clay is added to hot oil. Because the moisture in the clay is driven off too
rapidly causing collapse of the clay’s structure. The acid activated earth should be
added to dry, refined oil at 80°C under vacuum conditions and then rapidly brought up
to working temperature and held at that temperature for enough time to provide
maximal bleach (Wiedermann 1981).
Temperature for vacuum bleaching are lower than for atmospheric to reach
optimum color removal. Activity of clay increases while temperature increases.
However, decolorization starts to decline after an optimum temperature has been
reached. Temperature also affects other properties of the oil. One important is free-fatty
acid content. So, temperature should be kept as low as possible to minimize free-fatty
acid increase but the temperature should be enough to obtain the desired color
(Richardson 1978).
Agitation should be sufficient to achieve good contact of clay with the oil
(Wiedermann 1981).

25
CHAPTER 4
EXPERIMENTAL
4.1. Materials
Neutralized oil provided from Altınya� Kombinaları A.�. (�zmir, Turkey) was
used for bleaching process. The clay samples selected for study from Eski�ehir and
Ankara region were provided from Esan Eczacıba�ı A.�. (�stanbul, Turkey) and Sud
Chemie (Balıkkesir, Turkey) respectively. Commercially activated clay Tonsil FF was
obtained from Ekiz Ya� Fabrikası (�zmir, Turkey).
Acetic acid (100 %), chloroform (extra pure), ethanol, sodium hydroxyde,
sodium thiosulfate, and hydrochloric acid fuming (37 %, extra pure) were purchased
from Merck (Darmstadt). Potassium iodide was bought from Sigma Chem. Co. (St.
Louis, MO). Double distilled water was used in the whole experiment.
4.2. Methods
4.2.1. Characterization Studies
Thermal properties of the clays were analyzed by thermobalance (Shimadzu
TGA-51). ∼10 mg clays were scanned up to 850°C at heating rate of 10°C/min.
Nitrogen atmosphere (40 ml/min) were used for all analyses.
Mineralogy of the natural clays and the crystallinities of the acid treated clays
were determined by X-ray diffraction (X-Pert Pro Diffractometer) using CuK∝ radiation
at 45 kV and 40 mA with a step size of 0.02o, 2θ between 2 and 70, 2θ range.
The microphotographs of the clay crystals were taken by using scanning electron
microscopy (SEM, Philips XL 30S) with SE detector at 7.00 kV under vacuum
conditions. And also element distributions of clay samples were taken with EDAX
instrument.
Chemical composition of the natural clays were determined by fusion
dissolution technique using Li2B4O7. 0.1 gram of the clay samples were combined with
1 gram of lithiumtetraborate. The dry-powder mixture was placed in a platinum crucible

26
and fused in an oven at 1000°C for 1 hour. Afterthat, samples were dissolved in hot
aqueous 110 ml of 5 % HNO3 concentration. By adding deionized water, solutions were
completed to 250 ml and presented to Inductively Coupled Plasma Atomic Emission
Spectroscopy (ICP-AES, 96,Varian). The resulting elemental concentrations (i.e. Ca,
Mg, Na etc.) were then translated to their oxide forms (i.e. CaO, MgO, Na2O etc.) to
represent the final composition. The acidic solutions of the acid treated clays were also
analysed using the ICP analysis.
Physical adsorption methods are widely used to obtain textural properties of
materials such as surface area. Specific surface area of samples were determined by
using ASAP 2010 (Micromeritics) Adsorption System. Prior to adsorption, the samples
were degassed for 24 h under vacuum better than 10-5 mbar at 350°C.
Surface area was determined from nitrogen adsorption (at 77K) data by using
the Brunauer-Emmett-Teller (BET) equation. In the surface area calculation the
adsorption data in the relative pressure (p/p°) ranges from 0.05 to 0.20 were used.
4.2.2. Acid Activation Studies
The following procedure was used, based on the study of Valenzuela Diaz and
Souza Santos. 70 grams of the ground clay (dry basis, 105°C ) were placed in a 0.5 litre
round bottom flask heated by an electrical mantle; 300ml (1N, 3N, 5N) hydrochloric
acid (d: 1.19g/ml; 37g HCl/100ml) solutions were added. The dry acid/clay ratio (w/w)
were 0.16 (300ml of 1N HCl include 3.7g/100ml so, dry acid/clay ratio =11.1g / 70g ≈
0.16) 0.48, and 0.8 respectively.
Thermometer, stirrer and reflux condenser were attached to the flask. The
temperature was maintained at boiling point (107°C) for variable length of times (1h,
2h, and 3h) with constant stirring. While hot, the clay suspension was transferred to a
beaker and washed by decantation with deionized water until it is Cl- free (tested with
AgNO-3 solution). pH was determined by pH meter (744 Metrohmn) and adjusted
between 3.5-4.0. The acid activated clay was filtered in a Büchner funnel, dried at
100°C at 3 hours and reground 100% below 200 mesh using porcelain mortar and pestle
to avoid contamination of samples and stored in a dessicator for the decolorization test.
Flowchart of acid activation of clay is given in Figure 4.1.
27
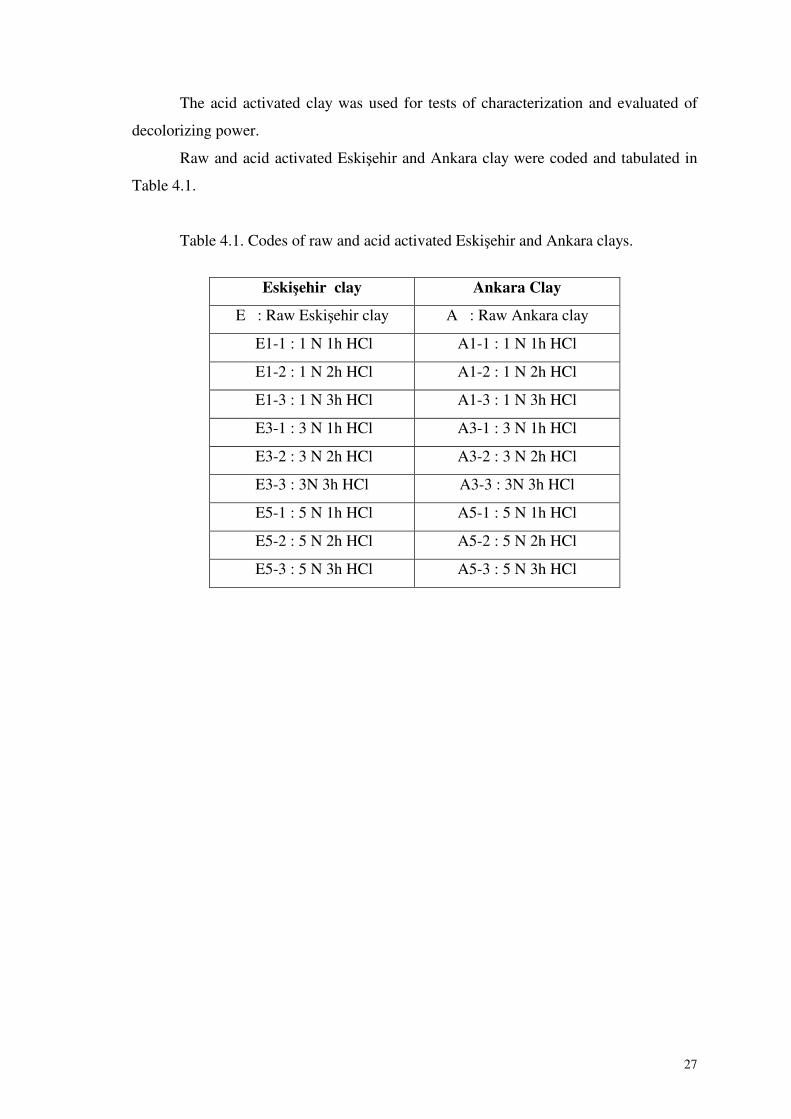
The acid activated clay was used for tests of characterization and evaluated of
decolorizing power.
Raw and acid activated Eski�ehir and Ankara clay were coded and tabulated in
Table 4.1.
Table 4.1. Codes of raw and acid activated Eski�ehir and Ankara clays.
Eski�ehir clay Ankara Clay
E : Raw Eski�ehir clay A : Raw Ankara clay
E1-1 : 1 N 1h HCl A1-1 : 1 N 1h HCl
E1-2 : 1 N 2h HCl A1-2 : 1 N 2h HCl
E1-3 : 1 N 3h HCl A1-3 : 1 N 3h HCl
E3-1 : 3 N 1h HCl A3-1 : 3 N 1h HCl
E3-2 : 3 N 2h HCl A3-2 : 3 N 2h HCl
E3-3 : 3N 3h HCl A3-3 : 3N 3h HCl
E5-1 : 5 N 1h HCl A5-1 : 5 N 1h HCl
E5-2 : 5 N 2h HCl A5-2 : 5 N 2h HCl
E5-3 : 5 N 3h HCl A5-3 : 5 N 3h HCl

28
Raw Clay
70 gr ground raw clay
(dry basis)
1 N, 3 N, and
5 N HCL
Deionized HCl acid and
water Cl- ions
Filtrate
Figure 4.1. Flowchart of acid activation of clay.
4.2.3. Bleaching Studies
As shown from the Figure 4.2, the neutralized oil was stirred at 150 rpm under
vacuum by using vacuum pump and heated to 80°C in a rotary evaporator (Kika-Werke,
Germany). Vacuum was disconnected and the required amount of clay as 0, 0.5, 1, 1.5
per cent (w/w) was added to the hot oil. Then, vacuum was applied and temperature
was rised to a top bleaching temperature 100°C (±1). At these conditions, the mixture
was held at selected bleaching times. 2 different times; 15 and 30 minutes were
Grinding to below 200 mesh
Mixing of HCl acid with raw clay
Keeping the flask at boiling point (107°C) for
selected acid activation times (1, 2 and 3 hours)
Washing by decantation
Filtrating by Büchner funnel
Drying at 100°C for 3 hours
Grinding to 100 % below 200mesh
using porcelain mortar and pestle

29
performed for bleaching experiments. At the end, the bleached oil was cooled to 70°C
and filtered through the spent earth by vacuum filtration. The mechanism of bleaching
of sunflower oil is shown in Figure 4.3.
Bleached oil-clay
mixture
Bleached Oil
Figure 4.2. Experimental flowchart of bleaching.
Figure 4.3. Mechanism of bleaching of sunflower oil
Adding acid activated clay to a hot oil without
vacuum
Heating neutralized oil to 80°C with agitation
at 150rpm
Heating the mixture to a top bleaching
temperature (100°C ±1) under vacuum
Allowing the mixture to hold at 15 and 30 min.
contact times while agitated at the top
bleaching tempereture
Filtrating bleached oil through spent clay by
vacuum filtration

30
4.2.4. Analysis of Oil and Montmorillonite 4.2.4.1. Moisture Determination of Bentonite
Moisture of clays were determined by using Sartorious Moisture Analyzer.
Results were given as % H2O.
4.2.4.2. Moisture Determination of Edible Oil
5 ± 0.2g prepared sample was weighed into Al moisture dish and dried to
constant weight in vacuum oven at uniform temperature 20-25°C at working pressure
which should be ≤ 100 mmHg. Finally, sample was cooled in desiccator for 30 min. and
weighed.
Result was given % loss in weight as moisture and volatile matter (AOAC
1995).
4.2.4.3. Free-fatty Acid Content
The amount of free fatty acids were determined by simple titration using AOAC
940.28 method (1995). Few drops of the sunflower oil and 2 ml phenolphthalein were
added to 50ml alcohol in clean, dry flask. Then flask was placed in H2O at 60-65°C
until warm and titrated with enough 0.1N NaOH to produce faint permanent pink. 56.4g
oil was weighed into the neutralized alcohol and titrated with 0.1N NaOH. Mixture was
shaked until same faint permanent pink appears in supernate alcohol. Reported as;
Free-fatty acid (as oleic acid) % = mL 0.1 N NaOH*0.05
4.2.4.4. Peroxide Value Determination
Oil oxidation is determined by measuring the amount of peroxides. Peroxide
value is most often expressed as milliequivalent of oxygen per kilogram of fat. Iodine is
produced from potassium iodide solution by the peroxides present in oil and titrated
against 0.01N sodiumthiosulfate (Patterson 1992).
Peroxide value was measured according to AOAC 965.33 method (1995).
5.00±0.05g sample was weighted into erlenmeyer. 30 ml CH3COOH-CHCl3 was added

31
and swirled to dissolve. 0.5 ml saturated KI solution was added and shaked for 1min.
30ml H2O was added then slowly titrated with 0.01 N Na2SO3. Calculated as;
Peoxide Value = (S*N*1000) / g sample
S= mL Na2S2O3
N= Normality Na2S2O3 solution
4.2.4.5. Color Determination
Two methods were used for measuring colors of neutralized and bleached
sunflower oil.
The instrumental color measurement was performed with UV-VIS Spectrometer
(Varian Cary Bio 100 ) to measure light absorbance in the visible region at 455 nm.
The manual color measurement was performed with Lovibond Tintometer.
Vegetable oil colour is usually measured using the Lovibond® Tintometer and
reported as Lovibond units of red and yellow plus blue or neutral if used. This
technique involves matching the colour of light transmitted through a specified
depth of oil with the colour of light transmitted from the same source through a
set of coloured glass slides. Colour reading is thus subjective and depends on the
analyst’s judgement as well as on the type and model of colorimeter used.
4.2.4.6. Oil Retention by Adsorbent
In the bleaching process oil retention is required to ascertain the loss of oil due
to its retention in the bleaching earth. Oil retention is calculated according to equation;
Wfilter cake – (WBE – WH20)
Oil retention [%] = * 100
Wfilter cake
W = Weight in g.
BE = Bleaching earth (Baranowsky et al. 2001)

32
CHAPTER 5
RESULTS AND DISCUSSION 5.1. Characterization Studies
5.1.1. Thermal Gravimetric Analysis (TGA)
Results of thermogravimetric analysis were given plot of sample weight (%) as a
function of temperature (°C). Total amount of water lost below 850°C for each clay are
given in Figure 5.1.
70
80
90
100
110
0 100 200 300 400 500 600 700 800 900Temperature (oC)
Wei
ght
(%)
Figure 5.1. Thermogravimetry curves of natural Ankara and Eski�ehir clays.
Figure 5.1 shows that weight loss in the temperature range 30° - 200°C (≈15%)
was observed for Ankara clay. Higher weight loss was found as ≈11% between 30° and
100°C. Subsequently, a gradual weight loss from 200°C up to 550°C (≈ 4%) was seen.
After that almost no further weight loss was observed.
For Eski�ehir clay, the significant weight loss was seen as ≈10% between 20°
and 100°C. Weight loss was observed to be ≈12% up to 200°C. Subsequently, a gradual
E
A

33
weight loss from 200°C up to 750°C (≈ 3°C) was seen. Then, it showed almost no
further weight loss.
Bala et al. (2000), studied the types of water in untreated clay. According to
their study, the weight losses of clays are observed with three types of water molecules;
free water molecules, hydrogen-bonded water molecules and water molecules strongly
coordinated to interlayer cations. Free water molecules should be removed first, and
followed by hydrogen bonded/coordinated water molecules in the process of
dehydration. So, the higher weight loss between 20°-100°C due to the removal of the
free water molecules from the interlayer spaces and the weight loss between 100°-
200°C may be due to the hydrogen-bonded and coordinated water molecules. Beyond
200°C the weight loss is due to dehydroxylation which increases with increasing
temperature up to 750°C. After 750°C dehydration and dehydroxylation is completed,
so weight loss is not observed. Similar tendencies were obtained in the current study.
5.1.2. X-Ray Diffraction (XRD)
The X-ray diffraction (XRD) was applied to confirm the presence of the
montmorillonite and to observe the changes in crystallinity between original samples
and acid activated samples.
0
40
80
120
160
0 10 20 30 40 50 60 70 80
o2Theta
Cou
nts
Figure 5.2. X-ray diffractogram of natural Eski�ehir clay (M: Montmorillonite, C:
Cristobalite low).
M
M
M M
M C

34
X-ray diffractogram of the natural form of the Eski�ehir clay as shown in Figure
5.2. indicates presence of montmorillonite as the dominating mineral and also
cristobalite low as contaminant. For the natural form of the Ankara clay, X-ray
diffractogram as given in Figure 5.3 shows presence of montmorillonite.
0
20
40
60
80
100
0 10 20 30 40 50 60 70 80 0 2Theta
C O U N T S
Figure 5.3. X-ray diffractogram of natural Ankara clay (M:Montmorillonite).
X-ray diffractogram of the acid activated Eski�ehir and Ankara clay are
represented in Figure 5.4. and 5.5, respectively. X-ray diffractogram shows that acid
activation causes to change in cristallinity of montmorillonites. This was also observed
by Christidis et al. (1997). As seen from the diffractogram, montmorillonite peaks
started to disappear and resulted in amorphous structure of smectite. Because over-
dissolving of the octahedral cations will result in decrease metal ions in the
montmorillonite structure so the layered structure of the original montmorillonite will
be destroyed. As a result, the activated product will be converted to an amorphous Si-
rich phase or amorphous SiO2 (Lu and Cui 2001). Also this amorphous phase will effect
bleaching efficiency of montmorillonite negatively. As a result, suitable acid activation
conditions should be selected to obtain effective performance.
M M
M M
M
M

35
0 10 20 30 40 50 60 70 80o2Theta
coun
ts (a
.u.)
E5-3
E5-2
E5-1
E3-3
E3-2
E3-1
E1-3
E1-2
E1-1
Figure 5.4. X-ray diffractogram of the acid activated Eski�ehir clays.
0 20 40 60 8002Theta
Cou
nts
(a.u
.)
A5-3
A5-2
A5-1
A3-2
A3-1
A1-3
A1-2
A1-1
Figure 5.5. X-ray diffractogram of the acid activated Ankara clays.

36
5.1.3. Physical Adsorption Measurement
The nitrogen adsorption isotherms of Eski�ehir and Ankara clays in natural and
acid activated forms are given in Figure 5.6. and 5.7, respectively. Also, the
characteristics of acid activated clay samples are given in Appendix A.1. The shapes of
isotherms are of type II according to the IUPAC classification. As seen from the figure
the isotherms are concave to the p/po (relative pressure) axis at low relative pressure,
then almost linear and finally convex to the axis.
0
50
100
150
200
250
0 0.2 0.4 0.6 0.8 1
Relative Pressure ( P/Po )
Vol
ume
Ads
orbe
d (c
m3 /g
ST
P )
E
E1-1
E3-1
E5-1
T
Figure 5.6. Nitrogen adsorption isotherms of the natural and representative acid
activated Eski�ehir clays and Tonsil (T).
From the Figure 5.6, the increase in the N2 amount adsorbed with increasing
acid concentration can be seen. The acid treated clay (E5-1) having the higher surface
area than Tonsil was obtained. The BET surface area of Eski�ehir clay (E5-1) and
Tonsil (T) were found as 269.67m2/g and 242.07m2/g, respectively.
The N2 amount adsorbed by Ankara clay are significantly higher than that of
Eski�ehir clay. With acid activation of Ankara clay, the N2 amount adsorbed increases
with increasing treatment time.

37
050
100150200250300350400450
0 0.2 0.4 0.6 0.8 1
Relative Pressure ( P/Po )
Vol
ume
Ads
orbe
d (c
m3 /g
STP
)A
A1-2
A1-3
T
Figure 5.7. Nitrogen adsorption isotherms of the natural and representative acid
activated Ankara clays and Tonsil (T).
The surface area was calculated by using the adsorption data in a relative
pressure (p/p°) range from 0.05 to 0.20. The surface area calculated for Eski�ehir and
Ankara clays in natural and acid activated forms are given in Figure 5.8. and 5.9,
respectively.
Surface area of acid activated Eski�ehir clay was increased by time for 1 N and
3 N HCl treatment. Maximum point was reached at 5 N 1h HCl (E5-1) treatment then
surface area decreased with increasing time. Maximum surface area was determined to
be 269.67 m2/g. For bleaching of sunflower oil, three different acid activated clays (E1-
1, E3-1 and E5-1) were selected as adsorbents used in bleaching of sunflower oil to
compare their bleaching efficieny with acid activated bleaching clay, Tonsil.

38
0
50
100
150
200
250
300
E E1-1 E1-3 E3-1 E3-2 E5-1 E5-2 E5-3
Raw and acid activated clays
Surf
ace
Are
a (m
2 /g)
Figure 5.8. Surface area of raw and acid activated Eski�ehir clay.
0
100200
300400
500600
700800
900
A A 1-1 A 1-2 A 1-3 A 3-1 A 5-1
Raw and acid activated clays
Surf
ace
Are
a (m
2 /g)
Figure 5.9. Surface area of raw and acid activated Ankara clay.
Surface area of acid activated Ankara clay increased with increasing time for 1N
HCl treatment. Maximum surface area was achieved at acid treatment with 1 N HCl
concentration for 3 hours treatment (A1-3) and was determined to be 849.09 m2/g. Then
surface area of it decreased with increasing acid concentration. According to the results
of the surface area, two kinds of acid activated clays (A1-2 and A1-3) were selected as
adsorbents used in bleaching of sunflower oil to compare their bleaching efficieny with
Tonsil.

39
5.1.4. Scanning Electron Microscopy and Energy Dispersive X-ray Analysis
Using SEM with an Eion system, the elemental composition in the sample can
b Scanning electron microscope (SEM) was used to take the microphotographs of
the surface feature of clay samples. SEM microphotographs of natural form of the
Eski�ehir and Ankara clay samples are given in Figure 5.10. and 5.11, respectively.
Figure 5.10. SEM microphotograph of natural form of the Eski�ehir clay.
Figure 5.11. SEM microphotograph of natural form of the Ankara clay.

40
Element distributions were taken in order to get information about the main
elements in the different layers and then element forms were transformed to oxide
forms. As a result, SiO2/Al2O3 ratio increases with increasing the period of time and
acid concentration. Oxide forms of Si+4 and Al+3 cations of raw and acid activated
Eski�ehir and Ankara clay samples are represented in Table 5.1. and 5.2, respectively
Table 5.1. Chemical composition of raw and acid activated Eski�ehir clays.
Oxides (wt%) E E1-1 E3-1 E5-1
SiO2 77.3±4 81.5±0.1 82.9±1.5 84.7±1.2
Al2O3 12.8±1.4 12.6±0.3 12.0±0.6 11.3±0.5
SiO2 /Al2O3 6.0 6.5 6.9 7.5
SiO2/Al2O3 ratio was 6.0 for raw Eski�ehir clay and increased to 6.5, 6.9 and 7.5
by treating the clay with 1 N, 3 N and 5 N HCl for 1 hour, respectively.
Table 5.2. Chemical composition of raw and acid activated Ankara clays.
Oxides (wt%) A A1-2 A1-3
SiO2 65.2±0.6 74.5±0.9 74.9±0.9
Al2O3 24.2±0.5 19.7±0.7 19.4±0.7
SiO2 /Al2O3 2.7 3.8 3.9
SiO2/Al2O3 ratio was 2.70 for raw Ankara clay. Then, this ratio increased to 3.8
and 3.9 for 2 hours and 3 hours treatment with 1 N acid concentration, respectively.
Table 5.3. Chemical composition of acid activated Zeolite and commercially activated
bleaching clay,Tonsil.
Oxides (wt%) Tonsil Zeolite
SiO2 77.34±1.7 86.54±0.6
Al2O3 16.89±1.6 9.59±0.5
SiO2 / Al2O3 4.58 9.02

41
As given in Table 5.3, SiO2/Al2O3 ratio was observed 4.58 for commercially
activated bleaching clay, Tonsil, and 9.02 for acid activated zeolite treated with 2N
HNO3 for 6h. SiO2/Al2O3 ratio of Zeolite was found as 9.02 which is higher than the
clay samples. It can be said that dissolving ratio of Al+3 cation from zeolite layers were
higher than the clays with acid activation.
5.1.5. Determination of the Chemical Composition by ICP-AES
Chemical composition of the natural forms of the Ankara and Eski�ehir clays
were analyzed with ICP-AES. Element contents are given in Table 5.4.
Table 5.4. Chemical compositions of the Ankara and Eski�ehir clay.
Oxides (wt%) E A
SiO2 61.91 59.05
Al2O3 12.52 17.25
CaO 4.13 1.72
Na2O 0.82 1.60
MgO 4.70 4.80
Fe2O3 7.00 6.24
K2O 0.95 1.22
Acid activated clay suspension was washed by decantation with deionized water
until it is Cl- free (pH 3.5 - 4.0) and ICP was applied to first washing water of acid
activated clay. The removal percentage of cations for Eski�ehir and Ankara clays after
activation are tabulated in Table 5.5. and 5.6, respectively. According to the ICP results
for Eski�ehir clay, the dissolving ratio of Ca+, Na+, Mg2+, K+, Fe3+ and Al3+ increases
along with increasing of acid concentration. This case was observed with increasing the
time for Ankara clay. Thus, the Si4+ content and the Si/Al ratio increased in the acid
activated montmorillonites. Dissolving ratio of these metal cations are important and
will be controlled to obtain high bleaching performance.

42
Table 5.5. The removal percentage of cations for Eski�ehir clay after acid activation.
Cations (w/w% ) E1-1 E3-1 E5-1
Si 0.62 0.59 0.52
Al 16.9 23.97 33.42
Ca 80.87 88.24 101.02
Na 3.22 3.27 3.29
Mg 18.5 19.00 20.03
Fe 2.37 2.40 3.24
K 4.2 5.35 6.51
Table 5.6. The removal percentage of cations for Ankara clay after acid activation.
Cations (w/w% ) A1-2 A1-3
Si 0.57 0.53
Al 18.11 19.88
Ca 92.57 94.52
Na 2.17 2.41
Mg 20.51 20.60
Fe 12.17 12.75
K 16.81 17.81
Ca2+ is the most readily removed cation at low acid concentration among the
cations. Because the element is present in the interlayered area and displaced by H+
easily while Mg2+, Fe3+ and Al3+ are settled in the octahedral area of montmorillonite
which are dissolved with difficulty ( Lu and Cui 2001).
5.2. Bleaching of Sunflower Oil
Generally the bleaching process uses bleaching earth at temperatures of 80-
120°C for 15-30 minutes under vacuum (Baranowskyet al. 2001). The dosage of
bleaching earths can vary between 0.5-2% on a weight basis depending on the oil type
(Valenzulela Diaz and Souza Santos 2001). In this study, the bleaching experiments
were done at 15 and 30 minutes contact time, 0, 0.5, 1, 1.5 % earth concentrations on a

43
weight basis and 100°C contact temperature at the laboratory conditions to observe
color, peroxide value, free-fatty acid content and oil retention of bleached oil. The
results were compared with bleaching efficiency of Tonsil. Characteristics of
commercial and neutralized sunflower oil are given in Appendix A.2.
� � Figure 5.12. UV absorbance spectra of neutralized (a) and treated sunflower oil (b).
Visible absorption spectra of neutralized oil was recorded in the wavelength
region between 400 and 800 nm. The absorption spectrum of neutralized oil gave a
maximum at 455nm with two shoulders at 455 and 483 nm. These peaks were
disappeared with treated of sunflower oil as seen in Figure 5.12.
Absorbance value of the neutralized sunflower oil was found 0.4290 at 455nm.
Peroxide value and free-fatty acid content were found 16.8 meq/kg and 0.07%,
respectively. When alkali-neutralized sunflower oil was kept at 100°C bleaching
temperature, 15 and 30 minutes contact time without any acid activated clays,
absorbance value increased from 0.422 to 0.442 and peroxide value also increased from
41.2 to 43.7 meq/kg with increasing contact time. Color value and peroxide value of oil
were affected with increasing contact time inversely. As a result, clay is needed to
achieve desired color and also peroxides and hydroperoxides are decomposed with acid
activated clay and this catalytic activity reduces the peroxide value (Patterson 1992 and
Nkpa et al. 1989).
As seen in Figure 5.13 and 5.14, absorbance value of oil bleached with Ankara
clay decreased with increasing earth concentration. There were no obvious changes with
increasing bleaching time. Maximum surface area of Ankara clay (A1-3) also affected
this value positively according to 1 N 2h HCl treatment (A1-2). Absorbance value was
a
b

44
observed as 0.230 (0.5% earth concentration at 15 min. contact time) at the begining
then decreased to 0.094 (1.5% earth concentration at 30 min. contact time).
With respect to the neutralized oil, bleached oil with acid activated Ankara clay
had a peroxide value 46.2 meq/kg first, then decreased to 22.4 meq/kg with 1 N 3h HCl
treatment clay (1.5% earth concentration at 30 min. contact times). There were no
obvious changes with increasing time. However, decreasing of this value was observed
in Figure 5.15. and 5.16. when the earth concentration increased (from 0.5% to 1.5).
Because acid bleaching clays are able to decompose some of the oxidation products
such as peroxides and this products are removed with bleaching process (Baranowsky et
al. 2001). Thus, peroxide value of oil decreases.
Besides, there were no obvious changes for free-fatty acid contents. These value
approximately observed around 0.08 %. However, with respect to the free-fatty acid
content of neutralized oil, this value increased. An increase in clay dosages lead to an
increase in free-fatty acid. Because the acidity of the surface activity of clays will
increase with increasing treatment time. (Nkpa et al. 1989). As shown in Figure 5.17
and 5.18, this value increased with increasing time from 15 minutes to 30 minutes with
increasing clay dosage from 0.5 % to 1.5 % .
0
0.2
0.4
0.6
0 15 30Time (min.)
Abs
orba
nce
(455
nm
)
0.5 (w/w%)1 (w/w%)1.5 (w/w%)0 (w/w%)
Earth Conc.
Figure 5.13. Absorbance value of bleached oil with acid activated Ankara clay (A1-2).

45
0
0.2
0.4
0.6
0 15 30
Time (min.)
Abs
orba
nce
(455
nm
)
0.5 (w/w%)1 (w/w%)1.5 (w/w%)0 (w/w%)
Earth Conc.
Figure 5.14. Absorbance value of bleached oil with acid activated Ankara clay (A1-3).
0
20
40
60
0 15 30Time (min.)
Per
oxid
e V
alue
(m
eq/k
g)
0.5 (w/w%)
1 (w/w%)
1.5 (w/w%)
0 (w/w%)
Earth Conc.
Figure 5.15. Peroxide value of bleached oil with acid activated Ankara clay (A1-2).

46
0
20
40
60
0 15 30Time (min.)
Pero
xide
Val
ue (
meq
/kg)
0.5 (w/w%)1 (w/w%)1.5 (w/w%)0 (w/w%)
Earth Conc.
Figure 5.16. Peroxide value of bleached oil with acid activated Ankara clay (A1-3).
0.05
0.055
0.06
0.065
0.07
0.075
0.08
0.085
0.09
0 15 30Time (min.)
Fre
e-fa
tty
Aci
d C
onte
nt (
%)
0.5 (w/w%)1 (w/w%)1.5 (w/w%)0 (w/w%)
Earth Conc.
Figure 5.17. Free-fatty acid content of bleached oil with acid activated Ankara clay
(A1-2).

47
0.050.0550.06
0.0650.07
0.0750.08
0.0850.09
0.095
0 15 30Time (min.)
Fre
e-fa
tty A
cid
Con
tent
(%
)
0.5 (w/w%)1 (w/w%)1.5 (w/w%)0 (w/w%)
Earth Conc.
Figure 5.18. Free-fatty acid content of bleached oil with acid activated Ankara clay
(A1-3).
As seen in Figure 5.19, 5.20. and 5.21, absorbance value of oil bleached with the
acid activated Eski�ehir clay with 15 minutes contact time decreased for all kinds of
clay (1 N, 3 N, 5 N HCl treatment) but after 1 % clay concentration and 30 minutes
contact time it started to increase again for each clay. Maximum absorbance value
(0.084) was achieved with maximum surface area of Eski�ehir clay with 5 N 1h HCl
treatment.
Bleached oil with acid activated Eski�ehir clay had a peroxide value 31.2
meq/kg first, then decreased to 3.7 meq/kg which was below peroxide value of
neutralized oil (16.8 meq/kg). Decreasing of this value was observed in Figure 5.22,
5.23 and 5.24, when the earth concentration and time increased for all kinds clay (1 N, 3
N, 5 N HCl treatment) because of decomposing some of the oxidation products and
removing with bleaching process (Baranowsky et al. 2001). Increasing earth
concentration was observed to affect than increasing bleaching time to reduce peroxide
value of bleached oil.
Free-fatty acid contents of bleached oil approximately observed around 0.09
%. There were no obvious changes between the bleaching conditions. However,
according to the free-fatty acid content of neutralized oil, this value increased from 0.07
to 0.09 % due to increasing in clay dosages leading to an increase in free-fatty acid
(Nkpa et al. 1989). With increasing earth concentration from 0.5% to 1.5%, free-fatty
acid increased continuously. Free-fatty acid content of bleached oil with acid activated
Eski�ehir clay is represented in Figure 5.25, 5.26. and 5.27.

48
0
0.2
0.4
0.6
0 15 30Time (min.)
Abs
orba
nce
(455
nm
)
0.5 (w/w%)1 (w/w%)1.5 (w/w%)0 (w/w%)
Earth Conc.
Figure 5.19. Absorbance value of bleached oil with acid activated Eski�ehir clay (E1-1).
0
0.2
0.4
0.6
0 15 30
Time (min.)
Abs
orba
nce
(455
nm
)
0.5 (w/w%)1 (w/w%)1.5 (w/w%)0 (w/w%)
Earth Conc.
Figure 5.20. Absorbance value of bleached oil with acid activated Eski�ehir clay (E3-1).

49
0
0.2
0.4
0.6
0 15 30Time (min.)
Abs
orba
nce
(455
nm
)
0.5 (w/w%)1 (w/w%)1.5 (w/w%)0 (w/w%)
Earth Conc.
Figure 5.21. Absorbance value of bleached oil with acid activated Eski�ehir Clay
(E5-1).
0
15
30
45
0 15 30
Time (min.)
Pero
xide
Val
ue (m
eq/k
g)
0.5 (w/w%)1 (w/w%)1.5 (w/w%)0 (w/w%)
Earth Conc.
Figure 5.22. Peroxide value of bleached oil with acid activated Eski�ehir clay (E1-1).

50
0
15
30
45
0 15 30
Time (min.)
Pero
xide
Val
ue (m
eq/k
g)
0.5 (w/w%)1 (w/w%)1.5 (w/w%)0 (w/w%)
Earth Conc.
Figure 5.23. Peroxide value of bleached oil with acid activated Eski�ehir clay (E3-1).
0
15
30
45
0 15 30Time (min.)
Pero
xide
Val
ue (m
eq/k
g)
0.5 (w/w%)1 (w/w%)1.5 (w/w%)0 (w/w%)
Earth Conc.
Figure 5.24. Peroxide value of bleached oil with acid activated Eski�ehir clay (E5-1).
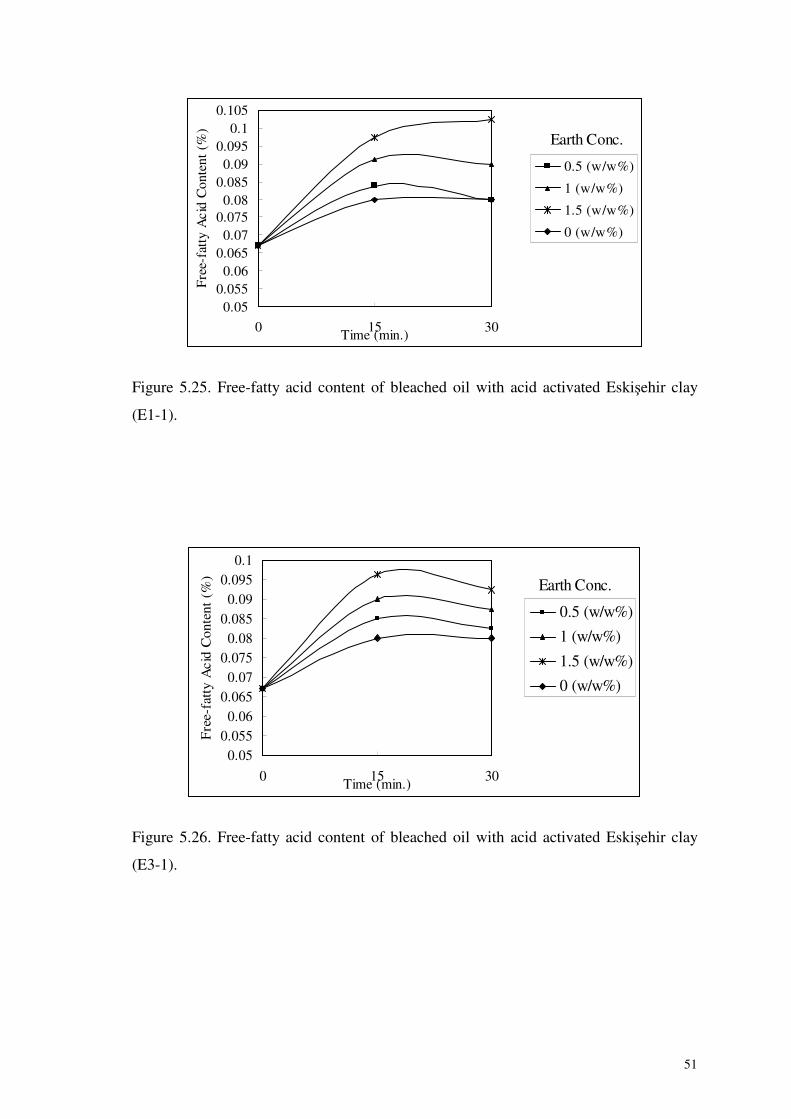
51
0.050.0550.06
0.0650.07
0.0750.08
0.0850.09
0.0950.1
0.105
0 15 30Time (min.)
Free
-fat
ty A
cid
Con
tent
(%
)
0.5 (w/w%)
1 (w/w%)
1.5 (w/w%)
0 (w/w%)
Earth Conc.
Figure 5.25. Free-fatty acid content of bleached oil with acid activated Eski�ehir clay
(E1-1).
0.050.055
0.060.065
0.070.075
0.080.085
0.090.095
0.1
0 15 30Time (min.)
Free
-fat
ty A
cid
Con
tent
(%
)
0.5 (w/w%)1 (w/w%)1.5 (w/w%)0 (w/w%)
Earth Conc.
Figure 5.26. Free-fatty acid content of bleached oil with acid activated Eski�ehir clay
(E3-1).

52
0.050.055
0.060.065
0.070.075
0.080.085
0.090.095
0.1
0 15 30Time (min.)
Free
-fat
ty A
cid
Con
tent
(%
)
0.5 (w/w%)1 (w/w%)1.5 (w/w%)0 (w/w%)
Earth Conc.
Figure 5.27. Free-fatty acid content of bleached oil with acid activated Eski�ehir clay
(E5-1).
The smallest value of absorbance was found 0.084 with Eski�ehir clay and
obtained with 1% earth concentration and 30 minutes contact time and this value was
found 0.083 with Tonsil at the same conditions.
New color formation occurs by continuing oxidation and color increases by
oxidation of pigments and due to stabilization of these oxidized pigments, adsorption of
pigments prevented (Mounts 1981). Bleaching earths can catalyze these oxidation
reaction. As a result, absorbance value starts to increase. It was observed in bleaching
process treated with 1.5 % earth concentration for Eski�ehir clay in this study.
Clays can adsorb peroxide and catalyze peroxide degradation into secondary
oxidation products and also can adsorb oxidation products depending on clay
concentration (Rossi et al. 2003). Bleaching to a normal color level reduces the
peroxides and remaining peroxide decomposition products are removed by
deodorization process. In this study, peroxide value were decreased with an increasing
earth concentration. Minimum peroxide value was obtained 3.74 meq/kg with Eski�ehir
clay.
Bleaching earths are produced from acid activation of montmorillonite and the
acidity of clay surface contributes free-fatty acid formation (Morgan et al. 1985). So, a
rise in free-fatty acid occured due to acid activated clay. Those activated earths will
produce or no change in the free-fatty acid content of the neutralized oil. Some of them
may add 0.05-0.1 % to the free-fatty acid content (Mounts 1981). In this study free-fatty

53
acid content observed maximum around 0.09 % and as to the free-fatty acid content of
neutralized oil, this value increased maximum 0.02 % value.
As bleaching parameters, 1 % earth concentration, 30 minutes contact time at
100 °C bleaching temperature were selected. At this selected point, Eski�ehir clay,
Ankara clay and zeolite were compared with Tonsil. Absorbance values of these
minerals are given in Figure 5.30.
In this study, zeolite activated 2 M HNO3 was tried to see their bleaching
performance. At this activated point, zeolite showed maximum surface area.
00.050.1
0.150.2
0.250.3
0.350.4
0.45
Absorbance (455nm)
E5-1 A 1-3 Zeolite Tonsil NeutralizedOil
Oil bleached with different mineral sources
Figure 5.28. Absorbance value of bleached oil at selected point [(100oC, 30min., 1
(w/w%)]. Zeolite : acid activated with 2N HNO3 at 6h, 60°C.
As a result, Eski�ehir clay, Ankara clay, Tonsil and Zeolite was used to select
suitable earth for bleaching of sunflower oil. Between different clays from different
regions and zeolite as to reference earth (Tonsil), Eski�ehir clay was selected due to its
high bleaching efficiency. Absorbance value of Eski�ehir clay and Tonsil showed
approximately same value and their bleaching efficiency 80 % and 81 % respectively.
The characteristics of bleached oils are given in Appendix A.3.
Bleaching efficieny was calculated by the following formula (Srasra et al. 1989) ;
Aoλ(neutral oil)- Aλ(treated oil)
Bleaching efficieny [%] = *100
Aoλ(neutral oil)

54
Where A is the absorbance value at wavelength λ, 455 nm for pigment uptake.
At selected bleaching point, lovibond red and yellow color of bleached oil
indicated that Eski�ehir clay and Tonsil were close to each other as bleaching
performance. In American trading rules, maximum red color of bleached sunflower oil
is 2.5 and maximum yellow color of bleached color is 25 (Rossell 1991). In this study,
all of them, except zeolite showed under 2.5 red and 25 yellow color value.
Acid activated zeolite did not reach required bleaching efficiency. Its bleaching
efficiency was found as 46 % and this value was 25 % with raw zeolite. In addition, red
and yellow color were higher than the other earths as shown in Table 5.7.
Table 5.7. Lovibond red and yellow color of bleached oil at selected point [(100oC, 30
min., 1 (w/w %)] and neutralized, bleached & edible oils.
Values of Lovibond Red & Yellow Color
Red Color Yellow Color
Neutralized oil 3.1 40
Treated oil with E5-1 1.1 20
Treated oil with A1-3 2 12
Treated oil with Tonsil 0.8 20
Treated oil with Zeolite* 2.6 30
Refined, Bleached & Deodorized oil 0.9 10
*Zeolite : acid activated with 2N HNO3 at 6h, 60°C.
The removal of color pigment is needed to obtain an acceptable finished edible
oil. For this reason, the color pigments are removed at different steps in the
conventional oil process. Especially during bleaching step, maximum reduction occur
(85%) and then remaining thermally degradable color pigments are removed in the
subsequent deodorization step due to high temperature processing (Subramanian 2001).
Deodorization is the last step to improve the color, taste and the stability of the oil with
the removal of undesirable substances. Lovibond results of deodorized oil 0.9 and 10 for
red and yellow color, respectively and these value were lower than bleached oil because
remaining color pigments from bleaching process are removed by deodorization step.
Also remaining peroxide decomposition products are removed by this process that is,
zero peroxide value is obtained (Mounts 1981).

55
Table 5.8. Oil retention values of representative acid activated clay samples and Zeolite.
Sources *Oil Retention %
A1-3 52
E5-1 63
Tonsil 60
Zeolite 59
Wfilter cake – (WBE – WH20)
*Oil retention [%] = * 100
Wfilter cake
W = Weight in g.
BE = Bleaching earth (Baranowsky et al. 2001)
In the industrial bleaching process, the retention of oil is in the range of 30-70%
of the weight of the activated clay (Subramanian 2001). Generally, oil lost to filter cake
results oil loss in the bleaching process (Bera et al. 2004). As shown in Table 5.8, oil
retention of Ankara and Eski�ehir clay, Tonsil and Zeolite displayed in the range of 30-
70% and oil loss of Ankara clay was lower than the others. This means that for each
100 kg of fresh bleaching earth 52 kg of oil are lost.
As a result, Eski�ehir clay gave better decolorization effects according to Ankara
clay and Zeolite. Maximum bleaching efficiency was achieved after 30 minutes contact
time with 1 % earth concentration at 100°C bleaching temperature with 5 N 1h HCl
treatment for Eski�ehir clay.

CHAPTER 6
CONCLUSIONS
In this study, two clay samples from different regions (Eski�ehir and Ankara)
were used as adsorbent for bleaching of sunflower oil. Characterization studies were
applied to determine structure and chemical composition of clay samples also to see
changes after acid activation. Besides clay samples, acid activated zeolite also used as
adsorbent for bleaching process.
By acid activation, partial dissolution of the raw materials occurred with mineral
acid (HCl) and resulted in protonated clays and amorphous silica phases. This treatment
provided an increase in surface area, porosity and acidity of the clays. Surface area of
clays increased until maximum surface area was obtained and then decreased with
increasing intensity of acid treatment. The chemical compositions of the solutions and
clays after acid activation were determined using ICP and EDX analysis, respectively.
According to the results, the SiO2 content and the Si02/Al2O3 ratio increased with
increase in acid concentration for the Eski�ehir clay and with increasing treatment time
for the Ankara clay. This ratio increased from 6.0 to 7.5 for acid activated Eski�ehir
clay, from 2.7 to 3.9 for acid activated Ankara clay.
Color, free-fatty acid content and peroxide value of bleached oil and oil
retention by bleaching earths were determined to see oil quality after bleaching process.
The peroxide value decreased with increasing catalytic activity of the bleaching earth.
However, there were no obvious changes for free-fatty acid contents. Increase in clay
dosage affected the peroxide value and free-fatty acid content of oil more than
increasing treatment time of the bleaching process. According to resuts of oil analysis,
1% earth concentration and 30 minutes contact time at 100 °C bleaching temperature
were selected among bleaching parameters,
The acid activated Eski�ehir clay showed higher bleaching efficiency
eventhough the acid activated Ankara clay had a higher surface area. The smallest
absorbance value was found to be 0.084 with the acid activated Eski�ehir clay and 0.083
with Tonsil at the same conditions. Bleaching efficiency was determined as 80 % and
81% for the acid activated Eski�ehir and Tonsil samples, respectively. The absorbance
value of bleached oil with acid activated Ankara clay was determined as 0.114 and its

57
bleaching efficiency was 73% at selected bleaching parameters. Bleaching efficiency of
the acid activated Ankara clay was obtained to be lower compared to the Eski�ehir
sample.
Red and yellow color values of bleached oil with Eski�ehir clay (5 N 1h HCl
treatment) and Tonsil were determined to be close to each other. Red color values of
bleached oil were 0.8 with Tonsil and 1.1 with Eski�ehir clay. Their yellow color values
were the same at 20. Red and yellow color values of the oil bleached with the Ankara
clay (1 N 3h HCl treatment) were found to be 2 and 12, respectively. Red value of
bleached oil with acid activated Ankara clay was higher than the others. However, this
value is below the maximum set by the American trading rules (maximum 2.5 red).
The acid activated zeolite did not provide the required bleaching efficiency. Its
bleaching efficiency was found to be 46 %, which was 25 % with the crude zeolite. In
addition, results of red and yellow color values were higher than the other earths.
As a result, Eski�ehir and Ankara clays can be used as bleaching earths,
Eski�ehir clay providing a better decolorization effects compared to the Ankara clay and
Zeolite. Maximum bleaching efficiency was achieved after a contact time 30 minutes
with 1 % earth concentration at 100°C bleaching temperature following 5 N 1h HCl
treatment for Eski�ehir clay.
As a result, bentonitic earths can be evaluated as adsorbent for using in
bleaching of sunflower oil beside Tonsil in domestic market.

58
REFERENCES
Anonymous, “Free fatty acids in crude and refined oils,” AOAC Official Method
940.28, (1995), Chapter 41, p.10. Anonymous, “Moisture and volatile matter in oils and fats,” AOAC Official Method
926.12, (1995), Chapter 41, p.1. Anonymous, “Peroxide value of oils and fats,” AOAC Official Method 965.53, (1995),
Chapter 41, p.9B.
Bala P., Samantaray B.K., Srivastava S.K., “Dehydration transformation in Ca-montmorillonite,” Bull. Mater. Sci. 23, (2000), 61-67.
Baranowsky K., Beyer W., Billek G., Buchold H., Gertz Ch., Grothues B., Sen Gupta
A.K., Holtmeier W., Knuth M., Lau J., Mukherjee K.W., Münch E.-W., Saft H., Schneider M., Tiebach R., Transfeld P., Unterberg Ch., Weber K., Zschau W., “Technologies for industrial processing of fats and oils,” Eur. J. Lipid Sci. Technol. 103, (2001), 505-551.
Becer, Y., Gas Adsorption in Volumetric System, M.S. Thesis, �zmir Institute of
Technology, �zmir, 2003.
Bera D., Lahiri D., Nag A., “Kinetic studies on bleaching of edible oil using charred sawdust as a new adsorbent,” Journal of Food Engineering 65, (2004), 33-36.
Boukerroui A., Ovalı M,S., “Edible oil bleaching with a bentonite activated by
microwave irradiation,” Ann. Chim. Sci. Mat. 27, (2002), 73-81. Bray H.J., Redfern S.A.T.,“Kinetics of dehydration of Ca-montmorillonite,” Phys.
Chem. Minerals 26, (1999), 591-600. Chau J. L. H., Wan Y. S. S., Gavriilidis A., Yeung K. L., “Incorporating zeolites in
microchemical systems,” Chemical Engineering Journal 88, (2002), 187–200. Chitnis S.R., Sharma M.M., “Industrial applications of acid-treated clays as catalysts,”
Reactive & Functional Polymers 32, (1997), 93-115.
Christie T., Brathwaite B., Thompson B., “Mineral commodity report 23- zeolites,” New Zealand Mining 31, (2002), 16-24.
Flessner U., Jones D.J., Roziere J., Zajac J., Storaro L., Lenarda M., Pavan M., Jimenez-
Lopez A., Rodriquez-Castellon E., Trombetta M., Busca G., “A study of the surface acidity of acid-treated montmorillonite clay catalysts,” Journal of Molecular Catalysis A: Chemical 168, (2001), 247-256.
Flewitt P.E.J., Wild R.K., Diffraction in Physical Methods for Materials
Characterisation, second edition, (Institute of Physics Publishing, Bristol and Philadelphia, 2003), p.76.

59
Flewitt P.E.J., Wild R.K., Electron sources in Physical Methods for Materials Characterisation, second edition, (Institute of Physics Publishing, Bristol and Philadelphia, 2003), p.274.
Haas W., Mittelbach M., “Detoxification experiments with the seed oil from Jatropha curcas L.,” Industrial Crops and Products 12, (2000), 111–118.
Hajjaji M., Kacim S., Alami A., Bouadili A., Mountassir M., “Chemical and mineralogical characterization of a clay taken from the Moroccan Meseta and a study of the interaction between its fine fraction and methylene blue,” Applied Clay Science 20, (2001), 1-12.
Hui Y.H., Bailey’s industrial oil and fat products, 2. Fifth edition, (1996), 611-620. Kheok C., Lim E., “Mechanism of palm oil bleaching by montmorillonite clay activated
at various acid concentrations,” JAOCS 59, (1982), 129-131. Khoo L.E., Morsingh F., Liew K.Y., “The adsorption of β-carotene I. by bleaching
earths,” Journal of the American Oil Chemists’ Society 56, (1979), 672-675. Lu X., Cui X., Preparation and activation mechanism of acid activated bentonite with
high decolouring capacity in Proceedings of the Third International Conference on Intelligent Processing and Manufacturing of Materials (IPMM), (Vancouver, Canada, 2001), 1-8.
Lu X., Cui X., Song M., “Study on the alteration of chemical composition and structural
parameters of modified montmorillonite,” Minerals Engineering 16, (2003), 1303-1306.
Madejova J., “FTIR techniques in clay mineral studies,” Vibrational Spectroscopy 944,
(2002), 1-10. Montaser A., Mclean J.A., Liu H., Mermet J.-M., An introduction to ICP
Spectrometries for elemental analysis in Inductively Coupled Plasma Mass Spectrometry , Edited by A. Montaser, (Wiley-VCH, America, 1998). p.1-5.
Morgan D.A., Shaw D.B., Sidebottom M.J., Soon T.C., Taylor R.S., “The function of bleaching earths in the processing of palm, palm kernel and coconut oils,” JAOCS 62, (1985), 292-298.
Mounts T.L., “Chemical and physical effects of processing fats and oils,” JAOCS,
(1981), 51A-54A. Mumpton F.A., “ La roca magica: Uses of natural zeolites in agriculture and industry,”
Proc. Natl. Acad. Sci. 96, (1999), 3463-3470. Murray H.H., “Traditional and new applications for kaolin, smectite, and palygorskite: a
general overview,” Applied Clay Science 17, (2000), 207-221.

60
Nkpa N.N., Arowolo T.A., Akpan H.J., “Quality of Nigerian palm oil after bleaching with local treated clays,” JAOCS 66, (1989), 218-222.
Patterson, H.B.W., Bleaching and Purifying Fats and Oils ( Theory and Practice ),
American Oil Chemists’ Society Campaign Illinois, (1992), AOCS Press, 61.
Pioch D., Largueze C., Graille J., Ajana H., Rouviere J., “Towards an efficient membrane based vegetable oils refining,” Industrial Crops and Products 7, (1998), 83-89.
Reddy K.K., Subramanian R., Kawakatsu T., Nakajima M., “Decolorization of
vegetable oils by membrane processing,” Eur Food Res Technol, (2001), 213:212–218.
Richardson L.L., “Use of bleaching, clays, in processing edible oils,” Journal of the
American Oil Chemists’ Society 55, (1978), 777-780. Rivera A., Rodriguez-Fuentes G., Altshuler E., “Time evolution of a natural
clinoptilolite in aqueous medium:conductivity and pH experiments,” Microporous and Mesoporous Materials 40, (2000), 173-179.
Rossell J.B., Vegetable oils and fats in Analysis of Oilseeds, Fats and Fatty Foods,
Edited by J.B. Rossell and J.L.R. Pritchard, (Elsevier Applied Science, London and Newyork , 1991), pg.272-275.
Rossi M., Gianazza M., Alamprese C., Stanga F., “The role of bleaching clays and
synthetic silica in palm oil physical refining,” Food Chemistry 82, (2003), 291–296.
Rouquerol, F., Rouquerol, J., Sing, K. S. W., Adsorption by Powders and Porous Solids: Principles, Methodology and Applications, Academic Press, San Diego, 1999.
Sarıer N., Güler Ç., “Thermal investigation of acid-activated clay minerals,”
Thermochimica Acta 119, (1987), 293-300. Sarıer N., Güler Ç., “The mechanism of β-carotene adsorption on activated
montmorillonite,” JAOCS 66, (1989), 917-923. Sontag N.O.V., Composition and characteristics of individual fats and oils in Bailey’s
Industrial Oil and Fat Products, Edited by S. Daniel, Volume 1, Fourth Edition, (A Wiley Interscience Publication, Newyork, 1979), pg.382.
Srasra E., Bergaya F., Van Damme H., Ariguib N.K., “Surface properties of an
activated bentonite-decolorisation of rapeseed oils,” Applied Clay Science, 4 (1989) 411-121.
Srasra E., Trabelsi-Ayedi M., “Textural properties of acid activated glauconite,”
Applied Clay Science 17, (2000), 71-84.

61
Subramanian R., Nakajima M., Kimura T., Maekawa T., “Membrane process for premium quality expellerpressed vegetable oils,” Food Research International 31, (1998), 587-593.
Subramanian R., Nakajima M., Kawakatsu T., “Processing of vegetable oils using
polymeric composite membrabes,” Journal of Food Engineering 38, (1998), 41-56.
Subramanian R., Nabetani H., Nakajima M., Ichikawa S., Kimura T., Maekawa T.,
“Rejection of carotenoids in oil systems by a nonporous polymeric composite membrane,” JAOCS 78, (2001), 803-807.
Tsai, W.T., H.P. Chen, M.F. Hsieh, H.F. Sun, S.F. Chien, “Regeneration of spent
bleaching earth by pyrolysis in a rotary furnace,” J. of Analtical and Applied Pyrolysis 63, (2002),157-170.
Valenzuela Diaz F., Souza Santos P., “Studies on the acid activation of Brazilian
smectitic clays,” Quim. Nova 24, (2001), 345-353. Vancouver, B.C., Market study of bentonite products : Consultant’s Report, British
Columbia Ministry of Energy, Mines and Petroleum Resources, (1994), 1-68. Wiedermann L.H., “Degumming, refining and bleaching soybean oil,” JAOCS,
(1981),159-165. Wu M.G., Deem M.W., Elomari S.A., Medrud R.C., Zones S.I., Maesen T., Kibby C.,
Chen C.Y., Chan I.Y., “Discovery of a new molecular sieve:Zeolite SSZ-55,” J.Phys. Chem. B. 106, (2002), 264-270.

APPENDIX
A.1. Characteristics of Acid Activated Clay Samples
Table A.1. Surface area and pore diameter of raw and acid activated Eski�ehir clays.
E E1-1 E1-3 E3-1 E3-3 E5-1 E5-2 E5-3
BET surface area (m2/g) 64.5 104.2 171.9 102.4 127.7 269.7 104.7 111.2
Langmuir Surface area
(m2/g) 90.6 148.0 243.2 145.2 181.6 379.9 148.3 156.5
Micropore area ( m2/g ) 17.2 25.5 31.9 26.5 36.9 52.8 25.3 19.7
t-plot external
surface area ( m2/g)
47.4 78.8 139.9 75.9 90.9 216.9 79.5 91.4
Median pore diameter
(Å) 8.2 9.1 8.6 8.4 8.3 8.5 8.5 9.6

63
Table A.2. Surface area and pore diameter of raw and acid activated Ankara clays.
A A1-1 A1-2 A1-3 A3-1
A5-1
BET surface area (m2/g) 209.7 332.5 551.0 849.1 686.5 523.4
Langmuir Surface area
(m2/g) 304.5 473.6 784.9 1246.6 955.2 728.3
Micropore area ( m2/g ) 96.3 54.9 116.8 130.6 55.8 42.4
t-plot External
surface area ( m2/g)
113.4 277.7 434.2 718.8 630.8 480.9
Median pore diameter (Å) 9.6 9.8 8.3 8.4 8.7 8.5
Table A.3. Surface area and pore diameter of Tonsil.
Tonsil
BET surface area (m2/g) 242.1
Langmuir Surface area (m2/g) 334.3
Micropore area ( m2/g ) 36.1
t-plot External surface area ( m2/g) 206.0
Median pore diameter (Å) 8.7

64
Table A.4. Surface area and micropore volume of acid activated Zeolite.
Zeolite*
Langmuir surface area (m2/g) 226
t-plot External surface area ( m2/g) 22.5
Micropore volume (cm3/g) 0.068
*acid activated zeolite with 2 N HNO3 at 60°C for 6 h (Becer 2003).
Table A.5. Moisture content of acid activated Eski�ehir and Ankara clays.
Moisture Content %
A1-2 14.0
A1-3 12.7
E1-1 9.3
E3-1 10.5
E5-1 10.4

65
A.2. Characteristics of Commercial and Neutralized Sunflower Oil
Table A.6. Characteristics of commercial (refined, bleached, deodorized and dewaxed)
sunflower oil (Sontag 1979).
Moisture content % 0.10 % maximum
Free-fatty acid Content % 0.05 % maximum
Peroxide Value 2.0 meq/kg
Lovibond Red & Yellow Color 2.0 Red & 20.0 Yellow
Table A.7. Characteristics of neutralized sunflower oil before bleaching.
Moisture content % 0.03
Free-fatty acid Content % 0.07
Peroxide Value (meq/kg) 16.8
Lovibond Red & Yellow Color 3.1 Red & 40 Yellow
Spectrophotometric Color (Absorbance) 0.4290
Table A.8. Neutralized oil characteristics kept at 100°C bleaching temperature without
any acid activated clays.
Time (min.)
15 min. 30 min.
Free Fatty Acids (%) 0.08 0.08
Peroxide Value (meq/kg) 41.2 43.7
Spectro. Color (Abs.) 0.422 0.442

66
A.3. Characteristics of Bleached Oils
Table A.9. Results of bleaching experiments with 0.5 % earth concentration (w/w), at
100°C and 15 minutes.
UV (Abs.) Peroxide Value
(meq/kg) Free Fatty
Acid % Bleaching
Efficiency %
A1-2 0.230 46.2 0.082 46
A1-3 0.175 37.7 0.078 59
E1-1 0.099 31.2 0.084 77
E3-1 0.106 27.9 0.085 75
E5-1 0.139 29.3 0.079 68
Table A.10. Results of bleaching experiments with 1 % earth concentration (w/w), at
100°C and 15 minutes.
UV (Abs.) Peroxide Value
(meq/kg) Free Fatty
Acid % Bleaching
Efficiency %
A1-2 0.124 42.9 0.084 71
A1-3 0.104 30.6 0.079 76
E1-1 0.086 16.4 0.091 80
E3-1 0.094 12.7 0.09 78
E5-1 0.101 16.1 0.086 76

67
Table A.11. Results of bleaching experiments with 1.5 % earth concentration (w/w), at
100°C and 15 minutes.
UV (Abs.) Peroxide Value
(meq/kg) Free Fatty
Acid % Bleaching
Efficiency %
A1-2 0.111 38.4 0.084 74
A1-3 0.100 22.2 0.088 77
E1-1 0.088 5.7 0.098 79
E3-1 0.100 3.5 0.096 77
E5-1 0.092 7.1 0.090 79
Table A.12. Results of bleaching experiments with 0.5 % earth concentration (w/w), at
100°C, 30 minutes.
UV (Abs.) Peroxide Value
(meq/kg) Free Fatty
Acid % Bleaching
Efficiency %
A1-2 0.224 49.1 0.082 48
A1-3 0.168 41.9 0.079 61
E1-1 0.118 26.7 0.080 73
E3-1 0.108 25.7 0.082 75
E5-1 0.118 26.7 0.082 73

68
Table A.13. Results of bleaching experiments with 1 % earth concentration (w/w), at
100°C and 30 minutes.
UV (Abs.) Peroxide Value
(meq/kg) Free Fatty
Acid % Bleaching
Efficiency %
Tonsil 0.083 10.9 0.093 81
A1-2 0.130 44.8 0.085 70
A1-3 0.114 32.0 0.088 73
E1-1 0.095 12.5 0.090 78
E3-1 0.117 12.1 0.088 73
E5-1 0.084 13.5 0.088 80
Zeolite crude 0.323 57.5 0.080 25
Zeolite 2 N (HNO3 treated)
0.230 49.7 0.081 46
Table A.14. Results of bleaching experiments with 1.5 % earth concentration (w/w), at
100°C and 30 minutes.
UV
(Abs.) Peroxide Value
(meq/kg) Free Fatty
Acid % Bleaching
Efficiency %
A1-2 0.105 39.3 0.088 76
A1-3 0.094 22.4 0.093 78
E1-1 0.098 6.9 0.103 77
E3-1 0.120 3.7 0.093 72
E5-1 0.107 5.6 0.096 75