us house electoral data - gis based application tool
TRANSCRIPT

US HOUSE ELECTORAL DATA - GIS BASED APPLICATION TOOL
_______________
A Thesis
Presented to the
Faculty of
San Diego State University
_______________
In Partial Fulfillment
of the Requirements for the Degree
Master of Science
in
Computer Science
_______________
by
Shrutika R. Sutar
Fall 2012


iii
Copyright © 2012
by
Shrutika R. Sutar
All Rights Reserved

iv
DEDICATION
I would like to dedicate this thesis to my father Ram B. Sutar, my mother Vidya R.
Sutar; they have been a source of encouragement and inspiration to me throughout my life. I
am also grateful to my brother Vaibhav R. Sutar for being very helpful and supportive.
Loving thanks to all my friends, who knowingly and unknowingly; played an
important role in this journey and kept my spirits up.
I offer my gratitude and appreciation to Professor Carl Eckberg who challenged,
guided and supported me throughout this work.

v
ABSTRACT OF THE THESIS
US House Electoral Data-GIS Based Application Tool by
Shrutika R. Sutar Master of Science in Computer Science
San Diego State University, 2012
The House of Representatives has 435 members, elected for a two year term in single-seat constituencies. House of Representatives elections are held every two years on the first Tuesday after November 1 in even years. The Democratic Party and Republic party are the two major existing political parties in the United States.
My objective here is to provide a summary of the loss or gain of seats in the House among these parties from the year 1970-2010, by creating an interactive graphical tool. This tool will help both teachers and students. The students can learn about the US House elections in an interactive way. With this tool, users can see the map of the United States of America and can click on the states and districts shown on the map using various tools to see the electoral trends for the specific state/district for the past years. A coloring scheme indicating red for Republicans and blue for Democrats has been implemented to get a clear idea on the change of party along district boundaries.
The users will be able to see the trends of House election results in past years for all districts in the matrix using a hotlink tool; the coloring scheme is implemented in the matrix for easy distinction between democrats and republicans.
A user can also select the year, see the map of US states with the congressional district boundaries and select a district to view election results and representative for the selected year and district using the identify tool.
The tool provides a graph explaining the gerrymandering of the House Elections. Over 90% of House members are reelected every two years, due to lack of electoral competition.
The tool has been developed in JAVA using MOJO (Map Objects Java Objects) library. MOJO is developed by ESRI (Environmental Science Research Institute). The major features shown on the map were designed using MOJO. MOJO made it easy to incorporate the tabular data with these features.

vi
TABLE OF CONTENTS
PAGE
ABSTRACT ...............................................................................................................................v
LIST OF FIGURES ............................................................................................................... viii
ACKNOWLEDGEMENTS .......................................................................................................x
CHAPTER
1 INTRODUCTION .........................................................................................................1
1.1 Overview ............................................................................................................1
1.2 Basic Facts About House Elections ...................................................................2
1.3 Chapter Summaries ............................................................................................2
1.4 About the Application ........................................................................................2
2 REQUIREMENTS .........................................................................................................4
2.1 Functional Requirements ...................................................................................4
2.2 Data Requirements .............................................................................................5
2.3 Platform Requirements ......................................................................................6
3 TECHNOLOGIES .........................................................................................................7
3.1 Java ....................................................................................................................7
3.2 MOJO Map Objects – Java Edition ...................................................................8
3.3 Eclipse IDE ........................................................................................................9
3.4 CDBF Viewer and Editor ................................................................................. 11
3.5 HTML ..............................................................................................................12
3.6 CSS ..................................................................................................................12
3.7 JavaScript .........................................................................................................13
3.8 JQuery ..............................................................................................................13
3.9 Adobe Dreamweaver ........................................................................................14
3.10 Adobe Photoshop ...........................................................................................15
4 BUILD CONFIGURATION ........................................................................................16
4.1 Create a Project ................................................................................................16
4.2 Configure Build Path .......................................................................................18
5 DBF FILES ..................................................................................................................21

vii
5.1 Edit File Using CDBF Editor ...........................................................................21
5.2 Modify Structure ..............................................................................................21
6 SOFTWARE PROTOTYPE ........................................................................................23
7 SOFTWARE DESIGN MODEL ..................................................................................25
8 LAYERS AND SHAPEFILES .....................................................................................27
8.1 Shape Files .......................................................................................................27
8.2 Layers ...............................................................................................................27
9 TOOLBARS ................................................................................................................33
9.1 ZoomPanToolBar .............................................................................................33
9.2 Selection Toolbar .............................................................................................34
9.3 Custom Toolbar ................................................................................................36
10 CUSTOM MENUS ......................................................................................................48
10.1 File .................................................................................................................49
10.2 Theme ............................................................................................................51
10.3 Graphs ............................................................................................................52
10.4 Help ................................................................................................................53
11 CONCLUSION ............................................................................................................56
12 FUTURE ENHANCEMENTS ....................................................................................57
BIBLIOGRAPHY ....................................................................................................................58

viii
LIST OF FIGURES
PAGE
Figure 3.1. MapObjects user interface. ....................................................................................10
Figure 3.2. Eclipse user interface. ............................................................................................11
Figure 3.3. Dreamweaver user interface. .................................................................................14
Figure 3.4. Adobe Photoshop user interface. ...........................................................................15
Figure 4.1. Eclipse select workspace dialog. ...........................................................................16
Figure 4.2. Create new project menu. ......................................................................................17
Figure 4.3. New project menu dialog. ......................................................................................17
Figure 4.4. Configure build path menu. ...................................................................................18
Figure 4.5. Add java external libraries. ....................................................................................19
Figure 4.6. Browse for MOJO20 external libraries. ................................................................19
Figure 4.7. Add MOJO20 external libraries.............................................................................20
Figure 5.1. CDBF viewer-editor. .............................................................................................22
Figure 5.2. Edit structure dialog in CDBF. ..............................................................................22
Figure 6.1. Initial software prototype. .....................................................................................24
Figure 7.1. Software design model. .........................................................................................25
Figure 8.1. Regional frame application view. ..........................................................................28
Figure 8.2. 2010_election attribute table. ................................................................................28
Figure 8.3. Four regional divisions. .........................................................................................29
Figure 8.4. Urban areas layer and congressional layer respectively. .......................................30
Figure 8.5 Presidential layer and voting-age layer respectively.. ............................................30
Figure 8.6. Political frame layers view with 9 political regions. .............................................31
Figure 8.7. Nine political regions layer. ..................................................................................32
Figure 9.1. ZoomPanToolBar. .................................................................................................33
Figure 9.2. Selection toolbar. ...................................................................................................34
Figure 9.3. Selected area view. ................................................................................................35
Figure 9.4. Buffer tool dialog. .................................................................................................35
Figure 9.5. Attributes table for selected area ...........................................................................35
Figure 9.6. Custom toolbar ......................................................................................................36

ix
Figure 9.7. Add layer dialog ....................................................................................................36
Figure 9.8. Pointer tool dialog .................................................................................................37
Figure 9.9. Hotlink election matrix dialog ...............................................................................37
Figure 9.10. Hotlink district dialog ..........................................................................................38
Figure 9.11. Hotlink code snippet ............................................................................................38
Figure 9.12. Election button result ...........................................................................................39
Figure 9.13. Men vs. women graph .........................................................................................40
Figure 9.14. Attribute table of selected layer ...........................................................................41
Figure 9.15. Select year dialog ................................................................................................41
Figure 9.16. House leaders dialog ............................................................................................42
Figure 9.17. Election matrix dialog .........................................................................................43
Figure 9.18. USA map web application ...................................................................................43
Figure 9.19. Democrats vs. Republicans web application .......................................................44
Figure 9.20. District change web application ..........................................................................45
Figure 9.21. Quiz application ...................................................................................................46
Figure 9.22. Help dialog for hotlink tool .................................................................................46
Figure 9.23. Clear all result ......................................................................................................47
Figure 10.1. Custom menus .....................................................................................................48
Figure 10.2. Menu component and elements ...........................................................................48
Figure 10.3. File menu .............................................................................................................49
Figure 10.4. Create shape file dialog .......................................................................................49
Figure 10.5. Legend editor view ..............................................................................................50
Figure 10.6. Legend editor graduated symbols view ...............................................................51
Figure 10.7. Labeled map view ................................................................................................52
Figure 10.8. Theme menu ........................................................................................................52
Figure 10.9. Graphs menu ........................................................................................................53
Figure 10.10. Help dialog ........................................................................................................54
Figure 10.11. About dialog ......................................................................................................54
Figure 10.12. History dialog ....................................................................................................55

x
ACKNOWLEDGEMENTS
I thank my advisor and Thesis chairperson Professor Dr. Carl Eckberg, San Diego
State University for giving me an opportunity to work on this thesis project and always
supporting me with my work with sufficient guidance to accomplish this Thesis.
I thank Professor Roger Whitney, San Diego State University for showing interest in
knowing about the tool and its use and being part of this Thesis committee.
I also am obliged to Professor Mahasweta Sarkar, San Diego State University for her
acceptance and being part of this Thesis committee.

1
CHAPTER 1
INTRODUCTION
1.1 OVERVIEW
House elections occur every two years, correlated with presidential elections or
halfway through a President's term. Voters of the U.S. states choose U.S. Representatives.
Voters of the U.S. territories, commonwealths, and the District of Columbia choose
their non-voting delegates.
Usually, when a House election occurs in the same year as a presidential election, the
party of the presidential winner will gain seats. On the other hand, there is a historical pattern
that the incumbent president's party loses seats in elections that are held in the middle of a
presidential term. The most recent election was in 2010 held on November 2, at the midpoint
of President Barack Obama's first term in office.
The purpose of this project is to provide information on trends and history of the US
House of Representative elections and act as a learning tool for the teachers and students of
political science and history departments. Users can interact with this tool to add, edit
different map layers to view the election data for a specific year. This tool provides various
functionalities such as hotlink tool and graphs to view changes on district elections over the
years.
This tool is a GIS (Geographic Information Systems) based tool which is developed
using JAVA and MOJO (Map Objects and Java Objects) ,a product of ESRI (Environmental
Science Research Institute). This provides flexibility to display different layers in the map.
This tool includes the layers like States, Districts, Geographical regions, Political regions,
Congressional Apportionment etc. The important aspect of using GIS tool is to analyze the
data pattern in a more effective way through mapped data. This allows the user to view and
understand the data provided through maps, charts, attribute tables [1].

2
1.2 BASIC FACTS ABOUT HOUSE ELECTIONS
House membership has been fixed at 435 representatives throughout 1970-2012.
However the number of representatives varies after each 10 year census (1970, 1980, 1990,
2000, and 2010). Each state representative represents some number of people, but as total
population increases the number of people represented in a district grows.
Moreover districts have to be redrawn if a state changes its number of representatives
after a census. These district boundaries are drawn by each state. Thus showing voting results
by districts is much less feasible than showing results by county in presidential elections.
The theory is that the House is more sensitive to the needs and moods of the people
than the Senate, because it is completely elected every two years and each number represents
a smaller number of people, by and large.
1.3 CHAPTER SUMMARIES
Chapter 2 explains about the functional, data and platform requirements the tool
should satisfy. Chapter 3 discusses the technologies used in developing this application such
as Java, MOJO, Html, CDBF-viewer editor, Dreamweaver, CSS, JavaScript, jQuery,
Photoshop are explained. Chapter 4 shows the build configuration. Chapter 5 shows how to
edit and modify the dbf files. Chapter 6 tells about the software prototype of the application.
Chapter 7 shows the software design model. Chapter 8 explains about the shape files and
layers used within the application. Chapter 9 explains in detail about the toolbars and the
tools such as hotlink, pointer, graphs etc. included in the application. Chapter 10 explains
about the custom menus such as legend editor, add/remove/create layer added to the
application.
1.4 ABOUT THE APPLICATION
This GIS based application is developed using the MOJO-Map Objects Java Edition 2
library developed by ESRI. The application user interface is built using the Java Swing
library.
MOJO provides various functionalities that help create dynamic map content and
display in different forms. This makes it easier for the developer and the user to better
understand the application.

3
The application’s main objective is to provide the user with the information on the
United States House of Representatives Elections from year 1970-2010. The application
shows the election results, which include the representative, winning party, republican votes,
and democratic votes.
The application has 27 shape files which include the 20 years of election data files,
USA states file, 4 regional divisions, 9 political divisions, urban areas, congressional
apportionment, voting age, and presidential layer files. Details on each of these are provided
in later chapters.
The application also uses image files in .jpg and .png format. It provides a number of
graphs and web html files which provide detailed and interactive information to the user.
More details on the functionalities will be seen in further chapters.
The election results about the incumbent representatives for each year used in this
application are collected from the House of Representatives wiki pages [2]. The other
election results are referred from the Office of Clerk [3] and House of Representatives pages
[4].

4
CHAPTER 2
REQUIREMENTS
This thesis project features an application tool which has an interactive user interface
with the user, to learn about US House of Representative elections and its trends over the
years 1970-2010. This tool is developed for students under the guidance of Professor Dr. Carl
Eckberg, San Diego State University. There are 3 sets of requirements for this tool to be
effective.
2.1 FUNCTIONAL REQUIREMENTS
The functional requirements of the tool refer to the specific functionality the tool is
supposed to accomplish and perform. All the functional requirements were collected from
Dr. Carl Eckberg.
Following is the list of functional requirements:
The tool should provide the user with district maps for all years and provide a visual representation of the political party.
The tool should provide the user with the Election data in colored matrix form for each district.
The tool should provide the representation of election data with the 9 political regions
The tool should provide the representation of election data according to the geographical regions.
The tool should provide district information for each state using the hotlink tool
The tool should provide the user with “zoom to full extent” option which can be used by a user after zoom in and zoom out to go back to the original state.
The tool should have ‘print the map’ option.
The tool should provide the longitude and latitude information of the cursor location.
The tool should allow the user to pan the map in any direction.
Tool should be flexible enough to add any additional layers when required and remove the unwanted layers.
The tool must allow users to edit the map color scheme using legend editor.
The tool must popup information on the map when clicked on the district layers.

5
The users must be able to see the Gerrymander graph for the districts that changed parties yearly.
The users must be able to see the transition of Democrats versus Republicans over the years 1970-2010.
By using the identify tool a user should be able to click on a particular district/state and a table should be displayed on screen which should give information about that state.
The user must be able to toggle the frame for different views of map according to the political and geographical regions.
The tool should have a quiz on the data provided.
The tool should offer help on each tool using a right click.
The tool should have a help document.
The tool should provide information on the speakers of the house yearly.
The tool should provide different graphs on the size of representative’s yearly, population per representative, women to men percentage in House, voting age population yearly.
The tool should give a brief history on the House of Representatives.
The tool should be flexible and simple enough for the users. It should provide enough knowledge about US House elections to students.
It was recommended to develop using JAVA with MOJO (Map Objects Java Objects) since JAVA is platform independent.
2.2 DATA REQUIREMENTS
Data requirements mean the data that needs to be presented within the tool. House
elections data based on the congressional boundaries in shown to the user when the user
opens the main screen of the tool, or selects different options available in this tool. The tool
is divided in two frames. When the user starts the application, Regional frame must be
shown. The users must be able to toggle between frames.
The Regional frame shows information on the US elections as per the geographical
regional division. Regional frame has 10 layers when loaded initially. Users can add more
layers or remove layers. The information for each layer in Regional frame is as follows:
Regional Layers: These are four layers which include the West Region, South Region, Northeast and Midwest region. More information on these layers is provided in section 8.
Congressional Apportionment: gives information on the number of districts per state.

6
Urban states: shows urban areas on the map.
Elections layer: shows information about the winning party for each district indicating red as Republicans and blue as Democrats.
Voting-age: shows the voting age population state-wise for election years
Presidential elections: Shows the information on the 2010 presidential elections
States layer: shows the USA map giving census data for each state.
Political Frame shows information on the US elections as per the 9 political regions.
Frame 2 has 11 layers when loaded initially. The information for each layer in Political frame
is as follows:
This includes the 9 political regions, New England, Mid-Atlantic, East North Central, West North Central, South Atlantic, East South Central, West South Central, Mountain, and Pacific regions.
Elections layer: shows information about the winning party for each district indicating red as Republicans and blue as Democrats.
States layer: shows the USA map giving census data for each state.
2.3 PLATFORM REQUIREMENTS
Platform requirements are the specification of programming language and other
technologies used to develop the tool. JAVA is used as the programming language for
development of this tool. ESRI’s Map Objects Java Edition 2 was used as GIS solution.
Development and testing of this tool is done on Macintosh operating system. The
application can also be developed and executed on Windows platform.

7
CHAPTER 3
TECHNOLOGIES
This chapter introduces the technologies and platform used to develop this thesis
project. It describes each technology used and its advantages. Primary technologies used for
this thesis project are Java, Map Objects Java Edition 2, Eclipse Helios 3.7, Dreamweaver
and Photoshop. Advantages and usage of these technologies along with some other
technologies are discussed in this section.
3.1 JAVA
Java is a general-purpose, high-level programming language and a powerful software
platform developed by Sun Microsystems [5]. Java can be used to create complete
applications that may run on a single computer or be distributed among servers and clients in
a network. The concept of ‘Write-once-run-anywhere’ known as Platform Independence is
one of the important key features of the java language that makes java a very powerful
language. The programs written on one java platform can run on any platform if the platform
has a Java Virtual Machine. The Java Virtual Machine is platform dependent. As a
platform-independent environment, Java can be a bit slower than native code.
Java Swing library is used to develop the user interface of this thesis project. Swing
was developed to provide a more sophisticated set of GUI components than the Abstract
Window Toolkit. Java is simple, object oriented, distributed, interpreted, robust, secure,
portable and dynamic. Java has the following features: [6]
Simple: There are various features that make java a simple language. Programs in java are easy to write and debug because java explicitly does not use pointers. Java provides strong memory management and supports automatic memory allocation and de-allocation.
Object Oriented: Java is a fully Object Oriented language. Object is at the top level of data structure in java. By using the wrapper class, primitive data types can also be converted into objects.
Robust: Java supports automatic garbage collection mechanism. It provides powerful exception handling and type checking mechanism as compared to other programming languages.

8
Distributed: Internet programmers can call functions on HTTP or FTP protocols and can get access to the project files from any remote machine on the internet rather than rewriting codes on their local system.
Portable: Java language is portable provided that the system has an interpreter for the JVM.
Dynamic: While executing the java program the user can get the required files dynamically from a local drive or from a computer placed thousands of miles away by using the Internet connection.
Secure: Java uses the public key encryption system to allow the java applications to transmit over the internet in the secure encrypted form. Other features include performance, multithreaded, interpreted, and architecture neutral. The versatility of being platform independent makes Java to outshine from other languages.
Easily deployed: A java application with an executable jar file can be easily downloaded and executed. No installation software is needed, if the platform has java installed.
3.2 MOJO MAP OBJECTS – JAVA EDITION
Map Objects Java Edition is a pure Java Mapping API. Map Objects Java Edition can
be used in desktop application, Java applets, as well as server-side environments. Map
Objects is a product of ESRI.
This product is collection of client and server-side components that developers can
use to build custom, cross-platform geographic information system (GIS) applications.
Regardless of application development, whether you use the high-level components for rapid
application development in the integrated development environment (IDE) or develop into
the extensive application program interface (API), Map Objects Java Edition 2 helps you
build applications that perform a variety of geography based displays, query’s, and data
retrieval activities.
Important Features of Map Objects: [7]
Combine Multiple Distributed Data Sources:
By using applications created with Map Objects—Java Edition, end users can combine local data with Internet and Intranet data to create their own customized maps and easily integrate these with existing application architectures.
Supports wide range of GIS capabilities with Map Objects—Java Edition, users can perform the following activities within the application:
1. Labeling map features
2. Thematic mapping

9
3. Panning and zooming through multiple map layers
4. Specifying projections
5. Querying spatial and attribute data
6. Performing geometric operations
7. Measuring distances
8. Displaying real-time geographic data
9. Creating layouts
Deploy Applications over the Web: You can easily distribute your Map Objects-Java Edition applications over an Internet or Intranet through browser-hosted applets.
Tools for Building a User Interface: Provides rich Swing components which helps building applications that include functional toolbars, dynamic symbol control, query dialogs, overview and insert maps, and intelligent legends that make custom applications easy to use and develop.
Map Objects- Java Edition comes with the following useful resources:
1. A suite of high-level visual JavaBeans that allow to drag and drop at design time into an IDE such as Eclipse or NetBeans
2. Developer’s Guide and Programmer’s Reference
3. Javadoc (API references)
4. Client and server-side sample applications (including source code)
5. Quick-start tutorials
6. Comprehensive object model diagram.
User Interface using map objects see Figure 3.1 [7].
3.3 ECLIPSE IDE
Eclipse is a software development environment comprising an integrated
development environment (IDE) and an extensible plug-in system. It is an Open Source
environment and is used in several different areas, e.g. as a development environment for
Java or Android applications. [8]
The initial codebase originated from IBM VisualAge. The Eclipse SDK which
includes the Java development tools is meant for Java developers. Users can extend its
abilities by installing plug-ins written for the Eclipse Platform, such as development toolkits
for other programming languages, and can write and contribute their own plug-in modules.
Eclipse requires an installed Java Runtime. Eclipse 3.7 requires at least Java 5 to run.
Eclipse provides views, perspective and editors. The Eclipse IDE contains its own Java

10
Figure 3.1. MapObjects user interface. Source: ESRI. Map Objects, 2003. http://www.usgsquads.com/downloads/factsheets/ESRI_map_objects_java.pdf, accessed Oct. 2012.
compiler. The Java Development Tools are required if you compile Java source code outside
Eclipse and for advanced development scenarios.
Eclipse requires an installed Java Runtime. Eclipse 3.7 requires at least Java 5 to run.
Eclipse provides views, perspective and editors. The Eclipse IDE contains its own Java
compiler. The Java Development Tools are required if you compile Java source code outside
Eclipse and for advanced development scenarios.
Eclipse provides Perspectives, Views and Editors. Views and Editors are grouped into
Perspectives. Eclipse user interface consists of following views.
The workspace is the physical location where projects, source files, images and other
artifacts are stored. Eclipse also allows referring to external resources.
An Eclipse project contains source, configuration and binary files related to a certain
task which are grouped into buildable and reusable components.
A Perspective is a visual container or a set of Parts. The Eclipse IDE uses
Perspectives to arrange Parts for different development tasks. The main perspectives used in
the Eclipse IDE are Java perspective for Java development and the Debug perspective for
debugging Java applications. Eclipse user interface in shown in Figure 3.2.

11
Figure 3.2. Eclipse user interface.
3.4 CDBF VIEWER AND EDITOR
CDBF for Windows is a powerful dbf viewer and editor that let individuals and
business user’s access dbf files directly without programming via the familiar Windows
interface [9]. These files contain data in the form of tables and hence you can add, delete
each table entry. You can add columns or modify the structure of the table using this editor.
This tool gives full control over the dbf file which allows correcting the file using
hexadecimal editor. This allows you to View, edit and repair the DBF database files
(including memo fields), print database tables and export the data contained in them to a
variety of formats (TXT, CVS, PRG, XLS, SQL, DBF, XML) . The trial software is
downloaded from CBDF site [10]. This is not open source. Other open source alternative is
DBF Explorer.

12
3.5 HTML
HTML, Hypertext Markup Language is the basic foundation in creating and
displaying web pages. HTML documents are composed entirely of HTML elements
consisting of three components: a pair of tags, a start tag and end tag; attributes within the
start tag; and textual and graphical content between the start and end tags.
HTML elements form the building blocks of all websites. HTML allows images
videos and objects to be embedded and can be used to create interactive pages. It provides a
means to create structured documents by denoting structural semantics for text such as
headings, paragraphs, lists, links, quotes and other items. It can embed JavaScript and other
scripts, which affect the behavior of HTML webpages. We can also refer to Cascading Style
Sheets (CSS) to define the appearance and layout of text and other material. [11]
HTML5 is the new version of the HTML. HTML5 adds many new syntactic features.
These include the new <video>, <audio> and <canvas> elements, as well as the integration
of scalable vector graphics content.
3.6 CSS
CSS (Cascading Style Sheets) is used to style HTML elements.CSS was introduced
together with HTML 4, to provide a better way to style HTML elements.CSS can be added to
HTML in the following ways:[12]
Inline - Using the style attribute in HTML elements. An inline style can be used if a unique style is to be applied to one single occurrence of an element.
To use inline styles, use the style attribute in the relevant tag. The style attribute can contain any CSS property. The example below shows how to change the text color and the left margin of a paragraph:
<p style= “color:#666;margin-left:10px”>Hello</p>
Internal - Using the <style> element in the <head> section. An internal style sheet can be used if one single document has a unique style. Internal styles are defined in the <head> section of an HTML page, by using the <style> tag.
External - Using an external CSS file. An external style sheet is ideal when the style is applied to many pages. With an external style sheet, you can change the look of an entire Web site by changing one file. Each page must link to the style sheet using the <link> tag. The <link> tag goes inside the <head> section. The preferred way to add CSS to HTML is to put CSS syntax in separate CSS files.

13
3.7 JAVASCRIPT
JavaScript is the scripting language for Web. JavaScript is used in web pages to add
functionality, validate forms, communicate with the server, and much more.
Some of the JavaScript features: [13]
A Tool for HTML: JavaScript is powerful scripting languages that help HTML designers to effectively and interactively design websites and web pages in a very simple and efficient way.
Handles Dynamic Effects: With JavaScript we can achieve dynamic effects in web pages. Using the features available in JavaScript, the designer can dynamically add text at runtime; animate certain elements, style elements at runtime and much more.
Browser Detection: One of the important features of JavaScript is its ability to detect client browser. Browser detection feature of JavaScript helps to achieve independent platforms. It helps designers to have different styling dependent on browsers, for example, a web page may look different in Internet Explorer than in Firefox.
Saves Time: JavaScript supports validation of data submitted at the client level. This helps in saving the processing time of the server.
DOM: Client side JavaScript is embedded inside HTML; this embedded JavaScript is used along with DOM (Document Object Model) for control over the browser by means of objects.
Interpreted Language: It can be used or executed with ease without pre-compilation, which makes it an interpreted language.
3.8 JQUERY
jQuery is a fast and concise JavaScript Library that simplifies HTML document
traversing, event handling, animating, and Ajax interactions for rapid web development.
jQuery is designed to change the way that you write JavaScript [14].
jQuery is free, open source software, licensed under the MIT License. jQuery's syntax
is designed to make it easier to navigate a document, select DOM elements, create
animations, handle events, and develop Ajax applications. jQuery also provides capabilities
for developers to create plug-ins on top of the JavaScript library. This enables developers to
create abstractions for low-level interaction and animation, advanced effects and high-level
widgets. The modular approach to the jQuery library allows the creation of powerful
dynamic web pages and web applications [15].
14
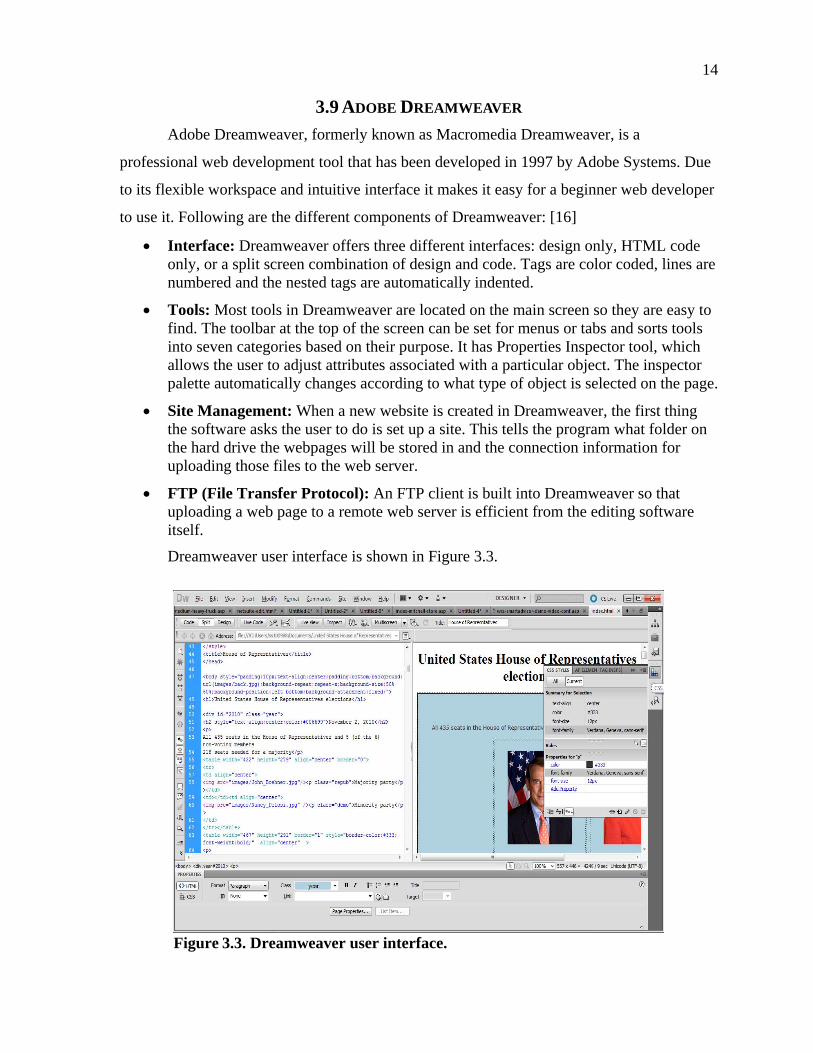
3.9 ADOBE DREAMWEAVER
Adobe Dreamweaver, formerly known as Macromedia Dreamweaver, is a
professional web development tool that has been developed in 1997 by Adobe Systems. Due
to its flexible workspace and intuitive interface it makes it easy for a beginner web developer
to use it. Following are the different components of Dreamweaver: [16]
Interface: Dreamweaver offers three different interfaces: design only, HTML code only, or a split screen combination of design and code. Tags are color coded, lines are numbered and the nested tags are automatically indented.
Tools: Most tools in Dreamweaver are located on the main screen so they are easy to find. The toolbar at the top of the screen can be set for menus or tabs and sorts tools into seven categories based on their purpose. It has Properties Inspector tool, which allows the user to adjust attributes associated with a particular object. The inspector palette automatically changes according to what type of object is selected on the page.
Site Management: When a new website is created in Dreamweaver, the first thing the software asks the user to do is set up a site. This tells the program what folder on the hard drive the webpages will be stored in and the connection information for uploading those files to the web server.
FTP (File Transfer Protocol): An FTP client is built into Dreamweaver so that uploading a web page to a remote web server is efficient from the editing software itself.
Dreamweaver user interface is shown in Figure 3.3.
Figure 3.3. Dreamweaver user interface.

15
3.10 ADOBE PHOTOSHOP
Adobe Photoshop is a graphical editing tool developed by Adobe systems. The latest
release of Photoshop is CS6 version [17].
Photoshop offers various different tools such as cropping, text tool, selection tool,
shape tools, layer control tools etc. that can be to create and edit graphic images. The saves
the files in .PSD format which are the working files can be edited whenever required. The
images created can also be stored in other image formats such .png, .jpg.
In this thesis project, the Adobe Photoshop CS5.0 was used to create different graphs
images and the images used in html files. The user interface is shown in Figure 3.4.
Figure 3.4. Adobe Photoshop user interface.

16
CHAPTER 4
BUILD CONFIGURATION
Eclipse IDE is used to create this thesis project.To build the project using the ESRI
libraries, the mojo20 files should be added to the project. Following are the steps involved in
creating a project.
4.1 CREATE A PROJECT
1. Start eclipse
2. Select a workspace from the dialog and ensure to check the box that makes it the default workspace. Figure 4.1 shows the workspace dialog.
3. From the File menu, select New and then Project. File>New>Project->Java project. See Figure 4.2.
4. In the New Java Project Dialog, enter Name as the Project name and click the Finish button. See Figure 4.3.
5. The project name hello is created and shown in Package Explorer.
Figure 4.1. Eclipse select workspace dialog.

17
Figure 4.2. Create new project menu.
Figure 4.3. New project menu dialog.

18
4.2 CONFIGURE BUILD PATH
To add the ESRI mojo library to the project follow these steps:
1. Right click on the project.
2. Select Build path -> Configure build path. See Figure 4.4.
3. Select add external jars from the library tab. See Figure 4.5.
4. Browse to the ESRI Mojo20 libraries. See Figure 4.6.
5. Click Ok. The libraries are now added to your project. See Figure 4.7.
Figure 4.4. Configure build path menu.

19
Figure 4.5. Add java external libraries.
Figure 4.6. Browse for MOJO20 external libraries.

20
Figure 4.7. Add MOJO20 external libraries.

21
CHAPTER 5
DBF FILES
DBF is basically the file format used for the database file. This format used originally
by the dBase database management system to store tables of data and later adopted by similar
DBMS packages. The file format is a combination of a simple structure and support for data
types appropriate for business use. It is best suited to fixed-field data and used in storing
fixed field tables of textual and numeric data. [18]
ESRI adopted the DBF format for storing the tabular data for the shape files. For
instance, the ‘2010_elections.dbf is the data table pertaining to the 2010_elections.shp(shape
file).
There are various software’s available for editing and creating the dbf files such as
DBF explorer, CDBF explorer, Open office for Macintosh systems.
The CDBF explorer and the Open office are the software’s used while creating the
Dbf files of this thesis project.
5.1 EDIT FILE USING CDBF EDITOR
To edit a file follow these steps: See Figure 5.1.
Open CDBF software
Browse to the dbf file to edit
Double click on the field data you need to edit
To delete a row, select a row you need to delete, click the red-cross mark on the left side of the row.
5.2 MODIFY STRUCTURE
To modify the structure i.e. to add new columns to the file follow these steps:
Select file -> modify structure.
Add the column name, type and decimal (if numeric value) values.
A column with specified name will now be added.
You can then type in your new information in the new added column. See Figure 5.2.

22
Figure 5.1. CDBF viewer-editor.
Figure 5.2. Edit structure dialog in CDBF.

23
CHAPTER 6
SOFTWARE PROTOTYPE
Software prototyping is activity that is involved in software development. It is the
initial version of the end software. It is a useful component in a software development
process. The original purpose of a prototype is to allow users of the software to evaluate
developers' proposals for the design of the eventual product by actually trying them out,
rather than having to interpret and evaluate the design based on descriptions.
Prototyping has several benefits:
The customers, including end-users, can examine the prototype and provide feedback on additions or changes on the application at an early stage.
Using the feedback, both the specifications and the prototype can be improved; this guides the application onto a right path towards final outcome.
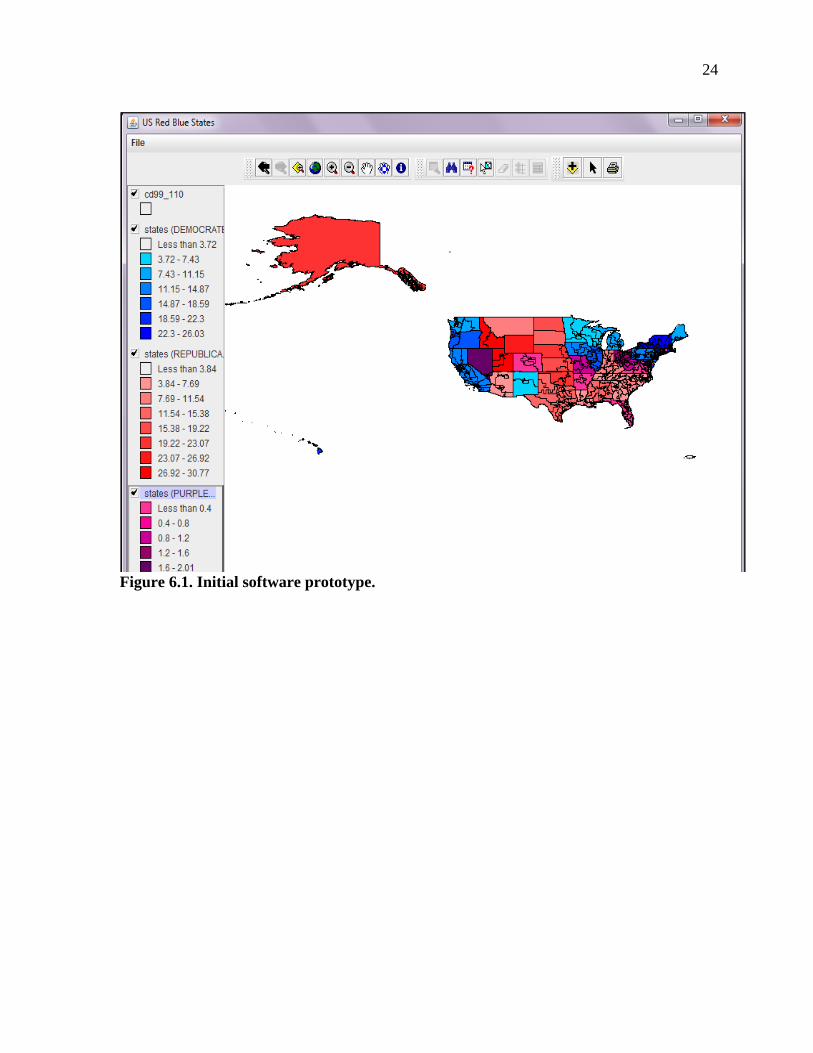
The initial prototype for this thesis project was developed to get a brief idea on the
final election model. The application had the user interface setup with a few toolbars.
The application had the following features:
The application displayed US states layers with the Republicans and Democrats information for each state.
It displayed the congressional district boundary layer of 111th congress.
The application had the election data of 2010.
The map used red-blue-purple color scheme to differentiate between the Democrats Republicans and other respectively.
The zoom tool bar, selection tool bar and legend editor menu to edit the map layers.
This initial prototype had various additions and enhancements at each development
stage to accomplish the final tools and functions. See Figure 6.1 for screenshot of the initial
prototype.
24
Figure 6.1. Initial software prototype.

25
CHAPTER 7
SOFTWARE DESIGN MODEL
The software design model explains the user interface elements within the
application. It shows the behavioral tree of the applications GUI. It a graphical representation
of the structures needed by the application, relations among each of them and properties
associated with each element. It will provide an easy presentation of the functional/logical
viewpoint about the application.
The software design model for this thesis project is shown in Figure 7.1:
Figure 7.1. Software design model.
The model consists of the following parts: The main application panel is the window
which first opens on running the application. All other elements are part of the application
panel.

26
Menu Bar: The menu bar includes the following items:
File: It has the add layer, remove layer, create new layer options. These items allow the user to edit the panel by adding or removing the shape file layers.
Theme: It has legend editor, house year selection; these allow editing the display options of the map and adding a new election layer for the year selected respectively.
Graphs: It has various graphs options such as democrats vs. republicans, women vs. men in house, population per representative etc. More on this in section 9.3
Help: The help document and History about the house are added under this menu.
Tool Bar: The toolbar has various buttons which allow the user to get more information on
the application and a better learning functionality. It consists the zoom tool bar, identify tool,
pointer tool, hotlink tool, graph button, add layer button, remove layer button, year selection
button, election button, matrix button, clear button, gerrymander button, democrats vs.
republicans button, house election button.
TOC: It has the information on the layers added to the panel. User can select and deselect
layers from here. When a new layer is added it gets added to the currently displayed TOC.
This application has two different TOC’s with different layers on them. In this project the
layers are divided between two TOC’s. ESRI calls a TOC element a “legend”.
TOC1: It has the 2010_elections, states layer. 4 regional division layers, congressional
apportionment layer, voting-age layer, urban areas, presidential election layer.
TOC2: It has the 2010_elections, the 9 political division’s layers, states layer.
Map: The map on the panel is updated according to the selected TOC and its layers. The
visible TOC layers will be displayed on the map depending on their selection. The toggle
button helps traverse between the TOC displays.

27
CHAPTER 8
LAYERS AND SHAPEFILES
8.1 SHAPE FILES
ESRI Shape file is the data format for geographic information systems software for
storing geometric location and associated attribute information in vector format. Shape files
spatially describe geometries, points, polylines, and polygons. Each feature has attributes that
describe about the feature. The attribute data for the shape file is stored in the dbf format.
Three individual files are mandatory to store the core data that comprises a shape file: ".shp",
".shx", and “.dbf" [19]. Mandatory files: [19]
.shp : shape format; the feature geometry itself
.shx : shape index format; a positional index of the feature geometry to allow getting forwards and backwards quickly
.dbf : attribute format; attributes for each shape, in dBase IV format
ArcView is GIS software developed by ESRI can used to create new different kinds
of shape files such as polygon, points, lines etc.
MOJO20 library has a predefined set of functions to add and remove shape files. We
can include an existing shape file for a layer in the TOC using the predefined function
addShapeFileToMap().
This application also consists of a menu option ‘create Layer from selection’, to
create a new layer from the selected parts of the current layer.
The application also has a tool "Add layer", to add a shape file to the map. This tool
will allow user to select a created shape file and add it as a layer to the TOC. The shape files
used in the application are accessed from National Atlas.gov [20] and Tiger shape files [21].
8.2 LAYERS
The tool has two panels showing 20 layers when the application is first executed. The
frames are divided between political regions and geographical regions. This division will
allow the user to co-relate the election data with the different regional divisions Figure 8.1
shows the layers added to the Regional frame.

28
Figure 8.1. Regional frame application view.
Common layers for Regional frame and Political frame:
2010_elections: This layer shows the data for 2010 House elections for each of the 435
districts. It shows a color-map differentiating the Democrats as blue and Republicans as red.
On clicking on a district user will get the information for the representative for the particular
district and his party. The attribute table for this layer has the district census data along with
the republican votes (r_vote), democratic votes (d_vote), house representative and winning
party information. Figure 8.2 shows the attribute table.
Figure 8.2. 2010_election attribute table.
States layer: This layer is the USA map layer giving the 2010 census information about each
US state. The hotlink tool is associated with the states layer, and will give information on the
number of districts and election data from year 1970-2010 for each state.
The layers added to Regional frame are:

29
South-Region: This includes Delaware, Maryland, District of Columbia, Virginia, West Virginia, North Carolina, South Carolina, Georgia, Florida, Kentucky, Tennessee, Mississippi, Alabama, Oklahoma, Texas, Arkansas, and Louisiana states.
West Region: This includes Idaho, Montana, Wyoming, Nevada, Utah, Colorado, Arizona, New Mexico, Alaska, Washington, Oregon, California, and Hawaii states.
Northeast Region: This includes Maine, New Hampshire, Vermont, Massachusetts, Rhode Island, Connecticut, New York, Pennsylvania, and New Jersey states.
Midwest Region: This includes Wisconsin, Michigan, Illinois, Indiana, Ohio, Missouri, North Dakota, South Dakota, Nebraska, Kansas, Minnesota, and Iowa states.
Figure 8.3 shows the four regions on map:
Figure 8.3. Four regional divisions.
Urban Areas: The shows the urban areas in the US. Using this layer the user can get information about various urban areas and get their election information in detail using the district in which a selected urban area lies. This layer is added on top of the election layer to get a visual distribution of which party the area lies in. The attributes table for the urban layer gives properties like the shape, area, perimeter, state name, state id etc. The visual representation is the black dots on the map. The Figure 8.4 shows the urban areas layer.
Congressional Apportionment: These layers gives the information on the number of districts for each state from Census 1970-Census 2010. It shows a color-map with graduating colors for states with least-highest number of districts. The attributes table of this layer has the state name, number of districts according to census 1970-2010, area and population. The visual representation is shown in Figure 8.4.
Presidential Elections: This layer shows information on the 2010 Presidential elections. It shows a color-map for red (indicates Republicans) and blue (indicates Democrats) states. The Figure 8.5 shows the Presidential Elections layer.

30
Figure 8.4. Urban areas layer and congressional layer respectively.
Voting-age: This layer shows the voting age population for each state .It shows a color-map for graduating colors for states from lowest-highest. The visual representation is shown in Figure 8.5.
Figure 8.5. Presidential layer and voting-age layer respectively.
The Political frame has the map layers correlated with the 9 political divisions. This
will help the user to see information about the districts in a particular region. The Political
frame visual representation is shown in Figure 8.6.

31
Figure 8.6. Political frame layers view with 9 political regions.
The toggle map button allows user to toggle between these two views i.e. Regional
frame view and Political frame view. See Figure 8.7.
The layers added to Political frame are:
New England: This layer comprises of Maine, New Hampshire, Vermont, Massachusetts, Rhode Island, and Connecticut states.
Mid-Atlantic: This layer comprises of New York, Pennsylvania, New Jersey states
East North Central: This layer comprises of Wisconsin, Michigan, Illinois, Indiana, and Ohio states.
West North Central: This layer comprises of Missouri, North Dakota, South Dakota, Nebraska, Kansas, Minnesota, Iowa, and Colorado states.
South Atlantic: This layer comprises of Delaware, Maryland, District of Columbia, Virginia, West Virginia, North Carolina, South Carolina, Georgia, and Florida states.
East South Central: This layer comprises of Kentucky, Tennessee, Mississippi, and Alabama states.
West South Central: This layer comprises of the Oklahoma, Texas, Arkansas, and Louisiana states.
Mountain: This layer comprises of Idaho, Montana, Wyoming, Nevada, Utah, Arizona, and New Mexico states.

32
Figure 8.7. Nine political regions layer.
Pacific: This layer comprises of Alaska, Washington, Oregon, California, and Hawaii states.
All the 9 political region layers have attributes such as state_id, name, population
area, and other 2010 census data within the attributes table.
Along with the added a layers, user can add more layers using the "Add layer" tool.
Also calendar tool will allow the user to select an election layer and add the selected year
election layer to the TOC.

33
CHAPTER 9
TOOLBARS
Toolbars are implemented with the application for the users to have sufficient
interaction with the application and get a good learning experience. MOJO-Map Objects-Java
Edition 2 comes with some toolbars like Selection tool bar, Zoom pan tool bar, etc. These
tool bars provide the user with some standard functionality like zoom in, zoom out, pan
direction etc. In this thesis project, I have used two standard tool bars; Selection tool bar and
Zoom pan tool bar. The details on toolbars are accessed from Notes on Map-Objects [22]. A
detailed description about these tools is described below.
9.1 ZOOMPANTOOLBAR
ZoomPanToolBar provides 9 tools required in this application. The basic tools that
are more useful here are Zoom in, Zoom out and identify. See Figure 9.1 for details of the
each tool in ZoomPanToolBar.
Figure 9.1. ZoomPanToolBar.
Previous Extent: This is used to show the map to the previous display extents stored. This tool is activated when the zoom in zoom out tools are used.
Next Extent: This is used to show the map to the next available display extents stored. This tool is activated when the zoom in zoom out tools are used.
ZoomToActiveLayer: This tool is used to zoom a selected layer. This tool is activated only when user selects a layer on the TOC.
ZoomToFullExtent: This tool is used to zoom the map to an extent which covers all the layers on the map within its extent. This tool will help user return to original extent of the map.
Zoom In: This tool is used to zoom in at a particular portion of the map. The user needs to select the zoom in icon and then click on the desired area that needs to be zoomed in.

34
Zoom Out: This is used to zoom out a particular portion on the map. The user needs to select the zoom in icon and then click on the desired area that needs to be zoomed out.
Pan: This tool is used to move the map when in the zoomed mode to obtain clear visibility of a location.
Pan One Direction: This tool allows the user to pan map only in one direction.
Identify: This tool allows the user to get attribute information of the selected feature on the map. User needs to first select the identify tool and then click on the map location to get its properties.
9.2 SELECTION TOOLBAR
Selection Toolbar is another tool bar which allows user to select features on the map
and get information on the selected features. The user first needs to select a layer for
activating the Selection tool bar. This tool bar mainly used for selecting required features
from the map, querying the attribute table, find certain features, calculate buffer for the
selected area. The tool is as shown in Figure 9.2.
Figure 9.2. Selection toolbar.
The list of tools in selection toolbar as per Figure 9.2 is as follows:
Find tool: This tool is to find the features of layers mentioned in the find dialog.
Search tool: This tool opens up a dialog which is used to find the features on the map from a predefined stored query.
Query Builder tool: This tools allows the user to query the database, get required fields and then selecting the features on the map as a result of the query.
Select Feature tool: This tool allows the user to select features on the map by using any of the polygons options such as rectangle, circle etc. User will first need to select a layer to activate this tool, then select the polygon option and drag the mouse over the features that need to be selected. Figure 9.3 shows selected area tool.
Clear Selection tool: This tool is to deselect all the features that are selected using select Feature tool. The portion which was selected and yellow is now cleared using this tool. This tool is enabled only when the select feature tool is used.
Buffer: This tool is to develop a buffer portion around the selected features. Figure 9.4 shows buffer tool dialog.
Attribute Table: This tool will display the attribute table for the layer selected. When the features are selected using the select feature tool, this tool will show

35
Figure 9.3. Selected area view.
Figure 9.4. Buffer tool dialog.
attributes of the selected features. This table consists of fields and records of dbase file. Figure 9.5 shows attributes dialog.
Figure 9.5. Attributes table for selected area.

36
9.3 CUSTOM TOOLBAR
This toolbar gives the user additional functionalities to get information on the data
included within the application. The tools included here are the add layer, remove layer,
calendar, clear, election button etc. Figure 9.6 shows the custom tools available.
Figure 9.6. Custom toolbar.
More in detail about the custom tools:
Add layer: The add layer tool will allow the user to add new layer to the current TOC. It will
pop up a dialog asking the user to browse and select a shape file which needs to be added.
This function makes use of the addShapeFileToMap() functions to add the file to the map.
Figure 9.7 shows add layer dialog.
Figure 9.7. Add layer dialog.
Remove layer: This tool will allow the user to remove the added layers. The user can add as
many layer to the map using the add layer and the calendar button tools. To avoid the user
from getting lost in too many layers this option is provided to help user clear the workspace.
Pointer tool: This tool will allow the user to select layers and select other tools within the
application. This tool will also provide information on the elections layer when clicked on a
feature. See Figure 9.8.

37
Figure 9.8. Pointer tool dialog.
Hotlink tool: The hotlink tool is used to get more information about the selected feature. In
this thesis project the hotlink tool is applied on the states layer for showing more in detail
about the selected state. The user must first select the hotlink tool, select the states layer and
then click on the map feature to get more information on the state.
This will show the congressional district map for the selected state and will also have
an option to view a graph on elections. On selecting the view graph the matrix of red-blue for
each district of the selected state is displayed.
For example, if the user clicks on California State using the hotlink tool Figure 9.9
and Figure 9.10 is displayed. Figure 9.11 shows the hotlink tool code snippet.
Figure 9.9. Hotlink election matrix dialog.

38
Figure 9.10. Hotlink district dialog.
Figure 9.11. Hotlink code snippet.

39
Election button: This button will allow the user to select only the 2010_election layers and
deselect all other layers present in TOC. On clicking this tool the 2010_elections will be
active and shown on the current panel. If the 2010_elections is absent in the TOC, the tool
will add the layer to the current TOC using the addshapeFileToMap() function.
The Figure 9.12 shows that only the 2010_elections is displayed.
Figure 9.12. Election button result.
Graph tool: This tool provides various options to the user to select a graph and show it on a
different frame. The graphs included in this application are:
1. Democrats vs. Republicans: Shows the trend in democrats and republicans from
2. 1970-2010
3. House of Representatives Region: This graph will show the distribution of the house seats between the 4 regions.
4. Size of House Representatives: This graph will show the change in size of House from year 1789-2009
5. Population per Representative: This graph will show the average population per representative in house from year 1793-2003.
6. Votes cast yearly: This graph will show the number of votes cast yearly from year 1970-2010.
7. Voting population yearly: This graph will show the number of population eligible for voting from year 1970-2010
8. Districts Changes yearly: This graph will show the number of districts that changed party from the previous elections for years 1970-2010.

40
9. Men to Women percent yearly: This graph will show information on percentage of men and women in the House from year 1970-2010.
The visual representation of the men-to Women graph is shown in Figure 9.13:
Figure 9.13. Men vs. women graph.
Attribute table: The attribute table will show the properties associated with a shape file that
are stored in the dBase format within the .dbf file. This tool will be enabled only when a
layer is selected. On clicking the attribute table tool the attribute table for the selected layer is
shown. See Figure 9.14.
Calendar tool: This tool will allow the user to select a year and add the election layer to the
current TOC. The status bar at the bottom will help the user know the current selected year.
See Figure 9.15.
House button: This tool will give information on the majority party and minority party for
the house elections. It will give details on the leaders, party, district, number of seats etc. of
the majority and minority party. It shows information from years 1970-2010. On clicking this
tool the information is shown on a different frame with an option to open it in browser. See
Figure 9.16.

41
Figure 9.14. Attribute table of selected layer.
Figure 9.15. Select year dialog.

42
Figure 9.16. House leaders dialog.
Matrix button: This tool will show the election data matrix for all the districts from years
1970-2010 in the red-blue color format for indicating winners. It will give the user a better
understanding on elections for each district. It also shows the change in number of districts
for each state. For example you can observe the trend that Montana had two districts in 1970
and changed to at-large district in 1990 census. See Figure 9.17.
USA map tool: This tool will open a web application showing the trend of elections from
year 1970-2010. It will basically show the USA map with red-blue districts for each year.
The user can select a year from the slider to view a map for a particular year. It is add-on
functionality for the user to get easy access to all the map layers with one click. See Figure
9.18.

43
Figure 9.17. Election matrix dialog.
Figure 9.18. USA map web application.
Democrats vs. Republicans tool: This tool will open a web application which allows the
user to display an interactive graph for democrats versus republicans. It will show a motion
graph on how democrats and republicans gained seats over the years and give clear idea on
who was the winning party for that year. See Figure 9.19.

44
Figure 9.19. Democrats vs. Republicans web application.
User can click plot graph button to view the motion graph from year 1970-2010 or
select a year from slider to view the transitions from 1970 to selected year.
Gerrymander tool: This tool will open a web application which will show the number of
districts that changed party then the previous elections. This will display an interactive graph
showing the transitions of the numbers from years 1970-2010. The slider will allow the user
to select a year and view the bar graph for that year.
It allows the user to interact with the graphs and get a better learning experience. See
Figure 9.20.
Quiz tool: This tool will open a quiz as a web application. The quiz will have 12 questions
which will test the user’s knowledge about the information provided in the application and

45
Figure 9.20. District change web application.
how well the user has used this learning tool. It will give the user the score of the quiz and
also provide correct answers. See Figure 9.21.
Help tool: This tool is added within the project to provide help on all the other tools within
the application. To make use of the help, the user will need to select the help tool and then
right click on the tool whose help is needed. Example of the hotlink tool help is shown in the
Figure 9.22.
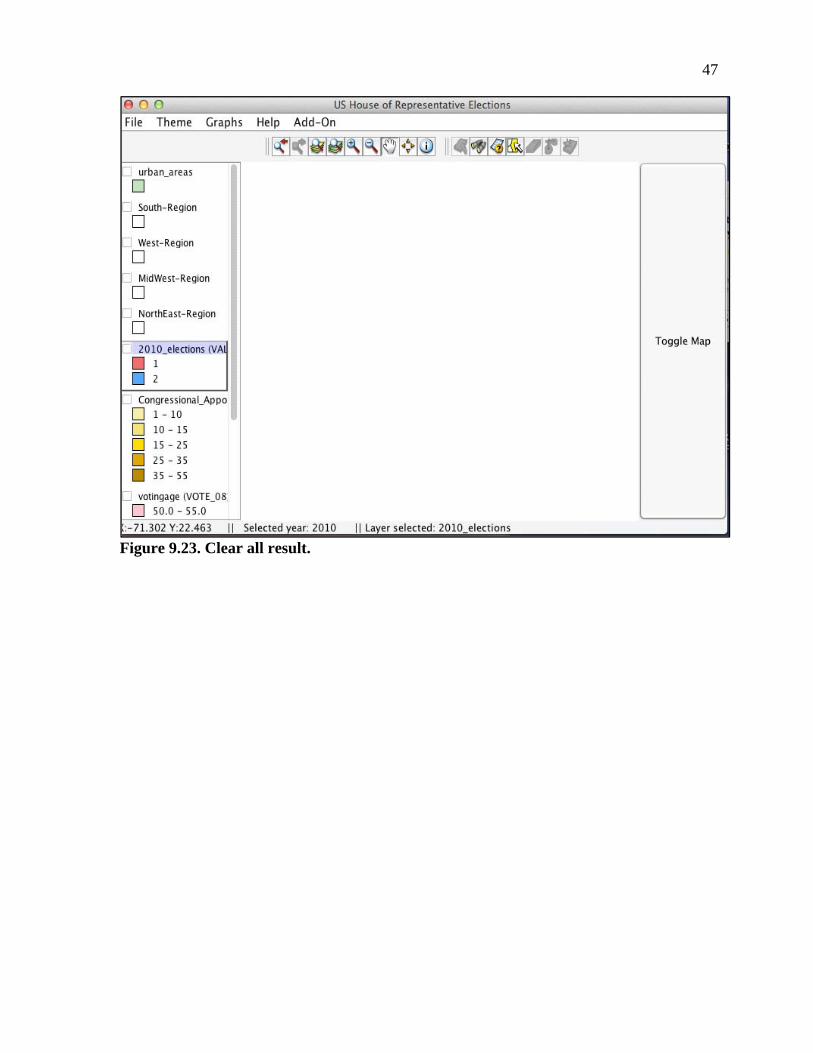
Clear-all tool: This tool will deselect all the layers within the current TOC and clear the
map. This will help user to select a layer which needs to be viewed and avoid getting lost
with the number of layers added. The layers will be removed from view but will be present in
the TOC so that user can select the required layers. Figure 9.23 shows result of Clear all tool.

46
Figure 9.21. Quiz application.
Figure 9.22. Help dialog for hotlink tool.
47
Figure 9.23. Clear all result.

48
CHAPTER 10
CUSTOM MENUS
Using java we can add menu bar to the MOJO application. These menus will user to
dynamically interact with the application for adding/removing layers, editing various map
options and give a good learning exposure. On clicking a menu on a menu bar a dropdown
will pop up giving user various options to select from these options are called Menu Items.
This thesis project uses the custom menus to allow the user to add, remove layers,
edit map options, view graphs, select year, view help document etc. The Figure 10.1 shows
the menu bar.
Figure 10.1. Custom menus.
The Menu Component consists of the MenuBar, MenuItems, Popupmenu. The design
chart of the Menu components used within this project is shown in Figure 10.2.
Figure 10.2. Menu component and elements.

49
10.1 FILE
The file menu gives user the options to add / remove layer, edit the map using the
Legend Editor, create layer from selection. Figure 10.3 shows file menu.
Figure 10.3. File menu.
Add/Remove layer: These menu items will allow user to add new layer to the current TOC.
And the remove layer will remove the selected layer form current TOC. More in detail about
this menu items is provided in Section 9.3 of this document.
Create layer from selection: This menu item will allow user to create a new layer from the
selected layer. User should first select features from the map using the selection tool and then
click this menu item to create layer. A popup will then be provided to the user to save the
shape file, the created layer is then added to the top of TOC and the shape file could be found
at the location saved. Figure 10.4 shows create shape file dialog.
Figure 10.4. Create shape file dialog.
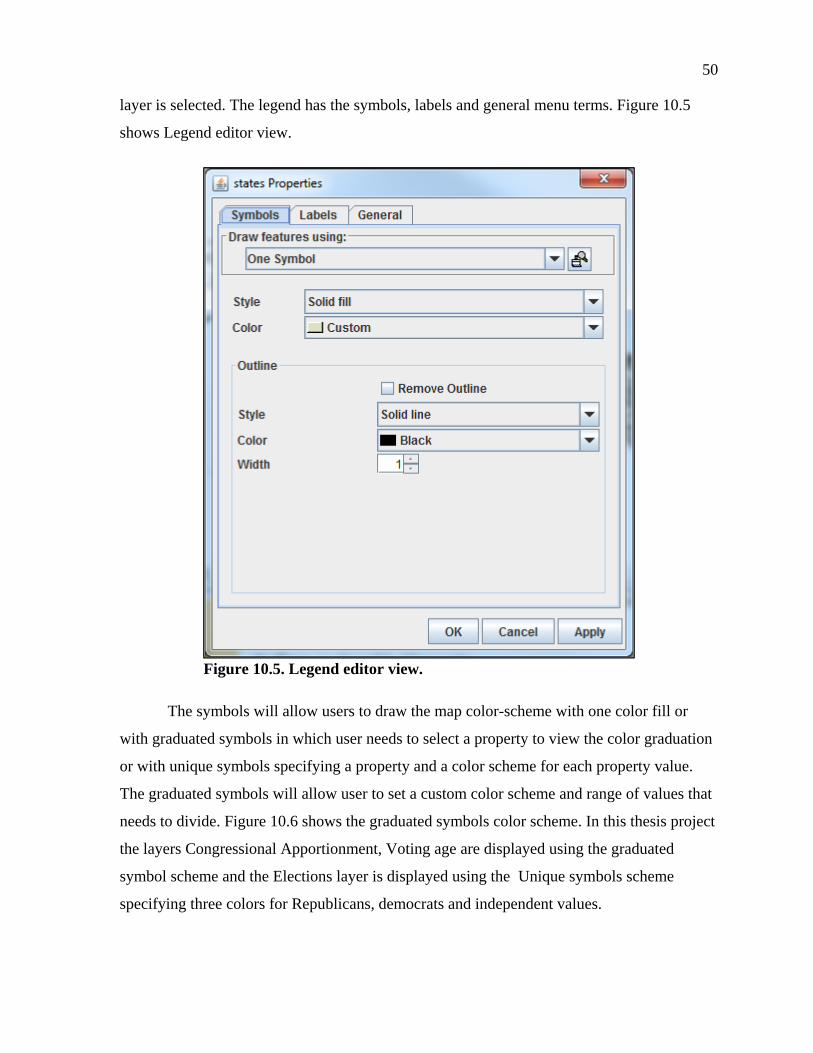
Legend editor: Legend editor can be used to add custom color scheme, labels etc. to the map
view. It will allow the user to interact with the display options of the map. These edits will
help user to create a better looking map that communicated data more effectively. With the
help of legend editor user can select a property which he wants to apply to the map, and view
the map based on that property values. The Legend editor menu item is enabled only when a
50
layer is selected. The legend has the symbols, labels and general menu terms. Figure 10.5
shows Legend editor view.
Figure 10.5. Legend editor view.
The symbols will allow users to draw the map color-scheme with one color fill or
with graduated symbols in which user needs to select a property to view the color graduation
or with unique symbols specifying a property and a color scheme for each property value.
The graduated symbols will allow user to set a custom color scheme and range of values that
needs to divide. Figure 10.6 shows the graduated symbols color scheme. In this thesis project
the layers Congressional Apportionment, Voting age are displayed using the graduated
symbol scheme and the Elections layer is displayed using the Unique symbols scheme
specifying three colors for Republicans, democrats and independent values.

51
Figure 10.6. Legend editor graduated symbols view.
The labels menu will allow user to select a property whose values need to be added as
labels to the features on the map. The Figure 10.7 shows the state_name property values
added as labels to the state layer. The type of the font and size and other style formatting can
also be done within this option.
10.2 THEME
The theme has the two menu items added to it. It will provide the user the option to
show the attribute table and open the year selection popup. The attribute table menu item is
enabled only when a layer is selected. The status will display the name of the layer selected
to avoid confusion when too many layers are added. The user can select a layer check the

52
Figure 10.7. Labeled map view.
status bar if the required layer is selected and click the attribute table option. More detail on
the attribute table is provided in Section 9.3 of this document.
The option House Election yearly will open a dialog with year values 1970-2010.
User can select a year and then say Ok to view the election map for the selected year. The
currently selected year is shown on the status bar, so the user can check the status bar to
check if the right year is selected. More detail on this option is provided in Section 9.3 of this
document. Figure 10.8 shows Theme menu items.
Figure 10.8. Theme menu.
10.3 GRAPHS
This option will provide a dropdown popup with 8 graph options to view from. It will
give a clear idea on various election and history related information. The Figure 10.9 shows

53
Figure 10.9. Graphs menu.
the graph menu items. More detail on Graphs option is provided in Section 9.3 of this
document.
These were created using the Adobe Photoshop software.
10.4 HELP
The Help menu provides the user with Help about the Tool, About the Tool, History
of House Elections menu items.
Help tool: The help document is opened when clicked on the help the tool option, and will
guide the user about the different tools and their use within the application. The Figure 10.10
shows the Help document.
About tool: This tool will provide copyright information about the tool version, and its
author. See Figure 10.11.
History menu item: The history option will open a dialog which displays the information on
the History of House of representatives which includes the information on The Continental
Congresses, House in 19th 20th and 21st centuries. It also talks about the size of
representatives and how the number went increasing from the years 1789. Figure 10.12
shows History dialog.

54
Figure 10.10. Help dialog.
Figure 10.11. About dialog.

55
Figure 10.12. History dialog.

56
CHAPTER 11
CONCLUSION AND OBSTACLES
This GIS based thesis project was presented to provide knowledge on the House of
Representative Elections. This GIS application creates a better understanding about the
elections from years 1970-2010. The application adopts the visual color scheme for
presenting the election data giving a clear idea about the election winning party for each
district. The application provides information on congressional districts for each state and
their change over years. The matrix form of presenting the election data helps to observe the
change of the districts over the years. Along with the election results, it provides information
on various other aspects of history and change in form of graphs. The application has various
tools which help interact with the application to get a good learning experience. This
application makes use of pictures and interactive graphs to give an enjoyable experience.
The application covers the data from years 1970-2010, which was a challenging part
while creating the application. This includes a large amount of research and data collection of
various election aspects for the each district in that year range. The application provides
shape files of election data for every year. Creating shape files for all these years including
the 435 district data was the major challenge encountered in this thesis.
57
CHAPTER 12
FUTURE ENHANCEMENTS
This GIS application tool developed to provide information on the House of
Representative elections fulfills the basic requirements, but there can still be many
enhancements that can further improve the application, by providing more knowledge on the
Elections and certain other terminologies. The further improvements would be:
More election results such as candidates in each election, incumbent defeats, and incumbent retirement.
The elections results can also display the darker to lighter red and blue states.
The application tool can be developed in several other languages to extend its use to a number of other users who lack knowledge in English
May have more interactive motion graphs and applications which will better explain the trend between the years.
The application may be divided upon the user such as Admin user and Student user, which will grant the admin to update the application, add questions to quiz, grade the quiz etc.
The application would have more layers and information about the other elections such as Senate and Presidential, and make it easily accessible in one application.

58
BIBLIOGRAPHY
[1] ESRI. What is GIS?, 2011. http://www.esri.com/what-is-gis/books, accessed Oct. 2012.
[2] Wikipedia.org. House of Representatives, 2012. http://en.wikipedia.org/wiki/United_States_House_of_Representatives, accessed Sep. 2012.
[3] Office of Clerk. Election Information, n.d. http://clerk.house.gov/, accessed Sep. 2012.
[4] United States House of Representatives. Directory of Representatives, n.d. http://www.house.gov/, accessed Sep. 2012.
[5] Wikipedia.org. Java Programming Language, 2012. http://en.wikipedia.org/wiki/Java_(programming_language), accessed Oct. 2012.
[6] Rose India Technologies Pvt. Ltd. Java Features, 2008. http://www.roseindia.net/java/java-introduction/java-features.shtml, accessed Sep. 2012.
[7] ESRI. Map Objects, 2003. http://www.usgsquads.com/downloads/factsheets/ESRI_map_objects_java.pdf, accessed Oct. 2012.
[8] Lars Vogel. Overview of Eclipse, 2012. http://www.vogella.de/articles/Eclipse/article.html#overview, accessed Oct. 2012.
[9] CleanSoft.org. CDBF-ViewerEditor Overview, 2012. http://cleansofts.org/cdbf-dbf-viewer-and-editor.html, accessed Oct. 2012.
[10] CDBF. CDBF - DBF Viewer and Editor, 2012. http://www.whitetown.com/cdbf, accessed Oct. 2012.
[11] Wikipedia.org. HTML, 2012. http://en.wikipedia.org/wiki/HTML, accessed Oct. 2012.
[12] W3Schools.com. CSS, 2012. http://www.w3schools.com/html/html_css.asp, accessed Oct. 2012.
[13] Exforsys Inc. JavaScript features, 2012. http://www.exforsys.com/tutorials/javascript/javascript-features.html, accessed Oct. 2012.
[14] JQuery. Documentation, 2012. http://jquery.com/, accessed Oct. 2012.
[15] Wikipedia.org. JQuery, 2012. http://en.wikipedia.org/wiki/JQuery, accessed Oct. 2012.
[16] Salon. Adode Dreamweaver Features, 2012. http://techtips.salon.com/dreamweaver-software-10236.html, accessed Oct. 2012.

59
[17] Wikipedia.org. Adobe Photoshop, 2012. http://en.wikipedia.org/wiki/Adobe_Photoshop, accessed Oct. 2012.
[18] Wikipedia.org. DBF Files, 2012. http://en.wikipedia.org/wiki/DBase, accessed Oct. 2012.
[19] Wikipedia.org. Shape files, 2012. http://en.wikipedia.org/wiki/Shapefile, accessed Oct. 2012.
[20] National Atlas.gov. Boundaries of the United States, 2011. http://www.nationalatlas.gov/, accessed Apr. 2012.
[21] United States Census Bureau. Tiger Shape files, 2012. http://www.census.gov/geo/www/tiger/, accessed Apr. 2012.
[22] C. Eckberg. Notes on Map Object-Java Edition Book. San Diego State University, San Diego, CA, 2010.