development of a gis based water management tool for a...
TRANSCRIPT

Pertanika J. Sci. & Techno!. 10(2): 209 - 227 (2002)ISSN: 0128-7680
© Universiti Putra Malaysia Press
Development of a GIS Based Water Management Toolfor a Large Scale Rice Irrigation Scheme
Rowshon M. K., Kwok C. Y. & Lee T. S.Department of Biological and Agricultural Engineering
Faculty of Engineering, Universiti Putra Malaysia43400 UPM Serdang, Selangor, Malaysia
Email: [email protected]
Received: 23 November 2000
ABSTRAK
Satu model berasaskan GIS telah direka untuk menggabungkan pelbagaimaklumat spatial dari kawasan pengairan Kerian. Kawasan pengairan ini dibahagikepada lapan kompatmen yang terdiri daripada 28 blok. Model ini mengandungitiga modul, iaitu Penjadualan (Scheduling) yang mengira pembekalan airberasaskan maklum balas spatial dan temporal daripada sawah, sementaramodul Pemantauan (Monitoring) menunjukkan maklumat tentang keseragamanbekalan air antara semua blok dan kompatmen. Petunjuk-petunjuk sepertiRelative Water Supply (RWS) , Water Use Efficiency (WUE), Cumulative RelativeWater Supply (CRWS), dan Water Productivity Index (WPI) ditentukan denganmodul Penilaian (Evaluation). Analisis lepas musim menggunakan maklumathidro-klimatik mingguan, bekalan air dan indeks pengairan mingguan bagisetiap blok. Berdasarkan tempoh seminggu, didapati bahawa julat RWS ialahantara 1.01 hingga 2.24 dan WUE ialah antara 45% hingga 99% bagi musimutama, sementara pada luar musim nilai RWS ialah antara 1.04 hingga 1.87 danWUE ialah antara 53.57% hingga 96.15%. ilai purata WPI ialah 0.13kg/m~
pada musim utama dan 0.22kg/m~ di luar musim. Peta tematik berkod warnatelah disediakan untuk mengesan Hasil Musim, dan Keamatan PenanamanMusim (Cropping Intensity), mengikut blok dan kompatmen. Maklumatdipamerkan dalam bentukjadual dan grafakan memudahkan proses membuatkeputusan sepanjang musim oleh pihak pengurusan. Model yang berasaskanmaklum balas daripada sawah ini dapat mempertingkatkan lagi sistempengurusan pengairan di jelapang padi.
ABSTRACT
A GIS based model was developed to integrate the vast amounts of spatiallydistributed information from the Kerian Irrigation Scheme comprising eightcompartments which are further subdivided into 28 blocks. The model consistsof three modules. The "Scheduling" program computes irrigation deliveriesbased on spatial and temporal demand of the paddy field by each compartment,block or secondary canal. The "Monitoring" program gives information bycompartment and by block on the uniformity of water distribution and theshortfall or excess. Relative Water Supply (RWS), Water Use Efficiency (WUE),Cumulative Relative Water Supply (CRWS), and Water Productivity Index(WPI) were computed by the "Evaluation" module. The post-season analysisuses weekly information on hydro-climatic parameters, irrigation delivery andirrigation indices by block within each compartment. On a weekly basis, RWSand WUE were found to range from 1.01 to 2.24 and 45% to 99% respectively

Rowshon M. K., Kwok C. Y. & Lee T. S.
in the main season and 1.01 to 1.87 and 53.57% to 96.15% respectively in theoff season. The average values of RWS and WUE were found to be 1.53 and68.15% in the main season and 1.33 and 78.47% in the off season respectively.The average values of WPI were also found to be 0.13 and 0.22 kg/m3 in themain season and off seasons respectively. Color-eoded thematic maps wereproduced for the monitoring of Seasonal Yields and Cropping Intensity (CI) byblock and compartment of the scheme. The results are displayed allowing themanager to view maps, tables and graphs in a comprehensible form to easedecision making as the season progresses. This study would be useful toimprove the irrigation system management based on feedback of fieldinformation.
Keywords: Water management, rice irrigation, user-interface and GIS
INTRODUCTION
Rice is the staple food in Malaysia. The Government has targeted rice productionof 1.20 million tons by 2010 at a self-sufficiency level of 65 percent in NationalAgricultural Policy, NAP 1992-2010. According to aJICA and DID report (Anon1998), effective use of water resources by rationalizing irrigation systems andimpartial water allocation with a suitable water management practice are keyfactors for increasing rice production. Irrigation performance has receivedgrowing attention during the last decades. Vast amounts of data are distributedspatially at district levels. These could be integrated to help improve watermanagement. Geographical Information Systems (GIS) is a tool with greatpotential for structuring information to improve monitoring and evaluation ofirrigation and drainage projects and assist in related policy decisions. Salman et.al. (1997) used Remote Sensing (RS) and GIS to monitor and evaluateirrigation and drainage projects in Pakistan. This study concentrated on theestimation of crop related indicators such as area under different crops andcropping intensity. Assessing performance requires a clear identification of theperformance indicators, the scale at which performance is to be assessed, andthe level of accuracy required by the potential users of this information. A GISbased software (NAGA Version 1) is being tested for monitoring and diagnosisof irrigation projects in Thailand. It expects improved stability of delivery at thesecondary level by "real time" monitoring; monitoring of the global indices ofefficiency and identification of mismanagement, easy weekly assessment ofperformance.
In irrigation projects there is significant variation in the spatial and temporaldata. GIS capabilities to integrate spatial data from different sources, withdiverse formats, structures, projections or resolution levels, constitute the maincharacteristic of these systems, thus providing needed aid for those models thatincorporate information in which spatial data has a relevant role (Goodchild1993). Bradly (1993) stated that the capability of GIS makes it appropriate fordecision-making. GIS provides a platform for retrieval and structuring of thatinformation to improve irrigation deliveries, monitoring and evaluation ofirrigation and drainage projects and related policy decisions. The objective of
210 PertanikaJ. Sci. & Techno!. Vo!. 10 No.2, 2002

Development of a GIS Based Water Management Tool for a Large Scale Rice Irrigation Scheme
this study is to develop a GIS interface program for Water Management of riceirrigation to improve regular or periodic irrigation delivery and monitoring,and post-season analysis to evaluate the irrigation performance.
Study Area
The Kerian Irrigation Scheme is one of the oldest Schemes in Malaysia. It issituated at the northwest comer of the State of Perak in Peninsular Malaysia.Fig. 1 shows the layout of the 28 blocks which make up a total irrigated areaof 23,800 ha. The catchment area of the reservoir is 489 km2 and active storageof the reservoir is 56 MCM with a dead storage of 19 MCM. It serves as thesource of irrigation water for compartments (E to H), while a pumping stationsupplements four compartments (A to D) at the tail end of the scheme.
I..;,;;;;;;;;;, :;.;;:;e-I II--_.. --..". j~ .....
• e-. OdAw
L-L..1--:.::;:='=..-P---L-.- _
Fig_ 1. Digitized layout of Kenan Irrigation
METHODOLOGYWater Balance in a Rice Field
The field water balance is used to characterise scheduling, monitoring andevaluation of the rice irrigation system. For a continuous irrigation system, howwell water is distributed among plots within a block for a particular irrigationperiod needs to be answered. Adequate monitoring and evaluation ofperformance is needed to improve water management practices to achieve asatisfactory level of efficiency. The schematic diagram of water balancecomponents in a paddy field is shown in Fig. 2, while the balance equation isexpressed as follows:
PertanikaJ. Sci. & Techno\. Vol. 10 0.2,2002 2II

Rowshon M. K., Kwok C. Y. & Lee T. S.
(1)
Where,WD.
J
WDj-lIRW.ET.
JSP.D1t• J
J
depth of water in the paddy field at the end of period, cm.depth of water in the paddy field at the beginning of a period, cm.depth of diversion of irrigation water supply during the period, cmrainfall during the irrigation period, cm.evapotranspiration from the paddy field during the period, cm.average seepage and percolation loss from the paddy field, cm.drainage requirement during the period, cm.period of water management for irrigation scheme, days.
Fig. 2. Water balance components of a model in a paddy field
In the Kerian Irrigation Scheme, where water is continuously supplied,excess water is drained whenever it exceeds the maximum allowable level ofwater (Dd) during season. It has to be considered that when standing waterdepth exceeds the maximum allowable water depth in the field, the drainagerequired is:
DR = WD. - Dd ifWD. > DdJ J J
(2)
Targeted Diversion Irrigation Supply
Precise estimation of irrigation delivery is a key element in any irrigationsystem. Accurate estimation of the expected rainfall and evaporation is difficult.Taking into account expected rainfall before performing the scheduling processescan save significant amounts of irrigation water. Spatial and temporal irrigationsupply for a single CHO can be estimated according to paddy field requirements.If WD is less than the targeted depth, Dd (ie., WD. < Dd) then the sum of
J Jdepleted standing water depth (WD
j- Dd) cm, and losses from the paddy field
and expected rainfall (ETj+ SP
j- ER) are considered in the scheduling process,
using the following equation:
212 PertanikaJ. Sci. & Techno\. Vol. 10 No.2, 2002
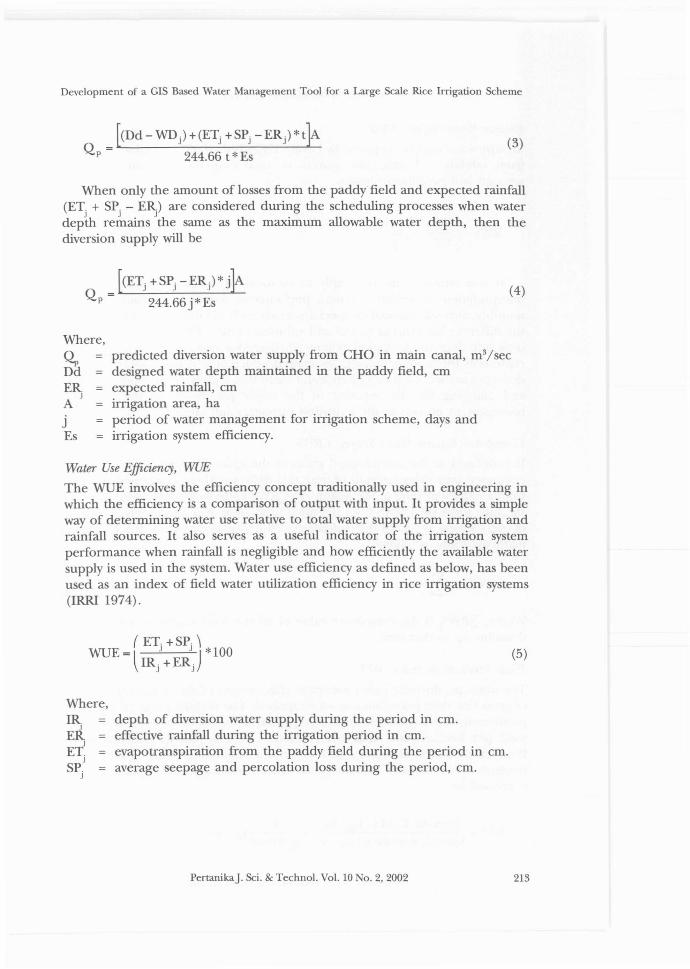
Development of a GIS Based Water Management Tool for a Large Scale Rice Irrigation Scheme
_ [(Dd - WD) +(ETj +SPj -ER)*tb.
Qp - 244.66 t *Es(3)
When only the amount of losses from the paddy field and expected rainfall(ET. + SP. - ER) are considered during the scheduling processes when water
J J J .depth remains the same as the maxlmum allowable water depth, then thediversion supply will be
(4)
Where,
~ERA
J
jEs
predicted diversion water supply from CHO in main canal, m3/secdesigned water depth maintained in the paddy field, cmexpected rainfall, cmirrigation area, haperiod of water management for irrigation scheme, days andirrigation system efficiency.
Water Use Efficiency, WUE
The WUE involves the efficiency concept traditionally used in engineering inwhich the efficiency is a comparison of output with input. It provides a simpleway of determining water use relative to total water supply from irrigation andrainfall sources. It also serves as a useful indicator of the irrigation systemperformance when rainfall is negligible and how efficiently the available watersupply is used in the system. Water use efficiency as defmed as below, has beenused as an index of field water utilization efficiency in rice irrigation systems(IRRI 1974).
(ET +SP \WUE = I J J ) *100
\ IRj +ER j
(5)
Where,IREli.
JET.
JSP.
J
depth of diversion water supply during the period in cm.effective rainfall during the irrigation period in cm.evapotranspiration from the paddy field during the period in cm.average seepage and percolation loss during the period, cm.
PertanikaJ. Sci. & Techno!. Vo!. 10 No.2, 2002 213

Rowshon M. K., Kwok C. Y. & Lee T. S.
Relative Water Supply, RWS
Relative water supply proposed by Levin (1982) is the ratio of total water supplyfrom rainfall and irrigation sources to total evapotranspiration need andseepage and percolation losses.
(6)
It is a simple ratio of supply to demand. It is useful for analysis andinterpretation of irrigation system performance for different time intervals,monthly, annual, seasonal or special periods such as land preparation and forthe different locations at system and subsystem levels. RWS is a more practicalindicator than the irrigation system efficiency for rice irrigation practices. Itrepresents the amount utilized for crop production and the amount of waterdelivered to meet crop water demand. Due to this, it gives a clear understandingand planning for the behavior of the major parameters in the irrigationmanagement process to the irrigation managers and farmers.
Cumulative Relative Water Supply, CRWS
It is defined as the accumulated value of the ratio of supply to the demandcomputed over short intervals of time (i.e. daily, weekly or any period) startingfrom a particular time of the season. The RWS helps to identify acute access orshortage while the CRWS gives the integrated value. It is also useful at the endof every season as part of the evaluation of the irrigation process. It is expressedmathematically as follows:
CRWS = IRWS j (7)
Where, }:RWS. is the cumulative value of all the RWS values over short timeJ
duration up to that time.
Water Productivity Index, ~I
The water productivity index measures effectiveness of the irrigation in termsof gross rice yield per volume of water applied. The realistic range of the waterproductivity index should be from 0.30 to 0.60 kg/m3
• Both the increases of riceyield per hectare and water use efficiency are essential to improve WaterProductivity Index. However, yields are not a function of water alone, it alsodepends on soil fertility, climate, pests, diseases and agricultural practices. It isexpressed as:
WPI = _Sp,,-e_c_ifi_l_C_Yi_le_ld_in_k",,-g_/_h_a"7Specific Supply in ha / m 3
Y k / 3qs *1000 g m (8)
214 PertanikaJ. Sci. & Technol. Vol. 10 No.2, 2002

Development of a GIS Based Water Management Tool for a Large Scale Rice Irrigation Scheme
where, Y the specific yield is the yield per ha (kg/ha) for the season in the areaconcerned, and <Is the specific supply is the total supply including rainfall perha for the season in the area concerned, m 3/ha.
GIS User-interface
The design of the GIS user-interface and its application in the Kenan IrrigationScheme are presented below. The desktop mapping software package MapInfofor Windows and MapBasic Programming Language were used for developingthe user-interface tools. The schematic in Fig. 3 illustrates the components andoperation strategies.
_.._ _ ).Start Program ""..........-----lfrom MapBasic Professional
....- _...__._--
Create Menus and Menu Items withinMaplnlo Menu Bar
Hydro-dimatological'--------I Dala
Fig. 3. Schematic diagram illustrates the operation procedureof the user-interface technique
PertanikaJ. Sci. & Techno!. Vol. 10 0.2,2002 215
Rowshon M. K., Kwok C. Y. & Lee T. S.
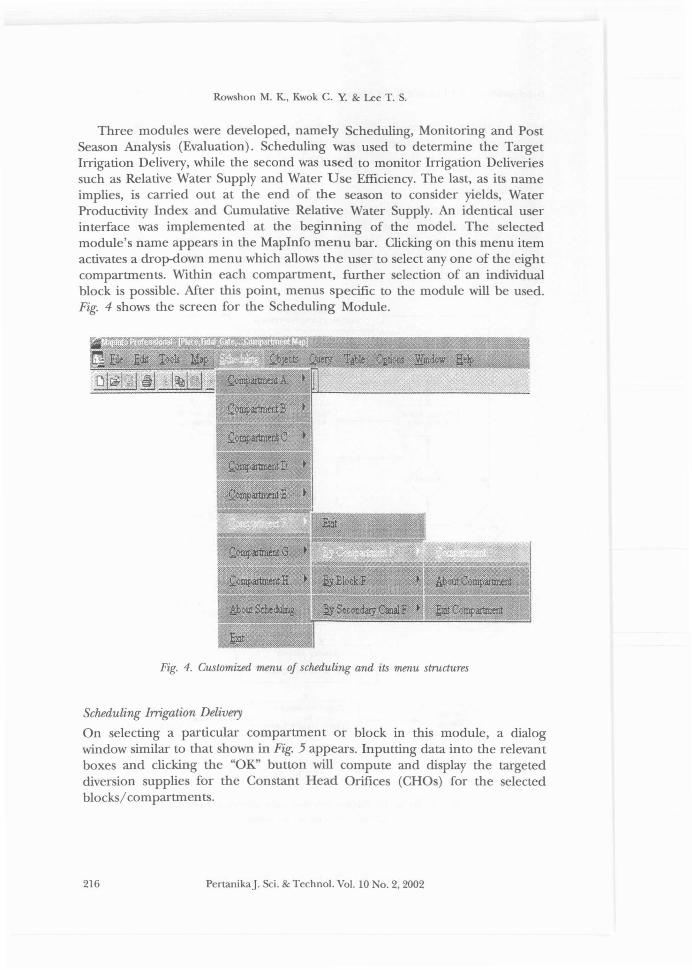
Three modules were developed, namely Scheduling, Monitoring and PostSeason Analysis (Evaluation). Scheduling was used to determine the TargetIrrigation Delivery, while the second was used to monitor Irrigation Deliveriessuch as Relative Water Supply and Water Use Efficiency. The last, as its nameimplies, is carried out at the end of the season to consider yields, WaterProductivity Index and Cumulative Relative Water Supply. An identical userinterface was implemented at the beginning of the model. The selectedmodule's name appears in the MapInfo menu bar. Clicking on this menu itemactivates a drop-down menu which allows the user to select anyone of the eightcompartments. Within each compartment, further selection of an individualblock is possible. Mter this point, menus specific to the module will be used.Fig. 4 shows the screen for the Scheduling Module.
Fig. 4. Customized menu of scheduling and its menu structures
Scheduling Irrigation Delivery
On selecting a particular compartment or block in this module, a dialogwindow similar to that shown in Fig. 5 appears. Inputting data into the relevantboxes and clicking the "OK" button will compute and display the targeteddiversion supplies for the Constant Head Orifices (CHOs) for the selectedblocks/compartments.
216 PertanikaJ. Sci. & Techno\. Vol. 10 No.2, 2002
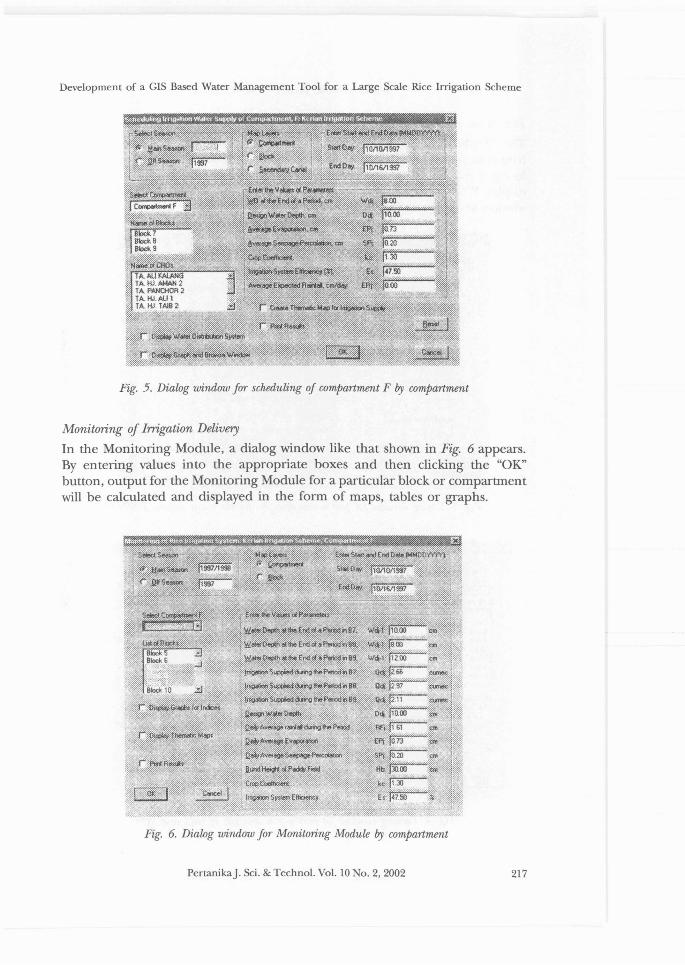
Development of a GIS Based Water Management Tool for a Large Scale Rice Irrigation Scheme
Fig. 5. Dialog window JOT scheduling oj compartment F !Jy compartment
Monitoring of Irrigation Delivery
In the Monitoring Module, a dialog window like that shown in Fig. 6 appears.By entering values into the appropriate boxes and then clicking the "OK"button, output for the Monitoring Module for a particular block or compartmentwill be calculated and displayed in the form of maps, tables or graphs.
Fig. 6. Dialog window JOT Monitoring Module !Jy compartment
PertanikaJ. &i. & Techno!. Vo!. 10 No.2, 2002 217

Rowshon M. K., Kwok C. Y. & Lee T. S.
Post-season Analysis of the Irrigation System
The "Evaluation" module is used to carry out post-season analysis for theirrigation system. On selection of this module a dialog window similar to thatin Fig. 7 appears. The user enters data and selects the indicator to analyse anddisplay. When yield and Water Productivity Index are to be determined a dialogwindow as shown in Fig. 8 appears.
Fig. 7. Dialog window for post-season analysis for the main season, 1997/98
Fig. 8. Dialong window for post-season analysis of yield and HPJ
218 PertanikaJ. Sci. & Technol. Vol. 10 0.2,2002
Development of a GIS Based Water Management Tool for a Large Scale Rice Irrigation Scheme
RESULTS AND DISCUSSIONS
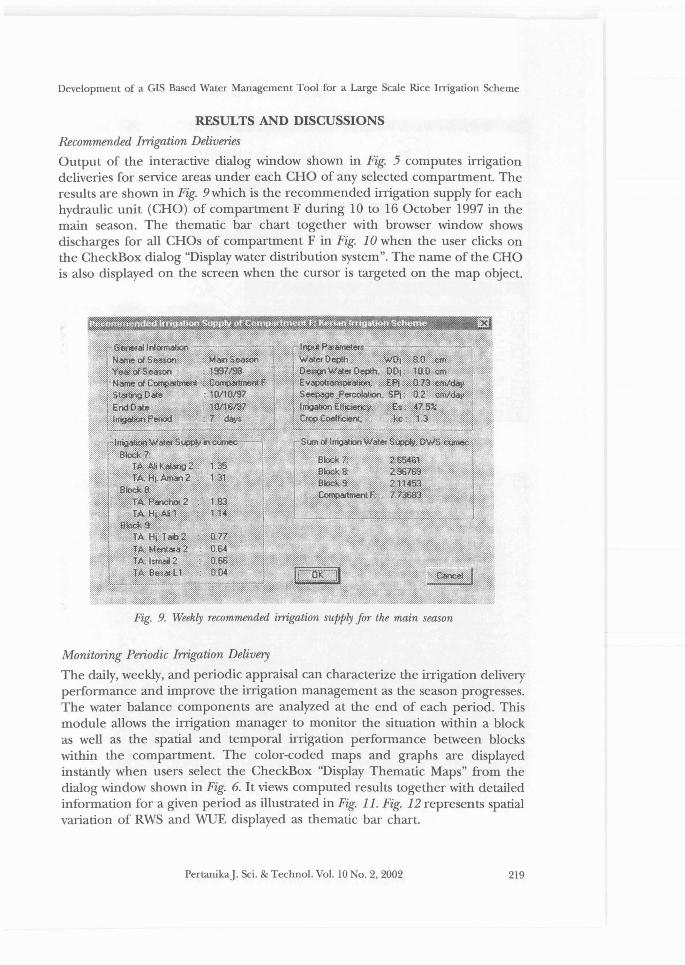
Recommended Irrigation Deliveries
Output of the interactive dialog window shown in Fig. 5 computes irrigationdeliveries for service areas under each CHO of any selected compartment. Theresults are shown in Fig. 9which is the recommended irrigation supply for eachhydraulic unit (CHO) of compartment F during 10 to 16 October 1997 in themain season. The thematic bar chart together with browser window showsdischarges for all CHOs of compartment F in Fig. 10 when the user clicks onthe CheckBox dialog "Display water distribution system". The name of the CHOis also displayed on the screen when the cursor is targeted on the map object.
Fig. 9. Weekly recommended irrigation supply for the main season
Monitoring Periodic Irrigation Delivery
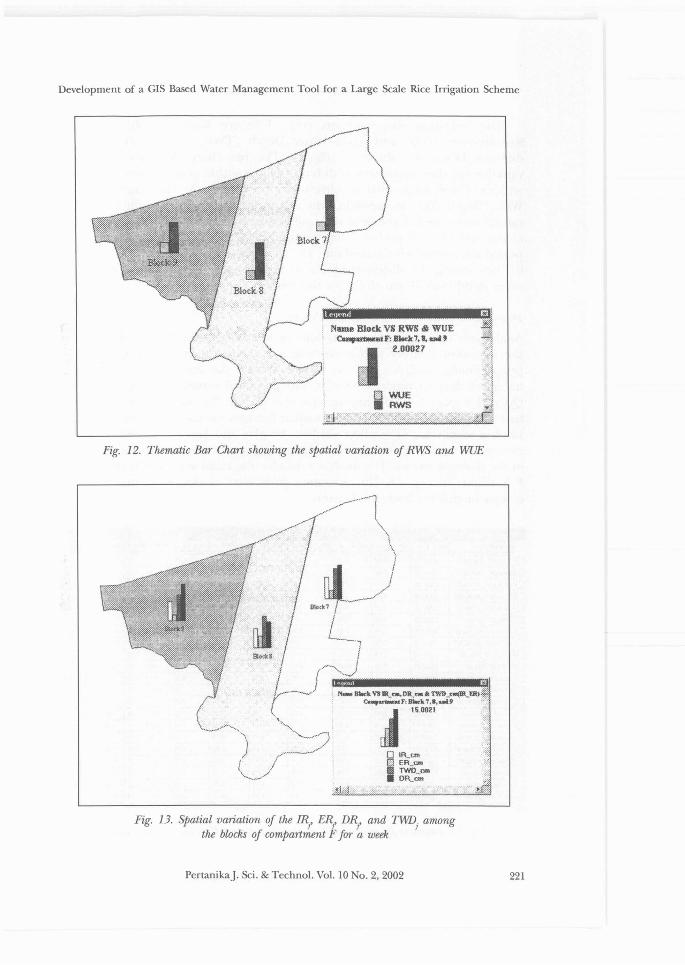
The daily, weekly, and periodic appraisal can characterize the irrigation deliveryperformance and improve the irrigation management as the season progresses.The water balance components are analyzed at the end of each period. Thismodule allows the irrigation manager to monitor the situation within a blockas well as the spatial and temporal irrigation performance between blockswithin the compartment. The color-coded maps and graphs are displayedinstantly when users select the CheckBox "Display Thematic Maps" from thedialog window shown in Fig. 6. It views computed results together with detailedinformation for a given period as illustrated in Fig. 11. Fig. 12 represents spatialvariation of RWS and WUE displayed as thematic bar chart.
PertanikaJ. Sci. & Technol. Vol. 10 No.2, 2002 219

Rowshon M. K., Kwok C. Y. & Lee T. S.
n~!!~!'@'hue~~~~~ .J~~At~.tlO\¥$~""-!I'0 TA. AU KAl.A/>IG 2 4Sl.110 ~.llO 1.34744 .?:0 TA. HoI. MIAN 2 4<18.00 448.00 1.30717.';;
:0 TA. PANCHOR2 628.10 626.10 1.63267 ~'\:0 T".HoI.AU1 3!l9.30 389.00 1.13502 <';;0 TA. HoI. T.Y3 2 265.40 265.00 0.773218"
;0 T". hlENTAAA 2 219.10 219.00 0.638996>
o TA. ISloIAL 2 225.10 225.70 0.656547'
'0 T".B€SARL1 59.60 15.00 O.CM37ll7.;~jy:: ; ;/;.;': ~.~":.:<~::.;~~0~:>:/~,'<~-;/ . ~y:.>':. ~. ,~',?_i-,t .-.I/~;. /, ..'::,>.-,:y-:>":.. ¥ ;:;:;:.
• DWS_~
/' . . /;'·u . ../.,
Fig. 10. Recommended irrigation supply fM Compartment F shoum on a map
Fig. 11. Monitoring Module: Computed results fM compartment F in main season, 1997/98
220 PertanikaJ. Sci. & Techno\. Vol. 10 No.2, 2002
Development of a GIS Based Water Management Tool for a Large Scale Rice Irrigation Scheme
Fig. 12. Thematic Bar Chart showing the spatial variation of RWS and WUE
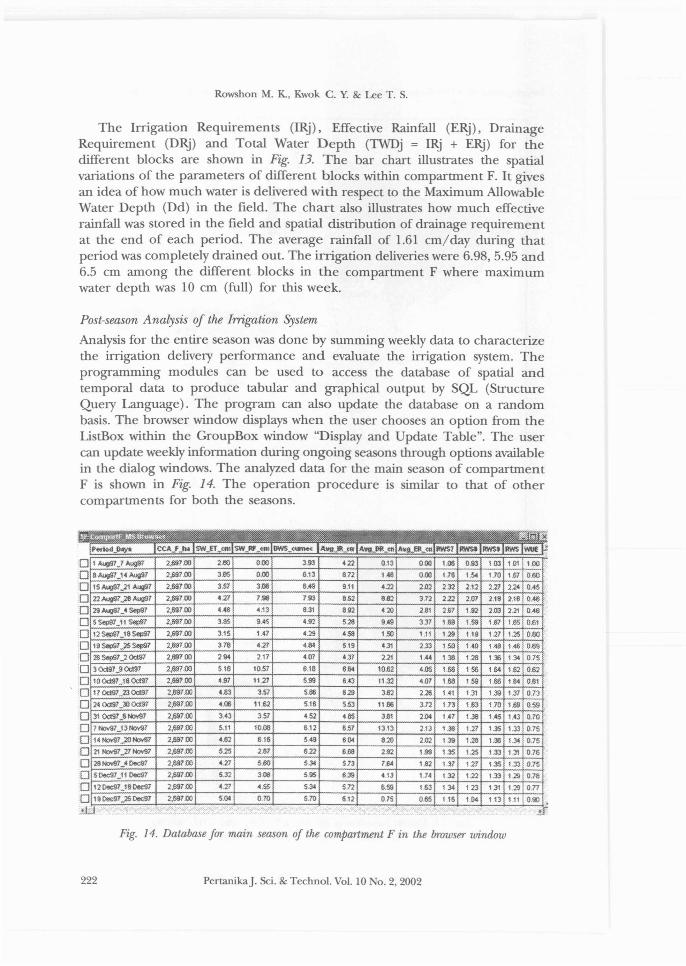
Fig. 13. Spatial variation of the IRfE~ DR
fand TW
jamong
the blocks of compartment F for a week
PertanikaJ. Sci. & Techno\. Vol. 10 No.2, 2002 221
Rowshon M. K., Kwok C. Y. & Lee T. S.
The Irrigation Requirements (IRj), Effective Rainfall (E~j), DrainageRequirement (DRj) and Total Water Depth (TWDj = IRj + ERj) for thedifferent blocks are shown in Fig. 13. The bar chart illustrates the spatialvariations of the parameters of different blocks within compartment F. It givesan idea of how much water is delivered with respect to the Maximum AllowableWater Depth (Dd) in the field. The chart also illustrates how much effectiverainfall was stored in the field and spatial distribution of drainage requirementat the end of each period. The average rainfall of 1.61 cm/day during thatperiod was completely drained out. The irrigation deliveries were 6.98, 5.95 and6.5 cm among the different blocks in the compartment F where maximumwater depth was 10 cm (full) for this week.
Post-season Analysis of the Irrigation System
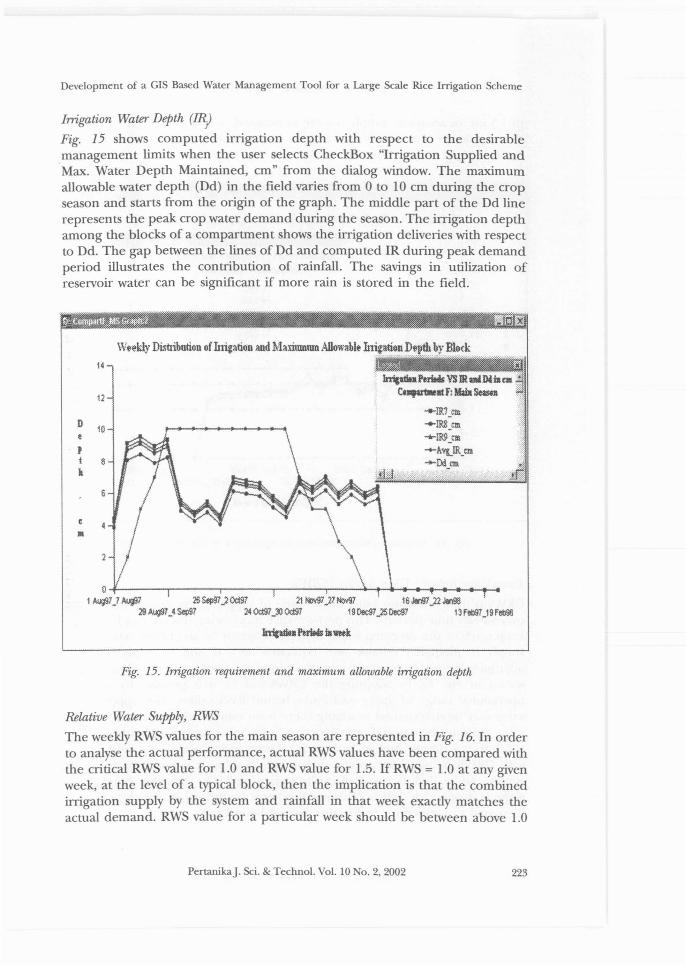
Analysis for the entire season was done by summing weekly data to characterizethe irrigation delivery performance and evaluate the irrigation system. Theprogramming modules can be used to access the database of spatial andtemporal data to produce tabular and graphical output by SQL (StructureQuery Language). The program can also update the database on a randombasis. The browser window displays when the user chooses an option from theListBox within the GroupBox window "Display and Update Table". The usercan update weekly information during ongoing seasons through options availablein the dialog windows. The analyzed data for the main season of compartmentF is shown in Fig. 14. The operation procedure is similar to that of othercompartments for both the seasons.
'''lod_O<IYs CCA)' "" SW~_<m '>W_""_....llWS__
AltD_III_.., AltD_IlP._'n A"lUR..QI 1lWS1 lllIM 1lWS.-I'M.
1 Ali;f31J1wIfl1 2,69H:1J 2.eo 0.00 3.93 '22 0.13 0.00 1.l16 0.93 103 101 100
8 Ali;f31_14/w991 2,69100 3.95 0.00 6.13 8.72 1.48 0.00 U6 1.5<1 1.70 1.61 OBO15 Ali;f31_21 "'-'1197 2.697.00 3$1 3.68 8.4\1 9.11 • .22 2M 232 2.12 U1 2.2' 0.45
22 Ali;f31_28 Ali;f37 2,69700 421 7!J1l 7.93 8~ 8.82 312 222 :t07 2.18 2.16 0.-16 .
29 Ali;f37_4 S«p97 2.69700 HB 4.13 6.31 8.92 420 281 :a1 1.92 2.03 2.21 0..46
5 5..,9"U1 s.¢l7 2,697.00 3.&5 9.45 4.92 5.29 9.4\1 ')37 188 1.Sll 157 1.65 0.61
12~1_'8Sd7 2,697.00 315 1.'7 4.29 4.58 1~ 1.11 129 1.18 1.27 \.25 0.60
19 Sep91.)'5 Sep91 2,691.00 378 4.27 4.84 519 4.31 2.33 ISO 140 1.'13 146 0.(,'11
2ll Sep97..,;l 0dll7 2/!fiP00 294 217 407 4,37 2.21 1.« 136 1.26 136 1.34 075
'3 0<:l87_90,,197 2,697.00 518 1057 6.18 684 10.62 '.05 1.66 156 164 182 0.62
10 OCl8U 6 0ct97 2.687.00 '.87 11.27 5.99 8'3 11.32 '.07 168 169 1.86 184 0.6'1
17 0Cl87,.,23 0Cl81 2,691.00 • .83 3.57 U6 829 3.82 2.26 141 131 1.39 137 0:1'3
2. Od97_30 0ct97 21>91.00 4.08 11.62 516 SS3 11.1l6 3.12 1.73 1.63 1.70 1.69 059
:l1 0<:191_6_7 21>97.00 3,43 3.57 452 485 3.61 2Jl4 1.47 1.38 1.45 lA3 0.70
1_U31«><91 2/!fiP.00 5.11 10.08 612 6.57 1313 2.13 1.38 121 1.35 1.33 0.15
14t«l>197_20t«l>I97 2,69100 4.152 618 5 49 604 8.20 2M 1:J3 1.26 \.311 1.34 0.1521_7_27_' 2.68700 525 287 622 6.68 2.92 1.99 1.35 125 1.33 1.31 07629_7_4Dec91 2fJ9100 421 5.60 5.34 5.13 1.84 1.82 137 1.27 1.35 1.33 0.75
5 Dec9U1 DoeIl7 2,68700 5.32 308 595 6.39 413 1.7' 132 122 133 1.22 o.n12 DoeIl7_,8 DoeIl7 2.69100 4.27 4.55 5.34 5.n 6.59 1.63 134 123 1.31 1.~ o.n19 DocIl7;15 DoeIl7 2.697.00 5.04 0.70 5.70 6.12 0.75 0.55 115 lJl4 113 1.11 0.00
'. ··c· •
ooooooooooooooooooooo.tLl
Fig. 14. Database for main season of the compartment F in the Irrowser window
222 PertanikaJ. Sci. & Techno!. Vol. 10 0.2, 2002
Development of a GIS Based Water Management Tool for a Large Scale Rice Irrigation Scheme
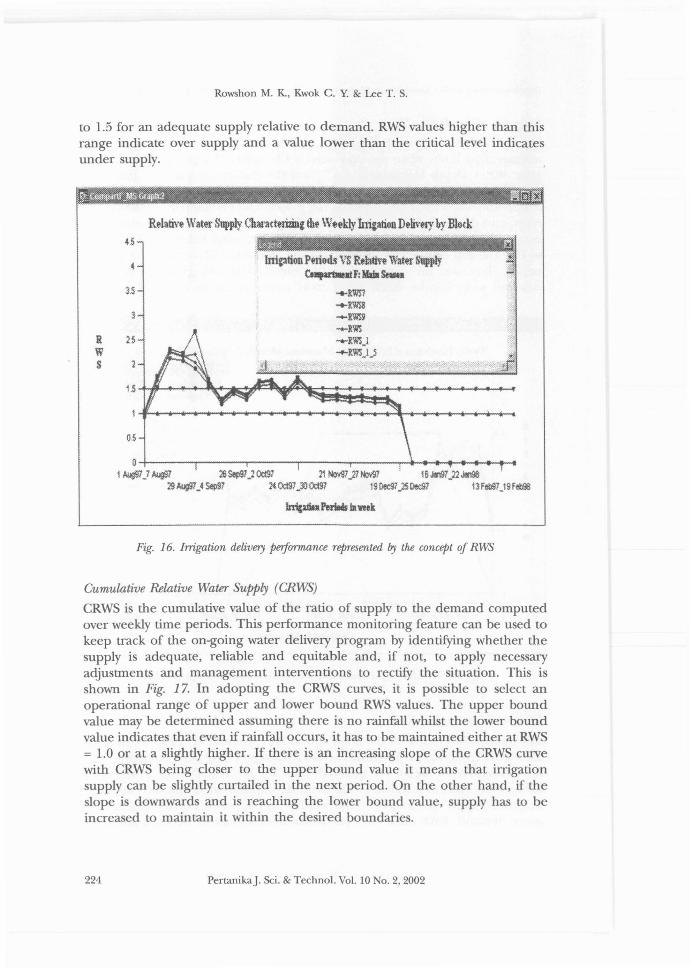
Irrigation Water Depth (IR)
Fig. 15 shows computed lrngation depth with respect to the desirablemanagement limits when the user selects CheckBox "Irrigation Supplied andMax. Water Depth Maintained, cm" from the dialog window. The maximumallowable water depth (Dd) in the field varies from 0 to 10 cm during the cropseason and starts from the origin of the graph. The middle part of the Dd linerepresents the peak crop water demand during the season. The irrigation depthamong the blocks of a compartment shows the irrigation deliveries with respectto Dd. The gap between the lines of Dd and computed IR during peak demandperiod illustrates the contribution of rainfall. The savings in utilization ofreservoir water can be significant if more rain is stored in the field.
Wtwkly Distribution of Irrigation and Maritmmm AUowabie L:ription ~,e~th by Block14
IrrIpInP.rWs VS IR lIIIIlD4ia~ ;
12 C..,.-III F: MalaSeuo
"'lR1_CInD 10 "'1R8.tme .....lR9_ellIp ....Avl.lR_Q11t 6 ......D(Q11 .iII if:
C
III
O-f----,..----....---...,-----,---+--t------lt-4.......-_.....1~7J~7 26 5ep97) 0d97 21 No-i97)7~7 16 Jtn97)2 JlW198
29~7_.Sep91 24 Od97JOOd97 19 Dec91_25Dee97 13f~7J9fellOO
~ltItu I'erINs iawek
Fig. 15. Irrigation requirement and maximum allowable irrigation depth
Relative Water Supply, RWS
The weekly RWS values for the main season are represented in Fig. 16. In orderto analyse the actual performance, actual RWS values have been compared withthe critical RWS value for 1.0 and RWS value for 1.5. If RWS = 1.0 at any givenweek, at the level of a typical block, then the implication is that the combinedirrigation supply by the system and rainfall in that week exactly matches theactual demand. RWS value for a particular week should be between above 1.0
PertanikaJ. Sci. & Technol. Vol. 10 o. 2, 2002 223
Rowshon M. K., Kwok C. Y. & Lee T. S.
to 1.5 for an adequate supply relative to demand. RWS values higher than thisrange indicate over supply and a value lower than the critical level indicatesunder supply.
RWS
45
3.5
3
2S
os
lnif!ltion Period., VS Relatin WaM Supply~r:MalIs..1
...RWS1
......RWS8-RWS9.....llWS......awsJ......lWS)J
o+---r---r---,-----r-----,--+-....-;......-..---....,--«1~}AI:Ij!l 26 $ep9TJ 0Ct97 21 Nov97_27 ti:rv91 16 Jen97_22 JI\9S
29 AI:Ij!lJ Stp97 24 0cl97_llOd97 19Dec97)SDec97 13Feb97J9feb98
IrricallalPerWs IIlwek
Fig. 16. Irrigation delivery performance refrresented lJy the concept of R\v.S
Cumulative Relative Water Supply (CRWS)
CRWS is the cumulative value of the ratio of supply to the demand computedover weekly time periods. This performance monitoring feature can be used tokeep track of the on-going water delivery program by identifying whether thesupply is adequate, reliable and equitable and, if not, to apply necessaryadjustments and management interventions to rectify the situation. This isshown in Fig. 17. In adopting the CRWS curves, it is possible to select anoperational range of upper and lower bound RWS values. The upper boundvalue may be determined assuming there is no rainfall whilst the lower boundvalue indicates that even if rainfall occurs, it has to be maintained either at RWS= 1.0 or at a slightly higher. If there is an increasing slope of the CRWS curvewith CRWS being closer to the upper bound value it means that irrigationsupply can be slightly curtailed in the next period. On the other hand, if theslope is downwards and is reaching the lower bound value, supply has to beincreased to maintain it within the desired boundaries.
224 PertanikaJ. Sci. & Techno!. Vol. 10 No.2, 2002

Development of a GIS Based Water Management Tool for a Large Scale Rice Irrigation Scheme
.~.l'erWJ\IS ClIIn1adIIt awsJc.lIIfU'lIMt1ltF: MIla s-.. .
....atWS7-+-Ol.WS8-+-Ol.WS9-+-CRWS.....awU-+-Ol.WS..U-+-Ol.WS;l
7Q
6S
60
55
50
(S
C 40R 35WS 30
25
20
15
10
5
O-F~--r----r---""-----'---""""---""'---"""""T-1~7 ] ~ 2S~;l Od97 21 No'4I..Z1 Noo<97 16 JWQ1_22 JIrlJll
29~1..4seps7 24 0d91..300d97 19Dec97.)5Dec91 13febll1..19fel:l9ll
lnicalllo.P.rw.!II ....k
Fig. 17. Irrigation delivery perfurmance represented by the concept oj CRWS
Water Productivity Index (ltVPl)
The Water Productivity Index provides a measure of the irrigation system'seffectiveness in terms of gross grain yield. The values of WPI ranged from 0.07to 0.19 kg/m3 in the main season and 0.10 to 0.31 kg/m3 in the off..seasonrespectively. The average values for the main season and off-season were foundto be 0.13 and 0.22 kg/m3 respectively. Results indicate that blocks 3 and 21were the most productive in the main season 1997/98 and block 15 in the offseason 1997. The overall WPI for the Kerian Irrigation Scheme was only 0.17kg/m3• This is below the desirable targets of 0.30 to 0.60 kg/m3• The twofactors, which directly affect the WPI are specific supply (m3/ha) and specificyield (kg/ha). The specific supply can be reduced by curtailing irrigationdeliveries during the rainy days. With the effective use of irrigation and rainfall,better yield targets for water productivity from 0.30 to 0.60 kg/m3 can be withinreach.
CONCLUSION
The development of sustainable rice farming depends on the urgent necessityof achieving sustainable management of water resources. Improved managementof water allocation systems, monitoring techniques and post..season analysis inthe existing irrigation scheme using advanced technology such as GeographicalInformation System (GIS) can greatly help to achieve efficient water management
PertanikaJ. Sci. & Techno!. Vol. 10 o. 2, 2002 225

Rowshon M. K.. Kwok C. Y. & Lee T. S.
_~i..··r··!· i_lllliI!" i1i11_ilCutparisitllofWPI(kcIBI3)itrMaiJt ....O1fSe...IIy Bl8ck]
KeriaIrricatila Sc:lleJlle, 1991198 <
~ 0.-
Il MS_WPU'c..,per_a3• OS_WPI_kc...rer_a3
Fig. 18. Seasonal WPI l7y the thmwtic bar chart on the block layer
and targeted rice production. GIS interface is suitable as its features allow it toprocess and analyze a vast amount of spatially distributed information. Thisstudy would be useful for improving the irrigation system management whencombined with actual feedback from the field.
ACKNOWLEDGEMENTS
The authors are indebted to the Ministry of Science, Technology andEnvironment, Government of Malaysia for funding this work through an IRPAGrant (Project No. 01-02-04-131), and to the Department of Irrigation andDrainage, Ministry of Agriculture, Malaysia for their assistance in data collection.
REFERENCES
ANON. 1998. JlCA and DID Report. The study on modernization of irrigation watermanagement system in the granary areas of Peninsular Malaysia. Nippon Koei Co.,Ltd.
BRADLEY, R L. 1993. Geographical information systems for agricultural decision support.Agric. Eng. 48: 102-105.
226 PertanikaJ. &i. & Techno\. Vol. 10 No.2, 2002
Development of a GIS Based Water Management Tool for a Large Scale Rice Irrigation Scheme
FRANCOIS, M. and K. PONGPUT. 1997. NAGA- A GIS based software for the monitoring anddiagnosis of irrigation projects. Special Issue on RS and GIS, Information Techniquesfor Irrigation Systems (ITIS). International Irrigation Management Institute (IIMI) ,4(1): 23-25. Colombo, Sri Lanka.
GooDCHILD, M. F. 1993. The state of GIS for environmental problem-solving. InEnvironmental Modeling with GIS ed. Goodchild, M. F., Parks, B. O. and Steyaert, L.T. p. 8-15. Oxford University Press.
IRRI (International Rice Research Institute). 1977. Annual Report for 1974. Los Banos,Philippines.
LEVINE, G. 1982. Relative water supply: An explanatory variable for irrigation systems,Technical report no. 6, Cornell University, ew York.
MORRIS, K. A. 1993. Evaluation of selected performance indicators at Kerian IrrigationScheme, Perak, Malaysia. MS Dissertation, University of Newcastle Upon Tyne, UK.
NlHAL F. 1992. Monitoring irrigation water delivery performance: The concept ofCumulative Relative Water Supply (CRWS). p. 525-534. In Proceedings ofan InternationalConference on Advances in Planning, Design, and Management of Irrigation Systems asrelated to Sustainable Land Use, Organized by the CIE of the Katholieke UniversiteitLeuven in cooperation with the ECOWARM, Leuven, Belgium.
SALMAN, A, Y. CHEMIN and A SAMlA. 1997. Using GIS and RS to monitor and evaluateirrigation and drainage projects: Example from IIMI Pakistan National Program.Special Issue on RS and GIS, Information Techniques for Irrigation Systems (ITIS),International Irrigation management Institute (IIMI). 4(1): 19-20. Colombo, Sri Lanka.
TEOH, B. P. 1995. Assessment of selected performance indicators for paddy irrigationschemes. p. 125. Department of Drainage and Irrigation, Perak DaruI Ridzuan.
TEOH, B. P. and T. D. NcoH. 1997. Drainage problems in Kerian irrigation scheme. InProceedings of 7th ICID International Drainage Workshop, vol. 3. Penang, Malaysia.p. MI4-1 to MI5-15.
Wl'SEURE, G. C. Land J. W. GoWING. 1992. Field studies in Malaysia: A joint program byUniversiti Pertanian Malaysia and University Newcastle Upon Tyne. Pages. In AnInternational Proceedings on Advances in Planning, Design, and Management of IrrigationSystems as Related to Sustainable Land Use, Leuven, Belgium, 14-17 September 1992.Organized by the CIE ofthe Katholieke Universiteit Leuven in cooperation with theECOWARM.
Wl'SEURE, G. C. L., KWOK CHEE YAN, J. W. GoWING and A A. ZAKARlA. 1994. Performanceevaluation of paddy irrigation: A case study at Kerian Irrigation Scheme, Malaysia.p. 17-20. Institution of Agricultural Engineers, Winter.
PertanikaJ. Sci. & Techno!. Vo!. 10 No.2, 2002 227