united states assessing and evaluating recreational uses
TRANSCRIPT
United StatesDepartment ofAgriculture
Forest Service
Pacific NorthwestResearch Station
General TechnicalReportPNW-GTR-536September 2002
Assessing and EvaluatingRecreational Uses of WaterResources: Implications for anIntegrated Management FrameworkChristina Kakoyannis and George H. Stankey

Christina Kakoyannis is a Ph.D. candidate, Department of Forest Resources, OregonState University, Corvallis, OR 97331; George H. Stankey is a research social scientist,U.S. Department of Agriculture, Forest Service, Pacific Northwest Research Station,Forestry Sciences Laboratory, 3200 SW. Jefferson Way, Corvallis, OR 97331. Finalreport on cooperative agreement PNW-753-0880-228 between U.S. Department ofAgriculture, Forest Service and Oregon State University.
Cover photo courtesy of Bo Shelby.
Authors

Abstract Kakoyannis, Christina; Stankey, George H. 2002. Assessing and evaluating recreationaluses of water resources: implications for an integrated management framework. Gen.Tech. Rep. PNW-GTR-536. Portland, OR: U.S. Department of Agriculture, ForestService, Pacific Northwest Research Station. 59 p.
To resolve conflicts over water, we need an understanding of human uses and values forwater. In this study, we explore how water-based recreation affects and is affected bythe water regime and water management and how key social trends might influence futurewater-based recreation. We found that although water is a critical component of manyrecreational experiences, our failure to understand current and anticipated water-basedrecreation use trends hampers our ability to effectively manage for recreation. Furthermore,we examined certain key drivers of social change, including population growth andmigration, that will likely alter future recreation trends in the Pacific Northwest.
We identified changes to the water resource, such as altered flow regimes, that haveimportant consequences for the availability and quality of recreation opportunities. Althoughthere are a variety of conflicts among recreationists and between recreation and otheruses of water, we have a limited understanding of how to resolve them. Effective manage-ment will require examining the links between recreational opportunities and watermanagement to minimize negative impacts to both recreation and the water regime.
Keywords: Recreation, water management, demographics.

Summary An understanding of human uses and values for water is necessary to resolve conflictsconcerning water. The purpose of this synthesis is to explore the impact of water-basedrecreation on the water regime and the reciprocal impact of water management on water-based recreational experiences. Because recreation use occurs within a social contextwith which management has to contend, we also examined how key drivers of socialchange will influence future trends in recreation and water management.
Water is an important component of recreational opportunities and experiences. In additionto being an essential medium for conducting water-based activities, proximity to wateralso enhances the experiences of many recreational activities (e.g., hiking) not strictlydependent on the water resource. Consequently, there may be no simple substitute forwater in many recreational activities.
Our ability to manage natural resources effectively for recreation is hampered by a lackof understanding of basic recreation use trends. Current recreation data, supported byanecdotal information, would suggest that water-based recreation is increasing; however,because of methodological limitations, coupled with incomplete, and sometimes non-existent data records, our ability to specifically characterize this growth—its magnitude,nature, location, and timing—is often problematic. The inability to describe recreationuse in accurate basic terms raises troubling questions as to how managers can managerecreational opportunities effectively.
Our examination of key drivers of social change revealed trends that will play a role inwater-based recreation patterns in the Pacific Northwest. Population growth, migrationshifts, population aging, increasing diversity, technological advances, and shifts in leisuretime will impact long-term recreation use trends. An awareness of the direction of thesetrends is necessary for anticipating shifting recreation demands. Population growth in theUnited States suggests that future recreation demand will rise. Current shifts in migrationof residents to rural, amenity-rich locations, particularly in the South and the West, suggestthat demands for recreation will increase in these locations. Perhaps more significantly,it also suggests that, as people relocate near public lands, greater public scrutiny will beplaced on federal land management around the urban-forest interface.
Other key social trends might have a dampening influence on water-based recreation,particularly in wildland settings. The increasing proportion of U.S. residents over 65years of age suggests that the demand for outdoor recreational activities, particularlythose that are physically demanding, likely will decline. The increasing racial and ethnicdiversity of the United States also suggests that the popularity of certain water-basedrecreational activities might change over time, with more people participating in urban-based recreational activities rather than wildland activities. Perceptions of declines inleisure time might reduce participation in wildland activities requiring extensive traveling,which will create greater demand for recreation near residential communities.
Technological advances will have a complex and unclear role in water-based recreationtrends. Although advances in technology have the potential to increase recreationpressure and site degradation as people gain easier access into wildland settings,technology also can increase efficiency of recreational equipment, thereby reducingimpacts (e.g., pollution) on the water regime. The complexity of the effects associatedwith these various drivers of change will confound attempts to accurately predict their

overall impact on recreation trends. Perhaps the only certainty is that resource managerswill have to contend with recreation issues in an era of rapid social and technologicalchange.
Through our examination of water-based recreation, we found that recreation typicallyimpacts the water regime on a much smaller scale than other uses (e.g., irrigation) andthat these impacts are usually localized, both spatially and temporally. Management ofthe water regime for various uses impacts water-based recreation. For example, changesto flow regimes can substantially impact water-based recreation by influencing thesafety of the recreational experience and perceptions of crowding, scenic beauty, orrecreational quality. Although conflicts over competing uses of water (including conflictsamong recreationists) are expected to grow, we lack an understanding of how to integraterecreation with other water uses. The need to manage in these complex and contentioussettings places a particular premium on the availability of integrated planning and manage-ment frameworks that facilitate an examination of alternatives, implications, and conse-quences across different resource sectors and over both space and time. Without the kindof understanding such frameworks provide, we will have difficulty managing for diverse,competing uses of water without displacing recreationists to other locations, which cansubsequently lead to unintended consequences elsewhere.
Recreation and water are often inextricably linked. Changes to the water regime will haveimportant consequences for recreation opportunities and experiences. Effective man-agement depends on anticipating future trends and preparing for potential difficulties tominimize negative impacts on recreation or on the water regime.

Contents 1 Introduction
2 Proposition 1
3 Proposition 2
7 Proposition 3
8 Population Growth
9 Regional Migration
10 Urban to Rural Migration
14 Proposition 4
14 Age
15 Increasing Racial and Ethnic Diversity
18 The Combined Influence of Demographic Variables
19 Proposition 5
19 Technology
20 The Influence of Leisure Time
22 Proposition 6
23 Boating
24 Camping and Hiking
26 Swimming
27 Proposition 7
29 Recreation Versus Other Uses of Water
30 Interactivity Conflicts

31 Intra-Activity Conflicts
31 Recreation Substitutability
33 Management Implications
35 Proposition 8
35 The Impact of Flow on Recreation
38 Implications for Research and Management
39 Integrating Recreation and Water Resource Management
39 Premises and Challenges to Integrated Resource Management
41 Developing an Integrated Framework for Management of the Water Regime
42 Key Attributes of a Framework
46 Conclusions
47 Acknowledgments
47 Metric Equivalents
48 Literature Cited

This page has been left blank intentionally.Document continues on next page.

Introduction
1
This work arises out of the Sustainable Water Research Initiative of the USDA ForestService, Pacific Northwest Research Station. The Sustainable Water Initiative recognizesthat water is a key link within, as well as among, biophysical and socioeconomic systems.Changes in either system often are transmitted to the other via water; i.e., changes inthe magnitude, quality, frequency, duration, timing, or rate of water production, inducedeither by natural changes (e.g., floods) or through socioeconomic changes (e.g., industrial-ization). Such processes are often quickly and dramatically evidenced in changes insystems, sectors, or locations. Often, such processes are unanticipated, inadvertent, orignored until it is too late.
One of the four major themes of the Sustainable Water Research Initiative is to “recognizethe competing demands, uses, and management opportunities to resolve conflict overwater.” The development of a strategy that can balance these competing demands requiresthat we better understand human values for water. The range of social values of naturalresources is diverse and includes commodity, amenity, environmental quality, ecological,spiritual, and public use values, such as subsistence, tourism, and recreation (Stankeyand Clark 1992). The Forest Service 2000 Recreation Agenda (USDA Forest Service2000) notes that recreation is the fastest growing use on national forests and grasslands.
Water has long played a significant role in the types, patterns, and levels of recreationuse in many areas. Studies of past recreation use patterns, as well as projected trendsin recreation use, indicate a continuing close link between water resources and thishuman behavior. For this reason, we specifically examine recreation as a proxy for othersocial values of water and uses of water. Thus, this project focuses on a systematicsynthesis of the literature on the interactions between water (excluding snow and ice)and outdoor recreation, a significant socioeconomic subsystem. Although the extent andrate of changes in the biophysical system (e.g., global warming, species extinction)remain in dispute, there is much more certainty and consistency in projections ofsocioeconomic changes (e.g., population growth, technological trends). Because thesesocioeconomic changes will be profound (Rayner and Malone 1998), it is critical that weexamine the impact they will have on water resources in the future. The purpose of thisstudy is to examine the reciprocal effects of recreation on the water resource and themanagement of the water resource on water-based recreation. There are three mainobjectives in this report:
1. Describe national and regional trends in water-based recreation and how populationgrowth and demographic components of population change might influence futurerecreation trends (propositions 1-5).
2. Examine the effect of water-based recreation on the water regime including theimpact on water quality, quantity, and flow (proposition 6).
3. Examine the effect that water management can have on water-based recreationalexperiences (propositions 7-8).
This report is organized around eight propositions; each summarizes what we knowabout a particular topic, question, or issue. Propositions are tentative statementsreflecting a conclusion; we recognize that their validity and applicability are arguable andsubject to validation and testing. However, they are primarily intended to facilitatediscussion and analysis. They derive from an assessment of both the research literatureand management experience and, where relevant, describe knowledge gaps surroundingthese topics.

2
The presence of water surfaces is essential to or enhances the satisfaction of recreation-ists engaged in most outdoor recreation activities.
The presence of water contributes to many recreational opportunities, including bothwater-dependent and water-enhanced recreational activities. Water-dependent activities arethose in which water is essential to conducting the activity such as fishing, boating, water-skiing, swimming, kayaking, rafting, canoeing, sailing, and most waterfowl hunting. Water-enhanced recreational activities are those in which water is not required in order toparticipate in the activity, but in which it greatly contributes to the recreationist’s overallexperience. These activities include, but are not limited to, hiking and camping alongbodies of water, viewing scenery, and studying nature. These categories are rarely distinct,even within a specific recreational activity. Depending on the species sought (e.g.,waterfowl, pheasants, or deer), hunters may or may not require access to water. Inaddition, campers who are traveling long distances and are unable to carry sufficientwater will require water sources periodically. Furthermore, recreationists seldom fallsolely into one category, but instead often conduct several activities during a visit to arecreation site. For example, boating also allows people to participate in other water-based recreational activities such as water-skiing, waterfowl hunting, and fishing.
Both water-dependent and water-enhanced recreational opportunities can be influencedby the management of the water regime, either positively or negatively, inadvertently orpurposefully. Recreationists participating in water-enhanced activities may be as affectedby changes in the water resource as participants in water-based activities. Furthermore,they may find it equally as difficult to locate adequate substitutes if their traditional, water-oriented sites are no longer available. To effectively manage the water resource for thevarious uses of water, including recreation, we must understand how recreationists useand value water in their outdoor experiences. Studies of visitor attitudes and prefer-ences indicate that water is a fundamental component of many forms of recreation onpublic lands and can contribute to recreationists’ satisfaction with a site (Rollins andChambers 1990). Studies of campground users consistently have found that access towater is one of the most important characteristics that recreationists look for in acampsite (Bumgardner et al. 1988, Clark et al. 1984, Lime 1971, Lucas 1970, Moore etal. 1990).
Water is often rated by recreationists as the most important attribute of their chosensetting, and the amount of land/water edge and surface water are positively related toincreased scenic value of the area (Zube et al. 1975). In a survey of visitors to theAravaipa Canyon Wilderness in Arizona, for instance, (Moore et al. 1990), respondentsranked 13 characteristics of the Canyon in order of importance; water was the mostfrequently mentioned item. In a study developing a typology of site attributes desired forcamping, Brunson and Shelby (1990) noted that one of the three most important attributesneeded to provide a minimum-level quality camping experience was proximity to water.
Water is important not only as an essential component of water-dependent recreationalactivities but also as an “aesthetic backdrop for nonwater oriented activities” (Field andMartinson 1986). In a study to examine how people make choices about recreation sites,Vining and Fishwick (1991) allowed 10 subjects to verbalize their thought processes asthey chose between 45 pairs of outdoor recreation sites. The authors noted that mostsubjects used the presence and absence of water in their evaluation. They discovered
Proposition 1
3
that water was considered more important than simply serving as a “medium” forconducting an activity. Instead, attributes of water (such as miles of shoreline) wereassociated with contributing to the peaceful or secluded atmosphere of a site that wasimportant to the subject. Thus, not only is water essential to many water-basedrecreational opportunities, studies indicate that symbolic aspects of water, such as itscalming and relaxing effect on individuals, is also important to the quality of outdoorrecreation activities.
Flawed and inconsistent methods limit accurate recreation use data; however, availabledata suggest that participation levels in water-dependent activities continue to increasealthough rates of participation are slowing.
Information on recreation participation levels is important for effective management ofnatural resources for recreation. For example, knowledge of recreation trends can helpmanagers direct monetary resources or personnel most appropriately. However, obtainingaccurate recreation use data is difficult, particularly for dispersed recreational activities.
One of the principal limitations of recreation use data stems from the lack of cost-effective, valid sampling methods. Consequently, although many research studies havecollected recreation data, our ability to compare across these different studies is limited.Currently, recreation data are not consistent enough to compare information from oneyear to the next (Loomis 2000). For example, depending on the survey, questionsreferring to boating can include sailing, canoeing, kayaking, rowing, floating, rafting,motorboating, water-skiing, or jet-skiing. Without a clear understanding of how recreationcategories have been compiled, it is not possible to accurately compare recreation useacross different survey instruments, areas, or time. Perhaps even more problematic isthe lack of continuity in the questions asked on recreation surveys. The tendency toalter survey instruments by dropping or rephrasing particular recreation use questions insubsequent versions of the questionnaire effectively eliminates the possibility ofcomparing recreation use trends over time.
The difficulties of comparison across studies is compounded by the use of two differentmeasurements of recreation units, visits and visitor days, each of which measures adifferent aspect of recreation intensity. Recreation use data are further confounded bythe fact that participation is always a function of supply; participation rates in selectedactivities are influenced by availability and access to the activity, not solely by demandfor participating in the activity (Manning 1999). As a result, activities that are widelyabundant are reflected in high participation rates, whereas more preferred, but not easilyaccessible, activities reflect low participation rates.
In summary, the accuracy of recreation data is generally uncertain as are the methodsused to obtain recreation use figures. This is and has been a fundamental, recurringproblem in recreation management. Furthermore, in many instances, recreation data arenot available. As a component of this report, a case study on one county in the PacificNorthwest was planned. It was envisioned that the case study would provide anopportunity to examine the impacts that demographic changes (e.g., population growth,migration patterns) have on water-based recreation in a specific county. However, the
Proposition 2

4
analysis of the case study was contingent on having some fundamental base of recreationuse information. These data were lacking however, and so the case study analysis wasabandoned. The possibility or even the likelihood of inaccurate or nonexistent data fromone county alone raises serious questions as to how managers can determine how toappropriately allocate limited resources, both staff and time, for the entire NationalForest System.
However, despite the caveats associated with recreation use data, some general recreationtrends can be explored. In the 1970s and 1980s, many studies identified trends in water-based or water-enhanced recreation. Snepenger and Ditton (1985) used data from anational survey of hunting and fishing taken every 5 years to determine general trends inthese activities. They noted that while participation in hunting [as a percentage of U.S.population] had declined from 1955 to 1980, participation in fishing had increased overthe same period. In addition, they found that increasing numbers of anglers and hunterslived west of the Mississippi, in part reflecting the general westward migration trendacross the United States. Warnick and Vander Stoep (1990) studied water-based trendsby geographic region from 1979 to 1989 and found that national participation rates forthree water-based activities (sailing, power boating, and water-skiing) had graduallydeclined over the 9-year period. In contrast, in the early 1980s, Hof and Kaiser (1983)predicted that participation in outdoor recreation would increase, with snow and ice-based recreation showing the highest rates of increase, followed by water-basedrecreational activities, and lastly, land-based recreational activities.
Recreation use data are obtained from descriptive national surveys including the NationalSurvey on Recreation and the Environment, which is conducted every 5 years (Cordellet al. 1997), and the annual national survey administered for the Recreation Roundtable(Recreation Roundtable 2000). Until peer-reviewed studies analyze the sensitivity andthe accuracy of these data in more detail, these surveys provide the best overview,albeit primarily a descriptive overview, of the major national trends in recreation. Theserecent surveys reveal that water remains an important aspect of recreation for NorthAmericans. When respondents were asked about their outdoor recreation participation in1995, water-based activities such as swimming, boating, and fishing were three of themost frequently mentioned outdoor recreation activities (table 1). A comparison of thesethree most popular water-based activities from 1982-83 to 1994-95 showed that thepercentage of people boating and swimming increased over this period, while thepercentage of people fishing decreased—although participation in sheer numbers remainedhigh (table 2). Other findings also reveal that boating is one of the most widely conductedoutdoor recreational activities in the United States. The National Marine ManufacturersAssociation (1997) estimates that 78 million people participated in recreational boatingin 1997. Industry estimates of recreational boats sold show that the number of boatsowned has grown steadily except for a short decline in the mid-1990s, with an estimated13.2 million outboard motor boats owned in 1997. A more recent national survey in 1999again identified swimming, fishing, and boating as the three most popular water-basedactivities, with swimming and fishing being within the five most popular outdoorrecreation activities overall (Recreation Roundtable 2000).

5
Table 1—Participation in outdoor recreational activities as a percentage of the totalpopulation of the United Statesa
Activity Percent Activity Percent
Swimming (nonpool) 39.0 Floating, rafting 7.6Boating (any) 30.0 Canoeing 6.6Fishing (any) 29.1 Sailing 4.8Studying nature near water 27.6 Personal watercraft riding 4.7Camping (any) 26.8 Rowing 4.2Freshwater fishing 24.4 Migratory bird hunting 2.1Motorboating 23.4 Windsurfing 1.1Saltwater fishing 9.5 Kayaking 0.7Water-skiing 8.9
a The percentage of people 16 and older who participated in the activity at least once in the past 12 months.Source: USDI and USDC 1996.
A focus on national trends can obscure differences among the various regions of thecountry; as a result, some studies have analyzed recreation use data at smaller scales.In a study that examined water-based recreation use trends from 1979 to 1987 amongfour regions of the United States, Warnick and Vander Stoep (1990) found that participationin swimming was evenly distributed across the country, whereas participation in water-skiing and motorboating was more prevalent in the Midwest and the South. However,their method of grouping a large number of diverse states (e.g., North Dakota and Kansasmake up part of the “Midwest”; all states from Washington to Arizona compose the “West”)makes it difficult to examine regional differences most relevant for Forest Serviceresearch stations.
To better understand the complex issues relating to to recreation and water in the PacificNorthwest,1 we examined region-specific water-based recreation use trends. The PacificNorthwest is an area abundant in public lands available for water-based recreation. Alaskacontains over 3,660 miles of rivers designated as National Wild and Scenic Rivers or asState Recreation Rivers, Oregon has 1,692 miles, and Washington has 177 (Zinser1995).
1 In this report, the “Pacific Northwest” refers to Alaska,Oregon, and Washington.
Table 2—Percentage of change in boating, nonpool swimming, and fishing partici-pation from 1983 to 1995
Activity Number in 1982-1983 Number in 1994-1995 Percent change
- - - - - - - - - - - Millions - - - - - - - -Boating: 49.5 58.1 +25.0
Sailing 10.6 9.6 -9.4Motorboating 33.6 47.0 +39.9Water-skiing 15.9 17.9 +12.6
Swimming/nonpool 56.5 78.1 +38.2Fishing 60.1 57.8 -3.8
Source: Cordell and others 1997.

6
At the state level, Statewide Comprehensive Outdoor Recreation Plans (SCORP) oftencontain recreation participation information for water-based activities. Each state’sSCORP, however, is administered separately and often cannot be compared acrossstates. Oregon’s SCORP (Oregon Parks and Recreation Department 1994) found thatwater-based recreational activities ranked high in terms of recreation participation inOregon. The second and third most frequently conducted activities out of 19 dispersedrecreational activities presented to respondents included swimming in lakes, rivers, orthe ocean, and boat fishing, which were noted by 59 and 41 percent of the households,respectively. In addition, between 24 and 40 percent of the households surveyedengaged in nonmotorized boating, motorized boating, and bank or dock fishing.
The Alaska SCORP (Alaska Department of Natural Resources 1999) revealed that themost popular water-based activities undertaken by Alaskans included sportfishing (76percent), clamming and beachcombing (53 percent), motorboating (42 percent), andcanoeing, rafting, or floating (31 percent). Interestingly, when Alaskans were askedwhich activities they did not participate in, but would like to, the top five responses(snowmobiling, downhill skiing, sea kayaking, jet-skiing, and cross-country skiing) wereactivities all dependent on water. In Washington, a survey found that 72 percent ofWashington households had participated in some type of water activity (e.g., swimming,water-skiing, sailing, boating) in the past year, and 57 percent had participated in fishing(Washington Interagency Committee for Outdoor Recreation 1995). In fact, as a result ofconducting the SCORP process, the Interagency Committee for Outdoor Recreation inWashington found that the public’s strong demand for water access was not being metand recommended that the state invest in 2,000 acres of public water access sites inthe future.
Boating is a popular water-based activity in the Pacific Northwest. According to theNational Marine Manufacturers Association (1997), Alaska, Oregon, and Washingtonrank 25th, 15th, and 24th, respectively, in the number of boating registrations on a percapita basis. Fishing is even more popular than boating in the region. A national surveyof fishing, hunting, and wildlife-based recreation compared data on fishing among thestates of the Pacific Northwest region (USDI and USDC 1996). For numbers of anglers,days of fishing, and fishing expenditures, Washington ranks first in the Pacific Northwest,followed by Oregon, and then Alaska (table 3). As a percentage of the state population,however, Alaska contains more anglers, followed by Oregon and Washington. The influenceof nonresident anglers is also greater in Alaska. Nonresident anglers fishing in Alaskaaccounted for about 40 percent of the total days of fishing, whereas nonresident anglersaccounted for only 6 and 7 percent of the total days of fishing in Oregon and Washington,respectively. These figures suggest that natural resource decisions in Alaska will impact amore geographically diverse constituency and that management decisions in Alaska will bedriven more by out-of-state individuals than will similar debates in Oregon and Washington.In all three states, freshwater fishing is preferred over saltwater fishing (table 4), implyingthat management changes in freshwater resources would have greater implications forrecreation participation than would changes in saltwater resources.
As previously discussed, there is an absence of current peer-reviewed studies examiningrecreation use trends. In contrast, research examining trends in recreation use generallyhas been replaced with studies that focus more specifically on particular components ofthe recreation experience, such as visitor satisfaction or visitor perceptions of crowding.

7
Table 3—Anglers and days of fishing for the Pacific Northwest region
AnglersAnglers (as a percentage of state Days of
State (resident and nonresident) population) fishing
MillionsAlaska 463,000 29 5.3Oregon 658,000 16 8.0Washington 1,000,000 15 12.9
Source: USDI and USDC 1996.
Table 4—Total days of freshwater and saltwater fishing in the Pacific Northwest in1996a
State Total days of freshwater fishing Total days of saltwater fishing
Alaska 3,602,000 1,949,000Oregon 7,118,000 870,000Washington 10,975,000 2,135,000a Includes state resident and nonresident.Source: USDI and USDC 1996.
Although this latter research was needed to better understand recreation behavior, it isimportant that researchers also continue to examine and to project recreation use trendsin the United States. Because different methods are used to obtain recreation data, it isimportant for peer-reviewed studies to examine long-term trends in recreation whileaccounting for the limitations arising from inconsistent methods. Without better andcontinuous monitoring of recreation trends, managers may be caught unaware of thechanging needs of the recreating public and may not be prepared to deal with thepotential impacts of recreation use shifts on the water resource.
Most recent survey data indicate that in the Pacific Northwest, water remains essentialto people’s ability to continue participating in their preferred recreational activities.Because water is such a critical element in many recreation opportunities, managersmust carefully design water management strategies that acknowledge the importance ofrecreation to the public and the importance of water resources to recreation.
Population growth and migration will influence the spatial distribution of recreation in theUnited States and will affect the local public’s acceptance of water managementstrategies.2
A discussion on future trends in recreation is incomplete without an examination of themajor determinants of recreation trends–population change, migration, and demographiccomponents of population. An understanding of these shifts in population is critical tounderstanding the future of outdoor recreation trends in the United States.
Proposition 3
2 Much of the research literature discussing the link betweendemographic changes and recreation is not specific to water-based recreation. Therefore, key drivers of change will focuson how demographic variables influence general recreation.The few examples of research studies that examined the effectof demographics on water-based recreation are included.
8
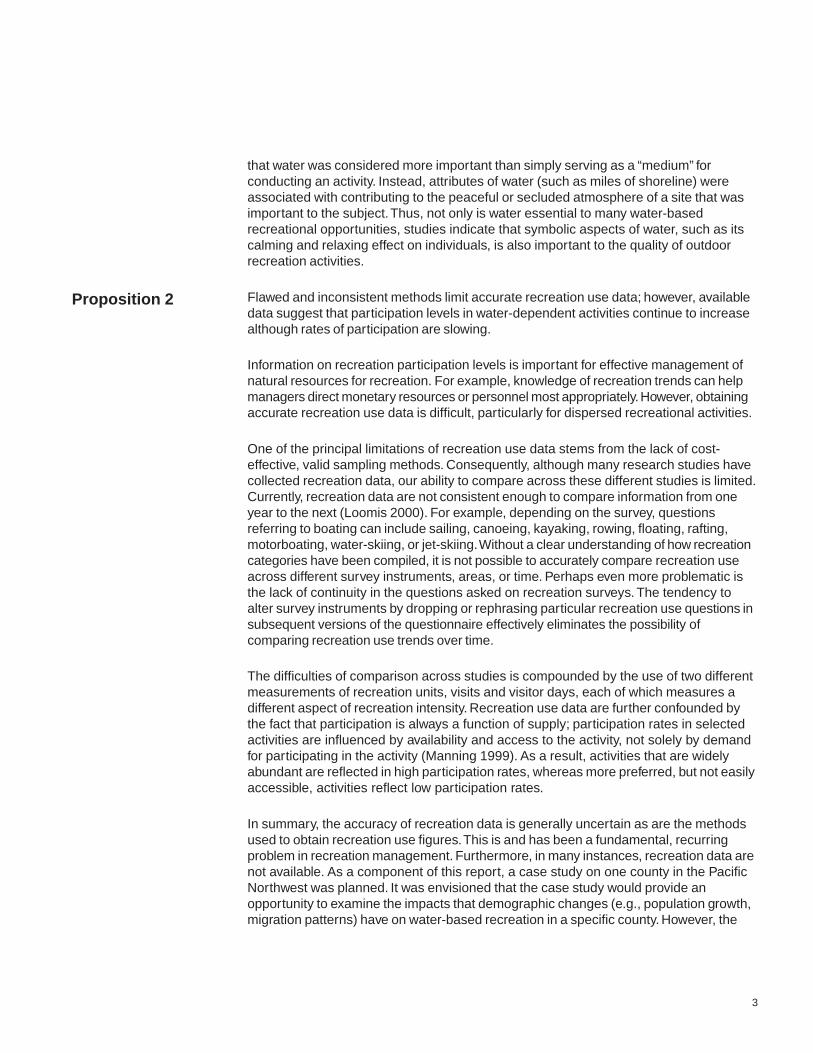
Many societal trends will influence water-based recreation in the Pacific Northwest, butnone appear to have as great a potential impact as population growth and the demographiccomponents of population change. Although the population growth rate of the UnitedStates has been declining for some time, the 1999 estimate for population growth in thePacific Northwest shows a rapid increase in population for all three states (table 5, fig. 1).Both Oregon and Washington were within the top 10 fastest growing states in the Nationin the 1990s (10th and 7th, respectively) while Alaska was 13th. Furthermore, if census2025 projections for population growth in the region are reasonably accurate, thepopulation of all three states will grow between 31 and 43 percent in the next quartercentury (USDC Bureau of the Census 1997).
Considered by itself, this dramatic increase in the Pacific Northwest population suggeststhat additional demands will be placed on natural resources for recreation in general, andon water resources in particular. Assuming the acreage of federally owned lands remainsrelatively constant, the increase in population will decrease the amount of federal publicland available per person. However, it is not enough to consider the effects of increased
Population Growth
Table 5—Population and percentage of population change for the Pacific Northwest
1999 Population 2025 Populationpopulation change population change
State (estimate) (1990-1999) (projection) (1999-2025)
Percent PercentAlaska 619,500 12.6 885,000 43Oregon 3,316,154 16.7 4,349,000 31Washington 5,756,361 18.3 7,808,000 36
Source: USDC Bureau of the Census 1997.
Figure 1—Percentage of population change for the United States, 1990-1999 (USDC Bureau of theCensus 2001a).
>16%10-16%<10%

9
population growth alone. Demographic components of this population growth—such asmigration, shifting age structure and racial composition–confound the effects of popu-lation growth on management of natural resources in the future (McCool and Kruger,n.d.). We examine each of these components in detail under propositions 3 and 4.
Not only will the increase in population have profound impacts on future recreationpatterns and management of water, but the spatial distribution of these population shiftsacross the United States will further complicate future scenarios. The trend throughoutthe United States is for residents to migrate from the Northeast, Midwest, and Plainsstates to the South and the West; the growth in the Pacific Northwest reflects thesenational migration shifts (fig. 1). The population of the Pacific Northwest continues togrow owing to natural increase (births minus deaths) and increased international anddomestic migration. Census projections for net domestic and international migration intothe Pacific Northwest estimate that Oregon and Washington will continue to rank high inboth net international and particularly net domestic migration (table 6), while in contrast,Alaska’s rate of inmigration will slow.
Whether or not the population is growing or declining in specific regions of the countryholds important implications for the conflicts over water for recreation and other uses.Current trends hold particular significance because they reveal a general pattern ofmigration from more water-rich regions of the United States toward more arid, WesternStates. These regional migration patterns potentially will have dramatically differenteffects on diverse regions of the country—bringing increased conflicts over scarce waterresources in some locations (e.g., southern California) while having less impact inregions of lower growth, particularly those already with an abundant water supply (e.g.,Michigan). An interesting question arising from these regional migration patterns iswhether or not water should be more equally distributed among the regions (e.g., watertransported from the Great Lakes to the Southwest) or whether each region must fulfillits own water needs through local water supplies. Even in the Pacific Northwest, aregion commonly considered to have abundant water resources, variations in climateresult in extremes of both wet and arid conditions within Washington and Oregon. Thus,the spatial pattern of rainfall coupled with the spatial pattern of migration into the PacificNorthwest will result in diverse impacts on different regions of the states. The implicationsof these migration patterns on recreation and water management is further discussed inthe following section.
Table 6—Projections for net domestic and international migration for the PacificNorthwest, 1995-2025
Net domestic State Net international StateState migration ranking migration ranking
Alaska -84,000 37th 28,000 41st
Oregon 712,000 8th 197,000 19th
Washington 931,000 5th 394,000 11th
Source: USDC Bureau of the Census 2001b.
Regional Migration

10
The recent movement of people from urban to rural locales is another important migrationtrend in the United States, reflecting a pattern of population “deconcentration” (Johnsonand Beale 1998). Throughout the early half of the 20th century, internal migration in theUnited States consistently reflected a migration from rural to urban areas. However, inthe 1970s there was a shift in net inmigration of people from metropolitan to nonmetro-politan areas, including remote, highly rural counties (Blahna 1990, Fuguitt 1985). Thistrend, termed the “rural renaissance” or “population turnaround,” revealed a pattern inwhich natural increase contributed less to the population growth in nonmetropolitancounties than did inmigration (Johnson 1993).
In the 1980s, this pattern reversed as people began moving back to urban areas in greaternumbers, in part because of the economic recession and the farm crisis of 1980-86(Johnson and Beale 1994). Consequently, many researchers believed that the populationturnaround of the 1970s was an aberration in the traditional rural to urban migration patternthat characterized most of the 20th century. However, data from migration patterns in theearly 1990s once again revealed increasing numbers of people moving from metropolitanto nonmetropolitan areas (Johnson and Fuguitt 2000). This suggests that the period ofslower growth of nonmetropolitan areas in the 1980s was atypical of the overall patternof urban to rural migration in the past three decades (Shumway and Davis 1996).
As the rural renaissance trend began to unfold, researchers sought to determine thecauses underlying this migration. Although economic needs for employment fueled muchof the migration from rural areas to cities in the first half of the century, the populationturnaround of the 1970s was influenced by other factors. Fuguitt et al. (1989) notedseveral possible causes, including narrowing wage differentials between urban and ruralareas, increased accessibility to rural areas through modernization, and a relative shiftin the value placed on economic as opposed to noneconomic (e.g., amenity) factorsaffecting personal decisions to move. Ploch (1978) found that quality-of-life factors suchas a rural orientation, slower pace of life, peacefulness, environmental quality, andnatural beauty were primary motivations for inmigration to Maine.
The finding that this migration shift is closely related to the presence of environmentalamenities in rural counties is well documented. Johnson (1993) found that the two fastestgrowing groups of counties in the 1980s were retirement counties and recreational counties(as determined by hotel, motel, trailer park, and camp spending per capita). In an exam-ination of nonmetropolitan population growth in the mountain West from 1970 to 1995,Shumway and Davis (1996) found that the counties that experienced the greatest netmigration were adjacent to metropolitan counties, contained high amenities for retirees,high percentages of federal land, numerous recreation opportunities, and few extractiveindustries. In the interior Columbia River basin, counties experiencing recent growth havebeen found to be economically different from traditional boom and bust counties becausethey typically contained high concentrations of environmental amenities (Troy 1998).Similarly, Rudzitis and Johansen (1989, 1991) found that counties adjacent to wildernessareas had higher rates of growth from migration than did more distant counties.
The urban to rural migration pattern has many implications for natural resourcemanagement. The pattern of population deconcentration reflected in the movement ofpeople from dense cities to less settled rural locations has likely contributed to changes
Urban to Rural Migration
11
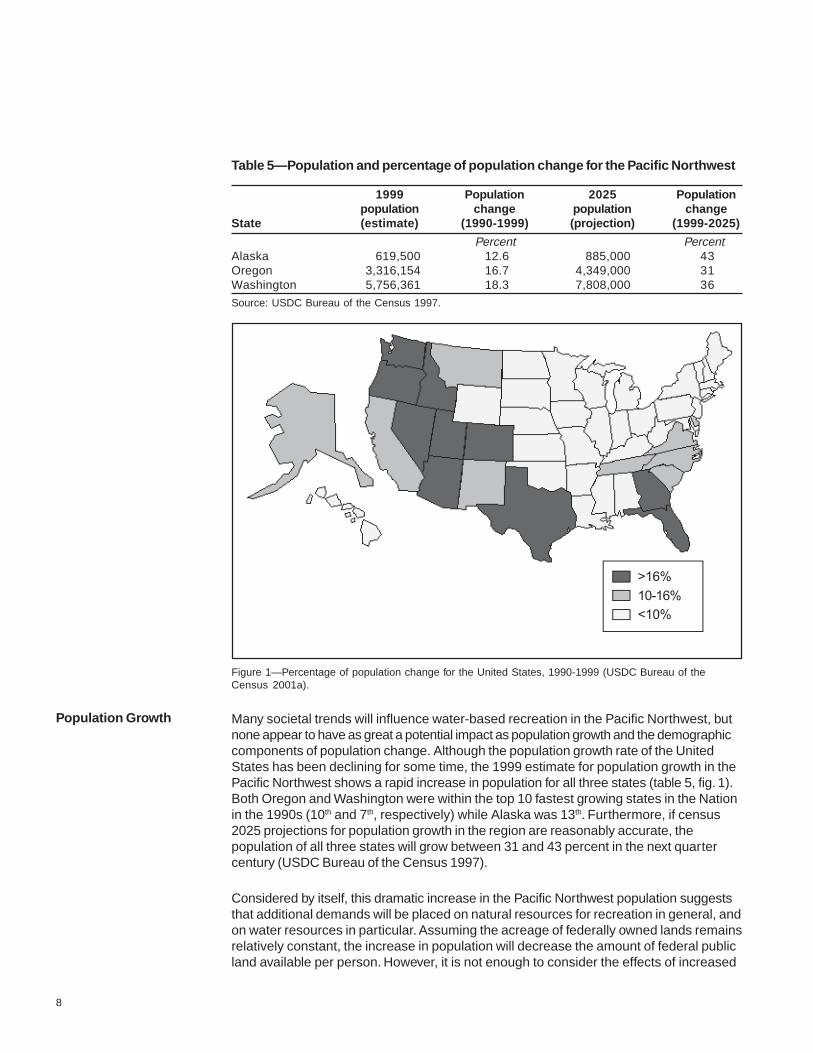
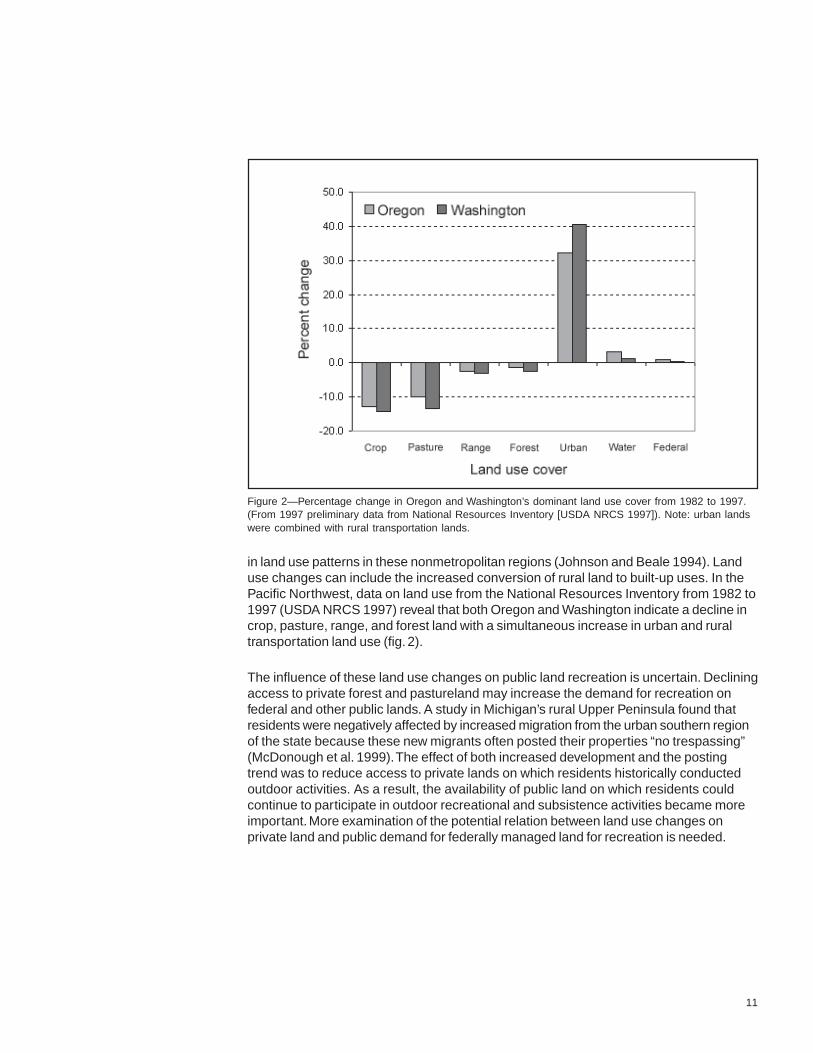
in land use patterns in these nonmetropolitan regions (Johnson and Beale 1994). Landuse changes can include the increased conversion of rural land to built-up uses. In thePacific Northwest, data on land use from the National Resources Inventory from 1982 to1997 (USDA NRCS 1997) reveal that both Oregon and Washington indicate a decline incrop, pasture, range, and forest land with a simultaneous increase in urban and ruraltransportation land use (fig. 2).
The influence of these land use changes on public land recreation is uncertain. Decliningaccess to private forest and pastureland may increase the demand for recreation onfederal and other public lands. A study in Michigan’s rural Upper Peninsula found thatresidents were negatively affected by increased migration from the urban southern regionof the state because these new migrants often posted their properties “no trespassing”(McDonough et al. 1999). The effect of both increased development and the postingtrend was to reduce access to private lands on which residents historically conductedoutdoor activities. As a result, the availability of public land on which residents couldcontinue to participate in outdoor recreational and subsistence activities became moreimportant. More examination of the potential relation between land use changes onprivate land and public demand for federally managed land for recreation is needed.
Figure 2—Percentage change in Oregon and Washington’s dominant land use cover from 1982 to 1997.(From 1997 preliminary data from National Resources Inventory [USDA NRCS 1997]). Note: urban landswere combined with rural transportation lands.

12
The effect of land use changes on water management can be profound. Not only can thegrowth of residential developments in the urban-forest interface lead to forest fragmenta-tion, disruption of habitat, and disruption of ecological processes such as water drainage,but land use changes resulting from increased migration will impact what is consideredsocially acceptable forest management. The finding that most migration to rural countieswas influenced by amenity factors suggests that recreation is an important factor inquality of life for many of these new migrants and that these migrants will be aware of,and concerned about, the management of their local resources. As more people moveinto the urban-forest interface and as these people demand a greater voice in forestmanagement, conflicts over management decisions are likely to grow. Thus, the spatialcontext of management decisions will be important to consider because residents’preferences for natural resource management strategies are often influenced by NIMBY(not in my backyard) reactions.
Researchers examining forest management practices at the urban interface have observedthat certain timber harvesting scenarios found publicly acceptable in a general senseare often unacceptable when situated in a familiar, highly valued location (Brandenburgand Carroll 1995, Johnson et al. 1994). Coupled with the fact that many migrants aremoving to forested areas—a phenomenon described as the exurbanization of the country-side (Egan and Luloff 2000)—the influence of the NIMBY responses has the potential toincrease conflicts over what has traditionally been considered acceptable naturalresource management.
Population growth in rural, forested locations will place increased pressure on managementfor water, fire, recreation, wildlife, and so forth. However, even beyond the problemassociated with the sheer numbers of people moving in, considering the urban to ruralmigration pattern for natural resource management is important because the compositionof the new residents will likely influence acceptance of management decisions (Troy1998). Even if the net effect of migration into a county is zero, the compositional changein communities may be significant for resource management. Much of the interest in thepopulation redistribution (both from the North and East to the South and West and fromurban to rural counties) is that it often changes the demographic composition of residents,which in turn results in shifting values, attitudes, behaviors, and knowledge regardingresource management (McCool and Kruger, n.d.).
Shifts in migration patterns raise many questions about the effect these incoming residentswill have on recreation patterns and on management of water in their new residence.Super and Cordell (1990, p. 813) noted that the recreational use of the Nation’s publiclands reflects the “values, tastes and preferences of the U.S. population—a very diversepopulation that is ever evolving in the types of recreation it demands.” By influencing thepredominant values held by the local citizenry, population change will therefore createnew challenges for resource managers who will need to adapt to shifting recreation needsand shifting notions of what are acceptable water management strategies. Without a betterunderstanding of the nature of these changes, managers will lack preparedness for themagnitude and direction of future recreation and water management needs.

13
The shifting composition of incoming residents is particularly important becauseresearch suggests that new inmigrants often hold different values and attitudes towardnatural resource management than long-time rural residents. Rudzitis and Johansen(1989, 1991) noted that rural migrants held higher levels of environmental concern andwere more likely to support management of public lands for environmental benefits insteadof commodity production. In an examination of migration patterns in Maine in the 1970s,Ploch (1978) noted that families migrating to rural counties were younger, smaller, moreeducated, and more likely to hold professional and managerial occupations than wereMaine residents. The author also noted that the inmigrants’ desire to maintain the ruralatmosphere and quality of life that they migrated for could come into conflict with localindividuals’ desire to promote economic growth. Fortmann and Kusel (1990) found littledifference in environmental attitudes of long-time residents and newcomers, but insteadfound that, because of their willingness to express dissatisfaction with forest managementdecisions, newcomers provided a “voice” for proenvironmental attitudes already existingin the community. These findings suggest that the migration of politically savvy newcomersto rural communities will increase public scrutiny of natural resource management decisions.
Most research has found that new residents differ from long-term residents in terms ofdemographic variables; many studies have examined the influence of these differencesin demographic characteristics on environmental concern and knowledge. Although thesestudies have mixed findings, research indicates that levels of environmental concern areinfluenced by gender, residence, political ideology, education, and particularly age. Typically,researchers have found that women, urban dwellers, people with a liberal political ideology,well-educated people, and younger cohorts tend to show more environmental concernthan their more conservative counterparts (Jones and Dunlap 1992, Steel et al. 1994,Van Liere and Dunlap 1980). Thus, the makeup of individuals migrating into a region canhave an impact on levels of environmental concern and subsequent natural resourcemanagement actions, programs, and policies. Higher levels of environmental concernscould then translate into shifts in the acceptability of specific water managementstrategies.
The public’s level of knowledge also influences their judgments of acceptability. However,public attitudes or knowledge is not fixed; it may evolve in response to new information,experience, peer-pressures, etc. One of the best-known examples of this was the SmokeyBear campaign, based on the premise that fire should always be suppressed in naturalecosystems. Although the original campaign was successful in terms of public support,in recent years the public’s increasing knowledge of the beneficial role of fire in naturalecosystems has led to greater public acceptance of practices besides total fire sup-pression (Shelby and Speaker 1990, Stankey 1976).
In summary, the increase in population and redistribution occurring across the UnitedStates likely will have a major impact on recreation trends and water management in thePacific Northwest, both in terms of sheer increase in numbers and in terms of changingdemographic composition of incoming residents.

14
Changing demographics—such as age, race, and ethnicity—will alter trends in water-based recreation, which may necessitate a shift in water-based recreation managementin the Pacific Northwest.
A demographic change expected to have a major influence on recreation participation inthe future is the aging of the population. Projected population trends suggest that the 15-to 24-year-old age group could decrease from 18.7 percent of the U.S. population in 1980to 13.1 percent of the total population by 2030. In contrast, the elderly population is expectedto increase from 11.3 percent to 20.1 percent over this same period (USDC Bureau of theCensus 2001b). Unlike changes in migration patterns and racial and ethnic makeup, theaging of the population is expected to similarly occur throughout the United States. In1995, only five states had greater than 15 percent of their population over 65 years of age.By 2025, 48 states are expected to have over 15 percent of their population over 65years of age (USDC Bureau of the Census 1997). In the Pacific Northwest, both Oregonand Washington are expected to have high percentages of older Americans by 2025(table 7).
The increasing proportion of the population in people over age 65 reveals the importanceof examining specific components of population change in the United States. Models thatonly use total population of the Nation to understand and predict the future pattern ofoutdoor recreation will be inaccurate owing to the confounding effects of age or racialmakeup, for example, on recreation behavior. Without a better understanding of changesin these variables, it is difficult to estimate how projected population increases will affectfuture demand for recreation or for specific facilities and programs.
Population aging likely will have a great impact on recreation participation trends becausethe relation between age and participation is often negative (i.e., as age increases,participation decreases), particularly in high-intensity activities such as water-skiing. Foractivities such as motorboating, the relation is more stable, or shows the highest ratesof participation at middle age. Thus, the demand for some activities will grow faster thanthe population grows, while for others it may drop rapidly. One complicating factor is thatpeople over 65 today are more active than the same cohort decades ago. Although Woodet al. (1990) noted that the population of 70 to 90 year olds are healthier and more mobiletoday than their predecessors and they still participate in recreational activities, thenature of these activities appears to change over their lifetimes. For instance, Luloff andKrannich (1990) found that hunters tended to be younger on average than were anglers.Specifically, they found that 2 percent of hunters were over 65 years old, whereas nearly7 percent of anglers and 7 percent of nonconsumptive recreation participants were over 65years old. These findings suggest that participation rates in hunting are likely to be morenegatively affected by the population aging than are participation rates in fishing.
Table 7—Percentage of population over 65 years, 1998 and 2025
State Population over 65 years (1998) Population over 65 years (2025)
- - - - - - - - - - - - - - - Percent - - - - - - - - - - - - - - - - -Alaska 5.5 10.4Oregon 13.2 24.2Washington 11.5 20.2
Source: USDC Bureau of the Census 1996.
Age
Proposition 4

15
In summary, the most important implication of the large percentage of older Americansis that many high-intensity water-based recreational activities will show a slowing in thegrowth rate, whereas certain lower intensity activities favored by older citizens mayshow stable or increasing participation rates (Murdock et al. 1991).
Increasing racial and ethnic diversity in the United States is another major componentthat will likely affect rate of participation in certain types of recreation.3 A combination ofboth high rates of natural increase (births minus deaths) and immigration of ethnic pop-ulations will increase the proportion of minorities in the United States. Unlike the aging ofthe population that will affect the entire United States, increasing racial and ethnic diversityis expected to be greatest in the South and Southwest. Although the rate of increase willbe slower in the Pacific Northwest than elsewhere, race and ethnic diversity are still pre-dicted to increase over time (table 8). Much of the increase in diversity in the PacificNorthwest will come from increases in populations of non-Hispanic Asian/Pacific Islandersand Hispanics.
Like the aging of the population, the effect of increasing racial and ethnic diversity mayhave a profound influence on future recreation trends. The different ways in which variousracial and ethnic groups recreate and their potentially different levels of acceptability fornatural resource management practices are important factors to consider. Much researchhas reported differences in the recreation patterns of various racial and ethnic groups,particularly among Blacks, Whites, and Hispanics.
One consistent finding is that racial and ethnic groups differ in the recreational activitiesin which they traditionally participate. Whereas Blacks and Whites are significantly morelikely to participate in more active recreational activities, Hispanics are more likely toparticipate in sedentary recreational activities such as picnicking (Hutchison 1987,Hutchison and Fidel 1984). White households are significantly more likely than Black
Increasing Racial andEthnic Diversity
3 An ethnic group is typically defined as a collection of people(e.g., Hispanics) who have in common a particular set ofattributes such as language, culture, or religion (Husbandsand Idahosa 1995). In contrast, race is defined in theAmerican Heritage Dictionary (2000) as a “local geographicor global human population distinguished as a more or lessdistinct group by genetically transmitted physicalcharacteristics” (e.g., Blacks, Asians).
Table 8—Percentage of population in racial and ethnic groups, 1995 and 2025projection
Alaska Oregon Washington
Race and ethnic groups 1995 2025 1995 2025 1995 2025
- - - - - - - - - - - - - - - - - - - Percent - - - - - - - - - - - - - - - - - - -Non-Hispanic White 73.0 57.1 89.5 82.0 85.0 76.1Non-Hispanic African Americans 4.0 3.9 1.7 2.0 3.1 3.1Non-Hispanic Asian/Pacific Islander 4.3 21.5 2.8 4.7 5.0 8.8Non-Hispanic Native American/Eskimos/Aleuts 15.0 10.7 1.3 1.5 1.6 1.8Hispanics (any race) 3.8 6.7 4.8 9.8 5.2 10.2
Source: USDC Bureau of the Census 1996.

16
households to participate in a variety of water-based or water-enhanced recreationalexperiences such as nonpool swimming, large or small horsepower motorboating, rivercanoeing, and primitive camping (Dwyer and Hutchison 1990). Similar results from the1994-95 National Survey on Recreation and the Environment (USDI and USDC 1996)found that Whites were much more likely to have participated in selected water-basedrecreational activities at least one time in the past 12 months than were Blacks (Wellner1997). For example, the survey found that 43 percent of Whites versus only 17 percentof Blacks had participated in nonpool swimming, 26 percent of Whites had gone fresh-water fishing versus 15 percent of Blacks, 10 percent of Whites had gone water-skiingversus 1 percent of Blacks, and 9 percent of Whites had gone floating or rafting versus2 percent of Blacks.
An understanding of the differences in rate of participation in certain recreationalactivities between various racial and ethnic groups is important because models thatattempt to predict future outdoor recreation trends will likely misrepresent rates ofrecreation change if they assume that minority groups will participate at the same rateas Whites. If minority recreational participation rates remain constant, the growth inminority populations likely will lead to an increase in the rate of certain activities inwhich they tend to participate more, such as fishing and saltwater swimming, whilepossibly suggesting a slowing of the increase in the participation rate for activities inwhich they are less likely to participate, such as motorboating.
Studies have not only revealed differences in the types of recreational activities participatedin by minorities and Whites but also have identified different reasons for participating incertain recreational activities. For example, in a study of anglers in two Mississippicommunities, Toth and Brown (1997) examined how race influences various meaningsthat recreational groups have for fishing. They noted that Black anglers evidenced agreater focus on fishing for subsistence, whereas White anglers gave greater importanceto fishing as a sport.
Studies also have shown differences in the manner in which the groups typicallyparticipate in recreational opportunities. Hispanics, more so than Whites, tend torecreate in larger groups—typically expanded family groups—and when camping, prefercampsites with other campers nearby (Hutchison 1987). Hutchison and Fidel (1984)found that the average size of recreating Mexican-American groups was 5.7, whereasthe average size for recreating Anglo groups was 2.5 persons. In addition, their researchnoted that Mexican-American recreating groups more often contained people of mixedages. Among Whites and Blacks, it has been noted that Black households show apreference for meeting people—particularly peers—and recreating in group-basedactivities in developed urban settings, whereas White households show a preference forindividual-oriented wildland recreation and for getting away from others in their outdoorrecreation experiences (Dwyer and Hutchison 1990, Edwards 1981, Irwin et al. 1990).
Furthermore, some studies have noted, even after accounting for sociodemographiccharacteristics such as income, that Black households were less likely to travel longdistances to find recreational opportunities than were White households (Dwyer andHutchison 1990, Kelly 1980, Washburne and Wall 1980). This finding helps explain whyBlacks have lower participation rates in activities such as wildland recreation thatrequire extensive traveling. Manning (1999) summarized findings from studies that haveexamined the differences in recreation participation between Whites and minority groups.

17
In general, minority groups, as compared to Whites, tend to use highly developed, urbanrecreation facilities that are close to home; recreate in larger groups that contain a diversityof ages; conduct more sport and fitness-type activities; have a longer length of stay; andparticipate in land-based activities more than water-based activities (Manning 1999).
There are two major theories as to why research studies find significant differences inrecreation participation patterns among racial and ethnic groups: the marginality and theethnicity theories (Husbands and Idahosa 1995). The marginality theory explains theracial and ethnic differences in recreation patterns through the groups’ differences indemographic variables (such as age and urban-rural distribution), poverty, and discrimination(Washburne 1978). The theory posits that differences in these characteristics lead todifferent opportunities to access recreational resources (Edwards 1981). It acknowledgesthat traditional minority participation rates may not reflect their real demand for recreation(Dwyer 1995). Historically, Blacks have had more limited recreational experiences thanWhites in part owing to lack of resources (e.g., money) and reduced access to bothpublic and private recreational opportunities.
The ethnicity theory posits that recreation differences are a function of the values, norms,and experiences of the different ethnic groups (Husbands and Idahosa 1995). Meeker etal. (1973) suggest that the noted preference of Blacks for urban-based activities resultsfrom their view of the city as a place of greater refuge from racism than natural land-scapes. Whereas national parks are seen by Whites as virgin lands (e.g., the “Garden ofEden”) untouched by human activities where one could find escape from civilization; thismystic surrounding nature was not a part of the cultural systems of other groups suchas Blacks and Native Americans.
Unlike the culture of European settlers where nature was considered separate from humanactivities and thus needed to be protected from civilization, the culture of Blacks andNative Americans ascribed more to a philosophy in which humans are more integratedwith natural processes (Meeker et al. 1973). Furthermore, Taylor (2000) notes that sincetheir inception, national parks and wilderness areas have been used primarily by middleclass Whites and that minority populations traditionally have felt more uncomfortablerecreating in these areas. This reluctance was likely formed and sustained by the celebrationof White “discoveries” of areas previously known to, and used by, Native Americans andChicanos; the lack of minorities employed in land management agencies; and the lack ofminorities in books, guides, and films of wildland areas.
The differences between these theories holds certain implications for recreation manage-ment as the diversity of the United States increases over time. If research suggests thatthe marginality hypothesis accounts for most of the differences in recreation participationamong racial and ethnic groups, then programs could be developed to make recreationmore accessible to individuals at all socioeconomic levels. On the other hand, if researchsuggests that cultural norms and values account for variations in recreation participation,then recreation managers could attempt to redistribute more resources to activitiespreferred by those racial and ethnic groups whose populations are increasing (Edwards1981). A better recognition of how race and ethnicity influence the meaning of recrea-tional activities is needed for resource professionals to manage natural resources fordiverse participants.

18
Our examination of major shifts in certain demographic variables in the United Statessuggests certain major trends in the future. The U.S. population is growing, although at aslower rate than in the past. Americans are becoming increasingly older, more raciallyand ethnically diverse, and more likely to reside in the South and the West. Althoughparticipation rates in outdoor water-based recreational activities will not increase rapidly,there will certainly be a substantial shift in the demographic makeup of recreationists(Schuett 1995). Because demographic variables are important determinants of recreationparticipation, changes in the demographic composition of the American population willhave profound effects on future recreation use trends, especially owing to the interrelatedeffects of age, ethnicity, and race. These variables work in combination, and will meanan increase in some activities and a decrease in others.
Because of the increasing proportion of older residents and minorities, rates of increasein most outdoor recreational activities will slow (Murdock et al. 1991). Owing to the slowergrowth of minority populations in the Pacific Northwest as compared to other regions(e.g., Southwest), racial and ethnic differences in recreation participation will have lessof an impact in the Northwest than in other parts of the country. However, if the growthin minority populations in the Northwest primarily occurs in certain geographic locations(e.g., urban areas), it will have a greater influence on recreation participation in thoseareas than overall percentage of growth rates in Northwest minority populations mightfirst suggest. Possible differences in the spatial pattern of increasing minoritypopulations in the Pacific Northwest highlight the importance of having site-specificinformation on demographic trends. Because there is a clear relation between race andethnicity and recreation participation, changes in the constituency of a particular areawill have strong implications for recreation management.
In the Pacific Northwest, however, in general, the influence of population aging is likelyto have more of an impact on recreation trends than will increasing racial and ethnicdiversity. This suggests that the Pacific Northwest may see increasing demand forwater-based recreational activities in which older adults participate—such as motorboatingon lakes or camping in developed campgrounds near lakes (Cordell et al. 1997). In contrast,high-intensity activities such as primitive camping along rivers will likely see a decline inthe rate of growth. Activities such as saltwater fishing that have high participation ratesfor both minorities and older Americans are predicted to have a higher rate of growth inthe future (Murdock et al. 1990).
Owing to the complexity of demographic variables influencing recreation, there is a needfor models that can account for these combined effects (Murdock et al. 1990). Becausedemographic groups have different participation rates in leisure activities, it is notsufficient to simply project current recreation participation rates to future populations topredict future recreation trends. The uncertainty surrounding modeling and predictions ofrecreational behavior make it particularly important to have consistent monitoring ofrecreation use to prepare managers for changing recreational demands (Dwyer 1995).
The Combined Influenceof Demographic Variables

19
Our knowledge of other causal factors affecting demand for recreation—such as the roleof technology and the influence of leisure time—is limited.
The influence of technology trends on water-based recreation patterns is not welldocumented in the research literature. In part, we are limited in our ability to understandhow technological change may impact water-based recreation and recreation manage-ment in the future owing to the rapid rate of technological change. In recent years, newtechnologies have been created at an accelerated pace, creating a situation in whichthere is some uncertainty as to what the future will hold. Rayner and Malone (1998) pointout that although it took 100 years, from 1844 to 1936, for people to develop commercialtelegraphy, the telephone, broadcast radio, and television, it took only 20 years for videocameras, computers, cellular phones, and the Internet to become widespread.
Compounding the confusion over the influence of technology on water-based recreationand management is the reality that technology is neither inherently beneficial nor harmful.Two extreme, but simplistic, viewpoints—that technological improvements will solve allproblems or that technology creates problems—both inadequately describe the complexityof the impact that technology may have on water-based recreation. The effect technologywill have on water-based recreation will depend on how the technology is applied.
Depending on the circumstances, technology can have both negative and positiveimpacts on water-based recreation and management. Several examples illustrate thispoint. The technology that led to the advent of the motorboat has arguably resulted inincreased pollution in lakes and rivers. However, given that motorboats exist and areused extensively in recreation, further improvements in the efficiency of these motorswill instead have a beneficial impact on pollution levels in waterways. In another example,technological improvements in recreational equipment (e.g., snowmobiles) have givenpeople greater access to recreation sites, including remote wildland sites, with relativelylittle effort. In addition, advances in technology now allow people to jet-ski into locationspreviously too shallow to access otherwise.
The effect of increased access is twofold. On the one hand, advances in technologyincrease recreational opportunities by removing some of the barriers to access intoremote locations and by allowing more people to participate in recreational opportunities(e.g., elderly or disabled individuals). By allowing a broader spectrum of society toparticipate in recreational experiences, technological increases also may have a positiveeffect on political interest in recreation and recreation management. If there are morepeople who value recreational opportunities, there will be more people who will attemptto influence the political system with regard to recreation. This is particularly true ofolder Americans who typically are much more politically active than younger cohorts(Steel et al. 1998). On the other hand, improved access resulting from technologicaladvances could lead to detrimental impacts on surrounding riparian habitat. Improvedaccess expands available recreational sites by allowing individuals to recreate in locationspreviously considered too remote. Improved access can intensify the use of existingsites that may be unable to withstand additional recreational pressure. Furthermore, tosome individuals, the mere presence of technology in wildland areas is antithetical totheir value systems, as evidenced by the recent controversy over snowmobiles inYellowstone National Park.
Proposition 5
Technology

20
Advancements in technology also influence demographic trends, such as the urban torural migration pattern, that affect water-based recreation and management. Johnsonand Beale (1998) note that advances in transportation and communication (e.g., satellitetechnology, the Internet) have given people the ability to reside in nonmetropolitancommunities without needing to consider proximity to urban areas or the availability oflocal employment. Improvements in transportation corridors also have resulted in growthof rural counties that are now considered within commuting distance to major metropolitancenters such as Seattle. On the other hand, Johnson and Beale (1998) note that theurban to rural migration also is fueled by negative aspects of technology because trafficcongestion in urban areas has increased people’s desire to leave cities for less populatedrural areas. The growing numbers of people migrating into rural counties will likelyincrease recreation pressure in these locations and, as a result, will increase the conflictsover management of water resources for different uses and values. As previouslydiscussed, technological advances not only will increase population growth in remote,rural counties but also will increase the number of individuals holding different values,beliefs, and knowledge about natural resource management.
Another important technological trend that may impact water-based recreation andmanagement is the information technology explosion. As before, this trend will result inboth positive and negative impacts for management of recreation and the water resource.The increase in information technology has and will continue to greatly expand theopportunities for individuals to obtain information about recreational activities andpotential recreation sites with relative ease (e.g., through Web sites). The Internet givesmanagement agencies the ability to spread real-time information and visual picturesabout recreational opportunities. However, Stankey (2000) noted that not only is there apossibility for dissemination of inaccurate information about a recreation site, such ason private, nonofficial Web sites, but widespread information about appealing recreationsites can result in increased crowding in formerly pristine locations. Furthermore,advances in Internet and e-mail technologies give individuals and organizations theability to become informed almost instantaneously about potential management strategiesand also gives them the ability to quickly mobilize a wide public to place pressure onagencies for particular natural resource management strategies.
Because the availability of leisure time is related to the ability to participate in recreationalactivities, leisure trends in the United States are important for projecting future recreationpatterns. Leisure time is defined as the available free time a person has after completingpaid work time, unpaid work time (e.g., household chores, childcare), and personal care(e.g., sleeping, eating) (Robinson and Godbey 1997).
Some polling in the United States reveals an increase in the median number of hoursAmericans work per week and a corresponding decline in leisure over the past 30 years.By asking respondents to estimate how long they work per week (including commutingtime), the Harris Poll (Taylor 2000) found that the median number of work hours hadincreased from 41 hours in 1973 to 50 hours in 2000. When adults estimated how muchleisure time was available to them each week, the poll found that the median number ofleisure hours decreased from 26 hours per week in 1973 to 20 hours per week in 2000.In her book, “The Overworked American,” Schor (1991) estimated that the averageemployed person worked 163 hours more in 1987 than they did in 1969. Data from theBureau of Labor Statistics’ Current Population Survey similarly shows that leisure time isless available for working Americans, particularly single parents or dual career couples
The Influence of LeisureTime

21
with children (Burtless 1999). In contrast, older Americans and younger adults withoutchildren tend to have more free time today than did their predecessors (Lagerfeld 1998).
Some researchers dispute the claim that leisure time has declined in recent decades forAmericans overall. Using time diaries, Robinson and Godbey (1997) found that not onlyhad the overall number of paid work hours fallen from 1965 to 1985, but that peopleresponding to surveys significantly overestimated how much time they had spent at workthe previous week. However, their results also showed that increased leisure time wasconcentrated in certain groups of Americans: the unmarried, the 18- to 24- and their 55-to 64-year-old cohorts, and those without children. These findings were consistent withmost research on leisure, which has found great variation in leisure time among differentgroups of individuals.
It is generally acknowledged that, for whatever reasons, Americans feel more pressedfor time now than ever before (Lagerfeld 1998). Davidson (1994) suggests that American’sreal or perceived decline in leisure time likely results from five “mega-realities”: populationgrowth, increasing volumes of information, increasing media coverage, growth in thepaper trail, and an overabundance of choices. For example, the author notes that vastincreases in knowledge and mass media coverage in the United States overwhelmpeople by bombarding them with information, while population growth has contributed toincreasing gridlock on transportation routes and longer commuting times for work andother tasks. Furthermore, Schor (1991) points out that consumerism (e.g., trying to“keep up with the Joneses”) locks workers into a work-and-spend cycle. To understand theimpact of leisure on recreation trends, the perceptions of Americans’ of their leisuretime are more important than their actual leisure time because it is their perception thatwill influence decisions about when, where, and how often to recreate.
The quality of leisure time is just as important as the quantity of leisure time. For example,Bittman and Wajcman (2000) found that although men and women have similar amountsof free time, the nature of their available time suggests that a gender gap in leisureexists. By comparing time diaries in 10 countries, the authors discovered that the leisuretime of men was more likely to be uninterrupted and of longer duration and was lesslikely to be associated with unpaid work such as childcare than was the leisure time ofwomen. There are some indications that, in general, recreation patterns of Americans areshifting owing to changes in the duration of leisure time. Americans are now more likelyto split their leisure time into several, small minivacations or long weekends rather thango on a few extended vacations (Hartmann et al. 1988). In addition, Lime et al. (1995)noted that recreation areas that are more developed and accessible have experiencedgreater growth in visitation than have backcountry settings.
This trend can have an important impact on recreation patterns resulting in an increasein the numbers of visitors at urban-proximate recreation sites, particularly day-use sites,and a decrease in the numbers of visitors to more remote locations that require longertraveling or longer stays. In combination with the preference of Americans for recreationaround water, this shifting pattern of leisure time suggests that there will be increasingpressure on water resources close to urban areas for water-based or water-enhancedrecreation. This will place further pressure on water resources for differing values suchas for clean drinking water, riparian habitat, or industrial use. In contrast, these trends

22
suggest that wildland recreation may face less pressure as people have limited time toreach those sites. In general, trends in leisure time suggest that water recreation man-agement requires focusing on sites located near population centers.
Certain water-based and water-enhanced recreation activities have been found tonegatively impact the water regime.
Water-based and water-enhanced recreational activities are often less detrimental towater quantity and quality compared to many other human uses of water (e.g., agriculture,industry, etc.). Nevertheless, the impact of recreation on the water regime still presentschallenges to managers attempting to create opportunities for recreational activities whilemaintaining water and environmental quality. Recreational activities that negativelyaffect water resources not only reduce the quality of water-based experiences or posehealth concerns for other recreationists, but they also can present problems with usingwater for other functions, such as for a municipal drinking water supply. Water qualityremains a concern, not only for environmental quality of riparian areas but also for publichealth. Between 1993 and 1994, 14 outbreaks of waterborne diseases (e.g., Giardia,Cryptosporidium, Shigella, and E. coli) in the United States affected about 1,437 peopleassociated with water recreation. Over this same period, over 405,000 people wereaffected by disease outbreaks associated with drinking water (Kramer et al. 1996),although it is unclear whether or not recreation played any factor in these outbreaks.
Recreational activities can impact water resources both directly and indirectly. Directimpacts result when recreational activities, such as swimming or boating, occur directlyon the water. Indirect impacts result when land-based recreation activities, such as campingor hiking, occur close to shore (Kuss et al. 1990). These distinctions are often describedas water-based and shore-based activities (Liddle and Scorgie 1980). Occasionally,impacts are observed regardless of the type of activity. For example, both shore- andwater-based recreational activities can disturb waterfowl populations sensitive todisturbance from humans (Liddle and Scorgie 1980).
Both direct and indirect recreational activities have the potential to produce biophysicalor chemical changes to surrounding riparian areas, which can then impact the waterresource itself. Research studies examining the impact of recreation on water qualityreveal variable findings. Hammitt and Cole (1987) review many studies that differed overthe impact of recreation on water quality as indicated by nutrient influx of nitrates,phosphates, and coliform bacteria. Some studies found nutrient increases owing torecreational activity in the area (King and Mace 1974); however, other studies note thatrecreational use has little effect (Silverman and Erman 1979), or that certain indicatorssuch as suspended solids fall to nearly predisturbance levels after recreationists leavethe site (Gary 1982).
The problem of determining whether recreation has an adverse impact on the water regimeis compounded by the fact that it is often hard to distinguish if high levels of nutrientsare coming from natural or human sources. Water quality reflects a combination of manyphysical, chemical, and biological factors as water moves through and across the land(Peters and Meybeck 2000). Owing to different lake morphology, geology, or depositionof sediment, water bodies can respond in a variety of ways to disturbance and pollution
Proposition 6

23
(Kuss et al. 1990). For example, oligotrophic lakes may be more influenced by smallnutrient influxes; therefore, erosion may be more of a management concern in theselocations (Hammitt and Cole 1987). The diversity of lake and stream characteristicsincreases the difficulty of obtaining consistent findings in studies examining impactson water.
Although research findings typically reveal that the impact of recreationists is oftenlocalized both temporally and spatially within the watershed (Clark et al. 1985), studiessuggest that different recreational activities have diverse impacts on the water regime.Research studies examining the impact of recreation activities on water primarily havefocused on motorboating, camping, and, less often, swimming. In general, studies havefound that boating has the greatest adverse impacts to the water regime, followed bycamping, and lastly, swimming and fishing (Kuss et al. 1990). Owing to the relationsamong fishing, boating, and hiking along shorelines, the impact of fishing on the waterregime is not discussed independently of the other two activities in this report. Further-more, fishing has been found to have the greatest impact on fish populations (Clark etal. 1985) rather than on the water resource examined in this study.
The greatest recreational impacts on water and riparian quality result from boating, particu-larly motorboating. Motorboating creates various physical and chemical disturbances tothe water regime and results in impacts much more significant than swimming, unlessswimming is heavily concentrated. Physical impacts from motorboating include increasedwash, turbulence, cutting action from propellers, direct contact, and disturbance (Liddleand Scorgie 1980). The overall impact of these physical changes on the water regimeare influenced by the dimensions of the water body and the types of habitat it contains(e.g., sensitive versus hardy).
Turbulence from propellers and wakes can cause erosion of the shoreline and can disturbsediment, a particular concern in fish spawning areas. Motorboats, especially those withoutboard engines, create turbulence, which can cause erosion of the shoreline and asubsequent release of nutrients in the sediment (Kuss et al. 1990). Although most ofthese impacts are created primarily by motorboats, turbulence also can result from useof rafts, canoes, and rowboats. In one study, findings revealed that about 0.5 m2 ofvegetation in a shallow lake could be uprooted by the turbulence resulting from one oarstroke (Liddle and Scorgie 1980). Furthermore, Cole and Marion (1988) found that sitesused by commercially outfitted rafting parties had a 50 percent greater area of disturbanceand an area of devegetation that was four times as large as sites used by localfishermen.
Although nonmotorized boats create some physical impacts to the water regime, mostchemical impacts result from motorboating. Chemical impacts include pollution fromoutboard motors—particularly motors of the two-stroke design—and sewage dischargeddirectly from boats into water. Discharge from motors contributes much of the wastegenerated from recreational activities. In an early study of motorboating, Jackivicz andKuzminski (1973) found that, depending on the engine design, two-stroke outboardmotors discharged an average of 10 to 20 percent of their fuel into the water—with someengines discharging up to 55 percent. The high variability in the amount of engine discharge
Boating

24
results from differences in the size of motor, intake and exhaust design, size of crank-case, speed of operation, tuning of the engine, and recycling of crankcase drainage. Thedischarge typically contains raw fuel, nonvolatile oil, volatile oil, lead, and phenols, whichnegatively affect plant and animal species within riparian environments (Stewart andHoward 1968).
In 1970, it was estimated that 100 to 160 million gallons of raw fuel was discharged intowater owing to the inefficiency of outboard motors (Jackivicz and Kuzminski 1973). Newertechnologies in engine design may result in a much smaller discharge and resultingimpact on water; however, motorboats are much more prevalent now than during the1970s, when most of these studies were conducted. As previously discussed underwater-based recreation trends, recreational motorboating has increased 40 percent from1982-83 to 1994-95, with nearly 23 percent of the U.S. population participating in theactivity in 1994 (Cordell et al. 1997). Furthermore, the fact that there were 13.2 millionoutboard motor boats owned in 1997 (National Marine Manufacturers Association 1997),more than almost any other year, indicates that increased efficiency of engines may notbe enough to compensate for the absolute increase in motorboat numbers.
Camping sites along water bodies also are associated with both physical and chemicalimpacts to the water regime as compared to control sites. Physical impacts to waterquality from camping can include many different indicators such as increased soilcompaction; runoff; erosion rates; lower soil moisture; reduced flow of air, water, andnutrients through the soil; higher pH; lower number of roots in the soil; a loss of vegetativecover; and increased eutrophication of nearby water bodies (Green 1998, Lockaby andDunn 1984).
Physical impacts caused by camping and hiking near water have many different inter-related effects. For example, a decline in vegetation near the shoreline leads to a reductionin soil microbial activity in the top 6 inches of soil in disturbed sites versus undisturbedsites (Zabinski and Gannon 1997). In addition, a loss of vegetation on the shore increaseserosion of the shoreline, which in turn can heighten nitrogen and phosphorus loading intostreams, causing eutrophication (Hammitt and Cole 1987). In an examination of the long-term impact of trampling along the waters of Pink Lake, Canada, Dickman and Dorais(1977) found that as recreation visitation grew over a 20-year period, so did the densityof phytoplankton in the lake, which resulted in a reduction in water clarity. Although anobject 16.4 to 22.9 feet beneath the water surface could be seen in 1956, water claritywas reduced to 5.6 feet beneath the surface in 1974.
Research studies differ as to the amount of camping and hiking along water that ispossible without reaching certain levels of physical impacts. Some research findingsdistinguish between impacts from high- vs. low-intensity camping sites. In an Arizonariparian area, Green (1998) found that runoff and sediment loss was significantly higherfrom heavily used camping sites than from lower intensity sites because the high-usesites had significantly less herbaceous vegetation and more soil compaction. Cole andMarion (1988) observed significant differences among high-use and low-use sitesincluding larger areas of disturbance, greater tree damage, greater exposure of mineralsoil, loss of tree reproduction, and greater soil compaction in the high-use sites.However, they also observed dramatic changes in certain environmental indicators in
Camping and Hiking

25
low-use sites, leading the researchers to suggest that the quality of low-use sites is morecomparable to high-use sites than to control sites.
In fact, some studies have found that even light recreational use of campsites has rapidand considerable impacts (Cole 1986, Cole and Marion 1988). These studies suggestthat recreation has a curvilinear relation to site degradation; low or moderate use of asite creates significant impacts, and little additional damage is contributed by higherintensity use (Marion 1995, Marion and Cole 1996). This finding is consistently found inresearch studies conducted across the United States in various habitats, including riparianforests on the east coast and riparian forests of the mountainous Western States thathave a much harsher environment (Cole and Marion 1988, Stohlgren and Parsons 1996).
Another consistent finding from the literature on the physical impacts of camping is thatmost campsite degradation occurs rapidly, within the first year of use. As a result, thecommon management strategy of closing developed campground areas temporarily toallow them to recover is not effective in many back-country locations because camp-grounds deteriorate much more quickly than they recover (Marion and Cole 1996).
Instead, other management strategies could better limit negative impacts to the waterregime. The most important aspects of an effective plan are reducing the number andsize of campsites so that people do not keep expanding outward in areas of highrecreational use (Cole and Marion 1988). Marion (1995) found that reducing the numberof campsites (to the lowest number that could still accommodate high usage) andinstalling firegrates (which constrained people spatially within the campsite area) werethe two most effective strategies for improving campsites overall. These strategies wereeffective because they reduced the area of degradation by concentrating recreation usein established, legitimate campsites. Green (1998) notes that management could reducerunoff by prohibiting particular recreational activities when the activity is most likely toresult in soil compaction. Based on a study of channel changes in the Merced River inYosemite National Park, Madej et al. (1994) suggest that park managers control foottraffic near the river and channel it to more stable locations to reduce erosion, sedimentloading, and channel widening in riparian areas. Because different sites have differentlevels of recreational activity and ability to withstand impacts, managers could usevarious strategies to address possible concerns (Leung and Marion 1999).
Biological and chemical changes from camping and hiking activities on water resourcesalso can impact water quality. Specifically, studies have monitored levels of bacteria(e.g., fecal coliform bacteria), protozoans, and viruses such as Giardia, Cryptosporidium,or Gastroenteritis. High levels of bacteria are typically associated with high recreationuse. For example, improper disposal of human waste can contaminate drinking water orharm human health through direct contact or through transmission of bacteria and viruses(Cilimburg et al. 2000). However, in a review of a 12-year period at a water recreationsite, Nelson and Hansen (1984) observed that increased recreational activity over theyears had not led to a corresponding increase in fecal coliform levels. Because fecalcoliform levels are influenced by various factors including seasonal variations, numberof recreationists, lake currents, and possible supplies of fresh water from upstreamdams, it can be difficult to determine the exact source of higher densities (Nelson andHansen 1984).

26
In general, these studies conclude that the impact of recreationists on water biology andchemistry is often spatially localized around recreation sites and temporally intermittent.Negative impacts are typically concentrated in the immediate location of the campingsite. In a study examining the effect of recreation at two camping sites on water qualityin the Mount Baker-Snoqualmie National Forest in Washington, Christensen et al. (1978)found that although upstream densities were consistently low, densities of total coliforms,fecal coliforms, and fecal streptococci downstream of campsites increased over weekends,when 90 percent of the recreation occurred. Another study in the Snoqualmie NationalForest also found high levels of certain indicators (total coliforms, fecal coliforms, andfecal streptococci, Salmonella and Shigella species) downstream from heavily usedmotorized camping sites (Varness et al. 1978).
Studies also have found that indicator densities differ temporally, and typically correspondto seasonal (i.e., winter levels are lower because of lower recreation use), weekly (i.e.,higher weekend use), and daily variation in recreational activity in the area. Interestingly,both Christensen et al. (1978) and Varness et al. (1978) observed rapid increases in theindicator densities once human use occurred. The rapid rise in these indicators has ledresearchers to suggest that much of the increase in bacterial density is resulting fromdisturbance of the sediment, which as discussed previously, is thought to contain higherlevels of bacteria than surface water. This rapid rise in coliform densities poses somepotential health hazards during periods of intense recreational use.
In general, levels of bacterial and viral populations exceeding regulation standardsappear to be infrequent. In a review of water quality records from water recreation sitesin Arizona’s Tonto National Forest, Nelson and Hansen (1984) found that few violationsin levels of fecal coliform bacteria populations occurred over a 12-year period. However,during periods of peak recreation use, public health concerns are valid. Managementstrategies to address the potential for increased biological and chemical contaminationfrom camping and hiking could include developing facilities or educating visitors aboutproper waste disposal. For example, in a review of the literature on the disposal ofhuman waste in wildland recreation, Cilimburg et al. (2000) found that the most appropriatemanagement strategy to avoid transmission of pathogens or contamination of watersources in wildland recreation is to deposit waste in 6- to 8-inch-deep cat holes about 200feet away from the nearest water source. Because of the possibility for human healthrisks, further examination of the impact of recreation on water chemistry is warranted.
Although swimming is less detrimental to water quality than are other recreationalactivities, swimming can still negatively impact water in three primary ways. First,recreational activities involving body contact, such as swimming, have the potential tointroduce pathogens into water through direct contact. Secondly, swimming may increasebacterial concentrations by creating turbulence that disturbs the bottom sediment, whichmay contain higher concentrations of bacteria than surface water (Hendricks 1971, Kusset al. 1990). Third, swimmers can increase the turbidity of water by eroding the bank atpopular entry points.
Swimming

27
The potential for recreational impacts from swimming are particularly important to considerin reservoirs built primarily as a source of drinking water. In a study examining the potentialimpact of recreational activities involving body contact on reservoir drinking water, Andersonet al. (1998) found that their model predicted possible high levels of Cryptosporidium,rotavirus, and poliovirus during the high recreation use of the summer months. In anothermunicipal water supply reservoir, Wagenet and Lawrence (1974) observed a highlylocalized increase in fecal coliform densities associated with peak recreation use thatexceeded standards for recreational waters. Because increased coliform densities were solocalized and far removed from the location from which water was extracted for municipalpurposes, the authors believed that the reservoir could still be used for dual recreationaland drinking water purposes. However, they also felt that the more significant healthimpact may result from water recreationists coming into direct contact with watercontaining high coliform densities.
In summary, research studies have found that both water- and shore-based recreationhave negative impacts on the water regime. For example, water-based activities such asmotorboating create increased wash and discharge pollutants into the water; shore-based activities tend to impact riparian areas through trampling. The level of impact differsby recreational activity. Studies note that boating has the greatest adverse impacts to thewater regime, followed by camping and swimming. The different types of disturbances towater and the riparian environment are typically categorized as either physical or chemicalimpacts. Physical impacts include propeller action, trampling, and turbulence; chemicalimpacts include increases in bacteria, protozoans, or viruses, owing to direct contact orimproper disposal of human waste.
Most studies suggest that although impacts resulting from recreation occur rapidly, theyare primarily localized in time and space. Research on recreation intensity finds that evenat low recreational levels, some disturbance in the water regime is observed. However,because specific data on recreation use levels are often lacking in recreation impactstudies, it is difficult to accurately and quantitatively specify cause and effect. In general,the management strategy of concentrating camping and hiking recreation (e.g., limitednumber of camping sites, smaller campsites) is probably the best method of minimizingthe overall impact of those recreational activities on water. More research is needed,however, to address the best management strategies for effectively dealing with impactsfrom swimming and, especially boating, particularly because little research has beendone on many of these topics since the 1970s and early 1980s.
Conflicts over competing uses of water—including recreation, municipal uses, industrialuses, irrigation, habitat, etc.—will likely grow in the future.
As noted in the Sustainable Water Initiative, any decision that results in changes to thewater resource will have impacts, either intentional or unintentional, on management ofwater for other uses and values. Because water is a crucial but limited resource, conflictswill increase over water requirements for various uses: urban needs, irrigation, hydro-electric power, recreation, municipal water supply, private ownership of property withwater frontage, and habitat conservation (Naeser and Smith 1995). Proposition 6described the impact that recreational activities could have on water quality for otheruses such as riparian habitat restoration or drinking water supply. However, not onlydoes recreation have the potential to impact the water regime for other uses, but these
Proposition 7

28
other uses of water can have the reciprocal effect of negatively influencing the quality ofwater-based recreational experiences.
Because of the spatial arrangement of both water resources and population growth,there will continue to be a spatial component to the conflicts related to water use. In theUnited States, major urban centers historically have developed adjacent to rivers andother waterways that served as transportation corridors. Today, many cities (e.g.,Portland, Oregon) are proximate to major water sources that are used for drinking water,transportation, hydropower, and recreation. Although conflicts over water use and dis-tribution would have occurred regardless, social trends such as population growth andmigration shifts in the Pacific Northwest will undoubtedly escalate water conflicts in thecoming decades. In particular, population growth and redistribution—especially to aridregions of the Northwest—will bring water conflicts to the forefront more quickly. By2025, the populations of Oregon, Washington, and Alaska are expected to increase byabout 3.4 million people; as a result, limited water resources, whether for recreation ormunicipal uses, will need to be distributed among more and more people, particularly inurban centers.
Rapid population growth only serves to increase both the probability of water shortagesin the future and the difficulty of deciding how to allocate water among different, oftenincompatible, uses. As the United States becomes more diverse (culturally and racially,with an aging population), more people will have different expectations for water use.Furthermore, the continued adoption of new technologies in recreational equipment andthe resulting diversification of recreational opportunities is likely to escalate conflictsamong recreationists, particularly if recreation participation continues to grow (Manning1999).
An understanding of the conflicts related to the distribution of water is importantbecause these conflicts negatively affect water-based recreation. For some recreation-ists, conflicts can lead to reduced satisfaction in an activity, whereas for otherrecreationists, conflict can lead them to engage in coping behaviors in an attempt toevade the conflict. Conflict for an individual is defined as “goal interference attributed toanother’s behavior” (Jacob and Schreyer 1980). The level of perceived conflict is notconstant among all recreationists, but instead differs in response to a variety of factors.An individual’s sensitivity to conflict is often influenced by activity style (i.e., personalmeanings associated with a recreational activity), resource specificity (i.e., the import-ance placed on a particular resource such as a swimming hole), lifestyle tolerance (i.e.,willingness to share resources with members of other lifestyle groups), and mode ofexperience (i.e., preferred ways of experiencing the environment), (Jacob and Schreyer1980). For instance, many individuals have expectations that a recreational experience,particularly in wildland settings, will not involve encounters with other people. Consequently,the discovery that one is not alone in the wilderness can detract from the recreationist’sexperience (Stankey 1973).
Recreation conflict can be classified into three main categories: recreation versus otheruses of the water resource, interactivity recreation conflict, and intra-activity recreationconflict (Schreyer 1990).

29
Although many studies have been conducted on how different logging practices impactrecreation (e.g., visual quality of camping sites) (Brunson and Shelby 1992, Langenauet al. 1980), much less research has been conducted on conflicts between water-basedrecreation and management of the water resource for other uses. Water conflicts canoccur when alternative uses of water are not compatible. For example, water appropriatedfor out-of-stream uses (e.g., irrigation) reduces the flow of water available for recreationalopportunities. There is extensive literature on how flow impacts water-based recreationalexperiences (Shelby et al. 1992b) (see “Proposition 8”); however, we still have littleunderstanding of how industrial or commercial water use, for example, affects decisionsto recreate.
Robertson (1989) noted both direct and indirect impacts on recreation from other uses ofurban waterways. Some direct impacts include private ownership of waterfront propertiesand subsequent development and problems associated with the navigation of large shipsinto commercial ports. Indirect impacts to recreationists include reduced opportunitiesto view wildlife, a reduction in the visual quality of a recreation site, or increased noise(Clark 1986, Robertson 1989). For much of the history of the United States, urban riversand waterways were designated primarily for commercial and industrial purposes overseenby the Army Corps of Engineers (Robertson 1989). With the increase in people recreatingin urban-proximate waters, recreationists have come into conflict with industrial andcommercial activities using the same water resources.
Competing demands on the water resource often alter the quality of the recreationexperience. Using a survey of park visitors to an urban waterway, Robertson (1989)found that two-thirds of recreationists felt that poor water quality, smells from treatedwastewater, and increased siltation detracted from their recreational experience. In astudy examining the impact of commercial and industrial uses of water on recreation ina Midwest urban river corridor, Robertson and Burdge (1993) found that impacts to waterquality associated with commercial navigation and water withdrawals (e.g., siltation,turbidity, water pollution) significantly reduced recreationists’ satisfaction with theirwater-based experience.
The effect that other uses of water have on recreation depends on the extent to whichthe public perceives negative impacts to the water regime. Studies of public perceptionsof water quality suggest that people make determinations about water quality basedprimarily on vision (Smith et al. 1991) and secondarily on smell and touch (Lant andMullens 1991). In a survey of adults in Wisconsin, David (1971) found that people identifypolluted water by the presence of algae, suds and foam, and murky, dark water. Usingphotographic slides of water settings that varied only by water color and amount of litter,Dinius (1981) found that people believe increased litter corresponds to decreased waterquality at the site.
Public perceptions of pollution influence decisions to recreate. Some impacts to thewater regime from other uses may be so great that they eventually displace recreationiststo other locations or convince recreationists to stop their activity altogether. Water clarityis important for swimming suitability. David (1971) noted that the presence of greenscum or algae would prevent 80 percent of recreationists from swimming, whereas thepresence of cans or glass in the water would prevent 70 percent of respondents fromswimming. In a study of swimmers in New Zealand, Smith et al. (1991) found that the
Recreation Versus OtherUses of Water

30
ability to see to 2.2 meters in depth was a necessary distance for 90 percent of recrea-tionists to consider the water suitable for swimming. Similarly, water color influencesrecreation decisions with blue being most suitable, followed by green, and lastly yellow(Smith and Davies-Colley 1992). Perceptions of water quality also influence peopleparticipating in water-based activities that do not involve body contact with water. Whismanand Hollenhorst (1998) found that perceptions of environmental quality along the rivercorridor positively influenced satisfaction for private boaters. In an examination of water-based recreation at Lake Red Rock in Iowa, Robertson and Colletti (1994) found that 45percent of the boaters surveyed had either reduced the frequency of their visits or hadavoided the site altogether because of problems with excessive siltation.
Interestingly, although recreationists use visual cues to determine the level of waterpollution of waterways, water quality measures for gauging public health traditionallyinclude nonvisual indicators such as bacteria levels or toxicity of organic compounds.On the Salt River in Arizona, Nelson and Hansen (1984) found no relation between waterclarity and fecal coliform levels in recreation sites. These findings suggest that efforts toimprove water quality for recreationists will have to include improving visual indicatorsfrom the recreation site such as the amount of litter and the water clarity. Otherwise,water that is considered of good quality by toxicity or bacterial standards, may still beperceived as unclean by recreationists (Dinius 1981).
Most studies on recreation conflict have examined interactivity conflict—conflict thatoccurs among recreationists participating in different activities. Empirical research onwater-based recreation has observed problems between anglers and water-skiers (Gramannand Burdge 1981), anglers and canoeists (Driver and Bassett 1975), and particularlybetween motorized and nonmotorized boaters (Shelby 1980). For example, jet skis oftendisturb people engaged in other recreational activities such as fishing or swimming (Burger1998).
A common finding throughout these research studies has been the asymmetricalcharacter of interactivity conflict: although people participating in a certain recreationalactivity may not mind the presence of recreationists of another activity, these congenialfeelings often are not reciprocated by the participants of the second activity. For example,studies have clearly documented an asymmetric conflict between motorized boaters andnonmotorized recreationists such as canoeists. Although motorboaters are typicallyindifferent or even have positive associations with their encounters with canoeists,canoeists dislike encounters with motorized recreationists (Lime 1977, Shelby 1980). Inthe Boundary Waters Canoe Area of Minnesota, Adelman et al. (1982) found that 71percent of paddling canoeists disliked meeting or seeing motorcraft users, but only 8percent of motorcraft users disliked meeting or seeing paddling canoeists. Furthermore,these motorcraft users typically were unaware that other recreationists were disturbedby their activities. Over 85 percent of these motorcraft users believed that they seldomor never disturb paddling canoeists, although 79 percent of paddlers felt they wereoccasionally or frequently disturbed by motorcraft users. This asymmetrical aspect torecreation conflict complicates management of water resources for recreation.
Interactivity Conflicts

31
Intra-activity conflicts are those conflicts that arise between recreationists who areparticipating in the same activity (Schreyer 1990). Crowding is a well-researched exampleof this form of recreation conflict. For example, in a study of boating on the Cheat River inWest Virginia, Whisman and Hollenhorst (1998) found that 64 percent of commercialboaters and 84 percent of private boaters experienced higher than normal levels ofcrowding. Crowding is defined as a “negative evaluation of a certain density or numberof encounters” (Shelby et al. 1989). Crowding can result from a combination of increasedvisitation, relatively stable facility or transportation infrastructure, and changes in visitoruse patterns such as bus tours (Lime et al. 1995).
Many studies have attempted to document perceived levels of crowding. Shelby et al.(1989) reviewed 35 studies in the United States and New Zealand that used the samesingle measure of crowding (rated along a 9-point scale from not at all crowded to extremelycrowded). The studies had a wide range in levels of perceived crowding by recreationists—from 17 percent of goose hunters experiencing crowding on the Grand River Marsh inWisconsin to 100 percent of boaters experiencing crowding on the Deschutes River inOregon. The review also noted that perceptions of crowding appear to vary by time andseason of use (e.g., holidays, summer), resource abundance or availability (e.g., openingday of fishing season), resource accessibility or convenience (e.g., near populationcenters), and management actions (e.g., management restricting density) (Shelby et al.1989).
It is important to understand perceived crowding because studies suggest that after acertain level of visitation, there is some reduction in the quality of the recreation experience.Particularly in wilderness settings where the opportunity for solitude is considered animportant aspect of the recreation experience, perceived lack of crowding is importantto having a quality recreation experience. An unacceptable level-of-use density has thepotential to drive recreationists into seeking alternative forms of leisure activities topursue.
Recreation substitutability is the degree to which a particular recreational experiencecan be an acceptable substitute for another (Manning 1999). The need for recreationsubstitutes arises when circumstances (such as increased crowding or a limitation onuse) detract from the recreation experience in a fundamental way and compel recreation-ists to somehow modify their leisure activity. The notion of substitutability is importantowing to the multiple demands placed on water resources for both recreation and otheruses. These competing demands (both among different uses or within recreation itself)increase the likelihood that some recreationists will be forced to find alternative forms orlocations owing to management decisions affecting the character of the water regime.
The extent to which there are alternatives to a recreation experience is highly variable.Depending on the characteristics of an activity, “real” choices are limited for thosedisplaced by some management action. For example, deer hunters have fewer acceptablesubstitutes than goose hunters because deer hunters tend to place greater importanceon specific attributes that compose the hunting experience such as social interaction,participation by peers, and importance of obtaining game (Baumgartner and Heberlein1981). When management actions affecting the water regime are envisioned, however,there is often an erroneous and implicit presumption that recreation users can always
Intra-Activity Conflicts
Recreation Substitutability

32
find adequate substitutes by relocating or by participating in another activity. Particularlyfor highly specialized or unique activities such as kayaking, the required presence of aparticular combination of physical and environmental attributes (e.g., gradient, flow,obstructions) might mean that few, if any, readily accessible substitutes exist.
In addition, because of a long history of involvement with a particular place, such as afishing hole, people often form strong bonds with specific landscapes over time (Brownand Perkins 1992). Sites that hold special place meanings for recreationists are oftenirreplaceable, and therefore, the existence of strong place attachments often is sufficientto mobilize people into challenging management decisions perceived as harmful to avalued location. Although place-based sentiments are often overlooked in natural resourcemanagement decisions, the strength of the meanings and ties that people have withparticular places within the natural environment are an important consideration for watermanagement (Mitchell et al. 1993).
Under certain circumstances, if a recreationist is unable to continue participating in arecreational experience, they might find an acceptable substitute by modifying a particularaspect of the experience such as the timing or access to the activity, the resourcesetting, or the resource activity (Brunson and Shelby 1993). Shelby and Vaske (1991)have created a typology of alternatives for recreation substitutability (fig. 3). If a recreationistcan substitute a different time for conducting the activity or a different means of gainingaccess to the resource (fig. 3, box A), the same activity and resource setting can beretained. However, if the resource setting is kept constant, but the activity is changed(box B), the recreationist has undergone an activity substitute (e.g., switching fromfishing to swimming in the same lake). A resource substitute (box C) occurs when arecreationist moves to a new resource setting yet continues participating in the sameactivity (e.g., switching from fishing in a lake to fishing in a river). Finally, if a recreationistchanges to both a new setting and a new activity, such as switching from fishing on ariver to swimming in a lake, they have made a resource and activity substitute (box D).
Research on recreation substitutability has discovered that activities considered to besimilar activity types (e.g., waterfowl hunting and deer hunting) are not necessarilyequivalent substitutes from the recreationist’s perspective (Baumgartner and Heberlein1981). As a result, recent studies place greater emphasis on understanding therecreationist’s subjective judgment as to what makes an acceptable substitute to a
Resource
D. Resource and activity substitute
B. Activity substitute
A. Temporal/strategic substitute
C. Resource substitute
Different
Same
Activity
Same Different
Figure 3—A typology of substitution alternatives (Shelby and Vaske 1991).

33
recreation experience. In particular, research suggests that instead of altering activities,recreationists typically attempt to substitute a different setting, time, or access method(Manfredo and Anderson 1987, McCool and Utter 1982). For example, if a free-flowingriver was converted to a reservoir, river recreationists were more likely to seek otherrivers on which to float as opposed to boating in the reservoir. As a result, changes inthe management of any one area can have profound consequences on other similar,nearby riparian areas to which recreationists become displaced.
Our understanding of recreation substitutability suggest that it is important to know howany given management action relative to the water regime might affect recreation. Thiscould include the possibility of actions that create substitutes for recreation opportunitiesthat are lost elsewhere. For example, the loss of a reservoir because of a decision toincrease flow for power or salmon restoration could possibly be offset by the creation ofa reservoir elsewhere. In other cases, negative consequences resulting from managementactions cannot be offset by creating or locating a substitute. The potential for affectingrecreationists illustrates the importance of having a sound understanding of both thepreferred and minimum conditions of attributes associated with different recreation activities.It also suggests that we should have available comprehensive inventories of waterresources that transcend organizational boundaries in order to define locations ofpossible substitutes. Finally, it highlights the importance of a planning framework thatfacilitates an understanding of cross-sectoral impacts and consequences (e.g., Clarkand Stankey 1979a).
There is a paucity of research that examines how natural resource managers can reduceconflicts between water-based recreation and other uses of water. More work in this fieldis needed. Instead, most research on water management strategies for reducing conflictswith recreation is limited to inter- and intra-activity conflicts. In particular, most of thisresearch is concerned with how to reduce crowding of recreation sites in order to avoidexcessive damage to riparian habitats or to avoid reducing the quality of the recreationexperience. A reduction in the quality of a visitor’s recreation experience can lead todisplacement of recreationists to a different area of the site, a different time, a differentlocation, or to altering their recreational activities altogether (Robertson and Colletti1994). From a manager’s perspective, it is important to understand the impacts ofrecreationists becoming displaced from one setting to another or from one activity toanother so that unintended consequences such as site degradation are not simplytransferred to a new location.
Managers often have to decide whether to minimize crowding (or a recreationist’sperception of crowding) by redistributing use, promoting off-peak times, or limitingoverall use. Before restricting access by limiting overall use, managers can first attemptindirect or direct methods to limit visitors or visitor damage (Bates 1992). Indirectapproaches attempt to modify behavior without regulations that limit a person’s choice.For instance, if the behavior of recreationists is a problem, providing education andinformation may reduce visitor damage. Educational programs that establish a code ofconduct and increase tolerance of different recreational groups and activities also couldreduce conflict (Manning 1999). In addition, informing recreationists about the numbersof people using a resource gives visitors the opportunity to choose alternative sites inwhich to recreate. However, when increased visitation is the underlying problem affectingthe resource or the perception of crowding, these indirect methods of limiting visitorsand damage may be inadequate.
Management Implications

34
Under these circumstances, direct options—which apply regulations to affect behavior—are often necessary. A more direct method of reducing visitation is accomplishedthrough implementing a limited visitor permit system (e.g., allocating boating permits onlimited-entry rivers) (Bates 1992, Shelby 1991). The system of distributing these limitedpermits can include advance reservation; lottery; first come, first served; price; merit;zoning; and priority for first time users (Shelby 1991, Wikle 1991). For example, a price-based system, which is commonly used, requires a user fee to recreate at the site,whereas a lottery system distributes permits randomly in an applicant pool.
The type of system applied is important because it will determine the pool of recreationiststhat are willing and able to continue participating in these recreational activities. A userfee system may discriminate against lower income individuals, whereas a reservationsystem would not work well for people who do not plan for their recreation far in advance.Differences also can exist between the preferred rationing policies of recreationists andmanagers. In a study examining opinions of recreationists and managers about threepolicy scenarios, Wikle (1991) found that although river users were more likely to acceptadvance reservation and merit as rationing policies, managers were more likely to preferzoning. For this reason, it is important to consider on what information (and from whatsources) water management decisions are based.
In addition, other conflict management strategies, such as binding arbitration, facilitation,mediation, and nonbinding arbitration, also can successfully resolve natural resourceconflicts. These dispute-resolution techniques differ primarily in the level of responsibilitythat the facilitator has over the process and in the level of obligation to accept theoutcome (Susskind and Cruikshank 1987), and so the choice of assisted negotiationtechnique used often will depend on the level of conflict and complexity of the naturalresource issues under dispute.
In summary, population growth and redistribution in the United States suggest that waterconflicts will continue to escalate in the future. In this proposition, three types ofrecreational conflict were explored—conflict between recreation and other uses of water,interactivity conflict, and intra-activity conflict. Among these three forms of recreationconflict, much more is known about the variety of management techniques for reducingor avoiding intra-activity conflicts over crowding. However, much less is understoodabout how conflicts between water-based recreation and other uses of water are resolved.Because it is likely that much of the future conflict and debate over water managementwill involve diverse uses of water, we need a better understanding of the relation betweenwater-based recreation and other uses of water and how management can reconcile theirdifferent water needs.

35
Management alterations of flow regimes can have a substantial impact on water-basedrecreation opportunities and experiences.
At the same time that conflicts over out-of-stream uses of water such as irrigation ordrinking water have increased, greater attention is being given to maintaining instreamflows for various purposes. Instream flows affect many uses of water includinghydropower, recreation, navigation, transport of waste materials, and fish and wildlifehabitat (Narayanan 1986). Conflicts over streamflow result from different water uses (andeven different recreational activities) requiring different optimum levels of streamflow.For example, increasing flow in the upper Arkansas River for rafting reduced the qualityof fishing experiences on the river. More rafters decreased the angler’s desired solitude,and the increased flow diminished the fishery (Naeser and Smith 1995). The diversity ofpreferred streamflow levels suggests that decisions about tradeoffs among these differentuses are necessary.
In recent years, much study has focused on the relation between streamflow and fisheries.In the Pacific Northwest, changes in the level and timing of instream flows as a result ofhydroelectric dam construction have contributed to declines in anadromous fish populations.Although streamflow also affects water-based recreational experiences, only recently hasa substantial body of literature addressed the impact of flow on recreation (Shelby andWhittaker 1995, Shelby et al. 1992b). However, understanding the interaction betweenwater-based recreation and streamflow is more important than ever as the Federal EnergyRegulatory Commission (FERC) begins relicensing many hydropower projects.
Although the Federal Power Act initially gave the FERC considerable flexibility inlicensing nonfederal hydroelectric power projects, Congress and the courts haverecently established progressively more restrictive procedural requirements for thecommission (Spence 1999). These new regulations require the FERC to give environmentalconcerns more consideration in their deliberations over dam relicensing applications.Specifically, the Electric Consumers Protection Act of 1986 requires the government toconsider fish and wildlife habitat, aesthetics, environmental quality, protection ofarchaeological sites, and recreation as much as it did energy development (Baker 1994,Burkardt and Lamb 1997). It requires the FERC to assess the impact of hydropowerprojects and, if necessary, to deny the application outright or to require conditions bemet for approval (Baker 1994). Although relicensing of hydroelectric power projectstypically occurs every 30 to 50 years, many projects are scheduled for renewal in thenear future (Baker 1994). For this reason, it is even more important that we have a clearunderstanding of how streamflow influences water-based recreation.
The influence of streamflow on recreational opportunities and experiences is oftensubstantial. Variations in flow have a strong influence on various recreational experiencesincluding fishing (Loomis et al. 1986), rafting and floating (Shelby and Whittaker 1995),and hiking along rivers (Shelby et al. 1997). Many water-based recreational activitiesrequire a minimum streamflow. Whitewater rafters are particularly limited by streamflowin their attempts to find suitable rivers (Shelby and Lime 1986). Rapid fluctuations inriver flow from changing dam operations also impact water-based recreational activities.Cole (1989) revealed how unanticipated changes in streamflow owing to higher than
Proposition 8
The Impact of Flow onRecreation

36
expected releases of water can influence a floating trip when he described waking onemorning and witnessing the Colorado River sweeping through his campsite.
Studies of streamflow and recreation often include both a descriptive component and anevaluative component (Shelby and Heberlein 1986). Descriptive components involveobjective information about the resource (e.g., number of rapids in a river) and how man-agement affects these characteristics. Evaluative components describe how humansreact to descriptive components (e.g., low flows may be too easy for whitewater raftersor may prevent use completely) and are used to determine which of the descriptiveconditions are the most or least desirable for recreation. Through an examination of bothdescriptive and evaluative components, researchers have found that changes instreamflow affect recreational experiences in various ways.
Streamflow impacts recreation by altering the safety of recreational activities and recrea-tionists’ perceptions of crowding, scenic beauty, and recreational satisfaction or quality(Shelby et al. 1992b). Streamflow can increase the danger of certain water-basedrecreational activities (such as the difficulty of rapids) or recreationists’ perceptions ofsafety. In an Arizona river, Moore et al. (1990) found that as streamflow fell below 23cubic feet per second (cfs), visitors were more likely to treat creek water before drinkingit. Because changes in streamflow can alter the safety of recreational experiences, whata recreationist perceives as an acceptable level of flow often depends on theirexperience and skill level. In a study of the flow preferences of backcountry hikers inZion National Park in Utah, Shelby et al. (1997) found that challenge-oriented hikersbelieved high streamflows were more acceptable than did scenic hikers whose skilllevels were low to intermediate. Depending on whether hikers desired a scenic hike or achallenging hike, the acceptable level of flow ranged between 30 and 150 cfs, owing tothe increased difficulty associated with crossing rivers at high streamflow.
Streamflow also affects recreationists’ perceptions of crowding. In a study of private andcommercial boaters, Tarrant and English (1996) observed a negative relation betweenperceived crowding and flow on the Nantahala River of North Carolina. Assuming aconstant level of perceived boater crowding, an increase in flow from 400 to 600 cfs wasshown to allow for an additional 670 private boaters on the river. Research also hasshown that streamflow influences recreationists’ evaluations of the scenic beauty of thesurrounding environment. Using video sequences from the Cache La Poudre River inColorado, Brown and Daniel (1991) observed a concave relation between flow and scenicbeauty with lowest scenic beauty evaluations at very low and very high water flow levels,and the highest scenic beauty rating around a medium flow level of 1,300 cfs.
The relation between streamflow and recreationists’ satisfaction with the quality of therecreational experience has been explored in greater depth. Whisman and Hollenhorst(1998) found that waterflow levels and related adventure experiences had a relativelystrong impact on whitewater boating satisfaction. In the Aravaipa Creek in Arizona,Moore et al. (1990) discovered that as streamflow decreased below the median flow,there was a 45-percent greater chance that recreationists would find water levelsunacceptable. In a study of whitewater recreation, Herrick and McDonald (1992)examined the effects of eight independent variables on visitor satisfaction with theirrecreational experience and noted that satisfaction was most affected by the settingcharacteristics, such as waterflow and number and difficulty of rapids.

37
Figure 4—Relation between recreation quality and streamflow (Shelby and Whittaker 1995).
2
1
0
-1
-2
0 200 400 600 800 1000
Una
ccep
tabl
eA
ccep
tabl
e Optimum flow
Marginal flow Maximum flow
Range of acceptable flows
Flow in cubic feet per second
Flow evaluation curves are used to quantitatively assess recreationists’ evaluations ofconditions at various levels of streamflow. In research studies, evaluations of flow oftenfollow a bell-shaped or an inverted U-shape (fig. 4), with very low and very high flowsbeing least acceptable for recreationists and intermediate flows contributing to thehighest levels of recreational quality (Shelby et al. 1992a).
Although flow evaluation curves typically follow an inverted U-shape, the optimum flowlevel in cubic feet per second differs depending on the skill level of the recreationists orthe recreational activity. For example, the acceptable level of flow for hikers may be toolow for boating; both groups of recreationists have similar, bell-shaped flow evaluationcurves, although over different magnitudes of flow. In this way, different recreationalactivities have different “niches” of acceptable flow. On the Dolores River in Colorado,Shelby and Whittaker (1995) observed large differences in the flow evaluations of visitorsusing open canoes as compared to other watercraft (e.g., large and small rafts andkayaks), with open canoeists more likely to desire lower flow levels. Furthermore,greater agreement on minimum level of flows was observed as compared to agreementover optimum levels of flows. Research studies on flow and recreation also have foundthat specific elements of a river trip—such as time to reach camp, availability ofcamping sites, safety of rapids, or the challenge of the trip, are affected differently byflow and therefore have different levels of acceptable flow (Shelby et al. 1992a, 1998).Because the level of acceptable flow in cubic feet per second is dependent on so manyvariables, including the unique attributes of streams or rivers, it is not possible togenerate a quantitative number for flow that can represent the optimum level ofstreamflow across all recreational activities or river types.

38
Because optimum streamflow varies by activity, it is important for research studies toexamine the relation between flow and various water-based recreational activities.Although some studies have examined the impact on fishing from reduction of flowowing to hydropower development or irrigation (e.g., Johnson and Adams 1988), moststudies examining the relation between streamflow and recreation have focused onrafters and boaters (see Brown et al. 1991, Shelby et al. 1992a for reviews) and, to alesser extent, on hiking or swimming (e.g., Moore et al. 1990). More work on the effectof streamflow on various recreational activities is needed. Managers who releasedifferent amounts of water from dam-controlled rivers offer an opportunity for researchersto examine the relation of flow to recreation by observing the subsequent advantagesand disadvantages to various water uses. An ideal controlled flow experiment wouldinclude the release of a full range of flows while recording recreationists’ responses tothe different flow levels. As a result of the FERC relicensing process, controlledexperiments are more easily arranged, although many difficulties (e.g., inability torelease a full range of flows) could limit the potential of this approach (Shelby et al.1998, Whittaker et al. 1993).
Natural resource managers may have some influence over streamflow levels and theresulting impacts on recreation. Under some circumstances, water from high springrunoff can be stored and released in summer when flows naturally decrease (Brown andDaniel 1991). However, one of the management difficulties is that flow often is subject todemands from users who own proprietary rights to the resource (Naeser and Smith1995). If managers are not able to manipulate flow to achieve a desired level, managersinstead could provide recreationists current and accurate information on flow levels sothat recreationists could make informed decisions (Whisman and Hollenhorst 1998). Incertain circumstances, recreationists could substitute different activities when manage-ment decisions affect streamflow, such as when a formerly free-flowing river with itscorresponding recreational activities becomes a reservoir with a different set ofrecreational activities.
Owing to various uses of water, it is unlikely that complete agreement on optimum flowlevels is possible. However, managers should still try to combine research recommend-ations about the acceptable or necessary flow levels for recreation with the necessaryflow levels for other uses of water such as fish habitat or channel maintenance so as toproduce the best decision with the available information (Shelby et al. 1992a).
Implications for Researchand Management

39
IntegratingRecreation and WaterResourceManagementPremises and Challengesto Integrated ResourceManagement
A fundamental premise of an ecosystem-based management approach is that naturalresource systems and human systems are linked; i.e., actions taken in one system willaffect both systems. For example, a decision to alter riparian management will affectboth natural resources (stream conditions and adjacent vegetation) as well as the humanuses and values associated with that particular location. However, there is often muchuncertainty surrounding these complex interrelations, making it difficult to predict theeffects, particularly at the secondary and tertiary level, of any given action. This highuncertainty increasingly typifies natural resource management actions, increasing, inturn, the possibility of undesirable, unanticipated, or even irreversible effects stemmingfrom such actions.
A second fundamental premise is that implementation of more-informed natural resourcemanagement programs and policies is constrained by the lack of effective institutionalstructures and processes (Cortner and Moote 1994, Ingram et al. 1984). This is particularlythe case in water resource management; even a cursory literature review reveals problems
Figure 5—Interrelated processes (physical, ecological, and socioeconomic) occurring within watersheds of the Pacific Northwest (From LaneCouncil of Governments, Eugene, OR).

40
related to antiquated laws, inefficient pricing schemes, gaps in or overlapping of admini-strative authority, and ineffective public educational programs.
Thus, a major challenge facing resource managers is developing planning and manage-ment frameworks that more effectively identify and accommodate uncertainty and thatfacilitate the delivery of informed action. More specifically, the challenge is in developingways to strengthen the process of making informed choices about resource manage-ment objectives and actions. In particular, how can we gain an improved sense of theconsequences and implications associated with a given decision or action, especiallywhere the effects of decisions are often distributed across other resource managementsectors and over space and time?
To help clarify the nature of this problem, consider the panoramic landscape shown infigure 5. This reveals a diverse and complex landscape, varying in topography, land use,vegetative cover, weather, and so on. Although not explicitly shown, it also likely involvesa variety of jurisdictions and tenures. Across this landscape, various decisions andactions are underway, often with little or no knowledge of one another, let alone the kindsof consequences and implications each might hold for the other. For example, decisionsto road or log highland regions will have biological consequences not only for the specificlocales in which these actions take place but for the lowlands and associated riverinesystem. The practice of agriculture will produce downstream consequences for otherriver uses and users: municipal water supply, recreation, and fish. Similarly, the decisionto promote recreational use of the reservoir might require the need for further water treat-ment or result in impacts on the amounts and timing of water releases over the dam.
It is apparent a complex array of interactions and consequences are unfolding at anygiven time in the drainage portrayed in figure 5. In actuality, however, it is even morecomplex because the effects associated with the examples noted above also extendbeyond the boundaries of the drainage; moreover, these effects might only becomenoticeable over an extended period.
The problems of identifying, let alone assessing, the many effects of any resourcemanagement decision across a range of spatial and temporal scales, multiple sectorsand tenures, and which involve a host of values and uses, are formidable, perhaps tothe point of either producing paralysis or the simple decision to ignore the consequencesbeyond the immediate location, time, and sector. Increasingly, however, these approachesare untenable, given widespread and intensive public scrutiny and an increasinglydemanding legal environment.
Such issues are particularly apparent in the management of water resources, in partbecause of the crucial role of water as an element of environmental quality, culturalidentity, and economic activity and because of its fluid nature; i.e., it moves across thelandscape irrespective of who claims jurisdiction or what land uses are involved. Indeed,it is these very qualities that are responsible in large part for this Sustainable WaterInitiative.

41
The challenges of dealing with such complex interrelations attract attention among man-agers and scientists interested in natural resource-based outdoor recreation. Beginningin the early 1970s, concern among both natural resource managers and recreationresearchers began to emerge over the need for an improved planning framework toaccommodate recreation and various other land management activities and issues. Forexample, decisions about transportation systems, often driven by engineering andtimber management concerns, could lead to significant impacts, both positive andnegative, on recreation uses and opportunities. Decisions to build roads in a previouslyinaccessible drainage could open up new recreation opportunities for camping or hunting;however, it could simultaneously eliminate other types of uses and values. However,functional planning systems and the lack of processes and frameworks that encouragedand facilitated more integrative, holistic, and comprehensive thinking often led toquestionable decisions that had adverse effects on people and resources.
Similar issues confront the relation between water resource management and recreation.For example, in the Pacific Northwest, management actions taken to achieve the objectivesof the aquatic conservation strategy (ACS) have emphasized closure of riparian zones.However, in many cases, these areas are also popular recreation venues experiencingsignificant levels of recreation use. Although such use impacted the riparian setting(e.g., loss of streamside vegetation, erosion), many impacts have long since stabilized.With closures to facilitate biophysical restoration, however, these traditional recreationvenues are no longer available. Such closures have resulted in vegetation recovery inmany areas; whether significant gains in other environmental variables crucial toachievement of the ACS objectives have occurred is unclear.
Even less clear is the nature of the consequences and implications of the site closureson recreation use. In short, what has happened to the use and users who once came tothese locations? Have they moved into adjacent drainages or stream stretches wheresuch closures are not yet in effect? And if this was the response, what are the associatedimpacts on these newly occupied areas; have the impacts on vegetation, soil, and waterthat once occurred in the now-closed area simply been displaced to some new location?In general, information about the consequences of such policies and management actionsare poorly understood, or completely unknown. Inadequate planning frameworks that failto facilitate a more comprehensive and integrated assessment of problems, alternatives,consequences, and implications exacerbate the problem.
A framework is “a structure for supporting or enclosing something else . . . it is a fund-amental structure, as for a system of ideas” (Houghton Mifflin 2000). Another way tothink of a framework is to conceive of it as a kind of “mental scaffold” that provides away of thinking about problems; a framework should help frame the issue, consideralternatives, understand relations, and consider implications and consequences. Aframework also should help identify alternative ways to state problems, describe whoand what values and uses might be affected by a decision, and identify the nature ofimportant links with other actors, events, and institutions. Finally, frameworks shouldhelp make explicit the assumptions that underlie proposed policies and actions (Stankeyand Clark 1998).
In short, a framework should focus, facilitate, and inform the decisionmaking process. Itshould help ensure a thorough problem-framing process; i.e., it clarifies the variousparticipants’ assumptions and preconceptions about the various problems requiring
Developing an IntegratedFramework forManagement of theWater Regime

42
attention, thereby increasing the likelihood that efforts to resolve the problem areappropriately focused. An Interaction Associates (1986) report claims that a largeproportion of the effort spent on problem solving ends up solving the wrong problem,stating the problem so that it cannot be solved, solving a solution, stating the problemtoo generally, or trying to reach agreement on the solution before there is agreement onthe problem.
Appropriate processes and structures that help achieve the above conditions facilitateproblem solving; e.g., venues and processes that encourage clarification of assumptionsunderlying how one understands a problem (Bardwell 1991). All too often, such processesand structures do not exist; not uncommonly, barriers to developing such commonunderstanding exist, including the functional organization of agencies and the underlyingbudgetary processes. Finally, the framework should help ensure that those charged withmaking decisions and choices have a comprehensive understanding of the alternativesbefore them, the consequences associated with those choices, and the implications ofalternative choices.
The roles and functions that frameworks should perform also suggest something of theattributes that should characterize them. First, it is important that a framework facilitatea collaborative approach to problem definition, framing, and solution. By collaborative,we mean that it fosters participation by diverse interests, perspectives, and parties.Wondolleck and Yaffee (2000, p. xiii) citing the work of Gray (1985, p. 912), define threecomponents of a collaborative process: (1) the pooling of appreciations or tangible resource,e.g., information, money, labor, etc., (2) by two or more stakeholders, (3) to solve a setof problems that neither can solve individually. To facilitate the choice process, a frame-work must help articulate not only the problem-framing process but also identify availableresources and capacities that exist in order to fashion solutions.
Second, a framework needs to be integrative in nature. In reviewing the extensive bodyof literature on the relation between recreation use and the water regime, it is apparentthat a diverse range of academic and disciplinary perspectives are involved; the bio-physical sciences of hydrology, engineering, silviculture, wildlife management, andchemistry meet and mingle with the social sciences of psychology, sociology, politicalscience, and geography. Moreover, these disciplinary perspectives play out against acomplex administrative and cultural background in which various rules, laws, policies,and norms are in effect. Both the nature of the problems that one can tease out fromthis complex web as well as the range of possible alternative solutions used affect, andare affected by, the multitude of individual components. For example, the decision tobuild a road on a drainage produces impacts on local hydrology that affect the flowregime, which affects the type and timing of recreation use, which can affectdownstream water quality, and so on.
Third, a framework should facilitate thinking and analysis at multiple scales, includingboth spatial and temporal and across multiple jurisdictions. The sources of influence onthe water regime, for example, often extend far beyond the drainage where the waterbody is located. Changes to the water regime often produce consequences far beyondthe drainage basin, and some impacts only become apparent long after the managementaction occurs. Finally, if the scope of analysis becomes restricted to only those landsadministered by the managing agency, it is easy to miss both sources of impacts, aswell as consequences of actions.
Key Attributes of aFramework

43
Finally, a framework must emphasize the need for an adaptive management approach.As noted earlier, risk and uncertainty characterize many of the decisions to which aframework might be addressed; in addition, problems evolve and change, new informationappears, the sociopolitical environment changes, new technologies appear, and so on.This means there is a need for ongoing learning and adaptation to these new conditions.The framework needs to both acknowledge the need for an adaptive approach as well asto facilitate creation of the structure and processes that promote adaptation. This beginswith clear problem definition, the explicit specification of assumptions, documentation ofhypotheses and anticipated results, and an ability to portray and compare what isexpected with what occurs.
As the preceding review and synthesis of the literature reveals, there are complex linksbetween water and recreation use. Changes to one component (e.g., recreation access,flow regimes) can produce significant consequences for other components; such changesalso can have effects beyond the water and recreation sectors. These are not necessarilynegative; e.g., altering flow regimes for the purpose of salmon restoration also couldresult in conditions conducive to certain types of recreation. However, the opposite isalso true; often, the nature, extent, and consequences of these secondary or tertiaryeffects are taken into account or even recognized. This problem has persisted for manyyears and has attracted considerable attention among managers and researchers whohave come to realize that the pressing need was not so much for more data but ratherfor a framework to better identify, display, assess, and evaluate interrelations, impacts,and consequences.
This concern led to development of the recreation opportunity spectrum (ROS) (Clarkand Stankey 1979, Driver and Brown 1978). The ROS was grounded in the need for animproved framework within which the effects of changes in resource management uses,policies, and actions on recreation opportunities could be better identified and, whenadverse, mitigated or prevented. Recreation opportunities were defined as the combinationof biological, physical, social, and managerial conditions that give recreational value to aplace. Thus, rather than a traditional focus on recreation uses and activities, the ROSgave particular attention to the settings in which these uses and activities occurred. Thishad the advantage of focusing attention and action on resource settings and conditions;it enabled managers to begin to consider how changes (e.g., a new road to serve atimber sale) might affect existing or potential recreation settings and the recreationaluses and experiences associated with those settings.
The ROS highlighted the role of management objectives in order to evaluate the conse-quences of any given change. Some frame of reference as to what conditions weredesired was necessary in order to frame options. For example, a new road might beseen as having an adverse consequence for existing recreation opportunities (e.g.,because it led to increased use of a “primitive” opportunity). However, these adverseconsequences might be prevented or mitigated by design considerations (e.g., wherethe road was to be located, the design standards to which it would be built, the rulesgoverning access to the road, the timing of when haulage would be permitted, etc.).Alternatively, the road might be seen as a way of fostering a new, perhaps highlydemanded kind of recreation opportunity, featuring motorized access. This option, inturn, required an assessment of the existing supply of such opportunities, the managingorganization’s capability and role, and various other factors. In short, the ROS provided

44
a systematic, deliberate, and purposeful way of thinking about the relation of recreationmanagement with other resource management activities.
A key element of the ROS framework was its operationalization of recreation opportunitysettings: by varying the level and character of specific attributes of the setting, each ofwhich was subject to management control or influence, the framework provided a “commonlanguage” for discussion among various specialists, be they in silviculture, wildlife, waterresource management, or recreation. For example, recreation settings could be describedin terms of the type and level of access, the nature of other resource managementactivities appropriate to that setting and type of use, the types and levels of recreationuse, or the nature of appropriate site management. This facilitated the ability of managersto see how a proposed action or policy might alter the nature of that setting and howthat, in turn, would affect the nature and level of recreation use. Conversely, actionsproposed for the recreation site could be analyzed in terms of how they might affectother resource uses and values.
The ROS framework was designed to deal, in general, with problems related to the man-agement of recreation and the integration of recreation with the management of othernatural resource sectors, such as timber and road construction. However, the potentialapplication of these tools to improve the link between recreation and management ofwater and riparian systems seems obvious and apparent. For example, it would bepossible to identify explicitly the kinds of changes to recreation opportunities and keyattributes associated with specific water or riparian management actions. As notedearlier, there are many areas in the Pacific Northwest region where extensive riparianclosures have taken place. However, such closures often have resulted in the loss of key,favorite recreation settings used by families and friends for many generations. With theseclosures come a number of problems. The displaced use might have moved elsewhere,with a consequence that the impacts on riparian and aquatic systems simply have beenmoved from one place to another. Another possibility is that these users have “droppedout”; a consequence of this result is unhappy citizens who seek redress throughadministrative appeals or litigation. This in turn can mean that legitimate resourcemanagement objectives become subject to overturn; at a minimum, it can lead toincreased distrust and acrimony between citizens and managers.
With use of the ROS planning framework, such undesirable outcomes might have beenprevented or mitigated. Initially, it could have helped foster a more thoughtful, deliberativediscussion about the extent to which a complete closure was needed. For example,would closures only at certain times, or in particular places have been more useful?Were other management alternatives possible (e.g., site design measures to restrictdirect access to streambanks) and, if so, how might they have been implemented toboth protect the riparian resource as well as the experiences of users? If closures wereneeded, what kinds of information, delivered to whom, might be appropriate to offsetadverse public reactions? If users will be displaced, are there real substitutes for theselocations? People often have long-standing attachments and histories with particularplaces; simply finding another stream stretch where someone can set up a tent mightnot constitute a legitimate alternative. If substitutes are available, what kinds ofmanagement actions are appropriate at these locations to prevent another wave ofunacceptable resource impacts from developing? This latter question points out theneed for coordination within, as well as outside, the managing organization (e.g., if thealternative locations are on state or private land).

45
The ROS framework also helps develop relevant indicators of resource impacts andspecific standards of conditions associated with specific management actions. Forexample, the ROS framework helps identify how the biophysical impacts associatedwith recreation use might be managed. A key assumption in much recreation manage-ment is that resource impacts in recreation settings are unacceptable. However, both thescientific literature on the recreation use/impact relation, as well as studies of recreationvisitor attitudes, challenge such an assumption. Recreation impacts (e.g., soil compaction,vegetative loss) are inevitable; any use produces impacts. Moreover, depending on therecreation opportunity, as specified in area management objectives, and the types ofrecreation use involved, such impacts might either constitute a major need for manage-ment intervention or be of no consequence at all. Thus, in the case of water-basedrecreation, we might examine the utility of such indicators as water quality, visibility, andtemperature and how changes in these conditions might impact different types ofrecreation opportunities.
Clark and Stankey (1979b) argued that in developing measures of what constitutesappropriate and inappropriate impact, it was necessary to distinguish between the mag-nitude of the impact and its importance. Magnitude refers to the quantitative aspect ofthe phenomenon under study. Typically, independent observers can reliably measure it.Importance, on the other hand, reflects a value judgment assigned to some phenomenon,such as vegetative loss or water pollution. Two individuals observing the same mag-nitude of impact can differ greatly in the importance they assign to that impact. In turn,these different judgments could lead to very different management responses (e.g., seeDriver and Bassett 1977, Wollmuth et al. 1985).
Using sound as an example, Clark and Stankey (1979b) describe how the ROS frame-work could help managers. In this case, sound is a physical phenomenon susceptible toobjective, quantitative measurement. When either the level of sound, or the particularform of sound, are judged as inappropriate or unacceptable, they are defined as “noise,”a measure of importance. As one considers a given level and source of sound (e.g.,highway traffic), and reflects on them across different kinds of recreation settings(ranging, for example, from a highly developed car access campground to a wilderness),one finds that what constitutes “noise” changes dramatically. In a wilderness, anymechanized sound, irrespective of the decibel level, is often defined as noise. In a highlydeveloped campground, sounds not noticed at mid-day might become noise at 2 a.m.
The ROS framework therefore can help managers in thinking about, and developingappropriate management responses for, a particular type of impact. It forces an explicitconsideration of assumptions (e.g., the idea of “no impact”), it requires managers tothink across functional and jurisdictional boundaries (e.g., what types of sounds, theirorigin), and it provides the opportunity for consideration of alternatives (e.g., banning thesource, buffering its effects, altering its timing, informing users about it, etc.).
A final benefit of the ROS, as noted in the above discussion, is that it helps makeexplicit the underlying assumptions and value systems of those involved in the manage-ment decisionmaking process (Driver et al. 1987). These assumptions and values areoften ignored even though they are a major driving force in the kinds of actions, policies,and programs that are initiated. For example, the belief that all human-induced impact is

46
“bad” and should be controlled at all costs can easily lead to an onerous, regulatory-ridden management regime that might or might not produce any desirable benefits forthe very values, conditions, or species they are designed to protect, while at the sametime producing high costs for recreationists.
However, the usefulness of the ROS in dealing with the complex problems associatedwith recreation and water is dependent on the availability of sound, reliable information. Forexample, as the previous discussion in this report details, we lack basic understandingof such fundamental descriptive information as the types, levels, and distribution of existingrecreation use. We similarly lack an understanding of the extent to which attributes ofnatural resource settings, such as specific flow regimes for kayaking, are essential toan activity as opposed to simply preferred. Also limited is the ability to describe thenature of the cause-and-effect relations that exist between and among recreation usesand water; the ability, for example, to describe the specific impacts associated withparticular patterns, types, or levels of recreation use on water and riparian settingsgenerally is poor. The lack of basic information about both supply and demand elementsof outdoor recreation resources and use compromises our ability to use frameworks,such as the ROS, in an effective manner.
Other constraints affect the capacity to deliver effective decisionmaking. For example, ithas become increasingly obvious that land management organizations are faced withserious challenges of organizational capacity and memory; for the ROS framework, weroutinely find that despite the widespread use (and understanding) of these tools thatwere commonly found 5 to 10 years ago, much of this experience and knowledge is nowlost. The continued functional structure and funding of resource management organizationsalso constrains the ability to think and act integratively; such institutional constraintsoften prove difficult to alter, despite their impact on more effective planning andmanagement (Clark et al. 1999).
This report examines water-based recreation as a proxy for understanding social valuesand uses of water in the Pacific Northwest. Our investigation of the reciprocal relationbetween recreation and the water regime has improved our understanding of the state ofknowledge surrounding these issues and of the potential challenges facing recreationand water management.
One primary finding is that future management of the water regime will be greatly influencedby external influences (regional, national, and global) beyond the control of management.Much of the predicted change in future recreation patterns will result from demographicshifts occurring across the country, including the migration of residents from EasternStates to the West and the rapidly aging population. Furthermore, technological advancesallowing people to recreate in locations distant from their primary residence increasesthe potential that nonresident recreationists will strongly influence the future direction ofwater management in the state (e.g., Alaska). Because these drivers of change will greatlyaffect recreation, an understanding of social trends is critical for anticipating andpreparing for future recreation demand. Although the complexity associated with thecombined impacts of demographic and technological variables make accurate forecastsdifficult, sufficient data are available to anticipate the trajectory of some of the keysocial and demographic trends influencing recreation.
Conclusions

47
In contrast, a fundamental problem facing water management for recreation is thepervasive lack of adequate data on various aspects related to recreation use, includingwho recreates, how often they recreate, in what recreation activities people participate ,and so forth. Our inability to accurately gauge current recreation use trends makes itdifficult, if not impossible, for managers to anticipate long-term recreation patterns.Without this information, managers will be fundamentally disadvantaged, because theywill not have adequate data to make informed decisions about shifting recreation demands.Some research on recreation trends was conducted in the 1970s and 1980s; however,continuous updating of this work is necessary to account for shifting patterns over time.Particularly considering the influence of rapid technological change on recreation,conclusions based on prior information might not be applicable today.
Although a thorough understanding of recreation use patterns is needed to make informedchoices about water use and distribution, we cannot afford to postpone managementdecisions until full and complete information becomes available. Limitations in recreationuse data simply mean that we will have to work in an environment of higher uncertainty.Decisions affecting water-based recreation cannot be avoided because the failure to actis itself a decision with its own set of consequences. Instead, managers will need tomove in a more conservative, thoughtful manner, giving particular emphasis to soundmonitoring programs and an adaptive approach to management. A substantial body ofknowledge exists on other aspects of recreation and water management from whichinsights may be drawn and later revised as new knowledge is gathered.
Lastly, we need to better understand how to integrate our knowledge of water-basedrecreation with other uses of water. Although there are many interconnections betweenmanagement of water for recreation and other values (e.g., municipal water supply), ourunderstanding of these relations is limited. We need to acknowledge that decisions cannotbe made in isolation; management changes to the water regime for one purpose willhave consequences and implications for other uses, including recreation. For example,management decisions in response to declining fish populations can have implications,either positive or negative, for recreation or for other aspects of the water regime. Further-more, management decisions have the potential to indirectly influence the water regimein other locations by shifting demand to other sites. The relations among various uses ofwater, including both direct and indirect consequences to recreation and the water regime,need to be considered and fully accounted for in water management decisions.
We thank Steve McCool, Bo Shelby, and Jo Tynon for reviewing the manuscript.Portions of this work were incorporated into a forthcoming work by Everest et al, (inpress) which presents a larger more general review of scientific information on issuesrelated to use and management of water resources in the Pacific Northwest.
Acknowledgments
Metric Equivalents When you know: Multiply by: To find:
Inches 2.54 CentimetersFeet 0.305 MetersCubic feet per second 0.028 Cubic meters per secondMiles 1.61 KilometersGallons 264.2 Cubic meters

48
Adelman, B.J.E.; Heberlein, T.A.; Bonnicksen, T.M. 1982. Social psychologicalexplanations for the persistence of a conflict between paddling canoeists andmotorcraft users in the Boundary Waters Canoe Area. Leisure Sciences. 5(1): 45-61.
Alaska Department of Natural Resources. 1999. Alaska’s outdoor legacy: statewidecomprehensive outdoor recreation plan (SCORP): 1997-2002.http://www.dnr.state.ak.us/parks/plans/softcopy.htm. (November 10, 2000).
Anderson, M.A.; Stewart, M.H.; Yates, M.V.; Gerba, C.P. 1998. Modeling the impact ofbody-contact recreation on pathogen concentrations in a source drinking waterreservoir. Water Resources. 32: 3293-3306.
Baker, B. 1994. Aquatic systems a concern as the government relicenses dams.BioScience. 44(6): 433.
Bardwell, L.V. 1991. Problem-framing: a perspective on environmental problem-solving.Environmental Management. 15(5): 603-612.
Bates, S.F. 1992. Whitewater dilemma: allocating boating permits on limited-entry rivers.Rivers. 3(4): 266-275.
Baumgartner, R.; Heberlein, T.A. 1981. Process, goal, and social interaction differencesin recreation: What makes an activity substitutable? Leisure Sciences. 4: 443-458.
Bittman, M.; Wajcman, J. 2000. The rush hour: the character of leisure time and genderequity. Social Forces. 79(1): 165-189.
Blahna, D.J. 1990. Social bases for resource conflicts in areas of reverse migration. In:Lee, R.G., ed. Community and forestry: continuities in the sociology of naturalresources. Boulder, CO: Westview Press: 159-178.
Brandenburg, A.M.; Carroll, M.S. 1995. Your place or mine? the effect of place creationon environmental values and landscape meanings. Society and Natural Resources.8: 381-398.
Brown, B.B.; Perkins, D.D. 1992. Disruptions in place attachment. In: Altman, I.; Low,S.M., eds. Place attachment. New York: Plenum Press: 279-304.
Brown, T.C.; Daniel, T.C. 1991. Landscape aesthetics of riparian environments:relationship of flow quantity to scenic quality along a wild and scenic river. WaterResources Research. 27(8): 1787-1795.
Brown, T.C.; Taylor, J.G.; Shelby, B. 1991. Assessing the direct effects of streamflowon recreation: a literature review. Water Resources Bulletin. 27(6): 979-988.
Brunson, M.W.; Shelby, B. 1990. A hierarchy of campsite attributes in dispersedrecreation settings. Leisure Sciences. 12: 197-209.
Brunson, M.W.; Shelby, B. 1992. Assessing recreational and scenic quality: How doesnew forestry rate? Journal of Forestry. 90(7): 37-41.
Brunson, M.W.; Shelby, B. 1993. Recreation substitutability: a research agenda. LeisureSciences. 15: 67-74.
Bumgardner, W.H.; Waring, M.R.; Legg, M.H.; Goetz, L. 1988. Key indicators ofcampsite selection at Corps of Engineer lakes. Journal of Park and RecreationAdministration. 6(1): 62-78.
Literature Cited

49
Burger, J. 1998. Attitudes about recreation, environmental problems, and estuarine healthalong the New Jersey Shore, USA. Environmental Management. 22(6): 869-876.
Burkardt, N.; Lamb, B.L. 1997. Power distribution in complex environmental negotia-tions: Does balance matter? Journal of Public Administration Research and Theory.7(2): 247-275.
Burtless, G. 1999. Squeezed for time? Brookings Review. 17(4): 18-22.
Christensen, H.H.; Pacha, R.E.; Varness, K.J.; Lapen, R.F. 1978. Human use in adispersed recreation area and its effect on water quality. In: Proceedings, recreationalimpact on wildlands. R-6-001-1979. Portland, OR: U.S. Department of Agriculture,Forest Service, Pacific Northwest Research Station; Seattle, WA: National ParkService: 107-119.
Cilimburg, A.; Monz, C.; Kehoe, S. 2000. Wildland recreation and human waste: a reviewof problems, practices, and concerns. Environmental Management. 25: 587-598.
Clark, R.N. 1986. Onsite interaction of recreation and other resource uses: a literaturereview—the President’s commission on the American outdoors. Washington, DC:Government Printing Office: 27-45.
Clark, R.N.; Gibbons, D.R.; Pauley, G.B. 1985. Influence of forest and rangelandmanagement on anadromous fish habitat in western North America: influences ofrecreation. Gen. Tech. Rep. PNW-178. Portland, OR: U.S. Department of Agriculture,Forest Service, Pacific Northwest Forest and Range Experiment Station. 31 p.
Clark, R.N.; Koch, R.W.; Hogans, M.L. [et al.]. 1984. The value of roaded, multiple-useareas as recreation sites in three national forests of the Pacific Northwest. Res. Pap.PNW-319. Portland, OR: U.S. Department of Agriculture, Forest Service, PacificNorthwest Forest and Range Experiment Station. 40 p.
Clark, R.N.; Stankey, G.H. 1979a. The recreation opportunity spectrum: a framework forplanning, management, and research. Gen. Tech. Rep. PNW-98. Portland, OR: U.S.Department of Agriculture, Forest Service, Pacific Northwest Forest and RangeExperiment Station. 32 p.
Clark, R.N.; Stankey, G.H. 1979b. Determining the acceptability of recreational impacts:an application of the outdoor recreation opportunity spectrum. In: Ittner, R.; Potter,D.R.; Agee, J.K.; Anschell, S., eds. Proceedings, recreational impact on wildlands.Seattle, WA: University of Washington, Institute of Government Research andInstitute for Environmental Studies: 32-42.
Clark, R.N.; Stankey, G.H.; Brown, P.J. [et al.]. 1999. Toward an ecological approach:integrating social, economic, cultural, biological, and physical considerations. In:Johnson, N.C.; Malk, A.J.; Sexton, W.T.; Szaro, R., eds. Ecological stewardship: acommon reference for ecosystem management. Oxford: Elsevier Science Ltd.:297-319. Vol. 3.
Cole, D.N. 1986. Recreational impacts on backcountry campsites in Grand CanyonNational Park, Arizona, USA. Environmental Management. 10(5): 651-659.
Cole, D.N. 1989. The Grand Canyon of the Colorado: a challenge to float, a challenge tomanage. Western Wildlands. 15(3): 2-7.
Cole, D.N.; Marion, J.L. 1988. Recreation impacts in some riparian forests of theEastern United States. Environmental Management. 12(1): 99-107.

50
Cordell, H.K.; Teasley, J.; Super, G. [et al.]. 1997. Outdoor recreation in the UnitedStates: results from the national survey on recreation and the environment, PacificNorthwest Region. [Place of publication unknown]: U.S. Department of Agriculture,Forest Service; Athens, GA: University of Georgia. 88 p.
Cortner, H.J.; Moote, M.A. 1994. Trends and issues in land and water resources man-agement: setting the agenda for change. Environmental Management. 18(2): 167-173.
David, E.L. 1971. Public perceptions of water quality. Water Resources Research. 7(3):453-457.
Davidson, J. 1994. Overworked Americans or overwhelmed Americans? BusinessHorizons. 37(1): 62-66.
Dickman, M.; Dorais, M. 1977. The impact of human trampling on phosphorus loading toa small lake in Gatineau Park, Quebec, Canada. Journal of EnvironmentalManagement. 5(4): 335-344.
Dinius, S.H. 1981. Public perceptions in water quality evaluation. Water ResourcesBulletin. 17(1): 116-121.
Driver, B.; Bassett, J. 1975. Defining conflicts among river users: a case study ofMichigan’s Au Sable River. Naturalist. 26: 19-23.
Driver, B.L.; Bassett, J.R. 1977. Problems of defining and measuring the preferences ofriver recreationists. In: Proceedings of the river recreation management and researchsymposium. Gen. Tech. Rep. NC-29. St. Paul, MN: U.S. Department of Agriculture,Forest Service, North Central Forest Experiment Station: 267-272.
Driver, B.L.; Brown, P.J. 1978. The opportunity spectrum concept and behaviorinformation in outdoor recreation resource supply inventories: a rationale. In:Integrated inventories of renewable natural resources: Proceedings of a workshop.Fort Collins, CO: U.S. Department of Agriculture, Forest Service, Rocky MountainForest and Range Experiment Station: 24-31.
Driver, B.L.; Brown, P.J.; Stankey, G.H.; Gregoire, T.G. 1987. The ROS planning system:evolution, basic concepts, and research needs. Leisure Sciences. 9: 201-212.
Dwyer, J.F. 1995. Changing population demographics: implications for recreationresources management. In: Thompson, J.L.; Lime, D.W.; Gartner, B.; Sames, W.M.,eds. Proceedings of the fourth international outdoor recreation and tourism trendssymposium and the national recreation resource planning conference. St. Paul, MN:University of Minnesota, College of Natural Resources, Minnesota Extension Service:245-248.
Dwyer, J.F.; Hutchison, R. 1990. Outdoor recreation participation and preferences byBlack and White Chicago households. In: Vining, J., ed. Social science and naturalresource recreation management. Boulder, CO: Westview Press: 49-67.
Edwards, P.K. 1981. Race, residence, and leisure style: some policy implications.Leisure Sciences. 4(2): 95-112.
Egan, A.F.; Luloff, A.E. 2000. The exurbanization of America’s forests: research in ruralsocial science. Journal of Forestry. 98(3): 26-30.

51
Everest, F.H.; Stouder, D.J.; Kakoyannis, C. [et al.] [In press]. A review of scientificinformation on issues related to use and management of water resource, in thePacific Northwest. Gen. Tech. Rep. Portland, OR: U.S. Department of AgricultureForest Service, Pacific Northwest Research Station.
Field, D.R.; Martinson, K. 1986. Water-based recreation participation. In: A literaturereview: the President’s Commission on Americans Outdoors. Washington, DC: U.S.Government Printing Office: 49-58.
Fortmann, L.; Kusel, J. 1990. New voices, old beliefs: forest environmentalism amongnew and long-standing rural residents. Rural Sociology. 55(2): 214-232.
Fuguitt, G.V. 1985. The nonmetropolitan turnaround. Annual Review of Sociology.11: 259-280.
Fuguitt, G.V.; Brown, D.L.; Beale, C.L. 1989. Rural and small town America. New York:Russell Sage Foundation. 471 p.
Gary, H.L. 1982. Stream water quality in a small commercial campground in Colorado.Journal of Environmental Health. 45(1): 5-12.
Gramann, J.; Burdge, R. 1981. The effect of recreation goals on conflict perception: thecase of water skiers and fishermen. Journal of Leisure Research. 13: 15-27.
Gray, B. 1985. Conditions facilitating interorganizational collaboration. Human Relations.38(10): 911-936.
Green, D.M. 1998. Recreational impacts on erosion and runoff in a central Arizonariparian area. Journal of Soil and Water Conservation. 53: 38-42.
Hammitt, W.E.; Cole, D.N. 1987. Wildland recreation: ecology and management. NewYork: John Wiley and Sons. 341 p.
Hartmann, L.A.; Cordell, H.K.; Freilich, H.R. 1988. The changing future of outdoorrecreation. Trends. 25(4): 19-23.
Hendricks, C.W. 1971. Increased recovery rate of Salmonellae from stream bottomsediments versus surface waters. Applied Microbiology. 21(2): 379-380.
Herrick, T.A.; McDonald, C.D. 1992. Factors affecting overall satisfaction with a riverrecreation experience. Environmental Management. 16(2): 243-247.
Hof, J.G.; Kaiser, H.F. 1983. Long-term outdoor recreation participation projections forpublic land management agencies. Journal of Leisure Research. 15: 1-14.
Houghton Mifflin Company. 2000. American Heritage® dictionary of the Englishlanguage, 4th ed. http://www.dictionary.com. (October 12, 2001).
Husbands, W.; Idahosa, P. 1995. Ethnicity and recreation behaviour: a review andcritique of the literature. Canadian Ethnic Studies. 27: 84-98.
Hutchison, R. 1987. Ethnicity and urban recreation: Whites, Blacks, and Hispanics inChicago’s public parks. Journal of Leisure Research. 19(3): 205-222.
Hutchison, R.; Fidel, K. 1984. Mexican-American recreation activities: a reply toMcMillen. Journal of Leisure Research. 16(4): 344-349.
Ingram, H.; Mann, D.E.; Weatherford, G.D.; Cortner, H.J. 1984. Guidelines for improvedinstitutional analysis in water resources planning. Water Resources Journal. 20(3):323-334.

52
Interaction Associates. 1986. Conflict resolution in organizations. Denver, CO. [Irregularpagination].
Irwin, P.; Gartner, W.; Phelps, C. 1990. Mexican-American/Anglo cultural differences asrecreation style determinants. Leisure Sciences. 12: 335-348.
Jackivicz, T.P., Jr.; Kusminski, L.N. 1973. A review of outboard motor effects on theaquatic environment. Journal of the Water Pollution Control Federation. 45(8): 1759-1770.
Jacob, G.R.; Schreyer, R. 1980. Conflict in outdoor recreation: a theoretical perspective.Journal of Leisure Research. 12(4): 368-380.
Johnson, K.M. 1993. Demographic change in nonmetropolitan America, 1980-1990.Rural Sociology. 58(3): 347-365.
Johnson, K.M.; Beale, C. 1994. The recent revival of widespread population growth innonmetropolitan areas of the United States. Rural Sociology. 59(4): 655-667.
Johnson, K.M.; Beale, C. 1998. The rural rebound. The Wilson Quarterly. 22(2): 16-28.
Johnson, K.M.; Fuguitt, G.V. 2000. Continuity and change in rural migration patterns,1950-1995. Rural Sociology. 65(1): 27-49.
Johnson, N.S.; Adams, R.N. 1988. Benefits of increased stream flow: the case of theJohn Day steelhead fishery. Water Resources Research. 24(11): 1839-1846.
Johnson, R.L.; Brunson, M.W.; Kimura, T. 1994. Using image-capture technology toassess scenic value at the urban/forest interface: a case study. Journal ofEnvironmental Management. 40: 183-195.
Jones, R.E.; Dunlap, R.E. 1992. The social bases of environmental concern: Have theychanged over time? Rural Sociology. 57: 28-47.
Kelly, J. 1980. Outdoor recreation participation: a comparative analysis. LeisureSciences. 3: 129-154.
King, J.C.; Mace, A.C., Jr. 1974. Effects of recreation on water quality. Journal of theWater Pollution Control Federation. 46(11): 2453-2459.
Kramer, M.H.; Herwaldt, B.L.; Craun, G.F. [et al.]. 1996. Waterborne disease: 1993 and1994. Journal of the American Water Works Association. 88: 66-80.
Kuss, F.R.; Graefe, A.R.; Vaske, J.J. 1990. Visitor impact management: a review ofresearch. Washington, DC: National Parks and Conservation Association. 256 p.
Lagerfeld, S. 1998. Spending time: Do we have more or less today? Current. (February):10-15.
Langenau, E.E., Jr.; O’Quin, K.; Duvendeck, J.P. 1980. The response of forestrecreationists to clearcutting in northern lower Michigan: a preliminary report. ForestScience. 26(1): 81-91.
Lant, C.L.; Mullens, J.B. 1991. Lake and river quality for recreation management andcontingent valuation. Water Resources Bulletin. 27(3): 453-460.
Leung, Y.; Marion, J.L. 1999. Characterizing backcountry camping impacts in GreatSmoky Mountains National Park, USA. Journal of Environmental Management.57: 193-203.

53
Liddle, M.J.; Scorgie, H.R.A. 1980. The effects of recreation on freshwater plants andanimals: a review. Biological Conservation. 17: 183-206.
Lime, D.W. 1971. Factors influencing campground use in the Superior National Forest ofMinnesota. Res. Pap. NC-60. St. Paul, MN: U.S. Department of Agriculture, ForestService, North Central Forest Experiment Station. 18 p.
Lime, D.W. 1977. When the wilderness gets crowded...? Naturalist. 28(4): 1-8.
Lime, D.W.; McCool, S.F.; Galvin, D.P. 1995. Trends in congestion and crowding atrecreation sites. In: Thompson, J.L.; Lime, D.W.; Gartner, B.; Sames, W.M., eds.Proceedings of the fourth international outdoor recreation and tourism trends symposiumand the national recreation resource planning conference. St. Paul, MN: University ofMinnesota, College of Natural Resources, Minnesota Extension Service: 87-96.
Lockaby, G.; Dunn, B.A. 1984. Camping effects on selected soil and vegetativeproperties. Journal of Soil and Water Conservation. 39(3): 215-216.
Loomis, J.; Sorg, C.; Donnelly, D. 1986. Economic losses to recreational fisheries dueto small-head hydro-power development: a case study of Henrys Fork in Idaho.Journal of Environmental Management. 22: 85-94.
Loomis, J.B. 2000. Counting on recreation use data: a call for long-term monitoring.Journal of Leisure Research. 32: 93(4).
Lucas, R.C. 1970. User evaluation of campgrounds on two Michigan national forests.Res. Pap. NC-44. St. Paul, MN: U.S. Department of Agriculture, Forest Service, NorthCentral Forest Experiment Station. 15 p.
Luloff, A.E.; Krannich, R.S. 1990. Demographic correlates of outdoor recreation: trendsand implications. In: O’Leary, J.T.; Fesenmaier, D.R.; Brown, T. [et al.], eds.Proceedings of the national outdoor recreation trends symposium III; Indianapolis, IN:[Publisher unknown]: 131-146.
Madej, M.A.; Weaver, W.E.; Hagans, D.K. 1994. Analysis of bank erosion on the MercedRiver, Yosemite Valley, Yosemite National Park, California, USA. EnvironmentalManagement. 18(2): 235-250.
Manfredo, M.; Anderson, D. 1987. The influence of activity importance and similarity onperception of recreation substitutes. Leisure Sciences. 9: 77-86.
Manning, R.E. 1999. Studies in outdoor recreation: search and research for satisfaction.Corvallis, OR: Oregon State University Press. 374 p.
Marion, J.L. 1995. Environmental auditing: capabilities and management utility ofrecreation impact monitoring programs. Environmental Management. 19(5): 763-771.
Marion, J.L.; Cole, D.N. 1996. Spatial and temporal variation in soil and vegetationimpacts on campsites. Ecological Applications. 6(2): 520-530.
McCool, S.F.; Kruger, L.E. [N.d.]. Human migration and natural resources: implicationsfor policy makers and challenges for researchers. Manuscript in preparation. On filewith: Steve McCool, School of Forestry, University of Montana, Missoula, MO 59812.
McCool, S.; Utter, J. 1982. Recreation use lotteries: outcomes and preferences. Journalof Forestry. 80: 10-11, 29.

54
McDonough, M.; Stynes, D.; Potter-Witter, K. [et al.]. 1999. The role of natural resourcesin community and regional economic stability in the eastern Upper Peninsula.Agricultural Experiment Station status and potential of Michigan natural resources(SAPMNR) Report 568; East Lansing, MI: Michigan State University. 88 p.
Meeker, J.W.; Woods, W.K.; Lucas, W. 1973. Red, white, and black in the national parks.The North American Review. Fall: 3-7.
Mitchell, M.Y.; Force, J.E.; Carroll, M.S.; McLaughlin, W.J. 1993. Forest places of theheart: incorporating special spaces into public management. Journal of Forestry.91(2): 32-37.
Moore, S.D.; Wilkosz, M.E.; Brickler, S.K. 1990. The recreational impact of reducing the“Laughing Waters” of Araipa Creek, Arizona. Rivers. 1(1): 43-50.
Murdock, S.H.; Backman, K.; Colberg, E. [et al.]. 1990. Modeling demographic changeand characteristics in the analysis of future demand for leisure services. LeisureSciences. 12: 79-102.
Murdock, S.H.; Backman, K.; Hoque, N.; Ellis, D. 1991. The implications of change inpopulation size and composition on future participation in outdoor recreationalactivities. Journal of Leisure Research. 23: 238-259.
Naeser, R.B.; Smith, M.G. 1995. Playing with borrowed water: conflicts over instreamflows on the upper Arkansas River. Natural Resources Journal. 35: 93-110.
Narayanan, R. 1986. Evaluation of recreational benefits of instream flows. Journal ofLeisure Research. 18(2): 116-128.
National Marine Manufacturers Association. 1997. 1997 boating population estimates.http://www.nmma.org/facts/boatingstats/statistic97.html. (September 8, 2000).
Nelson, D.E.; Hansen, W.R. 1984. Fecal coliform in the Salt River recreation areas ofArizona. Journal of Forestry. 82(10): 554-555.
Oregon Parks and Recreation Department. 1994. Oregon outdoor recreation plan,1994-1999. [Place of publication unknown]: [Irregular pagination].
Peters, N.E.; Meybeck, M. 2000. Water quality degradation effects on freshwateravailability: impacts to human activities. Water International. 25: 185-193.
Ploch, L.A. 1978. The reversal in migration patterns-some rural developmentconsequences. Rural Sociology. 43(2): 293-303.
Rayner, S.; Malone, E.L. 1998. Human choice and climate change: What have welearned? Columbus, OH: Battelle Press. 193 p.
Recreation Roundtable. 2000. Outdoor recreation in America 1999: the family and theenvironment. Prepared for The Recreation Roundtable. Washington, DC: Roper Starch.http://www.funoutdoors.com/Rec99/index.html. (November 2000).
Robertson, R.A. 1989. Recreational use of urban waterways: the Illinois and Michigancanal corridor. Western Wildlands. 15(3): 14-17.
Robertson, R.A.; Burdge, R.J. 1993. The interface between commercial and industrialdevelopment and recreational use in an urban river corridor. Journal of LeisureResearch. 25(1): 53-69.

55
Robertson, R.A.; Colletti, J.P. 1994. Off-site impacts of soil erosion on recreation: thecase of Lake Red Rock Reservoir in central Iowa. Journal of Soil and WaterConservation. 49(6): 576-581.
Robinson, J.P.; Godbey, G. 1997. Time for life: the surprising ways Americans use theirtime. University Park, PA: Pennsylvania State University Press. 367 p.
Rollins, R.; Chambers, D. 1990. Camper satisfaction with Canadian Park Servicecampgrounds. In: Vining, J., ed. Social science and natural resource recreationmanagement. Boulder, CO: Westview Press: 91-103.
Rudzitis, G.; Johansen, H.E. 1989. Migration into western wilderness counties: causesand consequences. Western Wildlands. Spring: 19-23.
Rudzitis, G.; Johansen, H.E. 1991. How important is wilderness? Results from a UnitedStates survey. Environmental Management. 15: 227-233.
Schor, J.B. 1991. The overworked American: the unexpected decline of leisure, USA.[Place of publication unknown]: HarperCollins Publishers. 247 p.
Schreyer, R. 1990. Conflict in outdoor recreation: the scope of the challenge to resourceplanning and management. In: Vining, J., ed. Social science and natural resourcerecreation management. Boulder, CO: Westview Press: 13-31.
Schuett, M.A. 1995. Environmental preference and risk recreation: the case of whitewater kayakers. Journal of Environmental Education. 25: 9(6).
Shelby, B. 1980. Contrasting recreational experiences: motors and oars in the GrandCanyon. Journal of Soil and Water Conservation. 35: 129-131.
Shelby, B. 1991. Allocation of public access rights on Western rivers. WesternWildlands. 16(4): 8-12.
Shelby, B.; Brown, T.C.; Baumgartner, R. 1992a. Effects of streamflows on river tripson the Colorado River in Grand Canyon, Arizona. Rivers. 3(3): 191-201.
Shelby, B.; Brown, T.C.; Taylor, J.G. 1992b. Streamflow and recreation. Gen. Tech. Rep.RM-209. Fort Collins, CO: U.S. Department of Agriculture, Forest Service, RockyMountain Forest and Range Experiment Station. 28 p.
Shelby, B.; Heberlein, T.A. 1986. Carrying capacity in recreation settings. Corvallis, OR:Oregon State University Press. 164 p.
Shelby, B.; Lime, D.W. 1986. Whitewater river recreation. In: A literature review: thePresident’s Commission on Americans Outdoors. Washington, DC: U.S. GovernmentPrinting Office: 91-97.
Shelby, B.; Speaker, R.W. 1990. Public attitudes and perceptions about prescribedburning. In: Walstad, J.D.; Radosevich, S.R.; Sandberg, D.V., eds. Natural andprescribed fire in Pacific Northwest forests. Corvallis, OR: Oregon State UniversityPress: 253-260.
Shelby, B.; Vaske, J.J. 1991. Resource and activity substitutes for recreational salmonfishing in New Zealand. Leisure Sciences. 13: 21-32.
Shelby, B.; Vaske, J.J.; Heberlein, T.A. 1989. Comparative analysis of crowding inmultiple locations: results from fifteen years of research. Leisure Sciences.11: 269-291.

56
Shelby, B.; Whittaker, D. 1995. Flows and recreation quality on the Dolores River:integrating overall and specific evaluations. Rivers. 5(2): 121-131.
Shelby, B.; Whittaker, D.; Hansen, W.R. 1997. Streamflow effects on hiking in ZionNational Park, Utah. Rivers. 6(2): 80-93.
Shelby, B.; Whittaker, D.; Roppe, J. 1998. Controlled flow studies for recreation: a casestudy on Oregon’s North Umpqua River. Rivers. 6(4): 259-268.
Shumway, J.M.; Davis, J.A. 1996. Nonmetropolitan population change in the mountainWest: 1970-1995. Rural Sociology. 61(3): 513-529.
Silverman, G.; Erman, D.C. 1979. Alpine lakes in Kings Canyon National Park,California: baseline conditions and possible effects of visitor use. Journal ofEnvironmental Management. 8: 73-87.
Smith, D.G.; Cragg, A.M.; Croker, G.F. 1991. Water clarity criteria for bathing watersbased on user perception. Journal of Environmental Management. 33: 285-299.
Smith, D.G.; Davies-Colley, R.J. 1992. Perception of water clarity and colour in terms ofsuitability for recreational use. Journal of Environmental Management. 36: 225-235.
Snepenger, D.J.; Ditton, R.B. 1985. A longitudinal analysis of nationwide hunting andfishing indicators: 1955-1980. Leisure Sciences. 7: 297-319.
Spence, D.B. 1999. Agency discretion and the dynamics of procedural reform. PublicAdministration Review. 59(5): 18-42.
Stankey, G. 1973. Visitor perception of wilderness recreation carrying capacity. Res. Pap.INT-142. Odgen, UT: U.S. Department of Agriculture, Forest Service, IntermountainResearch Station. 61 p.
Stankey, G.H. 1976. Wilderness fire policy: an investigation of visitor knowledge andbeliefs. Res. Pap. INT-180. Ogden, UT: U.S. Department of Agriculture, ForestService, Intermountain Forest and Range Experiment Station. 17 p.
Stankey, G.H. 2000. Future trends in society and technology: implications for wildernessresearch and management. In: Cole, D.N.; McCool, S.F.; Freimund, W.; O’Loughlin, J.,comps. Wilderness science in a time of change conference—Volume 1: Changingperspectives and future directions. RMRS-P-15-VOL-1. Ogden, UT: U.S. Departmentof Agriculture, Forest Service, Rocky Mountain Research Station: 10-23.
Stankey, G.H.; Clark, R.N. 1992. Social aspects of new perspectives in forestry: aproblem analysis. Milford, PA: Grey Towers Press. 33 p.
Stankey, G.H.; Clark, R.N. 1998. Frameworks for decisionmaking in management. In:Miller, M.L.; Auyong, J., eds. Proceedings of the 1996 world congress on coastal andmarine tourism. Seattle, WA: Washington Sea Grant Program, School of MarineAffairs: 55-59.
Steel, B.S.; List, P.; Shindler, B. 1994. Conflicting values about federal forests: a com-parison of national and Oregon publics. Society and Natural Resources. 7: 137-153.
Steel, B.S.; Pierce, J.; Lovrich, N. 1998. Public information campaigns and ‘at-risk’voters. Political Communication. 15(January): 117-133.
Stewart, R.; Howard, H.H. 1968. Water pollution by outboard motors. TheConservationist. 22(6): 6-8, 31.

57
Stohlgren, T.J.; Parsons, D.J. 1996. Vegetation and soil recovery in wildernesscampsites closed to visitor use. Environmental Management. 10(3): 375-380.
Super, G.; Cordell, H.K. 1990. Managing for changing recreation needs on nationalforests: a viewpoint. In: O’Leary, J.T.; Fesenmaier, D.R.; Brown, T. [et al.], eds.Proceedings of the national outdoor recreation trends symposium III, Indianapolis, IN:[Publisher unknown]: 813-816.
Susskind, L.; Cruikshank, J. 1987. Breaking the impasse: consensual approaches toresolving public disputes. New York: Basic Books, Inc. 276 p.
Tarrant, M.A.; English, D.B.K. 1996. A crowding-based model of social carryingcapacity: applications for whitewater boating use. Journal of Leisure Research. 28(3):155-168.
Taylor, D.E. 2000. Meeting the challenge of wildland recreation management:demographic shifts and social inequality. Journal of Leisure Research. 32(1): 171-180.
Taylor, H. 2000. Harris Poll #35: Reading remains the nation’s favorite leisure timeactivity, increasing its lead over watching TV. http://www. louisharris.com/harris_poll/index.asp?PID=98. (November 2000).
Toth, J.F., Jr.; Brown, R.B. 1997. Racial and gender meanings of why people participatein recreational fishing. Leisure Sciences. 19: 129-146.
Troy, L.R. 1998. Recent human migration to the interior Columbia basin: implications fornatural resource management. Missoula, MT: University of Montana. [Pagesunknown] M.S.thesis.
U.S. Department of Agriculture, Forest Service. 2000. The recreation agenda. FS-691.http://www.fs.fed.us/recreation. (November 2000).
U.S. Department of Agriculture, Natural Resources Conservation Service (NRCS).1997. National resources inventory. http://www.nhg.nrcs.usda.gov/NRI/1997.(February 2002).
U.S. Department of Commerce, Bureau of the Census. 1996. Population paper listing47; Population Electronic Product 45. Washington, DC: Population Division.
U.S. Department of Commerce, Bureau of the Census. 1997. Projections of the totalpopulation of states: 1995 to 2025. http://www.census.gov/population/projections/state/stpjpop.txt. (November 2000).
U.S. Department of Commerce, Bureau of the Census. 2001a. Maps of populationchange. http://www.census.gov/population/www/estimates/stmap03.html. (October12, 2001).
U.S. Department of Commerce, Bureau of the Census. 2001b. Population projectionsand estimates. http://www.census.gov/population/www/index.html. (January 2001).
U.S. Department of the Interior, Fish and Wildlife Service, U.S. Department ofCommerce, Bureau of the Census. 1996. 1996 National survey of fishing, hunting,and wildlife-associated recreation. [Irregular pagination].
Van Liere, K.D.; Dunlap, R.E. 1980. The social bases of environmental concern: areview of hypotheses, explanations and empirical evidence. Public Opinion Quarterly.44: 181-197.

58
Varness, K.J.; Pacha, R.E.; Lapen, R.F. 1978. Effects of dispersed recreationalactivities on the microbiological quality of forest surface water. Applied andEnvironmental Microbiology. 36(1): 95-104.
Vining, J.; Fishwick, L. 1991. An exploratory study of outdoor recreation site choices.Journal of Leisure Research. 23: 114-132.
Wagenet, R.J.; Lawrence, C.H. 1974. Recreational effects on bacteriological quality ofan impounded water supply. Journal of Environmental Health. 37(1): 16-20.
Warnick, R.B.; Vander Stoep, G. 1990. Regional outdoor recreation trends in the UnitedStates: 1979-1989. In: O’Leary, J.T.; Fesenmaier, D.R.; Brown, T. [et al.], eds.Proceedings of the national outdoor recreation trends symposium III. Indianapolis, IN:306-327.
Washburne, R.F. 1978. Black under-participation in wildland recreation: alternativeexplanations. Leisure Sciences. 1(2): 175-189.
Washburne, R.; Wall, P. 1980. Black-White ethnic differences in outdoor recreation.Ogden, UT: U.S. Department of Agriculture, Forest Service, Intermountain Forest andRange Experiment Station. [Pages unknown].
Washington Interagency Committee for Outdoor Recreation. 1995. State ofWashington outdoor recreation and habitat assessment and policy plan, 1995-2001: astatewide comprehensive outdoor recreation planning (SCORP) document. Olympia,WA. 39 p.
Wellner, A.S. 1997. Americans at play: demographics of outdoor recreation and travel.New York: New Strategist Publications, Inc. 367 p.
Whisman, S.A.; Hollenhorst, S.J. 1998. A path model of whitewater boatingsatisfaction on the Cheat River of West Virginia. Environmental Management. 22(1):109-117.
Whittaker, D.; Shelby, B.; Jackson, W.; Beschta, R. 1993. Instream flows for recreation:a handbook on concepts and research methods. Anchorage, AK: U.S. Department ofthe Interior, National Park Service, Rivers and Trails Conservation Program, WaterResources Division; Cooperative Park Studies Unit, Oregon State University. 103 p.
Wikle, T.A. 1991. Evaluating the acceptability of recreation rationing policies used onrivers. Environmental Management. 15(3): 389-394.
Wollmuth, D.C.; Schomaker, J.C.; Merriam, L.C., Jr. 1985. River recreation experienceopportunities in two recreation opportunity spectrum (ROS) classes. Water ResourcesBulletin. 21(5): 851-857.
Wondolleck, J.M.; Yaffee, S.L. 2000. Making collaboration work: lessons from innovationin natural resource management. Washington, DC: Island Press. 277 p.
Wood, T.J.; Bolek, J.; Doucette, K. 1990. Retirement centers: the trend toward resort-style living. In: O’Leary, J.T.; Fesenmaier, D.R.; Brown, T. [et al.], eds. Proceedings ofthe national outdoor recreation trends symposium III. Indianapolis, IN: [Publisherunknown]. 83-95.

59
Zabinski, C.A.; Gannon, J.E. 1997. Effects of recreational impacts on soil microbialcommunities. Environmental Management. 21(2): 233-238.
Zinser, C.I. 1995. Outdoor recreation: United States National Parks, forests, and publiclands. New York: John Wiley and Sons. 898 p.
Zube, E.H.; Pitt, D.G.; Anderson, T.W. 1975. Perception and prediction of scenicresource values of the Northeast. In: Zube, E.H.; Brush, R.O.; Fabos, J.G., eds.Landscape assessment: values, perceptions and resources. Stroudsburg, PA: HalstedPress: 151-167.

This page has been left blank intentionally.Document continues on next page.

This page has been left blank intentionally.Document continues on next page.

This page has been left blank intentionally.Document continues on next page.

The Forest Service of the U.S. Department of Agriculture is dedicated to the principleof multiple use management of the Nation’s forest resources for sustained yields ofwood, water, forage, wildlife, and recreation. Through forestry research, cooperationwith the States and private forest owners, and management of the National Forestsand National Grasslands, it strives—as directed by Congress—to provide increasinglygreater service to a growing Nation.
The U.S. Department of Agriculture (USDA) prohibits discrimination in all its programsand activities on the basis of race, color, national origin, gender, religion, age, disability,political beliefs, sexual orientation, or marital or family status. (Not all prohibited basesapply to all programs.) Persons with disabilities who require alternative means forcommunication of program information (Braille, large print, audiotape, etc.) shouldcontact USDA’s TARGET Center at (202) 720-2600 (voice and TDD).
To file a complaint of discrimination, write USDA, Director, Office of Civil Rights, Room326-W. Whitten Building, 14th and Independence Avenue, SW, Washington, DC20250-9410 or call (202) 720-5964 (voice and TDD). USDA is an equal opportunityprovider and employer.
Pacific Northwest Research Station
Web site http://www.fs.fed.us/pnwTelephone (503) 808-2592Publication requests (503) 808-2138FAX (503) 808-2130E-mail [email protected] address Publications Distribution
Pacific Northwest Research StationP.O. Box 3890Portland, OR 97208-3890

U.S. Department of AgriculturePacific Northwest Research Station333 S.W. First AvenueP.O. Box 3890Portland, OR 97208-3890
Official BusinessPenalty for Private Use, $300