evaluating methods for assessing sediment quality in a ... · evaluating methods for assessing...
TRANSCRIPT
Evaluating methods for assessing sediment qualityin a Great Lakes embayment
Judy L. Crane,1∗ Carl Richards,2∗∗ Dan Breneman,3 Stephen Lozano,4†
and Jeffrey A. Schuldt3‡1Minnesota Pollution Control Agency, Environmental Analysis and Outcomes Division, 520 Lafayette Road North,
St. Paul, MN 55155-4194, Phone 651 297 4068; Fax 651 297 77092University of Minnesota Duluth, Minnesota Sea Grant College Program, 2305 East Fifth Street, Duluth, MN 55812
3University of Minnesota Duluth, Natural Resources Research Institute, 5013 Miller Trunk Highway, Duluth, MN 558114U.S. Environmental Protection Agency, Environmental Effects Research Laboratory, Mid-Continent Ecology Division,
6201 Congdon Boulevard, Duluth, MN 55804∗∗Current address: U.S. Environmental Protection Agency, Mid-Continent Ecology Division, 6201 Congdon Boulevard,
Duluth, MN 55804.†Current address: National Oceanic and Atmospheric Administration, Great Lakes Environmental Research Laboratory,
2205 Commonwealth Boulevard, Ann Arbor, MI 48105-2945‡Current address: University of Wisconsin Superior, Department of Biology and Earth Sciences, Belknap and Catlin,
Superior, WI 54880-4500∗Corresponding author: E-mail: [email protected]
A probability-based, sediment quality assessment was conducted during 1995 in the lower St. Louis River Areaof Concern, located in western Lake Superior. A regional application of the intensified sampling grid developedfor the United States Environmental Protection Agency’s Environmental Monitoring and Assessment Programwas used to randomly select 90 sites for measuring the following sediment quality indicators: sediment chemistry,physical parameters, sediment toxicity, and benthic macroinvertebrate community structure. Screening methodswere used to assess sediment chemistry and sediment toxicity at all sites, whereas more conventional metricswere used at a subset of sites. In addition, sediment quality data were collected from 20 a priori training sites, 10in low impact areas and 10 in high impact areas. Mean probable effect concentration quotients were calculatedfor sediment chemistry variables at each site. As the range of mean probable effect concentration quotientsvalues increased, the incidence of sediment toxicity increased. Benthic data from the training sites were usedto establish standard criteria for developing two benthic integrity indices based on multimetric analysis anddiscriminant function analysis. Based on the training site results, the discriminant function analysis categorizedthe macroinvertebrate community at all random sites as 45 percent low impact and 55 percent high impact. Amultimetric approach categorized 55 percent of the random sites as low impact and 36 percent as high impact.Due to the overlap of 95 percent confidence intervals, the multimetric approach also placed 9 percent of therandom sites into an indeterminate category. The incidence of high impact sites appears to be primarily dueto physical habitat characteristics. This finding was supported by the sediment quality triad assessment of 52random sites that indicated alteration of the benthic community at 71 percent of sites was probably not due tochemical contamination.
Keywords: benthic macroinvertebrates, Lake Superior, toxicity tests, chemistry, multimetric index, discrimi-nant function analysis
323
Aquatic Ecosystem Health & Management, 8(3):323–349, 2005. Copyright C© 2005 AEHMS. ISSN: 1463-4988 print / 1539-4077 onlineDOI: 10.1080/14634980500242852
324 Crane et al. / Aquatic Ecosystem Health and Management 8 (2005) 323–349
Introduction
Many embayments and harbors within the GreatLakes have been impacted by a variety of environ-mental stressors, resulting in possible impairments dueto increased eutrophication, alteration of aquatic andnearshore habitats, expansion of exotic species popu-lations, bioaccumulation of persistent chemicals in fishtissue, and fluctuating water levels. The St. Louis RiverArea of Concern (AOC) is one of 41 current GreatLakes AOCs in which impaired use criteria, identi-fied by the International Joint Commission (IJC), havebeen observed (IJC, 1989). Contaminated sedimentshave contributed to several use impairments in thiswestern Lake Superior AOC, including the issuanceof fish advisories, restrictions on dredging, and habi-tat impairments to bottom-feeding organisms (MPCA,WDNR, 1992, 1995; Crane et al., 2002a). Chemicalsof potential concern in portions of the lower St. LouisRiver AOC include: polycyclic aromatic hydrocarbons(PAHs), polychlorinated biphenyls (PCBs), dioxins andfurans, diesel range organics, pesticides (e.g., DDTmetabolites, toxaphene), trace metals (copper, lead,mercury, nickel, zinc), and tributyltin (Crane et al.,2002a).
The IJC, through a formal protocol agreement be-tween Canada and the United States, is charged withreviewing the remedial action plans (RAPs) for eachGreat Lakes AOC. The RAPs are being preparedin a staged approach to evaluate impaired uses, todevelop and implement a plan for restoring benefi-cial uses, and to evaluate the success of any reme-dial measures that are conducted. A Stage I RAPfor the St. Louis River AOC was completed in 1992(MPCA, WDNR, 1992), and a three-phase strat-egy to reduce sediment-related impairments was rec-ommended in the Stage II RAP (MPCA, WDNR,1995).
The United States Environmental ProtectionAgency’s (USEPA) Assessment and Remediation ofContaminated Sediments Program recommends usinga weight-of-evidence approach to assess contaminatedsediment sites (Fox et al., 1994). The Sediment Qual-ity Triad (Triad) approach is one way in which sed-iment quality can be characterized through synopticchemical and physical analyses, whole-sediment tox-icity tests, and benthic infauna community surveys(Chapman et al., 1987,1997; Long and Wilson, 1997).The Triad approach is effective in addressing bioavail-ability and contaminant toxicity (Long and Chapman,1985; IJC, 1989; Burton and Ingersoll, 1994; Canfield
et al., 1994a,b, 1996) and it is considered a com-prehensive and ecologically relevant metric for sitecharacterizations. In addition, the Triad approach isvaluable for status and trends monitoring of aquaticecosystems because it reflects highly localized con-ditions that are relatively static over short periods oftime.
Although the Triad approach has been applied to afocused assessment of contaminated sites in the lowerSt. Louis River AOC (Crane et al., 1997), a large scaleTriad study was needed for status and trends monitoringthroughout this AOC. The resource status informationobtained from status and trends monitoring will helpevaluate restoration efforts of impaired aquatic habitatsat several sites within the lower St. Louis River AOC,including two Superfund sites. These restoration ef-forts will also benefit from implementation of the lowerSt. Louis River Habitat Plan (St. Louis River CAC,2002).
One approach to determining resource status isthrough statistical sampling design principles and se-lection of appropriate status indicators employed in theGreat Lakes Environmental Monitoring and Assess-ment Program (EMAP; USEPA, 1993). This processprovides a means for identifying and sampling the ap-propriate number of sites to acquire the baseline infor-mation necessary to measure progress in restoring im-paired areas. Combining these design principles with acomprehensive examination of the physical, chemical,and biological characteristics of the sediments shouldprovide sufficient data to make sound environmentaldecisions.
We previously reported on environmental influenceson benthic community structure in the lower St. LouisRiver AOC as part of a Regional EMAP (R-EMAP)investigation (Breneman et al., 2000). In this paper,we describe other objectives of the R-EMAP projectto: determine impaired areas using the Triad approach,provide status and trends data for evaluating sedimentquality in the lower estuary, and to provide the firsttest of EMAP concepts to the Great Lakes Harbors andEmbayments resource class. This paper will describemethods used to calculate mean probable effect con-centration quotients (PEC-Qs) for total PAHs and/ormetals, identify sites having significant acute toxicity,and develop two benthic indices based on multimetricand multivariate analyses. The results from 20 a prioritraining sites chosen in low and high impact areas willbe used to evaluate sediment quality conditions asso-ciated with randomized sites throughout the lower St.Louis River AOC.
Crane et al. / Aquatic Ecosystem Health and Management 8 (2005) 323–349 325
Materials and methods
Study area
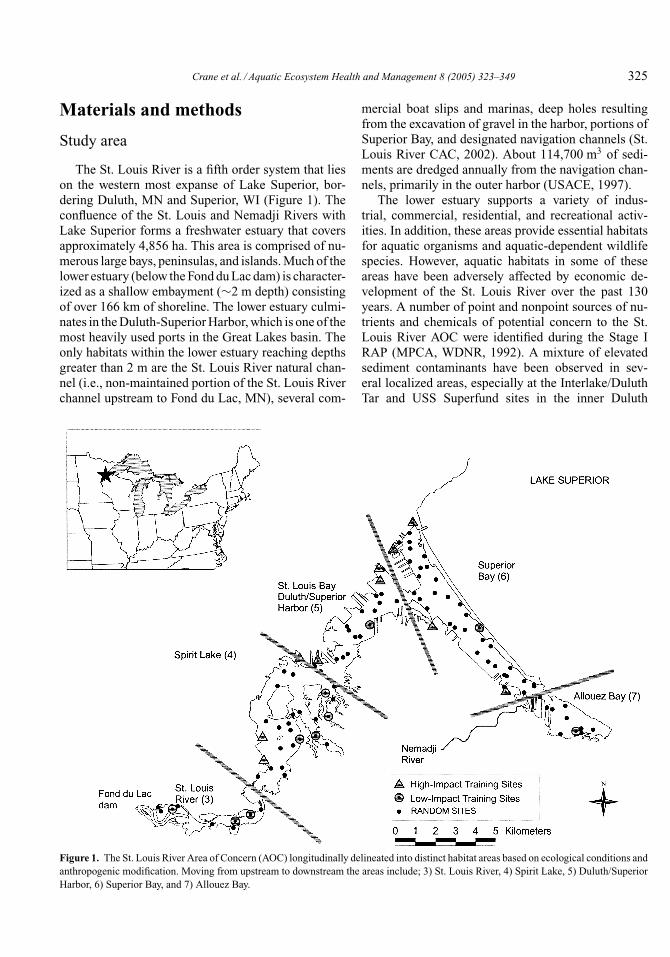
The St. Louis River is a fifth order system that lieson the western most expanse of Lake Superior, bor-dering Duluth, MN and Superior, WI (Figure 1). Theconfluence of the St. Louis and Nemadji Rivers withLake Superior forms a freshwater estuary that coversapproximately 4,856 ha. This area is comprised of nu-merous large bays, peninsulas, and islands. Much of thelower estuary (below the Fond du Lac dam) is character-ized as a shallow embayment (∼2 m depth) consistingof over 166 km of shoreline. The lower estuary culmi-nates in the Duluth-Superior Harbor, which is one of themost heavily used ports in the Great Lakes basin. Theonly habitats within the lower estuary reaching depthsgreater than 2 m are the St. Louis River natural chan-nel (i.e., non-maintained portion of the St. Louis Riverchannel upstream to Fond du Lac, MN), several com-
Figure 1. The St. Louis River Area of Concern (AOC) longitudinally delineated into distinct habitat areas based on ecological conditions andanthropogenic modification. Moving from upstream to downstream the areas include; 3) St. Louis River, 4) Spirit Lake, 5) Duluth/SuperiorHarbor, 6) Superior Bay, and 7) Allouez Bay.
mercial boat slips and marinas, deep holes resultingfrom the excavation of gravel in the harbor, portions ofSuperior Bay, and designated navigation channels (St.Louis River CAC, 2002). About 114,700 m3 of sedi-ments are dredged annually from the navigation chan-nels, primarily in the outer harbor (USACE, 1997).
The lower estuary supports a variety of indus-trial, commercial, residential, and recreational activ-ities. In addition, these areas provide essential habitatsfor aquatic organisms and aquatic-dependent wildlifespecies. However, aquatic habitats in some of theseareas have been adversely affected by economic de-velopment of the St. Louis River over the past 130years. A number of point and nonpoint sources of nu-trients and chemicals of potential concern to the St.Louis River AOC were identified during the Stage IRAP (MPCA, WDNR, 1992). A mixture of elevatedsediment contaminants have been observed in sev-eral localized areas, especially at the Interlake/DuluthTar and USS Superfund sites in the inner Duluth
326 Crane et al. / Aquatic Ecosystem Health and Management 8 (2005) 323–349
Harbor (Schubauer-Berigan and Crane, 1997; IT Cor-poration, 1997; URS Corporation, 2002). Other areaswith elevated sediment contamination in the Duluth-Superior Harbor include Hog Island Inlet/NewtonCreek (Redman and Janisch, 1995; SEH Inc., 2000,2003), as well as several boat slips, areas adjacent towastewater treatment plants, and other areas with his-torical sources of contaminants (Crane et al., 1997;Schubauer-Berigan and Crane, 1997; Crane, 1999;Crane et al., 2002b).
Experimental design and site selection
Our experimental design used a set of a priori se-lected sites (training sites) to classify a set of randomsites that were selected following a randomized sam-pling design based on the format used in the GreatLakes EMAP system (USEPA, 1993). The randomlyselected sites provided a means for generally character-izing condition of the region. The training sites (10 lowimpact and 10 high impact) were chosen in an attempt tocategorize the best and worst case sediment quality con-ditions existing in the lower estuary. Training sites wereselected based upon previous sediment quality stud-ies of the region (MPCA, WDNR, 1992; Schubauer-Berigan and Crane, 1996, 1997; Crane et al., 1997)and upon the best professional judgment of local re-source professionals. Much of this professional judg-ment about local sediment quality and habitat condi-tions has been documented in the lower St. Louis RiverHabitat Plan (St. Louis River CAC, 2002).
Random sites were chosen based on the NationalOceanic and Atmospheric Administration (NOAA)shipping chart for the Duluth-Superior Harbor whichwas digitally categorized into shallow (water depth<5.5 m) or channelized (>5.5 m in depth) habitats.A 49-fold enhancement of the Great Lakes EMAPgrid was applied to accessible areas, and the numberof sites evaluated within each habitat class was basedon the total surface area represented by that particu-lar class. Ninety sample site locations were randomlyselected from the resulting hexagonal grid, with eachsite positioned by a latitudinal and longitudinal coor-dinate. Sixty random sites were located in the shallowhabitat class, while 30 random sites were located inthe channel habitat of the federal navigation channel.Sites were stratified into shallow and channel due toknown influence of this physical feature on sedimentconditions.
To aid in summarizing results, site locations withinthe St. Louis River AOC were also delineated, upstreamto downstream, into five areas (Figure 1). As described
in the following sections, not all of the metrics for theseindicators were measured at all sites. Instead, screen-ing methods were used to develop a short-list of sitesfor running comprehensive sediment toxicity tests andchemical analyses.
Sediment sampling
All sediment samples were collected during a 30d period, beginning in June 1995 as described byBreneman et al. (2000). In brief, composited sedimentsamples of the upper 5 cm depth interval were split forsediment chemistry analyses, physical measurements,and sediment toxicity tests. Field replicates for sed-iment chemistry, particle size, and sediment toxicitywere collected at approximately every 10 sites, for atotal of 11 replicates (8 random sites and 3 trainingsites). Benthic macroinvertebrates were sampled at thesame time in triplicate using a 0.023 m2 petite Ponargrab sampler (Breneman et al., 2000). The storageand processing of sediment samples are described inBreneman et al. (2000). A Global Positioning Systemwas used to determine latitude and longitude coordi-nates (Breneman et al., 2000). Water depth and thedepth of soft sediments were also measured at each site(Breneman et al., 2000). Sediment samples were col-lected from all 20 training sites for sediment chemistry,particle size, sediment toxicity, and benthic macroin-vertebrates. From the original 90 random sample loca-tions, sediment chemistry and Microtox©R samples wereobtained and analyzed for 87 sites, including 58 shallowand 29 channelized habitats. Cohesive sediment sam-ples could not be obtained from three random samplesites because the substrates were composed of uncon-solidated sand and gravel. Extra sediment samples werealso collected at all 87 sites for possible use in 10 d sedi-ment toxicity tests. Benthic macroinvertebrate sampleswere collected from 89 random sites.
Sediment chemistry and physical parameters
The procedures for analyzing sediment samples forsediment chemistry and physical parameters were de-scribed in detail in Breneman et al. (2000). In brief, si-multaneously extractable metals (SEM, sum of Cd, Cu,Ni, Pb, Zn concentrations in µmol g−1), acid volatilesulfide (AVS), mercury, percent total organic carbon(TOC), KCl-extractable ammonia, screening PAHs (asmeasured using a fluorescence procedure; Petersonet al., 2002), and particle size (six size classes) weremeasured on sediment from all random and trainingsites. The following PAH compounds were measured
Crane et al. / Aquatic Ecosystem Health and Management 8 (2005) 323–349 327
by GC/MS-SIM on 42 random and 9 training sitesamples: acenaphthene, acenaphthylene, anthracene,benz(a)anthracene, benzo(b)fluoranthene, benzo(k)-fluoranthene, benzo(g,h,i)perylene, benzo(a)pyrene,chrysene, dibenz(a,h)anthracene, fluoranthene, fluo-rene, indeno(1,2,3-cd)pyrene, naphthalene, perylene,phenanthrene, and pyrene. The analysis of PCBs,by the immunoassay method, was dropped from thisstudy because a comparison of the results of PCBsmeasured by GC/ECD in an earlier contaminatedsediment survey of the Duluth-Superior Harbor(Schubauer-Berigan and Crane, 1997) indicated thatapproximately 90% of the sites sampled were belowthe detection limit of the immunoassay method.
Low molecular weight (LMW) PAHs were calcu-lated as the sum of the dry weight concentrationsof acenaphthene, acenaphthylene, anthracene, fluorine,naphthalene, and phenanthrene (2-methylnaphthalene,the other LMW PAH, was not measured in thisstudy). High molecular weight (HMW) PAHs werecalculated as the sum of the dry weight concentra-tions of benz(a)anthracene, benzo(a)pyrene, chrysene,dibenz(a,h)anthracene, fluoranthene, and pyrene. TotalPAHs were calculated as both the sum of the LMW andHMW PAHs (TPAH12) and as the sum of the 17 PAHsmeasured in this study (TPAH17).
A statistical summary of the dry weight concentra-tions of individual PAHs and TPAHs17 was completedby calculating the arithmetic mean and standard de-viation of random samples in each habitat class. Inaddition, the range of low and high values was de-termined for each habitat class. A t-test (α = 0.05)was conducted on the mean TPAH17 concentrations inthe shallow and channelized habitats using SigmaStat©R
Version 3.0. Ratios of phenanthrene/anthracene andfluoranthene/pyrene were calculated for each sample,and the arithmetic mean and standard deviation weredetermined for the random samples in each habitatclass. The percentage composition of individual PAHswas calculated by normalizing the individual PAHconcentrations by the TPAH17 value for each habi-tat class, and multiplying the result by 100. Sum-mary statistics of the arithmetic mean, standard de-viation, and range were determined for both habitatclasses.
Chemical and physical parameter data from all ran-dom sites were pooled together for conducting linearregression analyses using SigmaPlot©R 8.0. Ninety-five percent confidence intervals and prediction in-tervals were plotted, but no data points exceedingthese intervals were excluded from the regressionanalyses.
Mean probable effect concentrationquotients (PEC-Qs)
A subset of the sediment chemistry data were com-pared to Level II sediment quality targets (SQTs)adopted for use in the St. Louis River AOC (Crane et al.,2000, 2002a). The Level II SQTs are intended to iden-tify contaminant concentrations above which harmfuleffects on sediment-dwelling organisms are likely tobe frequently (i.e., ≥75%) or always observed. Most ofthe Level II SQTs were composed of consensus-basedprobable effect concentrations (PECs; MacDonaldet al., 2000). The PEC values were determined to be re-liable if the predictive ability was ≥75% for ≥20 sam-ples (MacDonald et al., 2000). The predictive abilityof the numerical SQTs was evaluated using the match-ing sediment chemistry and toxicity data set for the St.Louis River AOC as described in Crane et al. (2000,2002a). This evaluation involved determination of theincidence of toxicity to amphipods (Hyalella azteca)and midges (Chironomus dilutus, formally known asC. tentans) within five ranges of Level II SQT quotients(i.e., mean PEC quotients, PEC-Qs). The incidence oftoxicity was determined based on the results of 10 dtoxicity tests with amphipods (endpoints: survival andgrowth) and 10 d toxicity tests with midges (endpoints:survival and growth). For both toxicity tests, the inci-dence of toxicity increased as the mean PEC-Q rangesincreased. Thus, the predictive ability of the Level IISQTs (through the use of mean PEC-Qs) was improvedwhen the SQTs for the various chemicals of potentialconcern were used together to classify sediments fromthe St. Louis River AOC (Crane et al., 2000, 2002a).
For this study, an evaluation was conducted to deter-mine the incidence of toxicity and incidence of high im-pact sites (based on macroinvertebrate indices) withinthe following ranges of mean PEC-Qs: ≤0.1, >0.1 to≤0.5, >0.5 to ≤1.0, >1.0 to ≤5.0, and >5.0. Theseranges were analogous to the mean PEC-Q ranges usedby Ingersoll et al. (2001) and Crane et al. (2000, 2002a)to evaluate the predictive ability of freshwater sedimentquality guidelines and SQTs. In this evaluation, meanPEC-Qs were calculated using the methods that wererecommended by Ingersoll et al. (2001) and outlinedin Crane et al. (2000, 2002a). In brief, mean PEC-Qswere calculated as follows:
PEC-Q = chemical concentration (dry wt.)
corresponding PEC value
mean PEC-Q = (mean PEC-Qmetals + PEC-QTotal PAHs
+ PEC-QTotal PCBs)/n
328 Crane et al. / Aquatic Ecosystem Health and Management 8 (2005) 323–349
where n = number of classes of chemicals for whichsediment chemistry data were available (i.e., 1 to 3).
Only the metals (i.e., arsenic, cadmium, chromium,copper, lead, nickel, and zinc) for which reliable LevelII SQTs were available were used to calculate meanPEC-Qs (Crane et al., 2000, 2002a). As a conserva-tive estimate, SEM concentrations were assumed to beequivalent to total metal concentrations for Cd, Cu,Ni, Pb and Zn. This assumption was based on eval-uating a sediment quality data set for the MississippiRiver (Canfield et al., 1998) in which both SEM andtotal metals were measured. For each sample, the ra-tios of the SEM and total concentration for each ofthe five metals were calculated (D. MacDonald, pers.comm., 2004). The average ratio was then calculatedfor each metal. The results of these analyses showedthat the ratios for the various metals averaged about70 to 75%, which was considered within the range ofanalytical variability. Thereafter, SEM and total met-als were treated as functionally equivalent in a NorthAmerica-wide database of matching sediment chem-istry and toxicity data (i.e., the SEDTOX database;(Field et al., 2002; MacDonald et al., 2002)).
The PEC for total PAHs was used in the calcula-tion to avoid double counting the individual PAH PECvalues (MacDonald et al., 2000). Since PCBs were notmeasured in this study, the mean PEC-Q values werebased on two classes of chemicals.
Descriptive statistics of mean PEC-Q values forthe random sites (shallow and channelized habitats)and training sites (low impact and high impact) wereconducted using SigmaStat©R Version 2.0. A Kruskal-Wallis one way analysis of variance (ANOVA) on ranksof median mean PEC-Qs was conducted on the fourgroups of sites since the normality test failed (p <
0.001) for conducting an ANOVA on mean PEC-Qs forthese groups. A pairwise multiple comparison (Dunn’sMethod) was used to isolate the group or groups thatdiffered from the others.
Toxicity testing
Microtox©R tests: Two Microtox©R acute toxicityscreening assays were conducted on all random andtraining site sediment samples: 1) the solid-phase test,and 2) a 90% pore water screening test. Both the solid-phase and pore water assays measure the reductionin bioluminescence of the marine bacteria Photobac-terium phosphoreum. For the solid-phase test, methodsfollowed those described in Brouwer et al. (1990) andTung et al. (1990). Bacteria were directly exposed to anaqueous sediment suspension for 20 min., after which
the P. phosphoreum were separated from the sedimentby a filter column. The filtrate was then analyzed usingthe Microtox©R toxicity meter (model M500). Data fromthe test were expressed as an EC50, which is defined asthe effective concentration of a sample that causes a50% reduction in luminescence relative to the control.Samples producing an EC50 less than 0.5% (±0.05%)sediment were considered toxic. The 90% pore waterscreening test followed the methods described in theproduct manual (Microbics Corp., 1994). Pore waterwas prepared by centrifugation and was frozen untiltime of analysis. Tests were read at 5 and 15 min. A re-duction in light output of 20% (±0.5%) or greater rel-ative to the controls was considered a toxic response.The criteria chosen for toxic responses in both testswere based on technical discussions with staff fromMicrobics Corp.
Ten-day sediment toxicity tests: The results of thesolid-phase and pore water Microtox©R tests were usedto screen sediment samples for 10 d sediment toxicitytests. Sediment toxicity tests were run on a proportionof the samples that displayed a toxic response in bothMicrotox©R tests (100%), in only the solid-phase test(74%), and in only the pore water test (71%). To re-duce the chance of missing toxic samples due to falsenegative results, sediment toxicity tests were run on41% of sites displaying nontoxic responses in bothMicrotox©R tests. In all, ten-day sediment toxicity testswere conducted on fourteen training sites (all in shal-low areas) and fifty-two random sites (36 shallow and16 channelized habitat sites). The test organisms wereH. azteca (7 to 14 d old) and C. dilutus (third instar oryounger, with at least 50% of the organisms at third in-star). Survival endpoints were compared to organismssimilarly exposed to control sediment collected fromWest Bearskin Lake (Cook County, MN; Ankley et al.,1994a,b). The test organisms were exposed to sedimentsamples in a portable, mini-flow system (Benoit et al.,1993; USEPA, 1994) using modified procedures ofUSEPA (1994) and Crane et al. (1997). The test appara-tus consisted of 300-ml glass beakers held in a glass boxsupplied with water from an acrylic plastic headbox.The test set-up could accommodate a batch of replicatesfor the control and up to 11 test sediments for each ofthe H. azteca and C. dilutus tests, which were run con-currently. In order to conduct the 66 sediment toxicitytests for this study, seven batches of tests were run.
For each batch of toxicity tests, sediments were ho-mogenized by hand, and about 100 ml of sedimentwas added to a 300-ml test beaker. Each sedimenttest was set up with four replicates of H. azteca andfour replicates of C. dilutus. Approximately 170 ml of
Crane et al. / Aquatic Ecosystem Health and Management 8 (2005) 323–349 329
aerated, artesian well water was added to each beaker,and the sediments were allowed to settle from two hrto overnight. The test period began when ten individ-ual organisms were randomly added to each beaker.Tests were conducted at 23◦C on a 16L:8D photope-riod. Each day, two liters of aerated, artesian well waterwere exchanged through each glass box via the head-box delivery system. Hyalella azteca were fed 1 ml ofyeast-cerophyll-trout chow (YTC) each day, whereasC. dilutus were fed 1 ml of Tetrafin daily. Tempera-ture, pH, and dissolved oxygen were measured in eachtreatment daily in the overlying water of one replicatebeaker. Similarly, conductivity was measured on days 0and 10 for the last two batches of toxicity tests. At testtermination, test sediment was sieved through a 425µm mesh screen and all organisms removed. Organ-isms not accounted for were presumed to be dead, andpercent survival was determined. The removed C. dilu-tus for each treatment were placed in aluminum weigh-ing pans, dried at approximately 100◦C for at least 4 h,desiccated to room temperature, and weighed.
A 96 h reference toxicant (NaCl) test was run inconjunction with each batch of toxicity tests to deter-mine the condition and sensitivity of the H. azteca cul-ture (USEPA, 1994). Comparable reference toxicant(NaCl) tests, using C. dilutus, were run with the lasttwo batches of toxicity tests.
The 10 d survival data were statistically analyzedusing TOXSTAT (Gulley and WEST, Inc., 1994). Allsurvival data were expressed as a proportion and trans-formed using an arc sine-square root transformationprior to analysis. The Shapiro-Wilk’s test for normal-ity and Bartlett’s test for homogeneity of variance wererun on the transformed data. Next, an Analysis of Vari-ance (ANOVA) was conducted. Statistical guidelinesgiven in USEPA (1994) and Gilbert (1987) were usedto select the most appropriate parametric or nonpara-metric one-tailed statistical test. A sample was consid-ered toxic when mean percent survival was significantlylower (p = 0.05) than the corresponding response inthe control sediment. Due to a quality assurance/qualitycontrol issue, the growth data were not analyzed. TheLC50 values for the reference toxicant tests were deter-mined by the Trimmed Spearman-Karbar Method.
Benthic macroinvertebrates
Benthic habitats in the St. Louis River AOC were ex-amined by evaluating macroinvertebrate abundance at89 randomized sites. Benthic community structure andfunctional assemblages associated with the St. LouisRiver AOC were compared to the 10 best available
(low impact) sites, as well as 10 impaired-use (highimpact) sites occurring throughout the harbor. Exper-imental design, collection techniques for all sampletypes, and laboratory processing procedures are de-scribed by Breneman et al. (2000). In summary, benthicsamples were collected in triplicate using a petite Ponardredge. Macroinvertebrates were sorted by hand, sub-jected to QA/QC protocols, identified to genus when-ever possible, and total numbers/sample determined.
Benthic invertebrate data were used to generate aset of 21 biological metrics that described the macroin-vertebrate community (Table 1). Biological metricsused to develop an overall score reflect the trophicstatus, functional feeding group distribution, behav-ioral attributes, and taxonomic classifications associ-ated with the benthic community. Information to assigninvertebrate community characteristics was taken fromecological texts (Hilsenhoff, 1981; Wiederholm, 1983;Brinkhurst, 1986; Thorp and Covich, 1991; Merritt andCummins, 1996). Benthic sediment samples from a sin-gle site at the mouth of the Superior entry in AllouezBay were abandoned due to an inability to capture sed-iment particles. Invertebrate data from two sites thatlacked corresponding sediment chemistry and toxicitydata were also excluded from further analysis.
Table 1. Biological metrics created from the benthic macroinverte-brates collected in the lower St. Louis River AOC.
Biological metrics
Abundance values(no. m−2)
Taxonomic richnessper site
By Taxonomic Group By Mechanistic BehaviorAmphipoda BurrowersChironomidae (Diptera) ClimbersDiptera ClingersEphemeroptera SprawlersIsopodaMollusca By Habitat PreferenceOligochaeta Obligate DepositionalPolychaeta TaxaTrichoptera Obligate Erosional Taxa
Mean Number of TaxaBy Trophic Group
CarnivoresDetritivoresHerbivoresOmnivores
Total Macroinvertebrates
330 Crane et al. / Aquatic Ecosystem Health and Management 8 (2005) 323–349
Two methods were used to classify random site sed-iment conditions based on macroinvertebrate commu-nity comparisons with training site results. The firstmethod utilized a modification of a multi-metric ap-proach described by Gerritsen (1995). Metrics havebeen used extensively with fish and benthic commu-nities (Barbour et al., 1995) and are encouraged by theUS EPA as a means of developing biological indicatorsfor evaluating aquatic system health and sediment qual-ity (Barbour et al., 1999). The second method utilizeda multivariate procedure (discriminant function anal-ysis; SAS, 1988) to classify the random sites basedon the community structure associated with the bestavailable conditions as described by Reynoldson et al.(1997). For this study, the calibration procedure forestablishing reference conditions was modified. Thetechnique of using the best available conditions fromamong all sites sampled was simply replaced with aseparate training site data set. This technique was usedto quantitatively assign an upper boundary from low-impact sites and a lower boundary from high-impactsediments within the harbor.
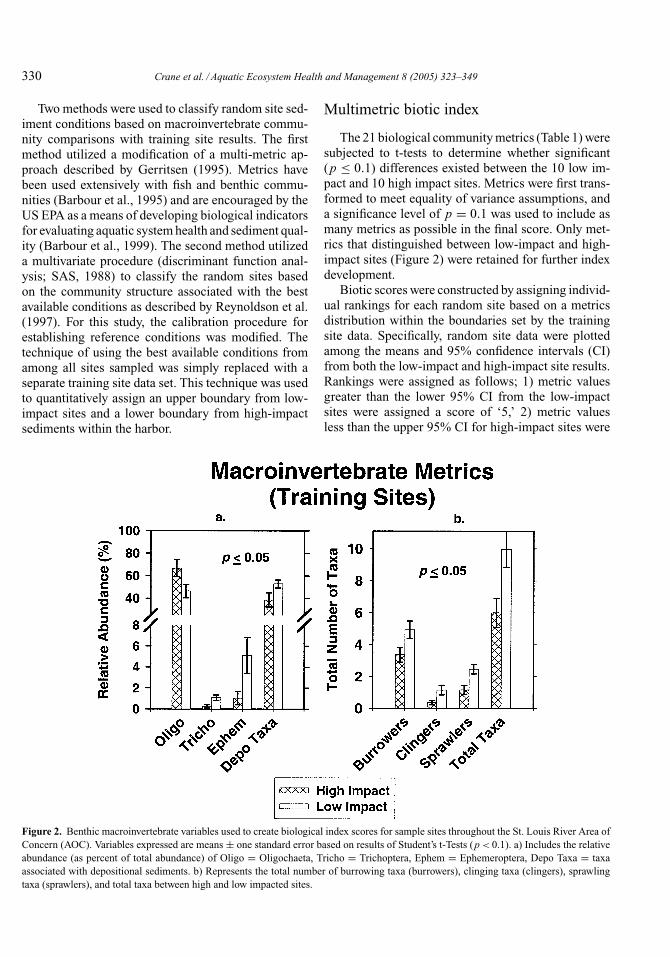
Figure 2. Benthic macroinvertebrate variables used to create biological index scores for sample sites throughout the St. Louis River Area ofConcern (AOC). Variables expressed are means ± one standard error based on results of Student’s t-Tests (p < 0.1). a) Includes the relativeabundance (as percent of total abundance) of Oligo = Oligochaeta, Tricho = Trichoptera, Ephem = Ephemeroptera, Depo Taxa = taxaassociated with depositional sediments. b) Represents the total number of burrowing taxa (burrowers), clinging taxa (clingers), sprawlingtaxa (sprawlers), and total taxa between high and low impacted sites.
Multimetric biotic index
The 21 biological community metrics (Table 1) weresubjected to t-tests to determine whether significant(p ≤ 0.1) differences existed between the 10 low im-pact and 10 high impact sites. Metrics were first trans-formed to meet equality of variance assumptions, anda significance level of p = 0.1 was used to include asmany metrics as possible in the final score. Only met-rics that distinguished between low-impact and high-impact sites (Figure 2) were retained for further indexdevelopment.
Biotic scores were constructed by assigning individ-ual rankings for each random site based on a metricsdistribution within the boundaries set by the trainingsite data. Specifically, random site data were plottedamong the means and 95% confidence intervals (CI)from both the low-impact and high-impact site results.Rankings were assigned as follows; 1) metric valuesgreater than the lower 95% CI from the low-impactsites were assigned a score of ‘5,’ 2) metric valuesless than the upper 95% CI for high-impact sites were
Crane et al. / Aquatic Ecosystem Health and Management 8 (2005) 323–349 331
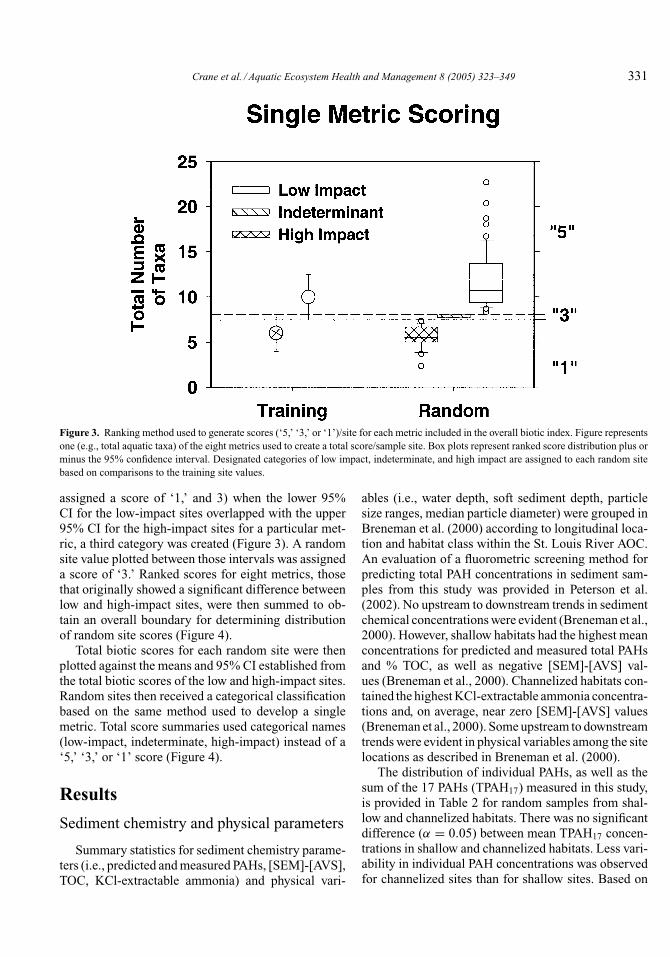
Figure 3. Ranking method used to generate scores (‘5,’ ‘3,’ or ‘1’)/site for each metric included in the overall biotic index. Figure representsone (e.g., total aquatic taxa) of the eight metrics used to create a total score/sample site. Box plots represent ranked score distribution plus orminus the 95% confidence interval. Designated categories of low impact, indeterminate, and high impact are assigned to each random sitebased on comparisons to the training site values.
assigned a score of ‘1,’ and 3) when the lower 95%CI for the low-impact sites overlapped with the upper95% CI for the high-impact sites for a particular met-ric, a third category was created (Figure 3). A randomsite value plotted between those intervals was assigneda score of ‘3.’ Ranked scores for eight metrics, thosethat originally showed a significant difference betweenlow and high-impact sites, were then summed to ob-tain an overall boundary for determining distributionof random site scores (Figure 4).
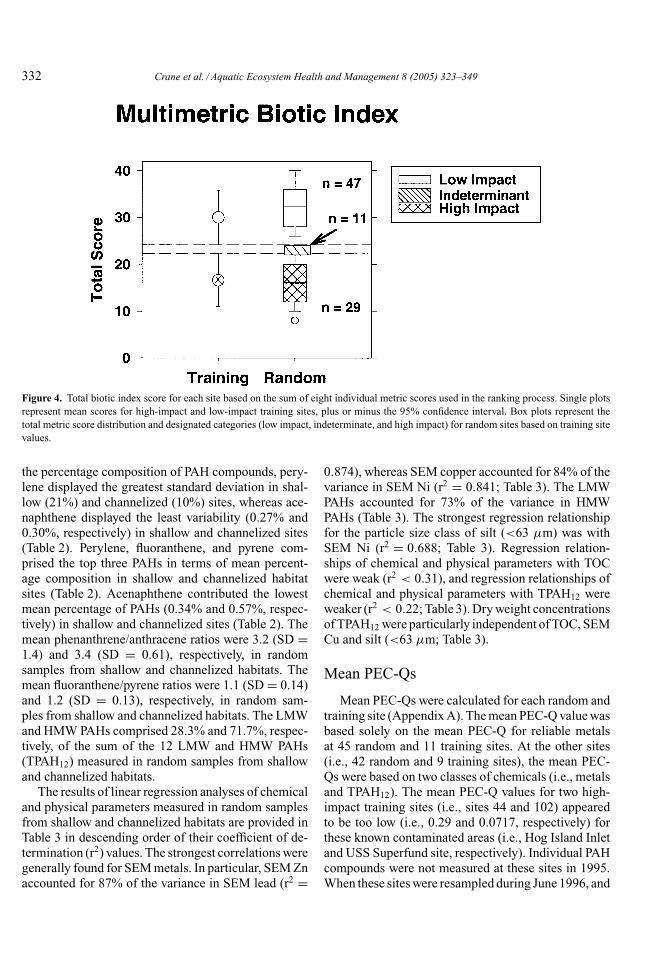
Total biotic scores for each random site were thenplotted against the means and 95% CI established fromthe total biotic scores of the low and high-impact sites.Random sites then received a categorical classificationbased on the same method used to develop a singlemetric. Total score summaries used categorical names(low-impact, indeterminate, high-impact) instead of a‘5,’ ‘3,’ or ‘1’ score (Figure 4).
Results
Sediment chemistry and physical parameters
Summary statistics for sediment chemistry parame-ters (i.e., predicted and measured PAHs, [SEM]-[AVS],TOC, KCl-extractable ammonia) and physical vari-
ables (i.e., water depth, soft sediment depth, particlesize ranges, median particle diameter) were grouped inBreneman et al. (2000) according to longitudinal loca-tion and habitat class within the St. Louis River AOC.An evaluation of a fluorometric screening method forpredicting total PAH concentrations in sediment sam-ples from this study was provided in Peterson et al.(2002). No upstream to downstream trends in sedimentchemical concentrations were evident (Breneman et al.,2000). However, shallow habitats had the highest meanconcentrations for predicted and measured total PAHsand % TOC, as well as negative [SEM]-[AVS] val-ues (Breneman et al., 2000). Channelized habitats con-tained the highest KCl-extractable ammonia concentra-tions and, on average, near zero [SEM]-[AVS] values(Breneman et al., 2000). Some upstream to downstreamtrends were evident in physical variables among the sitelocations as described in Breneman et al. (2000).
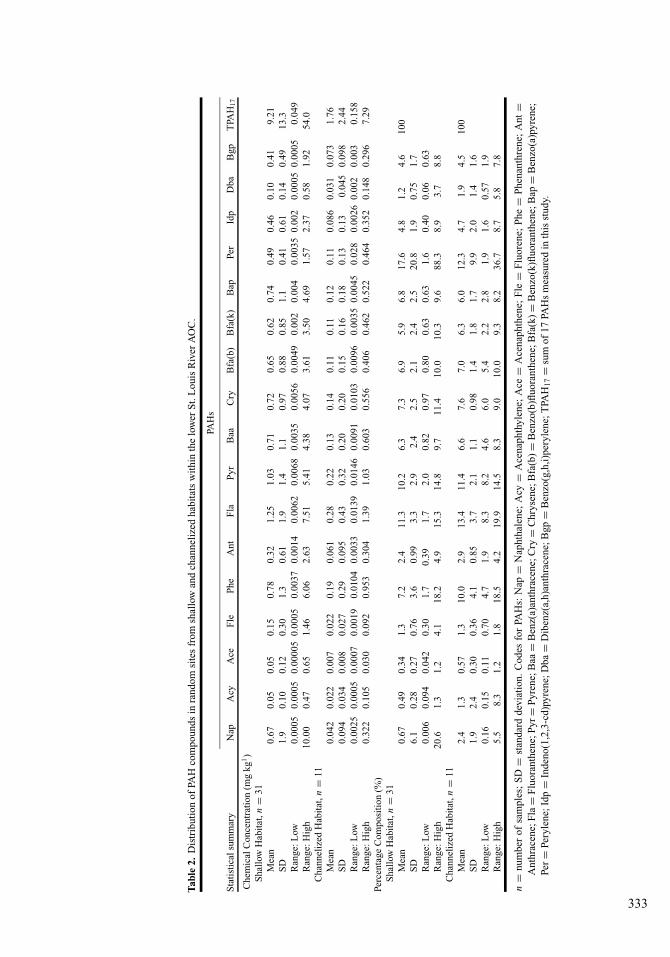
The distribution of individual PAHs, as well as thesum of the 17 PAHs (TPAH17) measured in this study,is provided in Table 2 for random samples from shal-low and channelized habitats. There was no significantdifference (α = 0.05) between mean TPAH17 concen-trations in shallow and channelized habitats. Less vari-ability in individual PAH concentrations was observedfor channelized sites than for shallow sites. Based on
332 Crane et al. / Aquatic Ecosystem Health and Management 8 (2005) 323–349
Figure 4. Total biotic index score for each site based on the sum of eight individual metric scores used in the ranking process. Single plotsrepresent mean scores for high-impact and low-impact training sites, plus or minus the 95% confidence interval. Box plots represent thetotal metric score distribution and designated categories (low impact, indeterminate, and high impact) for random sites based on training sitevalues.
the percentage composition of PAH compounds, pery-lene displayed the greatest standard deviation in shal-low (21%) and channelized (10%) sites, whereas ace-naphthene displayed the least variability (0.27% and0.30%, respectively) in shallow and channelized sites(Table 2). Perylene, fluoranthene, and pyrene com-prised the top three PAHs in terms of mean percent-age composition in shallow and channelized habitatsites (Table 2). Acenaphthene contributed the lowestmean percentage of PAHs (0.34% and 0.57%, respec-tively) in shallow and channelized sites (Table 2). Themean phenanthrene/anthracene ratios were 3.2 (SD =1.4) and 3.4 (SD = 0.61), respectively, in randomsamples from shallow and channelized habitats. Themean fluoranthene/pyrene ratios were 1.1 (SD = 0.14)and 1.2 (SD = 0.13), respectively, in random sam-ples from shallow and channelized habitats. The LMWand HMW PAHs comprised 28.3% and 71.7%, respec-tively, of the sum of the 12 LMW and HMW PAHs(TPAH12) measured in random samples from shallowand channelized habitats.
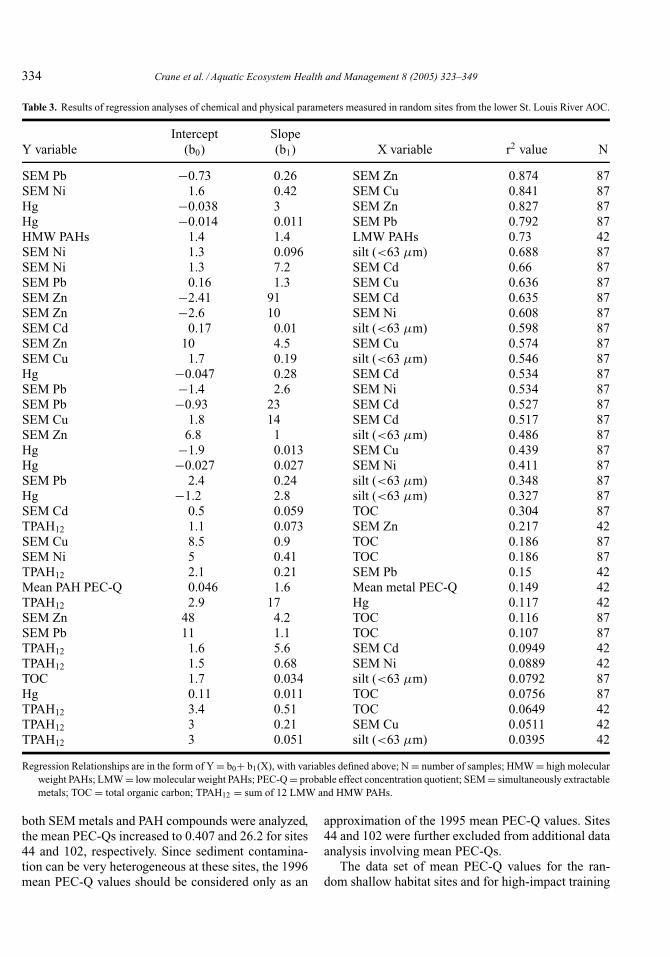
The results of linear regression analyses of chemicaland physical parameters measured in random samplesfrom shallow and channelized habitats are provided inTable 3 in descending order of their coefficient of de-termination (r2) values. The strongest correlations weregenerally found for SEM metals. In particular, SEM Znaccounted for 87% of the variance in SEM lead (r2 =
0.874), whereas SEM copper accounted for 84% of thevariance in SEM Ni (r2 = 0.841; Table 3). The LMWPAHs accounted for 73% of the variance in HMWPAHs (Table 3). The strongest regression relationshipfor the particle size class of silt (<63 µm) was withSEM Ni (r2 = 0.688; Table 3). Regression relation-ships of chemical and physical parameters with TOCwere weak (r2 < 0.31), and regression relationships ofchemical and physical parameters with TPAH12 wereweaker (r2 < 0.22; Table 3). Dry weight concentrationsof TPAH12 were particularly independent of TOC, SEMCu and silt (<63 µm; Table 3).
Mean PEC-Qs
Mean PEC-Qs were calculated for each random andtraining site (Appendix A). The mean PEC-Q value wasbased solely on the mean PEC-Q for reliable metalsat 45 random and 11 training sites. At the other sites(i.e., 42 random and 9 training sites), the mean PEC-Qs were based on two classes of chemicals (i.e., metalsand TPAH12). The mean PEC-Q values for two high-impact training sites (i.e., sites 44 and 102) appearedto be too low (i.e., 0.29 and 0.0717, respectively) forthese known contaminated areas (i.e., Hog Island Inletand USS Superfund site, respectively). Individual PAHcompounds were not measured at these sites in 1995.When these sites were resampled during June 1996, and
Tab
le2.
Dis
trib
utio
nof
PAH
com
poun
dsin
rand
omsi
tes
from
shal
low
and
chan
neli
zed
habi
tats
wit
hin
the
low
erS
t.L
ouis
Riv
erA
OC
.
PAH
s
Sta
tist
ical
sum
mar
yN
apA
cyA
ceF
leP
heA
ntF
laP
yrB
aaC
ryB
fa(b
)B
fa(k
)B
apPe
rId
pD
baB
gpT
PAH
17
Che
mic
alC
once
ntra
tion
(mg
kg1)
Sha
llow
Hab
itat
,n=
31M
ean
0.67
0.05
0.05
0.15
0.78
0.32
1.25
1.03
0.71
0.72
0.65
0.62
0.74
0.49
0.46
0.10
0.41
9.21
SD
1.9
0.10
0.12
0.30
1.3
0.61
1.9
1.4
1.1
0.97
0.88
0.85
1.1
0.41
0.61
0.14
0.49
13.3
Ran
ge:L
ow0.
0005
0.00
050.
0000
50.
0005
0.00
370.
0014
0.00
620.
0068
0.00
350.
0056
0.00
490.
002
0.00
40.
0035
0.00
20.
0005
0.00
050.
049
Ran
ge:H
igh
10.0
00.
470.
651.
466.
062.
637.
515.
414.
384.
073.
613.
504.
691.
572.
370.
581.
9254
.0C
hann
eliz
edH
abit
at,n
=11
Mea
n0.
042
0.02
20.
007
0.02
20.
190.
061
0.28
0.22
0.13
0.14
0.11
0.11
0.12
0.11
0.08
60.
031
0.07
31.
76S
D0.
094
0.03
40.
008
0.02
70.
290.
095
0.43
0.32
0.20
0.20
0.15
0.16
0.18
0.13
0.13
0.04
50.
098
2.44
Ran
ge:L
ow0.
0025
0.00
050.
0007
0.00
190.
0104
0.00
330.
0139
0.01
460.
0091
0.01
030.
0096
0.00
350.
0045
0.02
80.
0026
0.00
20.
003
0.15
8R
ange
:Hig
h0.
322
0.10
50.
030
0.09
20.
953
0.30
41.
391.
030.
603
0.55
60.
406
0.46
20.
522
0.46
40.
352
0.14
80.
296
7.29
Perc
enta
geC
ompo
siti
on(%
)S
hall
owH
abit
at,n
=31
Mea
n0.
670.
490.
341.
37.
22.
411
.310
.26.
37.
36.
95.
96.
817
.64.
81.
24.
610
0S
D6.
10.
280.
270.
763.
60.
993.
32.
92.
42.
52.
12.
42.
520
.81.
90.
751.
7R
ange
:Low
0.00
60.
094
0.04
20.
301.
70.
391.
72.
00.
820.
970.
800.
630.
631.
60.
400.
060.
63R
ange
:Hig
h20
.61.
31.
24.
118
.24.
915
.314
.89.
711
.410
.010
.39.
688
.38.
93.
78.
8C
hann
eliz
edH
abit
at,n
=11
Mea
n2.
41.
30.
571.
310
.02.
913
.411
.46.
67.
67.
06.
36.
012
.34.
71.
94.
510
0S
D1.
92.
40.
300.
364.
10.
853.
72.
11.
10.
981.
41.
81.
79.
92.
01.
41.
6R
ange
:Low
0.16
0.15
0.11
0.70
4.7
1.9
8.3
8.2
4.6
6.0
5.4
2.2
2.8
1.9
1.6
0.57
1.9
Ran
ge:H
igh
5.5
8.3
1.2
1.8
18.5
4.2
19.9
14.5
8.3
9.0
10.0
9.3
8.2
36.7
8.7
5.8
7.8
n=
num
ber
ofsa
mpl
es;
SD
=st
anda
rdde
viat
ion.
Cod
esfo
rPA
Hs:
Nap
=N
apht
hale
ne;
Acy
=A
cena
phth
ylen
e;A
ce=
Ace
naph
then
e;F
le=
Flu
oren
e;P
he=
Phe
nant
hren
e;A
nt=
Ant
hrac
ene;
Fla
=F
luor
anth
ene;
Pyr
=P
yren
e;B
aa=
Ben
z(a)
anth
race
ne;C
ry=
Chr
ysen
e;B
fa(b
)=
Ben
zo(b
)fluo
rant
hene
;Bfa
(k)=
Ben
zo(k
)fluo
rant
hene
;Bap
=B
enzo
(a)p
yren
e;Pe
r=
Pery
lene
;Idp
=In
deno
(1,2
,3-c
d)py
rene
;Dba
=D
iben
z(a,
h)an
thra
cene
;Bgp
=B
enzo
(g,h
,i)pe
ryle
ne;T
PAH
17=
sum
of17
PAH
sm
easu
red
inth
isst
udy.
333
334 Crane et al. / Aquatic Ecosystem Health and Management 8 (2005) 323–349
Table 3. Results of regression analyses of chemical and physical parameters measured in random sites from the lower St. Louis River AOC.
Intercept SlopeY variable (b0) (b1) X variable r2 value N
SEM Pb −0.73 0.26 SEM Zn 0.874 87SEM Ni 1.6 0.42 SEM Cu 0.841 87Hg −0.038 3 SEM Zn 0.827 87Hg −0.014 0.011 SEM Pb 0.792 87HMW PAHs 1.4 1.4 LMW PAHs 0.73 42SEM Ni 1.3 0.096 silt (<63 µm) 0.688 87SEM Ni 1.3 7.2 SEM Cd 0.66 87SEM Pb 0.16 1.3 SEM Cu 0.636 87SEM Zn −2.41 91 SEM Cd 0.635 87SEM Zn −2.6 10 SEM Ni 0.608 87SEM Cd 0.17 0.01 silt (<63 µm) 0.598 87SEM Zn 10 4.5 SEM Cu 0.574 87SEM Cu 1.7 0.19 silt (<63 µm) 0.546 87Hg −0.047 0.28 SEM Cd 0.534 87SEM Pb −1.4 2.6 SEM Ni 0.534 87SEM Pb −0.93 23 SEM Cd 0.527 87SEM Cu 1.8 14 SEM Cd 0.517 87SEM Zn 6.8 1 silt (<63 µm) 0.486 87Hg −1.9 0.013 SEM Cu 0.439 87Hg −0.027 0.027 SEM Ni 0.411 87SEM Pb 2.4 0.24 silt (<63 µm) 0.348 87Hg −1.2 2.8 silt (<63 µm) 0.327 87SEM Cd 0.5 0.059 TOC 0.304 87TPAH12 1.1 0.073 SEM Zn 0.217 42SEM Cu 8.5 0.9 TOC 0.186 87SEM Ni 5 0.41 TOC 0.186 87TPAH12 2.1 0.21 SEM Pb 0.15 42Mean PAH PEC-Q 0.046 1.6 Mean metal PEC-Q 0.149 42TPAH12 2.9 17 Hg 0.117 42SEM Zn 48 4.2 TOC 0.116 87SEM Pb 11 1.1 TOC 0.107 87TPAH12 1.6 5.6 SEM Cd 0.0949 42TPAH12 1.5 0.68 SEM Ni 0.0889 42TOC 1.7 0.034 silt (<63 µm) 0.0792 87Hg 0.11 0.011 TOC 0.0756 87TPAH12 3.4 0.51 TOC 0.0649 42TPAH12 3 0.21 SEM Cu 0.0511 42TPAH12 3 0.051 silt (<63 µm) 0.0395 42
Regression Relationships are in the form of Y = b0+ b1(X), with variables defined above; N = number of samples; HMW = high molecularweight PAHs; LMW = low molecular weight PAHs; PEC-Q = probable effect concentration quotient; SEM = simultaneously extractablemetals; TOC = total organic carbon; TPAH12 = sum of 12 LMW and HMW PAHs.
both SEM metals and PAH compounds were analyzed,the mean PEC-Qs increased to 0.407 and 26.2 for sites44 and 102, respectively. Since sediment contamina-tion can be very heterogeneous at these sites, the 1996mean PEC-Q values should be considered only as an
approximation of the 1995 mean PEC-Q values. Sites44 and 102 were further excluded from additional dataanalysis involving mean PEC-Qs.
The data set of mean PEC-Q values for the ran-dom shallow habitat sites and for high-impact training
Crane et al. / Aquatic Ecosystem Health and Management 8 (2005) 323–349 335
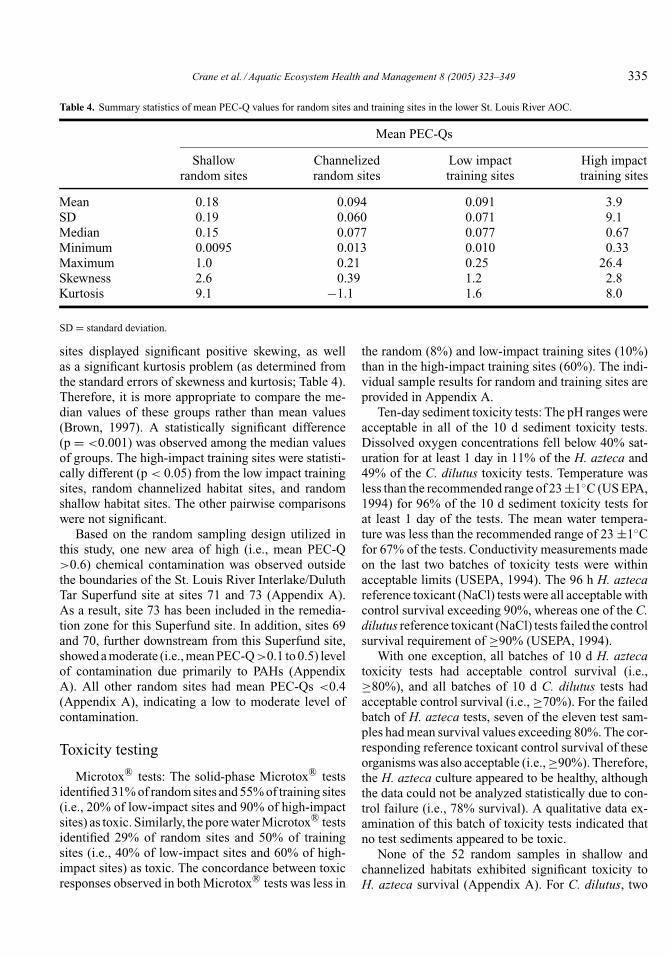
Table 4. Summary statistics of mean PEC-Q values for random sites and training sites in the lower St. Louis River AOC.
Mean PEC-Qs
Shallow Channelized Low impact High impactrandom sites random sites training sites training sites
Mean 0.18 0.094 0.091 3.9SD 0.19 0.060 0.071 9.1Median 0.15 0.077 0.077 0.67Minimum 0.0095 0.013 0.010 0.33Maximum 1.0 0.21 0.25 26.4Skewness 2.6 0.39 1.2 2.8Kurtosis 9.1 −1.1 1.6 8.0
SD = standard deviation.
sites displayed significant positive skewing, as wellas a significant kurtosis problem (as determined fromthe standard errors of skewness and kurtosis; Table 4).Therefore, it is more appropriate to compare the me-dian values of these groups rather than mean values(Brown, 1997). A statistically significant difference(p = <0.001) was observed among the median valuesof groups. The high-impact training sites were statisti-cally different (p < 0.05) from the low impact trainingsites, random channelized habitat sites, and randomshallow habitat sites. The other pairwise comparisonswere not significant.
Based on the random sampling design utilized inthis study, one new area of high (i.e., mean PEC-Q>0.6) chemical contamination was observed outsidethe boundaries of the St. Louis River Interlake/DuluthTar Superfund site at sites 71 and 73 (Appendix A).As a result, site 73 has been included in the remedia-tion zone for this Superfund site. In addition, sites 69and 70, further downstream from this Superfund site,showed a moderate (i.e., mean PEC-Q>0.1 to 0.5) levelof contamination due primarily to PAHs (AppendixA). All other random sites had mean PEC-Qs <0.4(Appendix A), indicating a low to moderate level ofcontamination.
Toxicity testing
Microtox©R tests: The solid-phase Microtox©R testsidentified 31% of random sites and 55% of training sites(i.e., 20% of low-impact sites and 90% of high-impactsites) as toxic. Similarly, the pore water Microtox©R testsidentified 29% of random sites and 50% of trainingsites (i.e., 40% of low-impact sites and 60% of high-impact sites) as toxic. The concordance between toxicresponses observed in both Microtox©R tests was less in
the random (8%) and low-impact training sites (10%)than in the high-impact training sites (60%). The indi-vidual sample results for random and training sites areprovided in Appendix A.
Ten-day sediment toxicity tests: The pH ranges wereacceptable in all of the 10 d sediment toxicity tests.Dissolved oxygen concentrations fell below 40% sat-uration for at least 1 day in 11% of the H. azteca and49% of the C. dilutus toxicity tests. Temperature wasless than the recommended range of 23 ±1◦C (US EPA,1994) for 96% of the 10 d sediment toxicity tests forat least 1 day of the tests. The mean water tempera-ture was less than the recommended range of 23 ±1◦Cfor 67% of the tests. Conductivity measurements madeon the last two batches of toxicity tests were withinacceptable limits (USEPA, 1994). The 96 h H. aztecareference toxicant (NaCl) tests were all acceptable withcontrol survival exceeding 90%, whereas one of the C.dilutus reference toxicant (NaCl) tests failed the controlsurvival requirement of ≥90% (USEPA, 1994).
With one exception, all batches of 10 d H. aztecatoxicity tests had acceptable control survival (i.e.,≥80%), and all batches of 10 d C. dilutus tests hadacceptable control survival (i.e., ≥70%). For the failedbatch of H. azteca tests, seven of the eleven test sam-ples had mean survival values exceeding 80%. The cor-responding reference toxicant control survival of theseorganisms was also acceptable (i.e., ≥90%). Therefore,the H. azteca culture appeared to be healthy, althoughthe data could not be analyzed statistically due to con-trol failure (i.e., 78% survival). A qualitative data ex-amination of this batch of toxicity tests indicated thatno test sediments appeared to be toxic.
None of the 52 random samples in shallow andchannelized habitats exhibited significant toxicity toH. azteca survival (Appendix A). For C. dilutus, two
336 Crane et al. / Aquatic Ecosystem Health and Management 8 (2005) 323–349
random sediment samples (sites 13 and 43) were sig-nificantly toxic at p = 0.05 (Appendix A). Site 13 waslocated in a channel east of the Blatnik Bridge, adjacentto a cement facility. Site 43 was located at the Hog Is-land Inlet/Newton Creek area in Superior, WI; this areais contaminated with diesel range organics (i.e., mid-range petroleum products such as diesel or fuel oil),PAHs, oil and grease, lead, chromium, and mercury(Redman and Janisch, 1995; SEH Inc., 2000, 2003).The specific cause of toxicity could not be determinedfor either site.
Toxicity tests were conducted on 14 training sitesediment samples (Appendix A). For H. azteca, sites56, 72, 77, and 102 had a significant reduction in meansurvival compared to the corresponding control at p =0.05. For C. dilutus, sites 44, 56, 72, 99, and 102 hadsignificant toxicity; all of these sites, except 44, causedcomplete mortality of C. dilutus. All of the training siteswhich caused significant acute toxicity, except site 77(Kimballs Bay), were in a priori high-impact areas.
Benthic macroinvertebrate communityclassification
Multimetric analysis: Eight of the 21 macroinver-tebrate metrics provided significant (p < 0.1) differ-ences between high-impact and low-impact trainingsites (Figure 2). These metrics were used to create anoverall biotic score. The metrics included percent abun-dance values from Ephemeroptera, Oligochaeta, Tri-choptera, and obligate depositional taxa. Oligochaetawere the most numerous taxa in both habitat types.Ephemeroptera, Trichoptera, and obligate deposi-tional taxa were observed in low densities at high-impact training sites, where Oligochaeta numbers wereabundant. Since Oligochaeta have been reported tohave high tolerance to contaminants (Breneman andPontasch, 1994), the Oligochaeta metric was scoredto reflect those conditions. An increase in Oligochaetaabundance produced lower ranked scores per site. Theremaining four significant metrics reflected aspects ofspecies richness with respect to three common behav-ioral categories (burrowers, clingers, crawlers) and to-tal taxa richness. All taxa metrics had lower values inhigh-impact training sites.
Total multimetric scores at training sites rangedfrom 8 to 38, with 40 as a possible total score (Figure 4).High-impact training sites had significantly lower val-ues (t-test, p ≤ 0.05) than low-impact training sites.The random sites had total multimetric scores similarto the same range of values as observed in the trainingsite data set. Most random sites (55%) were classified as
low impact by the multimetric approach (Appendix A).Thirty-six percent of the random sites were classified ashigh impact, and 9% were classified as indeterminate(Appendix A). A larger portion (48%) of the randomchannelized habitat sites were classified as high impactthan the random shallow habitat sites (25%).
Discriminant function analysis: Backwards selec-tion techniques retained 16 of 18 benthic metrics inthe discriminant function analysis for the training sites.The two metrics eliminated from the model includedDiptera abundance and those taxa associated with onlydepositional habitats. Using the retained metrics, therewas a significant difference between high-impact andlow-impact training sites (MANOVA F = 113.17, p =0.0012). The 16 metric discriminant function classifiedthe training sites perfectly (cross validated error rate =0%).
A larger proportion of the random sites were classi-fied as high impact with the discriminant analysis tech-nique. The discriminant function classified 48 (55%)of the random sites as high impact and 39 (45%) as lowimpact (Appendix A). A larger proportion (69%) of therandom channelized sites were classified as high impactthan were the random shallow sites (48%). All randomsites were classified with greater than 98% probability;therefore, no sites were classified into the indeterminatecategory.
Comparison of techniques: The multimetric tech-nique classified the random sites as follows: 36% highimpact, 55% low impact and 9% as indeterminate. Incomparison, 55% of random sites were classified ashigh impact using the discriminant function analysisand 45% of sites as low impact. Of the 31 random sitesclassified as high impact by the multimetric technique,22 sites (71%) were similarly classified as high impactin the discriminant function analysis (Appendix A). Inaddition, the multimetric method classified 48 randomsites as low impact that included 28 sites (58%) simi-larly classified by the discriminant function procedure.
Classifications were also compared with respect tothe location of sites along the length of the St. LouisRiver estuary (Figure 1). Both methods generally clas-sified more sites in the upper estuary as low impact anda larger portion of the lower estuary sites as high im-pact (Figure 5). This dichotomy was strongest, however,with the multimetric method which classified very fewof the upper sites (4%) as high impact. In contrast, over40% of the sites in the upper estuary were classified ashigh impact by the multivariate procedure. The discrim-inant function analysis, however, classified over 50% ofthe sites as high impact in all regions. Both techniquesidentified an increase in the number of sites classified as
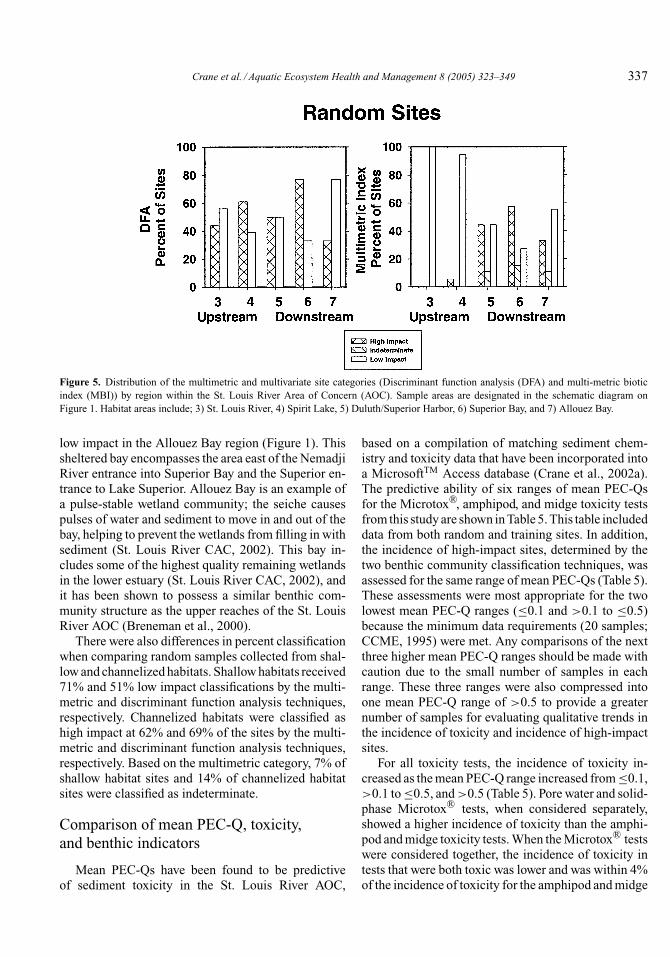
Crane et al. / Aquatic Ecosystem Health and Management 8 (2005) 323–349 337
Figure 5. Distribution of the multimetric and multivariate site categories (Discriminant function analysis (DFA) and multi-metric bioticindex (MBI)) by region within the St. Louis River Area of Concern (AOC). Sample areas are designated in the schematic diagram onFigure 1. Habitat areas include; 3) St. Louis River, 4) Spirit Lake, 5) Duluth/Superior Harbor, 6) Superior Bay, and 7) Allouez Bay.
low impact in the Allouez Bay region (Figure 1). Thissheltered bay encompasses the area east of the NemadjiRiver entrance into Superior Bay and the Superior en-trance to Lake Superior. Allouez Bay is an example ofa pulse-stable wetland community; the seiche causespulses of water and sediment to move in and out of thebay, helping to prevent the wetlands from filling in withsediment (St. Louis River CAC, 2002). This bay in-cludes some of the highest quality remaining wetlandsin the lower estuary (St. Louis River CAC, 2002), andit has been shown to possess a similar benthic com-munity structure as the upper reaches of the St. LouisRiver AOC (Breneman et al., 2000).
There were also differences in percent classificationwhen comparing random samples collected from shal-low and channelized habitats. Shallow habitats received71% and 51% low impact classifications by the multi-metric and discriminant function analysis techniques,respectively. Channelized habitats were classified ashigh impact at 62% and 69% of the sites by the multi-metric and discriminant function analysis techniques,respectively. Based on the multimetric category, 7% ofshallow habitat sites and 14% of channelized habitatsites were classified as indeterminate.
Comparison of mean PEC-Q, toxicity,and benthic indicators
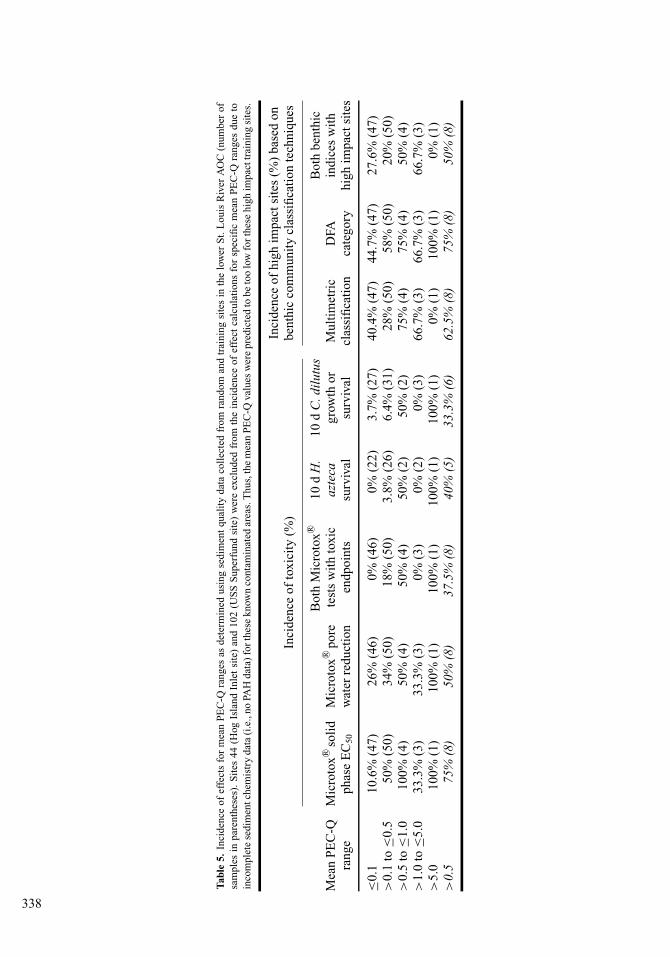
Mean PEC-Qs have been found to be predictiveof sediment toxicity in the St. Louis River AOC,
based on a compilation of matching sediment chem-istry and toxicity data that have been incorporated intoa MicrosoftTM Access database (Crane et al., 2002a).The predictive ability of six ranges of mean PEC-Qsfor the Microtox©R, amphipod, and midge toxicity testsfrom this study are shown in Table 5. This table includeddata from both random and training sites. In addition,the incidence of high-impact sites, determined by thetwo benthic community classification techniques, wasassessed for the same range of mean PEC-Qs (Table 5).These assessments were most appropriate for the twolowest mean PEC-Q ranges (≤0.1 and >0.1 to ≤0.5)because the minimum data requirements (20 samples;CCME, 1995) were met. Any comparisons of the nextthree higher mean PEC-Q ranges should be made withcaution due to the small number of samples in eachrange. These three ranges were also compressed intoone mean PEC-Q range of >0.5 to provide a greaternumber of samples for evaluating qualitative trends inthe incidence of toxicity and incidence of high-impactsites.
For all toxicity tests, the incidence of toxicity in-creased as the mean PEC-Q range increased from ≤0.1,>0.1 to ≤0.5, and >0.5 (Table 5). Pore water and solid-phase Microtox©R tests, when considered separately,showed a higher incidence of toxicity than the amphi-pod and midge toxicity tests. When the Microtox©R testswere considered together, the incidence of toxicity intests that were both toxic was lower and was within 4%of the incidence of toxicity for the amphipod and midge
Tab
le5.
Inci
denc
eof
effe
cts
for
mea
nP
EC
-Qra
nges
asde
term
ined
usin
gse
dim
ent
qual
ity
data
coll
ecte
dfr
omra
ndom
and
trai
ning
site
sin
the
low
erS
t.L
ouis
Riv
erA
OC
(num
ber
ofsa
mpl
esin
pare
nthe
ses)
.S
ites
44(H
ogIs
land
Inle
tsi
te)
and
102
(US
SS
uper
fund
site
)w
ere
excl
uded
from
the
inci
denc
eof
effe
ctca
lcul
atio
nsfo
rsp
ecifi
cm
ean
PE
C-Q
rang
esdu
eto
inco
mpl
ete
sedi
men
tche
mis
try
data
(i.e
.,no
PAH
data
)for
thes
ekn
own
cont
amin
ated
area
s.T
hus,
the
mea
nP
EC
-Qva
lues
wer
epr
edic
ted
tobe
too
low
fort
hese
high
impa
cttr
aini
ngsi
tes.
Inci
denc
eof
toxi
city
(%)
Inci
denc
eof
high
impa
ctsi
tes
(%)
base
don
bent
hic
com
mun
ity
clas
sifi
cati
onte
chni
ques
Mea
nP
EC
-Qra
nge
Mic
roto
x©Rso
lid
phas
eE
C50
Mic
roto
x©Rpo
rew
ater
redu
ctio
n
Bot
hM
icro
tox©R
test
sw
ith
toxi
cen
dpoi
nts
10d
H.
azte
casu
rviv
al
10d
C.d
ilut
usgr
owth
orsu
rviv
alM
ulti
met
ric
clas
sifi
cati
onD
FAca
tego
ry
Bot
hbe
nthi
cin
dice
sw
ith
high
impa
ctsi
tes
≤0.1
10.6
%(4
7)26
%(4
6)0%
(46)
0%(2
2)3.
7%(2
7)40
.4%
(47)
44.7
%(4
7)27
.6%
(47)
>0.
1to
≤0.5
50%
(50)
34%
(50)
18%
(50)
3.8%
(26)
6.4%
(31)
28%
(50)
58%
(50)
20%
(50)
>0.
5to
≤1.0
100%
(4)
50%
(4)
50%
(4)
50%
(2)
50%
(2)
75%
(4)
75%
(4)
50%
(4)
>1.
0to
≤5.0
33.3
%(3
)33
.3%
(3)
0%(3
)0%
(2)
0%(3
)66
.7%
(3)
66.7
%(3
)66
.7%
(3)
>5.
010
0%(1
)10
0%(1
)10
0%(1
)10
0%(1
)10
0%(1
)0%
(1)
100%
(1)
0%(1
)>
0.5
75%
(8)
50%
(8)
37.5
%(8
)40
%(5
)33
.3%
(6)
62.5
%(8
)75
%(8
)50
%(8
)
338
Crane et al. / Aquatic Ecosystem Health and Management 8 (2005) 323–349 339
toxicity tests at mean PEC-Q ranges of ≤0.1 and >0.5and within 14% at the mean PEC-Q range of >0.1 to≤0.5. Of the 14 random and training sites that had sig-nificant toxic responses in both Microtox©R tests, 50%of these sites were also toxic in either one or both ofthe corresponding amphipod and midge toxicity tests.
For the discriminant function analysis technique,the incidence of high-impact sites increased as themean PEC-Q range increased from ≤0.1, >0.1 to≤0.5, and >0.5 (Table 5). The multimetric classifica-tion showed a higher incidence of high-impact sites atmean PEC-Qs of ≤0.1 than at >0.1 to ≤0.5, followedby an increase in high impact sites at mean PEC-Qs>0.5. When both benthic indices were consideredtogether, the incidence of high-impact sites in bothindices decreased for most mean PEC-Q rangescompared to the individual indices.
Discussion
This study provided a good comparison of sedimentassessment techniques within a Great Lakes Harbor andEmbayment resource class and also provided a meansfor assessing the status of this resource utilizing the USEPA’s EMAP statistical sampling concepts. The vari-ous assessment techniques used in this study providedsome generalities in trends and results but also showeddistinct differences in the nature of their response toenvironmental conditions. These differences are usefulfor assessing condition and evaluating their potentialfor future trend and assessment monitoring.
Estuarine benthic fauna can provide a reliable andsensitive indicator of disturbance from chemical stres-sors at exposure levels that are well below those as-sociated with a similar incidence of sediment toxicityin laboratory survival tests with single marine species(Hyland et al., 1999, 2003). In the St. Louis RiverAOC, the macroinvertebrate community appeared tobe more sensitive to physical disturbances of the re-gion than the acute toxicity tests at low mean PEC-Qs.Breneman et al. (2000) found that the strongest en-vironmental factors influencing macrobenthos in theSt. Louis River AOC were physical parameters. Thesephysical variables were water depth and site distancefrom the headwaters (Breneman et al., 2000). Whenconsidering both benthic indices together, the classifi-cation of more high-impact sites in channelized habi-tats (48%) than shallow habitats (14%) and greaterproportion of high-impact sites in the lower regionsof the harbor with commercial activity are consistentwith those observations. The navigation channels in theDuluth-Superior Harbor must be periodically dredged
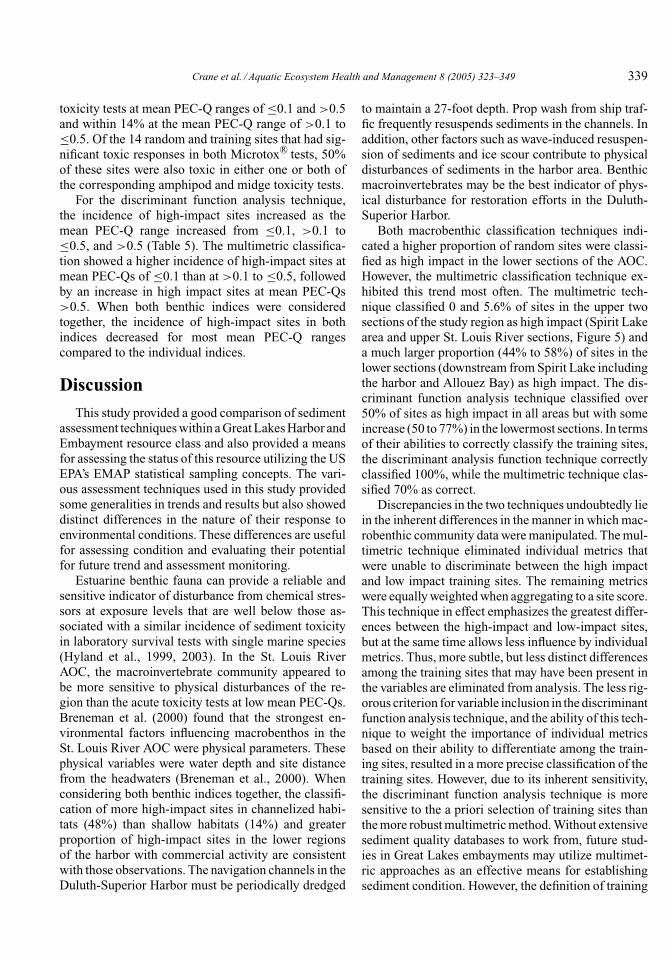
to maintain a 27-foot depth. Prop wash from ship traf-fic frequently resuspends sediments in the channels. Inaddition, other factors such as wave-induced resuspen-sion of sediments and ice scour contribute to physicaldisturbances of sediments in the harbor area. Benthicmacroinvertebrates may be the best indicator of phys-ical disturbance for restoration efforts in the Duluth-Superior Harbor.
Both macrobenthic classification techniques indi-cated a higher proportion of random sites were classi-fied as high impact in the lower sections of the AOC.However, the multimetric classification technique ex-hibited this trend most often. The multimetric tech-nique classified 0 and 5.6% of sites in the upper twosections of the study region as high impact (Spirit Lakearea and upper St. Louis River sections, Figure 5) anda much larger proportion (44% to 58%) of sites in thelower sections (downstream from Spirit Lake includingthe harbor and Allouez Bay) as high impact. The dis-criminant function analysis technique classified over50% of sites as high impact in all areas but with someincrease (50 to 77%) in the lowermost sections. In termsof their abilities to correctly classify the training sites,the discriminant analysis function technique correctlyclassified 100%, while the multimetric technique clas-sified 70% as correct.
Discrepancies in the two techniques undoubtedly liein the inherent differences in the manner in which mac-robenthic community data were manipulated. The mul-timetric technique eliminated individual metrics thatwere unable to discriminate between the high impactand low impact training sites. The remaining metricswere equally weighted when aggregating to a site score.This technique in effect emphasizes the greatest differ-ences between the high-impact and low-impact sites,but at the same time allows less influence by individualmetrics. Thus, more subtle, but less distinct differencesamong the training sites that may have been present inthe variables are eliminated from analysis. The less rig-orous criterion for variable inclusion in the discriminantfunction analysis technique, and the ability of this tech-nique to weight the importance of individual metricsbased on their ability to differentiate among the train-ing sites, resulted in a more precise classification of thetraining sites. However, due to its inherent sensitivity,the discriminant function analysis technique is moresensitive to the a priori selection of training sites thanthe more robust multimetric method. Without extensivesediment quality databases to work from, future stud-ies in Great Lakes embayments may utilize multimet-ric approaches as an effective means for establishingsediment condition. However, the definition of training
340 Crane et al. / Aquatic Ecosystem Health and Management 8 (2005) 323–349
sites needs to be clearly delineated. The eight macroin-vertebrate metrics utilized in this study may providerobust indicators in other Great Lakes embayments.However, their utility should be evaluated in otherareas.
Polycyclic aromatic hydrocarbons are widespreadchemicals of potential concern in the lower St. LouisRiver estuary. The percentage compositions of LMWand HMW PAHs in the random site samples of thisstudy were similar to site-specific observations in bothMinnesota Slip and Slip C in the Duluth Harbor (Craneet al., 2002b). The mean phenanthrene/anthracene andfluoranthene/pyrene ratios were indicative of pyro-genic (combustion) sources of PAHs to the estuary(i.e., phenanthrene/anthracene ratio <10 and fluoran-thene/pyrene ratio >1.0; Budzinski et al., 1997). Thehigh percentage composition of perylene in some sed-iment samples may be due to other sources. The pres-ence of perylene in sediments has often been attributedto early diagenesis of organic matter (Wakeham et al.,1980a; Venkatesan, 1988). Recent radiocarbon resultsindicate that both natural (diagenetic) and anthro-pogenic (fossil fuel combustion) sources of perylenewere evident in two marine sediments (Reddy et al.,2002). The high mean fluoranthene and pyrene con-centrations in the random samples from shallow andchannelized habitats were consistent with these com-pounds being the most abundant individual combus-tion PAHs observed in sediments from the Washingtoncoastal region (Prahl and Carpenter, 1984) and through-out the world (Laflamme and Hites, 1978; Wakehamet al., 1980b).
The lack of correlations between TPAH12 and ei-ther TOC or silt (<63 µm) in the random site sedi-ments may be due to multiple sources of PAHs in thelower St. Louis River watershed and to a broad range(0.02–19.2%) of TOC values in the lower estuary. Incontrast, a site-specific study at Slip C in the DuluthHarbor (Crane, 1999) demonstrated strong correlationsbetween total PAHs and TOC, as well as silt (53–2 µm).Mercury and SEM metals accounted for less than 22%of the variance in TPAH12 in the random site sam-ples of this study, whereas mercury and lead have beenfound to account for 77 and 88%, respectively, of thevariance in total PAHs in Slip C (Crane, 1999). Thus,the broad, random sampling strategy of this R-EMAPstudy may mask out chemical concentration trends atsmall, contaminated sites that have limited sources ofcontaminants.
Although the EMAP sampling design is unbiasedwith respect to space, it may be biased with respect torisk (Suter, 2001). Sampling randomly over space tends
to emphasize the importance of wide-spread stressorssuch as introduced species and land use and minimizepotentially severe stressors such as point source efflu-ents, waste dumping, gravel dredging, mine drainage,or failures of mine or animal waste lagoons (Suter,2001). A number of known contaminated sediment ar-eas in the Duluth-Superior Harbor were missed in theselection of random sites, indicating a combination ofrandom and purposive sampling should be conductedin future status and trends monitoring to characterizethe full range of aquatic ecological risks in the har-bor and the rest of the St. Louis River AOC. A mixedstrategy of random and purposive sampling will alsoallow state agencies, responsible parties, Natural Re-source Trustees (including federal partners), the St.Louis River Citizens Action Committee (CAC), andother stakeholders to more effectively track changes insediment quality after remediation actions and habi-tat restoration efforts have been implemented at sitesrequiring remediation.
Survival was the principal metric for the short-termamphipod and midge toxicity tests. The chronic 28 to42 d H. azteca toxicity test is more sensitive than ei-ther the 10 d amphipod or midge tests (Ingersoll et al.,2001), and its use would reduce the potential for falsenegatives at low mean PEC-Qs. Because longer-termtoxicity tests provide the most effective mean of dis-criminating among moderately contaminated sedimentsamples and because in situ benthic macroinvertebratesare exposed to contaminated sediments for an extendedperiod, it would be prudent in future R-EMAP studiesto evaluate sediment toxicity using the 28 to 42 d H.azteca test (endpoints: survival and growth) in sedi-ments with mean PEC-Qs <5.0. However, it would bemore cost-effective to utilize acute toxicity tests to char-acterize the toxicity of highly contaminated sediments(i.e., mean PEC-Qs ≥5.0).
Although the combined use of the pore water andsolid phase Microtox©R tests provided a better indi-cator of acute sediment toxicity than the individualMicrotox©R tests, it still greatly overestimated the occur-rence of acute toxicity in concurrent random samples(Appendix A). Only 14% of the random sites in whichtoxic responses were observed in both Microtox©R testsalso exhibited corresponding toxicity in either the 10 dH. azteca or C. dilutus tests. However, the combinationof both Microtox©R tests was a strong indicator of sed-iment toxicity in the high impact training sites wheretoxic responses in both Microtox©R tests correspondedto 83% of these sites also exhibiting toxicity in eitheracute toxicity test (Appendix A). In particular, sites56, 72, and 102 displayed toxicity in both Microtox©R
Crane et al. / Aquatic Ecosystem Health and Management 8 (2005) 323–349 341
tests and both acute toxicity tests. Site 56 was locatednear the outfall of the Western Lake Superior Sani-tary District, site 72 was located within the St. LouisRiver Interlake/Duluth Tar Superfund site, and site 102was located within the USS Superfund site. Significantacute toxicity to C. dilutus has been observed at eachof these contaminated sites during previous sedimentinvestigations (Crane et al., 1997; Schubauer-Beriganand Crane, 1997).
Benton et al. (1995) noted that extreme cautionshould be taken in interpreting the results of solid-phaseMicrotox©R tests when testing sediments of varyingcomposition or that may be differentially contaminatedor contain a suite of contaminants. Pardos et al. (1999)demonstrated the role of elemental sulfur in giving falsepositive toxicity results in the Microtox©R bioassay. Al-though elemental sulfur was not measured in sedimentsfrom the St. Louis River AOC, sulfide may be oxidizedto elemental sulfur by bacteria in sediments. The mostlabile fraction of sulfides in sediments is representedby AVS, and AVS is associated with the more solu-ble iron and manganese monosulfides (Di Toro et al.,1990). Acid volatile sulfide was detected in 78% of therandom sites and 95% of the training sites. Due to thepotential for a majority of these sites to form elementalsulfur, interpretation of the pore water and solid phaseMicrotox©R tests is difficult.
A more complete assessment of sediment qualityin the lower St. Louis River AOC was attained using aweight-of-evidence approach of several sediment qual-ity indicators. A sediment quality triad assessment wasconducted for 52 random sites that included all threecomponents of the Triad (i.e., sediment chemistry, 10 dsediment toxicity tests with midges and amphipods,and benthic macroinvertebrate community structure).Possible conclusions of the triad results were based onChapman (1992). For 21% of these sites, there wasstrong evidence for the absence of pollution-induceddegradation (Table 6). For 71% of sites, alteration of thebenthic macroinvertebrate community was probablynot due to toxic chemical contamination (Table 6). Eachof the following scenarios applied to about 2% of sites:contaminants were not bioavailable, unmeasured toxicchemicals caused degradation, chemicals were eithernot bioavailable or alteration of the benthic macroin-vertebrate community was not due to toxic chemi-cals, and unmeasured chemicals or conditions existedthat had the potential to cause degradation. These re-sults were consistent with Breneman et al.’s (2000)finding that physical habitat features best explainedvariability in benthic macroinvertebrate communitystructure in the lower St. Louis River AOC based on
multivariate redundancy analysis on 13 environmentalparameters.
The potential for sediment-associated use impair-ments to aquatic life (e.g., fish) at the random Triadsites was as follows: highly unlikely (21%), unlikely(73%), and likely (6%; Table 6). Channelized habi-tat sites were more unlikely (94%) to cause impair-ments to aquatic life than shallow habitat sites (64%).These findings are consistent with field observationsin the lower St. Louis River AOC. Native fish popula-tions have rebounded since water quality in the estuarybegan to improve in the late 1970s (St. Louis RiverCAC, 2002). Approximately 45 native species havebeen documented by state agencies in the lower St.Louis River. Piscivorous species such as yellow perch,white bass, muskie, walleye and northern pike con-tribute to a popular sport fishery in this area. Althoughthe Triad approach does not indicate a high degree ofimpairments to aquatic life, this approach does not con-sider bioaccumulation. Fish consumption guidelinesfor human health are currently in effect for a num-ber of fish species in the lower estuary, primarily dueto mercury contamination (MDH, 2002). In addition,chronic impacts to aquatic life were not assessed in thisstudy.
We recommend that the Triad approach be used infuture R-EMAP surveys of the lower St. Louis RiverAOC. Furthermore, we recommend measuring con-ventional metals instead of SEM and AVS for mak-ing comparisons to the Level I and Level II SQTs(Crane et al., 2000, 2002a). Long et al. (1998) noted thatrelative to SEM:AVS concentrations, sediment guide-lines based upon dry weight-normalized concentra-tions were equally or slightly more accurate in predict-ing both nontoxic and toxic results in laboratory tests.When SEM exceeds AVS by a factor of 5 (on a mo-lar basis), a higher incidence of toxicity (80 to 90%)has been observed in freshwater and saltwater sedi-ment amphipod tests (USEPA, 1997). This situation didnot occur in the St. Louis River sediments (AppendixA). Most sites that were toxic to amphipods and/ormidges had a greater concentration of AVS comparedto SEM metals, implying that SEM metals were prob-ably not available for uptake by benthic biota. Morseand Rickard (2004) noted that AVS is metastable andas the AVS minerals dissolve, any metals sequesteredwith them also dissolve and the final trace metal toxic-ity is determined by their behavior with respect to pyriterather than AVS. Thus, the toxicity of these samples ap-pears to be due to other chemicals such as PAHs. FutureR-EMAP surveys should also take into considerationthe potential for phototoxicity of PAHs (Monson et al.,
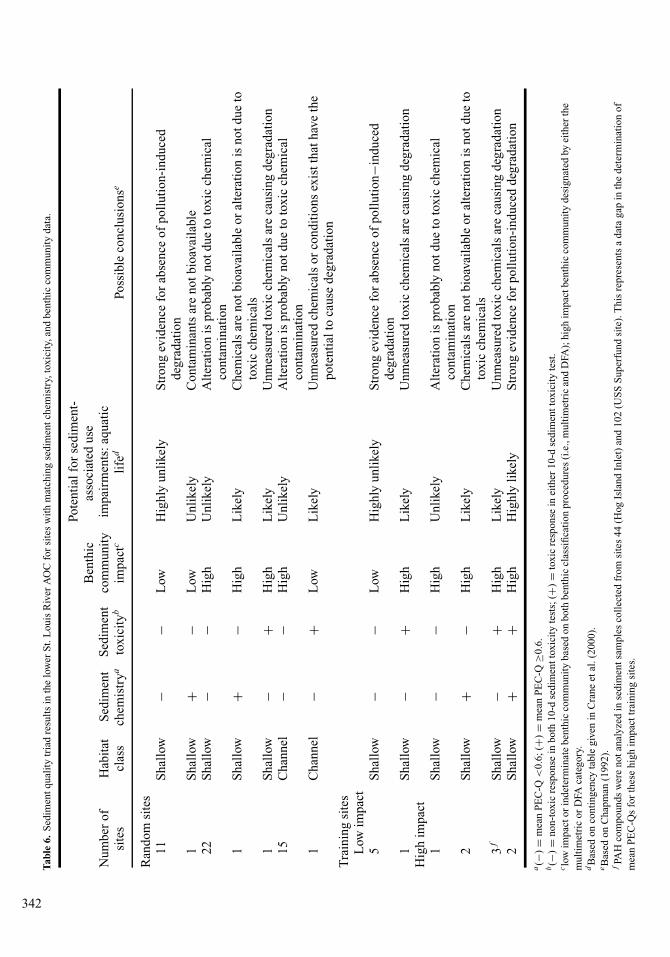
Tab
le6.
Sed
imen
tqua
lity
tria
dre
sult
sin
the
low
erS
t.L
ouis
Riv
erA
OC
for
site
sw
ith
mat
chin
gse
dim
entc
hem
istr
y,to
xici
ty,a
ndbe
nthi
cco
mm
unit
yda
ta.
Num
ber
ofsi
tes
Hab
itat
clas
sS
edim
ent
chem
istr
yaS
edim
ent
toxi
city
b
Ben
thic
com
mun
ity
impa
ctc
Pote
ntia
lfor
sedi
men
t-as
soci
ated
use
impa
irm
ents
:aqu
atic
life
dPo
ssib
leco
nclu
sion
se
Ran
dom
site
s11
Sha
llow
−−
Low
Hig
hly
unli
kely
Str
ong
evid
ence
for
abse
nce
ofpo
llut
ion-
indu
ced
degr
adat
ion
1S
hall
ow+
−L
owU
nlik
ely
Con
tam
inan
tsar
eno
tbio
avai
labl
e22
Sha
llow
−−
Hig
hU
nlik
ely
Alt
erat
ion
ispr
obab
lyno
tdue
toto
xic
chem
ical
cont
amin
atio
n1
Sha
llow
+−
Hig
hL
ikel
yC
hem
ical
sar
eno
tbio
avai
labl
eor
alte
rati
onis
notd
ueto
toxi
cch
emic
als
1S
hall
ow−
+H
igh
Lik
ely
Unm
easu
red
toxi
cch
emic
als
are
caus
ing
degr
adat
ion
15C
hann
el−
−H
igh
Unl
ikel
yA
lter
atio
nis
prob
ably
notd
ueto
toxi
cch
emic
alco
ntam
inat
ion
1C
hann
el−
+L
owL
ikel
yU
nmea
sure
dch
emic
als
orco
ndit
ions
exis
ttha
thav
eth
epo
tent
ialt
oca
use
degr
adat
ion
Tra
inin
gsi
tes
Low
impa
ct5
Sha
llow
−−
Low
Hig
hly
unli
kely
Str
ong
evid
ence
for
abse
nce
ofpo
llut
ion−
indu
ced
degr
adat
ion
1S
hall
ow−
+H
igh
Lik
ely
Unm
easu
red
toxi
cch
emic
als
are
caus
ing
degr
adat
ion
Hig
him
pact
1S
hall
ow−
−H
igh
Unl
ikel
yA
lter
atio
nis
prob
ably
notd
ueto
toxi
cch
emic
alco
ntam
inat
ion
2S
hall
ow+
−H
igh
Lik
ely
Che
mic
als
are
notb
ioav
aila
ble
oral
tera
tion
isno
tdue
toto
xic
chem
ical
s3
fS
hall
ow−
+H
igh
Lik
ely
Unm
easu
red
toxi
cch
emic
als
are
caus
ing
degr
adat
ion
2S
hall
ow+
+H
igh
Hig
hly
like
lyS
tron
gev
iden
cefo
rpo
llut
ion-
indu
ced
degr
adat
ion
a(−
)=
mea
nP
EC
-Q<
0.6;
(+)=
mea
nP
EC
-Q≥0
.6.
b(−
)=
non-
toxi
cre
spon
sein
both
10-d
sedi
men
ttox
icit
yte
sts;
(+)=
toxi
cre
spon
sein
eith
er10
-dse
dim
entt
oxic
ity
test
.clo
wim
pact
orin
dete
rmin
ate
bent
hic
com
mun
ity
base
don
both
bent
hic
clas
sifi
cati
onpr
oced
ures
(i.e
.,m
ulti
met
ric
and
DFA
);hi
ghim
pact
bent
hic
com
mun
ity
desi
gnat
edby
eith
erth
em
ulti
met
ric
orD
FAca
tego
ry.
dB
ased
onco
ntin
genc
yta
ble
give
nin
Cra
neet
al.(
2000
).eB
ased
onC
hapm
an(1
992)
.fPA
Hco
mpo
unds
wer
eno
tana
lyze
din
sedi
men
tsam
ples
coll
ecte
dfr
omsi
tes
44(H
ogIs
land
Inle
t)an
d10
2(U
SS
Sup
erfu
ndsi
te).
Thi
sre
pres
ents
ada
taga
pin
the
dete
rmin
atio
nof
mea
nP
EC
-Qs
for
thes
ehi
ghim
pact
trai
ning
site
s.
342
Crane et al. / Aquatic Ecosystem Health and Management 8 (2005) 323–349 343
1995; Diamond et al., 2003) in shallow areas and thatsequestration in sediments affects the bioavailability ofhydrophobic organic chemicals to benthic organisms(Kraaij et al., 2002; Ghosh et al., 2003).
This study has demonstrated that the US EPA’sEMAP concepts can be effectively applied to the GreatLakes Harbors and Embayments resource class. Ad-ditional sediment quality indicators that could be ap-plied at other Great Lakes sites are given in Crane et al.(2000). Although R-EMAP studies are resource inten-sive, they are vital for tracking the health of harbors andembayments over time. This type of information is es-pecially important for reaching decisions on whethersediment-related impairments at Great Lakes AOCshave been alleviated enough to contribute to the delist-ing of AOCs.
Acknowledgments
We wish to thank the many participants of thisstudy. Harold Wiegner, Scot Beebe, Patti King, CarolHubbard, and Jerry Flom, all of the Minnesota Pollu-tion Control Agency (MPCA), provided field samplingassistance and conducted the 10 d sediment toxicitytests. James Beaumaster (MPCA) provided graphicalsupport. Field assistance and benthic sample process-ing was conducted by Jacque Alexander, John Juaire,Barb Peichel, Maartje Thjssen, and Aaron Undelandat the University of Minnesota Duluth (UMD) NaturalResources Research Institute (NRRI), Duluth, MN. Inaddition, Sherry Bertelsen, Tim Corry, Jill Scharold,and Jo Thompson, USEPA Duluth, MN, assistedin processing benthic samples. Sediment chemistryanalyses were conducted by John Ameel, Rich Axler,Sarah Kohlbry, Keith Lodge, Irene Moser, and GregPeterson at the Analytical Chemistry Laboratory andTrace Organic Laboratory at UMD-NRRI. Microtox©R
analyses were conducted by Greg Peterson and ChrisOwen at UMD-NRRI. Particle size analyses weredone by Keith Lodge at UMD-NRRI. This researchwas largely supported by Cooperative AgreementCR823497 between the MPCA and US EPA andGrant Contract Number 47002 between the MPCAand UMD-NRRI. This research was partially sup-ported by the Minnesota Sea Grant College Program(MSGCP), and this paper is journal No. JR 505 ofthe MSGCP. This paper is journal No. 368 of theCenter for Water and the Environment of the NRRI.The views expressed herein are those of the authorsand do not necessarily reflect the views of the MPCA,UMD-NRRI, Minnesota Sea Grant, or the USEPA.
ReferencesAnkley, G. T., Benoit, D. A., Balogh, J. C., Reynoldson, T. B., Day,
K. E., Hoke, R. A., 1994a. Evaluation of potential confoundingfactors in sediment toxicity tests with three freshwater benthicinvertebrates. Environ. Toxicol. Chem. 13, 627–635.
Ankley, G. T., Call, D. J., Cox, J. S., Kahl, M. D., Hoke, R. A., Kosian,P. A., 1994b. Organic carbon partitioning as a basis for predictingthe toxicity of chlorpyrifos in sediments. Environ. Toxicol. Chem.13, 621–626.
Barbour, M. T., Stribling, J. B., Karr, J. R., 1995. Multimetric ap-proach for establishing biocriteria and measuring biological con-dition. In: W. S. Davis and T. P. Simon (Eds.), Biological As-sessment and Criteria: Tools for Water Resource Planning andDecision Making, pp. 63–76. Lewis Publishers, Ann Arbor, MI.
Barbour, M. T., Gerritsen, J., Snyder, B. D., Stribling, J. B., 1999.Rapid bioassessment protocols for use in streams and wadeablerivers: Periphyton, benthic macroinvertebrates and fish, SecondEdition. Office of Water, USEPA, Washington, DC. EPA 841-B-99-002.
Benoit, D. A., Phipps, G., Ankley, G. T., 1993. A sediment testingintermittent renewal system for the automated renewal of over-lying water in toxicity tests with contaminated sediments. WaterRes. 27, 1403–1412.
Benton, M. J., Malott, M. L., Knight, S. S., Cooper, C. M., Benson,W. H., 1995. Influence of sediment composition on apparent tox-icity in a solid-phase test using bioluminescent bacteria. Environ.Toxicol. Chem. 14, 411–414.
Breneman, D., Pontasch, K., 1994. Stream microcosm toxicity tests:predicting the effects of fenvalerate on riffle insect communities.Environ. Toxicol. Chem. 13, 381–387.
Breneman, D., Richards, C., Lozano, S., 2000. Environmental influ-ences on benthic community structure in a Great Lakes embay-ment. J. Great Lakes Res. 26, 287–304.
Brinkhurst, R. O., 1986. Guide to the freshwater aquatic microdrileoligochaetes of North America. Can. Spec. Publ. Fish. Aquat.Sci. 84,1– 259.
Brouwer, H., Murphy, T., McArdle, L., 1990. A sediment-contactbioassay with Photobacterium phosphoreum. Environ. Toxicol.Chem. 9, 1353–1358.
Brown, J. D., 1997. Skewness and kurtosis. Shiken: JALT Testing &Evaluation. SIG Newsletter. 1, 16–18.
Budzinski, H., Raoux, C., Baumard, P., Bellocq, J., Garrigues, P.,1995. In: Grimalt, J., Dorronsorro, C. (Eds.), Organic Geo-chemistry: Developments and Applications to Energy, Climate,Environment and Human History, pp. 616–618. A.I.G.O.A.:Donostia: San Sebastian, Spain.
Burton, G. A., Jr., Ingersoll, C. G., 1994. Evaluation of sediment tox-icity. In: PTI Environmental Services (Eds.), Assessment Guid-ance Document, pp. 86–130. Great Lakes National Program Of-fice, USEPA, Chicago, IL. EPA 905-B94-002.
Canfield, T., La Point, T., Swift, M., 1994a. Assessment of ben-thic invertebrate community structure. In: PTI EnvironmentalServices (Eds.), Assessment Guidance Document, pp.131–175.Great Lakes National Program Office, USEPA, Chicago, IL. EPA905-B94-002.
Canfield, T. J., Kemble, N. E., Brumbaugh, W. G., Dwyer, F. J., In-gersoll, C. G., Fairchild, J. F., 1994b. Use of benthic invertebratecommunity structure and the sediment quality triad to evaluate
344 Crane et al. / Aquatic Ecosystem Health and Management 8 (2005) 323–349
metal-contaminated sediment in the upper Clark Fork River, MT.Environ. Toxicol. Chem. 13, 1999–2012.
Canfield, T. J., Dwyer, F. J., Fairchild, J. F., Haverland, P. S., In-gersoll, C. G., Kemble, N. E., Mount, D. R., La Point, T. W.,Burton, G. A., Swift, M. C., 1996. Assessing contamination inGreat Lakes sediments using benthic invertebrate communitiesand the sediment quality triad approach. J. Great Lakes Res. 22,565–583.
Canfield, T. J., Brunson, E. L., Dwyer, F. J., Ingersoll, C. G., Kemble,N. E., 1998. Assessing sediments from the upper MississippiRiver navigational pools using benthic invertebrate evaluationsand the sediment quality triad approach. Arch. Environ. Contam.Toxicol. 35, 202–212.
CCME, 1995. Protocol for the derivation of Canadian sediment qual-ity guidelines for the protection of aquatic life. Task Group onWater Quality Guidelines, Canadian Council of Ministers of theEnvironment, Ottawa, ON.
Chapman, P. M., 1992. Sediment quality triad approach. In: USEPASediment Oversight Technical Committee (Eds.), Sediment Clas-sification Methods Compendium, pp. 10–1 to 10–18. Office ofWater, USEPA, Washington, DC. EPA 823-R-92-006.
Chapman, P. M., Dexter, R. N., Long, E. R., 1987. Synoptic mea-sures of sediment contamination, toxicity and infaunal commu-nity composition (the Sediment Quality Triad) in San FranciscoBay. Mar. Ecol. Prog. Ser. 37, 75–96.
Chapman, P. M., Anderson, B., Carr, S., Engle, V., Green, R.,Hameedi, J., Harmon, M., Haverland, P., Hyland, F., Ingersoll,C., Long, E., Rodgers, J., Salazar, M., Sibley, P. K., Smith, P. J.,Swartz, R. C., Thompson, B., Windom, H., 1997. General guide-lines for using the sediment quality triad. Mar. Pollut. Bull. 34,368–372.
Crane, J. L., 1999. Assessment of contaminated sediments inSlip C, Duluth Harbor, Minnesota. Great Lakes NationalProgram Office, USEPA, Chicago, IL. EPA-905-R-99-007.(http://www.pca.state.mn.us/water/sediments/slipc.pdf)
Crane, J. L., Schubauer-Berigan, M., Schmude, K., 1997. Sedimentassessment of hotspot areas in the Duluth/Superior Harbor. GreatLakes National Program Office, USEPA, Chicago, IL. EPA-905-R97-020. (http://www.pca.state.mn.us/water/sediments/94mudpuppy.pdf)
Crane, J. L., MacDonald, D. D., Ingersoll, C. G., Smorong,D. E., Lindskoog, R. A., Severn, C. G., Berger, T. A., Field,L. J., 2000. Development of a framework for evaluating nu-merical sediment quality targets and sediment contaminationin the St. Louis River Area of Concern. Great Lakes Na-tional Program Office, USEPA, Chicago, IL. EPA-905-R-00-008.(http://www.pca.state.mn.us/water/sediments/sqt-slraoc.pdf)
Crane, J. L., MacDonald, D. D., Ingersoll, C. G., Smorong, D. E.,Lindskoog, R. A., Severn, C. G., Berger, T. A., Field, L. J., 2002a.Evaluation of numerical sediment quality targets for the St. LouisRiver Area of Concern. Arch. Environ. Contam. Toxicol. 43,1–10.
Crane, J. L., Smorong, D. E., Pillard, D. A., MacDonald, D. D.,2002b. Sediment remediation scoping project in Minnesota Slip,Duluth Harbor. Great Lakes National Program Office, USEPA,Chicago, IL. EPA-905-R-02-002. (http://www.pca.state.mn.us/water/sediments/mnslipreport.pdf)
Diamond, S. A., Milroy, N. J., Mattson, V. R., Heinis, L. J., Mount,D. R., 2003. Photoactivated toxicity in amphipods collected from
polycyclic aromatic hydrocarbon-contaminated sites. Environ.Toxicol. Chem. 22, 2752–2760.
Di Toro, D. M., Mahony, J. D., Hansen, D. J., Scott, K. J., Hicks,M. B., Mayr, S. M., Redmond, M. S., 1990. Toxicity of cadmiumin sediments: The role of acid volatile sulfide. Environ. Toxicol.Chem. 9, 1487–1502.
Field, L. J., MacDonald, D. D., Norton, S. B., Ingersoll, C. G., Severn,C. G., Smorong, D., Lindskoog, R., 2002. Predicting amphipodtoxicity from sediment chemistry using logistic regression mod-els. Environ. Toxicol. Chem. 21, 1993–2005.
Fox, R., Landrum, P., McCrone, L., 1994. Introduction. In: PTI En-vironmental Services (Eds.), Assessment Guidance Document,pp. 1–9. Great Lakes National Program Office, USEPA, Chicago,IL. EPA 905-B94-002.
Gerritsen, J., 1995. Additive biological indices for resource manage-ment. J. N. Am. Benthol. Soc. 14, 451–457.
Ghosh, U., Zimmerman, J. R., Luthy, R. G., 2003. PCB and PAH spe-ciation among particle types in contaminated harbor sedimentsand effects on PAH bioavailability. Environ. Sci. Technol. 37,2209–2217.
Gilbert, G. O., 1987. Statistical Methods in Environmental PollutionMonitoring. Van Nostrand Reinhold, New York, NY.
Gulley, D. D., WEST, Inc., 1994. TOXSTAT 3.4. WEST, Inc.,Cheyenne, WY.
Hilsenhoff, W. L., 1981. Aquatic Insects of Wisconsin. Keys toWisconsin Genera and Notes on Biology, Distribution, andSpecies. Natural History Council, University of Wisconsin-Madison, Madison, WI.
Hyland, J. L., Van Dolah, R. F., Snoots, T. R., 1999. Predicting stress inbenthic communities of southeastern U.S. estuaries in relation tochemical contamination of sediments. Environ. Toxicol. Chem.18, 2557–2564.
Hyland, J. L., Balthis, W. L., Engle, V. D., Long, E. R., Paul, J. F.,Summers, J. K., Van Dolah, R. F., 2003. Incidence of stress inbenthic communities along the U.S. Atlantic and Gulf of Mexicocoasts within different ranges of sediment contamination fromchemical mixtures. Environ. Monitoring Assess. 81, 149–161.
IJC (International Joint Commission), 1989. Great Lakes water qual-ity agreement of 1978 (as amended by Protocol signed November18, 1987). IJC, Windsor, ON.
Ingersoll, C. G., MacDonald, D. D., Wang, N., Crane, J. L., Field,L. J., Haverland, P. S., Kemble, N. E., Lindskoog, R. A., Severn,C., Smorong, D. E., 2001. Predictions of sediment toxicity usingconsensus-based freshwater sediment quality guidelines. Arch.Environ. Contam. Toxicol. 41, 8–21.
IT Corporation, 1997. Remedial investigation data report, sedimentoperable unit, St. Louis River/Interlake/Duluth Tar site. Volume1 of 5. International Technology Corp., St. Paul, MN.
Kraaij, R., Seinen, W., Tolls, J., Cornelissen, G., Belfroid, A. C.,2002. Direct evidence of sequestration in sediments affectingthe bioavailability of hydrophobic organic chemicals to benthicdeposit-feeders. Environ. Sci. Technol. 36, 3525–3529.
Laflamme, R. E., Hites, R. A., 1978. The global distribution ofpolycyclic aromatic hydrocarbons in recent sediments. Geochim.Cosmochim. Acta. 42, 289–303.
Long, E. R., Chapman, P. M., 1985. A sediment quality triad: Mea-sures of sediment contamination, toxicity and infaunal commu-nity composition in Puget Sound. Mar. Pollut. Bull. 16, 405–415.
Crane et al. / Aquatic Ecosystem Health and Management 8 (2005) 323–349 345
Long, E. R., Wilson, C. J., 1997. On the identification of toxic hotspots using measures of the sediment quality triad. Mar. Pollut.Bull. 34, 373–374.
Long, E. R., MacDonald, D. D., Cubbage, J. C., Ingersoll, C. G., 1998.Predicting the toxicity of sediment-associated trace metals withsimultaneously extracted trace metal:acid volatile sulfide con-centrations and dry weight-normalized concentrations: A criticalcomparison. Environ. Toxicol. Chem. 17, 972–974.
MacDonald, D. D., Ingersoll, C. G., Berger, T. A., 2000. Developmentand evaluation of consensus-based sediment quality guidelinesfor freshwater ecosystems. Arch. Environ. Contam. Toxicol. 39,20–31.
MacDonald, D. D., Ingersoll, C. G., Smorong, D. E., Lindskoog,R. A., Sparks, D. W., Smith, J. R., Simon, T. P., Hanacek, M.A., 2002. An assessment of injury to sediments and sediment-dwelling organisms in the Grand Calumet River and Indiana Har-bor Area of Concern. Arch. Environ. Cont. Toxicol. 43, 141–155.
MDH (Minnesota Department of Health), 2002. Site-specific mealadvice for tested lakes and rivers. Environmental Health Division,MDH, St. Paul, MN.
Merritt, R. W., Cummins, K. W. (Eds.), 1996. An Introduction to theAquatic Insects of North America, 3rd ed. Kendall/Hunt Publish-ing Co., Dubuque, IA.
Microbics Corp., 1994. Microtox7 M500 manual: A toxicity testinghandbook. Vol. 3. Microbics Corporation, Carlsbad, CA.
Monson, P. D., Ankley, G. T., Kosian, P. A., 1995. Phototoxic re-sponse of Lumbriculus variegatus to sediments contaminated bypolycyclic aromatic hydrocarbons. Environ. Toxicol. Chem. 14,891–894.
Morse, J. W., Rickard, D., 2004. Chemical dynamics of sedimentaryacid volatile sulfide. Environ. Sci. Technol. 38, 131A–136A.
MPCA (Minnesota Pollution Control Agency), WDNR (WisconsinDepartment of Natural Resources), 1992. The St. Louis Riversystem remedial action plan. Stage one. MPCA, St. Paul, MN andWDNR, Madison, WI. (http://www.stlouisriver.org/rap.html)
MPCA, WDNR, 1995. The St. Louis River system remedial actionplan. Progress report. MPCA, St. Paul, MN and WDNR, Madi-son, WI. (http://www.stlouisriver.org/stage2/stage2 report.pdf)
Pardos, M., Benninghoff, C., Thomas, R. L., Khim-Heang, S., 1999.
Confirmation of elemental sulfur toxicity in the Microtox©R
as-say during organic extracts assessment of freshwater sediments.Environ. Toxicol. Chem. 18, 188–193.
Peterson, G. S., Axler, R. P., Lodge, K. B., Schuldt, J. A., Crane,J. L., 2002. Evaluation of a fluorometric screening method forpredicting total PAH concentrations in contaminated sediments.Environ. Monitoring Assess. 78, 111–129.
Prahl, F. G., Carpenter, R., 1984. Hydrocarbons in Washingtoncoastal sediments. Estuarine Coastal Shelf Sci. 18, 703–720.
Reddy, C. M., Pearson, A., Xu, L., McNichol, A. P., Benner Jr., B. A.,Wise, S. A., Klouda, G. A., Currie, L. A., Eglinton, T. I., 2002.Radiocarbon as a tool to apportion the sources of polycyclic aro-matic hydrocarbons and black carbon in environmental samples.Environ. Sci. Technol. 36, 1774–1782.
Redman, S., Janisch, T., 1995. Newton Creek system sediment con-tamination site characterization report. Sediment Managementand Remediation Techniques Program, WDNR, Madison, WI.PUBL-WR-433-95.
SAS, 1988. SAS User’s Guide: Statistics. SAS Institute Inc., Cary,NC.
Schubauer-Berigan, M., Crane, J. L., 1996. Preliminary contam-inant assessment of the Thomson, Forbay, and Fond du LacReservoirs. Water Quality Division, MPCA, St. Paul, MN.(http://www.pca.state.mn.us/water/sediments/cloquet.pdf)
Schubauer-Berigan, M., Crane, J. L., 1997. Survey of sedimentquality in the Duluth/Superior Harbor: 1993 sample results.Great Lakes National Program Office, USEPA, Chicago, IL. EPA905-R97-005. (http://www.pca.state.mn.us/water/sediments/93mud.pdf)
SEH Inc., 2000. Site investigation report. Newton Creek segmentsB and C, Superior, Wisconsin. Short Elliott Hendrickson Inc.,Chippewa Falls, WI. SEH No. WIDNR9905.00.
SEH Inc., 2003. Remedial investigation report. Newton Creek,Douglas County, Wisconsin. Short Elliott Hendrickson Inc.,Chippewa Falls, WI. SEH No. WIDNR9905.02.
St. Louis River CAC, 2002. Lower St. Louis River habitat plan.St. Louis River Citizens Action Committee, Duluth, MN.(http://www.stlouisriver.org/habitatplan/habitatplan.html)
Suter, G. W. II, 2001. Applicability of indicator monitoring to eco-logical risk assessment. Ecol. Indicat. 1, 101–112.
Thorp, J. H., Covich, A. P. (Eds.), 1991. Ecology and Classificationof North American Freshwater Invertebrates. Academic Press,Inc., San Diego, CA.
Tung, K. K., Scheibner, G., Miller, T., Bulich, A. A., 1990. A newmethod for testing soil and sediment samples. SETAC 11th An-nual Meeting Abstract Book. Society of Environmental Toxicol-ogy and Chemistry, Pensacola, FL.
URS Corporation, 2002. Former Duluth works LIF investigation re-port. URS Corporation, Minneapolis, MN.
USACE (United States Army Corps of Engineers), 1997. Phase IIreport. Draft dredged material management plan study and envi-ronmental impact statement. Duluth-Superior Harbor, Minnesotaand Wisconsin. USACE, Detroit District, Detroit, MI.
USEPA (United States Environmental Protection Agency), 1993. Re-gional Environmental Monitoring and Assessment Program (R-EMAP). Office of Research and Development and Office of Sci-ence, Planning and Regulatory Evaluation, USEPA, Cincinnati,OH. EPA/625/R-93/012.
USEPA, 1994. Methods for measuring the toxicity and bioaccumula-tion of sediment-associated contaminants with freshwater inver-tebrates. Office of Research and Development, USEPA, Duluth,MN. EPA/600/R-94/024.
USEPA, 1997. The incidence and severity of sediment contaminationin surface waters of the United States. Volume 1: National sedi-ment quality survey. Office of Science and Technology, USEPA,Washington, DC. EPA 823-R-97-006.
Venkatesan, M. I., 1988. Occurrence and possible sources of perylenein marine sediments. A review. Mar. Chem. 25, 1–28.
Wakeham, S. G., Schaffner, C., Giger, W., 1980a. Polycyclic aromatichydrocarbons in recent lake sediments—II. Compounds derivedfrom biogenic precursors during early diagenesis. Geochim. Cos-mochim. Acta. 44, 415–430.
Wakeham, S. G., Schaffner, C., Giger, W., 1980b. Polycyclic aromatichydrocarbons in recent lake sediments—I. Compounds havinganthropogenic origins. Geochim. Cosmochim. Acta. 44, 403–413.
Wiederholm, T. (Ed.), 1983. Chironomidae of the Holarctic region–Keys and diagnoses. Vol. 1. Larvae. Ent. Scand. Suppl. 19, 1–457.
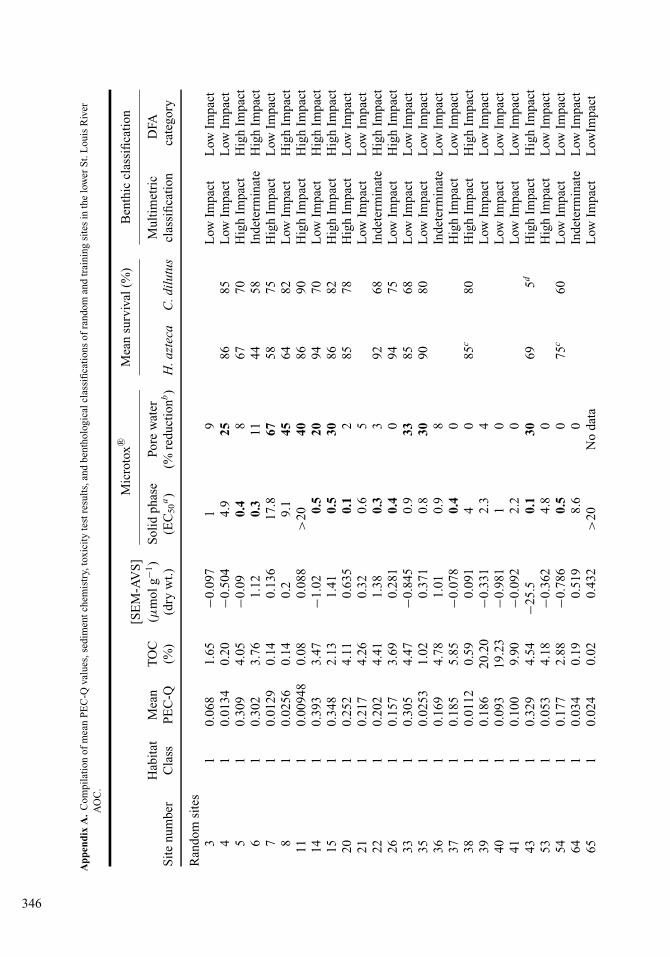
App
endi
xA
.C
ompi
lati
onof
mea
nP
EC
-Qva
lues
,sed
imen
tche
mis
try,
toxi
city
test
resu
lts,
and
bent
holo
gica
lcla
ssifi
cati
ons
ofra
ndom
and
trai
ning
site
sin
the
low
erS
t.L
ouis
Riv
erA
OC
.
Mic
roto
x©RM
ean
surv
ival
(%)
Ben
thic
clas
sifi
cati
on[S
EM
-AV
S]
Hab
itat
Mea
nT
OC
(µm
olg−1
)S
olid
phas
ePo
rew
ater
Mul
tim
etri
cD
FAS
ite
num
ber
Cla
ssP
EC
-Q(%
)(d
ryw
t.)(E
C50
a)
(%re
duct
ionb
)H
.azt
eca
C.d
ilut
uscl
assi
fica
tion
cate
gory
Ran
dom
site
s3
10.
068
1.65
−0.0
971
9L
owIm
pact
Low
Impa
ct4
10.
0134
0.20
−0.5
044.
925
8685
Low
Impa
ctL
owIm
pact
51
0.30
94.
05−0
.09
0.4
867
70H
igh
Impa
ctH
igh
Impa
ct6
10.
302
3.76
1.12
0.3
1144
58In
dete
rmin
ate
Hig
hIm
pact
71
0.01
290.
140.
136
17.8
6758
75H
igh
Impa
ctL
owIm
pact
81
0.02
560.
140.
29.
145
6482
Low
Impa
ctH
igh
Impa
ct11
10.
0094
80.
080.
088
>20
4086
90H
igh
Impa
ctH
igh
Impa
ct14
10.
393
3.47
−1.0
20.
520
9470
Low
Impa
ctH
igh
Impa
ct15
10.
348
2.13
1.41
0.5
3086
82H
igh
Impa
ctH
igh
Impa
ct20
10.
252
4.11
0.63
50.
12
8578
Hig
hIm
pact
Low
Impa
ct21
10.
217
4.26
0.32
0.6
5L
owIm
pact
Low
Impa
ct22
10.
202
4.41
1.38
0.3
392
68In
dete
rmin
ate
Hig
hIm
pact
261
0.15
73.
690.
281
0.4
094
75L
owIm
pact
Hig
hIm
pact
331
0.30
54.
47−0
.845
0.9
3385
68L
owIm
pact
Low
Impa
ct35
10.
0253
1.02
0.37
10.
830
9080
Low
Impa
ctL
owIm
pact
361
0.16
94.
781.
010.
98
Inde
term
inat
eL
owIm
pact
371
0.18
55.
85−0
.078
0.4
0H
igh
Impa
ctL
owIm
pact
381
0.01
120.
590.
091
40
85c
80H
igh
Impa
ctH
igh
Impa
ct39
10.
186
20.2
0−0
.331
2.3
4L
owIm
pact
Low
Impa
ct40
10.
093
19.2
3−0
.981
10
Low
Impa
ctL
owIm
pact
411
0.10
09.
90−0
.092
2.2
0L
owIm
pact
Low
Impa
ct43
10.
329
4.54
−25.
50.
130
695d
Hig
hIm
pact
Hig
hIm
pact
531
0.05
34.
18−0
.362
4.8
0H
igh
Impa
ctL
owIm
pact
541
0.17
72.
88−0
.786
0.5
075
c60
Low
Impa
ctL
owIm
pact
641
0.03
40.
190.
519
8.6
0In
dete
rmin
ate
Low
Impa
ct65
10.
024
0.02
0.43
2>
20N
oda
taL
owIm
pact
Low
Impa
ct
346
661
0.01
770.
120.
323
>20
395
78H
igh
Impa
ctH
igh
Impa
ct69
10.
396
4.36
−1.4
10
6885
Low
Impa
ctH
igh
Impa
ct70
10.
4313
.98
−7.8
40.
230
5682
Hig
hIm
pact
Hig
hIm
pact
711
0.91
54.
13−1
.77
0.3
2090
72H
igh
Impa
ctL
owIm
pact
731
1.01
3.07
−2.5
70.
732
75c
55L
owIm
pact
Low
Impa
ct74
10.
164
4.10
0.78
11.
332
Low
Impa
ctH
igh
Impa
ct75
10.
019
0.55
0.27
16.
333
Low
Impa
ctL
owIm
pact
761
0.04
671.
820.
267
3.6
070
75L
owIm
pact
Hig
hIm
pact
791
0.07
52.
821.
200.
37
7072
Low
Impa
ctL
owIm
pact
811
0.18
83.
300.
764
0.3
0L
owIm
pact
Low
Impa
ct82
10.
152
3.32
−0.0
510.
78
5588
Low
Impa
ctL
owIm
pact
831
0.16
44.
32−3
.18
0.4
4L
owIm
pact
Hig
hIm
pact
841
0.09
364.
84−2
1.7
0.1
1892
90L
owIm
pact
Low
Impa
ct85
10.
0366
0.86
0.32
614
.23
9072
Low
Impa
ctL
owIm
pact
871
0.04
630.
680.
212.
821
80c
55L
owIm
pact
Hig
hIm
pact
881
0.11
33.
14−1
.84
0.5
2290
c70
Low
Impa
ctH
igh
Impa
ct89
10.
158
3.73
−1.6
50.
411
Low
Impa
ctL
owIm
pact
921
0.08
02.
35−1
.93
1.1
4L
owIm
pact
Low
Impa
ct93
10.
0433
0.61
−0.3
395.
416
9865
Hig
hIm
pact
Hig
hIm
pact
941
0.21
110
.68
−13.
70.
315
72c
70L
owIm
pact
Low
Impa
ct95
10.
0837
2.19
−0.2
164.
227
9875
Low
Impa
ctH
igh
Impa
ct96
10.
333
17.4
9−3
0.1
1.5
075
72L
owIm
pact
Hig
hIm
pact
971
0.20
09.
56−4
.41
0.9
0L
owIm
pact
Low
Impa
ct98
10.
135
5.34
0.66
71
1910
075
Low
Impa
ctL
owIm
pact
100
10.
031
0.73
−0.5
411.
39
Low
Impa
ctH
igh
Impa
ct10
11
0.11
73.
42−2
.84
1.4
24L
owIm
pact
Hig
hIm
pact
103
10.
131
3.94
−0.6
761.
120
Low
Impa
ctH
igh
Impa
ct10
41
0.14
93.
48−1
.17
0.6
31L
owIm
pact
Hig
hIm
pact
105
10.
255
13.8
1−0
.741
3.9
062
98L
owIm
pact
Hig
hIm
pact
(Con
tinu
edon
next
page
)
347
App
endi
xA
.C
ompi
lati
onof
mea
nP
EC
-Qva
lues
,sed
imen
tche
mis
try,
toxi
city
test
resu
lts,
and
bent
holo
gica
lcla
ssifi
cati
ons
ofra
ndom
and
trai
ning
site
sin
the
low
erS
t.L
ouis
Riv
erA
OC
.(C
onti
nued
)
Mic
roto
x©RM
ean
surv
ival
(%)
Ben
thic
clas
sifi
cati
on[S
EM
-AV
S]
Hab
itat
Mea
nT
OC
(µm
olg−1
)S
olid
phas
ePo
rew
ater
Mul
tim
etri
cD
FAS
ite
num
ber
Cla
ssP
EC
-Q(%
)(d
ryw
t.)(E
C50
a)
(%re
duct
ionb
)H
.azt
eca
C.d
ilut
uscl
assi
fica
tion
cate
gory
107
10.
0403
5.77
−1.6
06.
76
7575
Low
Impa
ctH
igh
Impa
ct11
01
0.15
63.
55−0
.187
0.8
8L
owIm
pact
Hig
hIm
pact
111
10.
362
3.98
−2.4
90.
49
100
72L
owIm
pact
Low
Impa
ct1
20.
047
0.44
0.39
624
.30
Low
Impa
ctL
owIm
pact
92
0.04
10.
240.
123
>20
8H
igh
Impa
ctH
igh
Impa
ct10
20.
023
0.40
0.14
2>
2040
8486
Hig
hIm
pact
Low
Impa
ct12
20.
171
2.67
−0.0
780.
431
9160
Low
Impa
ctH
igh
Impa
ct13
20.
0589
0.81
0.01
92.
127
8918
dL
owIm
pact
Low
Impa
ct16
20.
162
3.64
−2.0
70.
910
Inde
term
inat
eH
igh
Impa
ct17
20.
016
0.16
0.23
613
.90
Hig
hIm
pact
Hig
hIm
pact
182
0.06
151.
85−0
.038
0.8
1578
90H
igh
Impa
ctH
igh
Impa
ct23
20.
206
3.38
−0.3
430.
319
8835
Hig
hIm
pact
Hig
hIm
pact
242
0.13
80.
240.
194
>20
1572
52H
igh
Impa
ctL
owIm
pact
252
0.03
40.
760.
225
8.4
8H
igh
Impa
ctH
igh
Impa
ct27
20.
126
2.09
0.71
1>
200
Inde
term
inat
eH
igh
Impa
ct28
20.
138
2.34
0.04
90.
316
9880
Low
Impa
ctH
igh
Impa
ct29
20.
182
3.07
−0.4
870.
20
9570
Hig
hIm
pact
Hig
hIm
pact
302
0.11
31.
94−0
.028
0.6
4098
62H
igh
Impa
ctH
igh
Impa
ct31
20.
0769
1.35
0.84
51
092
70In
dete
rmin
ate
Hig
hIm
pact
322
0.06
31.
420.
575
0.7
4210
060
Hig
hIm
pact
Hig
hIm
pact
342
0.01
30.
300.
132
1.4
0H
igh
Impa
ctH
igh
Impa
ct45
20.
059
1.40
0.45
30.
50
Inde
term
inat
eH
igh
Impa
ct46
20.
0768
1.10
0.50
70.
80
9062
Hig
hIm
pact
Low
Impa
ct47
20.
015
0.16
0.09
51
085
c90
Hig
hIm
pact
Hig
hIm
pact
482
0.17
62.
930.
519
0.2
1488
c80
Hig
hIm
pact
Hig
hIm
pact
492
0.02
50.
520.
232
9.1
13H
igh
Impa
ctL
owIm
pact
572
0.06
481.
55−1
.22
0.5
088
c65
Hig
hIm
pact
Hig
hIm
pact
592
0.06
72.
550.
171
1.5
0H
igh
Impa
ctH
igh
Impa
ct60
20.
157
2.96
0.12
60.
90
Low
Impa
ctL
owIm
pact
348
612
0.2
4.02
−0.3
740.
60
9090
Hig
hIm
pact
Hig
hIm
pact
622
0.10
62.
34−0
.432
0.9
0L
owIm
pact
Low
Impa
ct68
20.
105
1.94
−0.7
740.
90
Low
Impa
ctL
owIm
pact
Tra
inin
gsi
tes
Low
impa
ct42
10.
0105
0.35
0.00
211
.226
78c
55L
owIm
pact
Low
Impa
ct52
10.
0924
3.20
−1.2
60.
60
100
62L
owIm
pact
Low
Impa
ct63
10.
029
0.28
0.31
323
.60
Hig
hIm
pact
Low
Impa
ct77
10.
248
4.24
−1.0
60.
153
41d
70H
igh
Impa
ctL
owIm
pact
781
0.14
3.20
0.57
91.
146
82c
50L
owIm
pact
Low
Impa
ct80
10.
0734
2.59
1.03
0.3
798
65L
owIm
pact
Low
Impa
ct86
10.
0481
0.56
−0.3
442.
112
9868
Low
Impa
ctL
owIm
pact
901
0.04
31.
37−1
.07
1.2
2In
dete
rmin
ate
Low
Impa
ct91
10.
080
2.49
−1.7
31.
10
Low
Impa
ctL
owIm
pact
106
10.
147
3.07
−1.2
91.
937
Low
Impa
ctL
owIm
pact
Hig
him
pact
21
1.41
4.70
4.25
2.6
1388
65H
igh
Impa
ctH
igh
Impa
ct44
10.
293.
99−7
1.3
0.2
6775
10d
Hig
hIm
pact
Hig
hIm
pact
511
1.1
5.59
−4.3
40.
24
9572
Hig
hIm
pact
Hig
hIm
pact
551
0.32
82.
63−1
.10
0.3
3475
68L
owIm
pact
Hig
hIm
pact
561
0.74
814
.19
−23.
40.
268
12d
0dH
igh
Impa
ctH
igh
Impa
ct72
126
.48.
26−2
9.7
0.1
100
0d0d
Inde
term
inat
eH
igh
Impa
ct99
10.
445
0.82
4.49
0.1
2659
0dH
igh
Impa
ctH
igh
Impa
ct10
21
0.07
178.
40−2
.87
0.2
823d
0dH
igh
Impa
ctH
igh
Impa
ct10
81
0.50
35.
96−9
.97
08
Hig
hIm
pact
Hig
hIm
pact
109
20.
595
2.73
2.79
0.3
9L
owIm
pact
Hig
hIm
pact
Hab
itat
Cla
ss1
=S
hall
owha
bita
t;H
abit
atC
lass
2=
chan
neli
zed
habi
tat;
PE
C-Q
=pr
obab
leef
fect
conc
entr
atio
nqu
otie
nt;
TO
C=
tota
lor
gani
cca
rbon
;S
EM
=si
mul
tane
ousl
yex
trac
tabl
em
etal
;A
VS
=ac
idvo
lati
lesu
lfide
;D
FA=
disc
rim
inan
tfu
ncti
onan
alys
is;
EC
50=
effe
ctiv
eco
ncen
trat
ion
that
caus
eda
50%
redu
ctio
nin
lum
ines
cenc
ere
lativ
eto
the
cont
rol.
aE
C50
aspe
rcen
tdry
sedi
men
t;to
xic
resp
onse
(sho
wn
inbo
ld)
defi
ned
asE
C50
<0.
5(±
0.05
)%.
bPe
rcen
tlig
htre
duct
ion
rela
tive
toco
ntro
l;to
xic
resp
onse
(sho
wn
inbo
ld)
defi
ned
as>
20(±
0.5)
%.
cC
ontr
olfa
ilur
e(i
.e.,
78%
surv
ival
);th
eref
ore,
the
toxi
city
test
fail
edqu
alit
yas
sura
nce
requ
irem
ents
.dM
ean
surv
ival
sign
ifica
ntly
less
than
cont
rols
urvi
vala
tp
=0.
05.
349