ubs house view - our financial services around the...
TRANSCRIPT

UBS House viewMonthly Base May 2018
Chief Investment Office WM
PublishedApr 19 2018
This report was prepared by UBS AG.Please see the important disclaimer at the end of the document.This document is a snapshot view. We update the tactical asset allocationas changes occur and resend it to subscribers. For all other forecasts andinformation, we advise you to check the Investment Views section in your E-Banking or in Quotes. 1

For further information please contact Head CIO Global Asset Allocation Andreas J Koester, [email protected] or CIO asset class specialists Philipp Schöttler, [email protected] or Carolina Corvalan, [email protected].
Financial Market Outlook – short term EM inflation has moderated and isexpected to remain relatively lowCPI YoY (in %)
Source: Bloomberg, UBS, as of April 2018
Earnings advance supports equitymarkets12-month-trailing earnings per share (EPS)and equity index
180
280
380
480
580
680
15
18
21
24
27
30
33
2010 2011 2012 2013 2014 2015 2016 2017 2018MSCI AC World IBES trailing EPS (in $)
MSCI AC World index (local) (rhs)
Source: Thomson Reuters, UBS, as of March 2018
Global Tactical Asset Allocation
• Asset allocationMarket sentiment has improved as US-China tensions appeared to ease recently, as President Xi reiterated market access and tariff reductionpromises. We keep a constructive view on global equities as the economic backdrop remains strong and expect global inflation to pick up onlygradually. This should allow central banks to normalize monetary policy at a measured pace. We remain overweight global stocks versus euro highyield and high grade bonds. As we enter a phase in the business cycle where volatility tends to increase, we are protecting part of our pro-riskexposure through an equity put option. An escalation in trade tensions remains a risk, but our base case is for a combination of targeted tariffsand bilateral negotiations.
• EquitiesWe keep the overweight in global equities vs. bonds. Stocks are supported by solid earnings growth. US companies, which make up about halfof the global market, are benefiting from tax relief and a fiscal spending package. Based on the price-to-earnings ratio, the global stock valuationis below long-term average. We also keep an overweight in emerging market (EM) versus Australian stocks. EM companies should benefit fromstrong global growth given their operational leverage, while the expected weakness in the US dollar should enhance their stock performance inUSD terms. With MSCI China comprising close to 30% of the EM index, we monitor trade disputes carefully. Investors who don't own Australianstocks should underweight UK stocks.
• BondsWe are overweight EM sovereign bonds in USD against high grade bonds. We expect EM sovereign spreads to tighten amid improving fundamentalsincluding relatively subdued inflation, stable commodity prices and a benign external backdrop. Also, their current yield pick-up of 2.6% in USDis attractive. Euro high yield bonds remain expensive and we continue to underweight these assets versus global equities. We are overweight10-year US Treasury bonds against USD cash, a position that should benefit from the attractive carry. By contrast, we are underweight 10-yearJapanese government bonds against JPY cash. The Bank of Japan is likely to raise the target of its yield-curve control later this year, while aninterest rate cut looks unlikely.
• Foreign exchangeWe remain long EUR and CAD versus short USD and long JPY versus short NZD. The Eurozone runs a large trade surplus, at 4% of GDP, whilethe US has sizable trade and budget deficits, which should support the EURUSD exchange rate. We are closing our long GBP versus short CHFposition, which has benefited from lower Brexit uncertainty, while the market has priced in a more hawkish Bank of England this year. Our EMFX basket has suffered from rising idiosyncratic risk related to the Russian Ruble and Turkish Lira, as sanctions against Russia and threats againstSyria weakened those two currencies very quickly. We still see good prospects for the Brazilian Real and the Indian Rupee, and overweight theseagainst the USD and the Taiwanese Dollar.
2

Cross-asset preferences We like... We don't like...
Equities
• Global equities
• Emerging market equities
• Sustainable value creation in EM
• US smart beta
• "Buy-write" strategy on US equities
• Some protection via US equity put option
• Australian equities
Bonds
• Corporate hybrids
• US leveraged loans
• EM sovereign bonds in USD
• Selected EM bonds
• 10-year US Treasuries vs. USD cash
• Developed market high grade bonds
• "Well-worn" bonds
• Euro high yield
• 10-year Japanese govt bonds vs. JPY cash
Foreign exchange
• Euro vs...
• Canadian dollar vs...
• Japanese yen vs...
• Brazilian real vs...
• Indian rupee vs...
• ...US dollar
• ...US dollar
• ...New Zealand dollar
• ...US dollar ( )
• ...Taiwanese dollar
Hedge Funds • Navigating rising US rates with hedgefunds
Precious Metals& Commodities
Recent upgrades Recent downgrades
Model portfolios (EUR & USD)
Liquidity5%
High gradebonds10%
US TIPS 2%
Inv. gradecorporatebonds 8%
High yieldbonds3%
EM bonds 7%
Equities others5%
Equities EM5%
Equities Europe23%
Equities US12%
Hedge Funds18%
Risk Parity2%
EUR
Liquidity5% High grade
bonds8%
US TIPS4%
Inv. gradecorporate
bonds8%
High yieldbonds3%
EM bonds7%
Equities others6%
Equities EM6%
Equities Europe12%
Equities US21%
Hedge Funds18%
Risk Parity2%
USD
UBS, as of 19 April 2018
Note: Portfolio weightings are for a EUR model portfolio and aUSD model portfolio, with a balanced risk profile (including TAA).We expect the EUR balanced portfolio (excluding TAA) to havean average total return of 3.5% p.a. and a volatility of 8.0% p.a.over the next seven years. We expect the USD balanced portfolio(excl. TAA) to have an average total return of 5.2% p.a. and avolatility of 7.9% p.a. over the next seven years.
3

Global tactical asset allocationTactical asset allocation deviations from benchmark*
Liquidity
Equities total**
Global
US
Eurozone
UK
Switzerland
Japan
Emerging markets (EM)
Australia***
Bonds total
High grade bonds
Corporate bonds (IG)
High yield bonds****
EM sovereign bonds (USD)
EM corporate bonds (USD)
EM local currency bonds
US TIPS
Duration overlay (USD)
Duration overlay (JPY)
new old
neutral overweightunderweight
Source: UBS, as of 19 April 2018
*Please note that the bar charts show total portfolio preferences, which can be interpreted as therecommended deviation from the relevant portfolio benchmark for any given asset class and sub-asset class.**We are holding a put option on the S&P 500 to partly protect the tactical overweight in global equities.***Investors who don't have exposure to Australian equities should underweight UK equities instead.****Position includes an underweight in EUR HY.
Currency allocation
USD
EUR
GBP
JPY
CHF
SEK
NOK
CAD
NZD
AUD
EM FX basket^
DM FX basket^
BRL
TWD
INR
new old
neutralunderweight overweight
Source: UBS, as of 19 April 2018
^EM FX basket contains Russian ruble, Turkish lira, Brazilian real and Indian rupee. DM FX basketcontains Norwegian krone, Australian dollar, Taiwanese dollar and Hungarian forint (all equallyweighted).
4

UBS Chief Investment Office WM considers the highlighted themes as fitting the sustainability framework.
CIO themes in focus Equities
• US smart beta
Certain stock characteristics (momentum, quality, small capitalization, risk-weighting, value and yield) have been shown to deliver long-term investment outperformance relative to a marketcapitalization-weighted index. Combining these characteristics, known in the industry as smart beta, makes the investment less cyclical and creates a "passive-plus" solution. Smart beta'scompelling value proposition has resulted in a phenomenal growth in assets. Smart beta ETF assets have risen to over USD 650bn and are growing by more than 30% a year.
• Sustainable value creation in emerging markets
EM equities offer investors the opportunity to add value to their portfolios by incorporating environmental, social and corporate governance (ESG) considerations into their investment decisions.We argue that the wide disparity among individual companies on ESG performance, particularly regarding governance issues, necessitates focusing on those with a strong management toreduce tail-risk events such as severe environmental accidents or weak corporate governance (e.g. accounting/audit issues). As corporate governance rules in emerging markets are often lessstrict than those in developed countries, risks and opportunities are hard to quantify, which suggests that understanding how companies are exposed to ESG risks and opportunities and howthey manage them should factor in highly when determining corporate value.
• Generate yield: "Buy-write" on US equities
An equity buy-write strategy features the purchase of equities (the "buy" part) while systematically selling (or "writing") call options that cover the position, typically on a monthly schedule.In exchange for giving counterparty the right, but not the obligation, to buy the underlying asset at a predetermined price, the buy-writer receives a premium. Over an economic cycle, equitybuy-write strategies generate attractive risk-adjusted returns as they capture both the equity and volatility risk premium. They are most appealing when equity returns moderate and marketmomentum decreases and, historically, perform strongly during periods of rising rates.
Bonds
• Time to be more selective in EM credit
With this theme, we provide advice on how to build diversified exposure to emerging market credit, drawing from our top-down view on the asset class, as well as the bottom-up insights ofour credit analysts. Emerging market credit should benefit from continued improvements in domestic activity, as well as its relative attractiveness against other credit market segments. Whileemerging economies are on aggregate at an earlier stage in the business cycle than developed markets, there are big differences between countries and market sectors. We think it is becomingincreasingly important to invest in the right credits, and to actively adjust exposure towards the most promising opportunities.
• Replacing well-worn bonds
Risk-free yields in some major developed markets are near or below zero. Even if rates remain unchanged, many short- to medium-term bonds would deliver negative total returns. We thinkinvestors can preserve wealth by taking profits on assets that will deliver negative total returns (exceeding the costs of switching out) in most likely scenarios. More attractive alternatives canbe found on CIO's bond recommendation lists.
• US loans – Attractive floating yield
US senior loans are an attractive alternative to more traditional fixed income segments. Loans provide exposure to the most senior part of a company's capital structure and are often securedby the company's assets, leading to higher recovery rates than for bonds. Also, loans offer a floating coupon rate, which benefits from a rise in US short-term interest rates. The current yieldof 6.1% is attractive. Last year, the re-pricing of existing loans – allowing issuers to lock in lower coupon rates as demand for the asset class has been very strong – held back the asset classperformance. But this headwind is likely to fade going forward. We expect the 12-month trailing default rate to remain broadly stable over the next 12 months at around 2%. We think USloans present an attractive investment opportunity for qualified investors who are comfortable holding less liquid asset classes.
5
CIO themes in focus Bonds
• Yield pick-up with corporate hybrids
Corporate hybrids are a niche segment in the corporate bond market. At current spread levels, they compensate investors with a suitable reward for assuming the risks associated with them.We expect mid-single-digit percentage returns on selected instruments over 12 months.
Alternative investments
• Navigating rising US rates with hedge funds
The US Federal Reserve has started to hike interest rates. Historically, most hedge fund strategies have been resilient to rising rates, while high grade bonds have performed poorly. Investorslooking for an alternative to their high grade bond exposure should consider a diversified hedge fund portfolio characterized by low directional exposure to both fixed income and equities.
This selection of themes is a subset of a larger theme universe. It represents the highest conviction themes of the UBS Chief Investment Office WM, taking into account the current market environment and risk-returncharacteristics.
6

UBS Chief Investment Office WM considers the highlighted themes as fitting the sustainability framework.
CIO longer term investment themes in focus Equities
• Digital data
Due to increased urbanization, the global digital universe is expected to expand 50-fold between 2010 and 2020. Rising global internet penetration (likely about 66% in 2025 vs. 44% in2015) and strong data growth in emerging markets are key drivers. From an investment perspective, the theme offers solid long-term growth opportunities, as significant investment will berequired to manage and take advantage of the surge in data. Investors can participate by investing in either data enablers or data infrastructure companies.
• Automation and robotics
Smart automation is powering the ongoing industrial revolution, combining the innovation capabilities of industrial and IT processes to fuel global manufacturing productivity gains. Risingwages and challenging demographic changes will pressure costs of manufacturing firms, driving automation investments. Also, the increasing digitalization of automation equipment isa key driver of higher efficiency and therefore more automation investments. Artificial intelligence employed in machines should take automation to the next level. The smart automationindustry's total annual revenue now stands at around USD 177.5bn. We believe that over the cycle, the sector can grow by mid-to-high single digits, with industrial software, robots andnew trends – 3D printing, artificial intelligence and drones – the clear outperformers.
• EM tourism
Urbanization and income growth are driving demand growth for emerging market tourism and global aviation infrastructure. Already, emerging market air passengers carried globallyexceed that of developed markets. Airbus forecasts that two thirds of new plane orders will come from emerging markets in the next 20 years. The growth of EM tourism is furthersupported by EM government policy, particularly economic diversification away from commodity exports and rising visa openness to draw visitors and attract foreign-currency receipts.
• Smart mobility
Smart mobility is a combination of smart powertrains (electrification), smart technology (autonomous driving) and smart use (car-sharing/car-hailing). Urbanization will be its main driver,with aging also a supportive factor. Sustainable investment aspects like safety, better fuel efficiency and lower emissions play nicely into our theme. Regulatory changes and technologicaladvances support smart mobility and will reshape the way we experience and consume individual mobility. We estimate that by 2025, the annual addressable market of our theme will bearound USD 400bn, or about 10 times today's size.
• Silver spending
The aging of the global population provides investment opportunities. Compared with younger age groups, "silver spenders" allocate more of their disposable income to leisure and tourism(particularly cruises), as well as consumer personal care and beauty products (specifically anti-aging products). These markets are estimated to grow by 8% and 6% a year respectively, wellabove the average consumer spending growth of less than 2% in G7 nations.
This selection of themes is a subset of a larger theme universe. It represents the highest conviction themes of the UBS Chief Investment Office WM, taking into account the current market environment and risk-returncharacteristics. The Longer Term Investment (LTI) theme series focuses on inevitable global trends, such as population growth, aging and urbanization, that create a variety of opportunities, with certain companies andsub-sectors experiencing a higher-than-GDP rate of revenue growth. Here, we include a subset of a larger universe of LTI themes expected to offer good entry points for theme-oriented investors in the coming months,and highlight our preference for a diversified approach to themes.
7

For further information please contact US economist Brian Rose, [email protected], European economist Ricardo Garcia, [email protected] or UBS WM Global Chief EconomistPaul Donovan, [email protected]
Key financial market driver 1 - Central bank policyKey points• The US Federal Reserve is expected to raise US interest rates a further three times, by a quarter point each quarter. Fed bond holdings,
which represent a form of liquidity supply, should continue to decline to (hopefully) match the decline in liquidity demand in theeconomy.
• The European Central Bank (ECB) is now buying EUR 30bn worth of assets each month. It is likely to conclude this program by theend of this year, and raise interest rates in 2019. We expect the Bank of England (BoE) to raise rates in 2Q18.
• The Swiss National Bank (SNB) may raise rates at the end of the year, provided the Swiss franc has weakened a little further. Thiswould come before an ECB rate increase, but after the ECB changes its bond-buying policy.
CIO view (Probability: 75%*) Policies tighten gradually• The minutes of the last US Federal Reserve's Federal Open Market Committee (FOMC) meeting are consistent with the view
that US interest rates will reach 2.5% at end-2018. New members appointed to the FOMC create some uncertainty aboutthe nuances of policy. Additional fiscal stimulus at a time of full employment is of some concern. The Fed continues to reduceliquidity supply, with the intention of matching a decline in liquidity demand in the economy.
• The ECB is still buying bonds in spite of rising economic growth, employment, inflation and bank lending. Its current assetpurchases of EUR 30bn a month should be followed by a tapering in 4Q18. A recent Governing Council meeting changed thelanguage of the ECB's policy statement to one consistent with the end of bond-buying this year.
• We expect the BoE to raise rates in 2Q18, provided economic data remains relatively firm. Other central banks have been moreinclined to discuss policy with a bias toward tightening rather than easing; this coincidence of views more likely reflects thegeneral improvement in global growth rather than any overt coordination.
• The tightening of central bank policy has shifted compared to past cycles. This time, there is no desire to reduce economicgrowth or inflation; the aim is to maintain growth and inflation around current levels. This contrasts with some historicaltightening episodes, which deliberately sought to reduce company pricing power.
Positive scenario (Probability: 10%*) Worsening macro backdrop
• The Fed falls further behind the curve as US inflation surprises higher, with real interest rates slipping more rapidly. The ECBreverses the tone of recent public announcements, signaling a stronger emphasis on the potential to ease policy further. The BoJcomes under pressure to engineer currency depreciation.
Negative scenario (Probability: 15%*) Macro risks fade, central banks seek to reduce pricing power
• The inflationary effect of a tighter US labor market and fiscal stimulus leads to a stronger Fed response and a combination of tightmonetary policy and loose fiscal policy over the course of 2018. Increased labor market costs and commodity price pressures leadto higher European inflation, generating early signs of a more rapid monetary policy tightening.
*Scenario probabilities are based on qualitative assessment Key datesMay 2May 7May 10
US Federal Reserve interest rate decisionBank of Japan policy decisionBank of England interest rate decision
Inflation is a local affairCross-country 12-month correlations for core consumerprice inflation remain very low (often negative). Thissignals inflation is mainly local, and owes little to globalforces.
Source: UBS calculations on OECD data from 1Q18, as of 15 April 2018
Real policy rates still negativeReal policy interest rates (deflating using headline,national consumer price inflation) are still negative
Source: UBS calculations from Haver data, as of 15 April 2018
8
For further information please contact Global Chief Economist, UBS WM Paul Donovan, [email protected]
Key financial market driver 2 - Political risksKey points• Markets remain relatively immune to political risks, and investors appear unwilling to price in probabilities of extreme tail events.
Geopolitical issues in the Levant are unlikely to impact markets. US political noise is also not generally provoking a market reaction.• Global trade issues have become more of a concern, but we do not see these as leading to a trade war (defined as trade policies
resulting in falling trade volumes relative to GDP). The integrated nature of the global trade system gives countries a strong self-interest in limiting trade conflict.
• Domestic investors tend to understand local politics better than foreign investors. Market reaction to political risk will thereforedepend on the domestic-foreign mix of investors. The higher the foreign ownership, the greater the risk of overreaction to politicalnoise. The US dollar's reaction to US political risk is an example of this.
CIO view (Probability: 70%*)• Political uncertainty still gets a lot of media coverage, but it has a relatively limited impact on financial markets. Trade concerns
are likely to be the main political focus in the near term.
• US trade rhetoric may be seen as being tied to the midterm election cycle. Trade protection is being portrayed as a patrioticact, rallying support in certain sectors. The costs of trade protection so far are not especially visible to US consumers. However,extending trade protection into a trade war would be a more obvious tax on US consumers, and have domestic politicalimplications – which argues against an extreme escalation.
• The trade negotiations of the EU and the UK are likely to be complex and lengthy – investors will not pay much attention to thedetails, but may react to the headlines.
• Airstrikes on Syria are unlikely to have a significant market impact. There is a specific impact from tensions between Russia andthe West, to the extent that economic sanctions are applied, but these are likely to create very localized market reactions.
Positive scenario (Probability: 10%*)• The sharp improvement in labor market conditions for low-skilled workers leads to wage hikes that either are accompanied
by better credit access or compensate for the loss of credit access since 2008; this eases income and consumption inequality.Governments and economists successfully communicate the net economic benefits of global trade and diversity.
Negative scenario (Probability: 20%*)
• Nationalist tendencies appear encouraged by single-issue politics and social media. Traditional party structures fail to address thedemands of large sections of the electorate, encouraging populism. Political outcomes are increasingly unpredictable as opinionpolls offer even less guidance. Trade protectionism escalates as political nationalism is prioritized over economic benefit. Lowerincome groups' standards of living are hurt by populist policies and rising food and energy prices, fueling further demands forradical and unpredictable change.
*Scenario probabilities are based on qualitative assessment. Key datesMayMay 17May 22
State primary elections in 11 US states (8, 15 and 22 May)European heads of government meetingDeadline for US companies to comment on taxes on Chinese imports
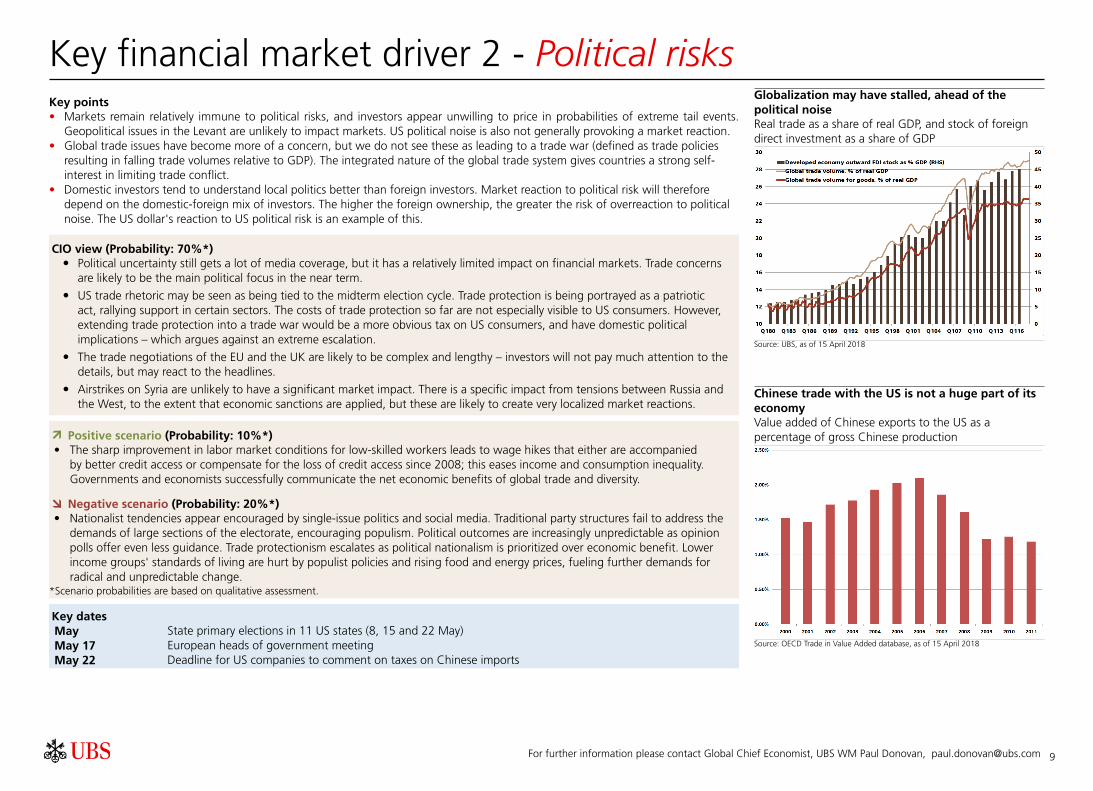
Globalization may have stalled, ahead of thepolitical noiseReal trade as a share of real GDP, and stock of foreigndirect investment as a share of GDP
Source: UBS, as of 15 April 2018
Chinese trade with the US is not a huge part of itseconomyValue added of Chinese exports to the US as apercentage of gross Chinese production
Source: OECD Trade in Value Added database, as of 15 April 2018
9

For further information please contact CIO strategists Jeremy Zirin, [email protected], David Lefkowitz, [email protected] or Edmund Tran, [email protected].
Key financial market driver 3 - Healthy US profit growthKey points• A solid economy and tax reform are driving strong earnings growth.• We look for 16% EPS growth in 2018 after 12% growth in 2017.• Earnings growth will likely slow to trend levels in 2019. We forecast 5% growth.
CIO view (Probability: 60%*) Earnings growth on solid footing. Tax reform is icing on thecake.
• The US earnings growth outlook remains healthy, driven by solid US consumer spending, secular growth drivers in tech, steadygains in US manufacturing activity in recent quarters, and a more favorable environment for financials. Leading indicators ofprofit growth, such as bank lending standards and capital spending intentions, remain supportive. The tax reform package isicing on the cake on top of this favorable backdrop. Tax reform should boost profits by 8%, thanks to a lower tax rate andthe redeployment of overseas cash into higher-returning assets. Faster economic growth as a result of the tax cuts could offeradditional upside.
• Adding it all up, we estimate S&P 500 EPS will rise 16% to USD 154 in 2018, up from 12% growth in 2017. Earnings growthshould slow to a trend rate in 2019 as the one-time boost from a lower tax rate goes away. We forecast 5% growth to USD 162in 2019.
• For 1Q18, we expect earnings growth of 20% (the fastest since 2010). This quarter will be the first that incorporates tax reformlegislation. Even without tax reform benefits, we estimate healthy EPS growth of roughly 12%, which includes a 1–2% benefitfrom the weaker dollar. We look for revenue growth of 7%, one of the strongest growth rates in the last six years.
• Fears that high profit margins will decline in the near term appear overblown. Excluding the tech sector, margins are notexcessive, in our view. The tech sector's high margins are supported by companies that have dominant market shares in theirend-markets. Other structural factors, such as industry consolidation, support higher-than-average profit margins. Also, marginstypically only decline when the economy enters a recession. Finally, the prospect of higher wages is unlikely to crimp profitability.Labor cost inflation has virtually no correlation with profit margins. In addition, higher consumer income is usually recycledinto faster consumer spending, suggesting that earnings growth (which is more important that profit margins) should be wellsupported.
Positive scenario (Probability: 20%*) Fiscal policy boosts earnings more than expected
• Corporate tax reform and the increased government spending generate even faster-than-expected profit growth. Higher interestrates and deregulation further boost financial sector earnings. Investment spending picks up.
Negative scenario (Probability: 20%*) Downturn in sentiment
• Trade and geopolitical tensions flare up as a result of the Trump administration's policy priorities, depressing business andconsumer sentiment. Wage pressures, without improving consumer and business demand, hurt profit margins and earningsgrowth rates. Persistently low short-term interest rates and renewed declines in long-term interest rates pressure financial sectorearnings.
*Scenario probabilities are based on qualitative assessment. Key datesApr 26 Peak of first quarter 2018 earnings season
Earnings growth remains solidS&P 500 EPS, in USD
119133
154162
40
60
80
100
120
140
160
180
2016 2017 2018E 2019E
Source: FactSet, UBS, as of 11 April 2018
Stocks seem to be ignoring the solid corporatefundamentalsS&P 500 price index and next-12-months consensus EPSestimates
110
125
140
155
170
1600
2000
2400
2800
3200
2015 2016 2017 2018S&P 500 (left) S&P 500 NTM EPS (right)
Source: FactSet, UBS, as of 11 April 2018
10

For further information please contact UBS WM Global Chief Economist Paul Donovan, [email protected]
Global economic outlook - SummaryKey points• Strong labor markets give people money to spend. This supports the global economy. Global growth should remain around trend.
The taxation of US consumers via tariffs has had little impact so far (perhaps because the taxes are not very visible).• Companies are finding it easier to increase prices. Producer price inflation has been rising steadily. Consumer prices are a little noisy,
but almost every US and European consumer price inflation (CPI) measure is around its 20-year average.• The Fed will likely increase interest rates a further three times this year, taking rates to 2.5%. This would leave CPI inflation-adjusted
(real) interest rates around 0% at year-end. We expect the ECB to finish its bond-buying program by year-end.
CIO view (Probability: 75%*) Global growth firm, around trend
• The global economy remains strong. Its growth this year should match that of 2017. There will be some new drivers of growth.Some emerging markets are doing better. In Europe and the US, strong labor markets are slowly leading to better incomes forworkers. Income growth is then spent. Stronger European and US spending has led to stronger Asian exports. Around a thirdof the US tax cuts are likely to be spent on imports. This part of the tax cuts will therefore help the global economy, not the USeconomy.
• Inflation rates are still being influenced by short-term technical factors generally only understood by statisticians. The long-termtrend is for a gradual increase in consumer prices. Companies are finding it easier to raise prices. Producer price inflation (PPI) isgenerally higher than in the recent past. While US wage growth has slowed from its 2017 highs, both US and European wagegrowth are consistent with some modest increase in price inflation. Labor costs typically make up about 70% of a developedeconomy's inflation. At sector and regional levels, there is evidence of tight labor markets pushing wage inflation higher.
• Real policy interest rates, adjusted for CPI, are still negative in the major economies. Policy should gradually tighten this year.
Positive scenario (Probability: 15%*) Growth exceeds expectations
• European growth surprises positively, with better labor markets and a more stable banking system that is more willing to lend. InitialUS economic growth data continues to be revised higher, and labor market shortages increase household incomes and consumerdemand at a faster pace than expected. Fiscal stimulus adds to the pace of economic activity, with US tax cuts having a largerimpact as taxpayers avoid attempts to close tax loopholes.
• Emerging markets see stable domestic demand, and higher commodity prices, coupled with consumer demand in developedeconomies, support export sectors. Pro-business forces guide the US policy agenda and produce growth-supportive regulatoryand legislative changes.
Negative scenario (Probability: 10%*) Political damage to growth
• US consumers suffer lower real disposable incomes as domestic inflation pressures increase. Additional fiscal stimulus at a timeof full employment produces economic overheating, which in turn provokes an economic recession in 2019.
• Credit growth suffers as capital flows are disrupted and uncertainty undermines normal bank lending.*Scenario probabilities are based on qualitative assessment.
Key datesMay 2May 22
Federal Reserve rate decisionDeadline for company comments on US trade taxes against China
Trend-like growth, normal inflationUBS estimates and forecasts
Source: UBS, as of 15 April 2018
Forecasts and estimates are current only as of the date of thispublication, and may change without notice.
US inflation anomalies fadeUS inflation measures start to move above their long-term averages as "special factors" cease to influence therates
Source: Haver, UBS, as of 15 April 2018
11

For further information please contact US economist Brian Rose, [email protected]
US economy - Moderate growth in the USKey points• We expect the US economy to grow at a moderate pace over the next 12 months.• Inflation should gradually trend higher as the recovery continues.• The Fed has begun to shrink its balance sheet, and interest rate hikes will likely continue at a gradual pace.
CIO view (Probability: 60%*) Moderate expansion• We expect the US economy to grow at a moderate pace over the next 12 months. The improving labor market and income tax
cuts should support robust consumer spending.
• Business investment should grow at a faster pace than last year, encouraged in part by labor shortages.
• Conditions in the manufacturing sector have improved and output should start to grow at a faster pace.
• Housing starts and home prices should remain on an upward trend, contributing modestly to overall economic growth.
• Inflation has risen, and we expect a gradual upward trend in the quarters ahead. A tight labor market and rising producer pricesare feeding through into consumer price inflation, which should allow the Fed to hit its 2% target.
• Tax reform and increased government spending will provide a substantial stimulus to growth. Deregulation should provide somebenefit over time. We do not expect the Trump administration to cause any severe disruptions to trade, although risks haveincreased.
• We expect the Fed to hike rates four times in 2018 and three times in 2019. The Fed should also continue to shrink its balancesheet.
Positive scenario (Probability: 25%*) Strong expansion
• US real GDP grows above 3%, propelled by an accommodative monetary policy, looser fiscal policy, strong household spending,and subsiding risks overseas. Inflation overshoots the Fed's 2% target, potentially leading the central bank to raise rates at a fasterpace.
Negative scenario (Probability: 15%*) Growth recession
• US growth stumbles. Political uncertainty and tighter financial conditions weigh on business investment and consumer spending.The Fed stays on hold.
*Scenario probabilities are based on qualitative assessment. Key datesApr 27Apr 30May 2May 4
GDP for 1Q18Personal income and spending for MarchFOMC rate decisionLabor report for April
Inflation should trend higherPCE and core PCE inflation rate, in %
(2)
(1)
0
1
2
3
4
5
2007 2009 2011 2013 2015 2017PCE price index y/y Core PCE price index y/y
Source: Bloomberg, UBS, as of 12 April 2018
PCE = personal consumption expenditures
PMIs are showing strengthPurchasing managers' indices (PMIs)
30
40
50
60
70
2007 2008 2009 2010 2011 2012 2013 2014 2015 2016 2017
Manufacturing PMI Non-manufacturing PMI
Source: Bloomberg, UBS, as of 12 April 2018
12

For further information please contact CIO European economist Ricardo Garcia, [email protected]
Eurozone economy - Growth set to consolidateKey points• We expect economic growth to continue to lose some momentum but remain at a high level.• Inflation should start to rise firmly again, driven by base effects.• We expect the ECB to end its QE program in 2018 and to start raising rates in July 2019.
CIO view (Probability: 65%*) Short-term tailwinds to abate• We expect the Eurozone economy to continue to lose some steam, although growth should stay at a high and solid level. Inflation
should continue to tick up in the months ahead, partly due to energy base effects. We expect the European Central Bank (ECB) totaper quantitative easing (QE) in the fourth quarter of 2018 and to start to raise interest rates in July 2019 (at the earliest).
• In Germany, fundamentals such as consumer confidence, construction, and capital-expenditure plans remain robust, even if a highereuro dents growth. In France, more corporate investment and high confidence levels should ensure continued robust economicexpansion.
• Italian economic growth should consolidate, supported by a stabilizing construction sector. We expect a broad grand coalition tobe formed. Spain is still growing strongly, but the momentum is likely to moderate. We expect Catalonia to remain a part of Spain.
Positive scenario (Probability: 15%*) Better-than-expected growth
• The global economy accelerates further and the euro weakens. Eurozone loan demand and the economy recover faster thanenvisaged. Political risks fade.
Negative scenario (Probability: 20%*) Disinflationary setback
• The Eurozone suffers a disinflationary setback as Greece leaves the union, Brexit talks fail, Catalonia leaves the EU, the Ukraineconflict escalates, or the Chinese economy suffers a severe downturn.
*Scenario probabilities are based on qualitative assessment. Key datesApr 26May 2May 2May 3
ECB policy meetingFirst quarter GDP estimateUnemployment rate for MarchInflation for April
Eurozone growth expected to moderate in 2018Business and consumer surveys
Source: Haver Analytics, UBS, as of March 2018
ECB balance sheet boosted by QETotal assets in national currency (index: 2007=100)
Source: Haver Analytics, UBS, as of March 2018 (SNB data as of February 2018)
13
For further information please contact CIO China economist Yifan Hu, [email protected] or CIO analyst Kathy Li, [email protected]
Chinese economy - Solid start to moderateKey points• We expect GDP growth to moderate, but to be of better quality in 2018.• Monetary policy should stay prudent with further regulatory tightening.• Political, economic and currency stability should keep investors confident on China.
CIO view (Probability: 75%*) On track for moderation• 1Q18 GDP growth stabilized at 6.8% y/y driven by resilient consumption, while investment evidently slowed. Growth should
moderate on cooling property, slowing infrastructure investment and ongoing deleveraging, likely to reach 6.6% y/y in 2018from 6.9% y/y in 2017.
• 2018 CPI inflation is to rise mildly to 2.4% y/y from 1.6% y/y in 2017, on modest rise of food price and service costs. PPIinflation continues to pull back to about 3% from 6.3% y/y in 2017 due to economic moderation and high base effect. 1Q CPIand PPI inflation were 2.2% and 3.7% respectively.
• 2018 investment is to decelerate to below 7% y/y from 7.2% in 2017; while consumption is to keep resilient around 10% y/y from 10.2% y/y in 2017. 2018 exports growth is to register lower single-digit growth from 7.9% y/y in 2017. 1Q fixed assetinvestment and retail sales were 7.5% y/y and 9.8% y/y respectively.
• Monetary policy should remain prudent and neutral. The new streamlined regulatory framework announced in March is led bythe State Council's Financial Stability and Development Committee. Deleveraging via existing and new regulatory measures aimsto lower overall and structural leverage to avoid systematic financial risks. Liquidity is likely to keep largely stable, with risingfunding costs and slowing credit growth.
• Risk of a Sino-US trade war has been escalating given tit-for-tat since the beginning of the year. China will stay on path offurther market opening, intellectual property protection and import expansion, while preparing to respond to any more tradetariffs imposed by the US.
Positive scenario (Probability: 5%*) Growth acceleration
• GDP growth rises above 7% a year, pushed by strong government policy stimulus packages or a strong pick-up in externaldemand.
Negative scenario (Probability: 20%*) Marked growth downturn
• A credit crunch – a tail risk especially damaging to sectors with overcapacity issues – leads to bond defaults, soaring interest rates,tight liquidity conditions, and lower bank lending, resulting in a market sell-off and a slowdown in economic growth. Trade frictionbetween the US and China and other major US trade partners escalate, affecting global trade and economic growth.
* Scenario probabilities are based on qualitative assessments. Key datesApr 30May 8May 10May 15
Manufacturing and non-manufacturing PMI for AprilTrade data for AprilCPI and PPI data for AprilFixed asset investment, industrial production and retail sales for April
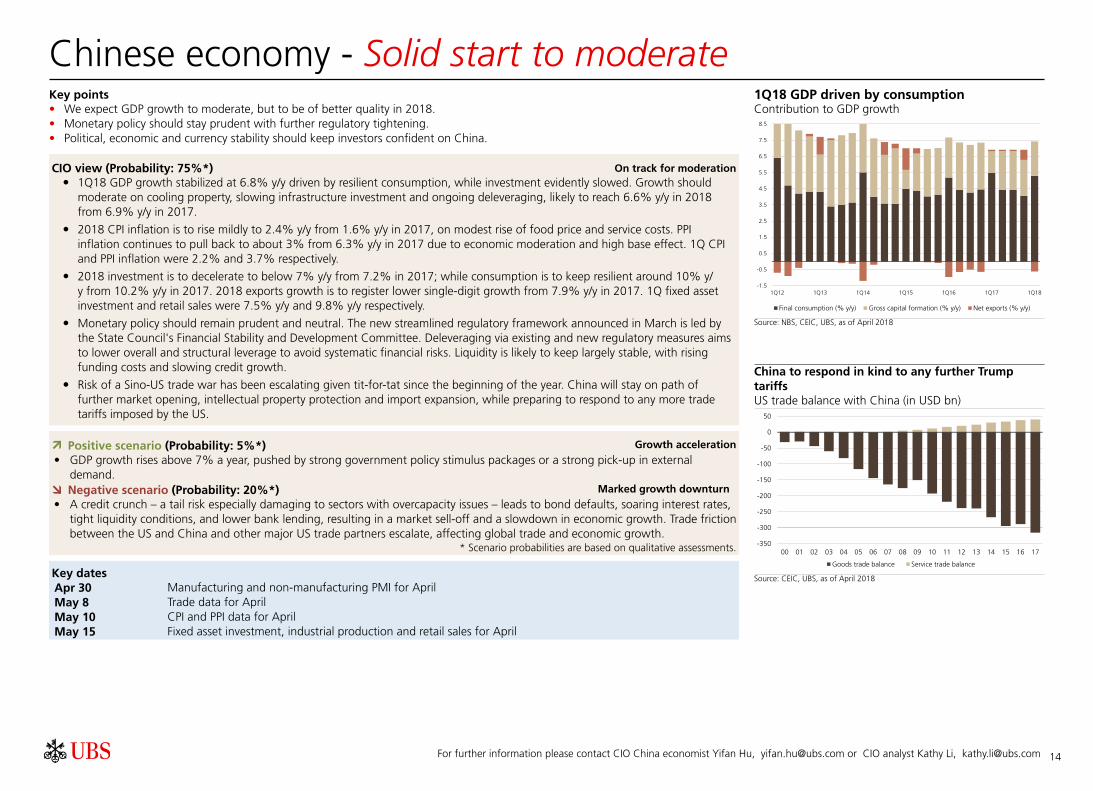
1Q18 GDP driven by consumptionContribution to GDP growth
-1.5
-0.5
0.5
1.5
2.5
3.5
4.5
5.5
6.5
7.5
8.5
1Q12 1Q13 1Q14 1Q15 1Q16 1Q17 1Q18
Final consumption (% y/y) Gross capital formation (% y/y) Net exports (% y/y)
Source: NBS, CEIC, UBS, as of April 2018
China to respond in kind to any further TrumptariffsUS trade balance with China (in USD bn)
-350
-300
-250
-200
-150
-100
-50
0
50
00 01 02 03 04 05 06 07 08 09 10 11 12 13 14 15 16 17
Goods trade balance Service trade balance
Source: CEIC, UBS, as of April 2018
14

For further information please contact CIO Swiss economists Alessandro Bee, [email protected] or Sibille Duss, [email protected].
Swiss economy - Poised for the best GDP growth since 2014Key points• The Swiss economy grew a robust 0.6% in 4Q17 compared to the previous quarter owing to a rebound in inventories. We expect
this to continue and have upgraded our 2018 GDP growth forecast to 2.4%, supported by solid economic activity in the Eurozoneand a depreciation of the Swiss franc.
• The major risks for the Swiss economy include protectionist US trade policies, tensions on the Korean Peninsula and the Middle East,and premature policy tightening by major central banks.
• After the ECB indicated clearly that it would end its net asset purchases in 2018, pressure on the Swiss franc eased sharply and theSNB ceased to intervene in the currency market. We don't expect it to hike rates until late this year, at the earliest.
CIO view (Probability: 60%*) Robust recovery• Swiss GDP grew at a quarterly pace of 0.7% in 3Q17 and 0.6% in 4Q17. After a weak first half in 2017, economic activity
accelerated considerably in the second half, suggesting a brighter outlook for 2018.
• GDP advanced by just 1% in 2017, and we expect it to pick up by 2.4% in 2018. The recovery should continue in 2019, withGDP growth coming in around 1.9%.
• In March, the Swiss manufacturing PMI decreased slightly to 60.3, but it remains above its long-term average and indicates anexpanding economy.
• Employment growth improved further in 4Q17, especially in the manufacturing sector which recorded a 1% gain compared to4Q16, while the unemployment rate continued to trend down.
• CPI inflation came in at 0.8% year-on-year in March. We expect it to be around 0.6% this year, underpinned by a weaker Swissfranc.
• The significant depreciation of the franc against the euro since July 2017 has afforded the Swiss National Bank (SNB) to ceaseintervention in the foreign exchange (FX) market. However, we do not expect it to hike rates until late 2018, at the earliest. Wethink it will not raise rates before the ECB terminates its net asset purchases.
Positive scenario (Probability: 20%*) Eurozone boosts Swiss growth
• Eurozone unemployment drops further, fueling positive sentiment in the union, in turn supporting Swiss exports. Compared withEurope as a whole, where economic growth has been strong, Switzerland has some catch-up potential.
Negative scenario (Probability: 20%*) Political risks hurt Swiss growth
• Protectionist measures by the Trump administration slow down global trade and hurt Swiss exports. Also, political risks in theMiddle East and the Korean Peninsula remain a threat.
* Scenario probabilities are based on qualitative assessment. Key datesMay 1May 2May 7May 7May 31
PMI for AprilSeco Consumer ConfidenceCPI for AprilForeign exchange reservesGDP for 1Q18
Swiss economy depends on tradeSwiss exports versus world trade
Inde
x,20
05=
100
30
40
50
60
70
80
90
100
110
120
130
140
150
92 94 96 98 00 02 04 06 08 10 12 14 16 18
Swiss exports excluding gold World trade
Source: Macrobond, UBS, as of 12 April 2018
PMI slightly weaker, but still above averageSwiss PMI and Swiss GDP growth in %
-4
-3
-2
-1
0
1
2
3
4
5
25
30
35
40
45
50
55
60
65
70
2000 2002 2004 2006 2008 2010 2012 2014 2016 2018
PMI manufacturing Swiss GDP y/y (right hand scale)
Source: Macrobond, UBS, as of 12 April 2018
15

Contact List Global Chief Investment Officer WM
Mark [email protected]
UBS CIO WM Global Investment Office
Global Asset AllocationAndreas [email protected]
UHNW & Alternatives IOSimon [email protected]
Investment ThemesPhilippe G. Mü[email protected]
UBS CIO WM Regional Chief Investment Offices
USMike [email protected]
APACMin Lan [email protected]
EuropeThemis [email protected]
SwitzerlandDaniel [email protected]
Emerging MarketsJorge [email protected]
16

DisclaimerIndependent Generic financial research – Risk information: UBS Chief Investment Office WM's investment views are prepared and published by Wealth Management and Personal & Corporate Banking or Wealth Management Americas, Business Divisions of UBS AG (regulatedby FINMA in Switzerland), its subsidiary or affiliate ("UBS"). In certain countries UBS AG is referred to as UBS SA. This material is for your information only and is not intended as an offer, or a solicitation of an offer, to buy or sell any investment or other specific product. Certainservices and products are subject to legal restrictions and cannot be offered worldwide on an unrestricted basis and/or may not be eligible for sale to all investors. All information and opinions expressed in this material were obtained from sources believed to be reliable andin good faith, but no representation or warranty, express or implied, is made as to its accuracy or completeness (other than disclosures relating to UBS). All information and opinions as well as any prices indicated are current as of the date of this report, and are subject tochange without notice. The market prices provided in performance charts and tables are closing prices on the respective principal stock exchange. The analysis contained herein is based on numerous assumptions. Different assumptions could result in materially different results.Opinions expressed herein may differ or be contrary to those expressed by other business areas or divisions of UBS as a result of using different assumptions and/or criteria. UBS and any of its directors or employees may be entitled at any time to hold long or short positionsin investment instruments referred to herein, carry out transactions involving relevant investment instruments in the capacity of principal or agent, or provide any other services or have officers, who serve as directors, either to/for the issuer, the investment instrument itself orto/for any company commercially or financially affiliated to such issuers. At any time, investment decisions (including whether to buy, sell or hold securities) made by UBS and its employees may differ from or be contrary to the opinions expressed in UBS research publications.Some investments may not be readily realizable since the market in the securities is illiquid and therefore valuing the investment and identifying the risk to which you are exposed may be difficult to quantify. UBS relies on information barriers to control the flow of informationcontained in one or more areas within UBS, into other areas, units, divisions or affiliates of UBS. Futures and Options trading is not suitable for every investor as there is a substantial risk of loss, and losses in excess of an initial investment may occur. Past performance of aninvestment is no guarantee for its future performance. Additional information will be made available upon request. Some investments may be subject to sudden and large falls in value and on realization you may receive back less than you invested or may be required to paymore. Changes in foreign exchange rates may have an adverse effect on the price, value or income of an investment. The analyst(s) responsible for the preparation of this report may interact with trading desk personnel, sales personnel and other constituencies for the purposeof gathering, synthesizing and interpreting market information. Tax treatment depends on the individual circumstances and may be subject to change in the future. UBS does not provide legal or tax advice and makes no representations as to the tax treatment of assets or theinvestment returns thereon both in general or with reference to specific client's circumstances and needs. We are of necessity unable to take into account the particular investment objectives, financial situation and needs of our individual clients and we would recommend thatyou take financial and/or tax advice as to the implications (including tax) of investing in any of the products mentioned herein. This material may not be reproduced or copies circulated without prior authority of UBS. UBS expressly prohibits the distribution and transfer of thismaterial to third parties for any reason. UBS accepts no liability whatsoever for any claims or lawsuits from any third parties arising from the use or distribution of this material. This report is for distribution only under such circumstances as may be permitted by applicable law.In developing the Chief Investment Office (CIO) economic forecasts, CIO economists worked in collaboration with economists employed by UBS Investment Research. Forecasts and estimates are current only as of the date of this publication and may change without notice.For information on the ways in which UBS CIO WM manages conflicts and maintains independence of its investment views and publication offering, and research and rating methodologies, please visit www.ubs.com/research. Additional information on the relevant authorsof this publication and other CIO publication(s) referenced in this report; and copies of any past reports on this topic; are available upon request from your client advisor.External Asset Managers / External Financial Consultants: In case this research or publication is providedto an External Asset Manager or an External Financial Consultant, UBS expressly prohibits that it is redistributed by the External Asset Manager or the External Financial Consultant and is made available to their clients and/or third parties. Australia: This notice is issued byUBS AG ABN 47 088 129 613 (Holder of Australian Financial Services Licence No 231087): This Document is issued and distributed by UBS AG. This is the case despite anything to the contrary in the Document. The Document is intended for use only by “Wholesale Clients”as defined in section 761G (“Wholesale Clients”) of the Corporations Act 2001 (Cth) (“Corporations Act”). In no circumstances may the Document be made available by UBS AG to a “Retail Client” as defined in section 761G of the Corporations Act. UBS AG’s researchservices are only available to Wholesale Clients. The Document is general information only and does not take into account any person’s investment objectives, financial and taxation situation or particular needs. Austria: This publication is not intended to constitute a publicoffer under Austrian law, but might be made available for information purposes to clients of UBS Europe SE, Niederlassung Österreich, with place of business at Wächtergasse 1, A-1010 Wien. UBS Europe SE, Niederlassung Österreich is a branch of UBS Europe SE, a creditinstitution constituted under German Law in the form of a Societas Europaea, duly authorized by the German Federal Financial Services Supervisory Authority (Bundesanstalt für Finanzdienstleistungsaufsicht, BaFin), and is subject to the joint supervision of BaFin, the centralbank of Germany (Deutsche Bundesbank), as well as of the Austrian supervisory authority (Finanzmarktaufsicht, FMA), to which this publication has not been submitted for approval. Bahamas: This publication is distributed to private clients of UBS (Bahamas) Ltd and is notintended for distribution to persons designated as a Bahamian citizen or resident under the Bahamas Exchange Control Regulations. Bahrain: UBS is a Swiss bank not licensed, supervised or regulated in Bahrain by the Central Bank of Bahrain and does not undertake bankingor investment business activities in Bahrain. Therefore, Clients have no protection under local banking and investment services laws and regulations. Brazil: Prepared by UBS Brasil Administradora de Valores Mobiliários Ltda, entity regulated by Comissão de Valores Mobiliários("CVM"). Canada: In Canada, this publication is distributed to clients of UBS Wealth Management Canada by UBS Investment Management Canada Inc.. Czech Republic: UBS is not a licensed bank in Czech Republic and thus is not allowed to provide regulated banking orinvestment services in Czech Republic. This material is distributed for marketing purposes. Denmark: This publication is not intended to constitute a public offer under Danish law, but might be distributed by UBS Europe SE, Denmark Branch, filial af UBS Europe SE, with placeof business at Sankt Annae Plads 13, 1250 Copenhagen, Denmark, registered with the Danish Commerce and Companies Agency, under the No. 38 17 24 33. UBS Europe SE, Denmark Branch, filial af UBS Europe SE is a branch of UBS Europe SE, a credit institution constitutedunder German Law in the form of a Societas Europaea, duly authorized by the German Federal Financial Supervisory Authority (Bundesanstalt für Finanzdienstleistungsaufsicht, BaFin). UBS Europe SE, Denmark Branch, filial af UBS Europe SE is subject to the joint supervisionof the BaFin, the central bank of Germany (Deutsche Bundesbank) and the Danish Financial Supervisory Authority (DFSA) (Finanstilsynet), to which this document has not been submitted for approval. France: This publication is distributed by UBS (France) S.A., French "sociétéanonyme" with share capital of € 125.726.944, 69, boulevard Haussmann F-75008 Paris, R.C.S. Paris B 421 255 670, to its clients and prospects. UBS (France) S.A. is a provider of investment services duly authorized according to the terms of the "Code Monétaire et Financier",regulated by French banking and financial authorities as the "Autorité de Contrôle Prudentiel et de Résolution". Germany: The issuer under German Law is UBS Europe SE, Bockenheimer Landstrasse 2-4, 60306 Frankfurt am Main. UBS Europe SE is authorized and regulated bythe "Bundesanstalt für Finanzdienstleistungsaufsicht". Hong Kong: This publication is distributed to clients of UBS AG Hong Kong Branch by UBS AG Hong Kong Branch, a licensed bank under the Hong Kong Banking Ordinance and a registered institution under the Securitiesand Futures Ordinance. India: Distributed by UBS Securities India Private Ltd. 2/F, 2 North Avenue, Maker Maxity, Bandra Kurla Complex, Bandra (East), Mumbai (India) 400051. Phone: +912261556000. SEBI Registration Numbers: NSE (Capital Market Segment): INB230951431,NSE (F&O Segment) INF230951431, BSE (Capital Market Segment) INB010951437. Israel: UBS Switzerland AG is registered as a Foreign Dealer in cooperation with UBS Wealth Management Israel Ltd, a wholly owned UBS subsidiary. UBS Wealth Management Israel Ltd is alicensed Portfolio Manager which engages also in Investment Marketing and is regulated by the Israel Securities Authority. This publication shall not replace any investment advice and/or investment marketing provided by a relevant licensee which is adjusted to your personalneeds. Italy: This publication is distributed to the clients of UBS Europe SE, Succursale Italia, Via del Vecchio Politecnico, 3 - 20121 Milano, the branch of a German bank duly authorized by the “Bundesanstalt für Finanzdienstleistungsaufsicht” to the provision of financialservices and supervised by "Consob". Jersey: UBS AG, Jersey Branch, is regulated and authorized by the Jersey Financial Services Commission for the conduct of banking, funds and investment business. Where services are provided from outside Jersey, they will not be coveredby the Jersey regulatory regime. UBS AG, Jersey Branch is a branch of UBS AG a public company limited by shares, incorporated in Switzerland whose registered offices are at Aeschenvorstadt 1, CH-4051 Basel and Bahnhofstrasse 45, CH 8001 Zurich. UBS AG, Jersey Branch'sprincipal place business is 1, IFC Jersey, St Helier, Jersey, JE2 3BX. Luxembourg: This publication is not intended to constitute a public offer under Luxembourg law, but might be made available for information purposes to clients of UBS Europe SE, Luxembourg Branch, withplace of business at 33A, Avenue J. F. Kennedy, L-1855 Luxembourg. UBS Europe SE, Luxembourg Branch is a branch of UBS Europe SE, a credit institution constituted under German Law in the form of a Societas Europaea, duly authorized by the German Federal FinancialServices Supervisory Authority (Bundesanstalt für Finanzdienstleistungsaufsicht, BaFin), and is subject to the joint supervision of BaFin, the central bank of Germany (Deutsche Bundesbank), as well as of the Luxembourg supervisory authority, the Commission de Surveillancedu Secteur Financier (the "CSSF"), to which this publication has not been submitted for approval. Mexico: This document has been distributed by UBS Asesores México, S.A. de C.V., a company which is not part of UBS Grupo Financiero, S.A. de C.V. or of any other Mexicanfinancial group and whose obligations are not guaranteed by any third party. UBS Asesores México, S.A. de C.V. does not guarantee any yield whatsoever. Netherlands: This publication is not intended to constitute a public offering or a comparable solicitation under Dutch law,but might be made available for information purposes to clients of UBS Europe SE, Netherlands branch, a branch of a German bank duly authorized by the “Bundesanstalt für Finanzdienstleistungsaufsicht” for the provision of financial services and supervised by "AutoriteitFinanciële Markten” (AFM) in the Netherlands , to which this publication has not been submitted for approval. New Zealand: This notice is distributed to clients of UBS Wealth Management Australia Limited ABN 50 005 311 937 (Holder of Australian Financial Services LicenceNo. 231127), Chifley Tower, 2 Chifley Square, Sydney, New South Wales, NSW 2000, by UBS Wealth Management Australia Ltd. You are being provided with this UBS publication or material because you have indicated to UBS that you are a client certified as a wholesale investorand/or an eligible investor ("Certified Client") located in New Zealand. This publication or material is not intended for clients who are not Certified Clients ("Non-Certified Clients"), and if you are a Non-Certified Client you must not rely on this publication or material. If despitethis warning you nevertheless rely on this publication or material, you hereby (i) acknowledge that you may not rely on the content of this publication or material and that any recommendations or opinions in this publication or material are not made or provided to you, and(ii) to the maximum extent permitted by law (a) indemnify UBS and its associates or related entities (and their respective directors, officers, agents and advisers (each a "Relevant Person") for any loss, damage, liability or claim any of them may incur or suffer as a result of, or inconnection with, your unauthorised reliance on this publication or material and (b) waive any rights or remedies you may have against any Relevant Person for (or in respect of) any loss, damage, liability or claim you may incur or suffer as a result of, or in connection with, yourunauthorised reliance on this publication or material. Saudi Arabia: This publication has been approved by UBS Saudi Arabia (a subsidiary of UBS AG), a Saudi Arabian closed joint stock company incorporated in the Kingdom of Saudi Arabia under commercial register number1010257812 having its registered office at Tatweer Towers, P.O. Box 75724, Riyadh 11588, Kingdom of Saudi Arabia. UBS Saudi Arabia is authorized and regulated by the Capital Market Authority of Saudi Arabia. Singapore: Please contact UBS AG Singapore branch, an exemptfinancial adviser under the Singapore Financial Advisers Act (Cap. 110) and a wholesale bank licensed under the Singapore Banking Act (Cap. 19) regulated by the Monetary Authority of Singapore, in respect of any matters arising from, or in connection with, the analysis orreport. Spain: This publication is distributed to its clients by UBS Europe SE, Sucursal en España, with registered office at Calle María de Molina 4, C.P. 28006, Madrid, entity supervised by Banco de España and the Bundesanstalt für Finanzdienstleistungsaufsicht. UBS EuropeSE, Sucursal en España is a branch of UBS Europe SE, a credit institution constituted in the form of a Societas Europaea authorized and regulated by the Bundesanstalt für Finanzdienstleistungsaufsich. Sweden: This publication is not intended to constitute a public offer underSwedish law, but might be distributed by UBS Europe SE, Sweden Bankfilial with place of business at Regeringsgatan 38, 11153 Stockholm, Sweden, registered with the Swedish Companies Registration Office under the Reg. No 516406-1011. UBS Europe SE, Sweden Bankfilialis a branch of UBS Europe SE, a credit institution constituted under German Law in the form of a Societas Europaea, duly authorized by the German Federal Financial Supervisory Authority (Bundesanstalt für Finanzdienstleistungsaufsicht, BaFin). UBS Europe SE, Sweden Bankfilialis subject to the joint supervision of the BaFin, the central bank of Germany (Deutsche Bundesbank) and the Swedish financial supervisory authority (Finansinspektionen), to which this document has not been submitted for approval. Taiwan: This material is provided by UBS AG,Taipei Branch in accordance with laws of Taiwan, in agreement with or at the request of clients/prospects. Thailand: This material was provided to you as a result of a request received by UBS from you and/or persons entitled to make the request on your behalf. Should you havereceived the material erroneously, UBS asks that you kindly delete the e-mail and inform UBS immediately. The material may not have been reviewed, approved, disapproved or endorsed by any financial or regulatory authority in your jurisdiction. The relevant investments will besubject to restrictions and obligations on transfer as set forth in the material, and by receiving the material you undertake to comply fully with such restrictions and obligations. You should carefully study and ensure that you understand and exercise due care and discretion inconsidering your investment objective, risk appetite and personal circumstances against the risk of the investment. You are advised to seek independent professional advice in case of doubt. UAE: This research report is not intended to constitute an offer, sale or delivery of shares
17

Disclaimeror other securities under the laws of the United Arab Emirates (UAE). The contents of this report have not been and will not be approved by any authority in the United Arab Emirates including the UAE Central Bank or Dubai Financial Authorities, the Emirates Securities andCommodities Authority, the Dubai Financial Market, the Abu Dhabi Securities market or any other UAE exchange. This material is intended for professional clients only. UBS AG Dubai Branch is regulated by the DFSA in the DIFC. UBS AG/UBS Switzerland AG is not licensed toprovide banking services in the UAE by the Central Bank of the UAE nor is it licensed by the UAE Securities and Commodities Authority. The UBS AG Representative Office in Abu Dhabi is licensed by the Central Bank of the UAE to operate a representative office. UK: Approvedby UBS AG, authorised and regulated by the Financial Market Supervisory Authority in Switzerland. In the United Kingdom, UBS AG is authorised by the Prudential Regulation Authority and subject to regulation by the Financial Conduct Authority and limited regulation bythe Prudential Regulation Authority. Details about the extent of our regulation by the Prudential Regulation Authority are available from us on request. A member of the London Stock Exchange. This publication is distributed to private clients of UBS London in the UK. Whereproducts or services are provided from outside the UK, they will not be covered by the UK regulatory regime or the Financial Services Compensation Scheme. USA: This document is not intended for distribution into the US, to US persons, or by US-based UBS personnel. UBSSecurities LLC is a subsidiary of UBS AG and an affiliate of UBS Financial Services Inc., UBS Financial Services Inc. is a subsidiary of UBS AG.Version 07/2017.© UBS 2018. The key symbol and UBS are among the registered and unregistered trademarks of UBS. All rights reserved.
18