outlook to action: ubs cio strategy updatevttaxseminar.org/documents/2015/morningkeynote.pdf ·...
TRANSCRIPT
0
Outlook to Action: UBS CIO Strategy Update
December 2015
UBS WMA Chief Investment Office
ab 1
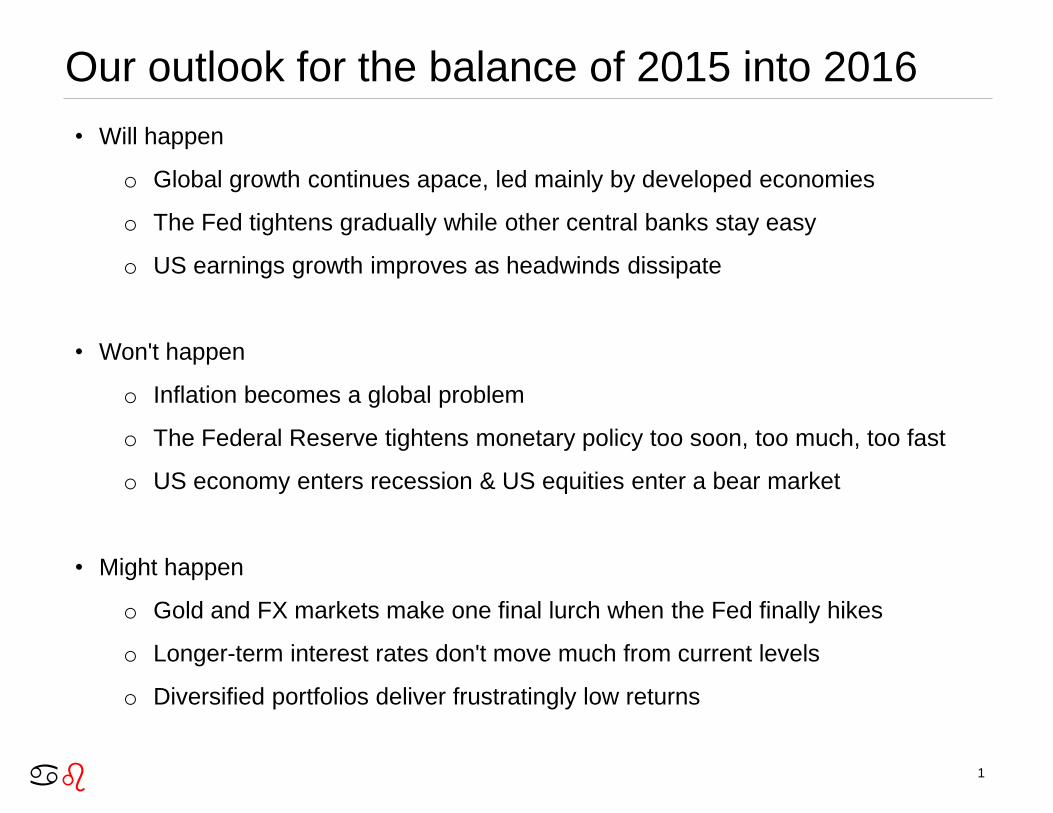
Our outlook for the balance of 2015 into 2016
• Will happen
o Global growth continues apace, led mainly by developed economies
o The Fed tightens gradually while other central banks stay easy
o US earnings growth improves as headwinds dissipate
• Won't happen
o Inflation becomes a global problem
o The Federal Reserve tightens monetary policy too soon, too much, too fast
o US economy enters recession & US equities enter a bear market
• Might happen
o Gold and FX markets make one final lurch when the Fed finally hikes
o Longer-term interest rates don't move much from current levels
o Diversified portfolios deliver frustratingly low returns

ab 2
2015 has been a "flattish" year on average
Source: UBS CIO WMR, Bloomberg, 5 November 2015.
-20% -10% 0% 10%
Commodit ies
EM local bonds
EM equity
Int ' l dev FI
US IG credit
US small-cap
Cash
US high yield
US government
US mid-cap
Int ' l developed equity
US municipals
EM USD bonds
US large-cap
Total returns YTD

ab 3
At long last, global monetary policy is diverging
Source: UBS CIO WMR, UBS Investment Research, as of 5 November 2015.
-1.0
0.0
1.0
2.0
3.0
4.0
5.0
6.0
2008 2009 2010 2011 2012 2013 2014 2015 2016 2017
US UK Switzerland Euro area Japan
Policy rate (%) with UBS forecasts
ab 4
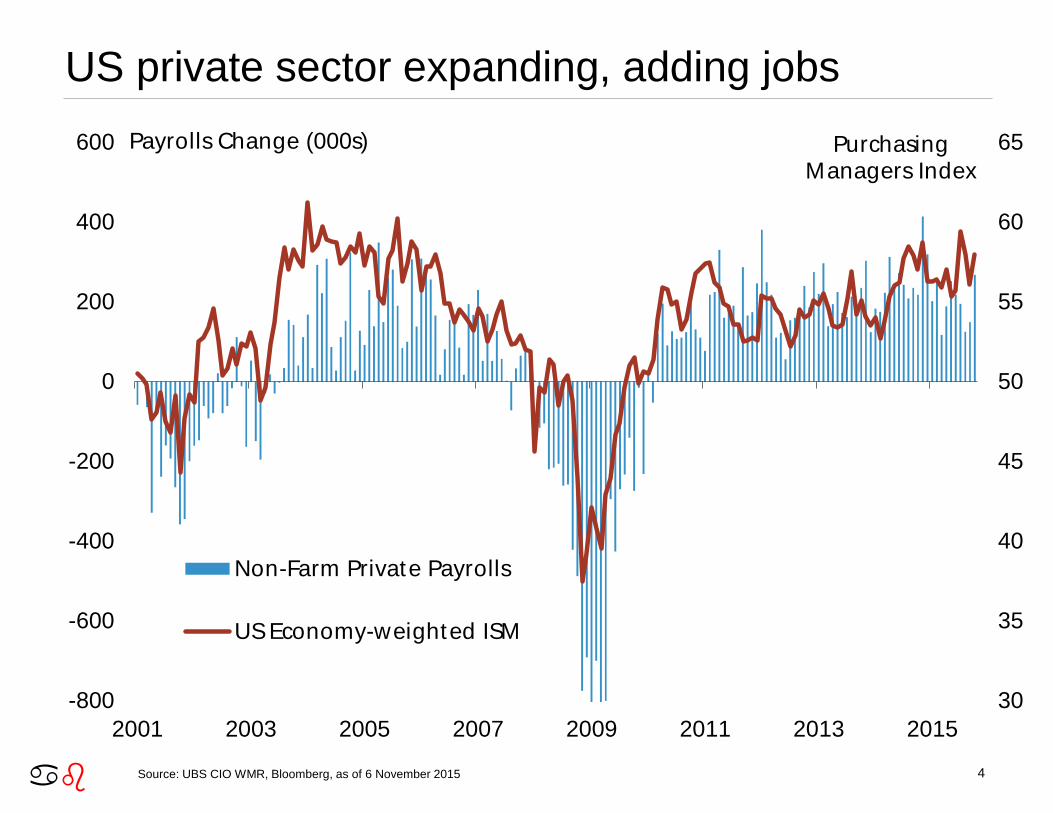
US private sector expanding, adding jobs
Source: UBS CIO WMR, Bloomberg, as of 6 November 2015
30
35
40
45
50
55
60
65
-800
-600
-400
-200
0
200
400
600
2001 2003 2005 2007 2009 2011 2013 2015
Purchasing Managers Index
Non-Farm Private Payrolls
US Economy-weighted ISM
Payrolls Change (000s)

ab 5
US consumers back in the driver's seat
Source: UBS CIO WMR, Bloomberg, as of 30 September 2015.
-6
-4
-2
0
2
4
6
1990 1993 1996 1999 2002 2005 2008 2011 2014
US GDP Growth (YoY %) US Consumpt ion Growth (YoY %)

ab 6
Chinese growth is not slowing rapidly
Source: UBS CIO WMR, Bloomberg, as of 30 October 2015
ab 7
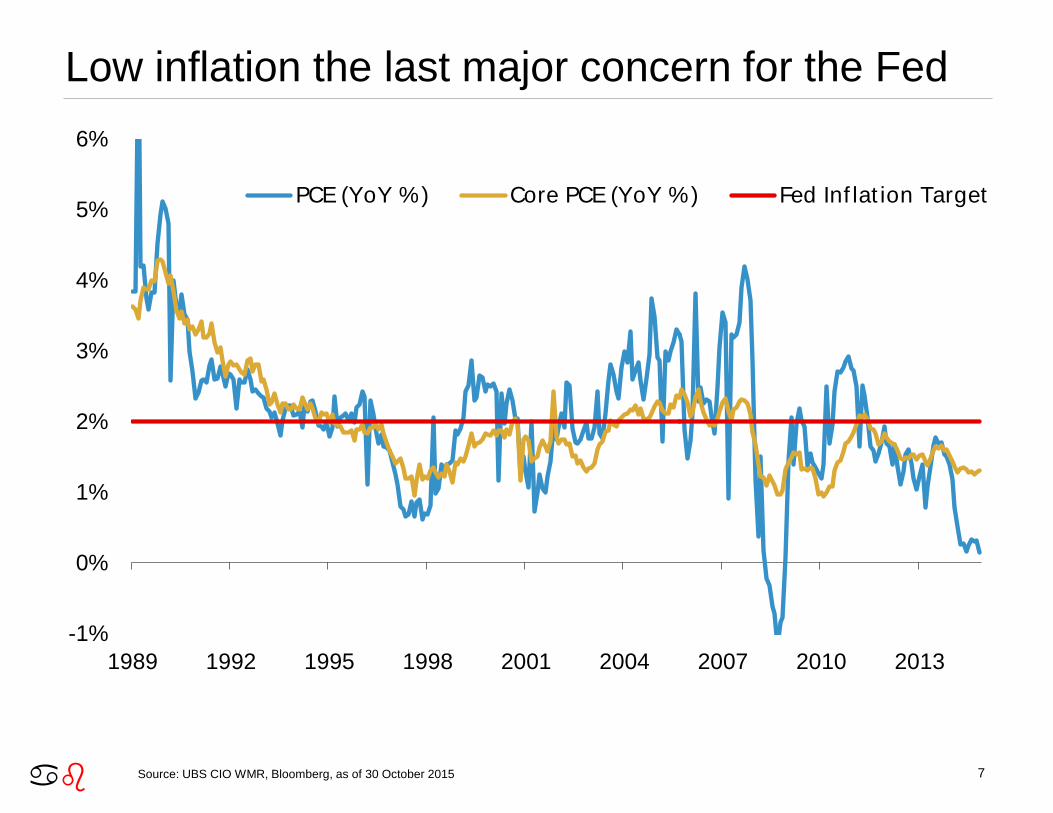
Low inflation the last major concern for the Fed
Source: UBS CIO WMR, Bloomberg, as of 30 October 2015
-1%
0%
1%
2%
3%
4%
5%
6%
1989 1992 1995 1998 2001 2004 2007 2010 2013
PCE (YoY %) Core PCE (YoY %) Fed Inf lat ion Target
ab 8
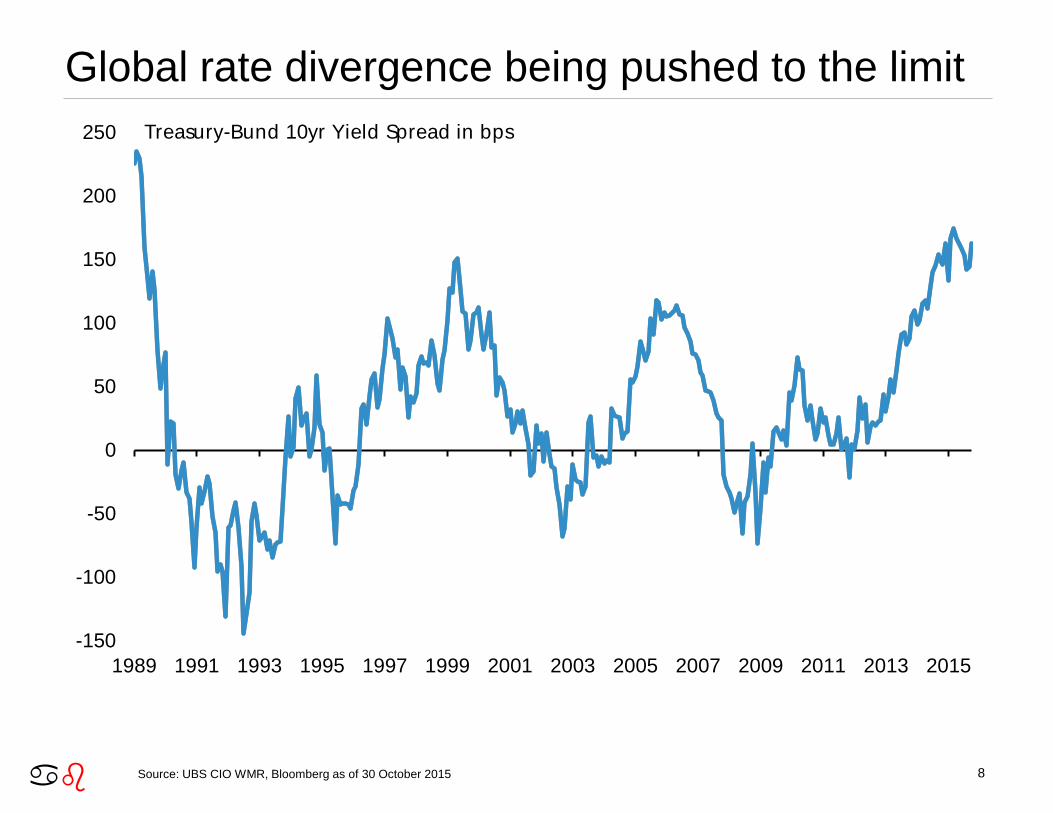
Global rate divergence being pushed to the limit
Source: UBS CIO WMR, Bloomberg as of 30 October 2015
-150
-100
-50
0
50
100
150
200
250
1989 1991 1993 1995 1997 1999 2001 2003 2005 2007 2009 2011 2013 2015
Treasury-Bund 10yr Yield Spread in bps
ab 9
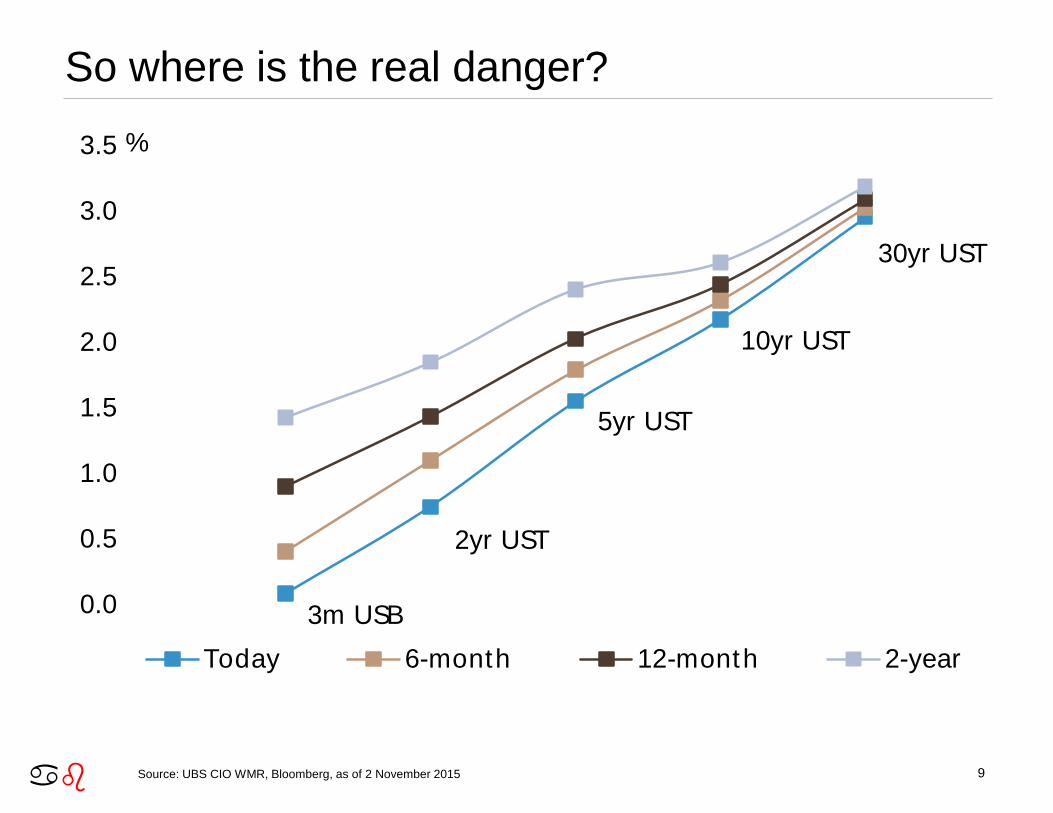
So where is the real danger?
Source: UBS CIO WMR, Bloomberg, as of 2 November 2015
0.0
0.5
1.0
1.5
2.0
2.5
3.0
3.5
Today 6-month 12-month 2-year
3m USB
2yr UST
5yr UST
10yr UST
30yr UST
%
ab 10
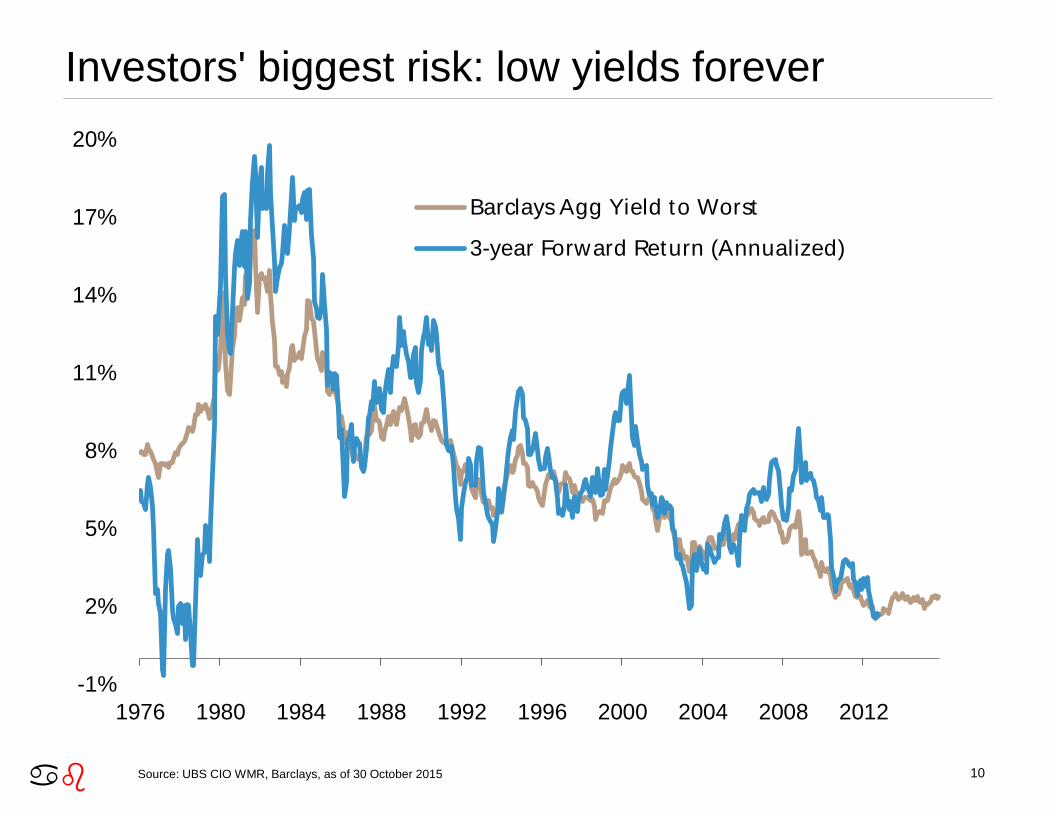
Investors' biggest risk: low yields forever
Source: UBS CIO WMR, Barclays, as of 30 October 2015
-1%
2%
5%
8%
11%
14%
17%
20%
1976 1980 1984 1988 1992 1996 2000 2004 2008 2012
Barclays Agg Yield to Worst
3-year Forward Return (Annualized)
ab 11
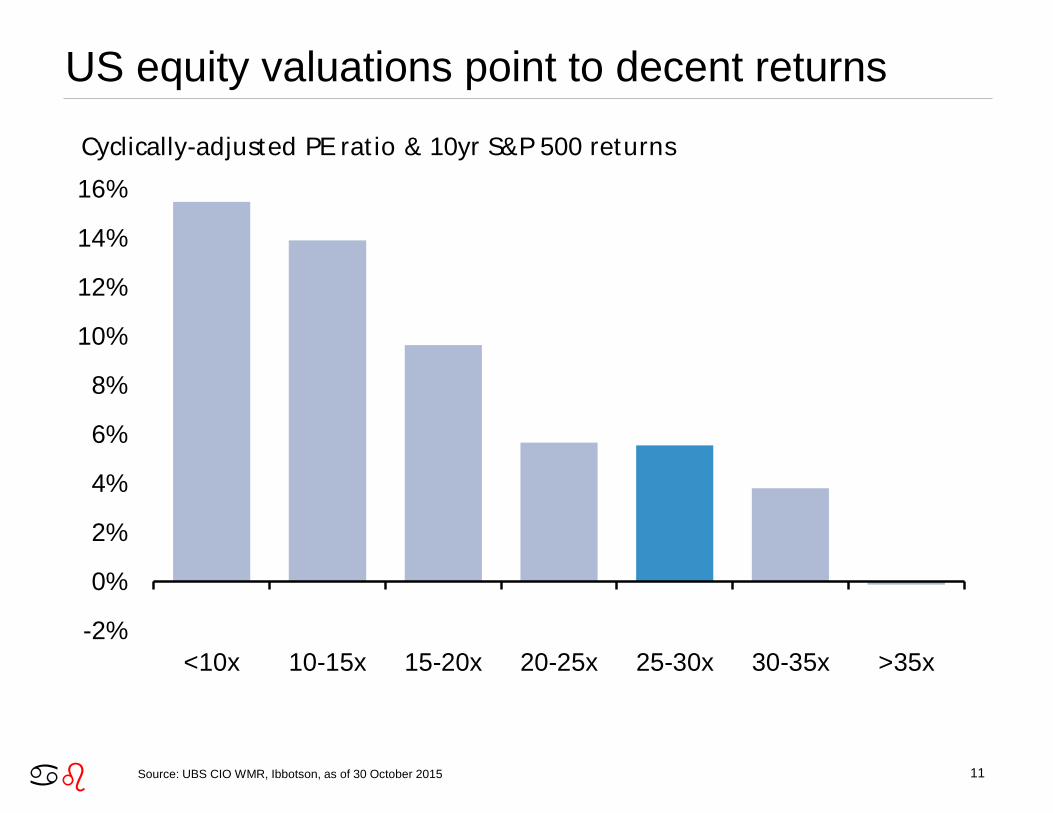
US equity valuations point to decent returns
Source: UBS CIO WMR, Ibbotson, as of 30 October 2015
-2%
0%
2%
4%
6%
8%
10%
12%
14%
16%
<10x 10-15x 15-20x 20-25x 25-30x 30-35x >35x
Cyclically-adjusted PE rat io & 10yr S&P 500 returns

ab 12
Valuation much more attractive outside the US
Source: UBS CIO WMR, Research Affiliates, as of 30 September 2015; * Data for EM starts in 1994
0
5
10
15
20
25
30
US France Germany Italy Spain EM
Current Shiller PE Median Shiller PE
25th Percent ile Shiller PE 75th Percent ile Shiller PE
" Shiller" P/E rat ios for major country equity markets, 1969 - 2015*
ab 13
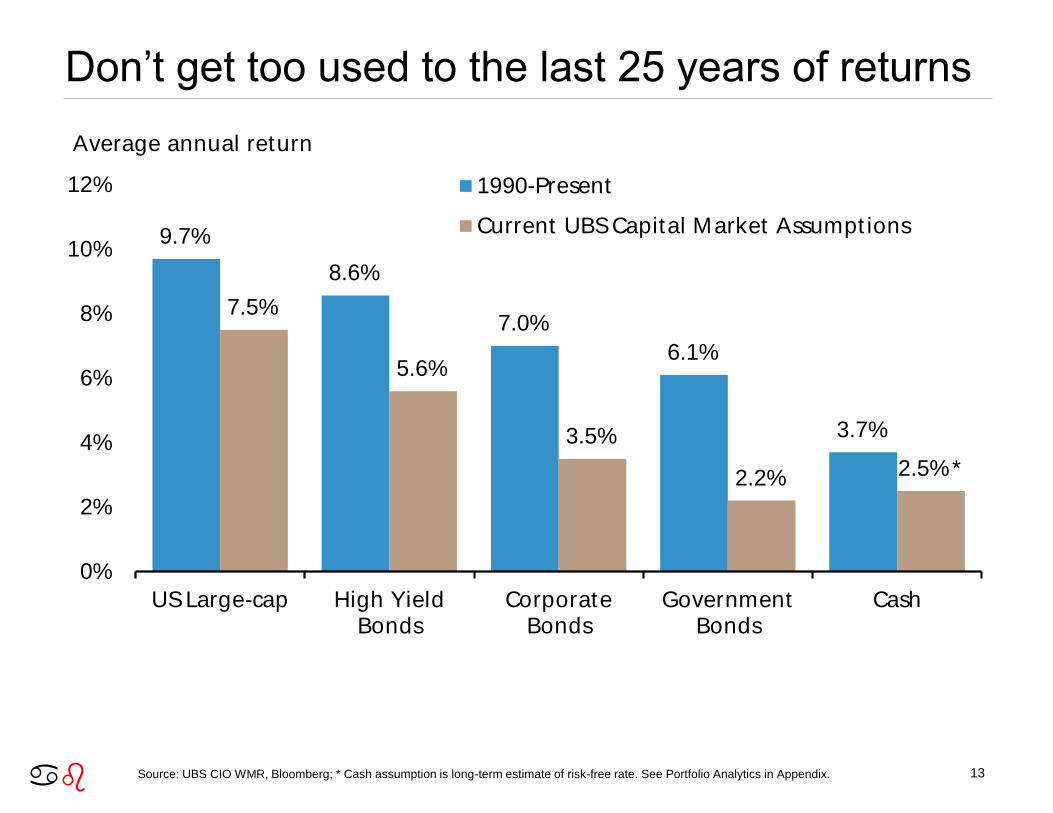
Don’t get too used to the last 25 years of returns
Source: UBS CIO WMR, Bloomberg; * Cash assumption is long-term estimate of risk-free rate. See Portfolio Analytics in Appendix.
9.7%
8.6%
7.0%
6.1%
3.7%
7.5%
5.6%
3.5%
2.2% 2.5%*
0%
2%
4%
6%
8%
10%
12%
US Large-cap High YieldBonds
CorporateBonds
GovernmentBonds
Cash
1990-Present
Current UBS Capital Market Assumpt ions
Average annual return
ab 14
A modest outlook with moderate risks
• US economy is growing at or above its potential and absorbing remaining labor
slack
o Eurozone growth set to accelerate further in 2016
o China & EM slowing but stable
• Muted asset returns given rich starting points
o Bonds are expensive, stocks aren't cheap, the US dollar is still strong
o International investments offer better long-term value
o US credit now cheaper but the cycle is well past the mid-point
• Risks to our Outlook
o US growth turns over for lack of investment and foreign demand
o Oil prices remain low as supply remains high, demand weak
o The "random" stories all break negative, especially in EM
ab 15
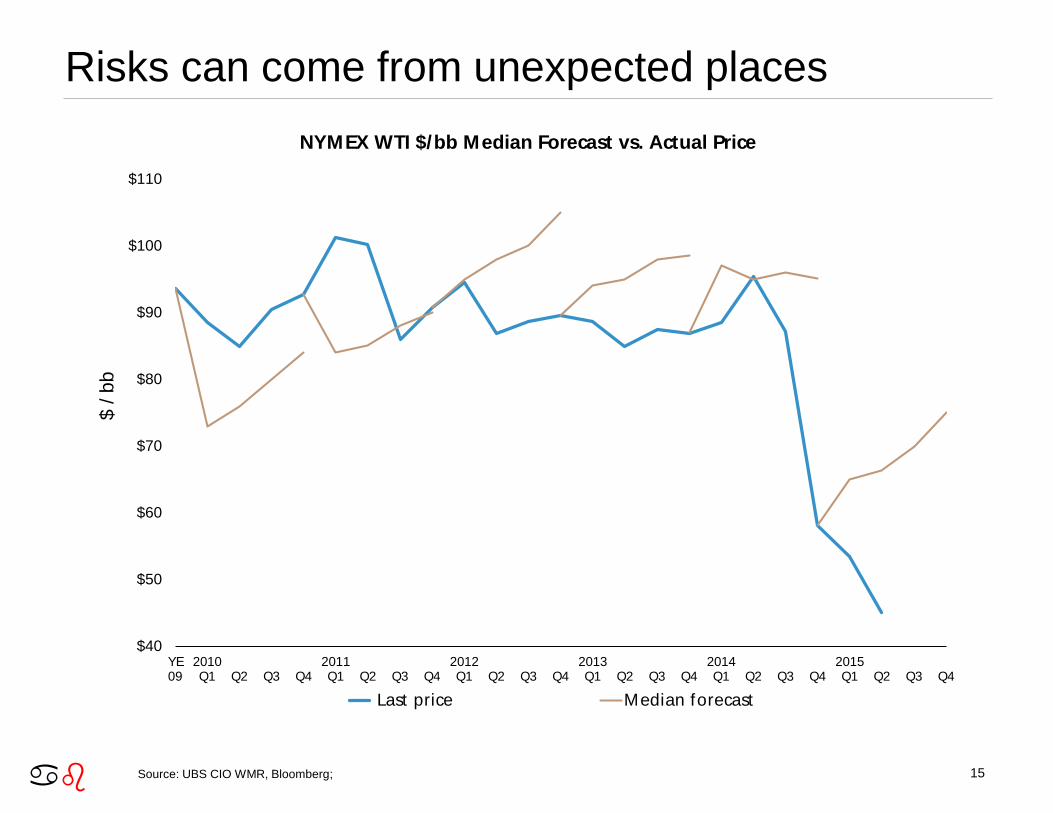
Risks can come from unexpected places
Source: UBS CIO WMR, Bloomberg;
$40
$50
$60
$70
$80
$90
$100
$110
Q4Q3Q22015Q1Q4Q3Q2
2014Q1Q4Q3Q2
2013Q1Q4Q3Q2
2012Q1Q4Q3Q2
2011Q1Q4Q3Q2
2010Q1
YE09
$ / b
b
NYMEX WTI $/bb Median Forecast vs. Actual Price
Last price Median forecast

ab 16
Some are clear ahead of time
Source: UBS CIO WMR, Barclays, as of 31 August 2015
-1%
2%
5%
8%
11%
14%
17%
20%
1976 1980 1984 1988 1992 1996 2000 2004 2008 2012
Barclays Agg Yield to Worst
3-year Forward Return (Annualized)
ab 17
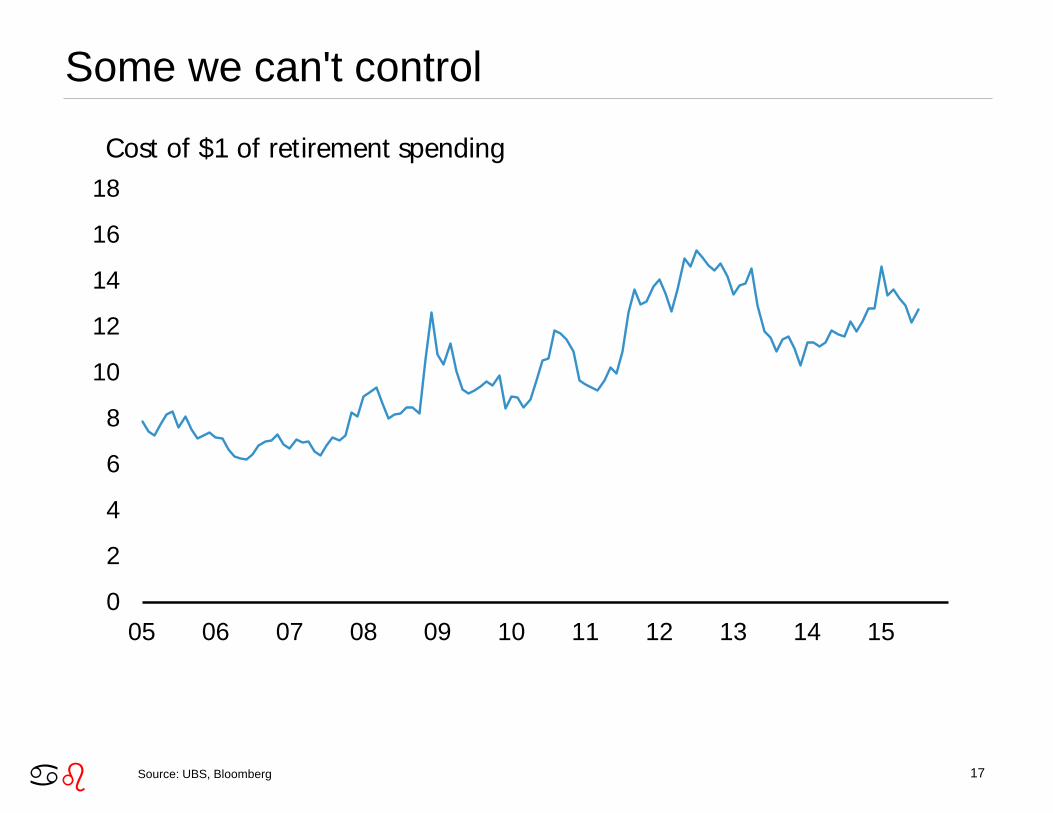
Some we can't control
Source: UBS, Bloomberg
0
2
4
6
8
10
12
14
16
18
05 06 07 08 09 10 11 12 13 14 15
Cost of $1 of retirement spending

ab 18
Others are self-created

ab 19
How did you feel on Friday, August 28th?
-5%
-4%
-3%
-2%
-1%
0%
1%
2%
3%
4%
5%
Monday Tuesday Wednesday Thursday Friday Full Week
Da
ily
Re
turn
Source: Bloomberg, UBS. Data covers 8/24/2015 – 8/28/2015.
ab 20
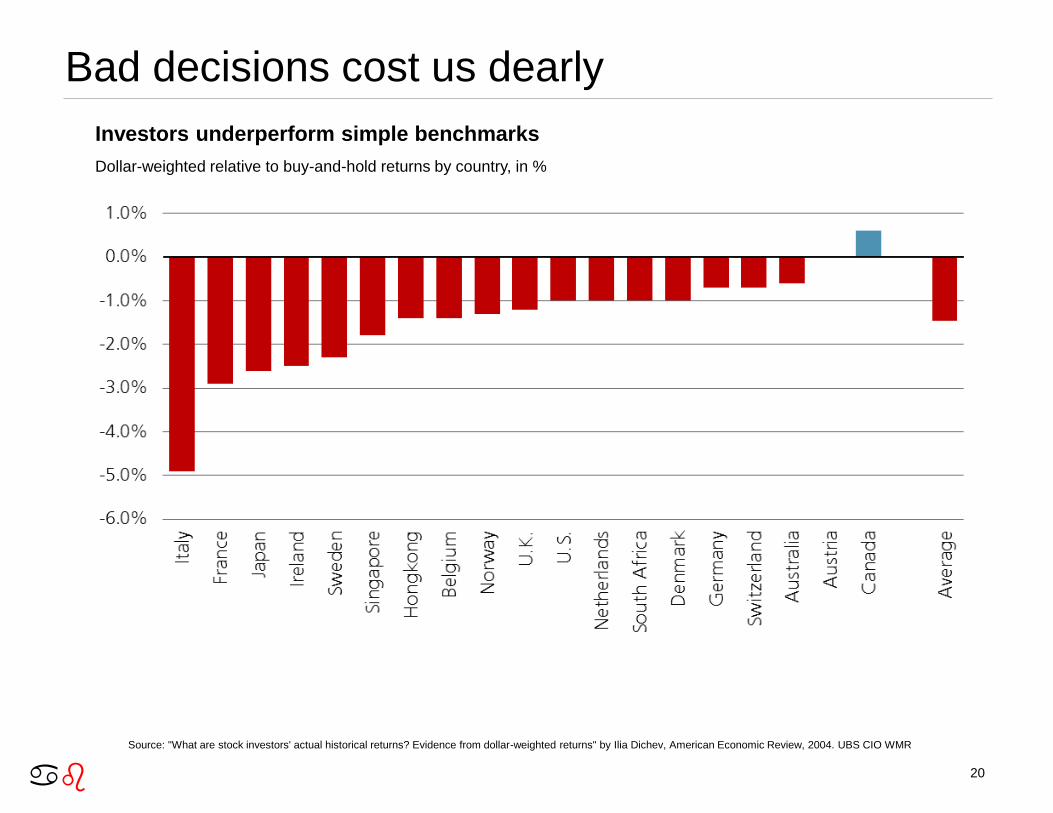
Bad decisions cost us dearly
Investors underperform simple benchmarks
Dollar-weighted relative to buy-and-hold returns by country, in %
Source: "What are stock investors' actual historical returns? Evidence from dollar-weighted returns" by Ilia Dichev, American Economic Review, 2004. UBS CIO WMR
ab 21
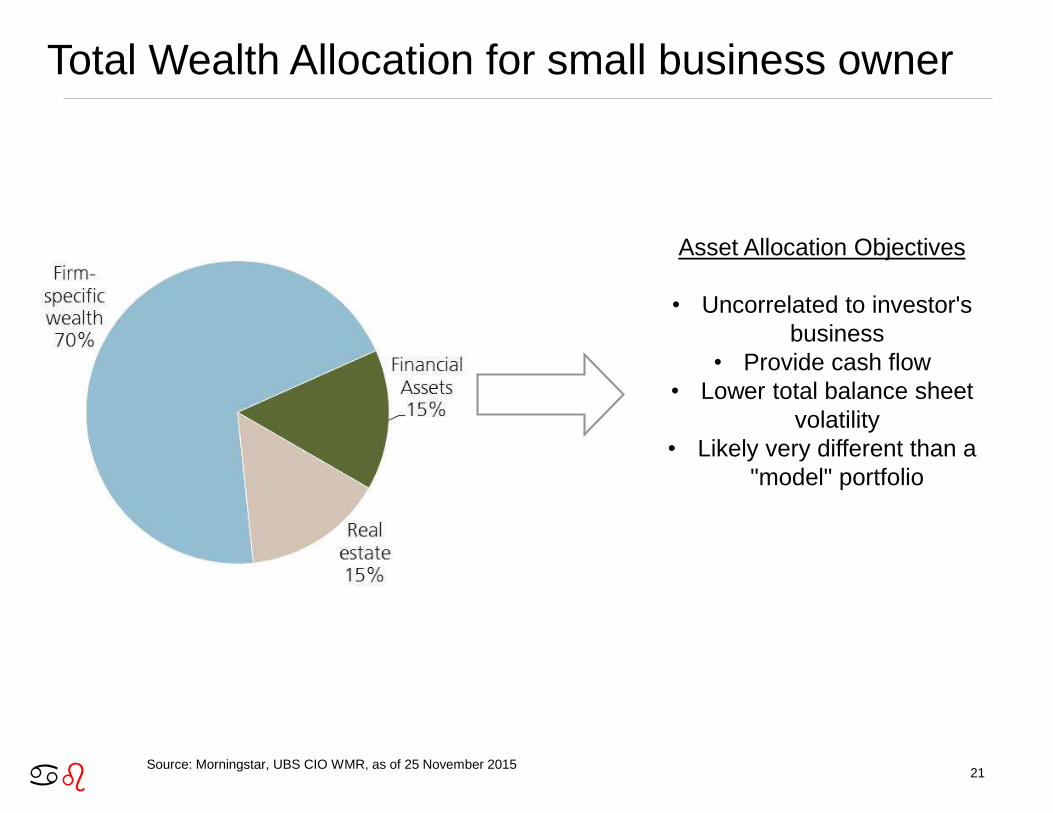
Total Wealth Allocation for small business owner
Source: Morningstar, UBS CIO WMR, as of 25 November 2015
Asset Allocation Objectives
• Uncorrelated to investor's
business
• Provide cash flow
• Lower total balance sheet
volatility
• Likely very different than a
"model" portfolio
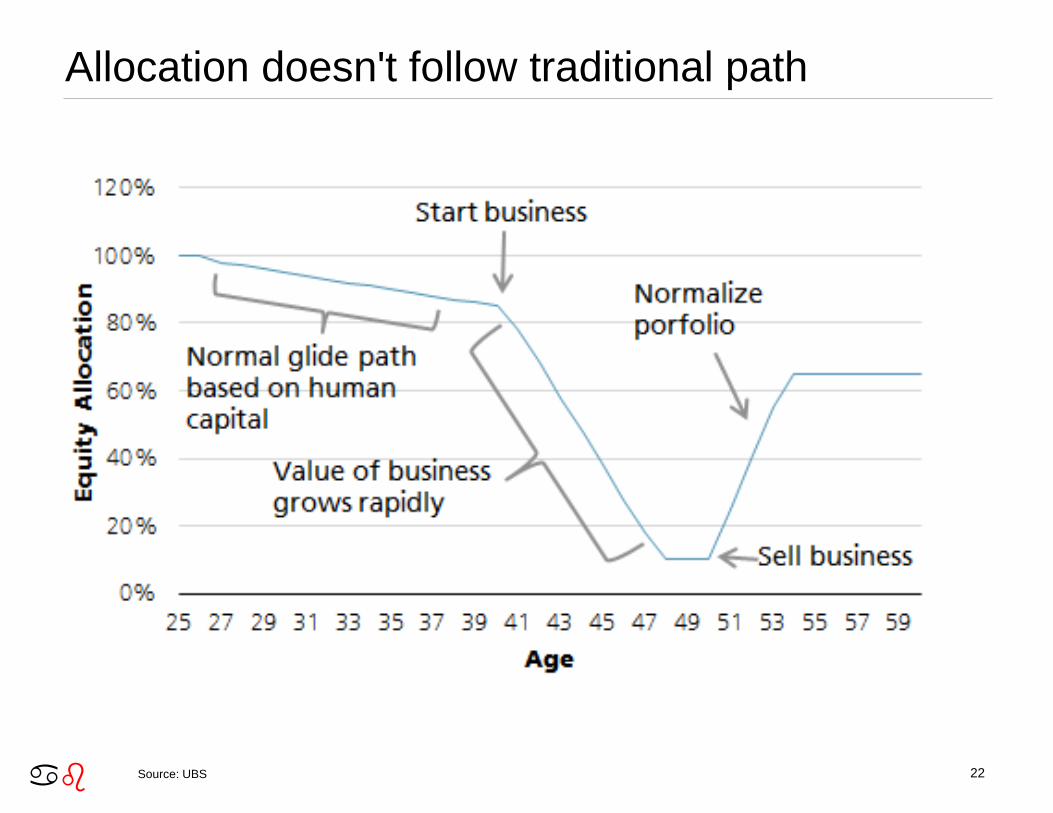
ab 22
Allocation doesn't follow traditional path
Source: UBS
ab 23
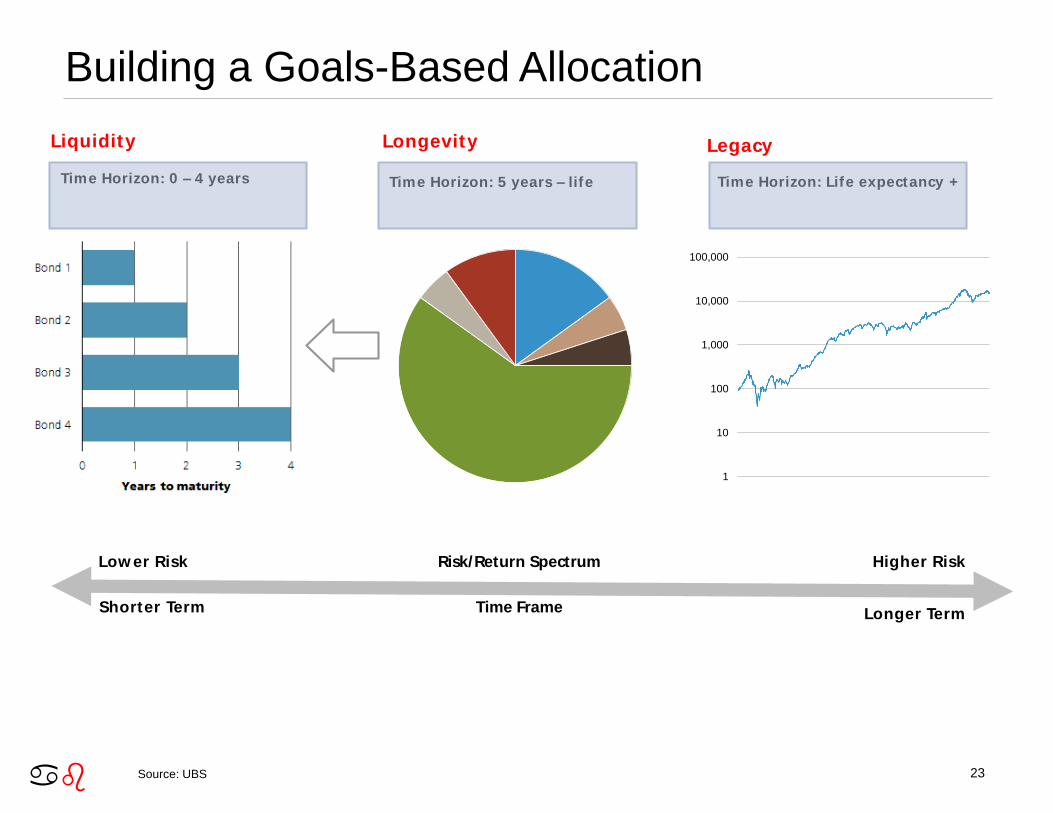
Building a Goals-Based Allocation
Source: UBS
Risk/Return SpectrumLow er Risk
Shorter Term Time Frame
Higher Risk
Longer Term
Liquidity
Time Horizon: 0 – 4 years
Longevity
Time Horizon: 5 years – life
Legacy
Time Horizon: Life expectancy +
1
10
100
1,000
10,000
100,000
ab 24
AppendixSources of strategic asset allocations and investor risk profiles
Strategic asset allocations represent the longer-term allocation of assets that is deemed suitable for a particular investor. The strategic asset allocation models
discussed in this publication, and the capital market assumptions used for the strategic asset allocations, were developed and approved by the WMA AAC.
The strategic asset allocations are provided for illustrative purposes only and were designed by the WMA AAC for hypothetical US investors with a total return
objective under five different Investor Risk Profiles ranging from conservative to aggressive. In general, strategic asset allocations will differ among investors
according to their individual circumstances, risk tolerance, return objectives and time horizon. Therefore, the strategic asset allocations in this publication may not
be suitable for all investors or investment goals and should not be used as the sole basis of any investment decision. Minimum net worth requirements may apply
to allocations to non-traditional assets. As always, please consult your UBS Financial Advisor to see how these weightings should be applied or modified
according to your individual profile and investment goals.
The process by which the strategic asset allocations were derived is described in detail in the publication entitled “UBS WMA’s Capital Markets Model: Explained,
Part II: Methodology,” published on 22 January 2013. Your Financial Advisor can provide you with a copy.
Deviations from strategic allocation
The recommended tactical deviations from the strategic asset allocation or benchmark allocation are provided by the Global Investment Committee and the
Investment Strategy Group within Wealth Management Research Americas. They reflect the short- to medium- term assessment of market opportunities and
risks in the respective asset classes and market segments. Positive / zero / negative tactical deviations correspond to an overweight / neutral / underweight
stance for each respective asset class and market segment relative to their strategic allocation. The current allocation is the sum of the strategic asset allocation
and the tactical deviation. Overweight: Tactical recommendation to hold more of the asset class than specified in the strategic asset allocation on pages 24-27 of
the flagship publication UBS House View: Investment Strategy Guide. Underweight: Tactical recommendation to hold less of the asset class than specified in the
strategic asset allocation on pages 24-27 of the flagship publication UBS House View: Investment Strategy Guide. Neutral: Tactical recommendation to hold the
asset class in line with its weight in the strategic asset allocation on pages 24-27 of the flagship publication UBS House View: Investment Strategy Guide.
Portfolio analytics
The portfolio analytics for each risk profile’s benchmark allocations are based on estimated forward-looking return and standard deviation assumptions (capital
market assumptions), which are based on UBS proprietary research. The development process includes a review of a variety of factors, including the return, risk,
correlations and historical performance of various asset classes, inflation and risk premium. These capital market assumptions do not assume any particular
investment time horizon. The process assumes a situation where the supply and demand for investments is in balance, and in which expected returns of all asset
classes are a reflection of their expected risk and correlations regardless of time frame. Please note that these assumptions are not guarantees and are subject to
change. UBS has changed its risk and return assumptions in the past and may do so in the future. Neither UBS nor your Financial Advisor is required to provide
you with an updated analysis based upon changes to these or other underlying assumptions.
In order to create the analysis, the rates of return for each asset class are combined in the same proportion as the asset allocations illustrated (e.g., if the asset
allocation indicates 40% equities, then 40% of the results for the allocation will be based upon the estimated hypothetical return and standard deviation
assumptions).
You should understand that the analysis shown and assumptions used are hypothetical estimates provided for your general information. The results are not
guarantees and pertain to the asset allocation and/or asset class in general, not the performance of specific securities or investments. Your actual results may
vary significantly from the results shown in this report, as can the performance of any individual security or investment.
ab25
Disclaimer Chief Investment Office (CIO) Wealth Management (WM) Research is published by UBS Wealth Management and UBS Wealth Management Americas, Business
Divisions of UBS AG (UBS) or an affiliate thereof. CIO WM Research reports published outside the US are branded as Chief Investment Office WM. In certain
countries UBS AG is referred to as UBS SA. This publication is for your information only and is not intended as an offer, or a solicitation of an offer, to buy or sell any
investment or other specific product. The analysis contained herein does not constitute a personal recommendation or take into account the particular investment
objectives, investment strategies, financial situation and needs of any specific recipient. It is based on numerous assumptions. Different assumptions could result in
materially different results. We recommend that you obtain financial and/or tax advice as to the implications (including tax) of investing in the manner described or in
any of the products mentioned herein. Certain services and products are subject to legal restrictions and cannot be offered worldwide on an unrestricted basis
and/or may not be eligible for sale to all investors. All information and opinions expressed in this document were obtained from sources believed to be reliable and in
good faith, but no representation or warranty, express or implied, is made as to its accuracy or completeness (other than disclosures relating to UBS and its
affiliates). All information and opinions as well as any prices indicated are current only as of the date of this report, and are subject to change without notice.
Opinions expressed herein may differ or be contrary to those expressed by other business areas or divisions of UBS as a result of using different assumptions
and/or criteria. At any time, investment decisions (including whether to buy, sell or hold securities) made by UBS AG, its affiliates, subsidiaries and employees may
differ from or be contrary to the opinions expressed in UBS research publications. Some investments may not be readily realizable since the market in the securities
is illiquid and therefore valuing the investment and identifying the risk to which you are exposed may be difficult to quantify. UBS relies on information barriers to
control the flow of information contained in one or more areas within UBS, into other areas, units, divisions or affiliates of UBS. Futures and options trading is
considered risky. Past performance of an investment is no guarantee for its future performance. Some investments may be subject to sudden and large falls in value
and on realization you may receive back less than you invested or may be required to pay more. Changes in FX rates may have an adverse effect on the price,
value or income of an investment. This report is for distribution only under such circumstances as may be permitted by applicable law.
Distributed to US persons by UBS Financial Services Inc. or UBS Securities LLC, subsidiaries of UBS AG. UBS Switzerland AG, UBS Deutschland AG, UBS Bank,
S.A., UBS Brasil Administradora de Valores Mobiliarios Ltda, UBS Asesores Mexico, S.A. de C.V., UBS Securities Japan Co., Ltd, UBS Wealth Management Israel
Ltd and UBS Menkul Degerler AS are affiliates of UBS AG. UBS Financial Services Incorporated of PuertoRico is a subsidiary of UBS Financial Services Inc. UBS
Financial Services Inc. accepts responsibility for the content of a report prepared by a non-US affiliate when it distributes reports to US persons. All transactions by a
US person in the securities mentioned in this report should be effected through a US-registered broker dealer affiliated with UBS, and not through a non-US affiliate.
The contents of this report have not been and will not be approved by any securities or investment authority in the United States or elsewhere. UBS Financial
Services Inc. is not acting as a municipal advisor to any municipal entity or obligated person within the meaning of Section 15B of the Securities Exchange Act (the
"Municipal Advisor Rule") and the opinions or views contained herein are not intended to be, and do not constitute, advice within the meaning of the Municipal
Advisor Rule.
UBS specifically prohibits the redistribution or reproduction of this material in whole or in part without the prior written permission of UBS and UBS accepts no liability
whatsoever for the actions of third parties in this respect.
Version as per September 2015.
© UBS 2015. The key symbol and UBS are among the registered and unregistered trademarks of UBS. All rights reserved.