outlook to action: ubs cio strategy update - c.ymcdn.comc.ymcdn.com/sites/ · pdf fileoutlook...
TRANSCRIPT

0
Outlook to Action: UBS CIO Strategy Update May 2015
UBS WMA Chief Investment Office

1
Our Outlook for the balance of 2015: Will…Won't…Might…
• Will happen
o Global growth continues apace, led mainly by developed economies
o The Fed tightens while lots of other central banks (EM & DM) ease
o US small-caps and European large-cap companies lead global earnings
• Won't happen
o Inflation becomes a global problem
o The Federal Reserve tightens monetary policy too soon, too much, too fast
o The S&P 500 delivers above-average returns with below-average volatility
• Might happen
o Structural reforms in EM lead to macro stabilization & better investor sentiment
o Long-term interest rates don't budge even if Fed raises the short end
o European economic growth accelerates, providing support to the euro

2
Who is going to be the world's growth engine?
Source: UBS CIO WMR, UBS Investment Research, as of 1 May 2015.
Outlook
-1
0
1
2
3
4
5
6
7
8
9
2013 2014F 2015F 2016F
United States Euro area China India Japan World
GDP Growth (%)

3
US private sector still expanding but at a slower pace
Source: UBS CIO WMR, Bloomberg, as of 1 May 2015
Outlook
30
35
40
45
50
55
60
65
-800
-600
-400
-200
0
200
400
600
2001 2003 2005 2007 2009 2011 2013 2015
Manufacturing PMI
Non-Farm Private Payrolls(thousands)
ISM Manufacturing PMI
Payrolls Change (000s)

4
US consumers are feeling pretty good
Source: UBS CIO WMR, Bloomberg, as of 1 May 2015.
Outlook
$2.00
$2.30
$2.60
$2.90
$3.20
$3.50
$3.80
70
75
80
85
90
95
100
Jan-13 May-13 Sep-13 Jan-14 May-14 Sep-14 Jan-15
U. of M. Consumer Confidence (LHS) National average gasoline price (RHS)

5
Low inflation is allowing the Fed to be patient
Source: UBS CIO WMR, Bloomberg, as of 1 May 2015
Outlook
-1%
0%
1%
2%
3%
4%
5%
6%
1989 1992 1995 1998 2001 2004 2007 2010 2013
PCE (YoY %) Core PCE (YoY %) Fed Inflation Target

6
At long last, global monetary policy is set to diverge
Source: UBS CIO WMR, UBS Investment Research, as of 1 May 2015.
Outlook
-1.0
0.0
1.0
2.0
3.0
4.0
5.0
6.0
2008 2009 2010 2011 2012 2013 2014 2015 2016
US UK Switzerland Euro area Japan
Policy rate (%) with UBS forecasts

7
"Surprise gap" favoring Eurozone over US in 2015
Source: UBS CIO WMR, Bloomberg, as of 1 May 2015
Outlook
-100
-75
-50
-25
0
25
50
75
100
Jan-12 Jun-12 Nov-12 Apr-13 Sep-13 Feb-14 Jul-14 Dec-14
US Surprises
Eurozone Surprises
Citi Economic Surprise Indexes (0 = no surprise)

8
Invest! Cash is still a "real" loser
Source: UBS CIO WMR, UBS Investment Research, Bloomberg, as of 30 April 2015.
Valuation
92
94
96
98
100
102
104
106
2003 2005 2007 2009 2011 2013 2015
Real Cash Returns (April 2003 = 100)

9
Bonds' outlook is challenged by their starting point
Source: UBS CIO WMR, Barclays, as of 30 April 2015
Valuation
-1%
2%
5%
8%
11%
14%
17%
20%
1976 1980 1984 1988 1992 1996 2000 2004 2008 2012
Barclays Agg Yield to Worst
3-year Forward Return (Annualized)

10
US-Eurozone rate spread at a multi-decade high
Source: UBS CIO WMR, Bloomberg as of 1 May 2015
Valuation
-150
-100
-50
0
50
100
150
200
250
1989 1991 1993 1995 1997 1999 2001 2003 2005 2007 2009 2011 2013 2015
Treasury-Bund 10yr Yield Spread in bps

11
Stocks over bonds an easier call now in Europe than US
Source: UBS CIO WMR, Bloomberg; valuation based on cyclically-adjusted equities earnings yields compared to Treasuries & Bunds, as of 30 April 2015
Valuation
2.0%
3.0%
4.0%
5.0%
6.0%
7.0%
Jun-09 May-10 Apr-11 Mar-12 Feb-13 Jan-14 Dec-14
DAX FLERP S&P 500 FLERP
Forward-looking equity risk premium (over govies)

12
US stocks still cheap vs. bonds (mainly due to the bonds)
Source: UBS CIO WMR, Bloomberg; valuation based on equities earnings yield compared to Treasuries, as of 30 April 2015
Valuation
-2%
0%
2%
4%
6%
8%
1982 1986 1990 1994 1998 2002 2006 2010 2014
Forward-looking
equity risk premium
13
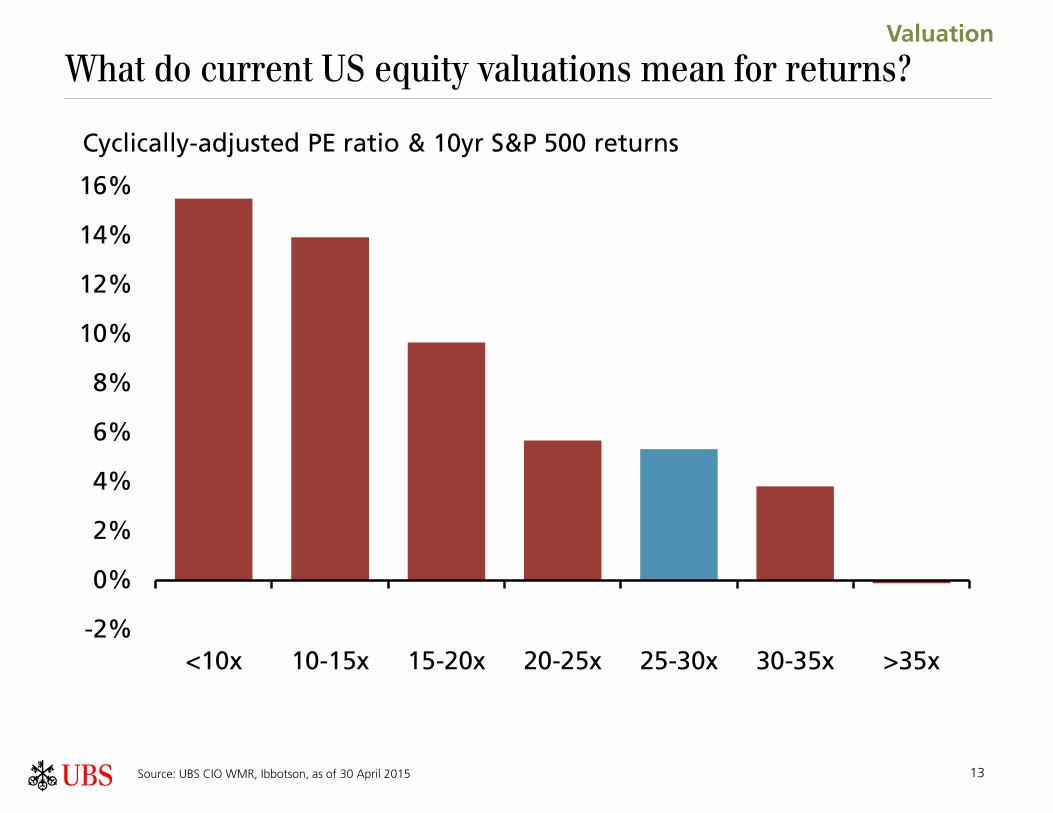
What do current US equity valuations mean for returns?
Source: UBS CIO WMR, Ibbotson, as of 30 April 2015
Valuation
-2%
0%
2%
4%
6%
8%
10%
12%
14%
16%
<10x 10-15x 15-20x 20-25x 25-30x 30-35x >35x
Cyclically-adjusted PE ratio & 10yr S&P 500 returns

14
2004 vs. 2015: How and why did rates rise?
Source: UBS CIO WMR, Bloomberg, data covers 1/1/04 – 12/31/04 and 1/1/15 – 5/1/15
Behavior
15
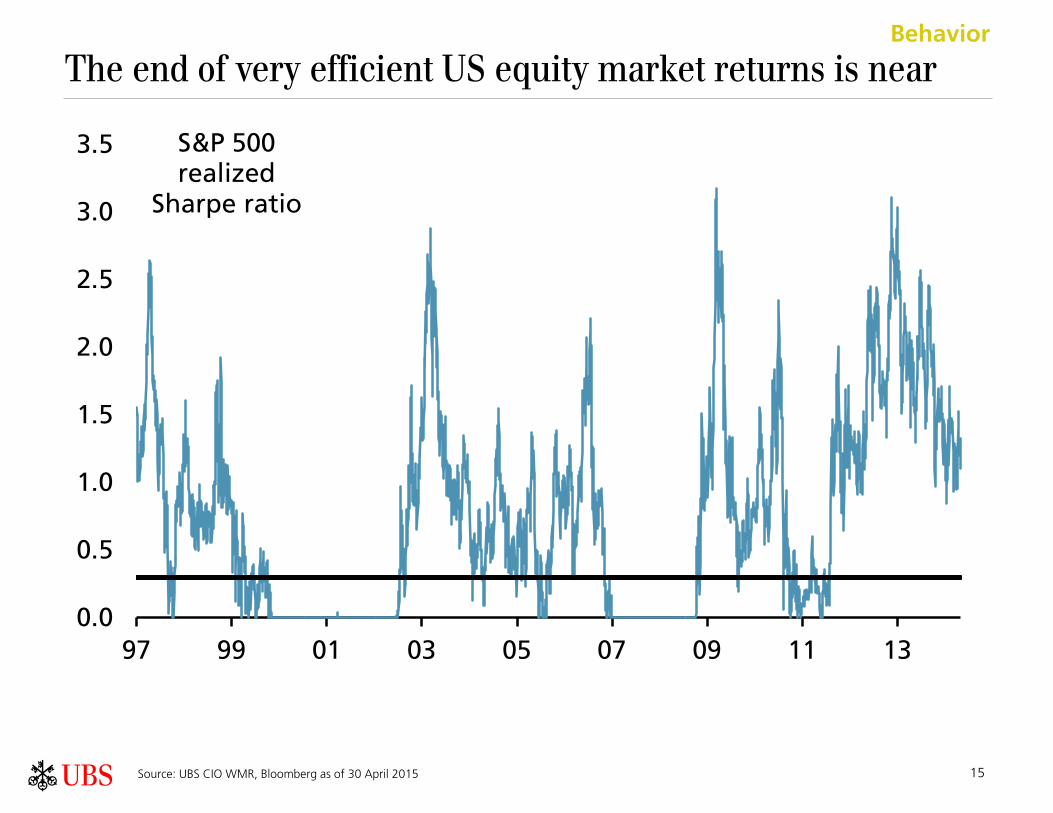
The end of very efficient US equity market returns is near
Source: UBS CIO WMR, Bloomberg as of 30 April 2015
Behavior
0.0
0.5
1.0
1.5
2.0
2.5
3.0
3.5
97 99 01 03 05 07 09 11 13
S&P 500 realized
Sharpe ratio

16
Home bias is not a permanent portfolio strategy
Source: UBS CIO WMR, Bloomberg as of 30 April 2015
Behavior
0
50
100
150
200
250
300
350
1990 1993 1996 1999 2002 2005 2008 2011 2014
MSCI US vs. MSCI AC
World ex US

17
QE does not permanently weaken currencies
Source: UBS CIO WMR, Bloomberg as of 1 May 2015
Behavior
1.0
1.1
1.2
1.3
1.4
1.5
1.6
Jan-09 Dec-09 Nov-10 Oct-11 Sep-12 Aug-13 Jul-14
QE1 QE2 QE3
EURUSD

18
US dollar no longer "risk off"…and that's perfectly normal
Source: UBS CIO WMR, Bloomberg, Federal Reserve, as of 24 April 2015
Action
-1.00
-0.75
-0.50
-0.25
0.00
0.25
0.50
0.75
1.00
80 83 86 89 92 95 98 01 04 07 10 13
Dollar (Major) & MSCI World Dollar (Broad) & MSCI ACWI
Correlation: USD vs. equities

19
Mini-surge in returns to illiquidity since end of QE3
Source: UBS CIO WMR, Bloomberg, Credit Suisse, as of 30 April 2015
Action
-15%
-10%
-5%
0%
5%
10%
15%
2004* 2005 2006 2007 2008 2009 2010 2011 2012 2013 2014 2015YTD
Credit Suisse Illiquidty Premium
20
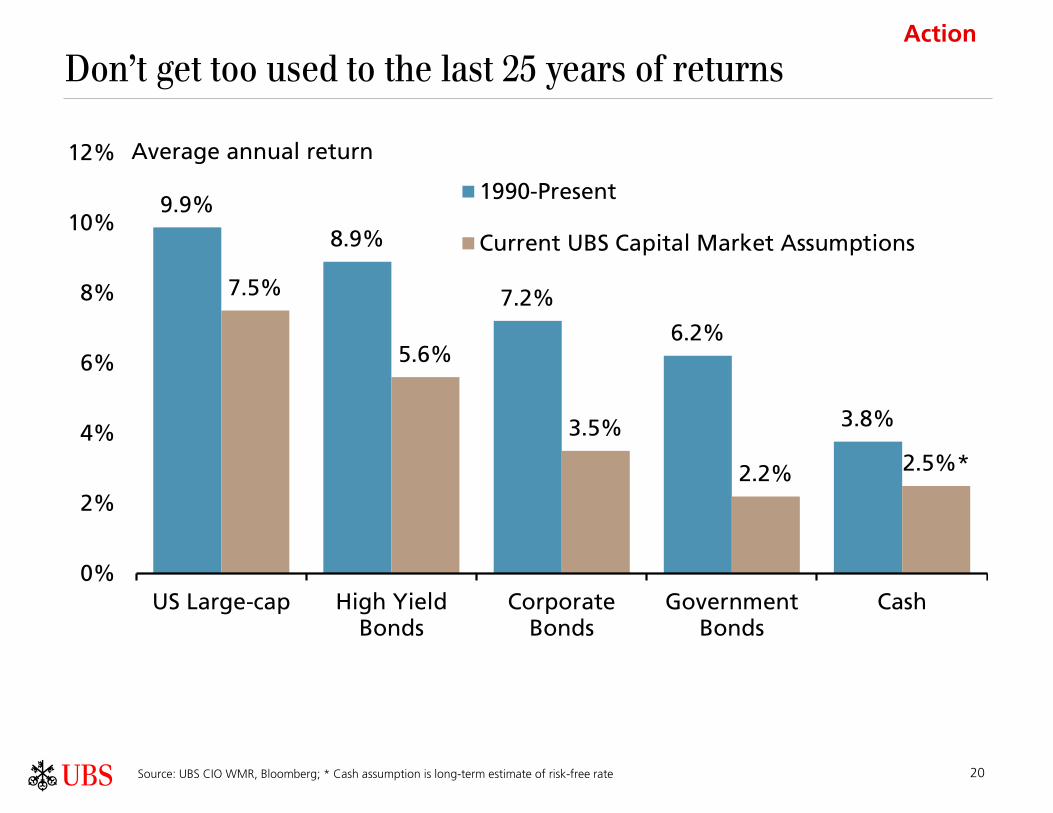
Don’t get too used to the last 25 years of returns
Source: UBS CIO WMR, Bloomberg; * Cash assumption is long-term estimate of risk-free rate
Action
9.9%
8.9%
7.2%
6.2%
3.8%
7.5%
5.6%
3.5%
2.2% 2.5%*
0%
2%
4%
6%
8%
10%
12%
US Large-cap High YieldBonds
CorporateBonds
GovernmentBonds
Cash
1990-Present
Current UBS Capital Market Assumptions
Average annual return

21
Important Information It is important that you understand the ways in which we conduct business and the applicable laws and regulations that govern us. As a firm providing wealth management services to clients, we are registered with the U.S. Securities and Exchange Commission (SEC) as an investment adviser and a broker-dealer, offering both investment advisory and brokerage services. Though there are similarities among these services, the investment advisory programs and brokerage accounts which we offer are separate and distinct, differ in material ways and are governed by different laws and separate contracts.
It is important that you carefully read the agreements and disclosures that we provide to you about the products or services we offer. While we strive to ensure the nature of our services is clear in the materials we publish, if at any time you seek clarification on the nature of your accounts or the services you receive, please speak with your Private Wealth Advisor. For more information, please visit our website at www.ubs.com/workingwithus.
UBS Wealth Management Research
Two sources of research are available to clients of UBS Financial Services Inc. Reports from the first source, UBS Wealth Management Research, are designed primarily for use by individual investors and are produced by UBS Wealth Management Americas (the UBS business group that includes, among others, UBS Financial Services Inc.) and UBS Wealth Management & Swiss Bank. The second source is UBS Investment Research, and its reports are produced by UBS Investment Bank, whose primary business focus is institutional investors. The two sources may have different opinions and recommendations. The various research content provided does not take into account the unique investment objectives, financial situation or particular needs of any specific individual investor. If you have any questions, please consult your Private Wealth Advisor. UBS Wealth Management Research is provided by UBS Financial Services Inc. and UBS AG. UBS Financial Services Inc. is a subsidiary of UBS AG.
Sources of strategic asset allocations and investor risk profiles
Strategic asset allocations represent the longer-term allocation of assets that is deemed suitable for a particular investor. The strategic asset allocation models discussed in this publication, and the capital market assumptions used for the strategic asset allocations, were developed and approved by the WMA AAC.
The strategic asset allocations are provided for illustrative purposes only and were designed by the WMA AAC for hypothetical US investors with a total return objective under five different Investor Risk Profiles ranging from conservative to aggressive. In general, strategic asset allocations will differ among investors according to their individual circumstances, risk tolerance, return objectives and time horizon. Therefore, the strategic asset allocations in this publication may not be suitable for all investors or investment goals and should not be used as the sole basis of any investment decision. Minimum net worth requirements may apply to allocations to non-traditional assets. As always, please consult your UBS Financial Advisor to see how these weightings should be applied or modified according to your individual profile and investment goals.
The process by which the strategic asset allocations were derived is described in detail in the publication entitled “UBS WMA’s Capital Markets Model: Explained, Part II: Methodology,” published on 22 January 2013. Your Financial Advisor can provide you with a copy.
Deviations from strategic allocation
The recommended tactical deviations from the strategic asset allocation are provided by the Global Investment Committee and the Investment Strategy Group within Wealth Management Research Americas. They reflect the short- to medium-term assessment of market opportunities and risks in the respective asset classes and market segments. Positive / zero / negative tactical deviations correspond to an overweight / neutral / underweight stance for each respective asset class and market segment relative to their strategic allocation. The current allocation is the sum of the strategic asset allocation and the tactical deviation.
Note that the regional allocations on the International Equities page are provided on an unhedged basis (i.e., it is assumed that investors carry the underlying currency risk of such investments). Thus, the deviations from the strategic asset allocation reflect the views of the underlying equity and bond markets in combination with the assessment of the associated currencies. The two bar charts (“Equity regions” and “Bond regions”) represent the relative attractiveness of countries (including the currency outlook) within a pure equity and pure fixed income portfolio, respectively. In contrast, the detailed asset allocation tables integrate the country preferences within each asset class with the asset class preferences stated earlier in the report.

22
Appendix Chief Investment Office (CIO) Wealth Management Research is published by Wealth Management & Swiss Bank and Wealth Management Americas, Business Divisions of UBS AG (UBS) or an affiliate thereof. In certain countries UBS AG is referred to as UBS SA. This publication is for your information only and is not intended as an offer, or a solicitation of an offer, to buy or sell any investment or other specific product. The analysis contained herein does not constitute a personal recommendation or take into account the particular investment objectives, investment strategies, financial situation and needs of any specific recipient. It is based on numerous assumptions. Different assumptions could result in materially different results. We recommend that you obtain financial and/or tax advice as to the implications (including tax) of investing in the manner described or in any of the products mentioned herein. Certain services and products are subject to legal restrictions and cannot be offered worldwide on an unrestricted basis and/ or may not be eligible for sale to all investors. All information and opinions expressed in this document were obtained from sources believed to be reliable and in good faith, but no representation or warranty, express or implied, is made as to its accuracy or completeness (other than disclosures relating to UBS and its affiliates). All information and opinions as well as any prices indicated are currently only as of the date of this report, and are subject to change without notice. Opinions expressed herein may differ or be contrary to those expressed by other business areas or divisions of UBS as a result of using different assumptions and/or criteria. At any time, investment decisions (including whether to buy or hold securities) made by UBS AG, its subsidiaries and employees thereof, may differ from or be contrary to the opinions expressed in UBS research publications. Some investments may not be readily realizable since the market in the securities is illiquid and therefore valuing the investment and identifying the risk to which you are exposed may be difficult to quantify. UBS relies on information barriers to control the flow of information contained in one or more areas within UBS, into other areas, units, divisions or affiliates of UBS. Futures and options trading is considered risky. Past performance of an investment is no guarantee for its future performance. Some investments may be subject to sudden and large falls in value and on realization you may receive back less than you invested or may be required to pay more. Changes in FX rates may have an adverse effect on the price, value or income of an investment. This report is for distribution only under such circumstances as may be permitted by applicable law.
Distributed to US persons by UBS Financial Services Inc., a subsidiary of UBS AG. UBS Securities LLC is a subsidiary of UBS AG and an affiliate of UBS Financial Services Inc. UBS Financial Services Inc. accepts responsibility for the content of a report prepared by a non-US affiliate when it distributes reports to US persons. All transactions by a US person in the securities mentioned in this report should be effected through a US-registered broker dealer affiliated with UBS, and not through a non-US affiliate. The contents of this report have not been and will not be approved by any securities or investment authority in the United States or elsewhere.
UBS specifically prohibits the redistribution or reproduction of this material in whole or in part without the prior written permission of UBS and UBS accepts no liability whatsoever for the actions of third parties in this respect.
Version as per September 2013.
UBS specifically prohibits the redistribution or reproduction of this material in whole or in part without the prior written permission of UBS and UBS accepts no liability whatsoever for the actions of third parties in this respect. © 2013. The key symbol and UBS are among the registered and unregistered trademarks of UBS. All rights reserved