u. s. department of the interior u.s. geological … · figure 5. close-up view of topography in...
TRANSCRIPT

U. S. DEPARTMENT OF THE INTERIOR
U.S. GEOLOGICAL SURVEY
Geology, Hydrology and Mechanics of the Alani-Paty Landslide, Manoa Valley, Oahu, Hawaii
by
Rex L. Baum 1 and Mark E. Reid2
Open-File Report 92-501
Prepared in Cooperation withthe City and County of Honolulu,
Department of Public Works
This report is preliminary and has not been reviewed for conformity with U.S. Geological Survey editorial standards and stratigraphic nomenclature. Any use of trade names is for descriptive purposes only and does not imply endorsement by the U.S. Geological Survey.
iDenver.CO 2Honolulu, HI
1992

ABSTRACT........................................................................................................................1
INTRODUCTION.................................................................................................................3
PREVIOUS WORK.............................................................................................................3
PHYSICAL DESCRIPTION OF THE ALANI-PATY LANDSLIDE..............................................5
GEOLOGIC SETTING OF THE ALANI-PATY LANDSLIDE......................................................10
GEOTECHNICAL PROPERTIES...........................................................................................22
Mechanical Properties................................................................................................22
Hydraulic Properties...................................................................................................32
HYDROLOGY OF THE LANDSLIDE.....................................................................................36
Rainfall and Landslide Movement.................................................................................36
Ground Water...........................................................................................................41
Occurrence of Ground Water............................................................................ 41
Debris-Apron Deposits.......................................................................41
Bedrock...........................................................................................44
Movement of Ground Water............................................................................55
Average Recharge of Ground Water...................................................................61
Hydrologic Response During Rainstorms.......................................................................61
Surface Runoff..............................................................................................65
Infiltration...................................................................................................65
Ground-Water Response..................................................................................69
Analysis......................................................................................................71
MECHANICS OF THE LANDSLIDE......................................................................................77
DIFFERENCES BETWEEN THE ALANI-PATY LANDSLIDE AND NEIGHBORING GROUND .....82
DISCUSSION AND CONCLUSIONS.....................................................................................^
Observations Relevant to Remediation of the Alani-Paty Landslide.....................................82
Comparison of Findings with Previous Studies...............................................................83
ACKNOWLEDGMENTS.......................................................................................................84
REFERENCES CITED..........................................................................................................84
TABLESTable 1. Mineralogy of the clay (<2-\i) fraction of samples from the Alani-Paty landslide..................23Table 2. Residual shear strength parameters and Atterberg limits of material from the Alani-Paty
landslide..................................................................................................................26Table 3. Estimated volume percentages of cobble- and boulder-sized clasts in material from the
Alani-Paty landslide................................____ _................................................28Table4. Texture of material from the Alani-Paty landslide...................!........................!.......!.!. ...28Table 5. Rainy periods, movement, and pressure heads recorded between September 26,1989, and
April 30, 1991, at the Alani-Paty landslide.....................................................................38Table 6. Water pressure head response in piezometers from installation until April 29,1991 ..............45Table?. Hydraulic gradients between piezometer tips on selected days............................................56Table 8. Estimated vertical and downslope ground-water discharge from the Alani-Paty landslide..........57

Table 9. Layers used to estimate equivalent saturated hydraulic conductivities...................................57Table 10. Mean annual rainfall and periods of record for rain gages near the Alani-Paty landslide..........62Table 11. Amount of rainfall required to saturate a seven foot thickness of landslide material..............72
FIGURESFigure 1. Map showing locations of the landslides in Manoa Valley, Oahu, Hawaii..........................4Figure 2. Cross sections through the Alani-Paty landslide............................................................7Figure 3. Map showing thickness of material between the basal slip surface and the top of bedrock
beneath part of the Alani-Paty landslide.........................................................................11Figure 4. Topographic setting of the Alani-Paty and Hulu-Woolsey landslides in Manoa Valley.......... 12Figure 5. Close-up view of topography in the immediate vicinity of the landslides........................... 13Figure 6. Cross section D-D' through the northwest side of Waahila Ridge, the debris-apron
deposits, and part of the valley floor..............................................................................15Figure 7. Sketches and photographs showing stratigraphic relations between silty and clayey units
in the debris-apron deposits.........................................................................................16Figure 8. Graph showing particle-size analysis of samples from the Alani-Paty landslide...................24Figure 9. Plasticity chart for materials from the Alani-Paty landslide..............................................25Figure 10. Graph showing relationship between liquid limit and residual shear strength of samples
from the Alani-Paty landslide.......................................................................................27Figure 11. Graph showing ratio of natural moisture content to plastic limit of samples from the
Alani-Paty landslide, plotted against depth......................................................................30Figure 12. Graph showing blow counts from borings in the landslide versus depth ...........................31Figure 13. Graph showing saturated hydraulic conductivity determined at different depths in and
near the Alani-Paty landslide........................................................................................33Figure 14. Graphs showing range of saturated hydraulic conductivities for different materials..............34Figure 15. Graph of moisture characteristics for unsaturated, near-surface soils at 3102 Alani
Drive......................................................................................................................35Figure 16. Graph of cumulative downslope displacement at the head scarp and daily rainfall from
September 26,1989 to April 30,1991..........................................................................37Figure 17. Graph of previous 10 day average rainfall at 3102 Alani Drive.......................................39Figure 18. Graph of monthly rainfall at Manoa Beaumont rain gage from January 1987 through
April 1991...............................................................................................................40Figure 19. Schematic cross section through the Alani-Paty landslide showing possible pathways
of water entering and leaving the landslide materials.........................................................42Figure 20. Cross section through the Alani-Paty landslide showing generalized ground-water flow
directions and approximate limits of the saturated materials within the slide..........................43Figure 21. Map showing the distribution and response patterns of piezometers with tips less than
a depth of 29 feet.......................................................................................................48Figure 22. Graph showing response of selected open-tube piezometers within the landslide that
show increased water levels during and following rainfall..................................................49Figure 23. Graph showing response of pressure-transducer piezometers within the upslope one-
quarter of the landslide that show increased pressure during rainfall......................................50Figure 24. Graph showing response of selected open-tube piezometers with relatively steady water
levels in the downslope three-quarters of the landslide.......................................................51Figure 25. Graph showing response of selected open-tube piezometers outside but near the head of
the landslide.............................................................................................................52Figure 26. Map showing the distribution and response patterns of piezometers with tips at depths
between 30 and 60 feet...............................................................................................53Figure 27. Graph showing response of open-tube piezometers in bedrock upslope of the landslide........54Figure 28. Cross section A-A" through the head of the Alani-Paty landslide near Paty extension,
showing piezometer responses.....................................................................................59Figure 29. Graph showing response of shallow pressure-transducer piezometers during March
1991 rainstorms........................................................................................................60Figure 30. Graph of average annual water budget for a medium-density urban area on Oahu,
receiving about 79 inches of rainfall per year..................................................................63Figure 31. Schematic diagram showing the rainfall infiltration process during extended rainy
periods....................................................................................................................64
in
Figure 32. Map showing approximate locations of drainage basin boundaries, intermittent surfaceflow paths, and diversion structures upslope of the Alani-Paty landslide...............................66
Figure 33. Cross section E-E1 through part of 3102 Alani Drive showing hydraulic headdistribution..............................................................................................................67
Figure 34. Graphs showing rainfall, pressure head, and hydraulic head measured at tensiometernestTl during the March 1991 rainstorms.....................................................................68
Figure 35. Graph showing response of shallow pressure-transducer piezometers within the Alani- Paty landslide during November 1990 rainstorms.............................................................70
Figure 36. Graph showing simulated time for a wetting front to infiltrate 7 feet vertically throughhomogeneous materials..............................................................................................73
Figure 37. Graph showing simulated and observed pressure attenuation with depth............................75Figure 38. Graph showing simulated and observed time lag in pressure response at depth from
signal at ground surface..............................................................................................76Figure 39. Graphs showing measured depth of the basal slip surface and estimated water pressures
at the slip surface in section A-A'.................................................................................78Figure 40. Graphs showing effective normal stress and shearing resistance at the basal slip surface
for wet-and dry-period ground-water conditions...............................................................80
PLATES (in Pocket)Plate 1. Map showing locations of borings in the landslide complex in Manoa valley, Honolulu,
Hawaii. Plate 2. Map showing kinematic elements of the Alani-Paty and Hulu Woolsey landslides in
Manoa valley, Honolulu, Hawaii. Plate 3. Map showing displacement of points in the landslide complex in Manoa valley,
Honolulu, Hawaii. Plate 4. Map showing elevation of the basal slip surface of the Alani-Paty landslide in Manoa
valley, Honolulu, Hawaii. Plate 5. Map showing elevation of the top of bedrock beneath parts of the landslide complex in
Manoa valley, Honolulu, Hawaii. Plate 6. Geomorphic map of part of Manoa Valley and Waahila Ridge, Honolulu, Hawaii.
IV
ABSTRACT
Geometry of the landslide ~ The Alani-Paty landslide occupies about 8.3 acres of a sloping residential area on the southeast side of Manoa Valley, Honolulu, Hawaii. The head of the landslide has two cusps that roughly coincide with drainage channels eroded into the Koolau Basalt bedrock on the side of Waahila Ridge, upslope from the landslide. A shear zone running downslope between the cusps subdivides the landslide into two elements that move somewhat independently of each other. One, called the Alani element, is centered near the intersection of Alani Drive and Paty Drive. The other, called the Kahaloa element, is bounded roughly by Paty extension, Kahaloa Drive, Kalawao extension, and the intersection of Woolsey Place and Lanikaula Street. The Alani element is about 500 ft long and 200 ft wide. Its head is at an elevation of about 370 ft and its toe is at an elevation of 260 ft; the average slope angle is 12°. The Kahaloa element is about 900 ft long and 350 ft wide. Its head is at an elevation of about 330 ft and its toe is at an elevation of 180 ft; the average slope angle is 9°. Overall, the Alani-Paty landslide has an average thickness of 25 ft and a volume of about 330,000 yd3 . The basal slip surface is from 0 to 15 ft deep near all the margins, from 20 to 25 ft deep near the head (upslope from Alani Drive and Kahaloa Place), and from 25 to perhaps 33 ft deep in the main body of the landslide.
Movement of the landslide -- During the period of observation, from September 26,1989 to April 30, 1991, the landslide moved only during a few rainy periods when pore-water pressures increased in the upslope quarter of the landslide. Movement at the head scarp of the landslide was observed following periods of intense rainfall. Movement of the main body of the landslide occurred only during extended periods of rainfall in January 1990 and March 1991. The landslide moved about 1-2 inches in January 1990 and about 0.5 inch in March 1991.
Physical properties of materials ~ The Alani-Paty landslide formed in debris-apron deposits consisting of boulder-, cobble-, and gravel-sized clasts of basalt suspended in a matrix of interstratified clayey silt and silty clay. Clasts occupy about half the volume of the landslide material. The matrix is much sandier in the upslope half of the landslide than in the downslope half.
The basal slip surface of the landslide apparently is in layers of weak, highly plastic, silty clay. Core samples of highly plastic clay, some with slickensides, were recovered from about the same depth as the basal slip surface in several borings. Samples from the vicinity of the slip surface had residual shear strength parameters (for effective stress) in the following ranges: cohesion from 40 to 139 lbf/ft2 and angle of friction from 6° to 10.9°.
Materials near the basal slip surface have lower hydraulic conductivity than materials above or below, indicating that materials near the basal slip surface can perch ground water. Measured hydraulic conductivities of the soils near the ground surface have a geometric mean of 1.3 X 10" 1 fl/d (feet per day). Between a depth of 8 and 20 ft beneath the ground surface, the geometric mean of the conductivities is lower, about 4.8 X 10"^ fl/d. Between a depth of 20 and 30 ft (near the basal slip surface), the geometric mean is even lower, about 1.1 X 10"4 fl/d. Below 30 ft, the one piezometer tested showed a conductivity of 3.7 X 10"^ fl/d (about the same as materials between 8 and 20 ft). Many piezometers below 30 ft were dry or mostly dry during the observational period. Water added to open- tube piezometers as slug tests drained rapidly from the dry piezometers, indicating that the piezometers were functioning properly and that the tips were in unsaturated materials.
The landslide material has such low hydraulic conductivity and such a strong affinity for water that draining the landslide using wells could prove extremely difficult. The clay-rich landslide material is able to remain nearly saturated even at high soil tensions during prolonged dry periods. Efficient gravity drainage requires an average hydraulic conductivity greater than about 2 fl/d, which is at least 10 times greater than the maximum value and tens to thousands of times greater than the mean value of hydraulic conductivities measured in the landslide and estimated by water budget analysis. The near-surface materials, which have larger hydraulic conductivity than materials deeper than 8 ft and contain landslide fractures, may have conductivity approaching 2 ft/day. Although some natural drainage occurs, it is too slow to prevent destabilizing pore pressures from forming during some extended rainy periods.
Surface and subsurface water ~ The main body of the landslide is nearly water-saturated throughout the year. The pore pressure response in the landslide to rainfall was different depending on whether the measurement was taken in the head or in the main body of the landslide, or whether a particular storm followed a period of dry or wet
weather. The pressure head during dry periods ranges from 0 in some piezometers to about 16 ft in others. Pressure head in the upslope quarter of the landslide was as great as 24 ft in one piezometer during wet periods.
Pressure head in the upslope quarter of the landslide increased as much as 11 ft during rainy periods. If antecedent weather was dry, the initial pore-water response occurred from one to two days following the onset of rain. During rainy periods, after the full thickness of the landslide became saturated, peak pressures occurred several hours following intense rainfall. Piezometers in the downslope three-quarters of the landslide had minor responses to rainfall.
Few piezometer tips were at the basal slip surface, so we estimated the pressure head at the slip surface using pressure head measured at various depths in the landslide. Pressure head at the slip surface in the upslope quarter of the landslide ranged from about 5-10 ft at the head to about 20 ft beneath Kahaloa Place when the slide was moving. The pressure head was 5-10 ft lower everywhere in the upslope quarter during dry periods. Pressure head in the downslope three quarters of the landslide ranged from about 10 to 16 ft depending on location and did not vary significantly throughout the year.
Water enters the landslide primarily at the ground surface by the infiltration of rain falling directly on the landslide and from small amounts of surface runoff channeled onto the landslide. Analysis indicates that infiltration is adequate to saturate the landslide during rainy periods and that infiltration is consistent with the observed one- to two-day lag between the onset of rainfall and pore pressure response. Following the initial pore-pressure response, the upper few feet of the landslide remains tension saturated until intense rainfall creates positive pore pressure immediately below the ground surface. Analysis also indicates that the pore-pressure peaks observed a few hours following intense rainfall are consistent with the downward movement and attenuation of waves of positive pore pressure from the ground surface.
Water gradually drains from the landslide. The water flows downslope through the landslide along steeply inclined paths. Part of the water drains through the downslope boundary of the landslide, but most drains through the basal slip surface into unsaturated materials beneath the landslide. This natural drainage is responsible for the gradual decrease in pore pressures in the upslope quarter of the landslide during dry periods.
Several lines of evidence indicate that little, if any, water enters the landslide from bedrock. Only about 0.3 percent of the basal slip surface of the landslide appears to be in contact with bedrock, and only about 3 percent of the slip surface is closer to bedrock than to the ground surface. Hydraulic conductivity of the bedrock appears to be much higher than conductivity of the landslide materials, so that water that occasionally becomes perched in bedrock near the head of the landslide tends to flow downward through the bedrock rather than laterally into the landslide. Piezometers in and near the head of the landslide indicate that a saturated hydraulic connection does not exist between bedrock and the landslide. Hydraulic gradients in the landslide indicate that ground water flow is mainly downward towards bedrock, rather than upward away from bedrock, and that flow is downward even where the basal slip surface is near bedrock.
Water outside and under the landslide is concentrated in saturated zones separated by intervening unsaturated zones. The ground water in part of the landslide appears to be perched on materials having low hydraulic conductivity at about the same depth as the basal slip surface. Beneath the landslide, in a zone 30 to 60 ft below the ground surface, the materials are dominantly unsaturated or have pressure heads near zero. Saturated zones also occur beneath the head and toe of the landslide at depths from about 60 to at least 100 ft below the ground surface. These two deep saturated zones appear to be separated laterally by an unsaturated zone; two pore-pressure transducers, 59 and 85 ft deep (1-3 P4 and 1-3 P5), near mid length of the landslide always indicated pressure head near zero.
Mechanical Stability ~ The measured water pressures and strength of the landslide materials are consistent with failure on the observed basal slip surface of the landslide. Stability analysis using measured water pressures, measured depth of the slip surface, and strength parameters from laboratory tests confirmed that the data are internally consistent. Residual cohesion of about 128 lbf/ft2 and an angle of residual friction of 8° (or an angle of friction of about 11° with no cohesion) characterize the average shear strength of the slip surface for a cross section from the head near Paty extension to the toe near Kalawao Street. Fewer data are available for a cross section from the head at 3103 Paty Drive to the toe near 3078 Kahaloa Drive, but preliminary stability analysis indicates residual cohesion between 80 and 160 lbf/ft2 and an angle of residual friction of 12° (or an angle of friction between 14° and 16.5° with no cohesion) characterize the average shear strength of the slip surface for this section of the landslide.

INTRODUCTION
Slow-moving landslides have damaged residential areas on Oahu since the 1950s, when the Waiomao landslide destroyed several homes and damaged public roads and utilities in Palolo Valley. Since then, other landslides have destroyed homes and property in Manoa Valley, Wailupe Gulch, Kuliouou Valley, and other valleys on the leeward side of the Koolau Range of Oahu. Many of these landslides were moving during the late 1980s, and public awareness of landslides on Oahu has been high since the New Year's Eve storm and flood of December 31, 1987. Despite previous investigations of landslides on Oahu, significant questions remained about these landslides, including how they form, what materials they form in and how those materials are distributed, what causes them to move, and how future landslide problems can be avoided. Consequently in 1989, the U.S. Geological Survey, in cooperation with the Department of Public Works of the City and County of Honolulu, began detailed investigations of landslides and debris flows in the Honolulu District of Oahu.
The Alani-Paty landslide, in Manoa Valley (fig. 1), was chosen for detailed study as an example of a slow- moving landslide because it was known to be moving at the beginning of the investigation and it appeared to have many of the characteristics typical of known slow-moving landslides on Oahu. These characteristics include presence of the landslide in gently sloping, clay-rich deposits at the base of a valley wall and episodic movement related to rainfall. The landslide area includes parts of several streets in a hillside residential area that had been plagued by water-main breaks and ground movement since the 1970s. Maximum total movement was about 10 ft, but annual movement was episodic and ranged from a fraction of an inch to a few feet, apparently depending on the amount and intensity of rainfall.
This report describes our detailed investigations of the Alani-Paty landslide in Manoa Valley (fig. 1). We focus on the geometry of the landslide, physical properties of the landslide materials, and water in and on the landslide. The investigation involved detailed monitoring of landslide movement, precipitation, and ground water; study of the distribution and properties of materials in the landslides; and analysis of ground-water flow and mechanics of the landslide.
Study of the landslides was approached primarily by field methods, supplemented by laboratory and analytical methods. At the beginning of the study Baum and others (1989) mapped the Alani-Paty and Hulu- Woolsey landslides to determine their size, shape, and pattern of internal strain. Subsequently, borings were made for collecting samples and installing instruments (plate 1, also Baum and others, 1990). Selected samples were tested by laboratories of the U.S. Geological Survey for determination of physical properties (Baum and others, 1990,1991). We monitored instrumentation for approximately two years to measure rainfall, movement of the landslide, and subsurface water pressures and to determine the depth of the basal slip surface. We supplemented our own data with data from bore-hole instrumentation of Geolabs-Hawaii and STV/Lyon Associates (plate 1).
In this report, we briefly summarize findings from previous investigations of slow-moving landslides on Oahu and then describe the geometric and structural features of the Alani-Paty landslide. Next, we describe the geomorphology, topography and geology at the site of the landslide. We then describe and analyze the hydrology and mechanics of the Alani-Paty landslide. Finally, we summarize the measurements and field observations relevant to remediation of the landslides and compare our findings with those of previous studies.
PREVIOUS WORK
Previous studies indicate that the slow-moving landslides form in a weak, heterogeneous material consisting of highly plastic silty clay and clayey silt containing boulder-, cobble-, and gravel-sized clasts of weathered basalt (Peck and Wilson, 1968, p.2; Walter Lum Associates, 1979; Geolabs-Hawaii, 1984,1985,1989). Data from these studies indicate that the basal slip surface might be much weaker than material within the landslide. Residual strength parameters of materials from the Waiomao landslide were determined by laboratory tests and corroborated by stability analysis. The angle of residual friction, determined by direct-shear tests, ranged from 7.5° to 11°, with residual cohesion of approximately 250 lbf/ft2 (Walter Lum Associates, 1979). Stability analysis using observed water levels, observed depth of the basal slip surface, an assumed friction angle of 11°, and cohesion of 240 lbf/ft2 yielded a factor of safety of 1 (Walter Lum Associates, 1979). Drained direct shear tests of relatively undisturbed samples from the landslide complex in Manoa Valley indicated that the debris-apron deposits and landslide material (above the slip surface) can have moderate to high peak strength, with cohesion ranging from 0 to 800 lbf/ft2 and the friction angle ranging from 12° to 38° (Geolabs-Hawaii, 1984,1985).

00'
o 30'
Hulu-Woolsey landslide
Figure 1. Locations of the Alani-Paty and Hulu-Woolsey landslides in Manoa Valley, Oahu, Hawaii.

Previous investigations of slow-moving landslides in Palolo Valley and Aina Haina (Wailupe Gulch) established relationships between movement and rainfall. Peck (1959, p. 6-7; 1967, p. 414) found strong correlation between the rate of movement of the Waiomao landslide and rainfall during the previous ten days in Palolo Valley. Peck observed that the Hind luka landslide in Aina Haina and the Waiomao landslide, while in their early stages of development, accelerated dramatically following intense rainfall (Peck, 1959; Peck and Wilson, 1968, p. 5).
Peck (1968) also determined that the Waiomao landslide had relatively low average permeability. Tests conducted during drilling indicated that the hydraulic conductivity of the landslide material ranged from approximately 10"2 to 10"6 ft/min (or less). Only a few areas of free-draining material were found; less than 5 percent of the tests indicated a hydraulic conductivity as great as 10'3 ft/min. Most of the material was slow-draining; two thirds of the tests indicated the hydraulic conductivity was less than 10~4 ft/min (Peck, 1968, p. III-5).
The low permeability of the Waiomao landslide combined with movement observations indicated that surface drainage was a more efficient means of arresting movement of the landslide than subsurface drainage. By studying the average rate of movement over a several-year period, Peck (1968) concluded that surficial drainage to prevent upslope runoff from entering the landslide had reduced the rate of movement from about 3.8 ft/yr to about 1.0 ft/yr. He suggested that additional surficial drainage to prevent infiltration of rain falling directly on the landslide might succeed in arresting movement of the landslide without the benefit of subsurface drainage. The rate of movement was reduced from about 1.0 ft/yr to 0.1-0.2 ft/yr following improvement of surficial drainage. Later, the movement accelerated to about 0.5 ft/yr following improvements to roads crossing the landslide, removal of part of the toe of the landslide and a period of heavy rain (Walter Lum Associates, 1979). Thus, despite these complicating factors, carefully designed surface drainage significantly reduced movement of the Waiomao landslide.
The several previous investigations of landslides on Oahu point out that heavy rainfall and the low strength and low hydraulic conductivity of hillside materials contribute to instability of slopes in the leeward valleys of the Koolau Range on Oahu. The present investigation was intended to determine how the landslides form, to identify the sources and understand the movement of hillside water, and to understand the processes that trigger movement of the landslides.
PHYSICAL DESCRIPTION OF THE ALANI-PATY LANDSLIDE
The landslide complex in the Woodlawn area of Manoa Valley consists of several landslides, including the Hulu-Woolsey landslide, the Woolsey Place landslide and the Alani-Paty landslide (Baum and others, 1989). The Woolsey Place landslide and the Hulu-Woolsey landslide are physically connected (plate 2).
The Alani-Paty landslide is the northeastern most landslide in the complex (plate 2). The head of the landslide is scalloped or cuspate in shape. The uppermost parts of the cusps (near the intersection of Alani Drive and Paty Drive and upslope from Kahaloa Place) coincide with the axes of drainage channels that extend up the steep slopes above the landslide.
The main body of the Alani-Paty landslide has an area of about 8.3 acres; it averages 25 ft thick and its volume is about 330,000 yd3 . Elevation of the head near the Alani-Paty curve is about 370 ft; elevation of the head near Paty extension is about 330 ft. The toe is at an elevation of about 175-180 ft. The length is about 1000 ft and the maximum width is about 550 ft. Overall the slope angle is about 11°; the slope is significantly steeper in the upslope part, and so the ground surface profile is concave upward. There are about 60 lots affected by the main body of the landslide.
The northeast flank of the landslide steps to the southwest using a toe that extends from 3092 Kahaloa Drive to 3077 Lanikaula Street. Width of the landslide is decreased by this step from about 550 ft upslope of the step to about 350 ft downslope of the step. Downslope from 3077 Lanikaula Street the northeast flank continues as a shear fracture to 3038 Lono Place. From there, a toe extends across several lots to near the intersection of Kalawao and Kaloaluiki Streets (plate 2). The southwest flank joins the toe at 3069 Kalawao Street.
A left-lateral shear zone that passes beneath homes at 3104,3110 and 3118 Kahaloa Drive divides the landslide into two kinematic elements. A kinematic element is a part of a landslide that moves at a different rate than and more or less independently of neighboring parts. The shear zone separates the Alani element, northeast of the shear, from the Kahaloa element to the southwest (plate 2). Left-lateral offset of 2.5 ft in a stone wall crossing
the shear zone between 3104 and 3110 Kahaloa Drive indicates that here the Alani element has moved farther downslope than the Kahaloa element. The average slope of the Alani element, from its head above Paty Drive to its toe at 3092 Kahaloa Drive, is 12°. The average slope of the Kahaloa element from its head at Paty extension to its toe at Kalawao Street is 9°.
Total displacement (including horizontal and vertical components) from 1969 to 1989, determined photogrammetrically, varies over the surface of the landslide (plate 3). Displacement of the Kahaloa element ranges from about 5 ft at the toe to 10 ft near Kahaloa Place. Displacement of the Alani element ranges from 11 ft at the intersection of Alani and Paty Drives to 14 ft near mid length of the element (plate 3). The pattern of displacement is consistent with the pattern of deformation determined by mapping damage to structures (Baum and others, 1989, plate 2); the downslope two thirds of the Kahaloa element is shortening and the upslope third is stretching. Similarly, the downslope part of the Alani element is shortening and the upslope part is stretching (Baum and others, 1989, fig. 5).
Damage to structures is greater at the edges of the landslide than within the boundaries, because the amount of displacement changes markedly across the boundaries but only gradually inside the boundaries (plate 3). Damage in the head of the landslide results from stretching and sagging (partial collapse of structures into voids left by stretching). Sagging is particularly common on the uphill side of the intersection of Alani and Paty Drives. Along the flanks of the landslide, structures are offset laterally, without much differential vertical movement. Lateral offset is about 4.7 ft near 3114 Paty Drive, 7.9 ft near 3031 Kahaloa Place, 4.9 ft near 3124 Lanikaula Street and 4.0 ft near 3037 Lono Place (Baum and others 1989,1991). At the ground surface these lateral offsets appear to be distributed across zones 1-20 ft wide.
Two areas of incipient movement are present on the northeast side of the Alani-Paty landslide (plate 2). One is next to the head of the landslide and extends an indefinite distance downslope from a scarp that crosses Paty Drive in front of 3119 Paty and extends part way behind the house at 3111 Paty. This scarp formed before January 1989 and constitutes the primary evidence for movement northeast of the head; no movement was detected by an inclinometer in boring 10 in front of 3120 Alani Drive between November 1989 and March 1991. The second area of incipient movement was actively deforming during the period of observation; it extends from the landslide toe at 3092 Kahaloa Drive to 3066 Kahaloa Drive and possibly farther downslope. Evidence for this movement includes distress to houses at 3080 and 3072 Kahaloa Drive, right-lateral offset in a driveway immediately downslope from 3066 Kahaloa Drive, and shearing at a depth of 26 ft in boring 15, on the corner at 3069 Kahaloa Drive (Baum and others, 1990). Deformation began at 3072 and 3080 Kahaloa Drive before January 1989. The right-lateral offset in the driveway occurred between February and April 1989 and boring 15 was sheared in January 1990.
The basal slip surface of the active Alani-Paty landslide was located by measuring the depths where piezometer tubes and inclinometer casing became deformed (Baum and others 1990, Appendix C; Geolabs/Hawaii, unpub. data; STV/Lyon Associates, unpub. data). Although shear surfaces deeper than the basal slip surface have been observed in large-diameter borings (William Cotton and Associates, unpub. data), inclinometer measurements in deep borings yielded no evidence that the Alani-Paty landslide has moved on any of these deeper surfaces (STV/Lyon Associates, unpub. data).
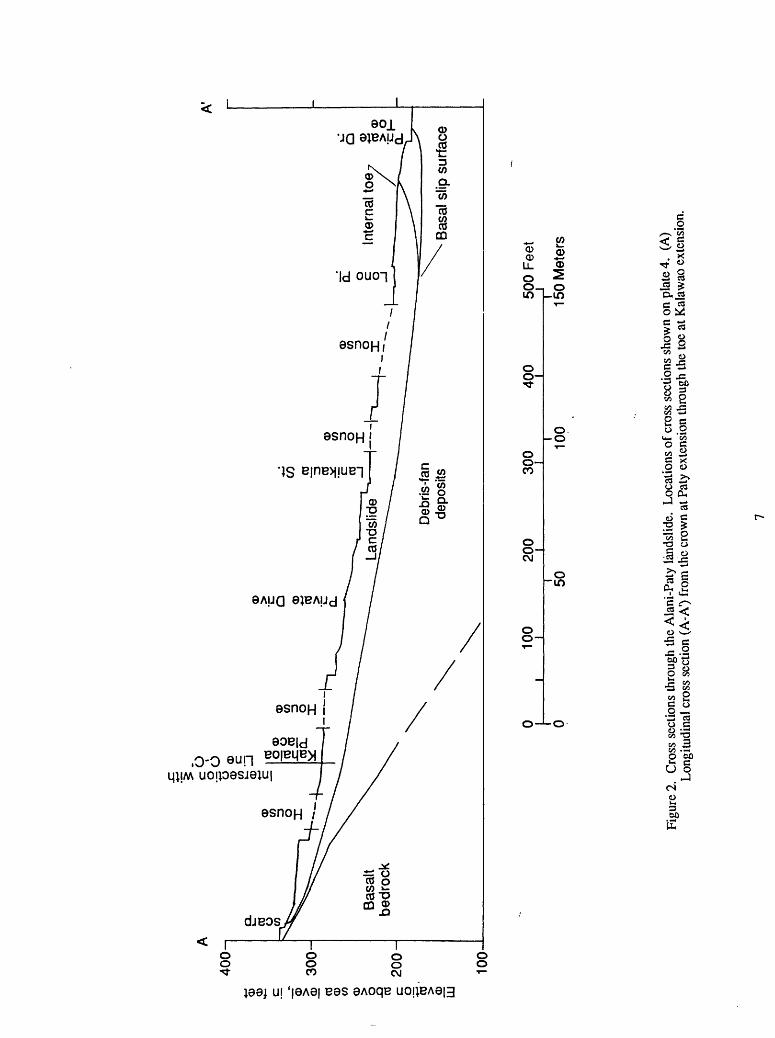
The basal slip surface is concave upward, subparallel to the ground surface, and shaped like two shallow troughs separated by a broad, low ridge (plate 4; figs. 2A, 2B, and 2C). The troughs correspond in position to the Alani and Kahaloa elements. Depth of the basal slip surface ranges from 20 to 25 ft in the head of the landslide, from 25 to perhaps 33 ft in the main body, from 10 to 20 ft near the toe, from 0 to 15 ft near all the margins; the depth averages 25 ft along section A-A' (fig. 2A). The slip surface slopes about 30° beneath the head of the Alani element, and 26° beneath the head of the Kahaloa element (figs. 2A, 2B). The slip surface flattens downslope from the head. The slope of the slip surface reverses beneath the toe, and is strongly concave upward near the toe of each element (plate 4, figs. 2A and 2B).
CD
CD CD Cd cu
</> CD >
o JO cd c
g I _0> ill
A'
40
0
30
0-
20
0-
100
100
200 i
30
04
00
500
Feet
0i 50
100
150
Met
ers
Figu
re 2
. C
ross
sec
tions
thro
ugh
the
Ala
ni-P
aty
land
slid
e. L
ocat
ions
of c
ross
sec
tions
sho
wn
on p
late
4.
(A)
Long
itudi
nal c
ross
sec
tion
(A-A
') fr
om th
e cr
own
at P
aly
exte
nsio
n th
roug
h th
e to
e at
Kal
awao
ext
ensi
on.

400
-1
CD
Q Q
jO)
OJ
Q
CO Q
O c
O LU
300-
J
20
0-
100
Ala
ni-P
aty
inte
rsec
tion
Gro
und
surf
ace
Deb
ris-fa
n de
posi
tsB
asal
t B
edro
ckB
asal
slip
sur
face
Bas
al s
lip s
urfa
ce
of i
ncip
ient
lan
dslid
e (o
bser
ved
in b
orin
g 15
)
0 0
100
200
300 i
400 i
5010
0
500
Fee
t i r
150
Met
ers
Figu
re 2
(co
ntin
ued)
. (B
) Lo
ngitu
dina
l cro
ss s
ectio
n (B
-B1)
from
the
crow
n ab
ove
Paty
Driv
e th
roug
h an
are
a of
in
cipi
ent m
ovem
ent (
dow
nslo
pe fr
om th
e to
e) a
t Kah
aloa
Driv
e.

Elevation above sea level, in feet
O
I
o¥3s-o
o. o
"d
I
-o o
en. oro o o
CO o o
CD- CD
ov o
<D 1><D
(J1 -OOTl <D <D
Intersection with Line B-B1
Kahaloa Drive
Intersection with Line A-A'

Limited evidence indicates that part of the movement observed at the ground surface has occurred on slip surfaces shallower than the basal slip surface. A boring cased for inclinometer measurements (B121, plate 1), in the front yard at 3110 Kahaloa Drive, was sheared first at about 25 ft and later at about 10 ft, indicating a shallow, 10-ft- deep, slip surface above the basal slip surface. We have not observed any surficial cracks or bumps that can be linked definitely to this shallow slip surface. This failure surface might be related to movement along the boundary between the Alani and Kahaloa kinematic elements and might not extend over a larger area. Other slip surfaces intersect the ground surface at well defined internal toes at 3092 Kahaloa Drive, along Lanikaula Street, and at 3073 Kalawao Street (Baum and others 1989, plate 1).
Only about 1200 ft2, or 0.3 percent, of the base of the landslide is in contact with the top of bedrock (fig. 3). Based on several data points obtained from drilling, the bedrock surface dips steeply beneath the landslide (plate 5; figs 2A, 2B). Consequently, the base of the landslide is closer to bedrock man to the ground surface only over an area of about 12,000 ft2 (approximately the area between the 20-ft contour line and the head scarp on fig. 3) or about 3 percent of the area of the landslide.
GEOLOGIC SETTING OF THE ALANI-PATY LANDSLIDE
Topography - The Alani-Paty landslide is on the southeast side of the elongate Manoa Valley, which has a relatively flat bottom and steep sides (fig. 4). The relatively flat valley bottom in the vicinity of the landslide consists of alluvial and lacustrine fill (fig. 5 and plate 6) deposited after basalt flows from the volcanic vent at Sugarloaf dammed the valley about 67,000 years ago (MacDonald and others, 1983, p. 304,447). The landslide has formed in a gently sloping debris apron that extends between the flat valley floor and the steep slope of exposed bedrock (fig. 5 and plate 6). The surface of exposed bedrock slopes approximately 40° and is incised by several small drainage channels, producing a scalloped effect to the bedrock-apron contact. Some of these incisions coincide approximately with scallop-shaped accumulations of weathered debris flow deposits in the heads of the Alani-Paty and Hulu-Woolsey landslides (plate 6). The surface of the debris apron slopes 8-12° on average. The debris apron has a concave-upward profile; near the valley floor it slopes 2-6°, whereas near its upslope edge, it slopes 10-15°.
Overall, the debris-apron deposit consists of several adjacent fan-shaped deposits with small, intervening hollows. A large fan, with irregular surface topography and poorly developed surface drainage, borders the Alani- Paty landslide to the northeast. This large fan leads from the mouth of a major drainage which has intercepted, by stream piracy, a pre-existing drainage with remnants on Waahila Ridge (Steve Ellen, written commun., 1992). The Alani-Paty and Hulu-Woolsey landslides each occupy a smaller fan or lobe within the debris apron and southwest of the large fan. One of the hollows coincides with the head of the Alani-Paty landslide at Paty Extension. STV/Lyon Associates (1990) interpreted this hollow to be part of a pre-existing landslide extending between Paty extension and Kalawao Street. The fan apices, hollows and lobes are visible on aerial photographs taken in 1941 and are still discernible, with difficulty, in the altered topography, which has been produced by residential construction (plate 1).
At least two interpretations for the origin of the topographic lobes and hollows are possible. One interpretation is that the hollows are the heads and the lobes are the toes of old landslides. According to this interpretation, the Alani-Paty and Hulu-Woolsey landslides are in part reactivations of old landslide deposits. An alternate interpretation is that the lobes and hollows are normal depositional features of adjacent debris fans. According to the alternate interpretation, the hollows have formed at sites of minimum deposition between neighboring fans, and the lobes represent the approximate downslope limit of deposition of the fans. In our opinion, the hollows and lobes are insufficient in themselves to identify the landslides as reactivations. If the features are landslide deposits, they should contain other evidence such as well-defined scarps and flank ridges (or levees, Zaruba and Mencl, 1982; Reming and Johnson, 1989). These features could not be seen on the 1941 aerial photographs or in the field during our mapping of the landslides.
10

North
o 100 200
i 50
300 Feet
100 Meters
EXPLANATION
15 Boring-Number indicates thickness, in feet
20 Line of constant thickness of material between the basal slip surface and the top of bedrock, interval 20 feet
Approximate boundary of the landslide
Figure 3. Thickness of material between the basal slip surface and the top of bedrock beneath part of the Alani-Paty landslide. Thickness was determined at the four borings indicated and by computing the difference in elevation between the basal slip surface (plate 4) and the bedrock surface (plate 5).
11

Hulu-Woolsey landslide
Alani-Paty landslide ,
Figure 4. Topographic setting of the Alani-Paty and Hulu-Woolsey landslides in Manoa Valley. Isometric diagram based on digital elevation model (10-m grid spacing) of the Honolulu, Hawaii 7-1/2 minute quadrangle, 1983, by the U.S. Geological Survey. Plotted by Steve Ellen and Donna Knifong. View east-southeast (S. 60° E.), no vertical exaggeration. The diagram shows only the main topographic features of the area. Locations and boundaries of the landslides are approximate. The landslides have formed in gently sloping ground at the base of a steep-sided ridge (Waahila Ridge) of Koolau Basalt on the southeast side of a wide, flat-bottomed valley (Manoa Valley).
12

56600
Figure 5. Close-up view of topography in the immediate vicinity of the landslides. Isometric diagram based ondigital elevation model (10-m grid spacing) of the Honolulu, Hawaii 7-1/2 minute quadrangle, 1983, by the U.S. Geological Survey. Plotted by Steve Ellen and Donna Knifong. View east-southeast (S. 60° E.), no vertical exaggeration. The diagram shows only the main topographic features of the area. Locations and boundaries of the landslides are approximate. Slightly elevated ground shown along lower right edge is underlain by Honolulu Volcanics, the flat valley bottom (near the words "Manoa Valley") is underlain by alluvium and lacustrine deposits and the landslides are in gently sloping debris-apron deposits (plate 6).
13

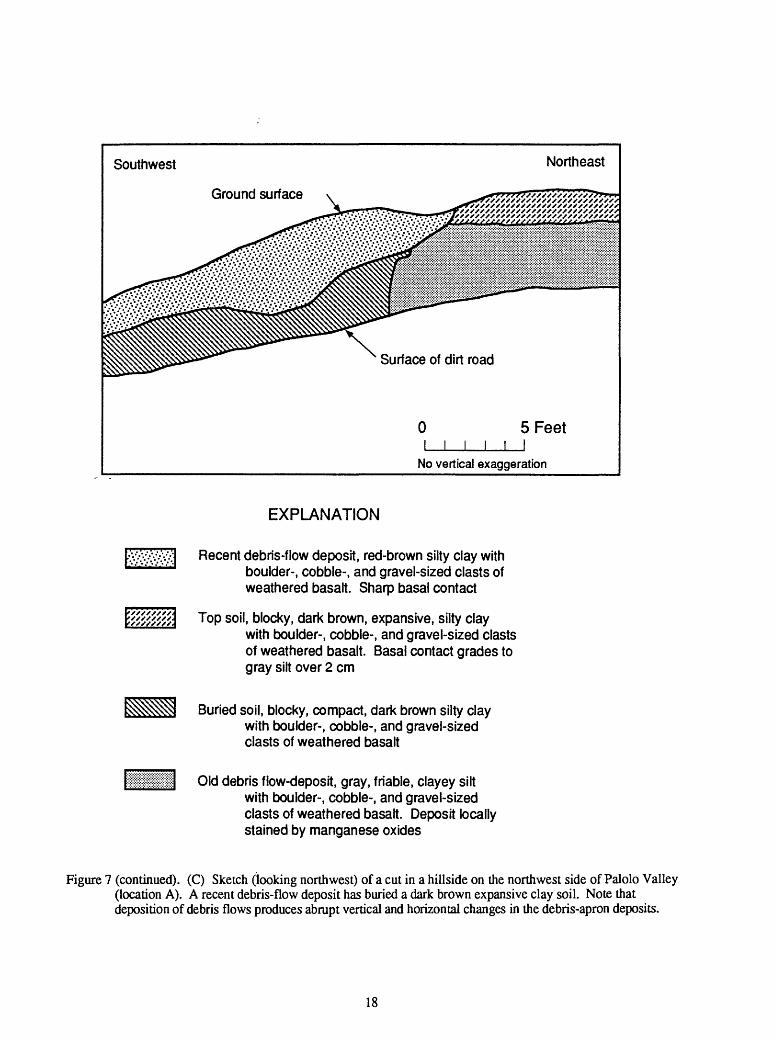
Origin of the debris-apron deposits -- The debris-apron deposits are largely derived locally from the Koolau Basalt bedrock forming Waahila Ridge; some of the deposits may include materials derived from pyroclastics of the Honolulu Volcanics mapped nearby by Stearns (1939). The bedrock consists of interbedded layers of aa and pahoehoe that dip about 8° toward the southwest (Langenheim and Clague, 1987). Weathered residuum, including clasts and soil, is transported downslope from the sides of Waahila Ridge to the fans by intermittent debris flows and rock falls, which through time have accumulated to form the debris apron (D.M. Peterson, unpub. data). The apron, wedge-shaped in cross section, overlaps the steeply sloping bedrock surface (fig 6).
Once deposited on the fans, the materials begin to weather and form vertisols. Vertisols are pedologic soils containing at least 30 percent clay, and characterized by the presence of deep, wide surface fractures during the dry season (Bates and Jackson, 1987, p.723). A vertisol exposed near the head of Kamiloiki Valley is typical of soils in parts of in Manoa Valley and other valleys on southeast Oahu. The soil is dark brown, clay rich, and highly expansive; it rests on its parent material, a friable gray clayey silt (figs. 7A, 7B). The vertisol appears homogeneous; the internal stratification typical of many other pedologic soils is absent. In most places, the basal contact is distinct; the transition from the dark-brown vertisol to the gray parent material occurs over a few inches (fig. 7B). Boulders and cobbles commonly extend across the contact.
The debris-apron deposits consist of crudely stratified clayey silt and silty clay containing boulder-, cobble-, and gravel-sized fragments of weathered basalt. Drilling and sampling indicate that the silty clays and clayey silts are distinct, interstratified units; distinct contacts between the two materials were observed in a few core samples. The crude stratification formed as successive debris-flow deposits buried vertisols that had formed in the upper parts of older debris-flow deposits. At an excavation in nearby Palolo Valley (fig. 7A), a recent debris-flow deposit that consists of friable reddish-brown clayey silt rests on a layer of compact dark-brown silty clay (fig. 7C). Dark brown expansive soil is at the ground surface next to the recent debris-flow deposit. Although no connection was visible in the cut (fig. 7C), the compact dark-brown silty clay probably was a continuation of the brown expansive soil, before it (the silty clay) was buried by the debris-flow deposit. The brown expansive soil rests on a layer of gray clayey silt that appears to be an older debris-flow deposit. Similar expansive soil overlying gray silt was also observed elsewhere (fig. 7B).
The stratification of the debris-apron deposits is complex and discontinuous, making it difficult to correlate layers even over short distances. The stratification is subparallel with the ground surface (fig 7D), and the units commonly range in thickness from 1 to 10 ft, or more. The units interfinger and have irregular shapes when viewed in cross-sections parallel with the contours (figs 7C, 7E and 7F), and they may be 10-200 ft wide. Many of the silty clay layers we observed, including some a few feet below the ground surface, had slickensided surfaces of various orientations.
The origin of slickensided shear surfaces at various depths in the deposits, including some deeper than the basal slip surface of the Alani-Paty landslide remains undetermined. Through-going shear surfaces, subparallel to the ground surface, are commonly associated with smaller, randomly oriented, shear surfaces that are several inches long and with shiny, randomly oriented, fissure surfaces that are commonly less than an inch long (William Cotton and Associates, unpub. data). The shear and fissure surfaces may be remnant features of the buried vertisols (Robert Fleming, oral commun., 1990) or remnant slip surfaces from past episodes of landsliding during the formation of the debris-apron deposits (William Cotton, oral commun., 1992).
The crude stratification of the debris-apron deposits contributes in several ways to the formation of translational landslides. Locally extensive layers of expansive, slickensided clay (buried vertisols) dipping roughly parallel to the slope of the ground surface provide weak zones in which failure can occur readily. Ground water moving down through the deposits may be impeded by the clay layers, causing perched water tables above the layers and increased pore pressures within the layers.
14

1000-
LU200- Basalt bedrock -- Dips away from view
Debris-fan deposits Alluvial
100 200 300
50
400 500 Feet
100 150 Meters
Figure 6. Cross section D-D' through the northwest side of Waahila Ridge, the debris-apron deposits, and part of the valley floor showing the Koolau Basalt bedrock and debris-apron deposits in relation to the Alani-Paty landslide. Line of section is shown on Plate 1.
15

157° 52'30"
21° 30'
157° 45'
0 2 MILES I i «i .'
3 KILOMETERS
Figure 7. Stratigraphic relations between silty and clayey units in the debris-apron deposits. (A) Locations (solid circles) of exposures depicted in photographs and sketches..
16

Figure 7 (continued). (B) Photograph (looking north) of a cut in Kamiloiki Valley (location C), hammer is 12 in. long. Dark brown, blocky, expansive silty clay soil overlies light gray clayey silt (parent material?). The contact is distinct, but transitional over several centimeters; clasts of weathered basalt straddle the contact.
17
No vertical exaggeration
EXPLANATION
Recent debris-flow deposit, red-brown silty clay with boulder-, cobble-, and gravel-sized clasts of weathered basalt. Sharp basal contact
Top soil, blocky, dark brown, expansive, silty claywith boulder-, cobble-, and gravel-sized clasts of weathered basalt. Basal contact grades to gray silt over 2 cm
Buried soil, blocky, compact, dark brown silty clay with boulder-, cobble-, and gravel-sized clasts of weathered basalt
Old debris flow-deposit, gray, friable, clayey silt with boulder-, cobble-, and gravel-sized clasts of weathered basalt. Deposit locally stained by manganese oxides
Figure 1 (continued). (C) Sketch (looking northwest) of a cut in a hillside on the northwest side of Palolo Valley (location A). A recent debris-flow deposit has buried a dark brown expansive clay soil. Note that deposition of debris flows produces abrupt vertical and horizontal changes in the debris-apron deposits.
18
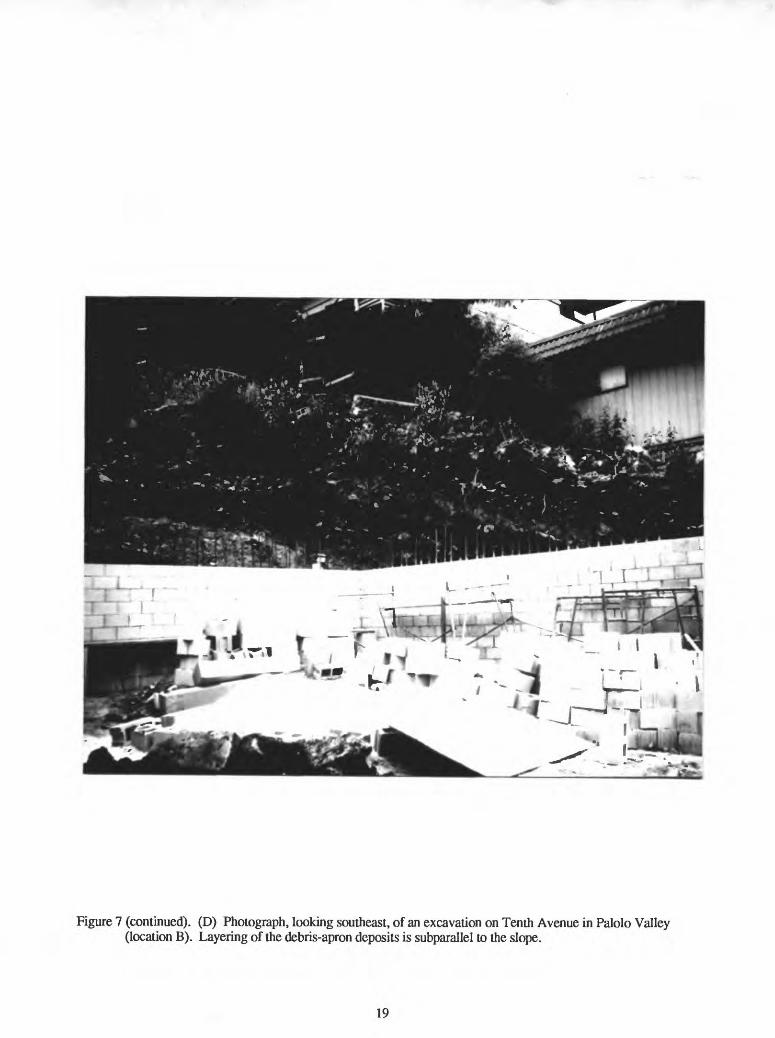
Figure 1 (continued). (D) Photograph, looking southeast, of an excavation on Tenth Avenue in Palolo Valley (location B). Layering of the debris-apron deposits is subparallel to the slope.
19

Southwest Northeast
Ground surface (graded)
Covered0 5 Feet
No vertical exaggeration
EXPLANATION
Light-gray, friable, clayey silt with boulder-, cobble-, and gravel-sized clasts of weathered basalt. Silt locally stained by manganese oxides
Blocky, compact, dark gray silty clay with boulder-,cobble-, and gravel-sized clasts of weathered basalt. Clay locally stained by manganese oxides
Yellow-gray silty clay with boulder-, cobble-, and gravel- sized clasts of weathered basalt
Cavity
Figure 7 (continued). (E) Sketch (looking northwest) of a cut in a hillside on the northwest side of Palolo Valley (location A). Clayey silts and silty clays are interstratified and have distinct, irregular contacts.
20

Southwest Northeast
0 5 FeetI .... I
No vertical exaggeration
EXPLANATION
Blocky, dark brown, expansive, sandy silty claywith boulder-, cobble-, and gravel-sized clasts of weathered basalt
Light-gray, friable, clayey silt with boulder-, cobble-, and gravel-sized clasts of weathered basalt
Blocky, compact, dark brown silty clay with boulder-, cobble-, and gravel-sized clasts of weathered basalt. Locally stained by manganese oxides. Slickensided shear surfaces common
Brown clayey silt with boulder-, cobble-, and gravel-sized clasts of weathered basalt. Locally stained by manganese deposits
Figure 7 (continued). (F) Sketch (looking northwest) of a cut in a hillside on the northwest side of Palolo Valley (location A). Clayey silts and silty clays are interstratified and interfingerred.
21
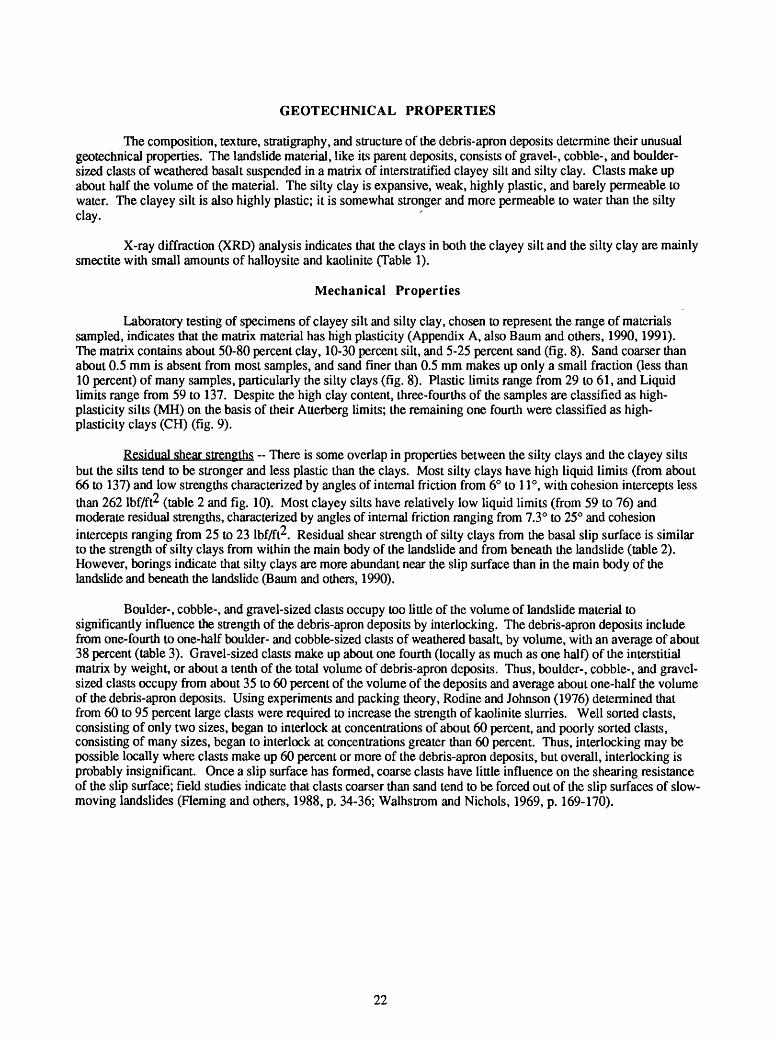
GEOTECHNICAL PROPERTIES
The composition, texture, stratigraphy, and structure of the debris-apron deposits determine their unusual geotechnical properties. The landslide material, like its parent deposits, consists of gravel-, cobble-, and boulder- sized clasts of weathered basalt suspended in a matrix of interstratified clayey silt and silty clay. Clasts make up about half the volume of the material. The silty clay is expansive, weak, highly plastic, and barely permeable to water. The clayey silt is also highly plastic; it is somewhat stronger and more permeable to water than the silty clay.
X-ray diffraction (XRD) analysis indicates that the clays in both the clayey silt and the silty clay are mainly smectite with small amounts of halloysite and kaolinite (Table 1).
Mechanical Properties
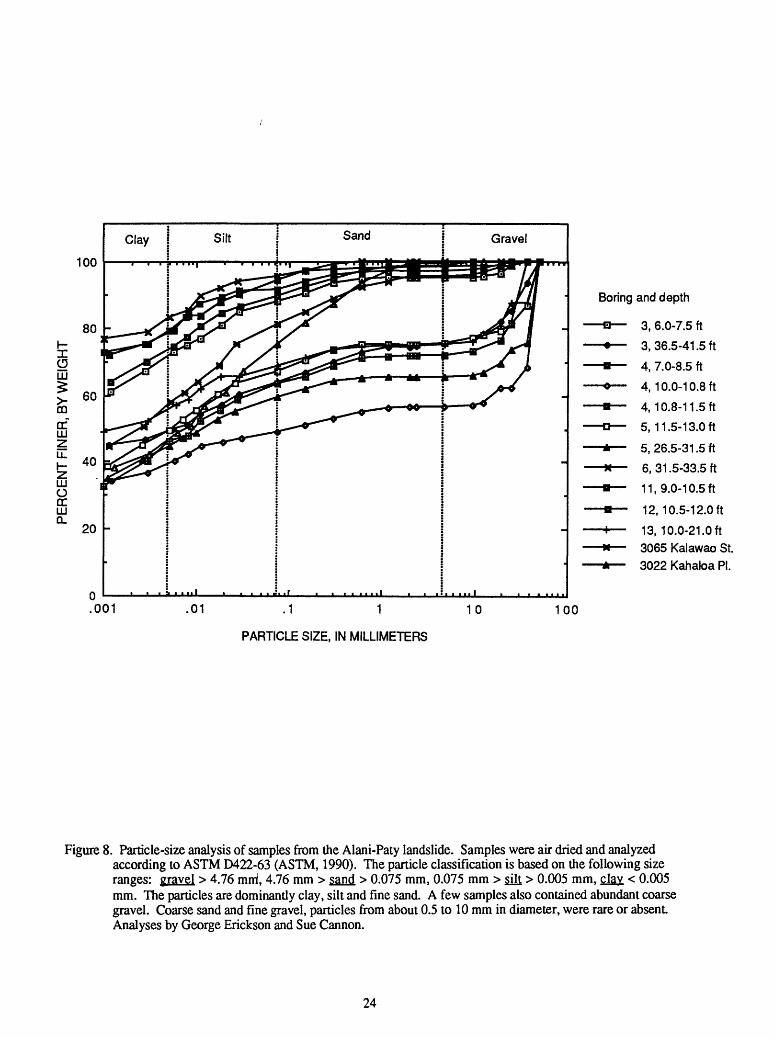
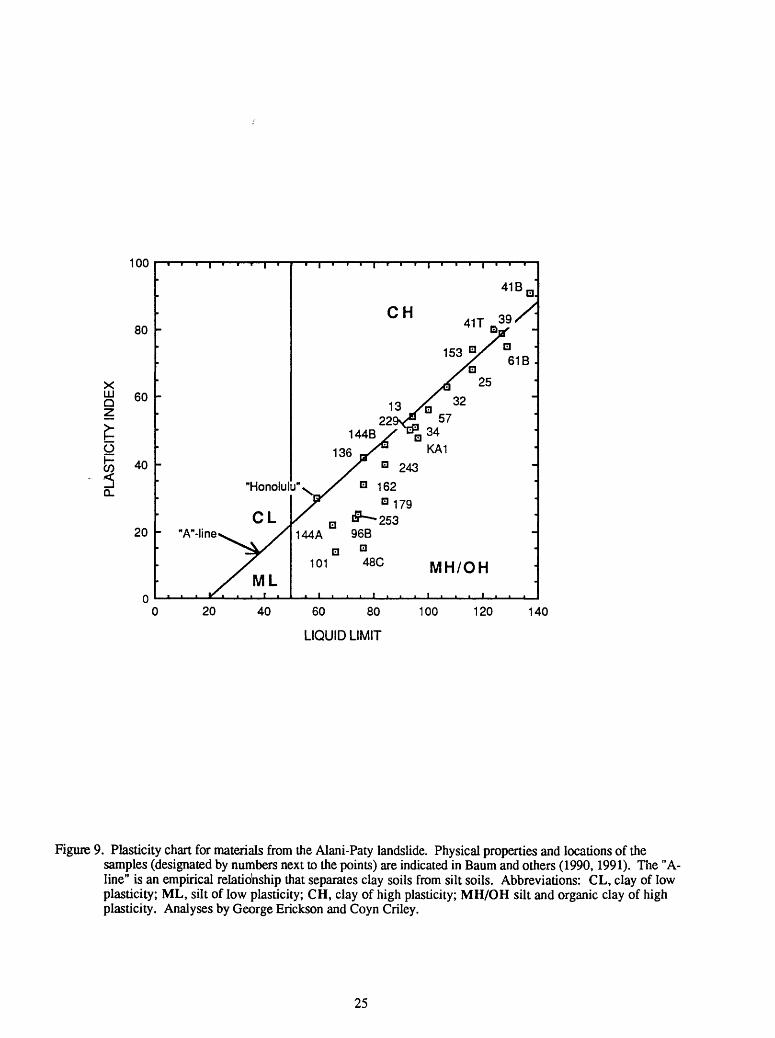
Laboratory testing of specimens of clayey silt and silty clay, chosen to represent the range of materials sampled, indicates that the matrix material has high plasticity (Appendix A, also Baum and others, 1990,1991). The matrix contains about 50-80 percent clay, 10-30 percent silt, and 5-25 percent sand (fig. 8). Sand coarser than about 0.5 mm is absent from most samples, and sand finer than 0.5 mm makes up only a small fraction (less than 10 percent) of many samples, particularly the silty clays (fig. 8). Plastic limits range from 29 to 61, and Liquid limits range from 59 to 137. Despite the high clay content, three-fourths of the samples are classified as high- plasticity silts (MH) on the basis of their Atterberg limits; the remaining one fourth were classified as high- plasticity clays (CH) (fig. 9).
Residual shear strengths ~ There is some overlap in properties between the silty clays and the clayey silts but the silts tend to be stronger and less plastic than the clays. Most silty clays have high liquid limits (from about 66 to 137) and low strengths characterized by angles of internal friction from 6° to 11°, with cohesion intercepts lessthan 262 lbf/ft^ (table 2 and fig. 10). Most clayey silts have relatively low liquid limits (from 59 to 76) and moderate residual strengths, characterized by angles of internal friction ranging from 7.3° to 25° and cohesion intercepts ranging from 25 to 23 Ibf/ft . Residual shear strength of silty clays from the basal slip surface is similar to the strength of silty clays from within the main body of the landslide and from beneath the landslide (table 2). However, borings indicate that silty clays are more abundant near the slip surface than in the main body of the landslide and beneath the landslide (Baum and others, 1990).
Boulder-, cobble-, and gravel-sized clasts occupy too little of the volume of landslide material to significantly influence the strength of the debris-apron deposits by interlocking. The debris-apron deposits include from one-fourth to one-half boulder- and cobble-sized clasts of weathered basalt, by volume, with an average of about 38 percent (table 3). Gravel-sized clasts make up about one fourth (locally as much as one half) of the interstitial matrix by weight, or about a tenth of the total volume of debris-apron deposits. Thus, boulder-, cobble-, and gravel- sized clasts occupy from about 35 to 60 percent of the volume of the deposits and average about one-half the volume of the debris-apron deposits. Using experiments and packing theory, Rodine and Johnson (1976) determined that from 60 to 95 percent large clasts were required to increase the strength of kaolinite slurries. Well sorted clasts, consisting of only two sizes, began to interlock at concentrations of about 60 percent, and poorly sorted clasts, consisting of many sizes, began to interlock at concentrations greater than 60 percent. Thus, interlocking may be possible locally where clasts make up 60 percent or more of the debris-apron deposits, but overall, interlocking is probably insignificant. Once a slip surface has formed, coarse clasts have little influence on the shearing resistance of the slip surface; field studies indicate that clasts coarser than sand tend to be forced out of the slip surfaces of slow- moving landslides (Fleming and others, 1988, p. 34-36; Walhstrom and Nichols, 1969, p. 169-170).
22

Table 1. Mineralogy of the clay (<2-|i) fraction of samples from the Alani-Paty landslide.
[X-ray powder diffraction analyses of samples KA-1 and 39 by Richard M. Pollastro, USGS, Denver, Colo.; all others by Mark Johnsson, USGS, Menlo Park, Calif. Interpretations by Pollastro based on glycol- and heat-treated samples. Percentages determined from heights and areas of peaks of basal reflections using method of Schultz (1964) and indicate relative abundance only. Interpretations by Johnsson based on foramide-treated samples. Relative peak area is proportional to clay mineral abundance but may not be linearly proportional. H/S = randomly interstratified halloysite/smectite]
Sample
KA-13 39 (gray) 39 (rust)
boring
4 4
depth (feet)
0 7.0-8.5 7.0-8.5
Smectite1 (percent)
50 62 50
Halloysite2 (percent)
5034 44
H/S (percent)
0 4 6
Sample
3261B101144A144B173175/176178179180181
boring
358
1111141414141414
depth Relative peak area of 00 1 reflection (feet) "Smectite"4 "Halloysite"5 "Kaolinite"6
26.5-28.626.5-31.526.0-28.529.6-30.229.0-29.6
5.5-7.09.0-12.015.0-16.019.5-21.524.0-25.529.0-31.0
8782878180776685868887
79876
1720
9775
684
12147
145859
Nearly pure, iron-rich smectite (nontronite)27-angstrom halloysite3Sample from under house at 3065 Kalawao St.4Nearly pure smectite, may contain some interstratified halloysite5Contains abundant interstratified smectite6Commonly contains abundant interstratified halloysite and perhaps some interstratified smectite
23
100
in
CD
CC LJJ
LJJ O CC LJJ Q.
Boring and depth
.01 .1 1
PARTICLE SIZE, IN MILLIMETERS
10 100
3, 6.0-7.5 ft
3. 36.5-41.5 ft
4. 7.0-8.5 ft
4, 10.0-10.8 ft
4. 10.8-11.5 ft
5. 11.5-13.0 ft
5. 26.5-31.5 ft
6. 31.5-33.5 ft
11. 9.0-10.5 ft
12. 10.5-12.0 ft
13. 10.0-21.Oft
3065 Kalawao St.
3022 Kahaloa PI.
Figure 8. Particle-size analysis of samples from the Alani-Paty landslide. Samples were air dried and analyzed according to ASTM D422-63 (ASTM, 1990). The particle classification is based on the following size ranges: gravel > 4.76 mm1 , 4.76 mm > sand > 0.075 mm, 0.075 mm > silt > 0.005 mm, clav < 0.005 mm. The particles are dominandy clay, silt and fine sand. A few samples also contained abundant coarse gravel. Coarse sand and fine gravel, particles from about 0.5 to 10 mm in diameter, were rare or absent Analyses by George Erickson and Sue Cannon.
24
X111Q
O
IQ_
100
80 -
60 -
40 60 80
LIQUID LIMIT
100 120 140
Figure 9. Plasticity chart for materials from the Alani-Paty landslide. Physical properties and locations of thesamples (designated by numbers next to the points) are indicated in Baum and others (1990,1991). The "A- line" is an empirical relationship that separates clay soils from silt soils. Abbreviations: CL, clay of low plasticity; ML, silt of low plasticity; CH, clay of high plasticity; MH/OH silt and organic clay of high plasticity. Analyses by George Erickson and Coyn Criley.
25

Tabl
e 2.
Res
idua
l she
ar s
treng
th p
aram
eter
s an
d A
tterb
erg
limits
of m
ater
ial f
rom
the
Ala
ni-P
aty
land
slid
e.
[Res
idua
l stre
ngth
par
amet
ers
dete
rmin
ed u
sing
dra
ined
dire
ct-s
hear
test
s on
rem
olde
d sa
mpl
es h
avin
g pr
ecut
failu
re p
lane
s (B
aum
and
oth
ers,
199
0,
1991
). Sa
mpl
es te
sted
und
er n
orm
al s
tress
es o
f 720
,144
0 an
d 36
00 Ib
f/ft2
. Sa
mpl
es w
ere
pre-
cons
olid
ated
und
er tw
ice
the
norm
al s
tress
app
lied
durin
g sh
earin
g. D
irec
t she
ar te
sts
by G
eorg
e Er
icks
on a
nd W
illia
m M
cArth
ur; A
tterb
erg
limits
by
Geo
rge
Eri
ckso
n an
d C
oyn
Cril
ey]
Bor
ing
Dep
th in
terv
al1
(ft)
Sam
ples
from
the
basa
l slip
sur
face
1 24
.0-2
6.25
3 26
.5-2
8.6
5 26
.5-3
1.5
14
19.5
-21.
518
21
.0-2
3.0
20
23.0
-24.
0
Liqu
id
limit
94 107
129 84 93 74
Plas
tic
limit
40 44 54 55 43 49
cV
(Ibf
/ft2)
85 82 139 40 46 105
4>V 10.9
°9.
3°6.
0°8.
2°8.
9°10
.1°
Des
crip
tion
brow
n sl
icke
nsid
ed c
lay
brow
n pl
astic
cla
ygr
ay s
licke
nsid
ed c
lay
gray
slic
kens
ided
cla
ysl
ight
ly s
andy
cla
ybr
own
sand
y cl
ayey
silt
Sam
ples
from
the
mai
n bo
dy o
f the
land
slid
e
surf
ace
surf
ace
3 6.
0-7.
54
10.8
-11.
512
26
.0-2
7.5
59 96 116
137 76
29 48 48 46 42
231
217 45 0 86
25.0
°11
.0°
9.0°
8.0°
8.5°
brow
n sa
ndy
clay
ey s
iltbr
own
sand
y si
lty c
lay
brow
n sl
ight
ly s
andy
cla
ybr
own
slig
htly
san
dy c
lay
brow
n sa
ndy
clay
Sam
ples
from
ben
eath
the
basa
l slip
sur
face
or o
utsi
de th
e la
ndsl
ide
3 36
.5-4
1.5
4 39
.0-4
1.0
8 8.
8-9.
58
26.0
-28.
311
29
.0-2
9.6
11
29.6
-30.
219
30
.0-3
1.8
95 76 73 66 84 65 84
44 61 49 52 38 43 44
128
189
169
262 44 25 90
8.0°
20.3
°7.
3°6.
1°7.
5°12
.4°
7.0°
brow
n si
lty c
lay
brow
n sa
ndy
clay
ey s
iltbr
own
clay
ey s
iltbr
own
sand
y cl
aybr
own
slic
kens
ided
cla
ysa
ndy
clay
ey s
litsl
ight
ly s
andy
slic
kens
ided
cla
y
Del
udes
rang
e of
unc
erta
inty
in lo
catio
n du
e to
inco
mpl
ete
reco
very
of s
ampl
e
26

£ 2000
£ 1800 -DC£ 1600 -
Q 1400 -zg 1200 -
2 1000 -
LU
COCCLUXCO
800 -
400 -
200 -
0
Normal Stress
-*- 3600lbf/ft2
-O- I440lbf/ft2
-B- 720lbf/ft2
Z 600 - A. A""""- -...... A
40 50 60 70 80 90 100 110 120 130 LIQUID LIMIT, AS PERCENT OF DRY WEIGHT
140
Figure 10. Relationship between liquid limit and residual shear strength (from drained direct shear tests) of samples from the Alani-Paty landslide. Test data are summarized in table 2 and Baum and others (1990,1991). The smooth curves approximate the relationship between the liquid limit and shear strength of different samples tested at the same normal stress. The curves indicate that the shear strength increases with decreasing liquid limit. Direct shear tests by George Erickson and William McArthur.
27
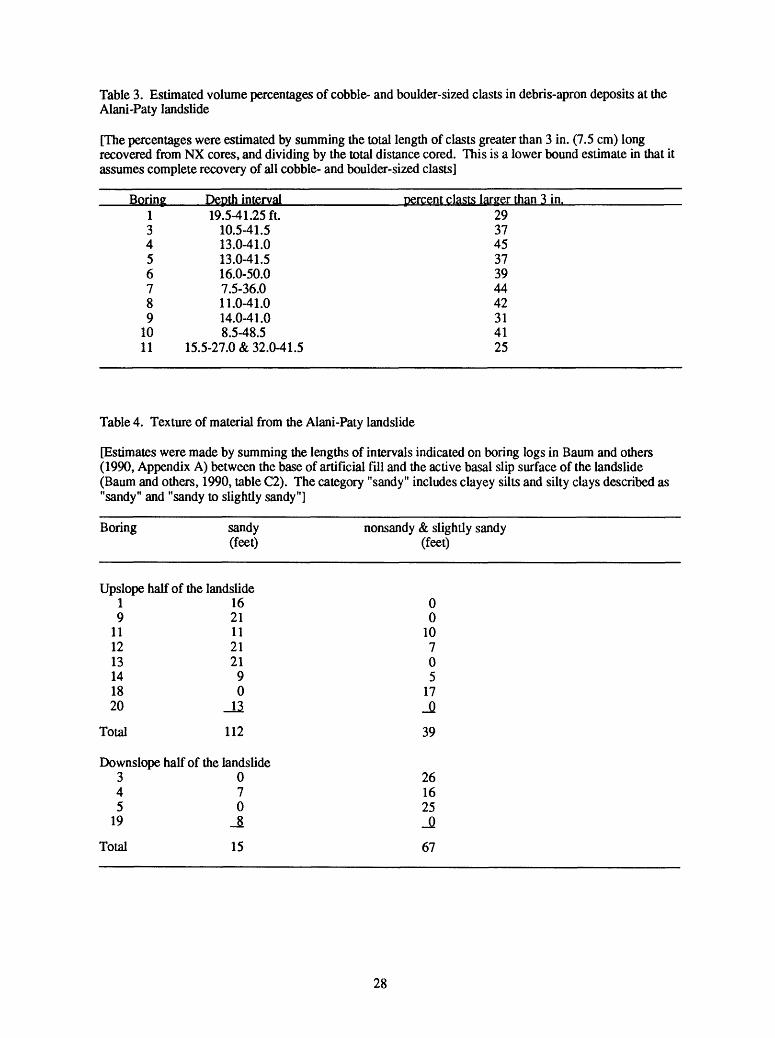
Table 3. Estimated volume percentages of cobble- and boulder-sized clasts in debris-apron deposits at the Alani-Paty landslide
[The percentages were estimated by summing the total length of clasts greater than 3 in. (7.5 cm) long recovered from NX cores, and dividing by the total distance cored. This is a lower bound estimate in that it assumes complete recovery of all cobble- and boulder-sized clasts]
Boring13456789
1011
Depth interval19.5-41.25 ft.
10.5-41.513.0-41.013.0-41.516.0-50.07.5-36.011.0-41.014.0-41.08.5-48.5
15.5-27.0 & 32.0-41.5
percent clasts larger than 3 in.29374537394442314125
Table 4. Texture of material from the Alani-Paty landslide
[Estimates were made by summing the lengths of intervals indicated on boring logs in Baum and others (1990, Appendix A) between the base of artificial fill and the active basal slip surface of the landslide (Baum and others, 1990, table C2). The category "sandy" includes clayey silts and silly clays described as "sandy" and "sandy to slightly sandy"]
Boring sandy nonsandy & slightly sandy (feet) (feet)
Upslope half of the landslide1 16 0 9 21 0
11 11 1012 21 713 21 014 9 518 0 1720
Total 112 39
Downslope half of the landslide30 2647 1650 25
19 _£ _Q
Total 15 67
28
Materials from the upslope half of the landslide generally are sandier and probably stronger than materials in the downslope half of the landslide (table 4). About 3/4 of the material sampled in the upslope half had a sandy matrix, whereas only a fifth of the material in the downslope half had a sandy matrix. Silt and sand can increase the strength of clay-rich soils, especially if the clay makes up less than 60 percent of the total volume. (Skempton, 1964; Lupini, Skinner and Vaughn, 1981, p. 182). Sandy samples from various locations in and around the landslide had angles of residual friction ranging from 6° to 25° whereas non-sandy samples had angles of residual friction ranging from 6° to 11° (table 2 and fig. 8).
Materials from the basal slip surface were identified in several borings; the materials are generally silly clays and sandy silty clays of high plasticity and low to moderate strength. Several samples from the depth of the slip surface were slickensided; however, slickensides were also present in several other samples above and below the slip surface. A sample of the failure surface from boring 5 had a schistose texture in a zone a few inches thick, indicating shearing on many closely spaced, subparallel surfaces. Trenches and large diameter borings that penetrated the landslide exposed plastic silty clay containing many randomly oriented, discontinuous, shiny surfaces surrounding one or a few continuous shear surfaces subparallel to the ground surface (William Cotton, unpub. data). The failure surface samples had strengths characterized by angles of residual friction ranging from 6° to 10.9° (table 2). Liquid limits of samples from the slip surface ranged from 74 to 129.
Most of the landslide material is saturated and either normally consolidated or lightly overconsolidated. Moisture content of the landslide materials ranges widely, but the average moisture content is near the plastic limit. The average plastic limit of 16 samples of landslide material is approximately 44, and the average moisture content of 123 samples from within the main body of the landslide is 47 percent. Figure 11 compares the natural moisture contents with the plastic limit for several samples. Moisture content of most specimens was within ±10 percent of the plastic limit.
Unit weight of the landslide material depends on the void ratio, the degree of saturation, and the densities and proportions of the rock and soil particles. We estimated an average unit weight of 138 lbf/ft3 for water saturated landslide material, based on the average moisture content of the matrix (47 percent), an average grain density of 2.74 for fines (Baum and others, 1990), an assumed average density of 2.9 for basalt clasts, and an average clast content of 38 percent by volume.
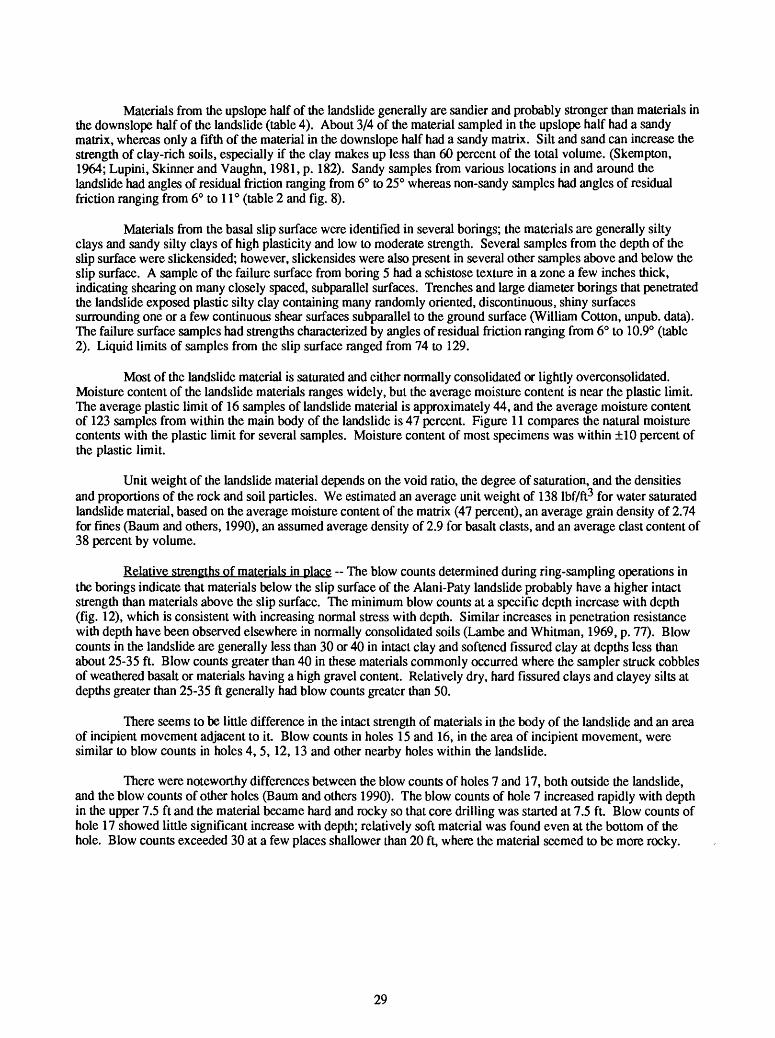
Relative strengths of materials in place ~ The blow counts determined during ring-sampling operations in the borings indicate that materials below the slip surface of the Alani-Paty landslide probably have a higher intact strength than materials above the slip surface. The minimum blow counts at a specific depth increase with depth (fig. 12), which is consistent with increasing normal stress with depth. Similar increases in penetration resistance with depth have been observed elsewhere in normally consolidated soils (Lambe and Whitman, 1969, p. 77). Blow counts in the landslide are generally less than 30 or 40 in intact clay and softened fissured clay at depths less than about 25-35 ft. Blow counts greater than 40 in these materials commonly occurred where the sampler struck cobbles of weathered basalt or materials having a high gravel content. Relatively dry, hard fissured clays and clayey silts at depths greater than 25-35 ft generally had blow counts greater than 50.
There seems to be little difference in the intact strength of materials in the body of the landslide and an area of incipient movement adjacent to it. Blow counts in holes 15 and 16, in the area of incipient movement, were similar to blow counts in holes 4, 5, 12, 13 and other nearby holes within the landslide.
There were noteworthy differences between the blow counts of holes 7 and 17, both outside the landslide, and the blow counts of other holes (Baum and others 1990). The blow counts of hole 7 increased rapidly with depth in the upper 7.5 ft and the material became hard and rocky so that core drilling was started at 7.5 ft. Blow counts of hole 17 showed little significant increase with depth; relatively soft material was found even at the bottom of the hole. Blow counts exceeded 30 at a few places shallower than 20 ft, where the material seemed to be more rocky.
29

-10
LLI Li.
^ -20
iLLI Q
-30
-40
RS-39
RS-96B Q
RS-41T H
RS-179H
RS-253
RS-243 B
RS-25 D
RS-153 D H
RS-41B
RS-229
H RS-162
0.0 0.2 0.4 0.6 0.8 1.0 1.2 1.4
NATURAL WATER CONTENT DIVIDED BY PLASTIC LIMIT (DIMENSIONLESS)
Figure 11. Ratio of natural moisture content to plastic limit of samples from the Alani-Paty landslide, plottedagainst depth. A ratio greater than one indicates that the natural moisture content is greater than the plastic limit The ratio ranges from 0.90 to 1.23; thus, the samples were near their plastic limits. Physical properties of samples (designated by numbers next to the data points) are in Baum and others (1990 and 1991).
30

0
-10
uj -20LLILL
- -30I
| -40
-50
-60
*3 Trend of minimum! penetration resistance
0 10 20 30 40 50 60 BLOWS PER FOOT OF PENETRATION
Figure 12. Blow counts from borings in the landslide (1, 3,4, 5,9,11, 12, 13,14,18, 19, and 20; Baum and others, 1990) versus depth. The zone designated minimum penetration resistance, which includes points having the fewest blow counts, indicates than penetration resistance, and probably intact strength increases with depth. The large scatter in the data results largely from the boulders and cobbles in the landslide material. Blow counts greater than 60 commonly indicate difficult or incomplete penetration because the sampler hit a boulder or pocket of gravel. Consequently values greater than 60 were shown as 60 in this graph.
31
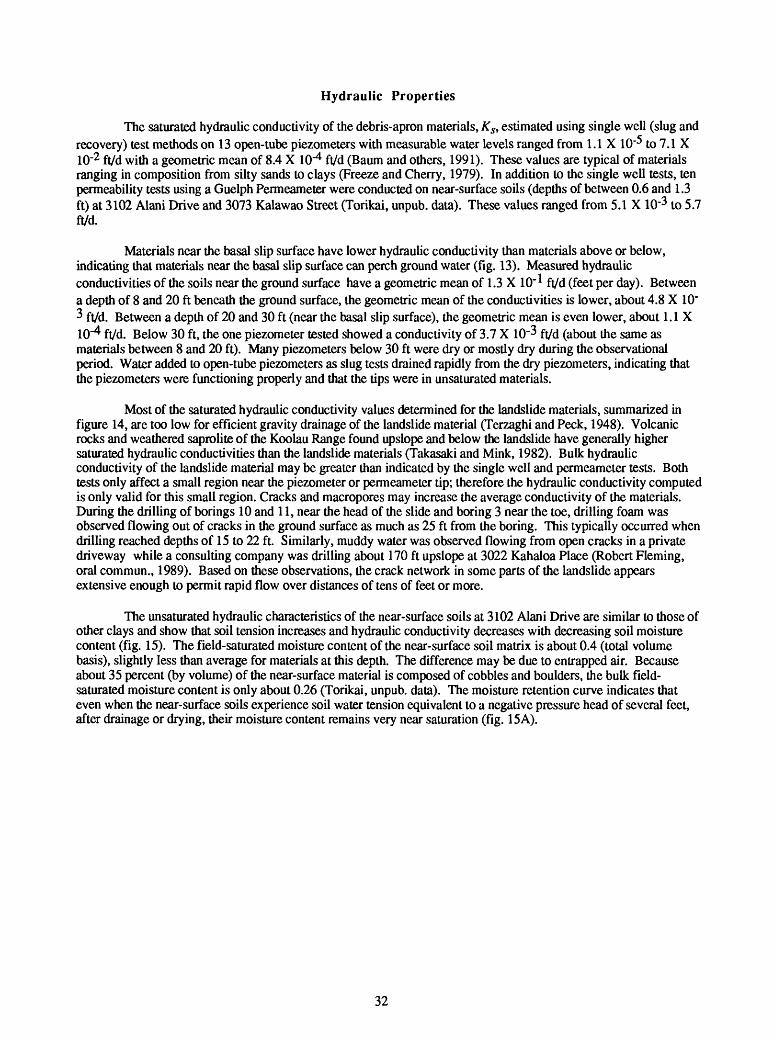
Hydraulic Properties
The saturated hydraulic conductivity of the debris-apron materials, KSt estimated using single well (slug and recovery) test methods on 13 open-tube piezometers with measurable water levels ranged from 1.1 X 10~5 to 7.1 X 10~2 ft/d with a geometric mean of 8.4 X 10"4 ft/d (Baum and others, 1991). These values are typical of materials ranging in composition from silty sands to clays (Freeze and Cherry, 1979). In addition to the single well tests, ten permeability tests using a Guelph Permeameter were conducted on near-surface soils (depths of between 0.6 and 1.3 ft) at 3102 Alani Drive and 3073 Kalawao Street (Torikai, unpub. data). These values ranged from 5.1 X 10'3 to 5.7 ft/d.
Materials near the basal slip surface have lower hydraulic conductivity than materials above or below, indicating that materials near the basal slip surface can perch ground water (fig. 13). Measured hydraulic conductivities of the soils near the ground surface have a geometric mean of 1.3 X 10" * ft/d (feet per day). Between a depth of 8 and 20 ft beneath the ground surface, the geometric mean of the conductivities is lower, about 4.8 X 10" 3 ft/d. Between a depth of 20 and 30 ft (near the basal slip surface), the geometric mean is even lower, about 1.1 X 10~4 ft/d. Below 30 ft, the one piezometer tested showed a conductivity of 3.7 X 10"3 ft/d (about the same as materials between 8 and 20 ft). Many piezometers below 30 ft were dry or mostly dry during the observational period. Water added to open-tube piezometers as slug tests drained rapidly from the dry piezometers, indicating that the piezometers were functioning properly and that the tips were in unsaturated materials.
Most of the saturated hydraulic conductivity values determined for the landslide materials, summarized in figure 14, are too low for efficient gravity drainage of the landslide material (Terzaghi and Peck, 1948). Volcanic rocks and weathered saprolite of the Koolau Range found upslope and below the landslide have generally higher saturated hydraulic conductivities than the landslide materials (Takasaki and Mink, 1982). Bulk hydraulic conductivity of the landslide material may be greater than indicated by the single well and permeameter tests. Both tests only affect a small region near the piezometer or permeameter tip; therefore the hydraulic conductivity computed is only valid for this small region. Cracks and macropores may increase the average conductivity of the materials. During the drilling of borings 10 and 11, near the head of the slide and boring 3 near the toe, drilling foam was observed flowing out of cracks in the ground surface as much as 25 ft from the boring. This typically occurred when drilling reached depths of 15 to 22 ft. Similarly, muddy water was observed flowing from open cracks in a private driveway while a consulting company was drilling about 170 ft upslope at 3022 Kahaloa Place (Robert Fleming, oral commun., 1989). Based on these observations, the crack network in some parts of the landslide appears extensive enough to permit rapid flow over distances of tens of feet or more.
The unsaturated hydraulic characteristics of the near-surface soils at 3102 Alani Drive are similar to those of other clays and show that soil tension increases and hydraulic conductivity decreases with decreasing soil moisture content (fig. 15). The field-saturated moisture content of the near-surface soil matrix is about 0.4 (total volume basis), slightly less than average for materials at this depth. The difference may be due to entrapped air. Because about 35 percent (by volume) of the near-surface material is composed of cobbles and boulders, the bulk field- saturated moisture content is only about 0.26 (Torikai, unpub. data). The moisture retention curve indicates that even when the near-surface soils experience soil water tension equivalent to a negative pressure head of several feet, after drainage or drying, their moisture content remains very near saturation (fig. 15 A).
32

0
-10
LJJ LLJ U.
X
CL LJJ Q
-20
-30
-40
-
M*
-
-
1 1 1 IIIUI 1 1 1 IIIUI 1 1 1 IIIUI III IIIUI 1 1 1 IIIUI 1 1 1
* Permeameter
Single well test, with boring number T ^ T"W y
9 14
* 13
19 1 0
B 1S ^P
16 A
3
7
e
1 1 Illl 1 1 1 1 1 III
W ^~
-
--_
/ ® \U0]
3
a(0
(0
-
* i ml i i i 1 1 in
10-* ID"6 ID'4 1CT3 ID'2 10H 10° 10 1
SATURATED HYDRAULIC CONDUCTIVITY, IN FEET PER DAY
Figure 13. Saturated hydraulic conductivity determined at different depths in and near the Alani-Paty landslideRange of depths of the basal slip surface beneath the main body of the landslide indicated between dashed lines. Single well tests are from Baum and others (1991); permeameter tests are from J.D. Torikai (unpub data).
33
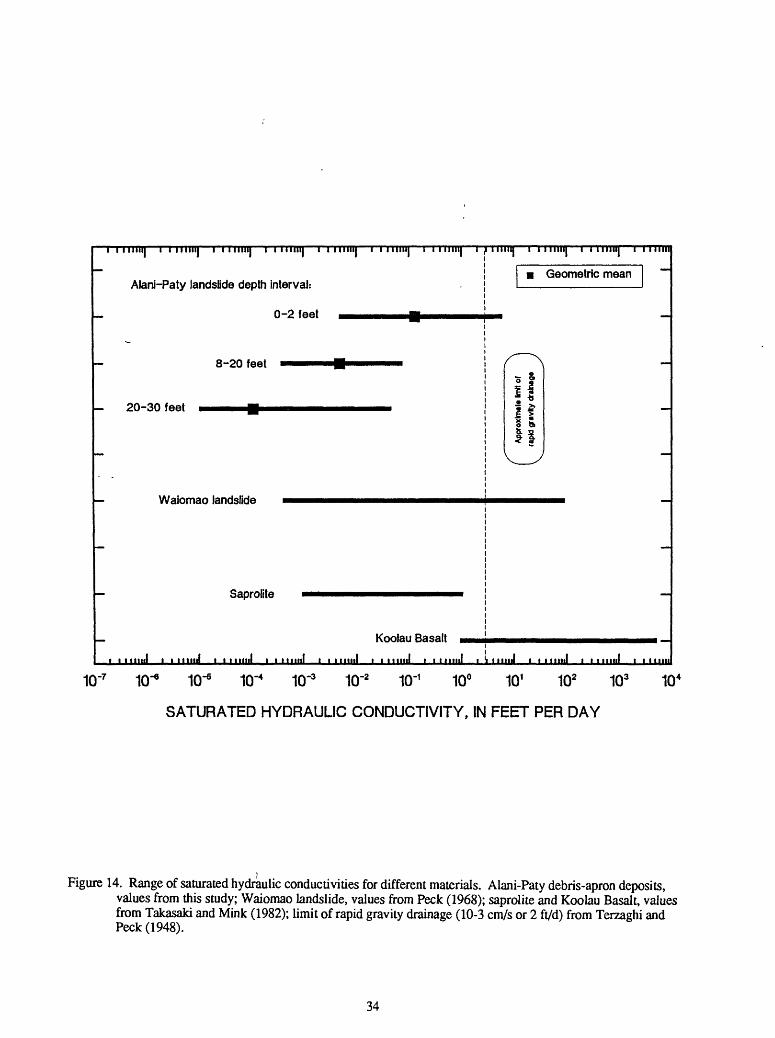
20-30 feet
ilium i i i mill i i i IHIII i i i mill i iiiiiui i iinuii i iiiiiui i f i nun I i i HUM i t i null I TTTT
Alani-Paty landslide depth interval:
0-2 feet
8-20 feet
Waiomao landslide
Saprolite
Kooiau Basalt
Geometric mean
if
i i 11 mil i i i mill i i i mill i t it mil i i iiiinl t i iiiinl i i iiiinl t 'i t mtJ i t iniiJ i i iiiinl t t 11111
ID'7 ID"6 10"6 10"4 1CT3 ID'2 ID'1 10° 101 102 103 104
SATURATED HYDRAULIC CONDUCTIVITY, IN FEET PER DAY
Figure 14. Range of saturated hydraulic conductivities for different materials. Alani-Paty debris-apron deposits, values from this study; Waiomao landslide, values from Peck (1968); saprolite and Koolau Basalt, values from Takasaki and Mink (1982); limit of rapid gravity drainage (10-3 cm/s or 2 ft/d) from Terzaghi and Peck (1948).
34

A.
B.
o
QC Q
X
dcc
35
30
25
20
15
10
5
0
1.0
0.8
0.6
0.2
0.0 I
0.10 0.15 0.20 0.25 0.30
MOISTURE CONTENT, IN FRACTION OF TOTAL VOLUME
i Figure 15. Moisture characteristics for unsaturated, near-surface soils at 3102 Alani Drive on the Alani-Paty
landslide (J.D. Torikai, unpub. data). Wet and dry values are typical of winter and summer conditions at the site, respectively. (A) Moisture retention curve. Moisture content (as fraction of total volume) has been corrected to account for 35 percent (by volume) cobbles and boulders using the methods of Bouwer and Rice (1984). (B) Relative hydraulic conductivity K(\f)IKs.
35

The critical pressure head, hcr, used to approximate the effective pressure head, -he, in simulations of infiltration into unsaturated materials was estimated using the unsaturated hydraulic conductivity curve and:
Vi(1)= J*
where \|i is the soil moisture tension, Kr(\\f) is the relative hydraulic conductivity (KXv) = ^(V)/^). and \|// is the tension value when Kr(\\f) becomes very small (Bouwer, 1978). Physically, -hcr approximates the height of a saturated capillary fringe (Bouwer, 1978) and he is the pressure head at an infiltrating wetting front. Using figures 15A and B, the estimated -hcr for the near-surface soils on the Alani-Paty landslide is about 12 in. Fine sands usually have a capillary fringe of about 12-24 in. (Bouwer, 1978).
HYDROLOGY OF THE LANDSLIDE
Observations indicate that rainfall can trigger and sustain the movement of slow-moving landslides on Oahu, including the Alani-Paty landslide. Earlier work on other slow-moving landslides in the leeward valleys near Honolulu showed that landslide movement accelerated during periods of large amounts of rainfall (Peck, 1959; Peck and Wilson, 1968). Peck (1959,1967) correlated movement on the Waiomao landslide with rainfall during the previous 10 days. Residents on and near the Alani-Paty landslide have reported that most damage to roads and houses on the landslide occurred during and immediately following rainy periods. Rainfall can influence movement of the landslide by increasing the weight of the landslide and by elevating ground-water pressures in part of the landslide. Understanding the mechanics of the landslide, as well as designing measures to control its movement, depends on understanding ground-water conditions in and near the landslide. Thus, we describe the observed relations between rainfall, ground water, and movement of the landslide; the flow of ground water in the landslide; and the hydrologic responses during rainstorms.
Rainfall and Landslide Movement
The Alani-Paty landslide was stationary for most of the period between September 1989 and April 1991. Although no major downslope movements occurred during this period, the head of the landslide, downslope from Paty extension, moved small amounts on several occasions (fig. 16). The main body of the landslide moved downslope during January 1990 and sometime in the winter of 1990-1991, probably in March 1991. The January 1990 movement was detected by borehole inclinometers (STV/Lyon Associates, 1990) and surface surveys (City and County of Honolulu, unpub. data); the March 1991 movement was detected by borehole inclinometers (STV/Lyon Associates, unpub. data). Slight surface deformation near the toe of the slide, evidenced by deformed walls and curbs, was observed about two weeks following the January 1990 head scarp movement (S.R. Spengler, oral communication, 1990).
Movement episodes occurred during rainy periods. However, movement was not detected during all rainy periods (table 5 and fig. 16). The head of the landslide moved during extended rainy periods containing high intensity rainfall bursts. Intense bursts of rain commonly occurred several times during a rainy period and 24-hour cumulative rainfall ranged up to about 5 in. For comparison, 5 in. of rain falling on the landslide area within 24 hours has an estimated return period of about 2 yr (Giambelluca and others, 1984). These rainy periods resulted in high peak pressure heads within the upslope part of the landslide and destabilizing pore pressure distributions within the ground-water system of the landslide (table 5). Movement in the main body of the landslide in January 1990 and March 1991 occurred during periods with high previous 10 day rainfall (fig. 17). Monthly rainfall amounts recorded at the longer-record Manoa Beaumont rain gage for this period show deviations of about twice the median monthly rainfall in January 1990, December 1990, and March 1991 (fig. 18). Monthly rainfall recorded at this gage for December 1987, when large downslope movements were noticed, was more than three times the median.
36

0.40
No Rainfall data for Feb. 1-20,1991, datalogger malfunctioned
-0.40
200 300 400 500 600 700 TIME, IN DAYS; DAY 1 IS JANUARY 1,1989
800 900
Figure 16. Cumulative downslope displacement recorded at the head scarp extensometer and daily rainfall measured at 3102 Alani Drive, from September 26,1989 to April 30,1991. Most of the noise has been removed from displacement data (the apparent gradual movement between storms remains unexplained). Original data in Baum and others (1991).
37
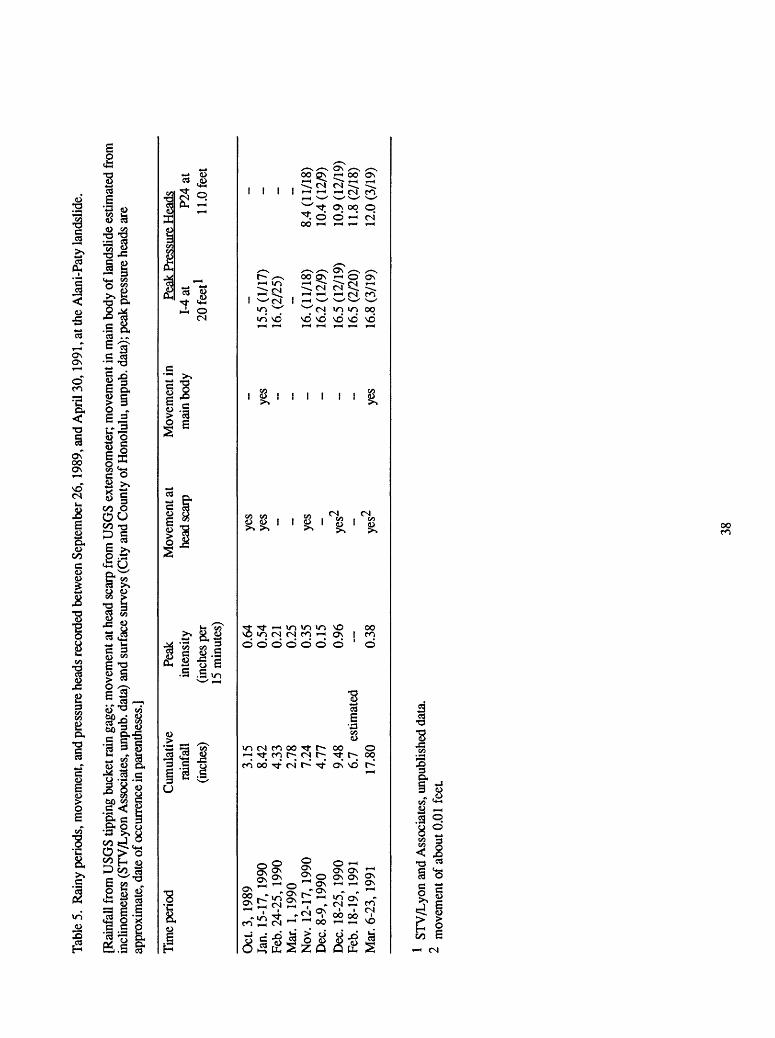
Tabl
e 5.
Rai
ny p
erio
ds, m
ovem
ent,
and
pres
sure
hea
ds re
cord
ed b
etw
een
Sept
embe
r 26,
1989
, and
Apr
il 30
,199
1, a
t the
Ala
ni-P
aty
land
slid
e.
[Rai
nfal
l fro
m U
SGS
tippi
ng b
ucke
t rai
n ga
ge; m
ovem
ent a
t hea
d sc
arp
from
USG
S ex
tens
omet
er;
mov
emen
t in
mai
n bo
dy o
f lan
dslid
e es
timat
ed fr
om
incl
inom
eter
s (S
TV/L
yon
Ass
ocia
tes,
unp
ub. d
ata)
and
sur
face
sur
veys
(C
ity a
nd C
ount
y of
Hon
olul
u, u
npub
. dat
a); p
eak
pres
sure
hea
ds a
re
appr
oxim
ate,
dat
e of
occ
urre
nce
in p
aren
thes
es.]
Tim
e pe
riod
Oct
. 3,
198
9Ja
n. 1
5-17
, 19
90Fe
b. 2
4-25
, 19
90M
ar.
1, 1
990
Nov
. 12
-17,
199
0D
ec. 8
-9,
1990
Dec
. 18
-25,
199
0Fe
b. 1
8-19
, 19
91M
ar. 6
-23,
199
1
Cum
ulat
ive
rain
fall
(inch
es)
3.15
8.42
4.33
2.78
7.24
4.77
9.48
6.7
estim
ated
17.8
0
Peak
inte
nsity
(inch
es p
er15
min
utes
)
0.64
0.54
0.21
0.25
0.35
0.15
0.96 0.38
Mov
emen
t at
head
scar
p
yes
yes - - yes yes2 yes2
Mov
emen
t in
Peak
Pre
ssur
e H
eads
mai
n bo
dy
1-4
at20
feet
1
_ _
yes
15.5
(1/
17)
16. (
2/25
)_
_16
. (11
/18)
16.2
(12
/9)
16.5
(12
/19)
16.5
(2/
20)
yes
16.8
(3/
19)
P24
at11
.0 f
eet
- - -8.
4(11
/18)
10.4
(12
/9)
10.9
(12
/19)
11.8
(2/1
8)12
.0 (
3/19
)
1 ST
V/L
yon
and
Ass
ocia
tes,
unp
ublis
hed
data
.2
mov
emen
t of a
bout
0.0
1 fe
et.
38

1.4
1.2
UJ
o^ 0.8
_< 0.6LL
0.4
0.2
0.0
200
previous 10 day average
I I I
300 400 500 , 600 700
TIME, IN DAYS; DAY 11S JANUARY 1,1989
800 900
Figure 17. Previous 10 day average rainfall at 3102 Alani Drive. Highest values occurred in January 1990 andMarch 1991. No rainfall data are available for February 1-20,1991. The average rainfall for the previous ten days probably was underestimated for this period and the 10 days following (February 1,-March 2, 1991).
39

Monthly Rainfall at Manoa Beaumont Raingage
30
25
a 20z
S. 15 i
I 10
5
0
Long-term median
Measured
1987 1988 1989 1990
Figure 18. Monthly rainfall at Manoa Beaumont rain gage (State of Hawaii Key Number 712.10) from January 1987 through April 1991. Long-term median adjusted values from Giambelluca and others (1986). Measured values from U.S. Oceanic and Atmospheric Administration (1987,1988,1989,1990, and 1991).
40

Ground Water
The occurrence and movement of ground water within and adjacent to the Alani-Paty landslide controls the distribution of destabilizing pore-water pressures. Ground-water occurs in Koolau Basalt bedrock beneath the landslide and in debris-apron deposits within and outside the landslide boundaries. The response of ground water to rainfall varies significantly between different areas.
Figure 19 shows schematically the main pathways of water entering and leaving perched ground water in the landslide. Ground water within the landslide is recharged from the direct infiltration of rainfall, infiltration of runoff coming from areas upslope of the landslide and from urban pavement and structures, and urban irrigation from activities such as lawn and garden watering. Once in the slide, ground water discharges from the landslide by downslope flow toward the valley, downward drainage into debris-apron deposits and bedrock, seep and spring discharge, drainage structures, and evapotranspiration.
Area residents have been concerned about the amount of water that has entered the landslide from broken water pipes, storm drains, and sanitary sewers. Water leaking from broken water pipes may have entered the landslide on many occasions before detailed monitoring of ground water in the landslide began during October 1989. For example, between November 2,1987, and February 27,1988, when the landslide moved about 3 ft (City and County of Honolulu, Department of Public Works, unpub survey data for Kahaloa Place), broken water pipes were reported many times at locations within or on the margins of the landslide (City and County of Honolulu, Board of Water Supply, unpub. data). We are unaware of any water-pipe breaks during the period of detailed monitoring, between October 1989 and April 1992, consequently the effects of water-pipe breaks on the landslide remain unobserved. However, observations and analyses indicate that infiltration at the ground surface of rainfall and runoff is sufficient to activate the landslide during extended rainy periods.
Occurrence of Ground Water
The description of the occurrence of ground water within and near the Alani-Paty landslide is based on water- level data collected from 41 small-diameter open-tube piezometers and five pressure transducers installed by the USGS (Baum and others, 1990,1991). Open-tube piezometers that were consistently dry were tested to insure that their tips were not clogged. During the tests, all dry piezometers drained water that was added to their casings. Thus, these dry piezometers indicate that unsaturated conditions exist around their tips. In addition to data obtained from USGS piezometers, unpublished data collected between January 1990 and April 26,1991 from 22 pressure transducers installed by STV/Lyon Associates (1990 and unpub. data) have been summarized in the following observations.
Debris-Apron Deposits
Piezometer responses varied from place to place throughout the debris-apron deposits; however, there are distinct regions in which most piezometers showed similar response patterns. In general, materials within the landslide are water saturated and have some positive pressure head (fig. 20). The water appears to be perched near the basal slip surface by materials having lower hydraulic conductivity (fig. 13). Materials underlying most of the landslide are largely unsaturated or have low pressure heads; this low pressure is consistent with the presence of perched water within the landslide. Deep piezometers indicate that saturated conditions exist beneath the unsaturated materials, within the debris-apron deposits and above the basal freshwater table.
41
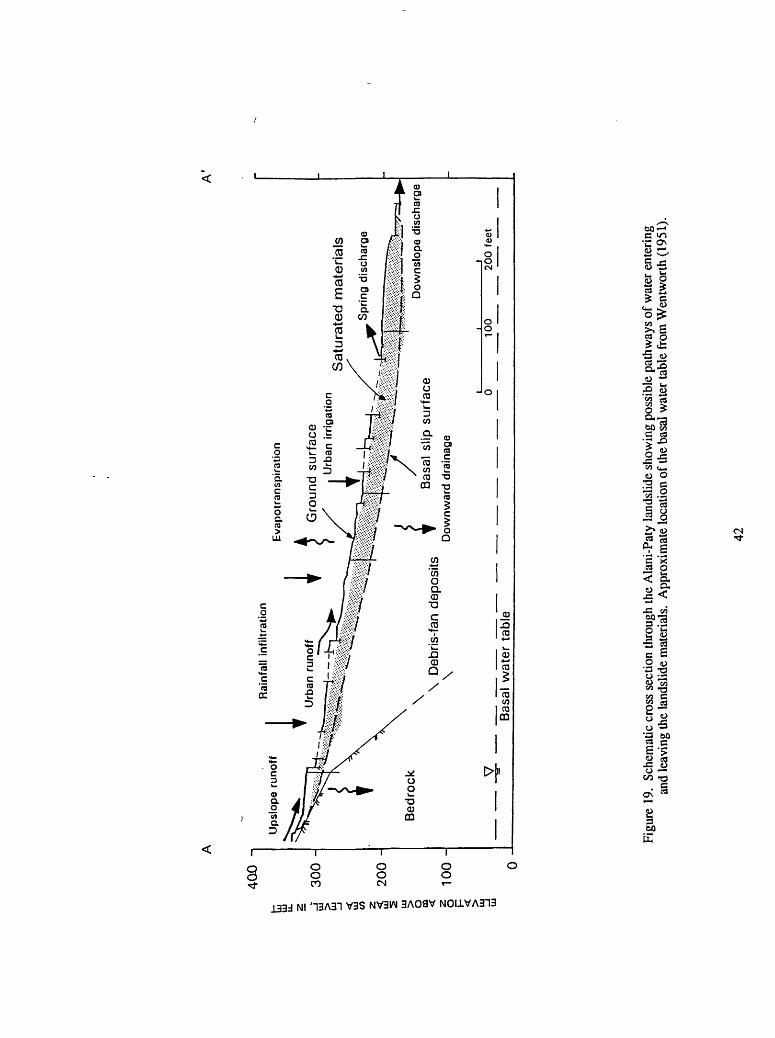
A'
fc UJ U
l
O CO
400
-i
30
0 -
200
-
0
Ups
lope
runoff
Rai
nfal
l in
filtr
atio
n
Bed
rock
Eva
potr
ansp
iratio
n
Gro
und
surf
ace
Urb
an i
rrig
atio
nS
atu
rate
d m
ate
ria
ls
Sprin
g di
scha
rge
v r.
. .
, .
.. w
Bas
al s
lip s
urf
ace
\
Deb
ris-f
an d
epos
its
"\
Dow
nwar
d dr
aina
ge
. jj
^^
''''^''
'''''^'
-''-''
'--''^
V^f
oV^^
^\
J
**-*
++
. ftr
+*
~'J
f.i.
- 'i'
l''-^
'^'^
!'' *
'-
'-'-
' ' '
'-' .
' ' '
' ' '
' -' '
' ' .
' ''
' '
' t
tD
owns
lope
dis
char
ge
100
200
feet
Bas
al w
ate
r ta
ble
Figu
re 1
9. S
chem
atic
cro
ss s
ectio
n th
roug
h th
e A
lani
-Pat
y la
ndsl
ide
show
ing
poss
ible
pat
hway
s of
wat
er e
nter
ing
and
leav
ing
the
land
slid
e m
ater
ials
. A
ppro
xim
ate
loca
tion
of th
e ba
sal w
ater
tabl
e fr
om W
entw
orth
(19
51).
42

EX
PLA
NA
TIO
N
W
et
pie
zom
ete
r tip
o
Dry
or
most
ly d
ry p
iezo
me
ter
tip
-25
0
Ap
pro
xim
ate
hyd
raulic
hea
d, i
n fe
et
- ^
Genera
lized d
irect
ion o
f g
rou
nd
-wa
ter
flo
wA
'
Ill § 3 CO o 00
400 i
300 -
20
0 -
§ 10
0 -
0
Gro
und s
urf
ace
":*s*j*
«: ^
^^i^
s^g^^v..:^
--. -
.
^ ^^
5^y
^mm
ii^27S\-
-
°
±
~^*~
Sat
urat
ed m
ater
ials
Bed
rock
Deb
ris-f
an d
epos
itsB
asal
slip
su
rfa
ce
V10
02
00
fee
t
Bas
al w
ate
r ta
ble
Figu
re 2
0. C
ross
sec
tion
thro
ugh
the
Ala
ni-P
aty
land
slid
e sh
owin
g ge
nera
lized
gro
und-
wat
er fl
ow d
irect
ions
and
appr
oxim
ate
limits
of t
he s
atur
ated
mat
eria
ls w
ithin
the
slid
e. P
iezo
met
ers
are
proj
ecte
d fr
om b
orin
gs n
ear
the
line
of se
ctio
n. S
hade
d ar
ea w
ithin
the
land
slid
e in
dica
tes
mos
tly s
atur
ated
mat
eria
ls.
Dee
per s
atur
ated
m
ater
ials
app
ear t
o be
sep
arat
ed fr
om th
e sa
tura
ted
land
slid
e m
ater
ials
in m
ost a
reas
by
unsa
lura
ted
mat
eria
ls.
43
Most piezometers with tips located within the landslide boundaries and above the basal slip surface showed two patterns of response: 1) relatively steady pressure heads or 2) increases in pressure head during and following rainfall (table 6., group 2). The distribution of shallow piezometers with different response patterns is shown in figure 21. In the upslope part of the slide, most piezometers responded during and following rainfall. Pressure heads in this part declined during several weeks following rainy periods, indicating natural drainage in this region (figs. 22 and 23). In the middle part of the slide, some piezometers showed small responses to rainfall while others maintained relatively steady pressure heads (figs. 22 and 24). In the downslope part, most shallow piezometers showed relatively steady pressure heads and many had water levels within a few feet of the ground surface (fig. 24). Only one piezometer, (1-2, PI) measured pressure heads greater than the depth to its tip, indicating artesian pressure conditions (STV/Lyon and Associates, unpublished data). This piezometer, an electronic pore-pressure transducer, showed a fairly steady excess value that differed from the responses observed in the other 67 piezometers. No means is available to test this transducer and it may have malfunctioned.
Near the head of the slide, most shallow piezometers with tips located outside the mapped landslide boundaries remained mostly dry or had low pressure heads of less than 2 ft, in contrast to the higher pressure heads measured by piezometers within the landslide boundaries (compare table 6, group 3 with group 2). Only piezometers in borings 26 and 103 showed large responses following rainfall. Pressure heads measured in boring 16 piezometers, located in an area of incipient deformation, remained relatively steady. Hydrographs for several of the piezometers in group 3 are shown in figure 25.
Piezometers with tips at depths between 30 and 60 ft (table 6, group 4) had general patterns of response that also differ from those within the active landslide (fig. 26). Of the 14 open-tube piezometers in this group, four were dry, four were mostly dry, and four consistently indicated low pressure heads. One transducer (1-4, P2) under the head of the landslide usually indicated pressure head near zero but showed increases as great as 5 ft following rainy periods. Only one transducer snowed relatively large pressure fluctuations during and following rainfall (1-5, P2), and that response pattern mimics in time the pattern of the shallower nested transducer in the same boring, suggesting a leak in the bentonite seal between transducers or a datalogger malfunction.
Most piezometers with tips deeper than 60 ft responded following rainfall, indicating deeper saturated zones within the debris-apron deposits beneath the head and toe of the landslide (table 6, group 5). Most of these zones do not appear to have a saturated hydraulic connection with the saturated landslide materials. These zones also appear to be separated laterally by an unsaturated zone.
Thus, ground water in most of the landslide appears to be perched by lower hydraulic conductivity materials. Pore water pressures increase in the upslope quarter of the landslide during rainy periods, whereas water pressures remain relatively steady in the downslope three-quarters of the landslide.
Bedrock
Within the Koolau Basalt bedrock near the landslide, the perennial basal freshwater table occurs at least 150 ft below the landslide basal slip surface (fig. 19). No extensive dikes or tuff layers that might perch ground-water, or perennial springs are visible in the bedrock directly upslope of the landslide, although tuffs are mapped locally near the base of the steep hillside northeast from the landslide (Stearns, 1939).
Ground water occurs intermittently in bedrock near the head of the landslide. Between October and December of 1989, STV/Lyon Associates had five inclined borings drilled into the hillside upslope of the Alani-Paty landslide, and four of the borings penetrated approximately 10 ft of basalt bedrock (plate 1). USGS personnel were present during most of the drilling. Ground water was observed in only two of the four borings, 100 and 108. However, boring 100 became dry after the drill penetrated a reddish cinder layer, indicating that ground water had been impeded by this layer. The USGS installed open-tube piezometers in these borings, with porous tips located above the cinder layer in boring 100 and near the observed seepage in boring 108 (Baum and others, 1990). The responses of these piezometers are illustrated in figure 27. and summarized in table 6 group 1. Following recovery from drilling, piezometer 108 remained dry. Piezometer 100 was dry during the summer months and responded to rainfall during the winter months with a pressure head variation of as much as about 6 ft.
44

Table 6. Water pressure head response in piezometers from installation until April 29,1991.
[Piezometer type: O=USGS open-tube; P=USGS vibrating wire or strain gauge pressure transducer; T=STV/Lyon pressure transducer. General pattern of response following recovery from drilling: dry=no water detected in open standpipe, indicating unsaturated conditions at tip; m. dry=mostly dry, occasionally responds briefly; dry/wet=dry during times of less rainfall, wet during times of more rainfall; decline=extended decline in pressures following drilling, relatively steady at end of observational period; steady=saturated with pressures that fluctuate usually less than one foot; rain=always or mostly saturated with pressure increases during or following rainstorms. Pressure head in open-tube piezometers is assumed to equal the height of water in the tube above the tip. Anomalous pressure head after drilling is shown in brackets]
Group 1. Piezometers with tips in bedrock.
Boring
100108
Depth ofTip
(feet)
10.1 l19.4 1
Group 2. Piezometers withboundaries.
Boring
1134599121314141919x202022222424I-1P11-2 PI1-3 PI1-3 P21-4 PI1-5 PI
Depth ofTip
(feet)
13.225.5 2
5.020.2
5.78.6
25.118.012.09.4
21.9 214.4
5.49.5
21.511.320.611.019.3212511272017
Type
OO
tips shallower than
Type
OOOOOOOOOOOOOOOPPPPTTTTTT
Pattern ofResponse
dry/wetdry
29 feet in debris-apron
Pattern ofResponse
rainrain
steadysteadysteadyrain
declinesteadyrain
dry-wetsteadysteadysteadym. dry
rainrain
steadyrainrainrain
steadyrain
steadyrainrain
Approx. PressureHead Range
(feet)
Oto6none [1]
deposits within the landslide
Approx. PressureHead Range
(feet)
1 toll12 to 241 to 1.5
3to4[0]2 to 2.5
1 to622 to 12.5
127 to 11Oto3
0 to 2 [8.5]10 [4.5]
1Oto2
9 to 10.52to8
-2.5 to 00 to 12 30 to 7.5 311 to 14.528.5 to 30
6to914 drops to 48.5 to 16.5
1 to 15
45
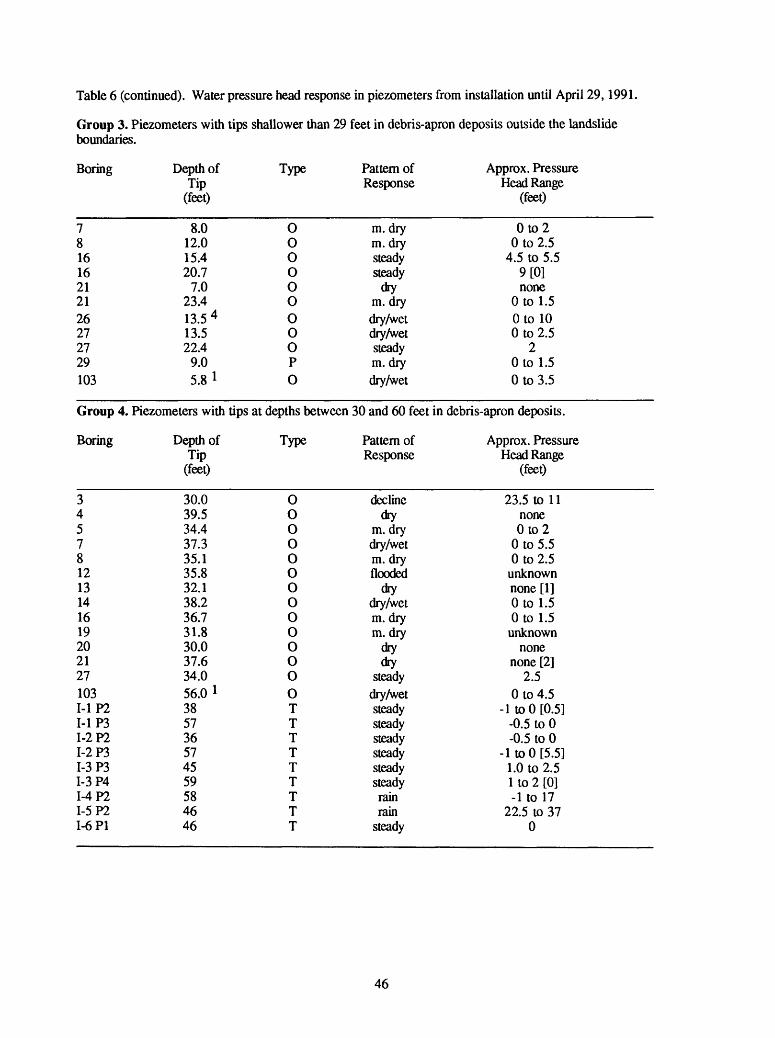
Table 6 (continued). Water pressure head response in piezometers from installation until April 29,1991.
Group 3. Piezometers with tips shallower than 29 feet in debris-apron deposits outside the landslide boundaries.
Boring
781616212126272729103
Group
Boring
345781213141619202127103I-1P2I-1P31-2 P21-2 P31-3 P31-3 P41-4 P21-5 P21-6 PI
Depth ofTip
(feet)
8.012.015.420.7
7.023.413.5 413.522.4
9.05.8 l
4. Piezometers with
Depth ofTip
(feet)
30.039.534.437.335.135.832.138.236.731.830.037.634.056.0 !385736574559584646
Type
00OO0000OP0
tips at depths between
Type
O00OOO0000OOOOTTTTTTTTT
Pattern ofResponse
m. drym. drysteadysteady
drym. drydry/wetdry/wetsteadym. drydry/wet
Approx. PressureHead Range
(feet)
Oto20 to 2.5
4.5 to 5.59[0]none
0 to 1.5OtolO0 to 2.5
20 to 1.50 to 3.5
30 and 60 feet in debris-apron deposits.
Pattern ofResponse
declinedry
m. drydry/wetm. dryflooded
drydry/wetm. drym. dry
drydry
steadydry/wetsteadysteadysteadysteadysteadysteadyrainrain
steady
Approx. PressureHead Range
(feet)
23.5 to 11noneOto2
0 to 5.50 to 2.5
unknownnone [1]0 to 1.50 to 1.5
unknownnone
none [2]2.5
0 to 4.5-1 toO [0.5]
-0.5 to 0-0.5 to 0
-1 toO [5.5]1.0 to 2.51 to 2 [0]-1 to 17
22.5 to 370
46

Table 6 (continued). Water pressure head response in piezometers from installation until April 29,1991.
Group 5. Piezometers with tips at depths greater than 60 feet in debris-apron deposits.
Boring
I-1P41-2 P41-3 P5 1-4 P31-5 P31-6 P21-6 P3
Depth of Tip
(feet)
819185 939583
104
Type
TTT TTTT
Pattern of Response
rainrain
steady rainrainrainrain
Approx. Pressure Head Range
(feet)
-1 to 16-1 to 9.5-6 to -5 8 to 115 to 22
25 to 28.540 to 48
Inclined depth to tip at 40 degrees from horizontal. Pressure head ranges are with respect to vertical.
Depth slightly below landslide basal slip surface.
Pressure values should be reduced by about 1 foot due to transducer drift after drying and over time.
Casing is slotted.
47

100
EX
PLA
NA
TIO
N
Pie
zom
eter
has
lar
ge (
grea
ter t
han
3 fe
et)
resp
onse
dur
ing
or fo
llow
ing
rain
fall
Pie
zom
eter
has
sm
all
(1 t
o 3
foot
) re
spon
se d
urin
g or
follo
win
g ra
infa
ll
Pie
zom
eter
rem
ains
rel
ativ
ely
stea
dy (
less
tha
n 1
foot
fluc
tuat
ion)
Pie
zom
eter
mos
tly d
ry
Pie
zom
eter
dry
Reg
ion
whe
re p
iezo
met
ers
resp
ond
durin
g or
follo
win
g ra
infa
ll
Reg
ion
whe
re p
iezo
met
ers
rem
ain
rela
tivel
y st
eady
or
have
sm
all
resp
onse
s du
ring
or fo
llow
ing
rain
fall
Reg
ion
whe
re p
iezo
met
ers
rem
ain
rela
tivel
y st
eady
CO
NT
OU
R I
NTE
RV
AL
2 F
EE
TD
AT
UM
IS
ME
AN
SE
A L
EV
EL
NO
RT
H
Figu
re 2
1. M
ap s
how
ing
the
dist
ribut
ion
and
resp
onse
pat
tern
s of
pie
zom
eter
s w
ith ti
ps le
ss th
an a
dep
th o
f 29
feet
. R
espo
nse
patte
rns
desc
ribed
furth
er in
tabl
e 6.

CO111oz
u.zQC
10
111111
tr in
I1111Q
-5
-10
-15 200
JijLlLJluJtJLu^^
Rainfall
Boring number and depth of piezometer tip
>.«.»*« * 4Mff 1,
#9, 8.6ft
--- #13. 12.0ft
....... #20.21.5ft
300 400 500 600 700 800 900
TIME, IN DAYS; DAY 1 IS JANUARY 1,1989
Figure 22. Response of selected open-tube piezometers wilhin the landslide that show increased water levels during and following rainfall. Large fluctuations (seen in piezometers 1 and 9) occurred in ihe upslope one-quarter of the landslide. Piezometer locations shown in figure 21. Additional piezometer responses can be found in Baum and others (1991).
49
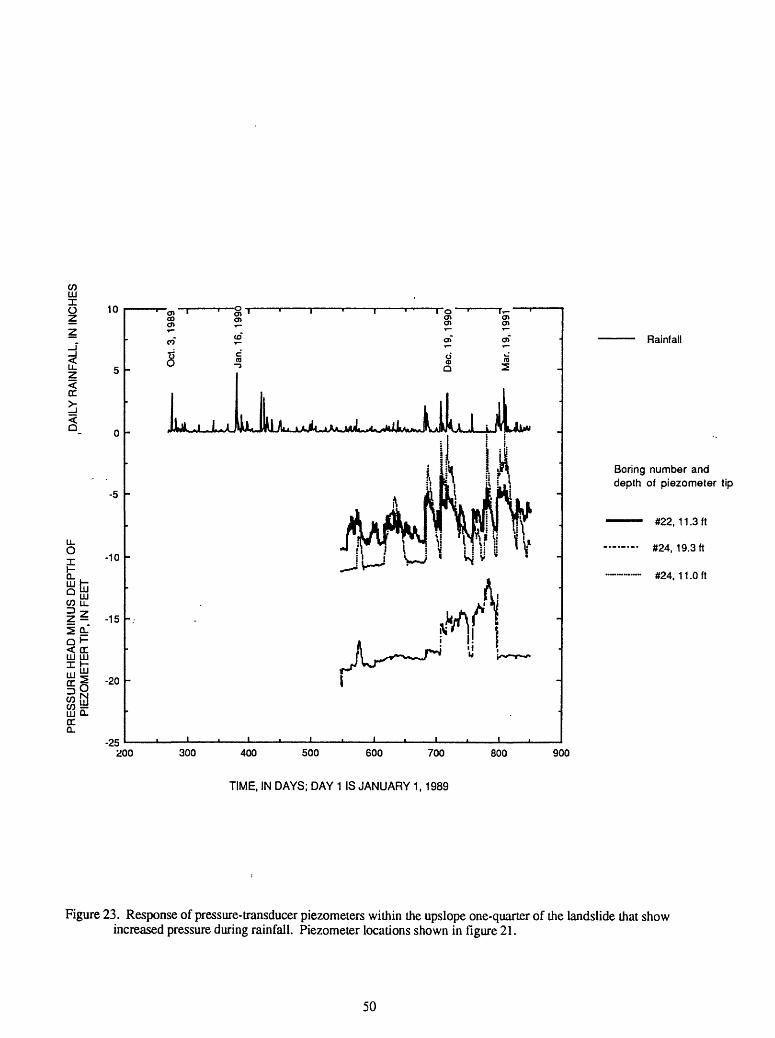
wULJT O 10
-5
Itu UJ W LLis2 O:"Ql-
< OC UJ UJ5§cr ^
oc a.
UI
-20
uM JU^LM^^JJU^JLA uJLjJ JUlM
,A rnfi . ^«^'»i«>i'^/^Wr^
200 300 400 500 600 700
TIME, IN DAYS; DAY 1 IS JANUARY 1,1989
800 900
Rainfall
Boring number and depth of piezometer tip
- #22,11.3 ft
....... #24,19.3 ft
#24. 11.0ft
Figure 23. Response of pressure-transducer piezometers within the upslope one-quarter of the landslide that show increased pressure during rainfall. Piezometer locations shown in figure 21.
50
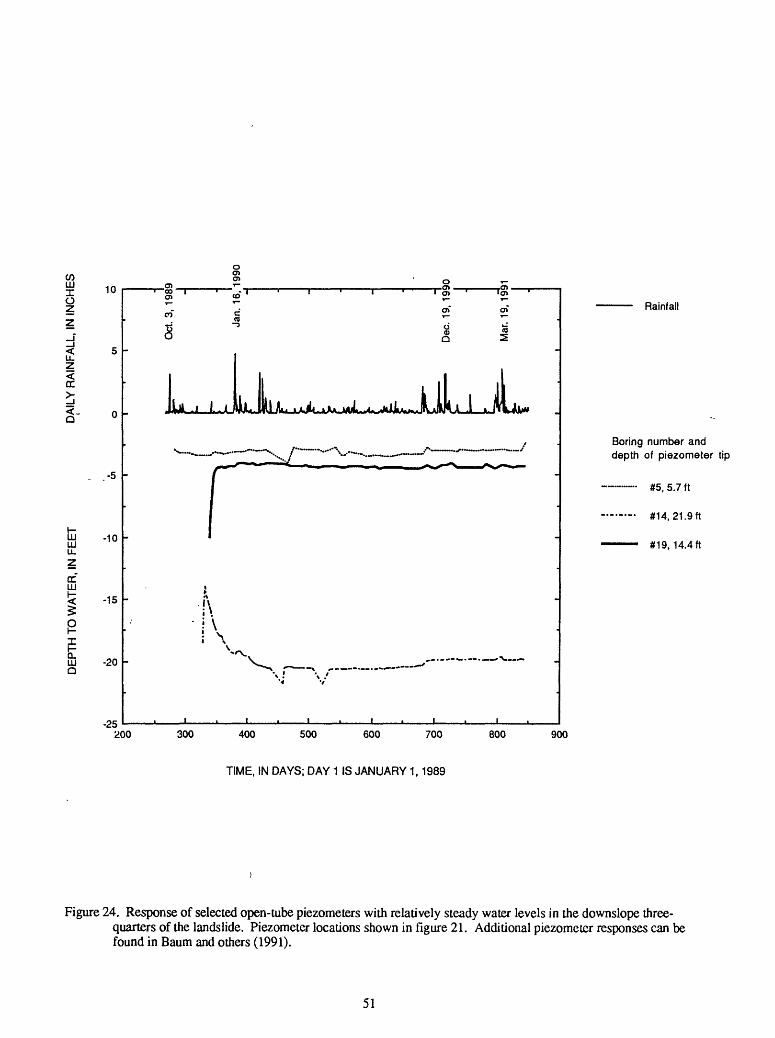
UJ
o
s-
UJ
DC UJ
I PIQ. UJ Q
-5
-10
-15
-20
-25 200
JLJ lLuJllUu_jLA^
!\
Rainfall
Boring number and depth of piezometer tip
300 400 500 600 700 800 900
TIME, IN DAYS; DAY 1 IS JANUARY 1,1989
Figure 24. Response of selected open-tube piezometers with relatively steady water levels in the downslope three- quarters of the landslide. Piezometer locations shown in figure 21. Additional piezometer responses can be found in Baum and others (1991).
51
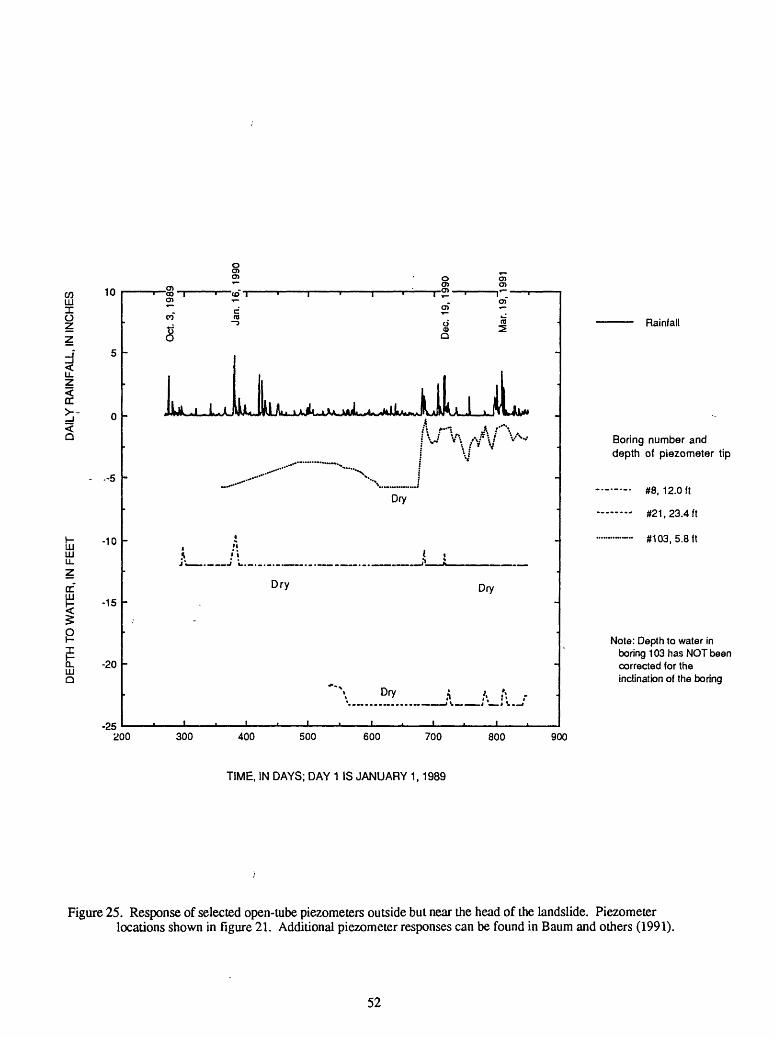
03UJIo
<DC
Q
111 UJ U_
ocIo
a.UJQ
-10
-15
-20
-25 200
^
Dry Dry
Dry
Rainfall
Boring number and depth of piezometer tip
#8, 12.0ft
#21, 23.4 ft
#103, 5.8ft
Note: Depth to water in boring 103 has NOT been corrected for the inclination of the boring
300 400 500 600 700 800 900
TIME, IN DAYS; DAY 1 IS JANUARY 1,1989
Figure 25. Response of selected open-tube piezometers outside but near the head of the landslide. Piezometerlocations shown in figure 21. Additional piezometer responses can be found in Baum and others (1991).
52

Ift u>
100
200
300
400
FE
ET
I
I I
I10
0 0
I ....
I CO
NT
OU
R I
NTE
RV
AL
2 F
EE
TD
AT
UM
IS
ME
AN
SE
A L
EV
EL
EX
PLA
NA
TIO
N
Pie
zom
eter
has
larg
e (g
reat
er th
an
3 fe
et)
resp
onse
dur
ing
or fo
llow
ing
rain
fall
D
Pie
zom
eter
has
sm
all
(1 t
o 3
foot
) re
spon
se d
urin
g or
follo
win
g ra
infa
ll
O
Pie
zom
eter
rem
ains
rel
ativ
ely
stea
dy (
less
than
1 f
oot f
luct
uatio
n)
A
Pie
zom
eter
mos
tly d
ry
v
Pie
zom
eter
dry
NO
RT
H
Figu
re 2
6. M
ap sh
owin
g th
e di
strib
utio
n an
d re
spon
se p
atte
rns
of p
iezo
met
ers
with
tips
at d
epth
s be
twee
n 30
and
60
feet
Res
pons
e pa
ttern
s de
scrib
ed fu
rther
in ta
ble
6.

Xo
u.Z
LU U_
ccLU
e0. LU O
-5
*10
-15
-20
\/\
V \
Dry
w^AJkjLjLJHab«
Dry
Dry
v] ! 1
Rainfall
Boring number and depth of piezometer tip
-- #100,10.1ft
#108,19.4ft
Note: Depth to water in borings #100 & 108 has NOT been corrected for the inclination of the boring
200 300 400 500 600 700 800 900
TIME, IN DAYS; DAY 1 IS JANUARY 1,1989
Figure 27. Response of open-tube piezometers in bedrock upslope of the landslide. Piezometer locations shown figure 21. in
54

Movement of Ground Water
Ground-water flow paths within the landslide are controlled by the hydraulic gradients in the materials and by the layering or anisotropy of the material hydraulic properties. Because of the heterogeneity in hydraulic properties, ground-water flow may be complex and vary locally in both direction and velocity. In general, however, ground water within the landslide moves downslope along steeply descending flow paths in predominantly saturated conditions (fig. 20). Ground water moves vertically downward from the predominantly saturated landslide to unsaturated materials or materials with low pressure heads beneath the basal slip surface. About one-fifth of the water discharges from the landslide along its downslope boundary; the remainder discharges through the basal slip surface.
All vertical components of the hydraulic head gradient between saturated shallow and deep piezometers in the same boring indicate downward ground-water flow, except for nest 19-19x in the toe of the landslide where the component indicates upward flow (table 7). Downward gradients increased in piezometer nests 1 and 9 following rainy periods (compare March 22,1991 values to August 14,1990 values) indicating recharge from the ground surface. Vertical hydraulic gradients between saturated materials above and unsaturated materials below were large, with values more negative than -1.0. Only piezometer nest 1 occasionally showed a reversal of gradient, from downward flow to upward flow during the early times of rainy periods. This may have been due to leakage from water flowing in the large annular space around the large diameter caisson at nearby boring 1-5. The downslope component of the hydraulic gradient between saturated downslope and upslope piezometers located within the landslide indicated a persistent downslope component of ground-water flow (table 7).
The downward movement of ground water may be reflected in the time lag seen in piezometer response with depth following rainstorms. This lag is most apparent in transducer nest 1-4 where transducer response at a depth of 58 ft occurs about 5-12 days following the transducer response at a depth of 20 ft (STV/Lyon Associates, 1990 and unpub. data).
We estimated the average annual ground-water discharge from the landslide by vertically downward flow and downslope flow by assuming steady Darcian flow:
(2)
where Q is the ground-water discharge, A is the cross-sectional area that ground water flows through, Ks is the saturated hydraulic conductivity, and dh/dl is the hydraulic gradient. The cross-sectional areas, saturated hydraulic conductivities, and hydraulic gradients differ between downward ground-water flow and downslope ground-water flow (table 8). Flow is assumed to occur through saturated, layered landslide materials with a thickness of 25 ft and a slope of 9 degrees. The equivalent vertical saturated hydraulic conductivity, Ky, for a layered material is approximated as (Freeze and Cherry, 1979, p. 34):
(3)
1*1
55

Table 7. Hydraulic gradients between piezometer tips on selected days.
[Piezometer nest denotes boring number with depth of tips in parentheses; Hydraulic gradient is the hydraulic head difference divided by distance between piezometer tips; Inclination is the inclination between tips; Ground slope is ground surface slope between piezometers.]
Piezometer nest
Vertical gradients1 (13.2) to 1( 25.5)
3 (5.0) to 3 (30.0)
9 (8.6) to 9 (25.1)
4 (20.2 to 4 (39.5)
5 (5.7) 5 (34.4) 13 (12.0) 13 (32.1)14 (9.4) to 14 (21.9)16 (15.4) to 16 (20.7)19x (5.4) to 19 (14.4)
Downslope Gradients1 (13.2) to 14 (9.4)
14 (9.4) to 13 (12.0)
13 (12.0) to 5 (5.7)5 (5.7) to 19 (14.4)
overall 1 (13.2) to 19 (14.4)
Hydraulic gradient- (8/14/90) (3/22/91)
-0.032
-0.58
-0.27
-1.87 1
-1.12 1
-1.22 1
-1.00
-0.16
0.026
-0.0144
-0.192
-0.162
-0.108
-0.130
-0.043
-0.61
-0.49
-1.88 1
-1.05
-1.161
-1.05
-0.26
0.026
-0.0633
-0.193
-0.169
-0.110
-0.143
Inclination (degrees)
90.0
90.0
90.0
90.0
90.0
90.0
90.0
90.0
90.0
0.3
13.5
6.5
8.2
8.2
Ground slope (degrees)
0.0
0.0
0.0
0.0
0.0
0.0
0.0
0.0
0.0
2.0
12.5
9.7
6.0
8.1
1Minimum gradient, because deeper piezometer was dry
56
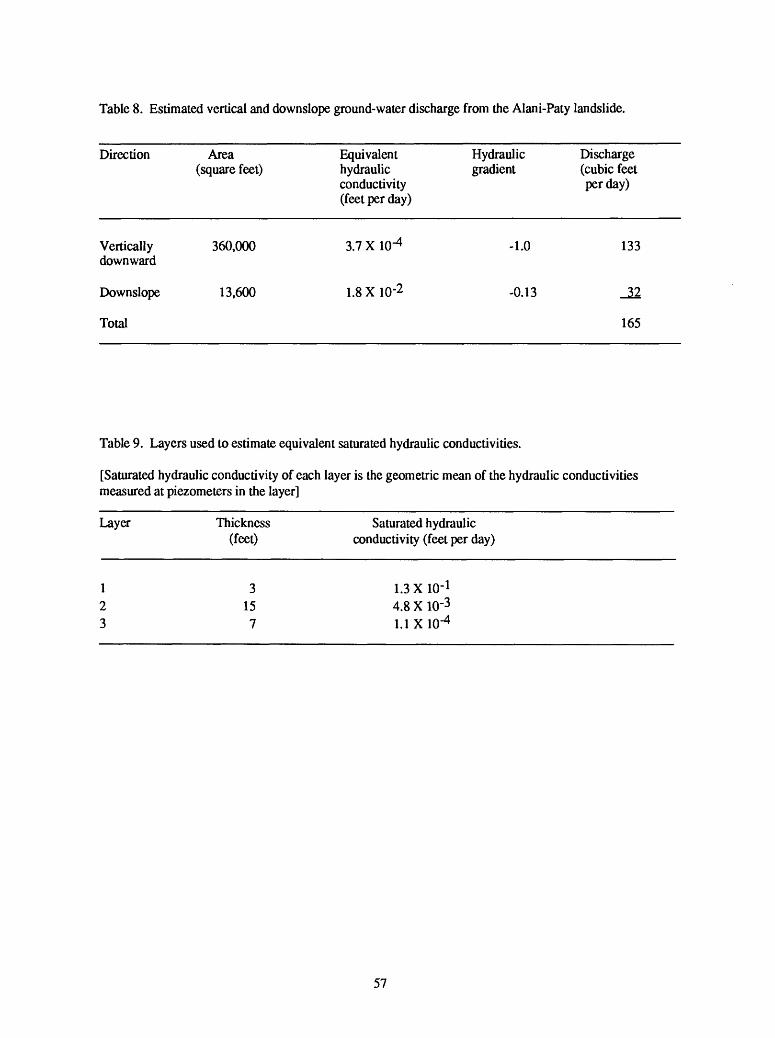
Table 8. Estimated vertical and downslope ground-water discharge from the Alani-Paty landslide.
Direction
Vertically downward
Downslope
Total
Area (square feet)
360,000
13,600
Equivalent hydraulic conductivity (feet per day)
3.7 X 10"4
1.8 X 10'2
Hydraulic gradient
-1.0
-0.13
Discharge (cubic feet per day)
133
^2
165
Table 9. Layers used to estimate equivalent saturated hydraulic conductivities.
[Saturated hydraulic conductivity of each layer is the geometric mean of the hydraulic conductivities measured at piezometers in the layer]
Layer Thickness (feet)
Saturated hydraulic conductivity (feet per day)
3157
1.3 X10' 1
4.8 X 10'31.1 x ur4
57

where d is the total vertical thickness, d{ is the vertical thickness of layer j, and K\ is the hydraulic conductivity of layer i, and N is the number of layers. The equivalent downslope conductivity, KD, is approximated as (Freeze and Cherry, 1979, p. 34):
i=N is I£-r (4)i=l *
where / is the total thickness normal to the slope and /; is the thickness (normal to the slope) of layer /. For this analysis, the materials are composed of the three layers shown in table 9 with the mean conductivities for different depths shown in figure 14. Any other anisotropic effects are ignored.
Using these methods and ignoring surface spring discharge and evapotranspiration, total ground-water discharge from the landslide is estimated as about 165 ft3/d (cubic feet per day) (table 8). Although the Darcian flow velocity, -Ks(dh/d[), within the landslide is larger in the downslope direction than vertically downward (fig. 20 and table 8), the ground-water discharge downward is larger because the horizontal area of the landslide is much greater than the cross-sectional area. Most of the natural drainage, responsible for the gradual decrease in pore pressures in the upslope quarter of the landslide during dry periods, appears to occur by ground water flowing vertically downward through the basal slip surface.
Although ground water occurs intermittently in the bedrock upslope of the landslide, several observations indicate that ground-water flow from bedrock into the landslide materials is minor and probably insignificant: 1) the piezometer response pattern near the bedrock contact; 2) the large hydraulic conductivity contrast between the bedrock and the debris-apron deposits; and 3) the distance between the bedrock contact and the basal slip surface.
Piezometers near the bedrock/debris-apron deposit contact indicate that a saturated hydraulic connection between the bedrock and the head of the landslide does not exist in the Paty Extension area (fig. 28). During and following rainfall, pressure heads increased in the piezometer in boring 100 located in the perched ground water in the bedrock. However, the nearby downslope pressure transducer at boring 29, located just above the bedrock contact, recorded zero pressure head during most storms. Only during the very large rains of March 1991 did this transducer show a pressure head rise of about 1.5 ft for very brief intervals (fig. 29). Farther downslope, the deeper piezometer (at a depth of 30 ft) in boring 20, below the active basal slip surface and above the bedrock contact, remained consistently dry. In contrast, the middle piezometer (at a depth of 21.5 ft) in boring 20, just above the active basal slip surface, was always wet and responded following rainfall (fig. 22).
Ground-water movement between the landslide and deeper materials has a component downward toward the bedrock, rather than upward from the bedrock. Downslope of boring 20, the bedrock contact becomes progressively deeper beneath the basal slip surface. All deep piezometers in debris-apron deposits (table 6, groups 4 and 5) have total hydraulic heads less than those measured in piezometers within the landslide (table 6, group 2).
Because the hydraulic conductivity of the bedrock appears to be generally larger than that of the landslide material and debris-apron deposits (fig. 14), little lateral ground-water flow from the bedrock into the deposits would be expected during the time when perched ground water in the bedrock occurs. Instead, ground-water flow within the bedrock would be dominantly downward.
Finally, the rapid pressure increases observed in some piezometers during rainstorms are facilitated by a short distance between the pressure source and the piezometer. Only three percent of the basal slip surface is closer to the bedrock contact than to the ground surface (fig. 3) and the pressure transducers showing rapid response to rainfall bursts (fig. 23) are much closer to the ground surface than to the bedrock contact. On the basis of these different observations, ground-water flow from bedrock into the landslide appears insignificant.
58

A"
UJ § 25 1 UJ O
ffi
40
0
30
0-
200 -
100
100
Pie
zom
eter
abo
ve b
asal
slip
su
rfac
e al
way
s w
et a
nd r
espo
nds
durin
g ra
iny
perio
ds
Pie
zom
eter
in
bedr
ock
resp
onds
du
ring
rain
y pe
riods
Pie
zom
eter
abo
ve b
edro
ck c
onta
ct
only
res
pond
s br
iefly
dur
ing
very
la
rge
rain
stor
ms
EX
PL
AN
AT
ION
W
et p
iezo
met
er t
ip
O D
ry o
r m
ostly
dry
pie
zom
eter
tip
i______I_
_____|
Gro
und
surf
ace
Pie
zom
eter
bel
ow b
asal
slip
sur
face
an
d ab
ove
bedr
ock
cont
act
alw
ays
dry
Bas
al s
lip s
urf
ace
Deb
ris-fa
n de
posi
ts
Hyd
raul
ic g
radi
ent
betw
een
thes
e tw
o p
iezo
met
ers
alw
ays
dow
nwar
d
05
010
0 fe
et
Figu
re 2
8. C
ross
sec
tion
A-A
" th
roug
h th
e he
ad o
f the
Ala
ni-P
aty
land
slid
e ne
ar P
aly
exte
nsio
n, s
how
ing
piez
omet
er r
espo
nses
. Lo
catio
n of
cro
ss s
ectio
n A
-A"
show
n on
pla
te 4
.
59

0.40 _ Depth of transducer tip
11.3 ft boring 22
11.Oft boring 24
9.0 ft, boring 29
0.00IO CD h- 00 O> O
TIME, IN DAYS SINCE 12:00 A.M. (MIDNIGHT) MARCH 1, 1991
Figure 29. Response of shallow pressure-transducer piezometers during March 1991 rainstorms. After initial pressure response, responses occur within hours following high intensity rainfall bursts. Piezometer locations shown in figure 21.
60

Average Recharge of Ground Water
Rainfall is the dominant source of water in the hydrologic system of the landslide. Mean annual rainfall on the landslide, estimated from rainfall maps of Oahu, is about 70 to 80 in. (Giambelluca and others, 1986). Although no rain gages with a long period of record exist on the Alani-Paty landslide, three gages with long periods of record are located nearby (table 10). During calendar year 1990, the shorter period-of-record at the USGS tipping bucket rain gage, located on the slide, recorded 80.83 in. (Baum and others, 1990,1991).
Average annual ground-water recharge for a medium-density urban area on Oahu, such as the landslide, receiving about 79 in./yr of rain is about 39 in./yr or about 50 percent of the annual rainfall (Giambelluca, 1986). This average recharge includes some gain from urban irrigation and some loss to runoff and evapotranspiration (fig. 30) and is an average for many medium-density urban areas on Oahu. The water budget assumes that most of the rain falling on rooftops, sidewalks, and driveways runs onto adjacent soil and infiltrates. The landslide may have more runoff, and therefore less ground-water recharge, than that estimated in figure 30. Additional runoff may be caused by locally steep slopes and by the diversion of rain falling on some rooftops and driveways into storm drains. Contributions from other sources such as infiltration of upslope runoff are not included in this water budget. Average ground-water recharge using the value shown in figure 30 is about 3200 ft3/d for the entire landslide. This value may be an overestimate because of additional runoff. However, annual ground-water recharge on Oahu is some fraction of the annual rainfall, typically about one-third (Giambelluca, 1986).
The average annual ground-water recharge over the landslide area estimated using water budget methods is about 20 times greater than the estimated total average annual ground-water discharge from the slide, shown in table 8. This discrepancy suggests either or both of the following sources of error: (1) that the average large-scale hydraulic conductivity of the landslide may be greater than the equivalent conductivities shown in table 8, which were computed from single well tests (geometric means listed in table 9).or (2) that the average ground-water recharge estimated using methods of Giambelluca (1986) may be too large.
Hydrologic Response During Rainstorms
Although ground water is present in the landslide year-round, the landslide moved downslope only during rainy periods. During large rainstorms water infiltrates downward into the landslide materials from soil-covered regions on the ground surface. This water may come from: 1) rain falling directly on the soil surface; 2) runoff of rain falling on the drainage basin upslope of the landslide and flowing onto soil; and 3) runoff from rain falling on pavement and rooftops on and near the landslide and flowing onto soil. Because of the large downward hydraulic gradient, vertical infiltration into unsaturated materials can occur at a rate faster than the saturated hydraulic conductivity of the material (fig. 31 A). However, if the application rate (from rainfall or adjacent runoff) is larger than the saturated hydraulic conductivity, the materials near the ground surface will eventually become saturated and water will start ponding on the ground surface (fig. 3IB). On a sloping surface, this water from incipient ponding will create surface runoff. With continued application of water, infiltration occurs until the wetting front reaches the water table and the materials become saturated (fig. 31C.). Both vertical and downslope flow in the layered landslide materials increase after infiltrating water reaches the water table. Thus, a region within the landslide receives water from both vertical infiltration and downslope flow from the adjacent upslope materials. During periods of intense rainfall, pore pressures rise rapidly and the water table approaches the ground surface (fig. 3ID). Without continued application, the near-surface materials will become unsaturated again because of drainage and evapotranspiration (fig. 3 IE). The following sections describe the surface runoff, infiltration, and ground-water response occurring on and within the landslide during rainstorms.
61
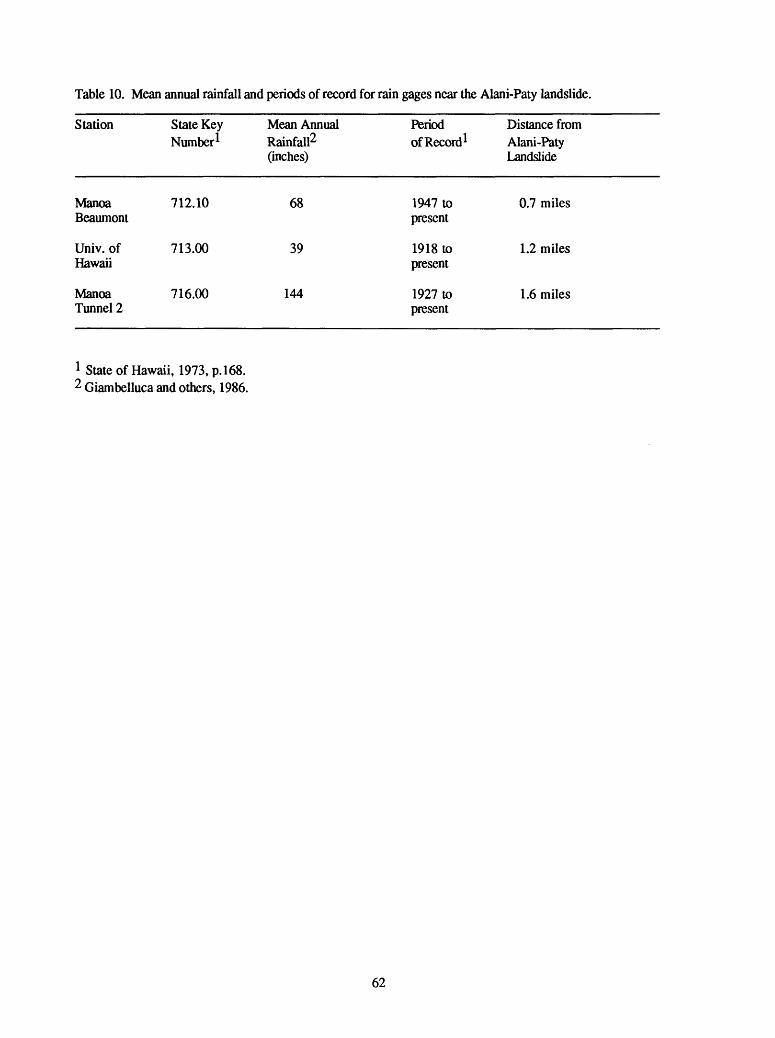
Table 10. Mean annual rainfall and periods of record for rain gages near the Alani-Paty landslide.
Station
Manoa Beaumont
Univ. of Hawaii
Manoa Tunnel 2
State Key Number^
712.10
713.00
716.00
Mean AnnualRainfall2 (inches)
68
39
144
Period of Record*
1947to present
1918to present
1927to present
Distance from Alani-Paty Landslide
0.7 miles
1.2 miles
1.6 miles
1 State of Hawaii, 1973, p. 168.2 Giambelluca and others, 1986.
62

u>
o
o\
a If
C*
H,
8 ?
"H-»
vo g
c
oO
9
c/5
o 3 O S- c
3 8 < 5" CfQ
RA
INF
ALL
UR
BA
N I
RR
IGA
TIO
N
RU
NO
FF
EV
AP
OT
RA
NS
PIR
AT
ION
GR
OU
ND
-WA
TE
R R
EC
HA
RG
E
cr

rain
fall
grou
nd s
urfa
ce
^S
iSS
gjig
lx':;
basa
l sl
ip s
urfa
ce
A.
On
set
of
rain
fall
B.
Inci
pie
nt
pond
ing
and
surf
ace
run
off
C.
Sat
ura
tio
n d
urin
g ex
ten
ded
rai
nfa
llD
. P
eak
pre
ssu
res
du
rin
g
rain
fall
burs
tsE.
D
rain
age
bet
wee
n
rain
sto
rms
Tim
e
Figu
re 3
1. S
chem
atic
dia
gram
sho
win
g th
e ra
infa
ll in
filtra
tion
proc
ess d
urin
g ex
tend
ed ra
iny
perio
ds.
Larg
e ar
row
s in
dica
te g
ener
aliz
ed d
irect
ions
of w
ater
flow
. Th
e de
pth
to th
e w
ater
tabl
e is
Z2 a
nd th
e de
pth
of th
e w
ettin
g fr
ont i
s z\
.
64

Surface Runoff
During and following large rainstorms, both surface runoff from the steep drainage basin above the landslide and urban runoff on the landslide can infiltrate into the landslide mass. Above the landslide, the drainage basin of about 16.8 acres is primarily underlain by basaltic bedrock with a thin discontinuous cover of weathered residuum and colluvium. The drainage basin contains two distinct gullies that channel ephemeral surface flow (fig. 32). One gully is located upslope of Paty Extension, the other upslope of the Alani-Paty curve.
Field observations during the large rainstorms of November and December 1990 and March 1991 indicate that surface flow in these gullies occurs during and immediately following large rainy periods. No flow was visible during lower intensity rainfall and it is likely that lower intensity rainfall infiltrates directly into the surficial deposits and bedrock underlying the drainage basin. In 1990, the USGS installed a stage recorder on the concrete channel between 3115 Kahaloa Drive and 3037 Kahaloa Place. This channel carries runoff from the drainage basin upslope from Paty Extension (fig. 32). Attempts to directly gauge the runoff at this site were unsuccessful because the channel was too steep. Mean annual runoff from larger drainage basins nearby ranges from 20 to 35 percent of the mean annual rainfall (Mink, 1962; Shade, 1984). During shorter period cyclonic storms, runoff can be as much as 40 percent of rainfall (Mink, 1962).
Most of the runoff generated from the drainage basin upslope of the slide, including both gully systems, appears to be collected by storm drains near the head of the landslide. Upslope of Paty Extension, surface runoff flows off bedrock onto Paty Extension and is diverted into a storm drain (fig. 32). Above the Alani-Paty curve, some of the surface runoff is diverted into a cement channel and enters a storm drain on Paty Extension. A series of unlined wooden walls attempts to capture the remainder of the runoff and divert it, via pipes, to storm drains on Paty Drive (fig. 32). Field observations during rains on December 19,1990 indicate that some of these wooden devices allowed water to infiltrate before reaching the downslope drainage pipes. Water infiltrating from these devices near the head of the landslide may flow downslope into the landslide.
Urban runoff from rooftops, streets, and driveways, which together cover about 49 percent of the landslide area, flows both onto adjacent soil, where it may infiltrate, and into city streets, where it may flow into storm drains. In addition, some urban runoff from up valley of the landslide reaches Paty Drive and flows into storm drains located on the slide.
Infiltration
During rainstorms, rainfall and surface runoff infiltrate into soil covered areas of the slide. Pressure responses collected by J. Torikai (unpub. data) at 3102 Alani Drive during the March 1991 rains illustrate the infiltration process. Data were collected using nests of tensiometers that measured near-surface unsaturated soil tensions and deeper nests of tensiometers with bi-directional pressure transducers that measured both soil tensions and positive pressure heads. Pressure transducer responses were recorded at 15 min intervals by a datalogger.
Prior to rainfall, contours of equal hydraulic head showed predominantly downslope ground-water flow with a water table 3-10 ft beneath the ground surface (fig. 33A). Pressure heads in the unsaturated materials were about -0.6 to -0.8 ft relative to atmospheric pressure (fig. 34). About 1 to 2 days after rainfall began, the tensiometers and deeper piezometer showed a rapid increase in pressure with the negative pressures becoming positive and the water table rising. The shallow tensiometer responded first, and there was a downward hydraulic gradient in the nest. Ground-water flow was predominantly downslope (with a small downward component) in the saturated zone and vertically downward in the unsaturated zone (fig. 33B). During the rainy period, the tensiometers measured positive pressures (indicating saturation of the materials) and small pressure increases within a few hours of intense bursts of rainfall (fig. 34). Also during this rainy period, the shallow near-surface tensiometers indicated saturated conditions, and runoff on the soil surface was observed.
65

Approximate boundary of ' watershed upslope of Alani- / Paty landslide j X.,^ I
Explanation
-» intermittent surface flow path
storm drain
pipe or concrete channel
-/ collection structure
O stage recorder
Approximate boundary of the Alani-Paty landslide
100 200 feet
Figure 32. Map showing approximate locations of drainage basin boundaries, intermittent surface flow paths, and diversion structures upslope of the Alani-Paty landslide.
66

E'
T1
UJ_j
S 320- z.<UJ2UJ
I 315-< z. g<"i -^m
= "^ ,. _ j 32U.b ^
/ "^^^ie ^ajoT^
/ ^^-*N/ XX-::nO o.X x- '
<Vk v^ ^
-\^
1 \.315.8 ^,-
^**"" '
^-' 7*"~
T /318.0 ^^
^-^^
^\
313.3 \
v^
JT O
0>
0) 0)roc2 a
A. March 5, 1991 12:15 am
325-
S 320-
T3
T1
B.10 FEET
March 7, 1991 1:00 pm
EXPLANATION
Approximate lines of equal hydraulic head, interval 2 feet
321.4 Measured hydraulic head, in feet
T1 Tensiometer instrument nest
Figure 33. Cross section E-E' through part of 3102 Alani Drive showing hydraulic head distribution (data and contours after J. Torikai, unpublished data). (A) Distribution on March 5, 1991, before rain. (B) Distribution on March 7, 1991, during rain. Rainfall shown in figure 34. Location of cross section E-E' shown on plate 1.
67
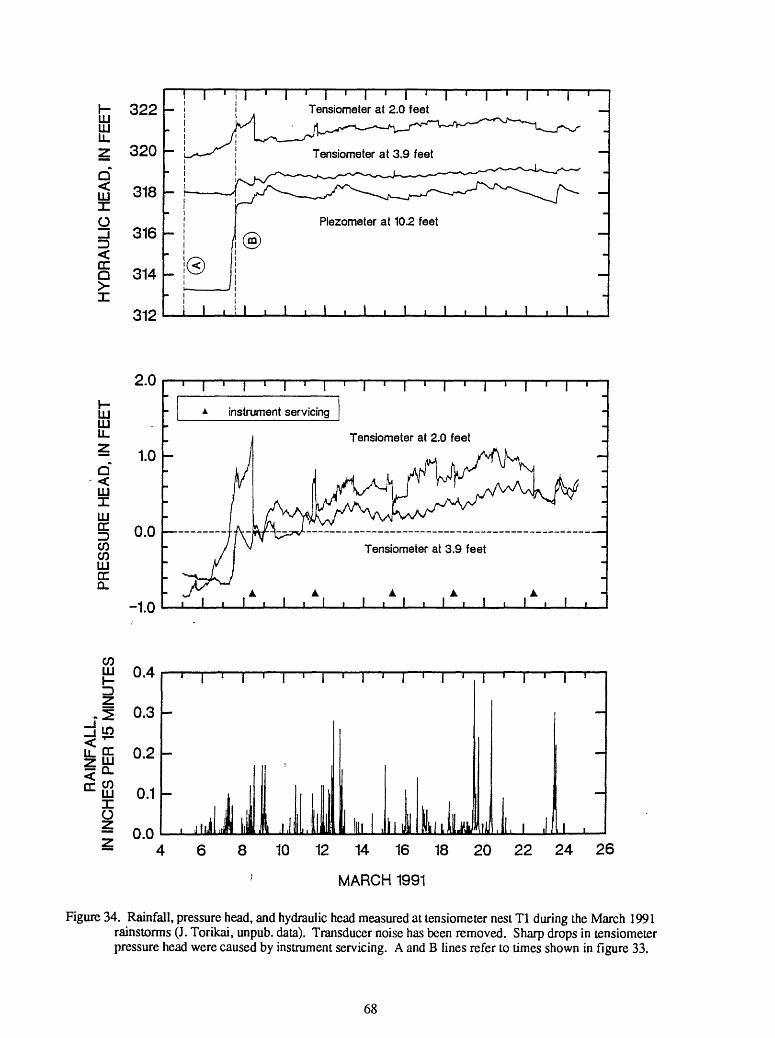
LJJ LJJ LL
Q ujX
322
320
318
316
Q 314
312
r^j i | i j i
Tensiometer at 2.0 feet
UJ UJ LJ_
- 1.0
UJ
UJrrIDCO CO UJDC Q.
0.0
-1.0
, , , I
instrument servicing
Tensiometer at 2.0 feet
CO LLJ 0.4
Z)
.1 0.3=J£?£ 0.2<£^ffl 0.1
Xo 2 nn
1 I ' 1 ' i
-
: ill'i, , J J II ,i,ll
1 I ' I
111Jll Mil
1 1 ' 1 ' 1
iimy J,
i | I | i
, 1 J,
~
_
1 .
8 10 12 14 16 18
' MARCH 1991
20 22 24 26
Figure 34. Rainfall, pressure head, and hydraulic head measured at tensiometer nest Tl during the March 1991 rainstorms (J. Torikai, unpub. data). Transducer noise has been removed. Sharp drops in tensiometer pressure head were caused by instrument servicing. A and B lines refer to times shown in figure 33.
68
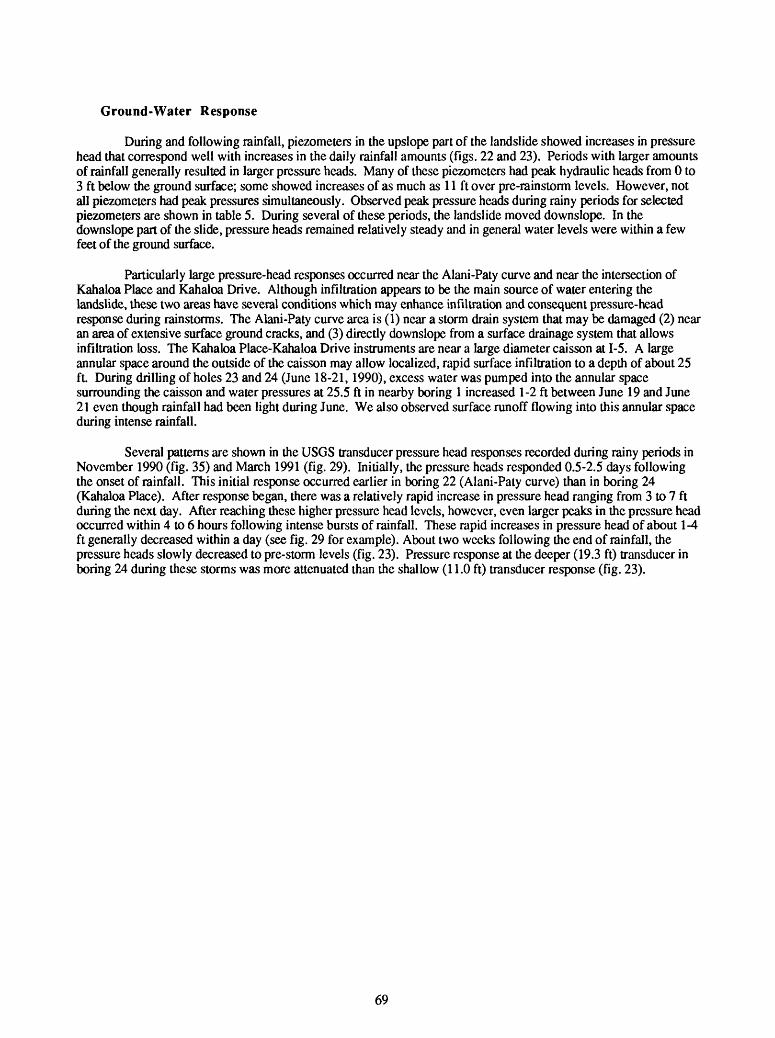
Ground-Water Response
During and following rainfall, piezometers in the upslope part of the landslide showed increases in pressure head that correspond well with increases in the daily rainfall amounts (figs. 22 and 23). Periods with larger amounts of rainfall generally resulted in larger pressure heads. Many of these piezometers had peak hydraulic heads from 0 to 3 ft below the ground surface; some showed increases of as much as 11 ft over pre-rainstorm levels. However, not all piezometers had peak pressures simultaneously. Observed peak pressure heads during rainy periods for selected piezometers are shown in table 5. During several of these periods, the landslide moved downslope. In the downslope part of the slide, pressure heads remained relatively steady and in general water levels were within a few feet of the ground surface.
Particularly large pressure-head responses occurred near the Alani-Paty curve and near the intersection of Kahaloa Place and Kahaloa Drive. Although infiltration appears to be the main source of water entering the landslide, these two areas have several conditions which may enhance infiltration and consequent pressure-head response during rainstorms. The Alani-Paty curve area is (1) near a storm drain system that may be damaged (2) near an area of extensive surface ground cracks, and (3) directly downslope from a surface drainage system that allows infiltration loss. The Kahaloa Place-Kahaloa Drive instruments are near a large diameter caisson at 1-5. A large annular space around the outside of the caisson may allow localized, rapid surface infiltration to a depth of about 25 ft During drilling of holes 23 and 24 (June 18-21,1990), excess water was pumped into the annular space surrounding the caisson and water pressures at 25.5 ft in nearby boring 1 increased 1-2 ft between June 19 and June 21 even though rainfall had been light during June. We also observed surface runoff flowing into this annular space during intense rainfall.
Several patterns are shown in the USGS transducer pressure head responses recorded during rainy periods in November 1990 (fig. 35) and March 1991 (fig. 29). Initially, the pressure heads responded 0.5-2.5 days following the onset of rainfall. This initial response occurred earlier in boring 22 (Alani-Paty curve) than in boring 24 (Kahaloa Place). After response began, there was a relatively rapid increase in pressure head ranging from 3 to 7 ft during the next day. After reaching these higher pressure head levels, however, even larger peaks in the pressure head occurred within 4 to 6 hours following intense bursts of rainfall. These rapid increases in pressure head of about 1-4 ft generally decreased within a day (see fig. 29 for example). About two weeks following the end of rainfall, the pressure heads slowly decreased to pre-storm levels (fig. 23). Pressure response at the deeper (19.3 ft) transducer in boring 24 during these storms was more attenuated than the shallow (11.0 ft) transducer response (fig. 23).
69

0.40
0.35
V)LUXoz
0.30
0.25
0.20
DC LU \-
Z
0.15
in 0.10
0.05
0.00
11.0 ft, boring 24
11.3ft, boring 22
10 11 12 13 14 15 16 17 18 19 20 21 TIME, IN DAYS SINCE 12:00 A.M. (MIDNIGHT) NOVEMBER 1, 1990
12
11
10
9
8
6
5 §HI
DC3 I2 LU
CC1 °-
0
-1
-2
-3
22
Figure 35. Response of shallow pressure-transducer piezometers within the landslide during November 1990rainstorms. Time lag of 0.5 to 2.5 days occurred between the onset of rainfall and initial pressure response. Piezometer locations shown in figure 21.
70

Analysis
Simple analyses demonstrate that the infiltration of rainfall and runoff during extended rainy periods is sufficient to explain the saturation or near-saturation of the landslide materials during rainy periods and the one-to- two-day lag between the onset of rainfall and the pressure response at depth within the landslide. After the landslide materials are saturated or nearly-saturated, pressure transmission of water infiltrating at the ground surface during intense bursts of rainfall is sufficient to cause the observed rapid pore pressure responses at depths equal to the thickness of the landslide.
Enough rain falls during most storms to completely fill the available porosity in the materials above the water table, provided ground-water discharge and evapotranspiration are relatively minor during the storm. For an unsaturated thickness of 7 ft (typical of the upslope one-fourth of the landslide prior to extended rainfall), the total amount of water required to fill the available porosity ranges from about 0.17 to 5.46 in. (table 11). Many observed storms have rainfall in excess of this amount (see table 5 for examples).
Infiltration of water from the ground surface is capable of explaining most of the observed lag between the onset of extended rainfall and the pore pressure response at depth. Given a constant 0.1 in./h (inches per hour) rainfall intensity, the estimated times for a saturated wetting front to infiltrate 7 ft to the water table encompasses the observed lag time of about 1 to 2 days (fig. 36). To estimate these lag times, we divided infiltration into two phases: 1) complete infiltration of all rainfall before incipient ponding and 2) partial infiltration of the rainfall and partial surface runoff after incipient ponding. Given a constant rainfall intensity larger than the saturated hydraulic conductivity of a homogeneous, isotropic soil, incipient ponding and surface runoff occurs after an elapsed time of:
where tp is the time to incipient ponding, 0yis the fillable porosity of the soil, Ks is the saturated hydraulic conductivity of the soil, he is the effective pressure head of the soil, and ry is the rainfall intensity (Bouwer, 1978). During this time, the wetting front advances to a depth z\, below the ground surface of:
89
After this time, some infiltration continues to occur with a steady zero pressure head condition at the ground surface. Given this condition, the elapsed time, tDt for a wetting front to advance vertically downward to a depth, D, was estimated using a Green-Ampt analysis (Bouwer, 1978):
71

Table 11. Amount of rainfall required to saturate a seven foot thickness of landslide material.
[Tillable porosity estimated assuming saturated moisture content equals 0.26. The saturated moisture content is defined as volume of water divided by total volume of saturated soil]
Initial Tillable Rainfall moisture porosity (inches) content
dry 0.195 0.065 5.46 wet 0.258 0.002 0.17
72

cc occLLIQ_CO LLI
O
O
O O
O
10
-irk Q 10
Q LLI
CC
co
'3
Near-surface soil
(Approximate range of observed time lags)
Intermediate d< jpth deposits
I
12 24 36 48 60
TIME SINCE ONSET OF RAINFALL, IN HOURS
72
Figure 36. Simulated time for a wetting front to infiltrate 7 ft vertically through homogeneous materials using a Green-Ampt analysis (equations 5, 6, 7, and 8) and assuming the following parameters: ry= 0.1 in./hr, he 11.8 in.; 6y= 0.002 for wet initial conditions with a soil tension of about -0.7 ft; and two different Ks values, 0.065 in./hr (near-surface soil) and 0.0024 in./hr (upper debris-apron deposits). The approximate range of observed lag time between the onset of rainfall and pressure response in shallow piezometers is indicated between the dashed lines.
73

The total time from the onset of steady rainfall for a wetting front to advance to the water table at a depth, 22, is:
(8)
where tz* and tZl are the times for a wetting front to advance to depths 22 and zi, respectively, with a constant zero pressure head at the ground surface. The values of tz~ and tz * are determined by substituting 22 and z\, respectively, into equation 7. Note that tj will be greater than fZ2 -
After the materials are saturated or tension saturated during extended rainy periods, the observed rapid pressure responses within the landslide may be the result of the transmission and attenuation of rainfall-induced oscillating flux at the ground surface. The attenuation of a sinusoidal oscillating pressure signal (in this situation approximating flux) through a homogeneous, isotropic saturated porous material can be estimated using a one- dimensional vertical diffusion model (Carslaw and Jaeger, 1959; Todd, 1980). Here, the oscillating signal represents oscillating bursts of intense rainfall infiltrating at the ground surface. Solutions to this model give an amplitude of the pressure fluctuation, p, at a depth x from the signal source of:
(9)
where PQ is the pressure of the original signal, Ss is the specific storage of the material, IQ is the period of the oscillation, and Ks is the saturated hydraulic conductivity of the material. The time lag, IL, between the oscillating source signal and the pressure response at depth is given by:
(10)
Similar solutions have been used to analyze the pressure response to rainfall in other landslides (Iverson and Major, 1987; Haneberg, 1991).
Using this model, the estimated pressure response and time lag at depth are similar to that observed (figs. 37 and 38) and indicate that pressure transmission from oscillating rainfall bursts is sufficient to cause the rapid pressure responses observed during extended rainy periods with intense rainfall bursts. Scatter in the observed responses may be the result of locally varying hydraulic properties. The maximum value of the source signal, PQ, was equal to the hydrostatic pressure coincident with the ground surface and the analysis assumes that the transient signal from rainfall is superimposed on a background of a steady pressure distribution. The intense rainfall oscillation period was estimated as about one day, typical of rainy periods such as that recorded during the March 1991 storms (fig. 29).
74
DC Ou_ OH
LLI O DE LLI Q_
LLI DC D 03 03 LLI DC CLQ LLI
LLI
100
90
80
70
60
~ 50
40
30
20
10
Simulation with 1 day period
I Observed ranges piezometer boring number
10 20 30
DEPTH, IN FEET
Figure 37. Simulated and observed pressure attenuation with depth. Simulations assume an oscillating pressure signal with a period of one day at the ground surface and attenuation through a saturated, homogeneous material with Ks =.13 ft/d (the geometric mean of the near-surface soils) and Ss = 0.0005 fr 1 (estimated for a saturated clay with 25 to 50 percent cobbles and boulders). Observed values based on piezometer records from selected March 1991 rainstorms and estimated as the change in pressure at depth divided by the change in pressure at the ground surface.
75

14
12
10 -
o
S 8
LLI crr 6CO COLLIcc A a. 4
0
Simulation with 1 day period T" Observed range; piezometer boring number
10 20 30
DEPTH, IN FEET
Figure 38. Simulated and observed time lag in pressure response at depth from signal at ground surface.Simulations used same parameters as in figure 37. Observed values based on piezometer records from selected March 1991 rainstorms.
76

Thus, water enters the landslide primarily at the ground surface by infiltration of rainfall and surface runoff. Infiltration is sufficient to saturate the landslide during rainy periods and to create a 1 to 2 day lag between the onset of rainfall and pore pressure response. After the initial response, the landslide materials remain saturated and pore pressures can increase rapidly in response to the downward movement of pressure waves from the ground surface during intense rainfall.
MECHANICS OF THE LANDSLIDE
The low shear strength of silty clays from the basal slip surface and the high water pressures measured during wet periods when the landslide moved are consistent with sliding on the observed basal slip surface of the landslide. Baum and Reming (1991) performed stability analyses using cross section A-A' of the landslide and their best estimate of pore pressure at the slip surface based on measurements through April 1990. They computed a factor of safety of 0.99±0.04 assuming the following parameters: saturated unit weight of the landslide material, y/ = 138 lbf/ft3 ; cohesion for effective stress, c' = 128 lbf/ft2; angle of friction for effective stress, <j>' = 8°. These assumed values are consistent with the measured shear strength parameters for samples of silty clay from the basal slip surface of the landslide, which range from c1 = 40 to 139 lbf/ft2 and from $' = 6° to 10.9° (table 2). They repeated calculations over the range of uncertainty in the pore pressures (±3 ft) and depth of the slip surface (±5 ft at the ends, ±2 ft elsewhere) and determined that the factor of safety varied by only ±4 percent.
Preliminary stability analyses using the method of Fellenius (Lambe and Whitman, 1969) indicate low average strength for cross section B-B' also. Depth and water pressures for section B-B' have been measured only near the intersection of Alani Drive and Paty Drive. We used depths shown in figure 2B and plate 4. We estimated that pressure head at the slip surface might range from 15 to 18 ft beneath Paty Drive, 17 to 24 ft beneath the downslope edge of Alani Drive, and from 18 to 25 ft near mid length of section B-B'. Assuming these water pressures and depths, and constant <|)' = 12°, c' ranges from 80 to 160 lbf/ft2 , or assuming no cohesion, <|)' ranges from 14° to 16.5°. The greater average strength of section B-B' compared to section A-A' is consistent with the greater average slope of section B-B', about 12°, compared to the average slope of section A-A', about 9°.
Absorbed storm water triggers movement of the Alani-Paty landslide. The landslide moved on a few occasions during the period of monitoring, but most of the time it was stationary (Table 5). The episodes of movement appear to have occurred after periods of intense rainfall during storms that lasted several days. The absorbed water affected the landslide by increasing subsurface water pressures in the upslope part of the landslide (fig. 39) and by slightly increasing the driving force (the component of the weight acting parallel to the slip surface).
Elevated ground-water pressures help to trigger movement by decreasing the normal force across the basal slip surface of the landslide. Increases of water level/pressure head ranging from 1 to 11 ft were observed in piezometers and pressure transducers in the upslope forth of the landslide (table 6). We used measured water levels and pressures from various depths to estimate the pressure head that acted on the slip surface when the landslide was moving and when it was stationary during dry periods (fig. 39). The shearing resistance of the slip surface, I, decreases as the water pressure at the slip surface, u, rises (fig. 40). The shearing resistance is related to u and the total normal stress, <jn, according to Terzaghi's principle of effective stress, and the Mohr-Coulomb failure criterion (Lambe and Whitman, 1969),
I = c' + (an - «) tan (j)' , (11)
Using the increased water pressures, the estimated available shearing resistance in the upslope part of the landslide decreases approximately 3-13 percent, depending on the specific location, during wet periods. Shearing resistance in the downslope part of the landslide stays roughly constant because water pressures near the basal slip surface in the downslope part of the landslide appear to be steady throughout the year. The decreased shearing resistance in the upslope part of the landslide amounts to a 2-percent decrease in the total shearing resistance of the entire slip surface for the parameters assumed in our analysis (fig. 40). Repeating the calculations over the range of uncertainty in our data indicates that the decrease is between 2 and 5 percent.
77

2COuji-
LLJ
< z
QCu< > UJ_J UJ
LLJ
350300250200150
Ground surface
_ Slip surface. i . i . i . i
0 100 200 300 400 500 600 700 800 9001000
A.
Depth of slip surface - Lines connect best estimates, squares indicate upper and lower limits
0 100 200 300 400 500 600 700 800 9001000 HORIZONTAL DISTANCE FROM HEADSCARF, IN FEET
Figure 39. Measured depth of the basal slip surface and estimated water pressures at the slip surface in secdon A-A'. Numbers beside data points identify borings where depths and water levels were measured. Lines connect best estimates; upper and lower limits indicate the range of uncertainty in the estimates. (A) Depths are projected from borings near the line of section. Section A-A1 is shown above the graph for reference.
78

2C/DUJ H-> u* rl "Jg^< z
QQj
< in > -JUJ
UJ
350300250200150
Ground surface
0 100 200 300 400 500 600 700 800 900 1000
a
Dry-period pressure head
Wet-period pressure head
Lines connect best estimates, points off lines indicate probable range of values
0 A0 100 200 300 400 500 600 700 800 9001000
HORIZONTAL DISTANCE FROM HEADSCARF, IN FEET
Figure 39. (continued) (B) Pressure head at the basal slip surface estimated using pressure heads from several depths in the boring or borings n,ear the line of section. Section A-A 1 is shown above the graph for reference.
79
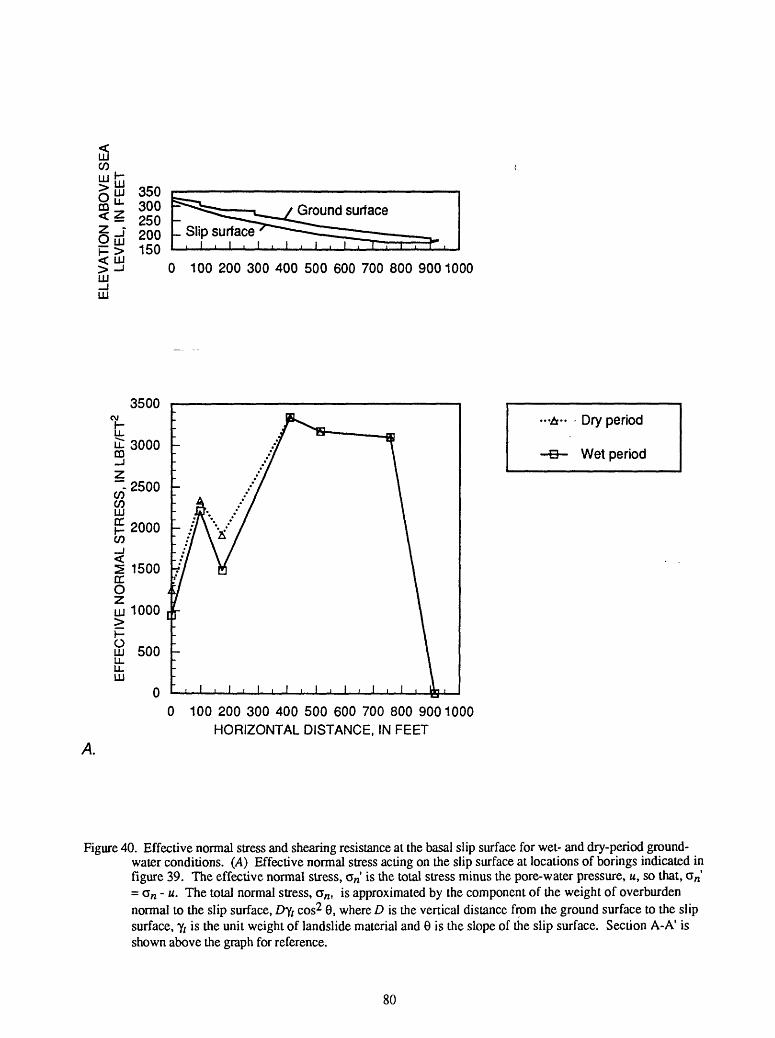
LLJ
< UJ> -JLU_iLU
350300250200150
Ground surface_ Slip surface
i.i.i
0 100 200 300 400 500 600 700 800 900 1000
3500
A.
Dry period
Wet period
100 200 300 400 500 600 700 800 9001000 HORIZONTAL DISTANCE, IN FEET
Figure 40. Effective normal stress and shearing resistance at the basal slip surface for wet- and dry-period ground- water conditions. (A) Effective normal stress acting on the slip surface at locations of borings indicated in figure 39. The effective normal stress, cn' is the total stress minus the pore-water pressure, u, so that, an' = Gn - u. The total normal stress, an , is approximated by the component of the weight of overburden normal to the slip surface, Dyt cos2 6, where D is the vertical distance from the ground surface to the slip surface, yt is the unit weight of landslide material and 6 is the slope of the slip surface. Section A-A' is shown above the graph for reference.
80

00
AV
AIL
AB
LE S
HE
AR
ING
RE
SIS
TA
NC
E,
IN L
BF
/FT
2
ELE
VA
TIO
N A
BO
VE
SE
A
LEV
EL,
IN
FE
ET
-* r
o ro
co
co
01 o
01 o
01
o o
o o
o
o
o ro
o
o CO o
o o
o Ol
o
o O) o
o o
o CO o
o CO o
o o
o
o
en
CD
xj
i I
I g

Water that fills tension cracks at the head of the landslide can increase driving force slightly. Water filling a 10-ft-deep crack that terminates at the basal slip surface in the head of the landslide exerts a horizontal force per unit width of about 3100 Ibf/ft (pounds-force per foot) against the head of the landslide. The downslope driving force per unit width is about 500,000 Ibf/ft for the Kahaloa element and 360,000 Ibf/ft for the Alani element. Thus, water in the cracks can increase the driving force by about .6-.9 percent. The water can also reduce the amount of cohesion mobilized on parts of the slip surface shallower than the cracks (Lambe and Whitman, 1969, p. 342-344); however, this reduction occurs on a minor pan of the slip surface and is insignificant
The weight of the water absorbed during storms increases the driving force insignificantly because the increased driving force is mostly offset by increased normal stress at the slip surface. The fillable porosity during the dry season is about 6.5 percent and the pressure head in the upslope quarter of the landslide increases 5-10 ft on average. If the entire landslide absorbs 0.5 ft (0.065 X 7.5 ft) of water during a wet period, the water would add 1.1 X 10' Ibf to the weight of the landslide. The weight of added rain would increase the driving forces that tend to destabilize the slope by about 1.7 X 10⁶ Ibf or 0.9 percent, based on the average thickness of 25 ft. However, the rain would also increase the total normal force by the same percentage, and increase the resistance from 0 to 0.9 percent depending on the relative contributions of cohesion and friction to the shear strength.
Changes in ground water pressures in the upslope quarter of the landslide control movement of the entire landslide. Adsorbed storm water triggers movement of the landslide mainly by reducing the shearing resistance of the upslope part of the slip surface. Increased pore pressures in the upslope part of the landslide reduces the shearing resistance of the upslope part by as much as 13 percent locally and the total shearing resistance by about 2 percent. Water filling cracks in the head of the landslide can augment the action of the increased pore pressures by increasing the driving force from 0.6 to 0.9 percent. The weight of the adsorbed water has a negligible effect because most of the increased driving force is balanced by increased normal force acting at the slip surface.
DIFFERENCES BETWEEN THE ALANI-PATY LANDSLIDE AND NEIGHBORING GROUND
Data from borings (6,7, 8,17,21,25, and 27) outside the boundaries of the Alani-Paty landslide indicate that materials and ground-water conditions differ from those in the landslide and areas of incipient movement. Most of these borings are near the head of the Alani-Paty landslide or on Puhala Rise, which is on the large fan next to the landslide (plate 6). In some of the borings (17,21, and 25) clayey silt was much more abundant than the silty clay that makes up most of the landslide. Clasts in a matrix of clayey silt were abundant in boring 7. Ground-water observations from borings 7,8 and 21 indicate that water pressures in non-sliding debris-apron deposits are much lower than water pressures in the landslide, and the water in the borings tends to drain quickly after storm events. The water table in boring 25 was about 10 ft below the ground surface. The material in boring 25 seemed to have a large hydraulic conductivity, because it is the only place where the auger displaced free water from the boring as it advanced below the water table. Thus, materials in the non-sliding areas near the head of the landslide and at Puhala Rise appear to be more permeable than most of the landslide material.
DISCUSSION AND CONCLUSIONS
Observations Relevant to Remediation of the Alani-Paty Landslide
Conditions leading to movement - The landslide was stationary during dry periods; it moved only during rainy periods when pore-water pressures were high in the upslope quarter of the landslide. The landslide moved small amounts after USGS monitoring began in September 1989. The head of the landslide moved small amounts during several intense storms (fig. 16 and table 5). Movement of the main body of the landslide was observed in January 1990 during a storm that lasted for several days (City and County of Honolulu, unpub. data). Inclinometer data indicate that the main body of the landslide also moved during a rainy period in March 1991 (STV/Lyon, Associates, unpub. data). Pore-water pressures were relatively high during both periods of movement and average rainfall for the previous ten days was greater at these two times than at any other during the period of observation (fig. 17).
82

Water perched near basal slip surface Water pressures at and above the slip surface are much higher than below the slip surface. Most of the piezometers and pressure transducers at depths from 0 to 30 ft stay wet year round and indicate pressure heads of several feet (table 6). Most of the piezometers and pressure transducers from 30 to 60 ft below the ground surface indicate pressures near zero (table 6). Materials near the basal slip surface have lower hydraulic conductivity than materials above or below, indicating that materials near the basal slip surface can perch ground water (fig. 13).
Sources of water ~ Water enters the landslide primarily from the ground surface. Hydraulic gradients indicate that ground water flow has a downward component in much of the landslide. Furthermore, shallow tensiometers and piezometers respond to rainfall more rapidly than deeper piezometers indicating downward movement of water within the body of the landslide during storms. Bedrock apparently plays a negligible role in delivering water to the landslide; bedrock is at or near only a small part of the basal slip surface and there appears to be no sustained saturated connection between bedrock and the landslide. Water slowly percolates downward through the slip surface into underlying materials and water pressures are generally low (near zero) beneath the basal slip surface, indicating a downward hydraulic gradient.
Upslope runoff -- The drainage basin upslope from the landslide contributes surface runoff that may enter the landslide. Field observations during storms indicate that runoff from the drainage basin upslope from the landslide may infiltrate into the landslide near the Alani-Paty curve. Much of the runoff from the drainage basin upslope from Paty Extension is channelized and diverted before it can infiltrate into the debris-apron deposits and landslide materials.
Variable water pressure in upslope quarter of landslide -- Water pressures in the upslope quarter of the landslide rise rapidly during rainy periods and fall gradually during drier periods. This pattern is evident in hydrographs of open tube piezometers and pressure transducers in the upslope quarter of the landslide (figs. 21,22, and 23). The gradual fall in pore pressures following a storm-induced peak indicates that the upslope quarter of the landslide has a form of natural drainage. Pore pressures in the downslope three-quarters of the landslide remain relatively steady. Consequently, most drainage of the upslope part of the landslide is probably downward into more permeable debris-apron deposits and bedrock beneath the landslide.
Upslope quarter of landslide controls movement The observed temporal variation of water pressures in the upslope quarter of the landslide, combined with the timing of movement of the landslide indicate that water pressures in the upslope quarter control movement of the entire landslide. Infiltration of runoff and rain falling directly on the landslide increases pore pressures in the upslope part of the landslide during rainy periods. The increased water pressures trigger movement by decreasing the effective stress (thus decreasing the shearing resistance) at the slip surface and by slightly increasing the downslope driving force (figs. 39,40). Water pressures in the downslope part of the landslide remain fairly steady throughout the year. Dry-period ground-water conditions appear to be adequate to halt movement of the landslide.
Enlargement of the landslide -- An area on the northeast side of Kahaloa Drive, adjacent to the landslide, moved during the period of observation. Deformation began at 3072 and 3080 Kahaloa Drive before January 1989. Deformation occurred between February and April 1989 at 3066 Kahaloa Drive. An inclinometer at the intersection of Kahaloa Drive and Lanikaula Street indicated movement at a depth of about 26 ft during January 1990.
Comparison of Findings with Previous Studies
Weak materials The landslide material is crudely stratified and the failure surface appears to be mainly in weak materials. Several samples of material from the basal failure surface were recovered during drilling. These samples consisted of plastic silty clays and sandy silty clays, and many contained slickensided surfaces. Drained direct shear tests on remolded samples having precut shear surfaces indicate that the samples from the slip surface have residual strength parameters ranging from (j)'r = 6° to (j)'r = 11° (table 2). Stability analysis using the observed thickness and observed water pressures indicates that the average strength parameters for the Kahaloa element of the Alani-Paty landslide (cross section A-A') are approximately c' = 128 lbf/ft2 and <j>' = 8° (Baum and Fleming, 1991). For the Alani element, c1 = 80-160 Ibf/ft2 and <j>' = 12°. The measured and calculated strengths are in agreement with the findings of Walter Lum Associates (1979) for the Waiomao landslide (c' = 240 lbf/ft2 and (J>* =11°). Tests on other samples of the debris-apron deposits including material from the main body of the Alani-Paty landslide
83

indicates residual strengths of silty materials may be as high as <|>V = 25°. Thus, the slip surface occurs in material that is weaker than some other materials in and around the landslide.
Low hydraulic conductivity (permeability) -- Hydraulic conductivities determined for the Alani-Paty landslide material are low and may be even less than the hydraulic conductivities determined for the Waiomao landslide (fig. 14). Although the hydraulic conductivities for the two landslides were determined by different methods, it is clear that both landslides have low hydraulic conductivities.
Response to rainfall -- The Alani-Paty landslide has increased water pressures and movement following rainfall, and the pattern appears grossly similar to findings for previous landslides. In studies of the Waiomao landslide, Peck (1967) concluded that movement was strongly correlated with the previous 10 days rainfall. Water pressures varied according to the rainfall in parts of the Waiomao landslide (Walter Lum Associates, 1979). In the Alani-Paty landslide pore-water pressures were relatively high during both periods of movement (January 1990 and March 1991) and average rainfall for the previous ten days was greater at these two times than at any other during the period of observation (fig. 17). Data from the present study indicates that antecedent moisture conditions determine how quickly pore pressures in the upslope quarter of the landslide respond to rainfall. From the beginning of a rainy period, pore pressures respond within 1 to 2 days. During extended rainy periods, pore pressures increase greatly within a few hours following intense rainfall. It appears that high intensity rainfall during the extended rainy periods is required to increase pore pressures high enough to trigger movement of the landslide.
ACKNOWLEDGMENTS
We thank C. Michael Street and his staff of the Department of Public Works, City and County of Honolulu, for coordinating access to sites for drilling and instrumentation. We also thank residents and owners of property in the landslide area for their cooperation in providing access to sites for drilling and instrumentation of the landslide. Geolabs-Hawaii performed drilling and sampling, and STV/Lyon Associates shared field measurements. Steve Spengler, Jill Torikai, Lori Liu, and Cynthia Wilburn helped with field work. James Messerich performed the photogrammetric measurements.
REFERENCES CITED
ASTM, 1990, Annual Book of ASTM Standards: Philadelphia, American Society for Testing and Materials, v. 4.08, 1089 p.
Bates, R.L., and Jackson, J.A., eds., 1987, Glossary of geology (3d ed.): Falls Church, Va., American Geological Institute, 788 p.
Baum, R.L., Fleming, R.W., and Ellen, S.D., 1989, Maps showing landslide features and related grounddeformation in the Woodlawn area of the Manoa Valley, City and County of Honolulu, Hawaii: U.S. Geological Survey Open-File Report 89-290, 16 p. + 2 oversize plates.
Baum, R.L., and Fleming, R.W., 1991, Use of longitudinal strain in identifying driving and resisting elements of landslides: Geological Society of America Bulletin, v. 103, p. 1121-1132.
Baum, R.L., Reid, M.E., Wilburn, C.A., and Torikai, J.D., 1991, Summary of Geotechnical and Hydrologic Data Collected from May 1,1990, Through April 30,1991, for the Alani-Paty Landslide, Manoa Valley, Honolulu, Hawaii: U.S. Geological Survey Open-File Report 91-598,102 p.
Baum, R.L., Spengler, S.R., Torikai, J.D., and Liu, L.A.S.M., 1990, Summary of Geotechnical and Hydrologic Data Collected Through April 30,1990, for the Alani-Paty Landslide, Manoa Valley, Honolulu, Hawaii: U.S. Geological Survey Open-File Report 90-531, 67 p.
Bouwer, H., 1978, Groundwater hydrology: New York, McGraw-Hill, 480 p.
Bouwer, H. and Rice, R.C., 1984, Hydraulic properties of stony vadose zones: Ground Water, v. 22, no. 6, p. 696- 705.
84

Carslaw, H.S. and Jaeger, J.C., 1959, Conduction of heat in solids: New York, Oxford University Press, 510 p.
De Silva, G.L.R., 1974, Slope stability problems induced by human modification of the soil covered hill slopes of Oahu, Hawaii: Honolulu, Hawaii, University of Hawaii, Ph.D. dissertation, 451 p.
Reming, R.W., and Johnson, A.M., 1989, Structures associated with strike-slip faults that bound landslide elements: Engineering Geology, v. 27, p. 39-114.
Reming, R.W., Schuster, R.L., and Johnson, R.B., 1988, Physical properties and mode of failure of the Mantilandslide, Utah, in The Manti, Utah, landslide: U.S. Geological Survey Professional paper 1311, p. 23-41.
Freeze, R.A. and Cherry, J.A., 1979, Groundwater: Englewood Cliffs, New Jersey, Prentice-Hall, 604 p.
Geolabs-Hawaii, 1984, Soil engineering investigation report for the study of earth movement in the vicinity ofKahaloa Drive, Kahaloa Place, Hulu Place, Woolsey Place, and Lanikaula Street, Manoa Valley, Honolulu, Hawaii: Unpublished report to the Department of Public Works, City and County of Honolulu, Hawaii, April, 23 p., appendices, 11 plates.
Geolabs-Hawaii, 1985, Geotechnical engineering investigation, remedial work for earth movement areas, vicinity of Hulu and Woolsey Place, Manoa Valley, Oahu, Hawaii: Unpublished report to the Department of Public Works, City and County of Honolulu, Hawaii, September, 19 p., appendices, 11 plates.
Geolabs-Hawaii, 1988, Field data report no. 1 earth movements in the Woodlawn area, Manoa Valley, Honolulu, Oahu, Hawaii: Unpublished report to the Department of Public Works, City and County of Honolulu, Hawaii, September, 2 p., appendices.
Giambelluca, T.W., 1986, Land-use effects on the water balance of a tropical island: National Geographic Research, v. 2, no. 2, p. 125-151.
Giambelluca, T.W., Lau, L.S., Fok, Y.S., and Schroeder, T.A., 1984, Rainfall frequency study for Oahu: Honolulu, Hawaii, State of Hawaii, Department of Land and Natural Resources, Report R73,34 p.
Giambelluca, T.W., Nullet, M.A., and Schroeder, T.A., 1986, Rainfall atlas of Hawaii: Honolulu, Hawaii, State of Hawaii, Department of Land and Natural Resources, Report R76,267 p.
Haneberg, W.C., 1991, Pore pressure diffusion and the hydrologic response of nearly saturated, thin landslide deposits to rainfall: Journal of Geology, v. 99, p. 886-892.
Iverson, R.M. and Major, J.J., 1987, Rainfall, ground-water flow, and seasonal movement at Minor Creek landslide, northwestern California: Physical interpretation of empirical relations: Geological Society of America Bulletin, v. 99, no. 4, p. 579-594.
Lambe, T.W., and Whitman, R.V., Soil mechanics: New York, Wiley, 553 p.
Langenheim, V.A.M., and Clague, D.A., 1987, The Hawaiian-Emperor Volcanic Chain Part II Stratigraphic Framework of Volcanic Rocks of the Hawaiian Islands, Chapter 1 in Volcanism in Hawaii, edited by Decker, R.W., Wright, T.L., and Stauffer, P.H.: U.S. Geological Survey Professional Paper 1350, p. 55-
Lupini, J.F., Skinner, A.E. and Vaughn, P.R., The drained residual strength of cohesive soils: Geotechnique, v. 31, no 2, p. 181-213.
MacDonald, G.A., Abbott, A.T., and Peterson, F.L., 1983, Volcanoes in the sea: Honolulu, University of Hawaii Press, 517 p.
Mink, J.F., 1962, Rainfall and runoff in the leeward Koolau Mountains, Oahu, Hawaii: Pacific Science, v. 16, no. 2, p. 147-159.
85

Peck, R.B., 1959, Report on causes and remedial measures Waiomao Slide, Honolulu: unpublished report to the City and County of Honolulu Hawaii, 31 p.
Peck, R.B., 1967, Stability of natural slopes: Proceedings of the American Society of Civil Engineers, Journal of the Soil Mechanics and Foundation Division v. 93, no SM4, p. 403-417.
Peck, R.B., 1968, Supplementary report on remedial measures Waiomao slide, Honolulu: unpublished report to the City and County of Honolulu Hawaii, 35 p.
Peck, R.B., and Wilson, S.D., 1968, The Hind luka landslide and similar movements Honolulu, Hawaii: unpublished report to the City and County of Honolulu, Hawaii. 21 p.
Rodine, J.D. and Johnson, A.M., 1976, The ability of debris, heavily freighted with coarse clastic materials to flow on gentle slopes: Sedimentology, v. 23, p 213-234.
Schultz, L.G., 1964, Quantitative interpretation of mineralogical composition from X-ray and chemical data for the Pierre Shale: U.S. Geological Survey Professional Paper 391-C, 31 p.
Shade, PJ., 1984, Hydrology and sediment transport, Moanalua Valley, Oahu, Hawaii: U.S. Geological Survey Water-Resources Investigations Report 84-4156,54 p.
Skempton, A.W., 1964, Long term stability of clay slopes: Geotechnique, v. 14, p. 77-101.
State of Hawaii, 1973, Climatologic stations in Hawaii: Honolulu, Hawaii, Department of Land and Natural Resources, Report R42,187 p.
Stearns, H.T., 1939, Geologic map and guide to the island of Oahu, Hawaii: Territory of Hawaii, Division of Hydrography, Bulletin 2,75 p. map scale 1:62,500
STV/Lyon Associates, 1990, Woodlawn area earth stabilization, Manoa Valley, Honolulu, Oahu, Hawaii, Landslides and Facilities Report: Unpublished report to the Department of Public Works, City and County of Honolulu, Hawaii, June, 2 volumes., appendices.
Takasaki, KJ. and Mink, J.F., 1982, Water resources of southeastern Oahu, Hawaii: U.S. Geological Survey Water- Resources Investigations 82-628, 89 p.
Terzaghi, Karl, and Peck, R.B., 1948, Soil mechanics in engineering practice: New York, Wiley, 566 p.
Todd, D.K., 1980, Groundwater hydrology (2d ed.): New York, John Wiley and Sons, 535 p.
U.S. National Oceanic and Atmospheric Administration, 1987, Climatological data annual summary, Hawaii and Pacific, v. 83, no. 13: Washington, D.C., U.S. Government Printing Office.
U.S. National Oceanic and Atmospheric Administration, 1988, Climatological data annual summary, Hawaii and Pacific, v. 84, no. 13: Washington, D.C., U.S. Government Printing Office.
U.S. National Oceanic and Atmospheric Administration, 1989, Climatological data annual summary, Hawaii and Pacific, v. 85, no. 13: Washington, D.C., U.S. Government Printing Office.
U.S. National Oceanic and Atmospheric Administration, 1990, Climatological data annual summary, Hawaii and Pacific, v. 86, no. 13: Washington, D.C., U.S. Government Printing Office.
U.S. National Oceanic and Atmospheric Administration, 1991, Climatological data, Hawaii and Pacific, v. 87: Washington, D.C., U.S. Government Printing Office.
Wahlstrom, E.E., and Nichols, T.C.,Jr., 1969, The morphology and chronology of a landslide near Dillon Dam, Dillon, Colorado: Engineering Geology, v. 3, p. 149-174.
86

Walter Lum Associates, Inc., 1979, Waiomao slide area remedial work phase II, subsurface investigation Palolo Valley, Honolulu, Hawaii: unpublished report to the city and county of Honolulu, Hawaii. 21 p.
Wentworth, C.K., 1951, Geology and ground-water resources of the Honolulu-Pearl Harbor area, Oahu, Hawaii: Honolulu, Hawaii, City and County of Honolulu, Board of Water Supply, 111 p.
Zaruba, Q., and Mencl, V., 1982, Landslides and their control (2nd edition), in the series. Developments in geotechnical engineering: New York, Elsevier, v. 31, 324 p.
87