truckload fuel surcharges - supply chain brain
TRANSCRIPT
Truckload Fuel SurchargesHow They Work and What They Cost
WHITE PAPER

C.H. Robinson | Truckload Fuel Surcharges 2
In brief Fuel surcharge programs are widely used in truckload transportation, but disagreements remain over how to apply these programs fairly and what they cost. By drawing on extensive experience with creating and applying fuel surcharge programs—and by incorporating groundbreaking research—this white paper maps the components of these programs and explains how each variable impacts overall costs. The result can help carriers and shippers make sense of fuel surcharges.
Contents How fuel surcharges work 3Basis for fuel surcharges 4Figuring fuel surcharges 5 What are PADDs? 6Costs and fuel surcharge programs 7Future impact of surcharges 10
C.H. Robinson | Truckload Fuel Surcharges 3
A fuel surcharge is a way of adjusting the amount paid to move freight by taking into account significant variation in fuel prices, compared to historical levels. It is a method for sharing or transferring risk. Most carriers and shippers participate in a fuel program of some kind. This is not surprising in an industry where carrier profits are razor thin and the risk of volatile fuel costs is ever-present.
In standard truckload contract negotiations, the shipper publishes a fuel surcharge schedule along with their request for lanes to be serviced. The carrier offers a bid, given the lane and fuel surcharge economics. In some situations, a carrier will offer their own fuel surcharge schedule.
How Fuel Surcharges WorkFuel surcharges are made up of three main components: index, peg, and escalator. Each of these components influences how surcharges are applied and the extent to which the carrier and/or shipper bears the cost.
Trucks average between 5 and 7 mpg (depending on how the truck is driven), so fuel is a large part of the cost of truckload transportation (see Table 1). Fuel surcharges kick in when the price of fuel goes up for an extended period. When fuel costs rose to $1.20 in August 1999 and continued to rise, surcharges became common practice. At that time, fuel was about $0.20 of the total cost per mile. By the time it reached $3.90 a gallon, the cost had risen to over $0.65 per mile.
C.H. Robinson | Truckload Fuel Surcharges 4
Truckload carriers typically make very little after taxes, so even a small increase in fuel can make the difference between making money and losing money. Fuel surcharges provide carriers with compensation for increases in fuel costs. Line haul plus fuel surcharge must meet the market rate. Anything lower may cause carriers to refuse freight in the long run.
Basis for fuel surchargesThe standard measure of diesel prices is the U.S. Department of Energy (DOE) National Average index, updated every Monday at their website (http://tonto.eia.doe.gov/oog/info/gdu/gasdiesel.asp).
Some regional carriers don’t use the DOE National Average. Instead, they use the Petroleum Administration for Defense District, or PADD. The PADD consists of a geographic aggregation of the 50 states and the District of Columbia divided into 5 districts: East Coast, Midwest, Gulf Coast, Rocky Mountains, and West Coast (see page 6, “What are PADDs?”).
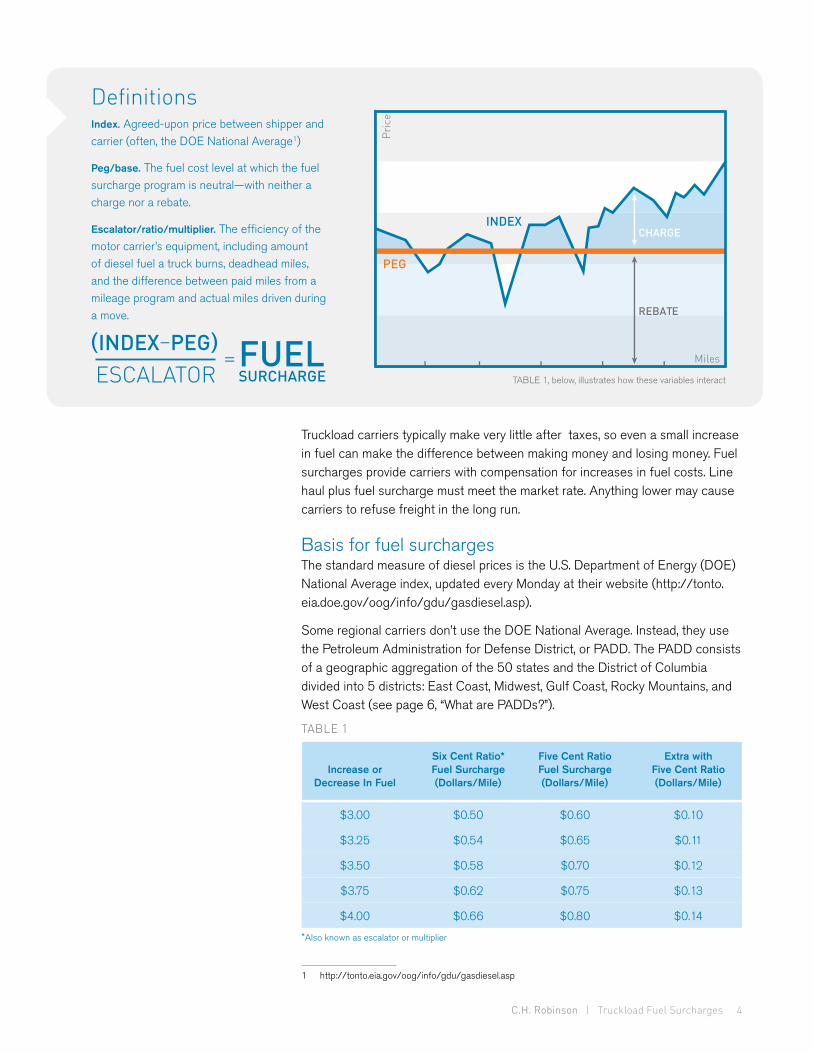
DefinitionsIndex. Agreed-upon price between shipper and carrier (often, the DOE National Average1)
Peg/base. The fuel cost level at which the fuel surcharge program is neutral—with neither a charge nor a rebate.
Escalator/ratio/multiplier. The efficiency of the motor carrier’s equipment, including amount of diesel fuel a truck burns, deadhead miles, and the difference between paid miles from a mileage program and actual miles driven during a move.
1 http://tonto.eia.gov/oog/info/gdu/gasdiesel.asp
TABLE 1
Increase or Decrease In Fuel
$3.00
$3.25
$3.50
$3.75
$4.00
Six Cent Ratio* Fuel Surcharge(Dollars/Mile)
$0.50
$0.54
$0.58
$0.62
$0.66
Five Cent RatioFuel Surcharge(Dollars/Mile)
$0.60
$0.65
$0.70
$0.75
$0.80
Extra with Five Cent Ratio(Dollars/Mile)
$0.10
$0.11
$0.12
$0.13
$0.14
(INDEX–PEG)ESCALATOR
=FUEL SURCHARGE
*Also known as escalator or multiplier
PEG
INDEXCHARGE
REBATE
Miles
Pric
eTABLE 1, below, illustrates how these variables interact
C.H. Robinson | Truckload Fuel Surcharges 5
Each PADD has its own fuel index, since geographical location does have some influence on the average price paid for diesel. For instance, the West Coast PADD typically runs higher than the National Fuel Average. Using different PADDs for different regional freight can be a hassle for a shipper and is probably unnecessary, since the PADDs tend to move in tandem with the national index. This concept will be explored in greater detail later in this paper.
Figuring fuel surchargesCompanies use a variety of methods—base rate, ratio, or percentage calculations—to calculate fuel surcharges. Some use a 5 cent ratio or a 6 cent ratio. In the end, your fuel surcharge plus line haul must meet the market rate in a lane.
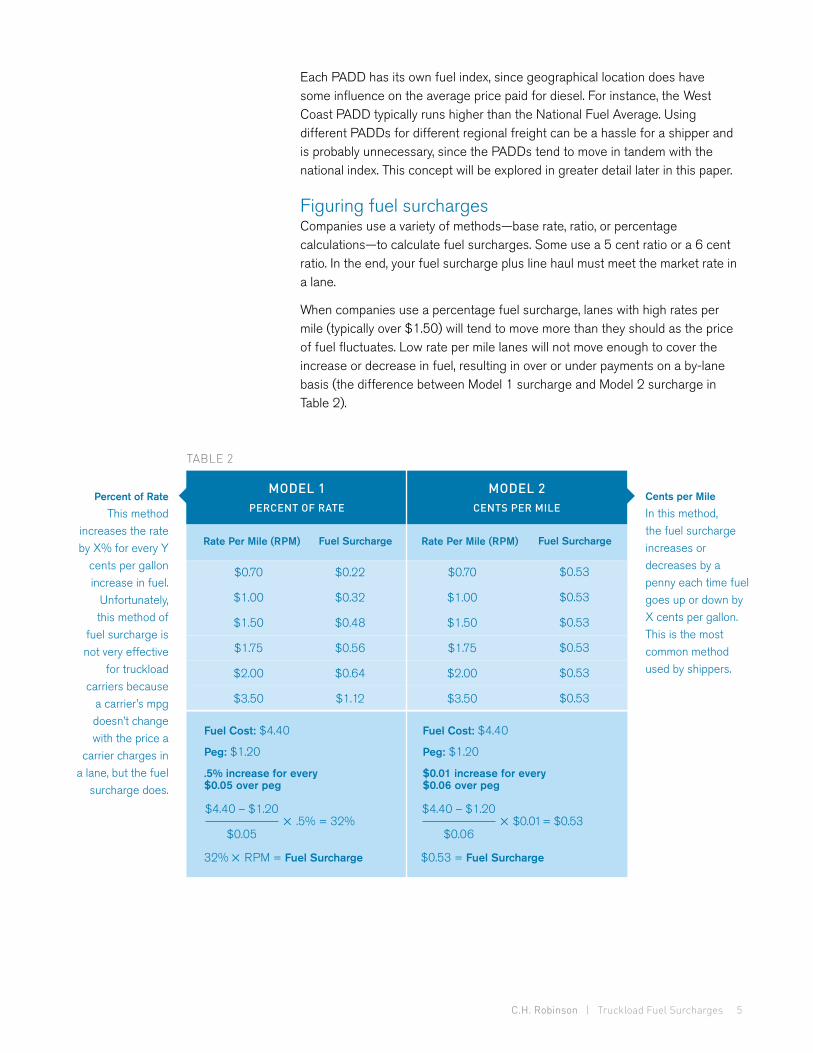
When companies use a percentage fuel surcharge, lanes with high rates per mile (typically over $1.50) will tend to move more than they should as the price of fuel fluctuates. Low rate per mile lanes will not move enough to cover the increase or decrease in fuel, resulting in over or under payments on a by-lane basis (the difference between Model 1 surcharge and Model 2 surcharge in Table 2).
Cents per Mile
In this method, the fuel surcharge increases or decreases by a penny each time fuel goes up or down byX cents per gallon. This is the most common method used by shippers.
Percent of Rate
This method increases the rate by X% for every Y
cents per gallon increase in fuel.
Unfortunately, this method of
fuel surcharge is not very effective
for truckload carriers because
a carrier’s mpg doesn’t change with the price a
carrier charges in a lane, but the fuel
surcharge does.
MODEL 1PERCENT OF RATE
$0.70
$1.00
$1.50
$1.75
$2.00
$3.50
$0.70
$1.00
$1.50
$1.75
$2.00
$3.50
$0.22
$0.32
$0.48
$0.56
$0.64
$1.12
Rate Per Mile (RPM) Rate Per Mile (RPM)Fuel Surcharge
MODEL 2CENTS PER MILE
$4.40 – $1.20
$0.05 .5% = 32%
$4.40 – $1.20
$0.06 $0.01 = $0.53
32% RPM = Fuel Surcharge $0.53 = Fuel Surcharge
Fuel Cost: $4.40
Peg: $1.20
.5% increase for every $0.05 over peg
Fuel Cost: $4.40
Peg: $1.20
$0.01 increase for every $0.06 over peg
TABLE 2
$0.53
$0.53
$0.53
$0.53
$0.53
$0.53
Fuel Surcharge
C.H. Robinson | Truckload Fuel Surcharges 6
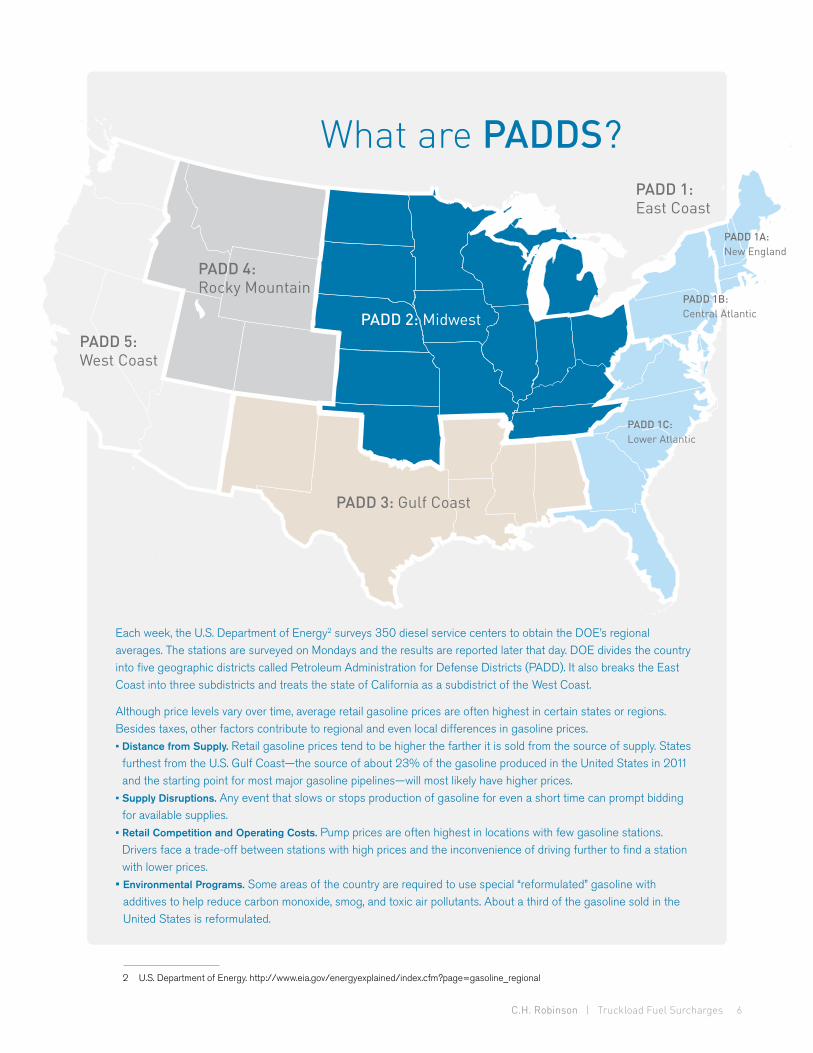
Each week, the U.S. Department of Energy2 surveys 350 diesel service centers to obtain the DOE’s regional averages. The stations are surveyed on Mondays and the results are reported later that day. DOE divides the country into five geographic districts called Petroleum Administration for Defense Districts (PADD). It also breaks the East Coast into three subdistricts and treats the state of California as a subdistrict of the West Coast.
Although price levels vary over time, average retail gasoline prices are often highest in certain states or regions. Besides taxes, other factors contribute to regional and even local differences in gasoline prices.• Distance from Supply. Retail gasoline prices tend to be higher the farther it is sold from the source of supply. States
furthest from the U.S. Gulf Coast—the source of about 23% of the gasoline produced in the United States in 2011 and the starting point for most major gasoline pipelines—will most likely have higher prices.
• Supply Disruptions. Any event that slows or stops production of gasoline for even a short time can prompt bidding for available supplies.
• Retail Competition and Operating Costs. Pump prices are often highest in locations with few gasoline stations. Drivers face a trade-off between stations with high prices and the inconvenience of driving further to find a station with lower prices.
• Environmental Programs. Some areas of the country are required to use special “reformulated” gasoline with additives to help reduce carbon monoxide, smog, and toxic air pollutants. About a third of the gasoline sold in the United States is reformulated.
PADD 2: Midwest
PADD 1: East Coast
PADD 1C: Lower Atlantic
PADD 1B: Central Atlantic
PADD 1A: New England
PADD 4: Rocky Mountain
PADD 3: Gulf Coast
PADD 5: West Coast
What are PADDS?
2 U.S. Department of Energy. http://www.eia.gov/energyexplained/index.cfm?page=gasoline_regional
C.H. Robinson | Truckload Fuel Surcharges 7
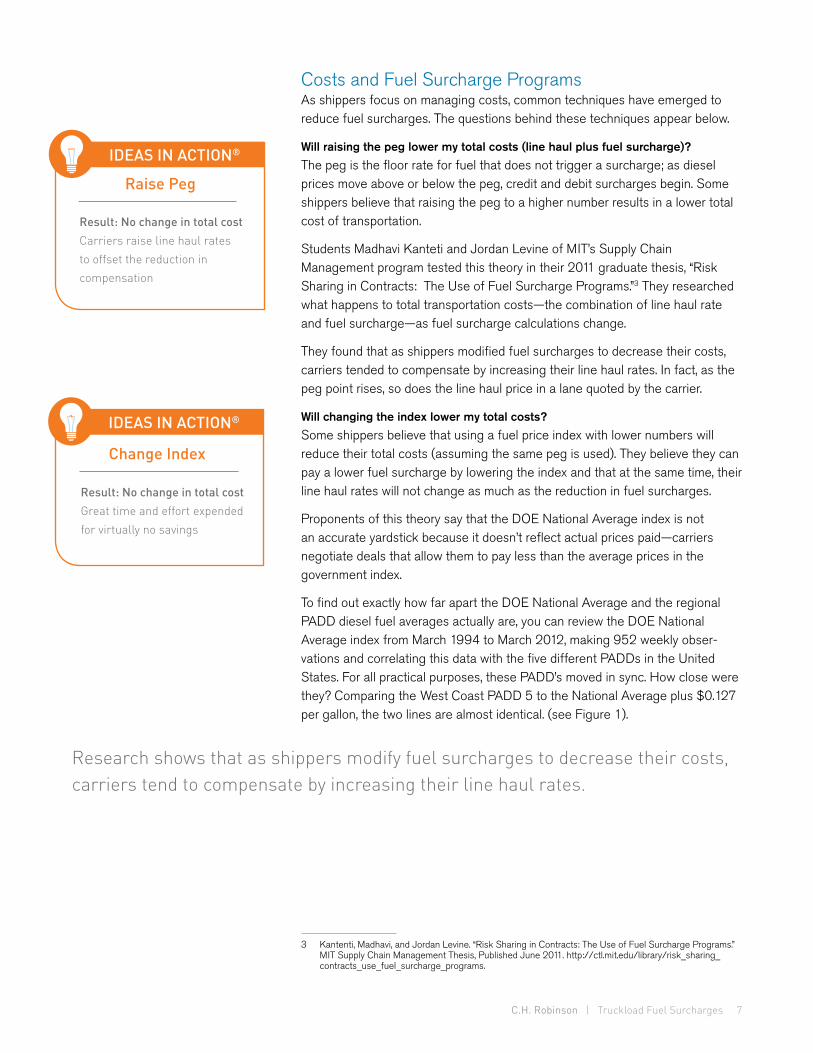
Costs and Fuel Surcharge ProgramsAs shippers focus on managing costs, common techniques have emerged to reduce fuel surcharges. The questions behind these techniques appear below.
Will raising the peg lower my total costs (line haul plus fuel surcharge)? The peg is the floor rate for fuel that does not trigger a surcharge; as diesel prices move above or below the peg, credit and debit surcharges begin. Some shippers believe that raising the peg to a higher number results in a lower total cost of transportation.
Students Madhavi Kanteti and Jordan Levine of MIT’s Supply Chain Management program tested this theory in their 2011 graduate thesis, “Risk Sharing in Contracts: The Use of Fuel Surcharge Programs.”3 They researched what happens to total transportation costs—the combination of line haul rate and fuel surcharge—as fuel surcharge calculations change.
They found that as shippers modified fuel surcharges to decrease their costs, carriers tended to compensate by increasing their line haul rates. In fact, as the peg point rises, so does the line haul price in a lane quoted by the carrier.
Will changing the index lower my total costs? Some shippers believe that using a fuel price index with lower numbers will reduce their total costs (assuming the same peg is used). They believe they can pay a lower fuel surcharge by lowering the index and that at the same time, their line haul rates will not change as much as the reduction in fuel surcharges.
Proponents of this theory say that the DOE National Average index is not an accurate yardstick because it doesn’t reflect actual prices paid—carriers negotiate deals that allow them to pay less than the average prices in the government index.
To find out exactly how far apart the DOE National Average and the regional PADD diesel fuel averages actually are, you can review the DOE National Average index from March 1994 to March 2012, making 952 weekly obser-vations and correlating this data with the five different PADDs in the United States. For all practical purposes, these PADD’s moved in sync. How close were they? Comparing the West Coast PADD 5 to the National Average plus $0.127 per gallon, the two lines are almost identical. (see Figure 1).
Result: No change in total costCarriers raise line haul rates to offset the reduction in compensation
Raise Peg
Result: No change in total costGreat time and effort expended for virtually no savings
Change Index
IDEAS IN ACTION®
IDEAS IN ACTION®
Research shows that as shippers modify fuel surcharges to decrease their costs, carriers tend to compensate by increasing their line haul rates.
3 Kantenti, Madhavi, and Jordan Levine. “Risk Sharing in Contracts: The Use of Fuel Surcharge Programs.” MIT Supply Chain Management Thesis, Published June 2011. http://ctl.mit.edu/library/risk_sharing_ contracts_use_fuel_surcharge_programs.

C.H. Robinson | Truckload Fuel Surcharges 8
Week of March 21
Pric
e pe
r gal
lon
(Dol
lars
)
'94 '95 '96 '97 '98 '99 '00 '01 '02 '03 '04 '05 '06 '07 '08 '09 '10 '11 '12$0
$1
2
3
4
5
Weekly West Coast No. 2 Diesel Retail Prices
National Average
ULS Diesel Rack Average
–0.67
+0.127
Some in the industry are reluctant to use the DOE National Average, since it tends to be higher than they are paying. Instead, they would prefer something closer to the rack or wholesale price. However, if you compare 650 points on the DOE National Average and the National Average minus $0.67 per gallon starting in January 2000, you can see that the indices don’t act differently. Instead, the indices track so closely that their data points fall onto almost exactly the same line on the graph. In other words, if you use the Diesel Rack Average instead of the DOE National Average, it’s the same thing as increasing your peg by $0.67. Similarly, if you use the West Coast No. 2 Diesel Retail Prices, it is the same thing as increasing the peg by $.127 over the National Average.
FIGURE 1 DIESEL FUEL INDEX COMPARISON
DOES CHANGING
THE
LOWER COSTS?INDEX
Using a different index produces a negligible effect, since for all practical purposes, the indices operate in a virtually identical fashion.
C.H. Robinson | Truckload Fuel Surcharges 9
This high correlation is not surprising. The market for diesel is a world market, so any difference in costs is typically the result of taxes or transportation. Changing indexes offers no more value than changing the peg. When formulating a fuel surcharge program, picking an industry index that gives a low fuel price estimate will probably save you a lot less than you think. Approximately 80% of the carriers surveyed said they had modified their line haul rates when a shipper used one of the eight regional average retail prices of fuel instead of the National Average.4
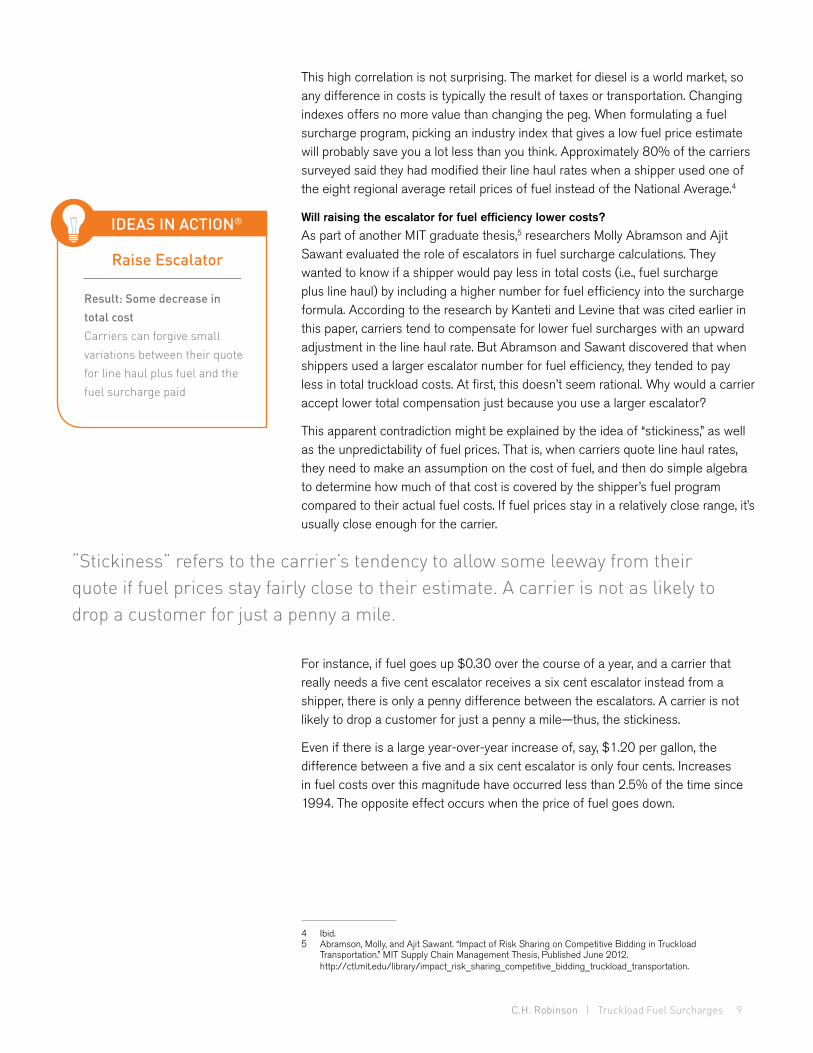
Will raising the escalator for fuel efficiency lower costs? As part of another MIT graduate thesis,5 researchers Molly Abramson and Ajit Sawant evaluated the role of escalators in fuel surcharge calculations. They wanted to know if a shipper would pay less in total costs (i.e., fuel surcharge plus line haul) by including a higher number for fuel efficiency into the surcharge formula. According to the research by Kanteti and Levine that was cited earlier in this paper, carriers tend to compensate for lower fuel surcharges with an upward adjustment in the line haul rate. But Abramson and Sawant discovered that when shippers used a larger escalator number for fuel efficiency, they tended to pay less in total truckload costs. At first, this doesn’t seem rational. Why would a carrier accept lower total compensation just because you use a larger escalator?
This apparent contradiction might be explained by the idea of “stickiness,” as well as the unpredictability of fuel prices. That is, when carriers quote line haul rates, they need to make an assumption on the cost of fuel, and then do simple algebra to determine how much of that cost is covered by the shipper’s fuel program compared to their actual fuel costs. If fuel prices stay in a relatively close range, it’s usually close enough for the carrier.
For instance, if fuel goes up $0.30 over the course of a year, and a carrier that really needs a five cent escalator receives a six cent escalator instead from a shipper, there is only a penny difference between the escalators. A carrier is not likely to drop a customer for just a penny a mile—thus, the stickiness.
Even if there is a large year-over-year increase of, say, $1.20 per gallon, the difference between a five and a six cent escalator is only four cents. Increases in fuel costs over this magnitude have occurred less than 2.5% of the time since 1994. The opposite effect occurs when the price of fuel goes down.
“Stickiness” refers to the carrier’s tendency to allow some leeway from their quote if fuel prices stay fairly close to their estimate. A carrier is not as likely to drop a customer for just a penny a mile.
Result: Some decrease in total costCarriers can forgive small variations between their quote for line haul plus fuel and the fuel surcharge paid
Raise Escalator
IDEAS IN ACTION®
4 Ibid. 5 Abramson, Molly, and Ajit Sawant. “Impact of Risk Sharing on Competitive Bidding in Truckload Transportation.” MIT Supply Chain Management Thesis, Published June 2012. http://ctl.mit.edu/library/impact_risk_sharing_competitive_bidding_truckload_transportation.
C.H. Robinson | Truckload Fuel Surcharges 10
Future Impact of SurchargesThe two MIT research projects suggest that changing the index and peg variables does not reduce the total cost of truckload transportation. Yet, this is a relatively common tactic in the industry.
What’s more, while fuel cost volatility attracts tremendous attention in the news, it is easy to overlook the fact that the impact of prices at the pump on total truckload costs has steadily decreased. A look at price trends reveals why. In 1995, the total average rate per mile line haul and fuel averaged approximately $1.24. In 2011, it was about $2.126—just over a 71% increase in total cost. So the same movement in the cost of fuel today has a much smaller effect on the total price paid. For example, in 1995, a $0.60 increase in diesel fuel would have increased the rate per mile by $0.10, or 8%; to achieve that same 8% increase in 2011, diesel fuel would have needed to increase by $1.02 per gallon.
Fuel issues and, by default, questions over the equity of surcharges are a standard for truckload business. Carriers simply cannot absorb significant changes in fuel costs and remain profitable.
At the same time, shippers cannot save significant amounts of money in the truckload arena by changing their fuel program pegs or indices, although some money may be saved by using a larger escalator. Shippers are likely to save more on transportation not by refiguring fuel surcharges, but by employing other methods that develop stronger relationships with carriers and make freight more attractive to them.
Changing the index and peg do not reduce the total cost of truckload transportation. Yet, this is a relatively common tactic in the industry.

C.H. Robinson | Truckload Fuel Surcharges 11
Kevin McCarthy works for C.H. Robinson as a director of Consulting Services. Kevin has over 25 years of experience in the logistics industry. Kevin has an MBA from the University of Minnesota Carlson School of Business with an emphasis in Management Information Systems, and an undergraduate business degree with an emphasis in Marketing.
Molly Abramson is currently working as a materials program manager at Apple Inc. Before MIT SCM, Molly worked as a research assistant for the UC Davis Agricultural and Resource Economics Department and as a project manager at Reply! Inc.
Ajit Sawant is currently working as an associate with McKinsey & Company in Boston. Before MIT SCM, Ajit worked as a lead supply chain consultant for Infosys Ltd. and Neocortex, Inc.
About usC.H. Robinson helps companies simplify their global supply chains and understand their landed costs. To help build smarter, more competitive supply chains, skilled supply chain engineers and logistics employees combine a deep knowledge of market conditions, practical experience, and proven processes. From local truck transportation to global supply chain management systems, from produce sourcing to consulting based on practical experience and logistics outsourcing, C.H. Robinson supplies a competitive advantage to companies of all sizes. Integrated technology helps companies manage their supply chain spend. This technology gathers data from across the supply chain and provides global supply chain visibility.
For more information, please visit www.chrobinson.com.
Subscribe to Transportfolio, a leading industry blog with current discussions from a wide range of industry experts, at www.blog.chrobinson.com.

3KEYS TOUNDERSTANDINGFUEL SURCHARGES
When trying to reduce total transportation costs, shippers sometimes adjust one of three components that make up the fuel surcharge: index, peg, or escalator. However, research shows that:1. Changing the index doesn’t reduce total transportation costs. Each Petroleum
Administration for Defense District (PADD) has its own fuel index, since geography can influence the average price paid for diesel. Some shippers try to match their shipments with regional PADDs. But research shows that this practice is a hassle for the shipper and is unnecessary, since the PADDs are highly correlated to the DOE National Average.
2. Raising the peg doesn’t reduce total transportation costs. The peg is the floor rate for fuel that does not trigger a surcharge; as diesel prices move above or below the peg, credit and debit surcharges begin. Some shippers believe that raising the peg to a higher number results in lower total transportation costs. Research shows, however, that when shippers modify fuel surcharges in this way, carriers compensate by increasing their line haul rates.
3. Raising the escalator for fuel efficiency can lower total costs. Research shows that when shippers use a larger escalator number for fuel efficiency, they tend to pay less in total truckload transportation costs—something that seems con-tradictory. However, carriers make assumptions about the cost of fuel when they quote line haul rates, then determine how much of that cost is covered by the shipper’s fuel program compared to their actual fuel costs. If costs stay in a relatively close range, it is usually close enough for a carrier. When a shipper uses a six cent escalator instead of a five cent escalator, the carrier is unlikely to drop the customer, since the difference is only a penny a mile.
14701 Charlson Road, Eden Prairie, MN 55347 | 800.323.7587 | www.chrobinson.com© 2013 C.H. Robinson Worldwide, Inc. All Rights Reserved.