trends in on-road vehicle emissions of ammonia in on-road vehicle emissions of ammonia a.j. kean 1,...
TRANSCRIPT

1
Trends in On-Road Vehicle Emissions of Ammonia
A.J. Kean1, D. Littlejohn2, G.A. Ban-Weiss3, R.A. Harley4, T.W. Kirchstetter2, and M.M
Lunden2
1Mechanical Engineering Dept., California Polytechnic State University, San Luis Obispo, CA.
2Environmental Energy Technologies Division, Lawrence Berkeley National Laboratory,
Berkeley, CA 94720
3Mechanical Engineering Dept., University of California, Berkeley, CA 94720
4Civil and Environmental Engineering Dept., University of California, Berkeley, CA 94720
Abstract
Motor vehicle emissions of ammonia have been measured at a California highway tunnel
in the San Francisco Bay area. Between 1999 and 2006, light-duty vehicle ammonia emissions
decreased by 38 ± 6%, from 640 ± 40 to 400 ± 20 mg kg–1. High time resolution measurements
of ammonia made in summer 2001 at the same location indicate a minimum in ammonia
emissions correlated with slower-speed driving conditions. Variations in ammonia emission rates
track changes in carbon monoxide more closely than changes in nitrogen oxides, especially
during later evening hours when traffic speeds are highest. Analysis of remote sensing data of
Burgard et al. (Environ Sci. Technol. 2006, 40, 7018-7022) indicates relationships between
ammonia and vehicle model year, nitrogen oxides, and carbon monoxide. Ammonia emission
rates from diesel trucks were difficult to measure in the tunnel setting due to the large
contribution to ammonia concentrations in a mixed-traffic bore that were assigned to light-duty
vehicle emissions. Nevertheless, it is clear that heavy-duty diesel trucks are a minor source of
ammonia emissions compared to light-duty gasoline vehicles.

2
Introduction
The use of catalytic converters has dramatically reduced most pollutant emissions from
motor vehicles. Catalytic converters make use of the low activation energy of certain
heterogeneous reactions on rare earth metals (e.g., palladium, platinum, and rhodium) to speed
reactions in their approach to equilibrium conditions. Starting in 1975, oxidation mode (i.e, two-
way) catalytic converters were introduced on automobiles in the U.S. (Heavenrich et al., 1987).
These converters oxidize carbon monoxide (CO) and volatile organic compounds (VOC) to
carbon dioxide (CO2) and water. In 1981, three-way catalytic converters were introduced, with
the additional capability to reduce nitrogen oxides (NOx = NO + NO2) to nitrogen gas. Having
both oxidizing and reducing conditions occur simultaneously on the catalyst surface is best
achieved if the air/fuel mixture is stoichiometric (Heywood, 1988). This is because hydrogen
(H2), the reducing agent for NO, and oxygen (O2), the oxidizing agent for CO and VOC, can
only be maintained in exhaust at sufficient concentrations by closely modulating air/fuel ratio
around stoichiometric conditions. Feedback control of the air/fuel ratio using exhaust oxygen
sensors was implemented in new vehicles starting in the 1980s to maintain near-stoichiometric
operating conditions for optimum three-way catalytic converter operation.
An unwanted side effect of the use of three-way catalytic converters has been an increase
in ammonia (NH3) emissions from motor vehicles. Ammonia is the primary alkaline gas and the
third most common nitrogen-containing species in the atmosphere, after nitrogen gas and nitrous
oxide (Seinfeld and Pandis, 1998). Ammonia reacts with sulfuric or nitric acid in the atmosphere
to generate secondary particles of ammonium sulfate and ammonium nitrate, respectively.
Ammonia also is a major contributor to acidification/eutrophication processes in lakes (Pearson
and Stewart, 1993; Watson et al., 1994).

3
Until recently, motor vehicles were not recognized to be a significant source of ammonia.
However, the U.S. EPA now estimates that 5% of national ammonia emissions are due to motor
vehicles, with almost all the remaining ammonia coming from agricultural processes (EPA,
2003). This figure may understate the importance of motor vehicle emissions in urban areas
where agricultural sources of ammonia are mostly absent. To date, no significant regulatory
effort has been made to control NH3 emissions from motor vehicles.
Ammonia is not created in significant quantities during typical combustion in a gasoline-
powered vehicle, but is an undesirable product of NO reduction on the catalyst surface. Over-
reduction of NO – beyond the formation of molecular N2 – leads to ammonia in motor vehicle
exhaust. Consequently, NH3 emissions were low for early 1980s and older gasoline-powered
vehicles (Pierson and Brachaczek, 1983) and have since increased following the widespread use
of three-way catalytic converters (Cadle et al., 1979, Moeckli et al., 1996, Fraser and Cass, 1998,
Kean et al., 2000).
On-road measurements of ammonia emissions from motor vehicles have been reported
previously by several groups of investigators. Early studies showed that ammonia emissions
from light-duty vehicles were low (Pierson and Brachaczek, 1983). These measurements were
made in the Allegheny Mountain Tunnel in Pennsylvania in 1981 when less than 10% of
vehicles were equipped with three-way catalytic converters. Fraser and Cass (1998) and others
(see Table 1) showed increased ammonia emissions following the widespread use of 3-way
catalytic converters. Burgard et al. (2006a) used remote sensing to show that the distribution of
ammonia emissions across the vehicle fleet shows an atypical pattern: the highest average
ammonia emission rates were observed for ~10 year-old vehicles. It is well understood that the
oldest vehicles (no catalytic converter) or those with deactivated catalysts will have negligible

4
emissions of ammonia. In addition, Burgard et al. have shown that new vehicles also emit low
quantities of ammonia. So unlike most other pollutants, ammonia emissions are dominated by
“middle-aged” vehicles (Burgard et al., 2006a).
Ammonia emissions from catalyst-equipped vehicles have been shown in laboratory
dynamometer studies to be markedly higher than for non-catalyst-equipped vehicles (Cadle et al.,
1979; Urban and Garbe, 1979; Cadle and Mulawa, 1980; Durbin et al., 2002). The reaction that
produces ammonia on the catalyst is enhanced if the engine runs fuel-rich, because that condition
favors reducing processes on the catalyst surface (Cadle et al., 1979; Urban and Garbe, 1979;
Cadle and Mulawa, 1980). Durbin et al. (2002) reported an average ammonia emission factor of
34 mg km-1 for 39 recruited gasoline-powered vehicles on the Federal Test Procedure (FTP),
with increased ammonia emissions on more aggressive driving cycles. In related efforts, Huai et
al. (2003 and 2005) showed that ammonia emissions are primarily generated during acceleration
events for modern technology vehicles. Recent laboratory dynamometer studies also showed that
vehicles equipped with more advanced emissions control technologies demonstrated better
ammonia emission control behavior (Durbin et al., 2002; Huai et al., 2003 and 2005).
The primary objective of the present investigation was to determine if on-road emissions
of ammonia are continuing to increase as turnover in the vehicle fleet continues to replace older
vehicles whose catalysts may no longer be functional with new three-way catalyst-equipped
vehicles. We have previously reported ammonia measurements from a large sample of on-road
vehicles using California reformulated gasoline in 1999 (Kean et al., 2000), which are compared
here to more recent measurements performed in 2006. We also present time-resolved ammonia
measurements from 2001 to describe emissions as a function of vehicle speed and engine load.
5
A secondary objective of this study was to estimate ammonia emissions from heavy-duty
diesel vehicles. Ammonia emissions from heavy-duty vehicles have been shown to be small
relative to modern light-duty vehicles (Pierson and Brachaczek, 1983; Burgard et al., 2006b). To
meet increasingly stringent nitrogen oxide emission standards, future adoption of selective
catalytic reduction (SCR) by the addition of urea or ammonia to diesel exhaust is likely. If not
properly controlled, use of SCR could result in elevated ammonia emissions from heavy-duty
vehicles. The present study documents baseline heavy-duty diesel truck ammonia emission rates
prior to SCR use.
Experimental Section
Field Sampling Site
The Caldecott tunnel is located on highway 24 just east of Berkeley, CA in the San
Francisco Bay area. It consists of three bores, each consisting of two traffic lanes. The tunnel is
970 m long on a 4.1% grade uphill in the eastbound direction. This study focuses on bore 1,
which contains a mix of light and heavy-duty traffic, and bore 2, which contains almost entirely
light-duty traffic. The traffic direction through bore 2 is changed around midday to accommodate
the dominant rush-hour travel direction. For this study, however, we consider only times when
traffic is headed eastbound (uphill).
Pollutant Measurements
For all years of this study (1999, 2001, and 2006), NOx, CO, and CO2 concentrations
were measured at the tunnel inlet and outlet on summer weekdays using standard ambient air
monitoring equipment (Kean et al., 2000; Ban-Weiss et al., 2008). Sample air was drawn from
the traffic bore and calibration of all gas-phase analyzers was checked daily prior to sampling for
6
all years. Ammonia measurements at the inlet and outlet of the traffic bore were made in 1999 on
8 summer weekdays between 4 and 6 PM PDT, using annular denuders coated with citric acid,
with extracts later analyzed using ion chromatography with a conductivity detector (Kean et al.,
2000).
In 2001, semi-continuous measurements of gas-phase ammonia were made with 15-
minute time resolution at the exit of tunnel bore 2 between 2:00 and 9:30 PM on 7 days in July
and August. Ammonia was stripped from the sample air stream by dissolution in a water film in
cocurrent flow inside a tubular wet effluent denuder (Buhr, 1995; Fischer et al., 2003), as shown
in Figure 1. Sample air was drawn from the exhaust bore (located directly above the traffic bore)
into a pre-cleaned 70 cm long, 0.4 cm ID etched borosilicate glass tube. The air flow rate was
controlled at 1.06 L min-1 using a critical orifice. Deionized water was supplied to the top of the
denuder by a peristaltic pump at a rate of 1.7 mL min-1. The water flowed down the inner walls
of the denuder tube and ammonia gas diffused towards and dissolved in the flowing film of
water. Collection efficiencies were measured during instrument development and found to be
close to unity. The water was collected at the bottom of the tube using a collection cup and drain
attached to the bottom of the denuder tube. A second peristaltic pump conveyed the collected
water to a cation concentrator column that collected sample for 13 minutes. From the
concentrator column, the sample was sent to an ion chromatograph for quantification of
ammonium. Calibration of the signal was accomplished with aqueous solutions of known
ammonium concentration (Fischer et al., 2003). In 2001, only the tunnel exit ammonia
concentration was measured. Based on experience from 1999 and 2006, background levels of
ammonia are small (~24 µg m-3) and relatively constant compared to those measured at the
tunnel exit.
7
In 2006, 2-hour average ammonia measurements were made on 8 days in bore 2 (light-
duty vehicles only), and on 8 days in bore 1 (mixed traffic including both light-duty vehicles and
heavy-duty diesel trucks). Measurements in bore 2 were made during the 4-6 PM peak traffic
period. Measurements in bore 1 were performed from 12-2 PM, when the heavy-duty traffic
contribution to emissions was highest. Samples from the inlet and outlet of the traffic bores were
collected on citric acid-coated annular denuders at a nominal flow rate of 5 L min–1. Flow was
regulated using a critical orifice and quantified with a primary air flow standard. The ammonium
collected on the denuders was analyzed after each day of sampling using an ion chromatograph
with conductivity detector, similar to 1999 (Kean et al., 2000). Traffic volume and average speed
through the tunnel were determined for each sampling day, as detailed elsewhere (Ban-Weiss et
al., 2008).
Results and Discussion
Light-duty Ammonia Emission Factor Trends Between 1999 and 2006
Light-duty vehicle emission factors were calculated by carbon balance using equation 1
ENH3=
∆[NH 3]
∆[CO2] + ∆[CO]
wC (1)
where ENH3 is the ammonia emission factor (mg kg–1 of fuel burned), ∆[NH3] is the increase in
mass concentration of ammonia measured between tunnel entrance and exit (µg m-3), ∆[CO2]
and ∆[CO] are similarly background-subtracted concentrations (mg C m-3), and wC = 0.85 is the
mass fraction of carbon in oxygenated gasoline used in California. Organic compounds are not
included in the denominator of eq. 1 because the hydrocarbon contribution to total carbon
concentrations in the tunnel is known to be negligible compared to CO2 and CO.

8
The ammonia emission factor for light-duty vehicles at the Caldecott tunnel in 1999 was
640 ± 40 mg kg-1. The uncertainty bounds provide a 95% confidence interval for the mean based
on run-to-run variability in the results over 8 days of sampling. At the time of these
measurements, we estimated based on a license-plate survey that ~99% of vehicles in the center
bore are gasoline-powered and >94% of the vehicles were originally outfitted with three-way
catalyst systems (Kean et al., 2000). During the rush-hour period of measurement, driving
conditions and the mean vehicle age (~6 years old) at the Caldecott Tunnel are consistent from
year to year (Kirchstetter et al., 1999; Ban-Weiss et al., 2008).
The ammonia emission factor in 2006 decreased to 400 ± 20 mg kg-1. This represents a
38 ± 6% reduction over the 7 years since the 1999 study (Kean et al., 2000). For comparison,
over this same time period, the light-duty vehicle NOx emission factor for NOx decreased by 54
± 6%. The present study clarifies that despite increasing ammonia emissions as a given vehicle
ages, the Caldecott tunnel fleet as a whole is emitting less ammonia today than 7 years ago under
the same driving conditions.
In 1999, the molar ratio of ammonia to total fixed nitrogen (taken to be NOx + NH3) in
vehicle emissions was 0.21 ± 0.01 at the Caldecott tunnel. This same measurement in 2006 was
0.27 ± 0.01. While vehicle emission rates (and total emissions) of ammonia are reducing over
time, the fraction of reactive nitrogen being emitted as ammonia by light-duty vehicles is
increasing. This is a consequence of greater focus on controlling NOx emissions compared to
efforts to reduce ammonia emissions.
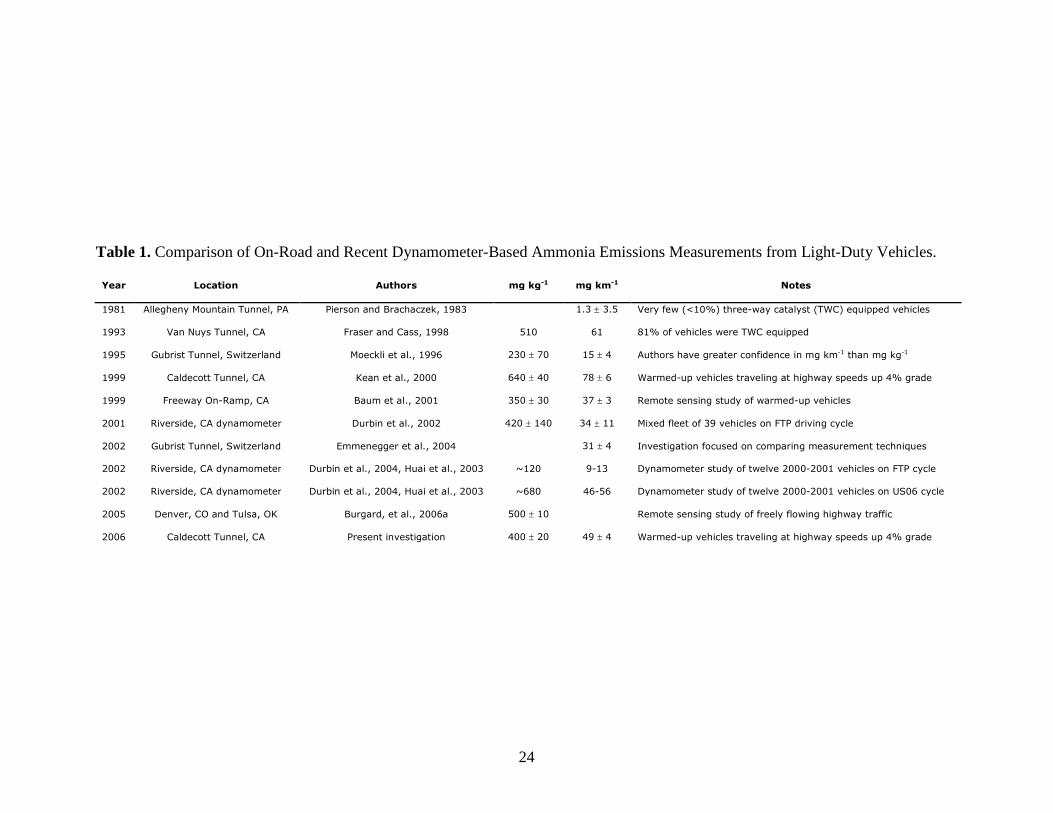
A comparison of the Caldecott tunnel results to other on-road and dynamometer-based
investigations is given in Table 1. Where possible, emission factors have been converted into the
same units to facilitate comparison. An estimate of ammonia emission factors at the Caldecott

9
tunnel on a mg km-1 basis can be made using vehicle fuel efficiencies measured at the Caldecott
tunnel in 2001 (Kean et al., 2003). During the 4-6 PM traffic period in 2001, the measured light-
duty vehicle fuel consumption for uphill traffic was 16.4 ± 0.1 L/100 km (14.4 ± 0.1 mpg). As
fuel economies (EPA, 2006) and driving conditions at the tunnel (Ban-Weiss et al., 2008) have
not changed significantly over the last decade, it is reasonable to apply this rate of fuel
consumption to both the 1999 and 2006 measurements. Focusing on the Table 1 studies
performed in California, it appears that early three-way catalyst fleets and modern fleets at high
load emit over 600 mg kg-1 of ammonia. Modern fleets at lower loads emit lower rates of
ammonia (350-450 mg kg-1). The general similarity of the fuel-based measurements is notable
given the wide range of measurement techniques used and driving conditions observed.
Engine-Load Effects on Light-duty Ammonia Emissions
The wet-effluent denuder at the Caldecott Tunnel in 2001 permitted measurement of
ammonia concentrations at 15-minute intervals over seven days of the study. Figure 2 presents
the normalized ammonia emission factors (± 95% confidence interval) over the course of the
afternoons with uphill driving in summer 2001. These data have been normalized by the average
emission factor measured from 4-6 PM, the period emphasized elsewhere in this investigation.
Absolute emission factors are not presented because the ammonia measurements in 2001 were
made in the exhaust bore (above the traffic bore), whereas the other gas-phase measurements
where made in the traffic bore. There is a small pollutant concentration gradient from the traffic
bore to the exhaust bore, which biases the numerator of eq. 1 low relative to the denominator
when calculating absolute emission factors. In Figure 2, the normalized emission factor
decreases gradually from 2 to 6 PM and then increases rapidly to a maximum at 9:30 PM. Also
included in the figure are vehicle speeds through the tunnel in 2001 (Kean et al., 2003). The

10
increase in ammonia emissions with increasing vehicle speed and thus engine load is apparent, as
we have previously reported for CO and NOx (Kean et al., 2003).
Variations over the course of the afternoon in the ammonia emission factor during the
entire 2001 study are compared to variations in CO and NOx in Figure 3. Ammonia roughly
tracks NOx from 2-6 PM, resulting in a near constant NH3 to fixed nitrogen ratio during this
period. This may suggest that the quantity of NOx passing through the catalytic converters is
limiting ammonia emissions. After 6 PM when traffic volumes are lower and vehicle speeds are
higher, NH3 tracks CO emissions. Taking elevated CO emissions as an indication of enrichment,
the more strongly reducing conditions on the catalyst appear to convert a greater fraction of NOx
to ammonia during the period after 6 PM. The ratio of ammonia emissions to total fixed nitrogen
emissions therefore increases.
Analysis of Remote Sensing Data
The above analysis pertains to fleet-average emissions. It is unclear from the tunnel data
how ammonia emission rates are distributed across individual vehicles, and how they correlate
with NOx and CO emission rates. Since most emitted NH3 molecules likely existed as NO
molecules upstream of the catalytic converter, a trade-off is likely to exist such that high
ammonia emissions occur at low NO emissions. In addition, high NO emissions may indicate
lean combustion, which can hinder formation of ammonia on the catalyst.
The likely correlation between ammonia and CO emissions is less obvious. High CO
emissions are an indication of strongly reducing conditions on the catalyst surface, which
promotes conversion of NO to NH3. However under fuel-rich conditions, NO formation is
limited, which in turn could limit formation of NH3 by the catalytic converter. Because of these
conflicting effects, it is difficult to predict in advance if high ammonia and CO emissions occur

11
concurrently. The picture is further complicated by the fact that elevated NO and/or CO
emissions may be an indication of a non-functional catalyst, in which case low ammonia
emissions would be expected. Remote sensing measurements of ammonia emissions reported by
Burgard et al. (2006a) are used here to study relationships among pollutants. Measurements of
NH3, NO, and CO concentrations in the exhaust plumes of 21,858 individual vehicles were made
by Burgard et al. in 2005 in Tulsa and Denver.
Figure 4 presents average ammonia emission factors (mg kg-1) as a function of NO and
CO concentration in light-duty vehicle exhaust. For this, vehicles are binned based on their NO
and CO exhaust concentrations, and then the average ammonia emission factor within each bin is
presented. The average ammonia emission factors are: 610 ± 30 mg kg-1 for model year 1995 and
older vehicles (Figure 4a), 600 ± 20 mg kg-1 for model year 1996-2000 (Figure 4b), 370 ± 20 mg
kg-1 for model year 2001 and newer vehicles (Figure 4c), and 500 ± 10 mg kg-1 for the entire
fleet. The number of vehicles in each bin varies depending on the prevalence of the
corresponding emission rates and is presented in the figures; less statistical significance should
be given to bins with fewer vehicles.
Looking at Figure 4, ammonia emission factors are highest for vehicles with low exhaust
NO concentrations and high exhaust CO concentrations. This trend is present for the three
vehicle age groups, but is most pronounced for newer vehicles. The data suggest that there is a
trade-off in the emissions of ammonia and NO; NO emissions decrease due to the formation of
NH3 on the catalyst. The data also suggest that chemically reducing conditions on the catalyst
surface (as evidenced by high CO) do, in fact, enhance additional conversion of NO to NH3.
Figure 4 is useful for understanding correlations between ammonia and other pollutant
emissions, but does not aid in understanding which vehicles are responsible for the bulk of total

12
ammonia emissions at the measurement sites. Figure 5 estimates the contribution of each NO-CO
bin to total ammonia emissions by accounting for the fact that the number of vehicles in each bin
varies. For Figure 5, each ammonia emission factor in Figure 4 was weighted by the number of
vehicles in that bin and then divided by the total emissions across the fleet. The results in Figure
5 should be considered approximate because its development effectively required assuming a
constant fuel-economy value across the fleet. The model year 1995 and older vehicles were 19%
of the fleet and emit ~23% of the total ammonia emissions, model year 1996-2000 vehicles were
36% of the fleet and emit ~43% of emissions, and model year 2001 and newer vehicles were
45% of the fleet and emit ~34% of ammonia emissions. Further inspection of Figure 5 indicates
that total emissions of ammonia are dominated by the vehicles with the lowest NO emissions.
For the oldest vehicles, the bins with high ammonia emission factors (see Figure 4a) also
contributed significantly to total ammonia emissions. This is in contrast to the newest vehicles,
where several bins with high emission factors contributed insignificantly to total emissions
because of the small number of vehicles in those bins. For the newest vehicles, a low emission
factor for ammonia for the cleanest vehicles (i.e., low NO and low CO) was overwhelmed by the
sheer number of vehicles in this bin.
Ammonia Emissions from Medium- and Heavy-Duty Diesel Trucks
Contributions to ammonia concentrations in bore 1 of the Caldecott tunnel from medium-
and heavy-duty (MD/HD) vehicles were estimated using CO2 as a tracer for gasoline engine
emissions, together with LD vehicle emission ratios measured in bore 2 (see Ban-Weiss et al.,
2008):
∆∆
∆−∆=∆22
23,1213,13 ][
][][][][
CO
NHCONHNH GD (2)

13
where subscripts 1 and 2 outside the bracket refers to tunnel bore number and D or G refers to
emissions due to diesel or gasoline vehicles, respectively. ∆[CO2]1,G is calculated as:
∆[CO2]1,D
∆[CO2]1=
ρDwD ( f hdUhd + fmd FUmdD )ρDwD ( fhdUhd + fmd FUmdD ) + ρGwG ( f ldU ld + fmd (1− F )UmdG )
(3a)
and
∆[CO2]1,G = ∆[CO2]1 − ∆[CO2]1,D (3b)
where fx are the observed fractions of vehicles that are LD, MD, and HD in the tunnel and
F=0.53 is the fraction of MD vehicles equipped with diesel engines. Fuel densities (ρ), carbon
mass fractions (w), and fuel economies (U) are from Ban-Weiss et al. (2008). Once pollutant
concentrations in bore 1 were apportioned between gasoline and diesel contributions, calculation
of diesel truck emission factors proceeded via carbon balance using eq. 1 with wC = 0.87. The
resulting ammonia emission factor for diesel trucks in the Caldecott tunnel in 2006 is 170 ± 150
mg kg-1. The 95% confidence interval is large because diesel trucks do not appear to be major
emitters of ammonia (Burgard et al., 2006b) and the observed fraction of diesel trucks in the
Caldecott tunnel is small. For these reasons, the fraction of ammonia emissions attributed to
diesel engines in bore 1 was only 8% on average. For comparison to the diesel truck ammonia
emission factor, the light-duty vehicle emission factor for ammonia in the same year was 400 ±
20 mg kg-1. The large uncertainty for the diesel value makes a definitive comparison of these two
emission factors difficult. Given other recent measurements (Burgard et al., 2006b), it is likely
that the true ammonia emission factor for diesel trucks lies at the low end of the range reported
here. The Caldecott tunnel was not well-suited to determination of ammonia emission rates for
diesel trucks, due to the large contribution to ammonia concentrations in bore 1 from light-duty
vehicles. However, our results imply that diesel trucks are at present a minor source of ammonia
emissions compared to light-duty gasoline vehicles.

14
Acknowledgments
The submitted manuscript has been authored by a contractor of the U.S.Government under
contract No. DE-AC02-05CH11231. Accordingly, the U.S. Government retains a nonexclusive
royalty-free license to publish or reproduce the published form of this contribution, or allow
others to do so, for U.S. Government purposes.
This project was funded by the California Air Resources Board under Contract 05-301. The
statements and conclusions in this paper are those of the authors and not necessarily those of the
California Air Resources Board. We are grateful to Caltrans staff at the Caldecott tunnel,
Technical Services Division staff of the Bay Area Air Quality Management District, and
California Air Resources Board staff for their assistance. We also thank Daniel Burgard, Donald
Stedman, and Gary Bishop of the University of Denver and John McLaughlin of UC Berkeley.
15
References
Ban-Weiss, G.A., McLaughlin, J.P., Harley, R.A., Lunden, M.M., Kirchstetter, T.W., Kean, A.J.,
Strawa, A.W., Stevenson, E.D., and Kendall, G.R. (2008). Long-Term Changes in
Emissions of Nitrogen Oxides and Particulate Matter from On-Road Gasoline and Diesel
Vehicles. Atmospheric Environment 42: 220-232.
Baum, M.M., Kiyomiya, E.S., Kumar, S., Lappas, A.M., Kapinus, V.A., and Lord III, H.C.
(2001). Multicomponent Remote Sensing of Vehicle Exhaust by Dispersive Absorption
Spectroscopy. 2. Direct On-Road Ammonia Measurements. Environmental Science and
Technology 35: 3735-3741.
Buhr, S.M., Buhr, M.P., Fehsenfeld, F.C., Holloway, J.S., Karst, U., Norton, R.B., Parrish, D.D.,
and Sievers, R.E. (1995). Development of a Semi-Continuous Method for the
Measurement of Nitric Acid Vapor and Particulate Nitrate and Sulfate. Atmospheric
Environment 29: 2609-2624.
Burgard, D.A., Bishop, G.A., and Stedman, D.H. (2006a). Remote Sensing of Ammonia and
Sulfur Dioxide from On-Road Light Duty Vehicles. Environmental Science and
Technology 40: 7018-7022.
Burgard, D.A., Bishop, G.A., Stedman, D.H., Gessner, V.H., and Daeschlein, C. (2006b).
Remote Sensing of In-Use Heavy-Duty Diesel Trucks. Environmental Science and
Technology 40: 6938-6942.
Cadle, S.H., Nebel, G.J., and Williams, R.L. (1979). Measurements of Unregulated Emissions
from General Motors’ Light-Duty Vehicles. SAE Technical Paper Series no. 790694.
Cadle, S.H., and Mulawa, P.A. (1980). Low Molecular Weight Aliphatic Amines in Exhaust
from Catalyst-Equipped Cars. Environmental Science and Technology 14: 718-723.

16
Durbin, T.D., Wilson, R.D., Norbeck, J.M., Miller, J.W., Huai, T., and Rhee, S.H. (2002).
Estimates of the emission rates of ammonia from light-duty vehicles using standard
chassis dynamometer test cycles. Atmospheric Environment 36:1742-1482.
Durbin, T. D., Miller, J. W., Pisano, J. T., Sauer, C., Younglove, T., Rhee, S. H., Huai, T., and
MacKay, G.I..(2004). The Effect of Fuel Sulfur on NH3 and Other Emissions from 2000-
2001 Model Year Vehicles. Atmospheric Environment 38: 2699-2708.
Emmenegger, L., Mohn, J., Sigrist, M., Marinov, D., Steinemann, U., Zumsteg, F., and Meier,
M. (2004). Measurement of ammonia emissions using various techniques in a
comparative tunnel study. Int. J. Environment and Pollution 22: 326-340.
EPA (2003). National Air Quality and Emissions Trends Report, 2003, Office of Air Quality
Planning and Standards, Research Triangle Park, NC.
EPA (2006). Light-Duty Automotive Technology and Fuel Economy Trends: 1975 Through
2006, Office of Transportation and Air Quality, Research Triangle Park, NC.
Fischer, M.L., Littlejohn, D., Lunden, M.M., and Brown, N.J. (2003). Automated Measurements
of Ammonia and Nitric Acid in Indoor and Outdoor Air. Environmental Science and
Technology 37: 2114-2119.
Fraser, M.P., and Cass, G.R. (1998). Detection of Excess Ammonia Emissions from In-Use
Vehicles and the Implications for Fine Particle Control. Environmental Science and
Technology 32: 1053-1057.
Heavenrich, R.M., Murrell, J.D., and Cheng, J.P. (1987). Light-Duty Automotive Fuel Economy
and Technology Trends Through 1987. SAE Technical Paper Series no. 871088.
Heywood, J.B. (1988). Internal Combustion Engine Fundamentals. McGraw-Hill, NY.

17
Huai, T., Durbin, T.D., Miller, J.W., Pisano, J.T., Sauer, C.G., Rhee, S.H., and Norbeck, J.M.
(2003). Investigation of NH3 Emissions from New Technology Vehicles as a Function of
Operating Conditions. Environmental Science and Technology 37: 4841-4847.
Huai, T., Durbin, T.D., Younglove, T., Scora, G., Barth, M., and Norbeck, J.M. (2005). Vehicle
Specific Power Approach to Estimating On-Road NH3 Emissions from Light-Duty
Vehicles. Environmental Science and Technology 39: 9595-9600.
Kean, A.J.; Harley, R.A.; and Kendall, G.R. (2003). Effects of Vehicle Speed and Engine Load
on Motor Vehicle Exhaust Emissions; Environmental Science and Technology 37: 3739-
3746.
Kean, A.J.; Harley, R.A.; Littlejohn, D.; and Kendall, G.R. (2000). On Road Measurement of
Ammonia and Other Motor Vehicle Exhaust Emissions; Environmental Science and
Technology 34: 3535-3539.
Kirchstetter, T.W., Singer, B.C., Harley, R.A., Kendall, G.R., and Traverse, M. (1999). Impact of
California Reformulated Gasoline on Motor Vehicle Emissions: Mass Emission Rates.
Environmental Science and Technology 33: 318-328.
Moeckli, M.A., Fierz, M., and Sigrist, M.W. (1996). Emission Factors for Ethene and Ammonia
from a Tunnel Study with a Photoacoustic Trace Gas Detection System. Environmental
Science and Technology 30: 2864-2867.
Pearson, J., and Stewart, G.R. (1993). Tansley Review No. 56: The Deposition of Atmospheric
Ammonia and Its Effects on Plants. New Phytologist 125: 283-305.
Pierson, W.R., and Brachaczek, W.W. (1983). Emissions of Ammonia and Amines from
Vehicles on the Road. Environmental Science and Technology 17: 757-760.

18
Seinfeld, J.H., and Pandis, S.N. Atmospheric Chemistry and Physics: From Air Pollution to
Climate Change. John Wiley and Sons: New York, NY, 1998, pp. 74-75, 1056-1057.
Urban, C.M., and Garbe, R.J. (1979). Regulated and Unregulated Exhaust Emissions from
Malfunctioning Vehicles. SAE Technical Paper Series no. 790696.
Watson, J.G., Chow, J.C., Lu, Z., Fujita, E.M., Lowenthal, D.H., Lawson, D.R., and Ashbaugh,
L.L. (1994). Chemical Mass Balance Source Apportionment of PM10 during the
Southern California Air Quality Study. Aerosol Science and Technology, 21:1-36.

19
Figure 1. Schematic of the tubular wet effluent denuder used for ammonia sampling in 2001.

20
0
1
2
3
4
14:00 15:00 16:00 17:00 18:00 19:00 20:00 21:00 22:00
Time
No
rmal
ized
NH
3 E
mis
sio
n F
acto
r (-
)
0
25
50
75
100
Ave
rag
e V
ehic
le S
pee
ds
(km
h-1
)
Figure 2. Average ammonia emission factors (± 95% confidence interval) for light-duty vehicle
traffic driving uphill (plotted using diamond symbols) normalized by the average emission factor
measured from 4-6 PM in summer 2001. Average vehicle speeds are also plotted (triangle
symbols without error bars).

21
0.0
0.5
1.0
1.5
2.0
2.5
14:00 15:00 16:00 17:00 18:00 19:00 20:00 21:00 22:00
Time
No
rmal
ized
Em
issi
on
Fac
tors
(-)
NH3 EF
CO EF
NOx EF
Figure 3. Emission factors for NH3, CO, and NOx normalized by 4-6 PM average emission
factors; measured over the entire tunnel-study in summer 2001 for uphill light-duty vehicle
traffic only.

22
232 126 110 124 129 >1.0
148 78 97 103 147 0.5-1.0
244 107 139 123 130 0.25-0.5287 129 129 133 143 0.125-0.25
469 162 184 207 212 ≤0.125
≤125 125-250 250-500 500-1000 >1000
Vehicles Per Bin
NO (ppm)
CO
(%
)
162 48 35 31 36 >1.0302 86 46 45 59 0.5-1.0
744 174 117 79 50 0.25-0.51393 265 202 126 63 0.125-0.25
2703 433 326 204 115 ≤0.125≤125 125-250 250-500 500-1000 >1000
Vehicles Per Bin
CO
(%
)
NO (ppm)
98 4 3 3 1 >1.0180 19 6 3 10 0.5-1.0
845 44 27 6 7 0.25-0.52251 111 61 38 29 0.125-0.25
5634 250 127 101 64 ≤0.125≤125 125-250 250-500 500-1000 >1000
Vehicles Per Bin
CO
(%
)
NO (ppm)
12
5-25
0
250-
500
500-
1000
>100
0
0.125-0.25
0.25-0.5
0.5-1.0
>1.0
0
500
1000
1500
2000
2500
3000
3500
NH
3 E
mis
sion
Fac
tor
(mg
kg-1
)
NO (ppm)
CO (%)
125-
250
250-
500
500-
1000
>100
0
0.125-0.25
0.25-0.5
0.5-1.0
>1.0
0
500
1000
1500
2000
2500
3000
3500
NH
3 E
mis
sion
Fac
tor
(mg
kg-1
)NO (ppm)
CO (%)
125-
250
250-
500
500-
1000
>100
0
0.125-0.25
0.25-0.5
0.5-1.0
>1.0
0
500
1000
1500
2000
2500
3000
3500
NH
3 E
mis
sion
Fac
tor
(mg
kg-1
)
NO (ppm)
CO (%)
(a) (b) (c)
Figure 4. Average ammonia emission factors (mg kg-1) as a function of NO and CO concentration in light-duty vehicle exhaust
(calculated from Burgard et al., 2006a) for (a) model year 1995 and older vehicles (19% of the 21,858 vehicles in their study were in
this age group), (b) model year 1996-2000 vehicles (36% of the 21,858 vehicles in their study were in this age group), and (c) model
year 2001 and newer vehicles (45% of the 21,858 vehicles in their study were in this age group).

23
125-
250
250-
500
500-
1000
>100
0
0.125-0.25
0.25-0.5
0.5-1.0>1.0
0%
2%
4%
6%
8%
10%
Dis
trib
uti
on
of
NH
3 E
mis
sio
ns
NO (ppm)
CO (%)
125-
250
250-
500
500-
1000
>100
0
0.125-0.25
0.25-0.5
0.5-1.0>1.0
0%
2%
4%
6%
8%
10%
Dis
trib
uti
on
of
NH
3 E
mis
sio
ns
NO (ppm)
CO (%)
125-
250
250-
500
500-
1000
>100
0
0.125-0.25
0.25-0.5
0.5-1.0>1.0
0%
2%
4%
6%
8%
10%
Dis
trib
uti
on
of
NH
3 E
mis
sio
ns
NO (ppm)
CO (%)
(a) (b) (c)
Figure 5. Estimated distribution of ammonia emissions at the measurement sites as a function of NO and CO concentration in light-
duty vehicle exhaust (calculated from Burgard et al., 2006a) for (a) model year 1995 and older vehicles, (b) model year 1996-2000
vehicles, and (c) model year 2001 and newer vehicles. The bin heights in Figures 5a, 5b, and 5c sum to 100%.
24
Table 1. Comparison of On-Road and Recent Dynamometer-Based Ammonia Emissions Measurements from Light-Duty Vehicles.
Year Location Authors mg kg-1 mg km-1 Notes
1981 Allegheny Mountain Tunnel, PA Pierson and Brachaczek, 1983 1.3 ± 3.5 Very few (<10%) three-way catalyst (TWC) equipped vehicles
1993 Van Nuys Tunnel, CA Fraser and Cass, 1998 510 61 81% of vehicles were TWC equipped
1995 Gubrist Tunnel, Switzerland Moeckli et al., 1996 230 ± 70 15 ± 4 Authors have greater confidence in mg km-1 than mg kg-1
1999 Caldecott Tunnel, CA Kean et al., 2000 640 ± 40 78 ± 6 Warmed-up vehicles traveling at highway speeds up 4% grade
1999 Freeway On-Ramp, CA Baum et al., 2001 350 ± 30 37 ± 3 Remote sensing study of warmed-up vehicles
2001 Riverside, CA dynamometer Durbin et al., 2002 420 ± 140 34 ± 11 Mixed fleet of 39 vehicles on FTP driving cycle
2002 Gubrist Tunnel, Switzerland Emmenegger et al., 2004 31 ± 4 Investigation focused on comparing measurement techniques
2002 Riverside, CA dynamometer Durbin et al., 2004, Huai et al., 2003 ~120 9-13 Dynamometer study of twelve 2000-2001 vehicles on FTP cycle
2002 Riverside, CA dynamometer Durbin et al., 2004, Huai et al., 2003 ~680 46-56 Dynamometer study of twelve 2000-2001 vehicles on US06 cycle
2005 Denver, CO and Tulsa, OK Burgard, et al., 2006a 500 ± 10 Remote sensing study of freely flowing highway traffic
2006 Caldecott Tunnel, CA Present investigation 400 ± 20 49 ± 4 Warmed-up vehicles traveling at highway speeds up 4% grade

25
Keywords: ammonia, NH3, emissions, trends, on-road, vehicle Corresponding Author: Andrew Kean Mechanical Engineering 1 Grand Ave. California Polytechnic State University San Luis Obispo, CA 93407 805-756-1236 805-756-1137 (fax) [email protected]