greenhouse gas (ghg) and ammonia emissions from poultry ... · alimentation agriculture...
TRANSCRIPT
ALIMENTATION AGRICULTURE
ENVIRONNEMENT
Florianopolis, SC, 11-13 May 20101
Greenhouse Gas (GHG) and Ammonia Emissions from Poultry and Swine: Animal Houses and
Manure Stores, Measurements and Reduction
Paul Robin, Mélynda Hassouna
UMR SAS, INRA-Agrocampus Ouest
IX International Seminar on Poultry and SwineI Ecoagri Forum on Sustainable Food Production
Florianopolis, SC11-13 May 2010
Emissão de gases de Efeito Estufa (GEE) na produção deSuínos e Aves e em sistema de armazenamento de dejetos
ALIMENTATION AGRICULTURE
ENVIRONNEMENT
Florianopolis, SC, 11-13 May 20102
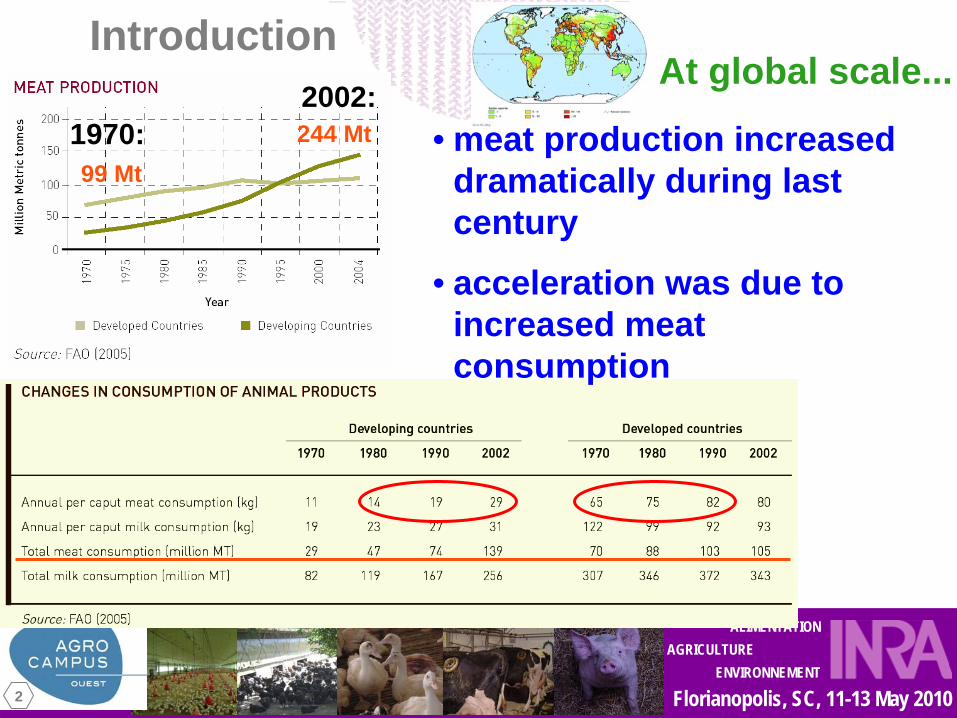
Introduction
• acceleration was due to increased meat consumption
At global scale...
• meat production increased dramatically during last century
99 Mt244 Mt1970:2002:
ALIMENTATION AGRICULTURE
ENVIRONNEMENT
Florianopolis, SC, 11-13 May 20103
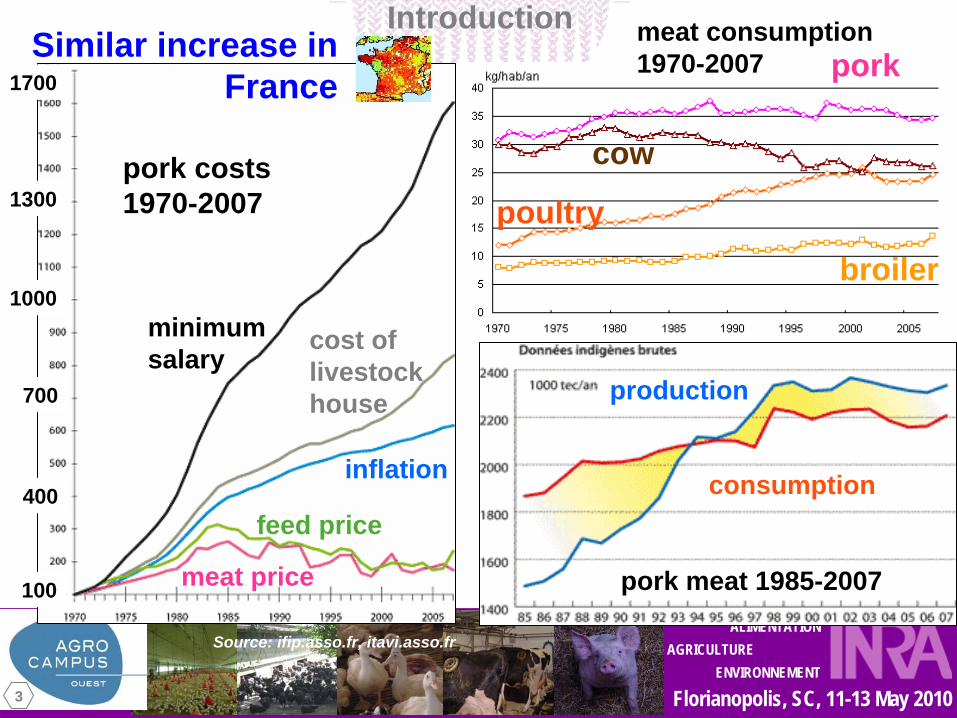
Introductionpork
cow
poultry
broiler
meat consumption 1970-2007
consumption
production
pork meat 1985-2007
pork costs 1970-2007
minimum salary
cost of livestock house
inflation
meat price
feed price
1700
1300
1000
700
400
100
Similar increase in France
Source: ifip.asso.fr, itavi.asso.fr
ALIMENTATION AGRICULTURE
ENVIRONNEMENT
Florianopolis, SC, 11-13 May 20104
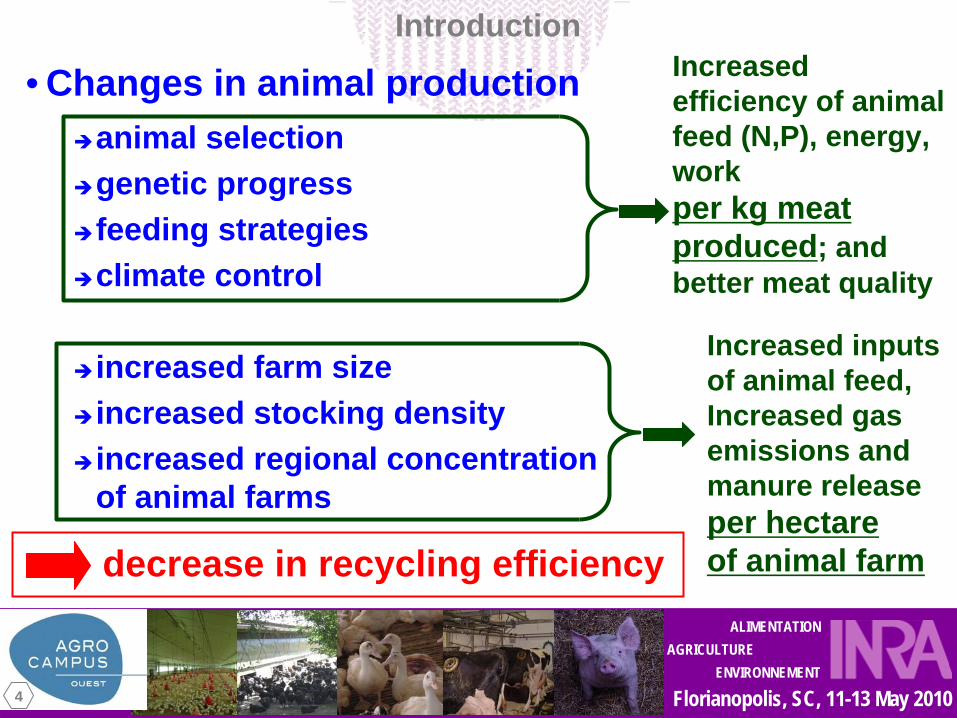
• Changes in animal productionanimal selectiongenetic progressfeeding strategiesclimate control
increased farm sizeincreased stocking densityincreased regional concentration of animal farms
Introduction
Increased inputs of animal feed, Increased gas emissions and manure release per hectare of animal farm
Increased efficiency of animal feed (N,P), energy, work per kg meat produced; and better meat quality
decrease in recycling efficiency
ALIMENTATION AGRICULTURE
ENVIRONNEMENT
Florianopolis, SC, 11-13 May 20105
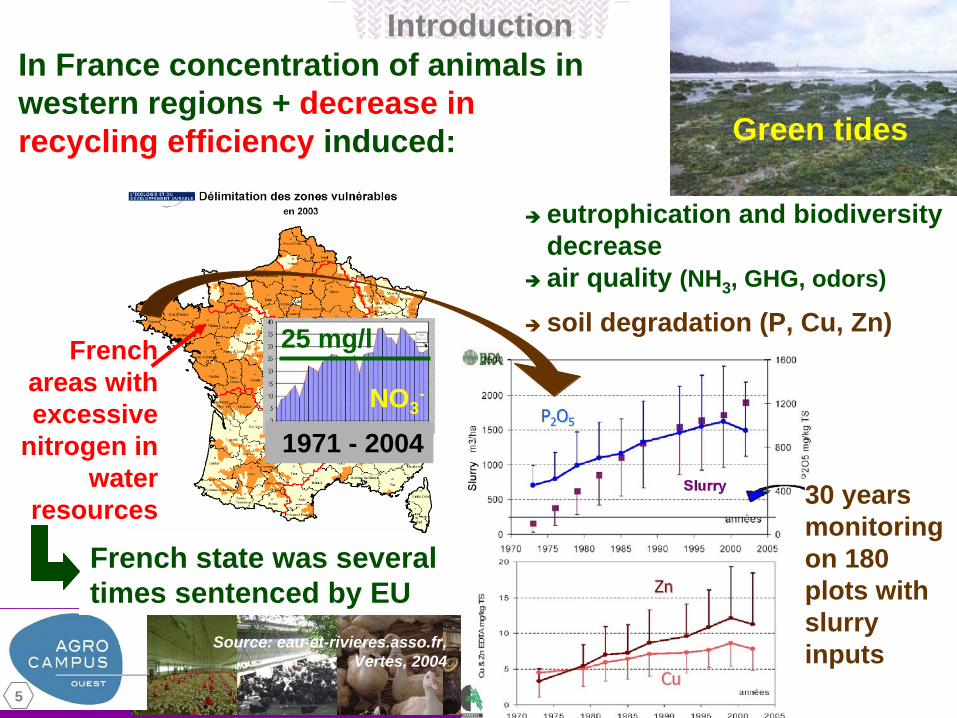
Introduction
Green tides
eutrophication and biodiversity decreaseair quality (NH3, GHG, odors)
French areas with excessive
nitrogen in water
resources
In France concentration of animals in western regions + decrease in recycling efficiency induced:
French state was several times sentenced by EU
NO3-
25 mg/l
1971 - 2004
30 years monitoring on 180 plots with slurry inputs
soil degradation (P, Cu, Zn)
Source: eau-et-rivieres.asso.fr,Vertes, 2004
ALIMENTATION AGRICULTURE
ENVIRONNEMENT
Florianopolis, SC, 11-13 May 20106
Previous evolution led to productive but polluting animal farming systems
Present evolution has to find a way toward an environment-friendly livestock production
Livestock houses, farming systems, non-food social needs, environmental (green) marketing can offer opportunities to improve manure recycling and avoid water, air, and soil pollution, and resource depletion
- which gaseous emissions should be reduced ?- when choosing a reduction technique, in which direction should the system change ?
Introduction
ALIMENTATION AGRICULTURE
ENVIRONNEMENT
Florianopolis, SC, 11-13 May 20107
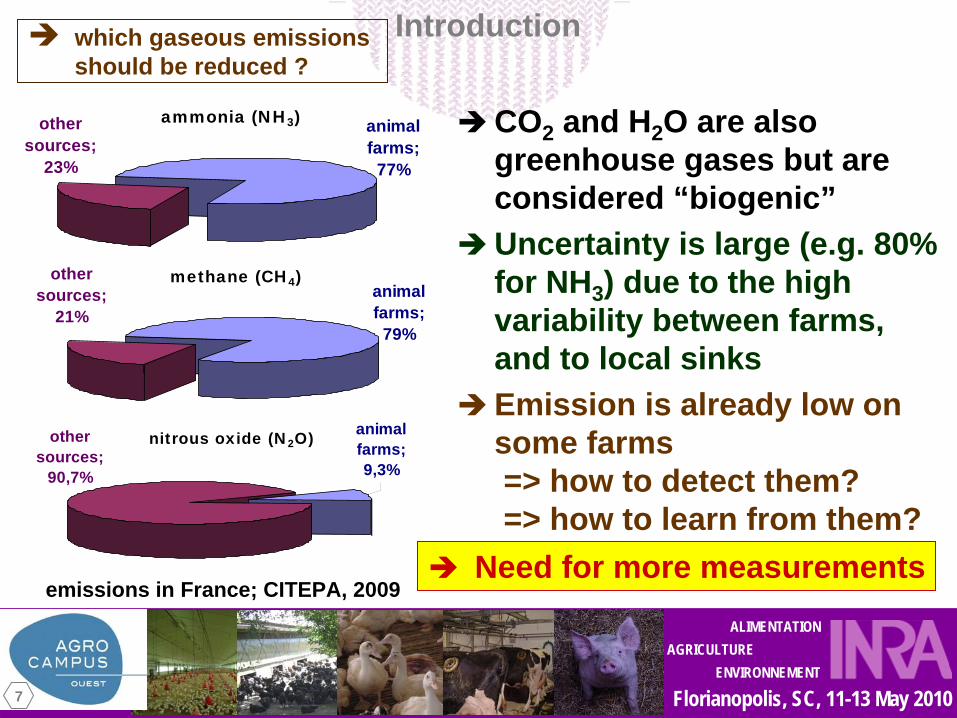
which gaseous emissions should be reduced ?
Introduction
ammonia (NH3) animal farms;
77%
other sources;
23%
methane (CH4)other sources;
21%animal farms;
79%
nitrous oxide (N2O) animal farms; 9,3%
other sources;
90,7%
emissions in France; CITEPA, 2009
CO2 and H2O are also greenhouse gases but are considered “biogenic”Uncertainty is large (e.g. 80% for NH3) due to the high variability between farms, and to local sinksEmission is already low on some farms => how to detect them?=> how to learn from them?
Need for more measurements
ALIMENTATION AGRICULTURE
ENVIRONNEMENT
Florianopolis, SC, 11-13 May 20108
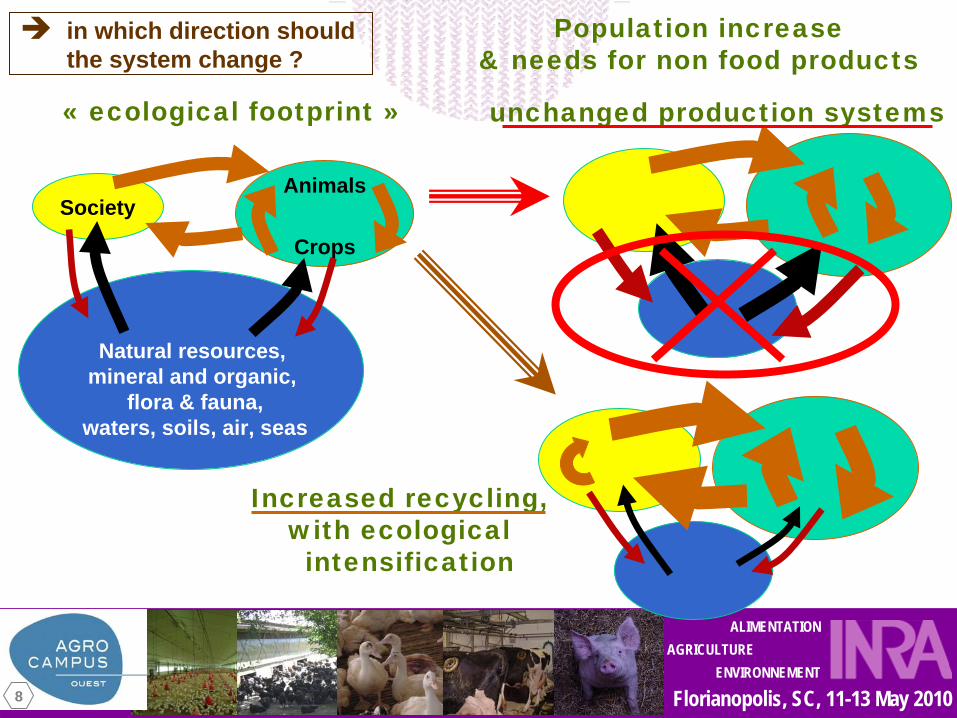
Population increase& needs for non food products
unchanged production systems« ecological footprint »
SocietyAnimals
Crops
Natural resources, mineral and organic,
flora & fauna,waters, soils, air, seas
Increased recycling,with ecological intensification
in which direction should the system change ?
ALIMENTATION AGRICULTURE
ENVIRONNEMENT
Florianopolis, SC, 11-13 May 20109
Introduction
• in France environmental impacts on water, air, soils increased from 1970 => 2000
despite warning knowledge (since Coppenet, 1977)despite regulation evolution:
farm evolutions are controlled by state authorizations, after impact study; laws were integrated into a “Code of Environment”spreading manure is limited to 170 kg N/ha for water protection,P and metals should also be consideredammonia emission of big farms have to be declaredstate programs (PMPOA) and EU aids help farm evolutions (‘Cross-compliance’ links aids to farmers to their respect of environmental and other requirements set at EU and national levels)
despite conflicts:the association “water and rivers of Brittany” developped its activity since 1958 (http://www.eau-et-rivieres.asso.fr)frequency of conflicts between population and farmers increased
in which direction should the system change ?

ALIMENTATION AGRICULTURE
ENVIRONNEMENT
Florianopolis, SC, 11-13 May 201010
Introduction
long term strategies: transformation of ≈200’000 animal farms in France takes 1-2 decades proposed changes can be adopted and adapted by the farmers themselves, years after introduction, without decreasing sustainabilitysustainability improvements will be proposed by farmers if their personal efforts improve their economic income(less if they just have to conform to regulations…)on farm scale, emission reductions can be observed on a mass balance basis (around 50% of C in feed and 25% of excreted N are volatilised) and contribute to carbon sinksreuse efficiency increases with the number of reuses and with synchronization between input and use fluxes
in which direction should the system change ?
ALIMENTATION AGRICULTURE
ENVIRONNEMENT
Florianopolis, SC, 11-13 May 201011
0
5
10
15
20
25
30
35
21-sept-00 11-oct-00 31-oct-00 20-nov-00 10-déc-00
Prod
uctio
ns d
e ch
aleu
r tot
ale
(W/c
anar
d)
cailleb. CIGR 84 tot
cailleb. OBS tot
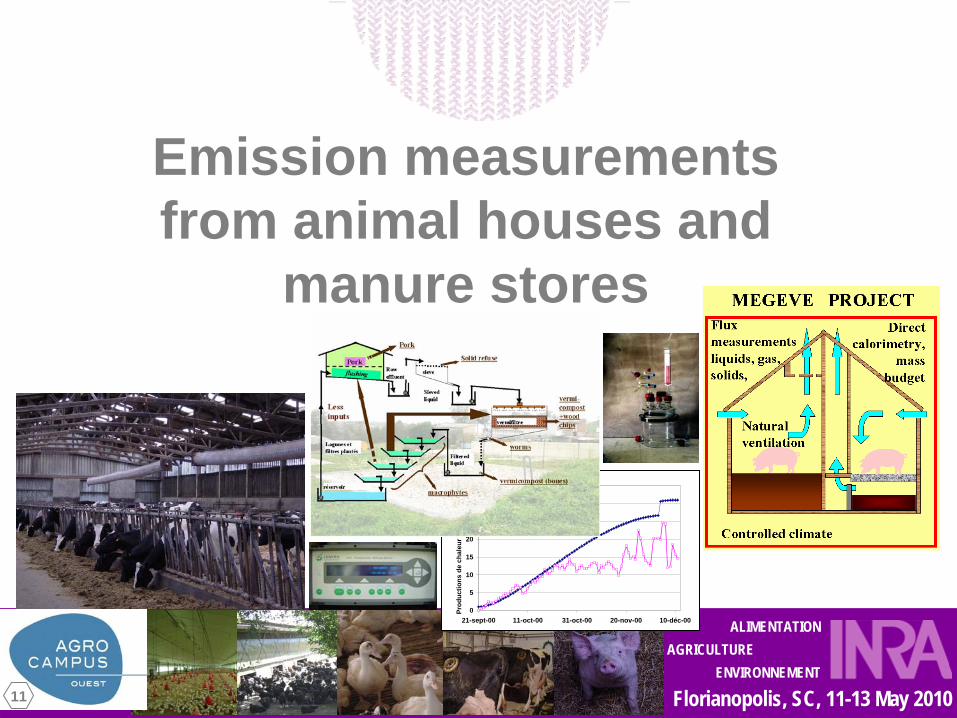
Emission measurements from animal houses and
manure stores
ALIMENTATION AGRICULTURE
ENVIRONNEMENT
Florianopolis, SC, 11-13 May 201012
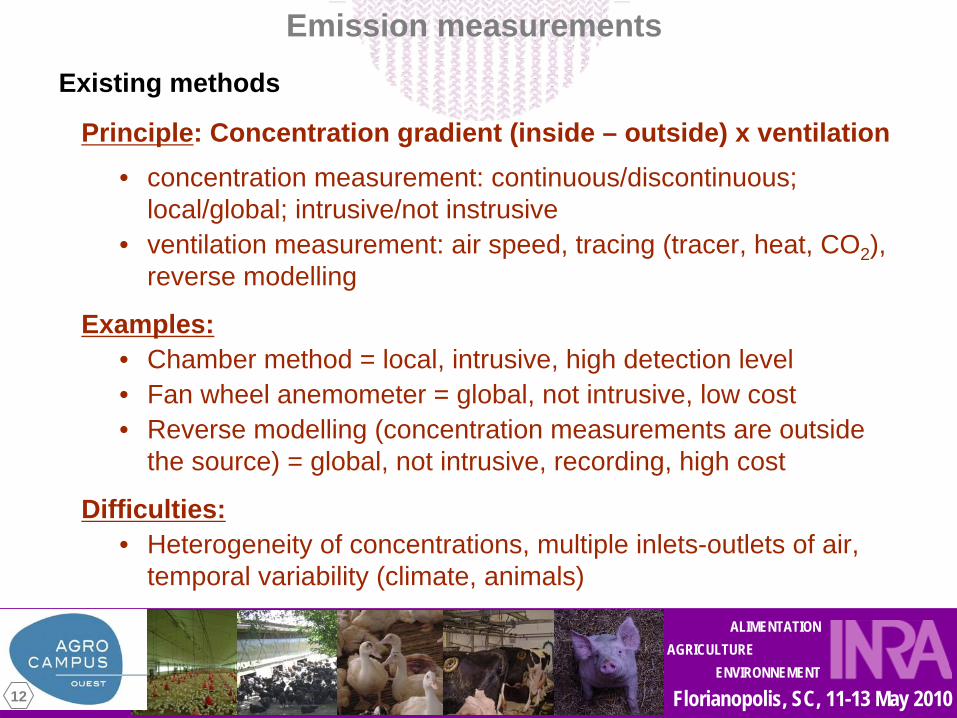
Existing methods
Principle: Concentration gradient (inside – outside) x ventilation• concentration measurement: continuous/discontinuous;
local/global; intrusive/not instrusive• ventilation measurement: air speed, tracing (tracer, heat, CO2 ),
reverse modelling
Examples:• Chamber method = local, intrusive, high detection level• Fan wheel anemometer = global, not intrusive, low cost• Reverse modelling (concentration measurements are outside
the source) = global, not intrusive, recording, high cost
Difficulties:• Heterogeneity of concentrations, multiple inlets-outlets of air,
temporal variability (climate, animals)
Emission measurements
ALIMENTATION AGRICULTURE
ENVIRONNEMENT
Florianopolis, SC, 11-13 May 201013
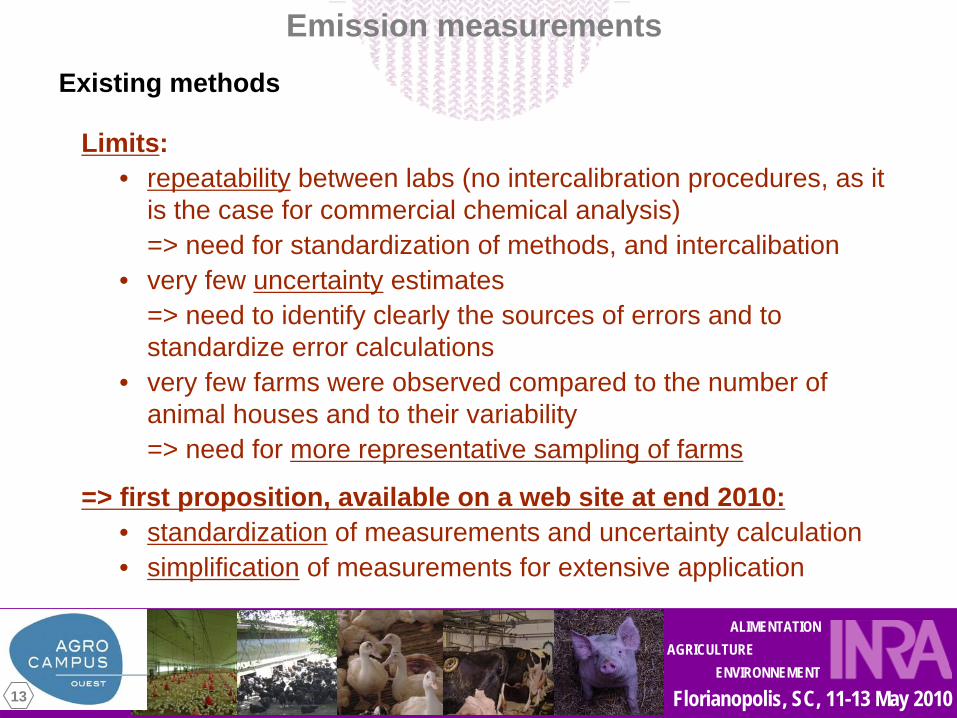
Existing methods
Limits:• repeatability between labs (no intercalibration procedures, as it
is the case for commercial chemical analysis)=> need for standardization of methods, and intercalibation
• very few uncertainty estimates=> need to identify clearly the sources of errors and to standardize error calculations
• very few farms were observed compared to the number of animal houses and to their variability=> need for more representative sampling of farms
=> first proposition, available on a web site at end 2010:• standardization of measurements and uncertainty calculation • simplification of measurements for extensive application
Emission measurements
ALIMENTATION AGRICULTURE
ENVIRONNEMENT
Florianopolis, SC, 11-13 May 201014
Procedures:• Mass balance during manure storage (using weight or P tracing)
• Emission measurement using dynamic closed chamber• Emission measurement using SF6 tracing for manure storage • Emissions from livestock houses and manure stores using a model
calibrated with intermittent measurements of concentrations• Ventilation measurement in mechanically ventilated houses using air
speed measurements• Ventilation measurement using CO2 produced by animals• Ventilation measurement using heat produced by animals• Ventilation measurement using SF6 tracing
• Emission measurement using ventilation and concentration gradient• Emission measurement using reverse modelling
• Generate a predefined ammonia concentration and measure it with acid bubbling
• Uncertainty calculation applied to the measurements of gaseous emissions from animal houses and manure stores
Emission measurements
ALIMENTATION AGRICULTURE
ENVIRONNEMENT
Florianopolis, SC, 11-13 May 201015
Proposition of simplified measurements for extensive use on many farms:• Based on the mass balance of one animal flock, and on the measurement
of concentration gradients of CO2 , H2 O, NH3 , N2 O, CH4
• Protocols of air sampling – calculation – checking and control for meat poultry, laying hens, growing-finishing pigs, dairy cows
• Calculation in .xls datasheets and associated to a database
• Development of a bootable USB key containing all software (database, calculations, xls datasheets, documentation, standard procedures) based on Linux system, multilanguage, and opensource softwares
Objective:• from « Good Agricultural Practices » with assumed emission factors and
high uncertainties
• to « Approved Methodologies » with local observations: low-costs methods + models (time interpolation) + references (relevant categories)
Emission measurements
ALIMENTATION AGRICULTURE
ENVIRONNEMENT
Florianopolis, SC, 11-13 May 201016
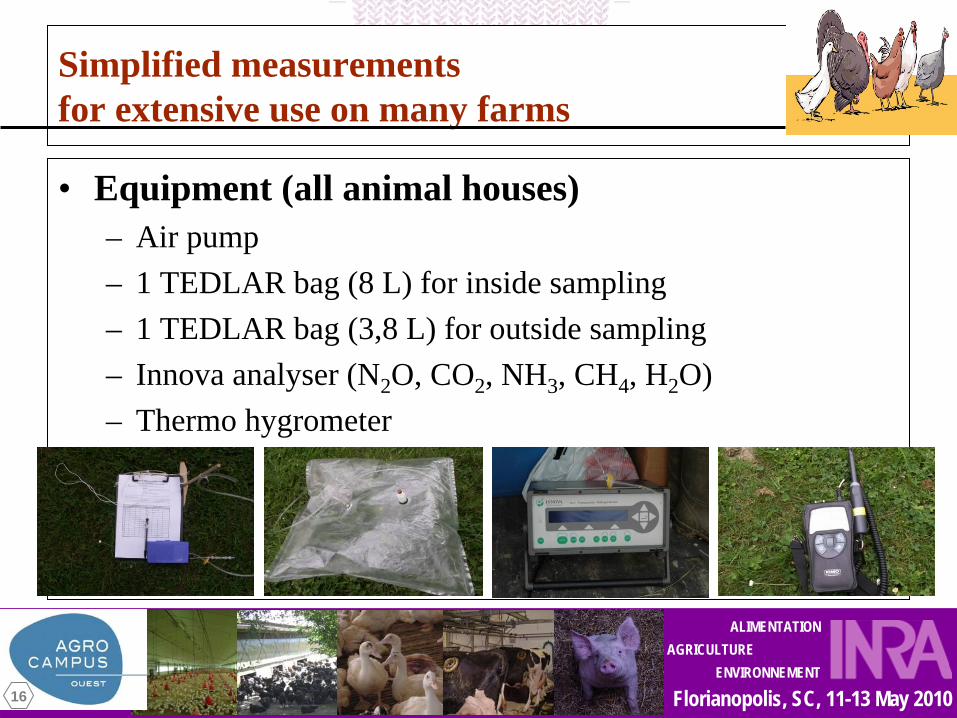
• Equipment (all animal houses)– Air pump– 1 TEDLAR bag (8 L) for inside sampling– 1 TEDLAR bag (3,8 L) for outside sampling– Innova analyser (N2 O, CO2 , NH3 , CH4 , H2 O)– Thermo hygrometer
Simplified measurements for extensive use on many farms
ALIMENTATION AGRICULTURE
ENVIRONNEMENT
Florianopolis, SC, 11-13 May 201017
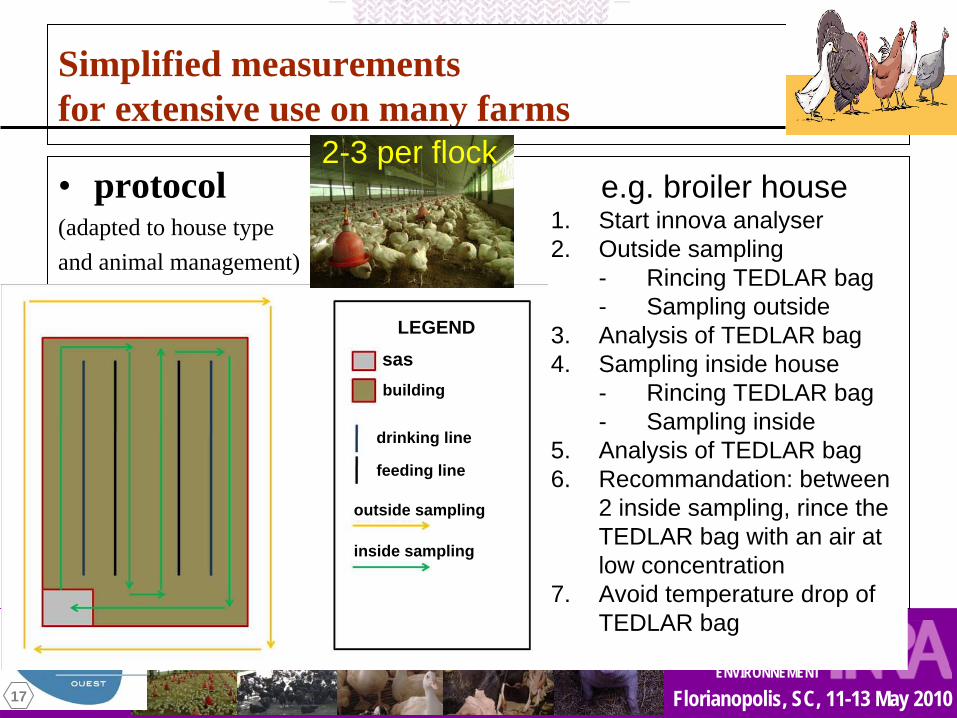
Simplified measurements for extensive use on many farms
• protocol(adapted to house type and animal management)
e.g. broiler house1. Start innova analyser2. Outside sampling
- Rincing TEDLAR bag- Sampling outside
3. Analysis of TEDLAR bag4. Sampling inside house
- Rincing TEDLAR bag- Sampling inside
5. Analysis of TEDLAR bag6. Recommandation: between
2 inside sampling, rince the TEDLAR bag with an air at low concentration
7. Avoid temperature drop of TEDLAR bag
sasbuilding
drinking line
feeding line
outside sampling
inside sampling
LEGEND
2-3 per flock
ALIMENTATION AGRICULTURE
ENVIRONNEMENT
Florianopolis, SC, 11-13 May 201018
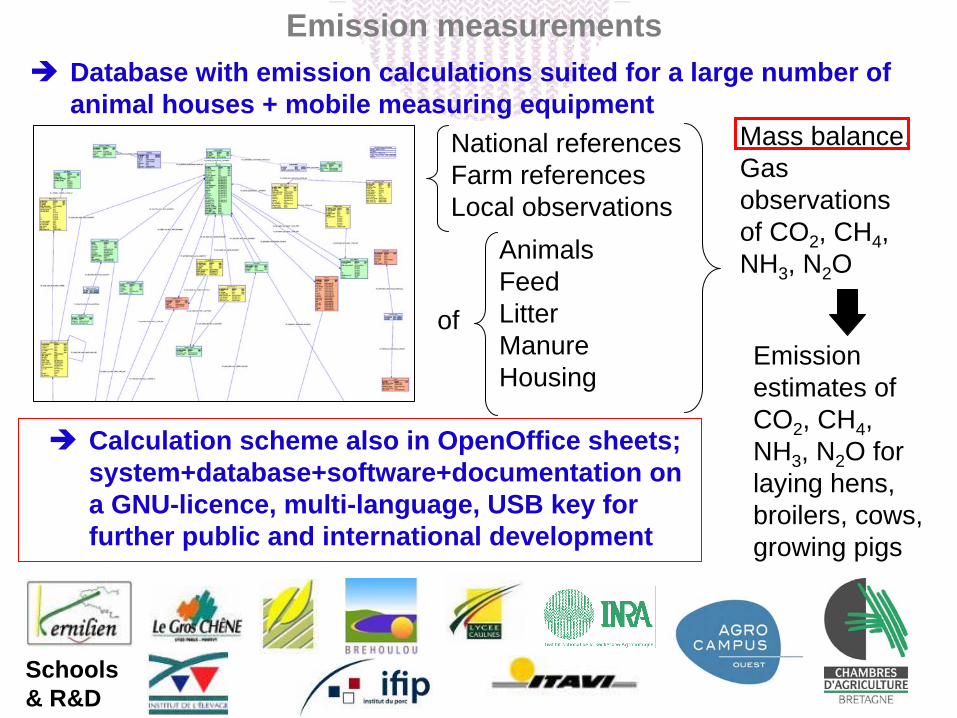
Database with emission calculations suited for a large number ofanimal houses + mobile measuring equipment
National referencesFarm referencesLocal observations
AnimalsFeedLitterManureHousing
ofEmission estimates of CO2 , CH4 , NH3 , N2 O for laying hens, broilers, cows, growing pigs
Calculation scheme also in OpenOffice sheets; system+database+software+documentation on a GNU-licence, multi-language, USB key for further public and international development
Emission measurements
Mass balance,Gas observations of CO2 , CH4 , NH3 , N2 O
Schools & R&D
ALIMENTATION AGRICULTURE
ENVIRONNEMENT
Florianopolis, SC, 11-13 May 201019
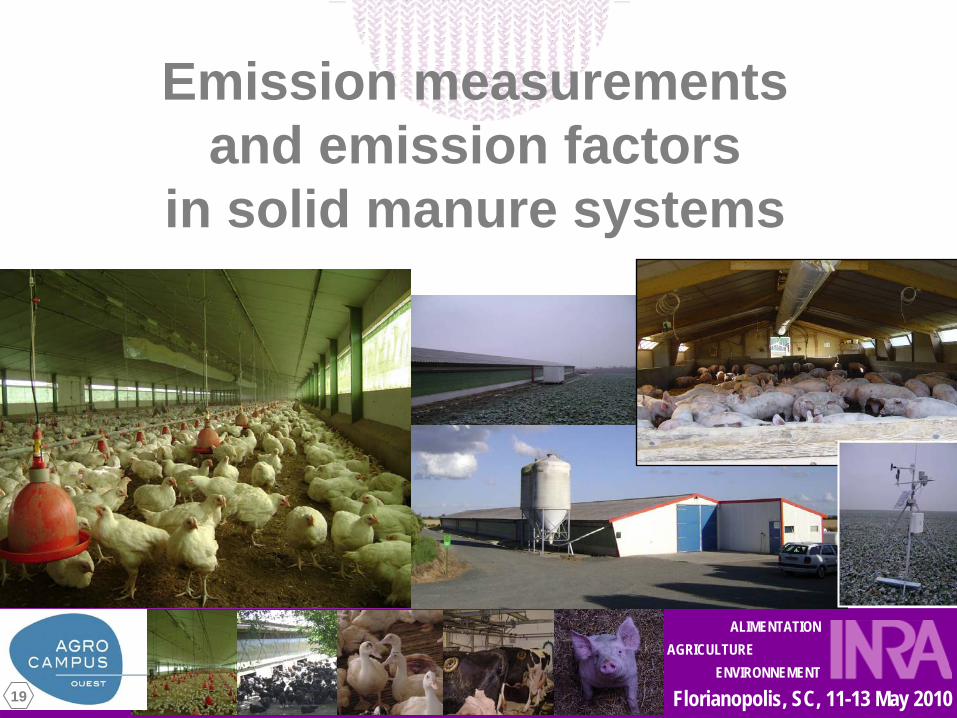
Emission measurements and emission factors
in solid manure systems
ALIMENTATION AGRICULTURE
ENVIRONNEMENT
Florianopolis, SC, 11-13 May 201020
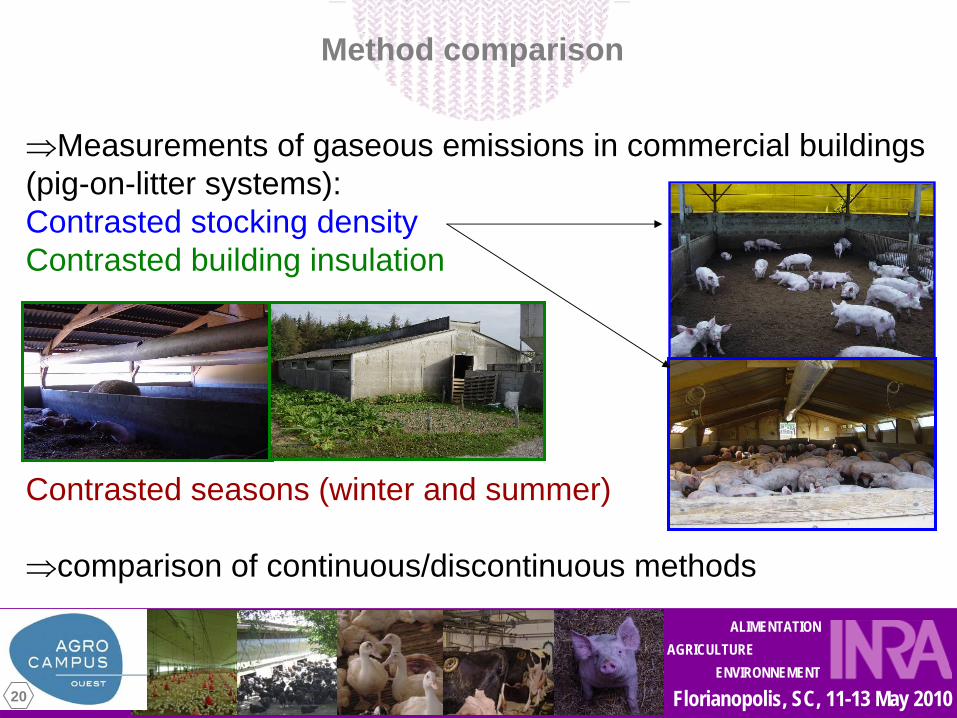
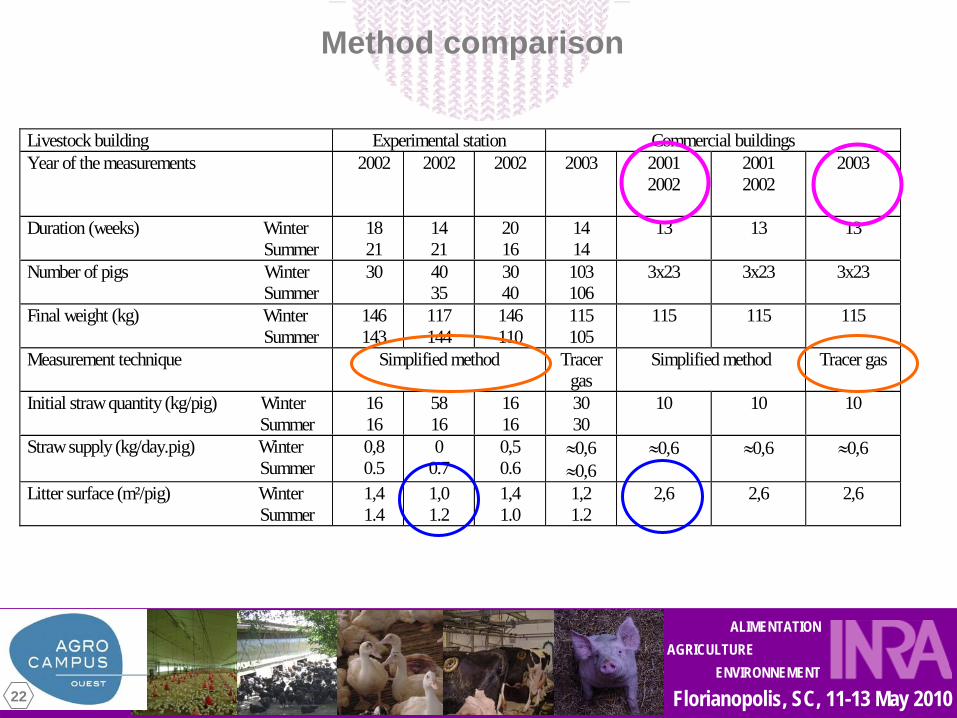
Method comparison
⇒Measurements of gaseous emissions in commercial buildings(pig-on-litter systems):Contrasted stocking densityContrasted building insulation
Contrasted seasons (winter and summer)
⇒comparison of continuous/discontinuous methods
ALIMENTATION AGRICULTURE
ENVIRONNEMENT
Florianopolis, SC, 11-13 May 201021
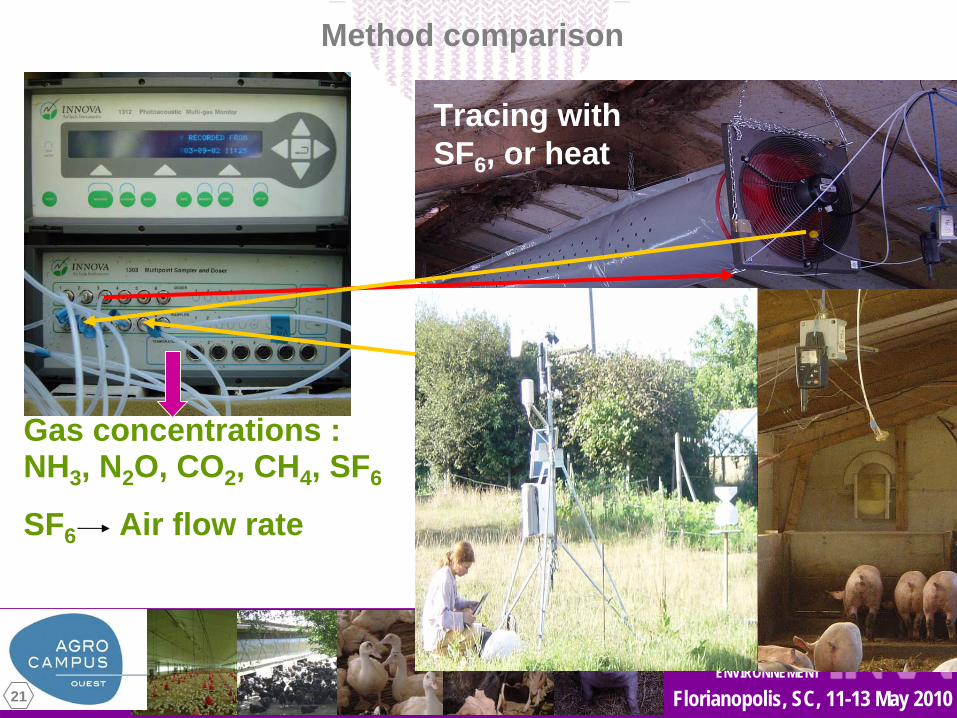
Method comparison
Gas concentrations : NH3 , N2 O, CO2 , CH4 , SF6
SF6 Air flow rate
Tracing with SF6 , or heat
ALIMENTATION AGRICULTURE
ENVIRONNEMENT
Florianopolis, SC, 11-13 May 201022
Livestock building Experimental station Commercial buildingsYear of the measurements 2002 2002 2002 2003 2001
200220012002
2003
Duration (weeks) Winter Summer
1821
1421
2016
1414
13 13 13
Number of pigs Winter Summer
30 4035
3040
103106
3x23 3x23 3x23
Final weight (kg) Winter Summer
146143
117144
146110
115105
115 115 115
Measurement technique Simplified method Tracergas
Simplified method Tracer gas
Initial straw quantity (kg/pig) Winter Summer
1616
5816
1616
3030
10 10 10
Straw supply (kg/day.pig) Winter Summer
0,80.5
00.7
0,50.6
≈0,6≈0,6
≈0,6 ≈0,6 ≈0,6
Litter surface (m²/pig) Winter Summer
1,41.4
1,01.2
1,41.0
1,21.2
2,6 2,6 2,6
Method comparison
ALIMENTATION AGRICULTURE
ENVIRONNEMENT
Florianopolis, SC, 11-13 May 201023
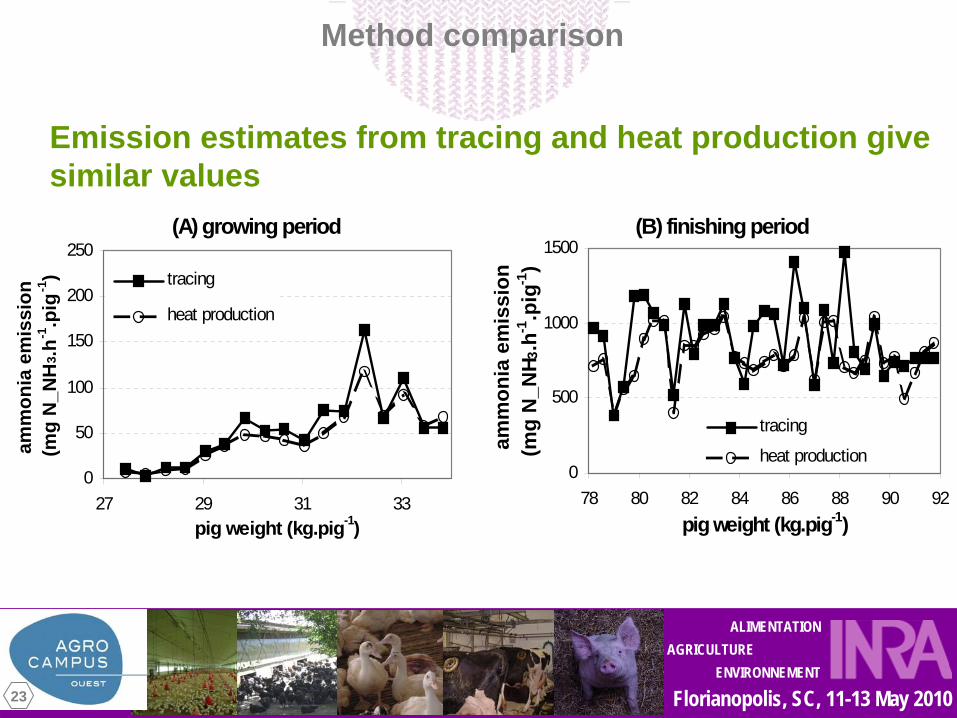
(A) growing period
0
50
100
150
200
250
27 29 31 33pig weight (kg.pig-1)
amm
onia
em
issi
on
(mg
N_N
H3 .h
-1.p
ig-1
) tracing
heat production
(B) finishing period
0
500
1000
1500
78 80 82 84 86 88 90 92pig weight (kg.pig-1)
amm
onia
em
issi
on
(mg
N_N
H 3.h
-1.p
ig-1
)
tracing
heat production
Emission estimates from tracing and heat production give similar values
Method comparison
ALIMENTATION AGRICULTURE
ENVIRONNEMENT
Florianopolis, SC, 11-13 May 201024
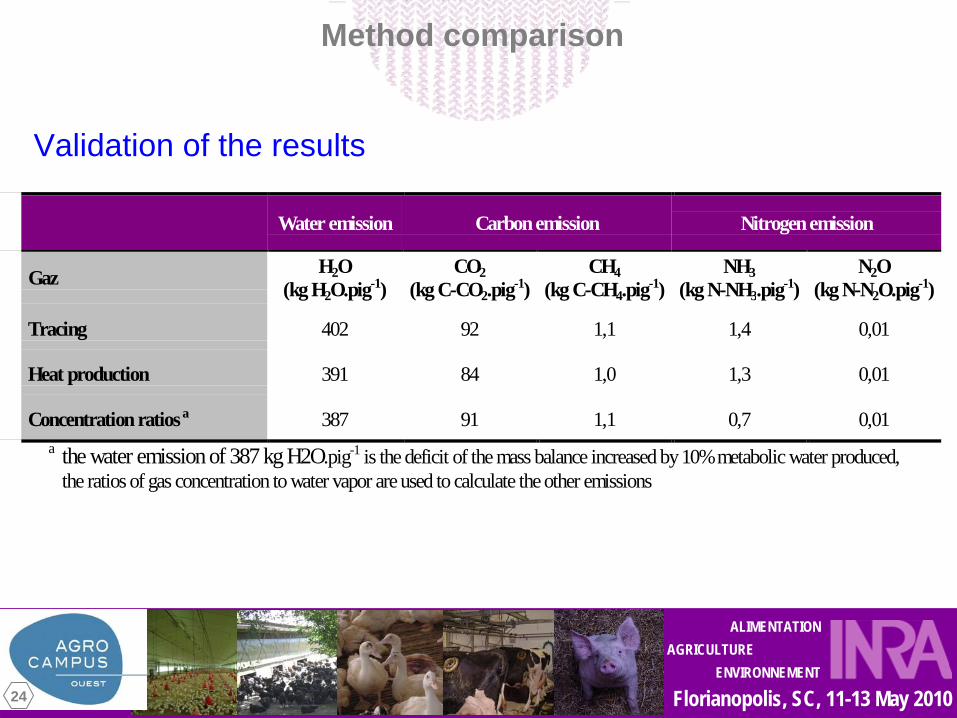
Validation of the results
Water emission Carbon emission Nitrogen emission
Gaz H2O(kg H2O.pig-1)
CO2(kg C-CO2.pig-1)
CH4(kg C-CH4.pig-1)
NH3(kg N-NH3.pig-1)
N2O(kg N-N2O.pig-1)
Tracing 402 92 1,1 1,4 0,01
Heat production 391 84 1,0 1,3 0,01
Concentration ratios a 387 91 1,1 0,7 0,01a the water emission of 387 kg H2O.pig-1 is the deficit of the mass balance increased by 10% metabolic water produced,
the ratios of gas concentration to water vapor are used to calculate the other emissions
Method comparison
ALIMENTATION AGRICULTURE
ENVIRONNEMENT
Florianopolis, SC, 11-13 May 201025
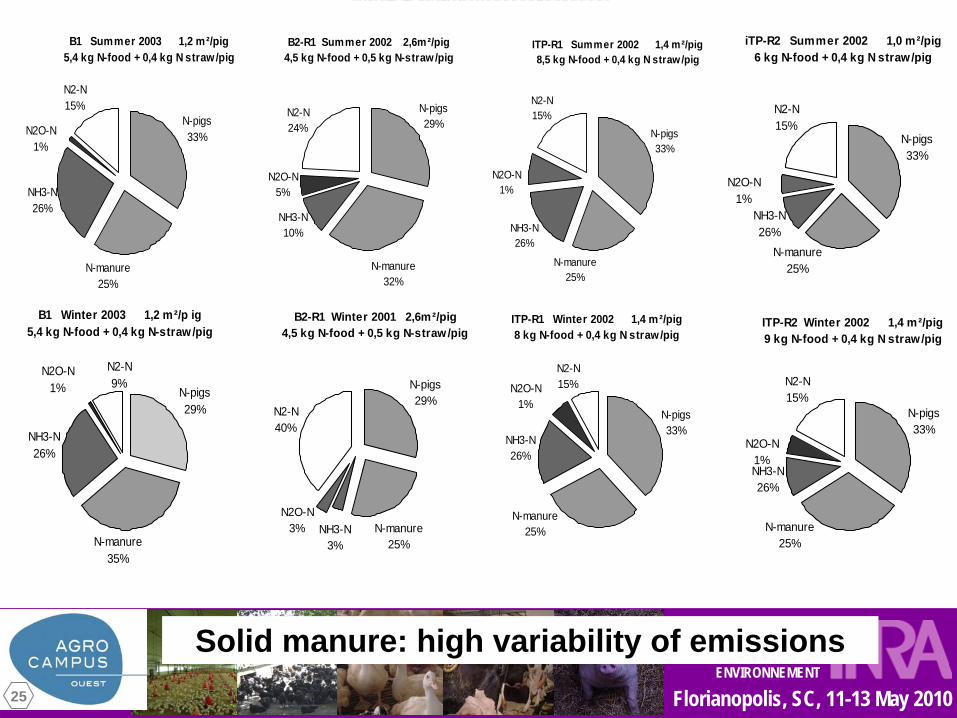
Commercial conditions
B1 Winter 2003 1,2 m²/p ig5,4 kg N-food + 0,4 kg N-straw/pig
N-pigs29%
NH3-N26%
N2-N 9%
N2O-N1%
N-manure35%
B2-R1 Summer 2002 2,6m²/pig4,5 kg N-food + 0,5 kg N-straw /pig
N-pigs29%
NH3-N10%
N2O-N5%
N-manure32%
N2-N 24%
B2-R1 Winter 2001 2,6m²/pig 4,5 kg N-food + 0,5 kg N-straw/pig
N-pigs29%
N2-N 40%
NH3-N3%
N2O-N3% N-manure
25%
B1 Summer 2003 1,2 m²/pig 5,4 kg N-food + 0,4 kg N straw/pig
N2-N 15%
N-manure25%
N2O-N1%
N-pigs33%
NH3-N26%
ITP-R1 Summer 2002 1,4 m²/pig 8,5 kg N-food + 0,4 kg N straw/pig
NH3-N26%
N-pigs33%
N2O-N1%
N-manure25%
N2-N 15%
ITP-R1 Winter 2002 1,4 m²/pig 8 kg N-food + 0,4 kg N straw/pig
N2-N 15%
N-manure25%
N2O-N1%
N-pigs33%
NH3-N26%
iTP-R2 Summer 2002 1,0 m²/pig 6 kg N-food + 0,4 kg N straw/pig
NH3-N26%
N-pigs33%
N2O-N1%
N-manure25%
N2-N 15%
ITP-R2 Winter 2002 1,4 m²/pig 9 kg N-food + 0,4 kg N straw/pig
N2-N 15%
N-manure25%
N2O-N1%
N-pigs33%
NH3-N26%
Solid manure: high variability of emissions
ALIMENTATION AGRICULTURE
ENVIRONNEMENT
Florianopolis, SC, 11-13 May 201026
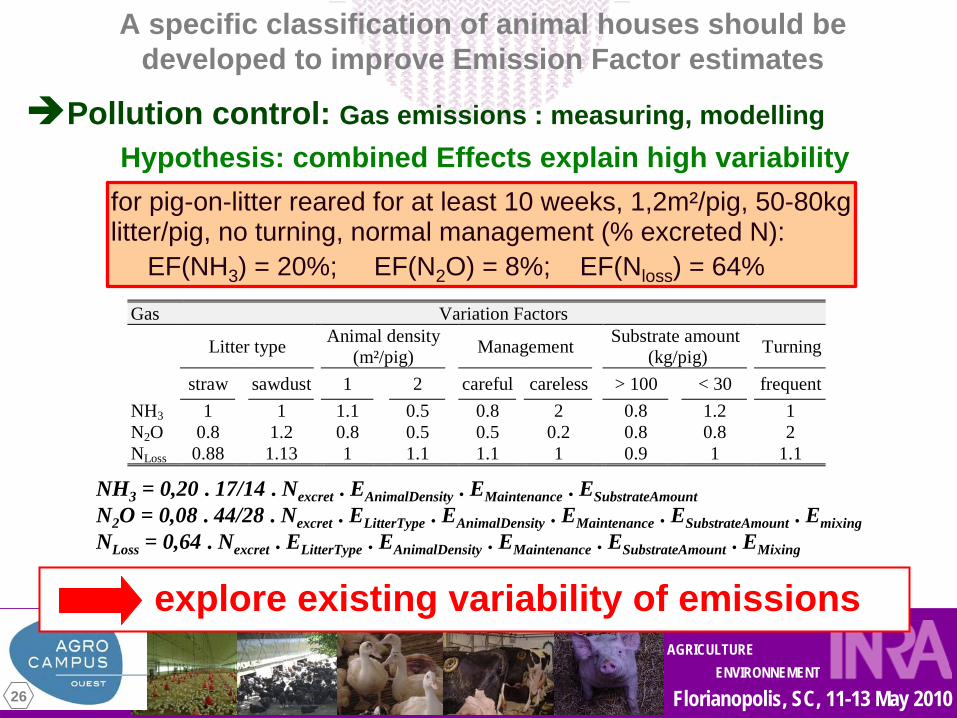
A specific classification of animal houses should be developed to improve Emission Factor estimates
Pollution control: Gas emissions : measuring, modellingHypothesis: combined Effects explain high variability
for pig-on-litter reared for at least 10 weeks, 1,2m²/pig, 50-80kglitter/pig, no turning, normal management (% excreted N): EF(NH3) = 20%; EF(N2O) = 8%; EF(Nloss) = 64%
NH3 = 0,20 . 17/14 . Nexcret . EAnimalDensity . EMaintenance . ESubstrateAmountN2O = 0,08 . 44/28 . Nexcret . ELitterType . EAnimalDensity . EMaintenance . ESubstrateAmount . EmixingNLoss = 0,64 . Nexcret . ELitterType . EAnimalDensity . EMaintenance . ESubstrateAmount . EMixing
Gas Variation Factors
Litter type Animal density(m²/pig) Management Substrate amount
(kg/pig) Turning
straw sawdust 1 2 careful careless > 100 < 30 frequentNH3 1 1 1.1 0.5 0.8 2 0.8 1.2 1N2O 0.8 1.2 0.8 0.5 0.5 0.2 0.8 0.8 2NLoss 0.88 1.13 1 1.1 1.1 1 0.9 1 1.1
explore existing variability of emissions
ALIMENTATION AGRICULTURE
ENVIRONNEMENT
Florianopolis, SC, 11-13 May 201027
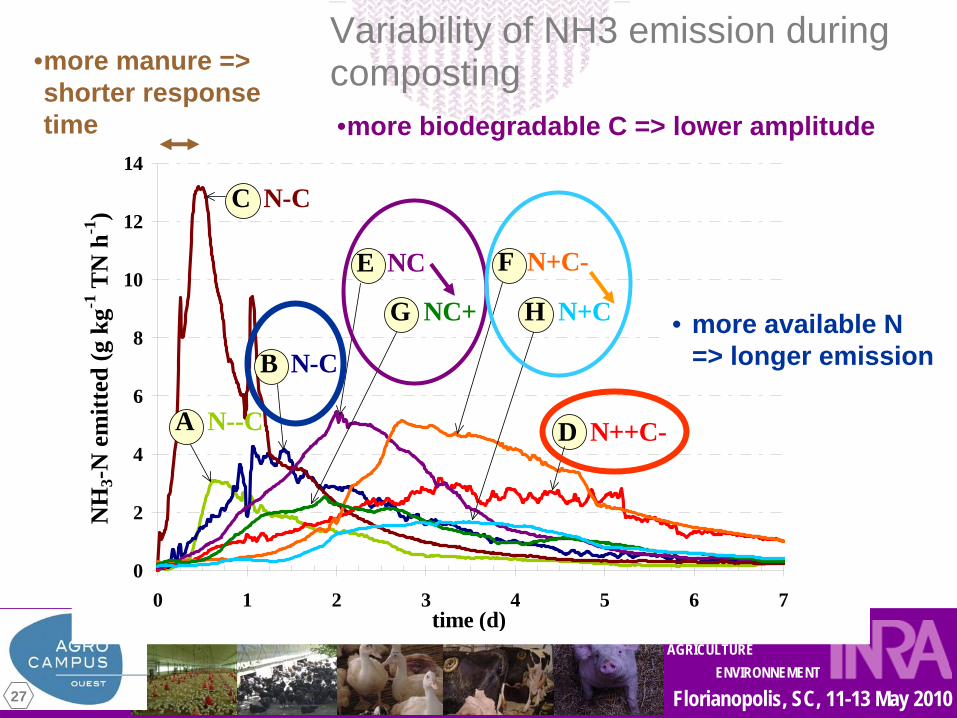
Variability of NH3 emission during composting
0
2
4
6
8
10
12
14
0 1 2 3 4 5 6 7
A N--C D N++C-
NH
3-N
em
itted
(g k
g-1 T
N h
-1)
time (d)
C N-C
B N-C
E NC F N+C-
H N+CG NC+
•more manure => shorter response time
• more available N => longer emission
•more biodegradable C => lower amplitude
ALIMENTATION AGRICULTURE
ENVIRONNEMENT
Florianopolis, SC, 11-13 May 201028
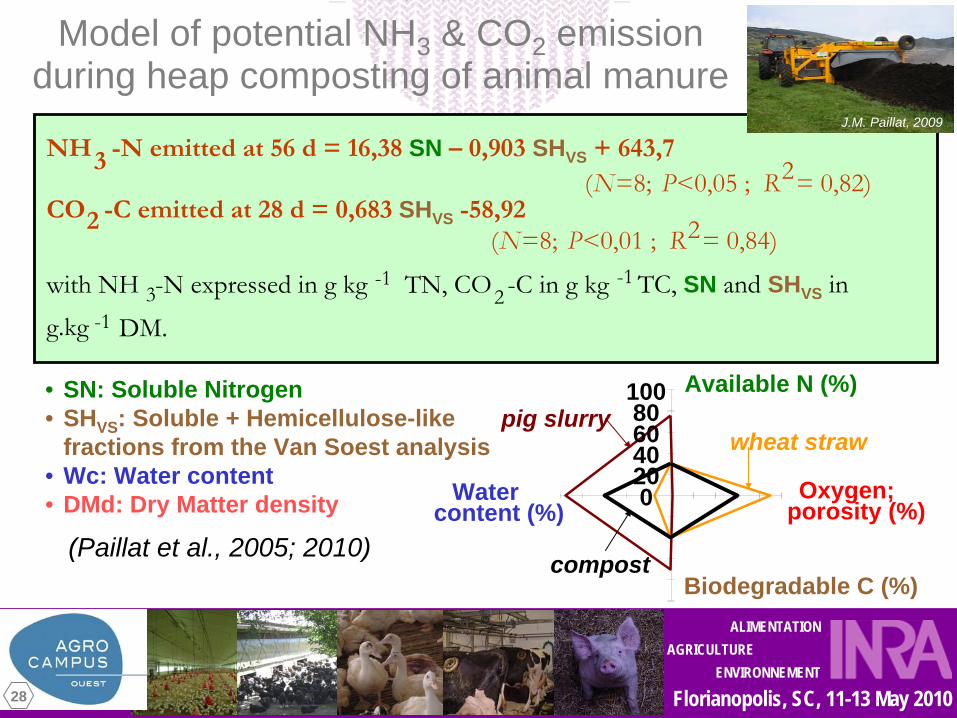
Model of potential NH3 & CO2 emission during heap composting of animal manure
NH3 -N emitted at 56 d = 16,38 SN –
0,903 SHVS + 643,7(N=8; P<0,05
; R2= 0,82)
CO2 -C emitted at 28 d = 0,683 SHVS -58,92(N=8; P<0,01
; R2= 0,84)
with NH 3-N expressed in g kg -1 TN, CO2 -C in g kg -1 TC, SN and SHVS ing.kg -1 DM.
• SN: Soluble Nitrogen• SHVS : Soluble + Hemicellulose-like
fractions from the Van Soest analysis• Wc: Water content• DMd: Dry Matter density 0
20406080
100 Available N (%)
Oxygen;porosity (%)
Biodegradable C (%)
Water content (%)
pig slurry
compost
wheat straw
(Paillat et al., 2005; 2010)
J.M. Paillat, 2009
ALIMENTATION AGRICULTURE
ENVIRONNEMENT
Florianopolis, SC, 11-13 May 201029
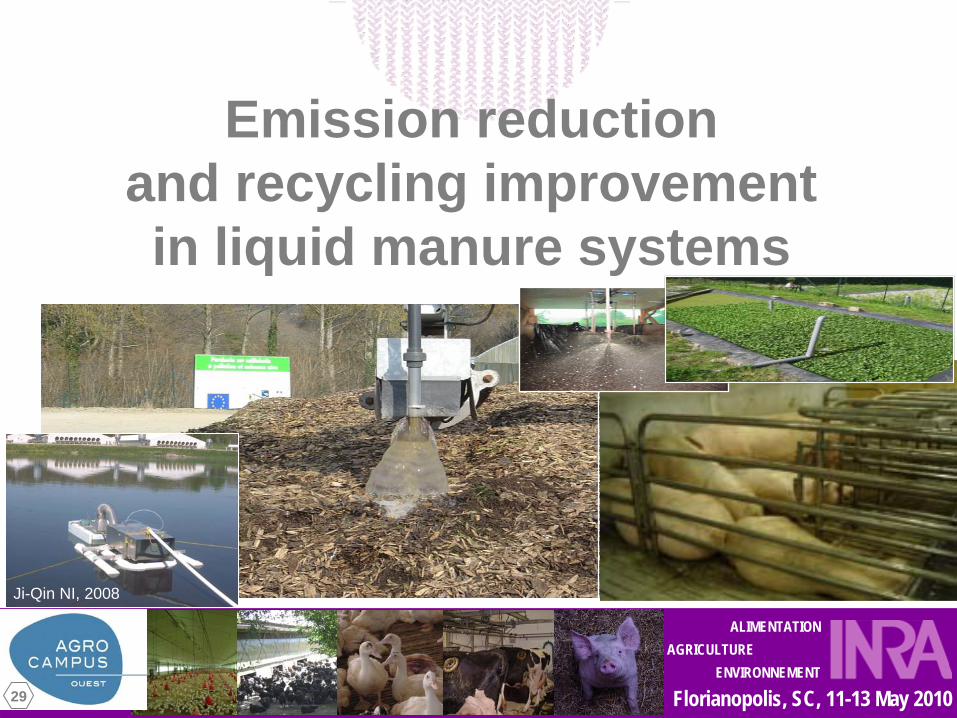
Emission reduction and recycling improvement in liquid manure systems
Ji-Qin NI, 2008
ALIMENTATION AGRICULTURE
ENVIRONNEMENT
Florianopolis, SC, 11-13 May 201030
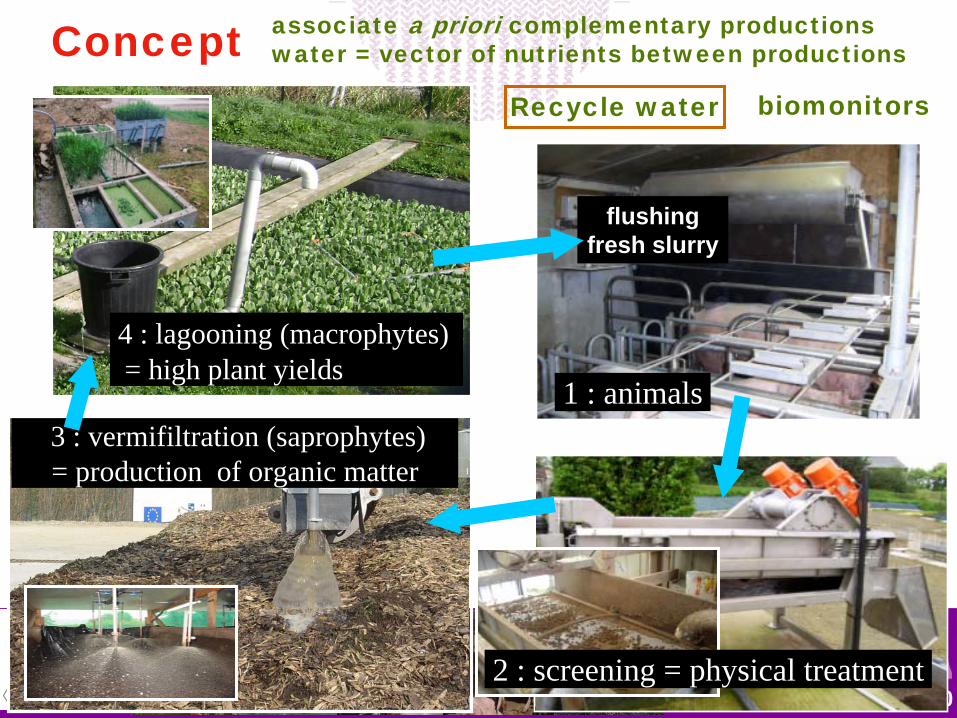
Concept associate a priori complementary productions water = vector of nutrients between productions
2 : screening = physical treatment
4 : lagooning (macrophytes)= high plant yields
1 : animals
flushingfresh slurry
3 : vermifiltration (saprophytes)= production of organic matter
Recycle water biomonitors
ALIMENTATION AGRICULTURE
ENVIRONNEMENT
Florianopolis, SC, 11-13 May 201031
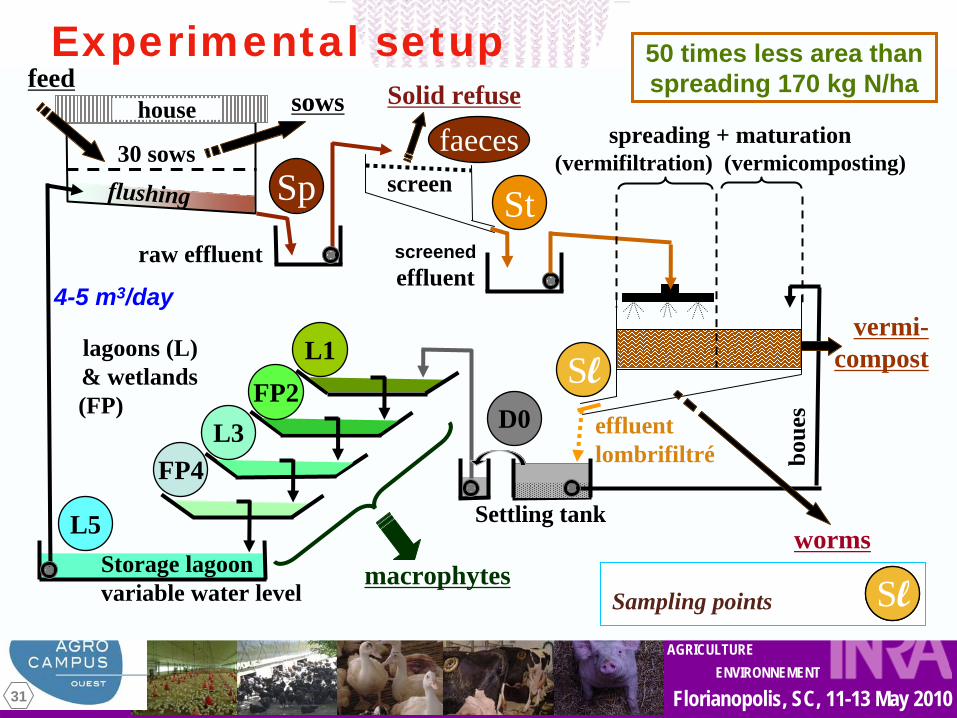
Experimental setup
macrophytesSlSampling points Sl
50 times less area than spreading 170 kg N/ha
lagoons (L) & wetlands(FP)
L1FP2
L3FP4
L5Storage lagoonvariable water level
4-5 m3/day
raw effluent
Sp30 sows
flushing
sowshousefeed
boue
s
Settling tank
D0
vermi- compost
spreading + maturation (vermifiltration) (vermicomposting)
worms
effluent lombrifiltré
Sl
screen
screened effluent
St
Solid refuse
faeces
ALIMENTATION AGRICULTURE
ENVIRONNEMENT
Florianopolis, SC, 11-13 May 201032
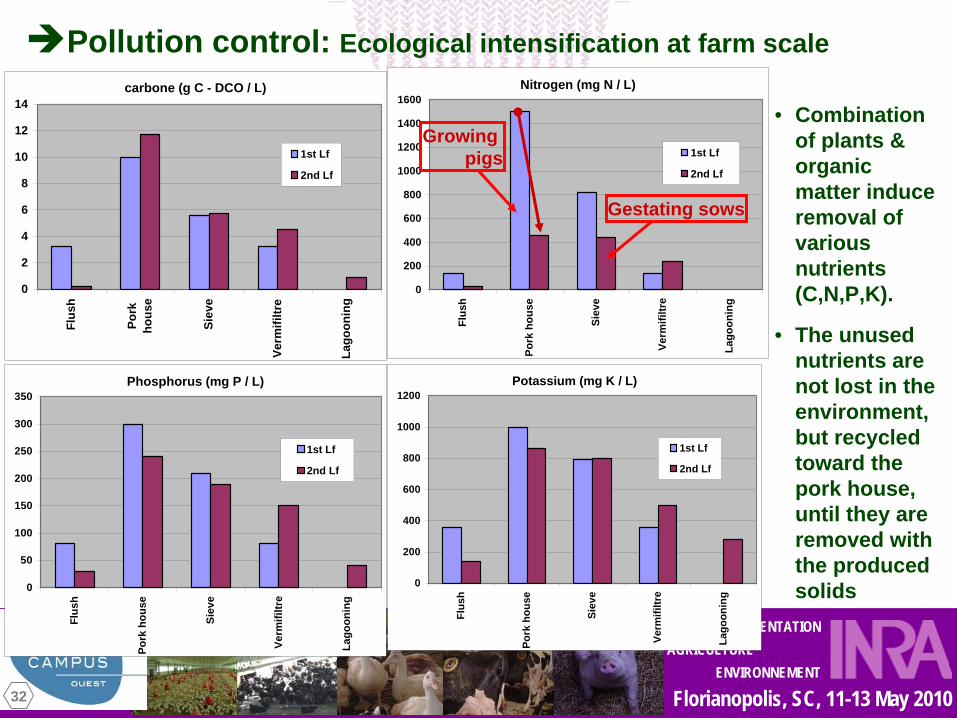
Pollution control: Ecological intensification at farm scale carbone (g C - DCO / L)
0
2
4
6
8
10
12
14
Flus
h
Pork
hous
e
Siev
e
Verm
ifiltr
e
Lago
onin
g
1st Lf
2nd Lf
Nitrogen (mg N / L)
0
200
400
600
800
1000
1200
1400
1600
Flus
h
Pork
hou
se
Siev
e
Verm
ifiltr
e
Lago
onin
g
1st Lf
2nd Lf
Phosphorus (mg P / L)
0
50
100
150
200
250
300
350
Flus
h
Pork
hou
se
Siev
e
Verm
ifiltr
e
Lago
onin
g
1st Lf
2nd Lf
Potassium (mg K / L)
0
200
400
600
800
1000
1200
Flus
h
Pork
hou
se
Siev
e
Verm
ifiltr
e
Lago
onin
g
1st Lf
2nd Lf
• Combination of plants & organic matter induce removal of various nutrients (C,N,P,K).
• The unused nutrients are not lost in the environment, but recycled toward the pork house, until they are removed with the produced solids
Gestating sows
Growing pigs
ALIMENTATION AGRICULTURE
ENVIRONNEMENT
Florianopolis, SC, 11-13 May 201033
summer 2008
0
100
200
300
400
500
Sp St Sl P0 P1 P2 P3 P4 P5
N (m
g/L)
autumn 2008
0
100
200
300
400
500
Sp St Sl P0 P1 P2 P3 P4 P5
spring 2009
0
100
200
300
400
500
Sp St Sl P0 P1 P2 P3 P4 P5
summer 2009
0
100
200
300
400
500
Sp St Sl P0 P1 P2 P3 P4 P5
summer 2008 autumn 2008 spring 2009 summer 2009
0
50
100
150
200
Sp St Sl P0 P1 P2 P3 P4 P5
Nitr
ogen
0
50
100
150
200
Sp St Sl P0 P1 P2 P3 P4 P50
50
100
150
200
Sp St Sl P0 P1 P2 P3 P4 P50
50
100
150
200
Sp St Sl P0 P1 P2 P3 P4 P5
P (m
g/L)
Pho
spho
rus
Pot
assi
um
0
200
400
600
800
Sp St Sl P0 P1 P2 P3 P4 P5
K (m
g/L)
0
200
400
600
800
Sp St Sl P0 P1 P2 P3 P4 P50
200
400
600
800
Sp St Sl P0 P1 P2 P3 P4 P50
200
400
600
800
Sp St Sl P0 P1 P2 P3 P4 P5
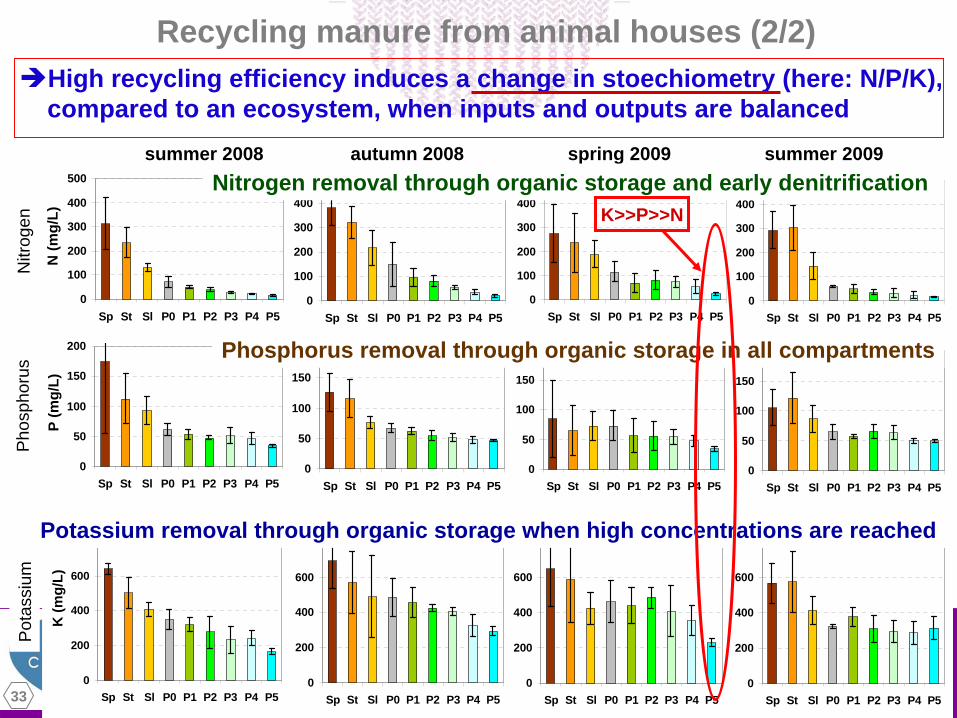
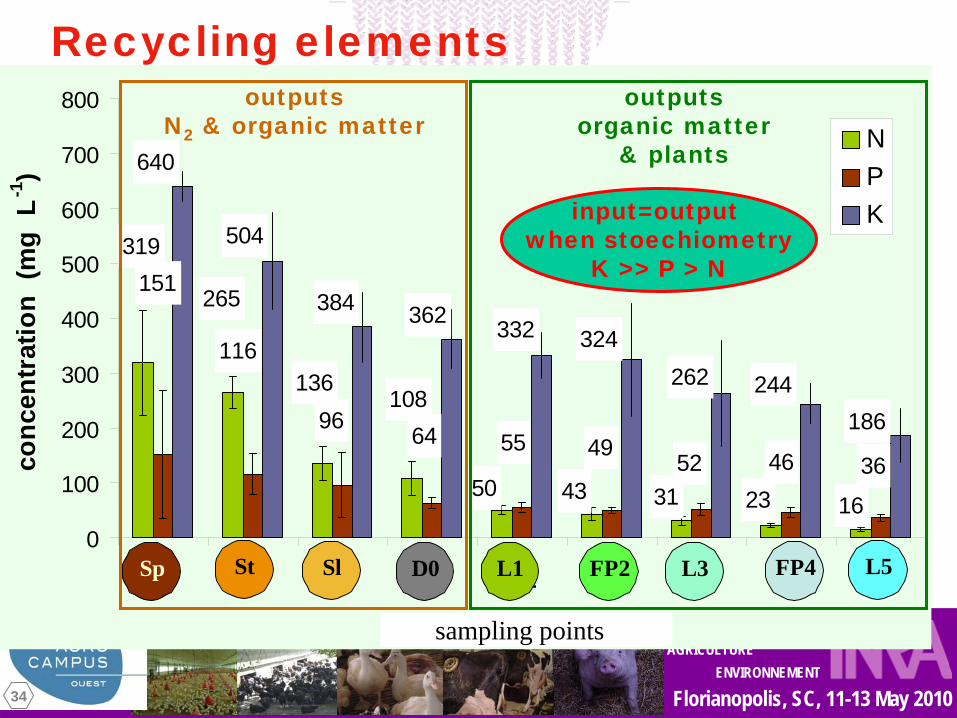
Recycling manure from animal houses (2/2) High recycling efficiency induces a change in stoechiometry (here: N/P/K),compared to an ecosystem, when inputs and outputs are balanced
Nitrogen removal through organic storage and early denitrification
Phosphorus removal through organic storage in all compartments
Potassium removal through organic storage when high concentrations are reached
K>>P>>N
ALIMENTATION AGRICULTURE
ENVIRONNEMENT
Florianopolis, SC, 11-13 May 201034
23314350
319
265
16
136108
151
116
524955
9664
46 36
640
504
384 362 332 324262 244
186
0
100
200
300
400
500
600
700
800
Sp St Sl P0 P1 P2 P3 P4 P5
points d'échantillonnage
conc
entr
atio
n (m
g L
-1)
NPK
Sp L5FP4L3FP2L1D0SlSt
sampling points
Recycling elementsoutputs
N2 & organic matteroutputs
organic matter & plants
input=output when stoechiometry
K >> P > N
ALIMENTATION AGRICULTURE
ENVIRONNEMENT
Florianopolis, SC, 11-13 May 201035
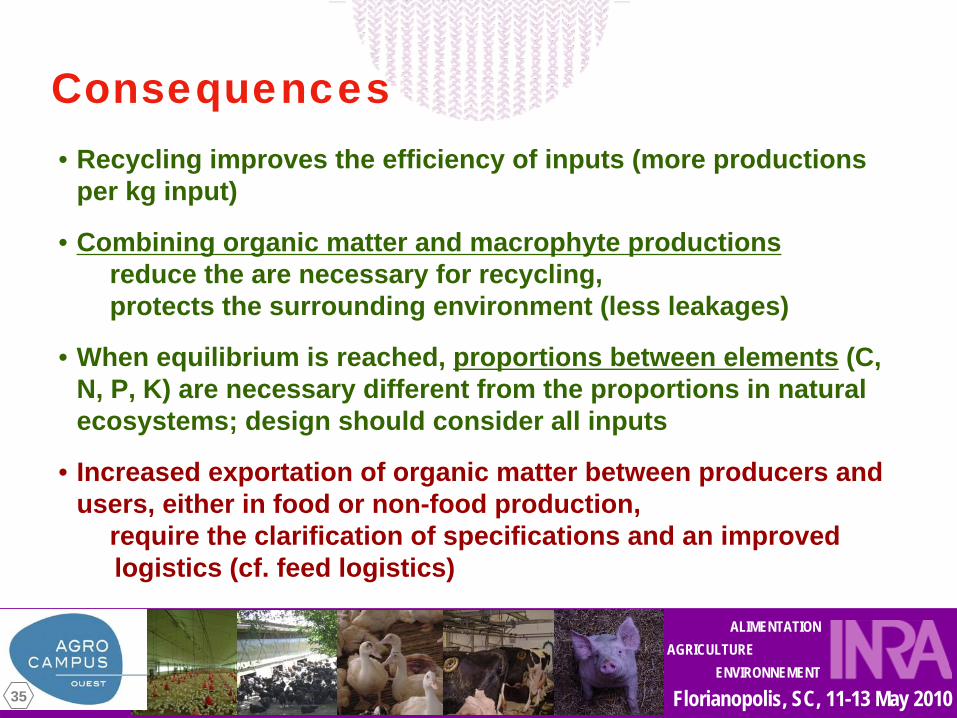
Consequences• Recycling improves the efficiency of inputs (more productions
per kg input)
• Combining organic matter and macrophyte productions reduce the are necessary for recycling,protects the surrounding environment (less leakages)
• When equilibrium is reached, proportions between elements (C, N, P, K) are necessary different from the proportions in natural ecosystems; design should consider all inputs
• Increased exportation of organic matter between producers and users, either in food or non-food production,
require the clarification of specifications and an improved logistics (cf. feed logistics)
ALIMENTATION AGRICULTURE
ENVIRONNEMENT
Florianopolis, SC, 11-13 May 201036
Conclusion:from local management to
global results
ALIMENTATION AGRICULTURE
ENVIRONNEMENT
Florianopolis, SC, 11-13 May 201037
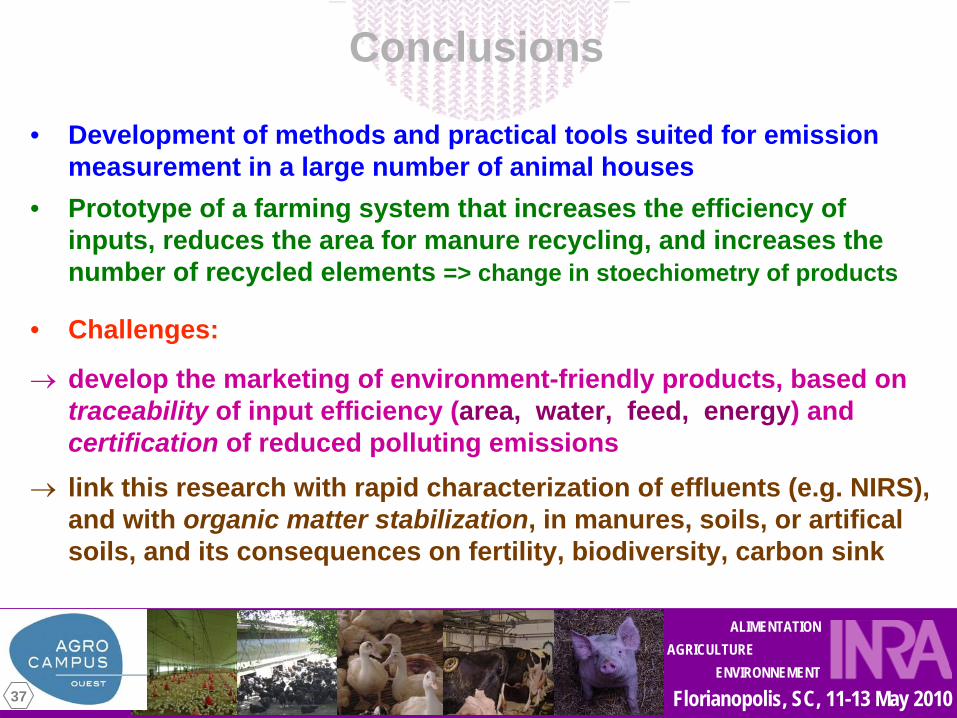
• Development of methods and practical tools suited for emission measurement in a large number of animal houses
• Prototype of a farming system that increases the efficiency of inputs, reduces the area for manure recycling, and increases the number of recycled elements => change in stoechiometry of products
• Challenges:
→
develop the marketing of environment-friendly products, based on traceability of input efficiency (area, water, feed, energy) and certification of reduced polluting emissions
→
link this research with rapid characterization of effluents (e.g. NIRS), and with organic matter stabilization, in manures, soils, or artifical soils, and its consequences on fertility, biodiversity, carbon sink
Conclusions