tre3014-nrf retail returns survey+canada-2014
TRANSCRIPT

AN
NU
AL
RE
TU
RN
SU
RV
EY
2014 Consumer Returns in the Retail Industry
2 2014 CONSUMER RETURNS IN THE RETAIL INDUSTRY
Introduction
The Retail Equation (TRE) is pleased to incorporate the results of the National Retail Federation (NRF) 2014 Return Fraud Survey into the 2014 Consumer Returns in the Retail Industry report. In an environment that shows a 20 percent increase in fraud compared to last year, retailers need a benchmarking point. This executive summary document provides return-related information that retailers may use to help compare and improve their business processes. Report objectives included:
◾ Identify US and Canadian retail industry return metrics—total return amounts, receipted/ non-receipted percentages, various examples of fraudulent and abusive returns, and fraud by tender type, as identified by retail respondents.
◾ Uncover other shortfalls caused by return fraud; for example, lost retail jobs and sales taxes.
◾ Understand current practices in the retail industry for processing merchandise returns, both brick and mortar and online.
◾ Compare the relative importance of return fraud and related shrink issues.
◾ Generate industry discussion regarding best practices for accepting customer returns and controlling return fraud and abuse to maximize profits and minimize losses.
Consumer Focus
Preventing fraud is only one of the challenges being contemplated at the retail return desk; improving the shopping experience is an equally important trend. Therefore, differentiating the consumer experience during the return process—such as offering “hassle free” returns—is often under consideration as a potential revenue driver. The ability to offer more flexible and lenient returns, while still mitigating the risk of fraud and abuse, is critical.
Participating Company Demographics
The NRF Return Fraud Survey was conducted by the National Retail Federation during October–November 2014 by polling senior loss prevention executives at 60 retail companies. Executives from all segments of retail including discount stores, department stores, drug stores, supermarkets, and specialty stores completed the survey. Some responses may represent multiple brands within a single company. The Retail Equation would like to thank all of the retailers who participated in this year’s NRF Return Fraud Survey. You will notice that no retailer names are mentioned, per the NRF and the sponsoring company’s commitment to maintain confidentiality of each organization’s data.
32014 CONSUMER RETURNS IN THE RETAIL INDUSTRY
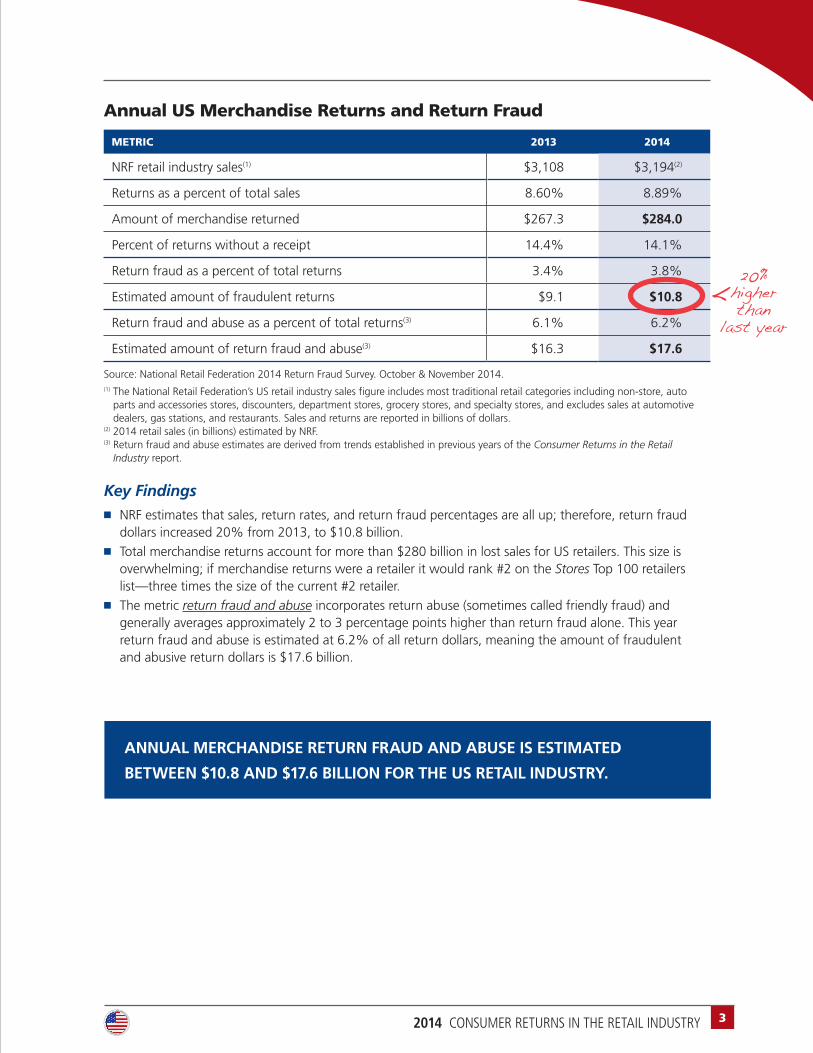
Annual US Merchandise Returns and Return Fraud
METRIC 2013 2014
NRF retail industry sales(1) $3,108 $3,194(2)
Returns as a percent of total sales 8.60% 8.89%
Amount of merchandise returned $267.3 $284.0
Percent of returns without a receipt 14.4% 14.1%
Return fraud as a percent of total returns 3.4% 3.8%
Estimated amount of fraudulent returns $9.1 $10.8
Return fraud and abuse as a percent of total returns(3) 6.1% 6.2%
Estimated amount of return fraud and abuse(3) $16.3 $17.6
Source: National Retail Federation 2014 Return Fraud Survey. October & November 2014.(1) The National Retail Federation’s US retail industry sales figure includes most traditional retail categories including non-store, auto
parts and accessories stores, discounters, department stores, grocery stores, and specialty stores, and excludes sales at automotive dealers, gas stations, and restaurants. Sales and returns are reported in billions of dollars.
(2) 2014 retail sales (in billions) estimated by NRF.(3) Return fraud and abuse estimates are derived from trends established in previous years of the Consumer Returns in the Retail
Industry report.
Key Findings ◾ NRF estimates that sales, return rates, and return fraud percentages are all up; therefore, return fraud
dollars increased 20% from 2013, to $10.8 billion. ◾ Total merchandise returns account for more than $280 billion in lost sales for US retailers. This size is
overwhelming; if merchandise returns were a retailer it would rank #2 on the Stores Top 100 retailers list—three times the size of the current #2 retailer.
◾ The metric return fraud and abuse incorporates return abuse (sometimes called friendly fraud) and generally averages approximately 2 to 3 percentage points higher than return fraud alone. This year return fraud and abuse is estimated at 6.2% of all return dollars, meaning the amount of fraudulent and abusive return dollars is $17.6 billion.
ANNUAL MERCHANDISE RETURN FRAUD AND ABUSE IS ESTIMATED
BETWEEN $10.8 AND $17.6 BILLION FOR THE US RETAIL INDUSTRY.
20% higher than
last year <
4 2014 CONSUMER RETURNS IN THE RETAIL INDUSTRY
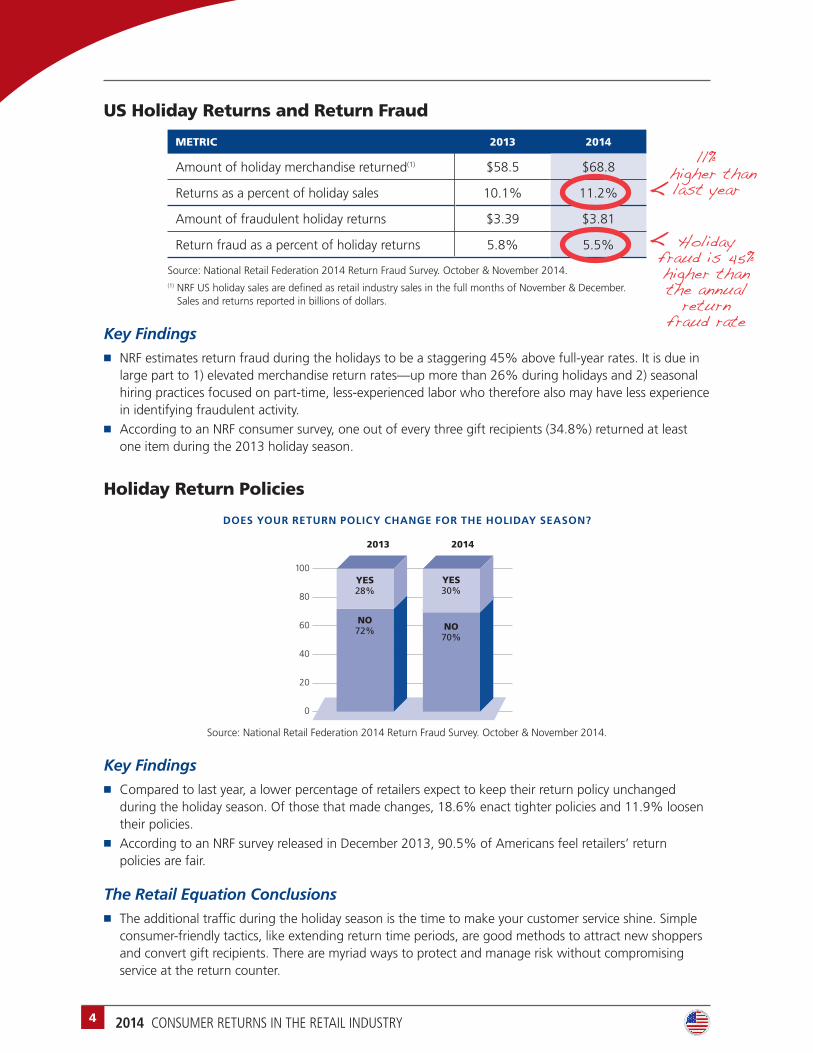
US Holiday Returns and Return Fraud
METRIC 2013 2014
Amount of holiday merchandise returned(1) $58.5 $68.8
Returns as a percent of holiday sales 10.1% 11.2%
Amount of fraudulent holiday returns $3.39 $3.81
Return fraud as a percent of holiday returns 5.8% 5.5%
Source: National Retail Federation 2014 Return Fraud Survey. October & November 2014. (1) NRF US holiday sales are defined as retail industry sales in the full months of November & December.
Sales and returns reported in billions of dollars.
Key Findings ◾ NRF estimates return fraud during the holidays to be a staggering 45% above full-year rates. It is due in
large part to 1) elevated merchandise return rates—up more than 26% during holidays and 2) seasonal hiring practices focused on part-time, less-experienced labor who therefore also may have less experience in identifying fraudulent activity.
◾ According to an NRF consumer survey, one out of every three gift recipients (34.8%) returned at least one item during the 2013 holiday season.
Holiday Return Policies
DOES YOUR RETURN POLICY CHANGE FOR THE HOLIDAY SEASON?
0
20
40
60
80
100
2014
NO70%
YES30%
2013
NO72%
YES28%
Source: National Retail Federation 2014 Return Fraud Survey. October & November 2014.
Key Findings ◾ Compared to last year, a lower percentage of retailers expect to keep their return policy unchanged
during the holiday season. Of those that made changes, 18.6% enact tighter policies and 11.9% loosen their policies.
◾ According to an NRF survey released in December 2013, 90.5% of Americans feel retailers’ return policies are fair.
The Retail Equation Conclusions ◾ The additional traffic during the holiday season is the time to make your customer service shine. Simple
consumer-friendly tactics, like extending return time periods, are good methods to attract new shoppers and convert gift recipients. There are myriad ways to protect and manage risk without compromising service at the return counter.
Holiday fraud is 45% higher than the annual
return fraud rate
ll% higher than
last year
<
<
52014 CONSUMER RETURNS IN THE RETAIL INDUSTRY
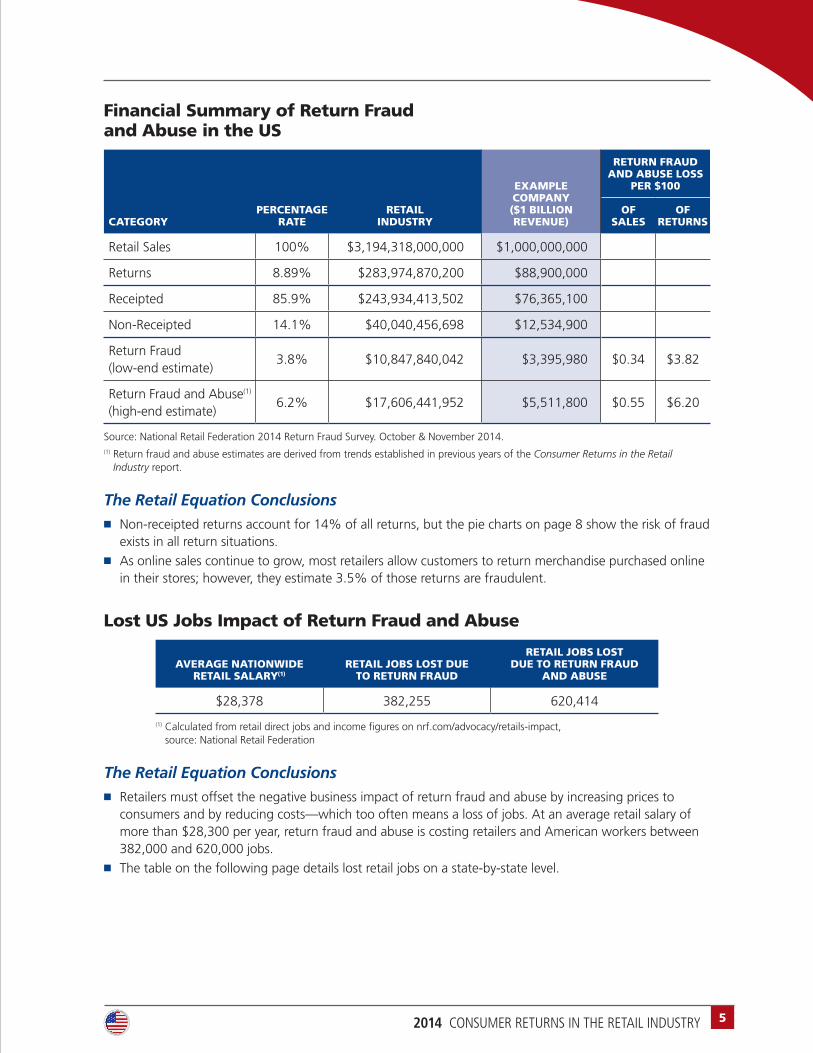
Financial Summary of Return Fraud and Abuse in the US
EXAMPLE COMPANY($1 BILLION REVENUE)
RETURN FRAUD AND ABUSE LOSS
PER $100
CATEGORYPERCENTAGE
RATERETAIL
INDUSTRYOF
SALESOF
RETURNS
Retail Sales 100% $3,194,318,000,000 $1,000,000,000
Returns 8.89% $283,974,870,200 $88,900,000
Receipted 85.9% $243,934,413,502 $76,365,100
Non-Receipted 14.1% $40,040,456,698 $12,534,900
Return Fraud (low-end estimate)
3.8% $10,847,840,042 $3,395,980 $0.34 $3.82
Return Fraud and Abuse(1) (high-end estimate)
6.2% $17,606,441,952 $5,511,800 $0.55 $6.20
Source: National Retail Federation 2014 Return Fraud Survey. October & November 2014.(1) Return fraud and abuse estimates are derived from trends established in previous years of the Consumer Returns in the Retail
Industry report.
The Retail Equation Conclusions ◾ Non-receipted returns account for 14% of all returns, but the pie charts on page 8 show the risk of fraud
exists in all return situations. ◾ As online sales continue to grow, most retailers allow customers to return merchandise purchased online
in their stores; however, they estimate 3.5% of those returns are fraudulent.
Lost US Jobs Impact of Return Fraud and Abuse
AVERAGE NATIONWIDE RETAIL SALARY(1)
RETAIL JOBS LOST DUE TO RETURN FRAUD
RETAIL JOBS LOST DUE TO RETURN FRAUD
AND ABUSE
$28,378 382,255 620,414
(1) Calculated from retail direct jobs and income figures on nrf.com/advocacy/retails-impact, source: National Retail Federation
The Retail Equation Conclusions ◾ Retailers must offset the negative business impact of return fraud and abuse by increasing prices to
consumers and by reducing costs—which too often means a loss of jobs. At an average retail salary of more than $28,300 per year, return fraud and abuse is costing retailers and American workers between 382,000 and 620,000 jobs.
◾ The table on the following page details lost retail jobs on a state-by-state level.
6 2014 CONSUMER RETURNS IN THE RETAIL INDUSTRY
STATE
% OF NATIONWIDE
RETAIL SALES(1) SALES RETURNSSTATE SALES TAX RATE(2)
LOW-END ESTIMATE(4) HIGH-END ESTIMATE(5)
RETURN FRAUDLOST SALES
TAX REVENUELOST RETAIL
JOBS IN STATE(3)RETURN
FRAUD/ABUSELOST SALES
TAX REVENUELOST RETAIL
JOBS IN STATE(3)
Alabama 1.50% $47,914,770,000 $4,675,253,049 4.000% $178,594,666 $7,143,787 7,137 $289,865,689 $11,594,628 11,583
Alaska 0.26% $8,305,226,800 $810,377,195 0.000% $30,956,409 $0 942 $50,243,386 $0 1,529
Arizona 2.24% $71,552,723,200 $6,981,711,220 5.600% $266,701,369 $14,935,277 8,825 $432,866,096 $24,240,501 14,324
Arkansas 0.91% $29,068,293,800 $2,836,320,183 6.500% $108,347,431 $7,042,583 4,315 $175,851,851 $11,430,370 7,003
California 11.90% $380,123,842,000 $37,090,340,856 6.500% $1,416,851,021 $92,095,316 43,326 $2,299,601,133 $149,474,074 70,320
Colorado 1.70% $54,303,406,000 $5,298,620,122 2.900% $202,407,289 $5,869,811 7,183 $328,514,448 $9,526,919 11,659
Connecticut 1.25% $39,928,975,000 $3,896,044,208 6.350% $148,828,889 $9,450,634 4,511 $241,554,741 $15,338,726 7,322
Dist. Of Columbia 0.15% $4,791,477,000 $467,525,305 5.750% $17,859,467 $1,026,919 649 $28,986,569 $1,666,728 1,053
Delaware 0.37% $11,818,976,600 $1,153,229,085 0.000% $44,053,351 $0 1,357 $71,500,203 $0 2,202
Florida 7.30% $233,185,214,000 $22,752,898,172 6.000% $869,160,710 $52,149,643 30,278 $1,410,679,687 $84,640,781 49,143
Georgia 3.01% $96,148,971,800 $9,381,674,452 4.000% $358,379,964 $14,335,199 13,436 $581,663,816 $23,266,553 21,808
Hawaii 0.50% $15,971,590,000 $1,558,417,683 4.000% $59,531,555 $2,381,262 2,068 $96,621,896 $3,864,876 3,357
Idaho 0.51% $16,291,021,800 $1,589,586,037 6.000% $60,722,187 $3,643,331 2,397 $98,554,334 $5,913,260 3,891
Illinois 4.05% $129,369,879,000 $12,623,183,232 6.250% $482,205,599 $30,137,850 16,842 $782,637,360 $48,914,835 27,335
Indiana 1.99% $63,566,928,200 $6,202,502,378 7.000% $236,935,591 $16,585,491 9,671 $384,555,147 $26,918,860 15,696
Iowa 0.92% $29,387,725,600 $2,867,488,537 6.000% $109,538,062 $6,572,284 4,695 $177,784,289 $10,667,057 7,620
Kansas 0.79% $25,235,112,200 $2,462,299,939 6.150% $94,059,858 $5,784,681 3,719 $152,662,596 $9,388,750 6,037
Kentucky 1.26% $40,248,406,800 $3,927,212,561 6.000% $150,019,520 $9,001,171 5,980 $243,487,179 $14,609,231 9,706
Louisiana 1.33% $42,484,429,400 $4,145,391,037 4.000% $158,353,938 $6,334,158 5,890 $257,014,244 $10,280,570 9,560
Maine 0.51% $16,291,021,800 $1,589,586,037 5.500% $60,722,187 $3,339,720 2,303 $98,554,334 $5,420,488 3,737
Maryland 1.99% $63,566,928,200 $6,202,502,378 6.000% $236,935,591 $14,216,135 7,947 $384,555,147 $23,073,309 12,898
Massachusetts 2.34% $74,747,041,200 $7,293,394,757 6.250% $278,607,680 $17,412,980 9,357 $452,190,475 $28,261,905 15,187
Michigan 3.10% $99,023,858,000 $9,662,189,635 6.000% $369,095,644 $22,145,739 14,480 $599,055,757 $35,943,345 23,502
Minnesota 1.80% $57,497,724,000 $5,610,303,659 6.875% $214,313,600 $14,734,060 8,500 $347,838,827 $23,913,919 13,796
Mississippi 0.89% $28,429,430,200 $2,773,983,476 7.000% $105,966,169 $7,417,632 4,219 $171,986,975 $12,039,088 6,847
Missouri 1.97% $62,928,064,600 $6,140,165,671 4.225% $234,554,329 $9,909,920 9,134 $380,690,272 $16,084,164 14,824
Montana 0.36% $11,499,544,800 $1,122,060,732 0.000% $42,862,720 $0 1,723 $69,567,765 $0 2,797
Nebraska 0.62% $19,804,771,600 $1,932,437,927 5.500% $73,819,129 $4,060,052 3,068 $119,811,151 $6,589,613 4,979
Nevada 1.14% $36,415,225,200 $3,553,192,317 6.850% $135,731,947 $9,297,638 4,448 $220,297,924 $15,090,408 7,219
New Hampshire 0.67% $21,401,930,600 $2,088,279,695 0.000% $79,772,284 $0 2,591 $129,473,341 $0 4,206
New Jersey 3.12% $99,662,721,600 $9,724,526,342 7.000% $371,476,906 $26,003,383 11,239 $602,920,633 $42,204,444 18,241
New Mexico 0.62% $19,804,771,600 $1,932,437,927 5.125% $73,819,129 $3,783,230 2,820 $119,811,151 $6,140,322 4,577
New York 5.93% $189,423,057,400 $18,482,833,721 4.000% $706,044,248 $28,241,770 21,762 $1,145,935,691 $45,837,428 35,321
North Carolina 2.89% $92,315,790,200 $9,007,654,208 4.750% $344,092,391 $16,344,389 13,198 $558,474,561 $26,527,542 21,421
North Dakota 0.25% $7,985,795,000 $779,208,842 5.000% $29,765,778 $1,488,289 1,151 $48,310,948 $2,415,547 1,868
Ohio 3.39% $108,287,380,200 $10,566,071,891 5.750% $403,623,946 $23,208,377 15,588 $655,096,457 $37,668,046 25,301
Oklahoma 1.00% $31,943,180,000 $3,116,835,366 4.500% $119,063,111 $5,357,840 4,272 $193,243,793 $8,695,971 6,934
Oregon 1.27% $40,567,838,600 $3,958,380,915 0.000% $151,210,151 $0 5,436 $245,419,617 $0 8,824
Pennsylvania 4.07% $130,008,742,600 $12,685,519,940 6.000% $484,586,862 $29,075,212 18,323 $786,502,236 $47,190,134 29,739
Rhode Island 0.34% $10,860,681,200 $1,059,724,024 7.000% $40,481,458 $2,833,702 1,439 $65,702,890 $4,599,202 2,336
South Carolina 1.36% $43,442,724,800 $4,238,896,098 6.000% $161,925,831 $9,715,550 6,380 $262,811,558 $15,768,693 10,354
South Dakota 0.32% $10,221,817,600 $997,387,317 4.000% $38,100,196 $1,524,008 1,609 $61,838,014 $2,473,521 2,611
Tennessee 2.10% $67,080,678,000 $6,545,354,269 7.000% $250,032,533 $17,502,277 8,899 $405,811,965 $28,406,838 14,444
Texas 7.49% $239,254,418,200 $23,345,096,892 6.250% $891,782,701 $55,736,419 31,357 $1,447,396,007 $90,462,250 50,893
Utah 0.84% $26,832,271,200 $2,618,141,707 4.700% $100,013,013 $4,700,612 3,573 $162,324,786 $7,629,265 5,800
Vermont 0.25% $7,985,795,000 $779,208,842 6.000% $29,765,778 $1,785,947 1,084 $48,310,948 $2,898,657 1,759
Virginia 2.63% $84,010,563,400 $8,197,277,013 5.000% $313,135,982 $15,656,799 11,694 $508,231,175 $25,411,559 18,980
Washington 2.26% $72,191,586,800 $7,044,047,927 6.500% $269,082,631 $17,490,371 8,153 $436,730,971 $28,387,513 13,233
West Virginia 0.54% $17,249,317,200 $1,683,091,098 6.000% $64,294,080 $3,857,645 2,648 $104,351,648 $6,261,099 4,298
Wisconsin 1.80% $57,497,724,000 $5,610,303,659 5.000% $214,313,600 $10,715,680 8,889 $347,838,827 $17,391,941 14,426
Wyoming 0.21% $6,708,067,800 $654,535,427 4.000% $25,003,253 $1,000,130 945 $40,581,196 $1,623,248 1,534
Total $663,044,903 $1,076,146,178 (1) Source: National Retail Federation (2) Source: Federation of Tax Administrators
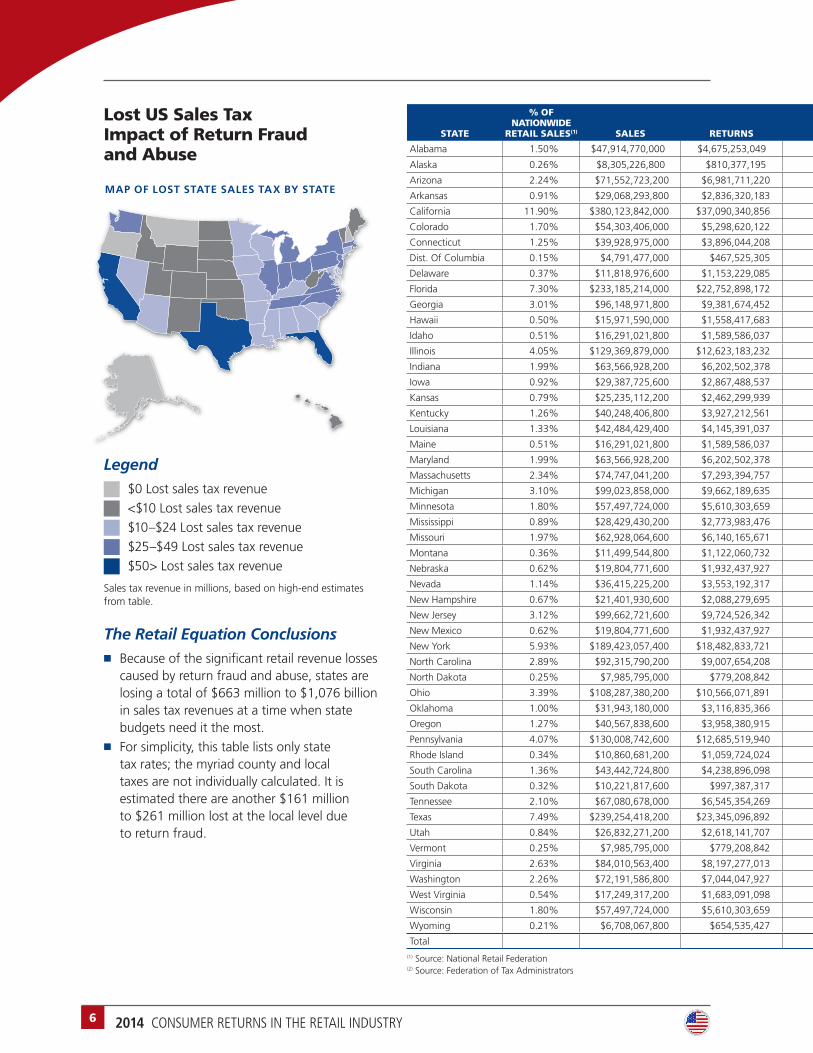
Lost US Sales Tax Impact of Return Fraud and Abuse MAP OF LOST STATE SALES TAX BY STATE
Legend $0 Lost sales tax revenue <$10 Lost sales tax revenue $10–$24 Lost sales tax revenue $25–$49 Lost sales tax revenue $50> Lost sales tax revenue
Sales tax revenue in millions, based on high-end estimates from table.
The Retail Equation Conclusions ◾ Because of the significant retail revenue losses
caused by return fraud and abuse, states are losing a total of $663 million to $1,076 billion in sales tax revenues at a time when state budgets need it the most.
◾ For simplicity, this table lists only state tax rates; the myriad county and local taxes are not individually calculated. It is estimated there are another $161 million to $261 million lost at the local level due to return fraud.
72014 CONSUMER RETURNS IN THE RETAIL INDUSTRY
STATE
% OF NATIONWIDE
RETAIL SALES(1) SALES RETURNSSTATE SALES TAX RATE(2)
LOW-END ESTIMATE(4) HIGH-END ESTIMATE(5)
RETURN FRAUDLOST SALES
TAX REVENUELOST RETAIL
JOBS IN STATE(3)RETURN
FRAUD/ABUSELOST SALES
TAX REVENUELOST RETAIL
JOBS IN STATE(3)
Alabama 1.50% $47,914,770,000 $4,675,253,049 4.000% $178,594,666 $7,143,787 7,137 $289,865,689 $11,594,628 11,583
Alaska 0.26% $8,305,226,800 $810,377,195 0.000% $30,956,409 $0 942 $50,243,386 $0 1,529
Arizona 2.24% $71,552,723,200 $6,981,711,220 5.600% $266,701,369 $14,935,277 8,825 $432,866,096 $24,240,501 14,324
Arkansas 0.91% $29,068,293,800 $2,836,320,183 6.500% $108,347,431 $7,042,583 4,315 $175,851,851 $11,430,370 7,003
California 11.90% $380,123,842,000 $37,090,340,856 6.500% $1,416,851,021 $92,095,316 43,326 $2,299,601,133 $149,474,074 70,320
Colorado 1.70% $54,303,406,000 $5,298,620,122 2.900% $202,407,289 $5,869,811 7,183 $328,514,448 $9,526,919 11,659
Connecticut 1.25% $39,928,975,000 $3,896,044,208 6.350% $148,828,889 $9,450,634 4,511 $241,554,741 $15,338,726 7,322
Dist. Of Columbia 0.15% $4,791,477,000 $467,525,305 5.750% $17,859,467 $1,026,919 649 $28,986,569 $1,666,728 1,053
Delaware 0.37% $11,818,976,600 $1,153,229,085 0.000% $44,053,351 $0 1,357 $71,500,203 $0 2,202
Florida 7.30% $233,185,214,000 $22,752,898,172 6.000% $869,160,710 $52,149,643 30,278 $1,410,679,687 $84,640,781 49,143
Georgia 3.01% $96,148,971,800 $9,381,674,452 4.000% $358,379,964 $14,335,199 13,436 $581,663,816 $23,266,553 21,808
Hawaii 0.50% $15,971,590,000 $1,558,417,683 4.000% $59,531,555 $2,381,262 2,068 $96,621,896 $3,864,876 3,357
Idaho 0.51% $16,291,021,800 $1,589,586,037 6.000% $60,722,187 $3,643,331 2,397 $98,554,334 $5,913,260 3,891
Illinois 4.05% $129,369,879,000 $12,623,183,232 6.250% $482,205,599 $30,137,850 16,842 $782,637,360 $48,914,835 27,335
Indiana 1.99% $63,566,928,200 $6,202,502,378 7.000% $236,935,591 $16,585,491 9,671 $384,555,147 $26,918,860 15,696
Iowa 0.92% $29,387,725,600 $2,867,488,537 6.000% $109,538,062 $6,572,284 4,695 $177,784,289 $10,667,057 7,620
Kansas 0.79% $25,235,112,200 $2,462,299,939 6.150% $94,059,858 $5,784,681 3,719 $152,662,596 $9,388,750 6,037
Kentucky 1.26% $40,248,406,800 $3,927,212,561 6.000% $150,019,520 $9,001,171 5,980 $243,487,179 $14,609,231 9,706
Louisiana 1.33% $42,484,429,400 $4,145,391,037 4.000% $158,353,938 $6,334,158 5,890 $257,014,244 $10,280,570 9,560
Maine 0.51% $16,291,021,800 $1,589,586,037 5.500% $60,722,187 $3,339,720 2,303 $98,554,334 $5,420,488 3,737
Maryland 1.99% $63,566,928,200 $6,202,502,378 6.000% $236,935,591 $14,216,135 7,947 $384,555,147 $23,073,309 12,898
Massachusetts 2.34% $74,747,041,200 $7,293,394,757 6.250% $278,607,680 $17,412,980 9,357 $452,190,475 $28,261,905 15,187
Michigan 3.10% $99,023,858,000 $9,662,189,635 6.000% $369,095,644 $22,145,739 14,480 $599,055,757 $35,943,345 23,502
Minnesota 1.80% $57,497,724,000 $5,610,303,659 6.875% $214,313,600 $14,734,060 8,500 $347,838,827 $23,913,919 13,796
Mississippi 0.89% $28,429,430,200 $2,773,983,476 7.000% $105,966,169 $7,417,632 4,219 $171,986,975 $12,039,088 6,847
Missouri 1.97% $62,928,064,600 $6,140,165,671 4.225% $234,554,329 $9,909,920 9,134 $380,690,272 $16,084,164 14,824
Montana 0.36% $11,499,544,800 $1,122,060,732 0.000% $42,862,720 $0 1,723 $69,567,765 $0 2,797
Nebraska 0.62% $19,804,771,600 $1,932,437,927 5.500% $73,819,129 $4,060,052 3,068 $119,811,151 $6,589,613 4,979
Nevada 1.14% $36,415,225,200 $3,553,192,317 6.850% $135,731,947 $9,297,638 4,448 $220,297,924 $15,090,408 7,219
New Hampshire 0.67% $21,401,930,600 $2,088,279,695 0.000% $79,772,284 $0 2,591 $129,473,341 $0 4,206
New Jersey 3.12% $99,662,721,600 $9,724,526,342 7.000% $371,476,906 $26,003,383 11,239 $602,920,633 $42,204,444 18,241
New Mexico 0.62% $19,804,771,600 $1,932,437,927 5.125% $73,819,129 $3,783,230 2,820 $119,811,151 $6,140,322 4,577
New York 5.93% $189,423,057,400 $18,482,833,721 4.000% $706,044,248 $28,241,770 21,762 $1,145,935,691 $45,837,428 35,321
North Carolina 2.89% $92,315,790,200 $9,007,654,208 4.750% $344,092,391 $16,344,389 13,198 $558,474,561 $26,527,542 21,421
North Dakota 0.25% $7,985,795,000 $779,208,842 5.000% $29,765,778 $1,488,289 1,151 $48,310,948 $2,415,547 1,868
Ohio 3.39% $108,287,380,200 $10,566,071,891 5.750% $403,623,946 $23,208,377 15,588 $655,096,457 $37,668,046 25,301
Oklahoma 1.00% $31,943,180,000 $3,116,835,366 4.500% $119,063,111 $5,357,840 4,272 $193,243,793 $8,695,971 6,934
Oregon 1.27% $40,567,838,600 $3,958,380,915 0.000% $151,210,151 $0 5,436 $245,419,617 $0 8,824
Pennsylvania 4.07% $130,008,742,600 $12,685,519,940 6.000% $484,586,862 $29,075,212 18,323 $786,502,236 $47,190,134 29,739
Rhode Island 0.34% $10,860,681,200 $1,059,724,024 7.000% $40,481,458 $2,833,702 1,439 $65,702,890 $4,599,202 2,336
South Carolina 1.36% $43,442,724,800 $4,238,896,098 6.000% $161,925,831 $9,715,550 6,380 $262,811,558 $15,768,693 10,354
South Dakota 0.32% $10,221,817,600 $997,387,317 4.000% $38,100,196 $1,524,008 1,609 $61,838,014 $2,473,521 2,611
Tennessee 2.10% $67,080,678,000 $6,545,354,269 7.000% $250,032,533 $17,502,277 8,899 $405,811,965 $28,406,838 14,444
Texas 7.49% $239,254,418,200 $23,345,096,892 6.250% $891,782,701 $55,736,419 31,357 $1,447,396,007 $90,462,250 50,893
Utah 0.84% $26,832,271,200 $2,618,141,707 4.700% $100,013,013 $4,700,612 3,573 $162,324,786 $7,629,265 5,800
Vermont 0.25% $7,985,795,000 $779,208,842 6.000% $29,765,778 $1,785,947 1,084 $48,310,948 $2,898,657 1,759
Virginia 2.63% $84,010,563,400 $8,197,277,013 5.000% $313,135,982 $15,656,799 11,694 $508,231,175 $25,411,559 18,980
Washington 2.26% $72,191,586,800 $7,044,047,927 6.500% $269,082,631 $17,490,371 8,153 $436,730,971 $28,387,513 13,233
West Virginia 0.54% $17,249,317,200 $1,683,091,098 6.000% $64,294,080 $3,857,645 2,648 $104,351,648 $6,261,099 4,298
Wisconsin 1.80% $57,497,724,000 $5,610,303,659 5.000% $214,313,600 $10,715,680 8,889 $347,838,827 $17,391,941 14,426
Wyoming 0.21% $6,708,067,800 $654,535,427 4.000% $25,003,253 $1,000,130 945 $40,581,196 $1,623,248 1,534
Total $663,044,903 $1,076,146,178 (1) Source: National Retail Federation (2) Source: Federation of Tax Administrators
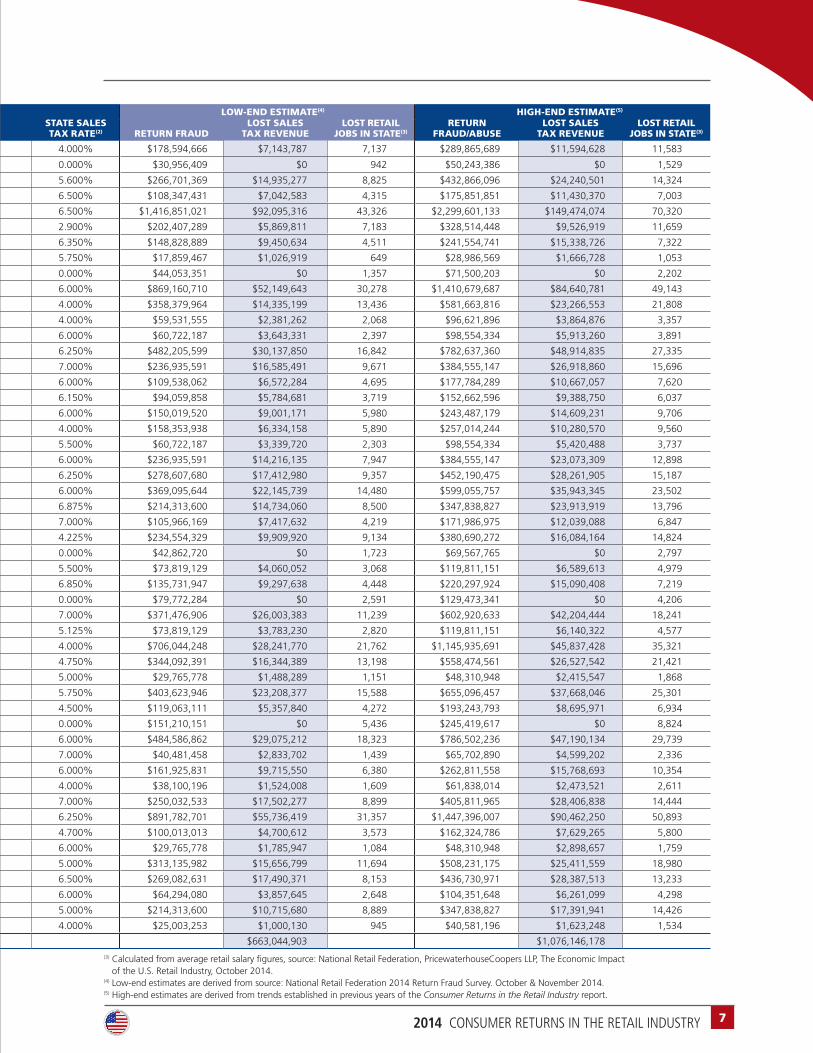
(3) Calculated from average retail salary figures, source: National Retail Federation, PricewaterhouseCoopers LLP, The Economic Impact of the U.S. Retail Industry, October 2014.
(4) Low-end estimates are derived from source: National Retail Federation 2014 Return Fraud Survey. October & November 2014.(5) High-end estimates are derived from trends established in previous years of the Consumer Returns in the Retail Industry report.
8 2014 CONSUMER RETURNS IN THE RETAIL INDUSTRY
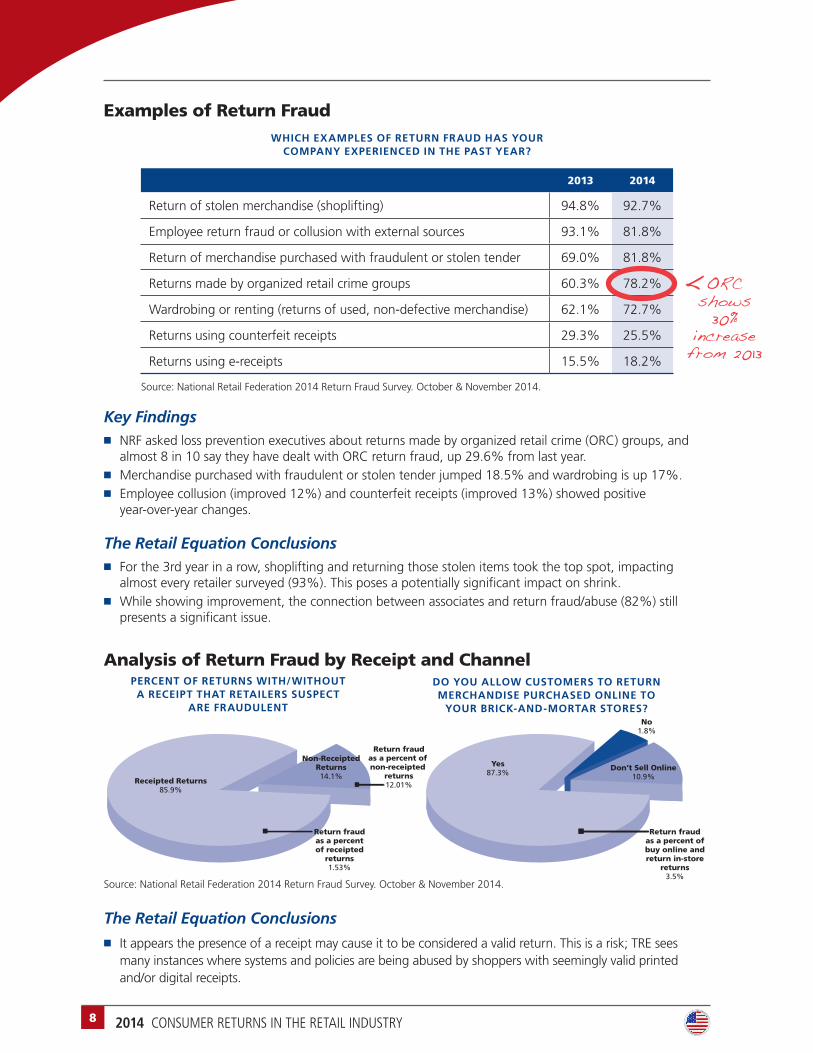
Examples of Return FraudWHICH EXAMPLES OF RETURN FRAUD HAS YOUR
COMPANY EXPERIENCED IN THE PAST YEAR?
2013 2014
Return of stolen merchandise (shoplifting) 94.8% 92.7%
Employee return fraud or collusion with external sources 93.1% 81.8%
Return of merchandise purchased with fraudulent or stolen tender 69.0% 81.8%
Returns made by organized retail crime groups 60.3% 78.2%
Wardrobing or renting (returns of used, non-defective merchandise) 62.1% 72.7%
Returns using counterfeit receipts 29.3% 25.5%
Returns using e-receipts 15.5% 18.2%
Source: National Retail Federation 2014 Return Fraud Survey. October & November 2014.
Key Findings ◾ NRF asked loss prevention executives about returns made by organized retail crime (ORC) groups, and
almost 8 in 10 say they have dealt with ORC return fraud, up 29.6% from last year. ◾ Merchandise purchased with fraudulent or stolen tender jumped 18.5% and wardrobing is up 17%. ◾ Employee collusion (improved 12%) and counterfeit receipts (improved 13%) showed positive
year-over-year changes.
The Retail Equation Conclusions ◾ For the 3rd year in a row, shoplifting and returning those stolen items took the top spot, impacting
almost every retailer surveyed (93%). This poses a potentially significant impact on shrink. ◾ While showing improvement, the connection between associates and return fraud/abuse (82%) still
presents a significant issue.
Analysis of Return Fraud by Receipt and Channel
Source: National Retail Federation 2014 Return Fraud Survey. October & November 2014.
The Retail Equation Conclusions
◾ It appears the presence of a receipt may cause it to be considered a valid return. This is a risk; TRE sees many instances where systems and policies are being abused by shoppers with seemingly valid printed and/or digital receipts.
Yes87.3%
No1.8%
Don’t Sell Online10.9%
Return fraudas a percent ofbuy online andreturn in-store
returns3.5%
Return fraudas a percentof receipted
returns1.53%
Receipted Returns85.9%
Non-ReceiptedReturns14.1%
Return fraudas a percent of non-receipted
returns12.01%
ORCshows 30%
increase from 2013
<
PERCENT OF RETURNS WITH/WITHOUT A RECEIPT THAT RETAILERS SUSPECT
ARE FRAUDULENT
DO YOU ALLOW CUSTOMERS TO RETURN MERCHANDISE PURCHASED ONLINE TO
YOUR BRICK-AND-MORTAR STORES?
92014 CONSUMER RETURNS IN THE RETAIL INDUSTRY
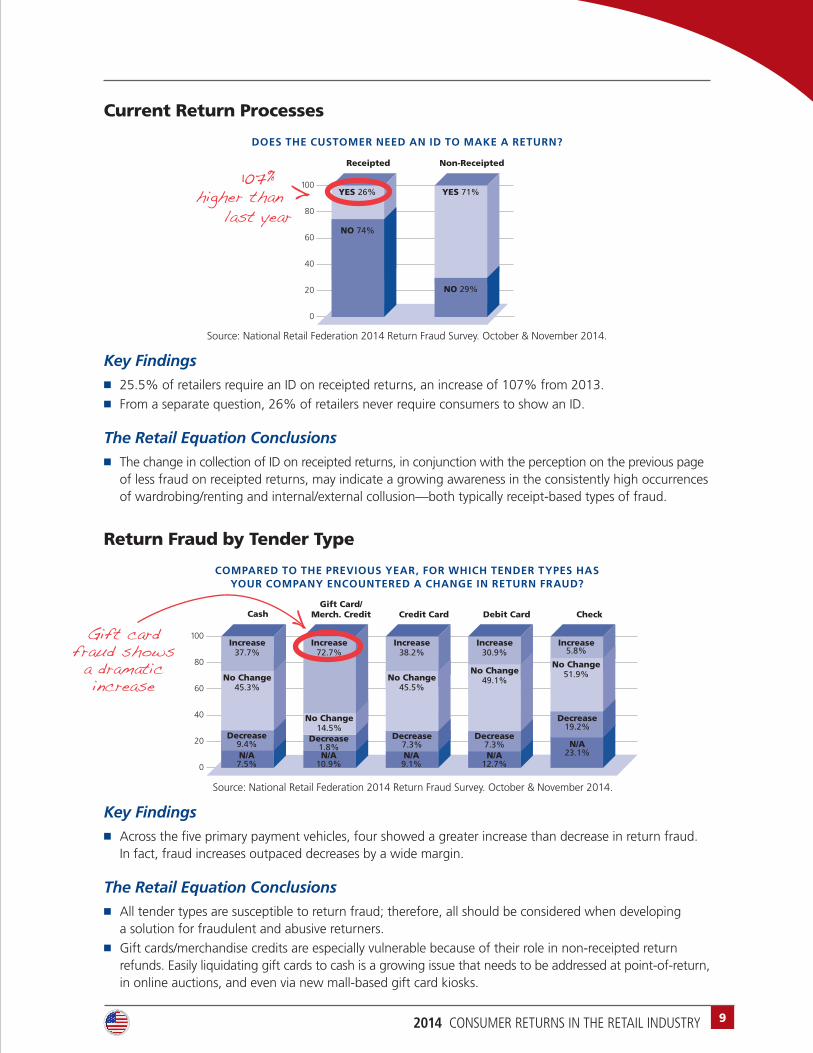
Current Return Processes
DOES THE CUSTOMER NEED AN ID TO MAKE A RETURN?
0
20
40
60
80
100
Receipted
YES 26%
NO 74%
Non-Receipted
YES 71%
NO 29%
Source: National Retail Federation 2014 Return Fraud Survey. October & November 2014.
Key Findings ◾ 25.5% of retailers require an ID on receipted returns, an increase of 107% from 2013. ◾ From a separate question, 26% of retailers never require consumers to show an ID.
The Retail Equation Conclusions ◾ The change in collection of ID on receipted returns, in conjunction with the perception on the previous page
of less fraud on receipted returns, may indicate a growing awareness in the consistently high occurrences of wardrobing/renting and internal/external collusion—both typically receipt-based types of fraud.
Return Fraud by Tender Type
COMPARED TO THE PREVIOUS YEAR, FOR WHICH TENDER TYPES HAS YOUR COMPANY ENCOUNTERED A CHANGE IN RETURN FRAUD?
0
20
40
60
80
100
120
checkdebitcreditgift cardcash
0
20
40
60
80
100
120
checkdebitcreditgift cardcash
0
20
40
60
80
100
Cash
N/A7.5%
No Change45.3%
Decrease7.3%
Increase37.7%
Decrease1.8%N/A
10.9%
Increase72.7%
N/A9.1%
N/A12.7%
N/A23.1%
No Change45.5%
Decrease9.4%
Decrease7.3%
Decrease19.2%
Increase38.2%
No Change49.1%
Increase30.9%
Increase5.8%
No Change51.9%
Gift Card/Merch. Credit Credit Card Debit Card Check
No Change14.5%
Source: National Retail Federation 2014 Return Fraud Survey. October & November 2014.
Key Findings ◾ Across the five primary payment vehicles, four showed a greater increase than decrease in return fraud.
In fact, fraud increases outpaced decreases by a wide margin.
The Retail Equation Conclusions ◾ All tender types are susceptible to return fraud; therefore, all should be considered when developing
a solution for fraudulent and abusive returners. ◾ Gift cards/merchandise credits are especially vulnerable because of their role in non-receipted return
refunds. Easily liquidating gift cards to cash is a growing issue that needs to be addressed at point-of-return, in online auctions, and even via new mall-based gift card kiosks.
Gift card fraud shows a dramatic increase
<
107% higher than
last year<
10 2014 CONSUMER RETURNS IN THE RETAIL INDUSTRY
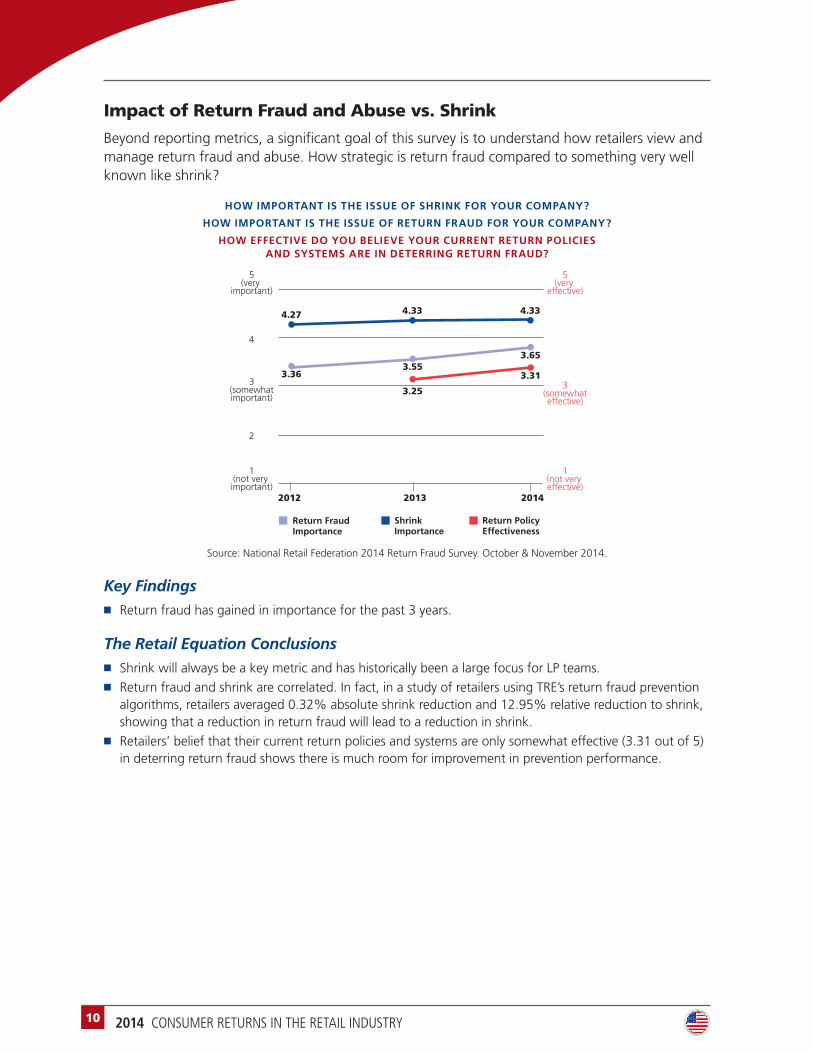
Impact of Return Fraud and Abuse vs. Shrink
Beyond reporting metrics, a significant goal of this survey is to understand how retailers view and manage return fraud and abuse. How strategic is return fraud compared to something very well known like shrink?
HOW IMPORTANT IS THE ISSUE OF SHRINK FOR YOUR COMPANY?
HOW IMPORTANT IS THE ISSUE OF RETURN FRAUD FOR YOUR COMPANY?
HOW EFFECTIVE DO YOU BELIEVE YOUR CURRENT RETURN POLICIES AND SYSTEMS ARE IN DETERRING RETURN FRAUD?
1(not very important)
2
3(somewhatimportant)
4
5(very
important)
5(very
effective)
1(not very effective)
3(somewhateffective)
20142012 2013
3.65
4.33
3.553.31
3.25
4.33
3.36
4.27
Return FraudImportance
ShrinkImportance
Return PolicyEffectiveness
Source: National Retail Federation 2014 Return Fraud Survey. October & November 2014.
Key Findings ◾ Return fraud has gained in importance for the past 3 years.
The Retail Equation Conclusions ◾ Shrink will always be a key metric and has historically been a large focus for LP teams. ◾ Return fraud and shrink are correlated. In fact, in a study of retailers using TRE’s return fraud prevention
algorithms, retailers averaged 0.32% absolute shrink reduction and 12.95% relative reduction to shrink, showing that a reduction in return fraud will lead to a reduction in shrink.
◾ Retailers’ belief that their current return policies and systems are only somewhat effective (3.31 out of 5) in deterring return fraud shows there is much room for improvement in prevention performance.
112014 CONSUMER RETURNS IN THE RETAIL INDUSTRY
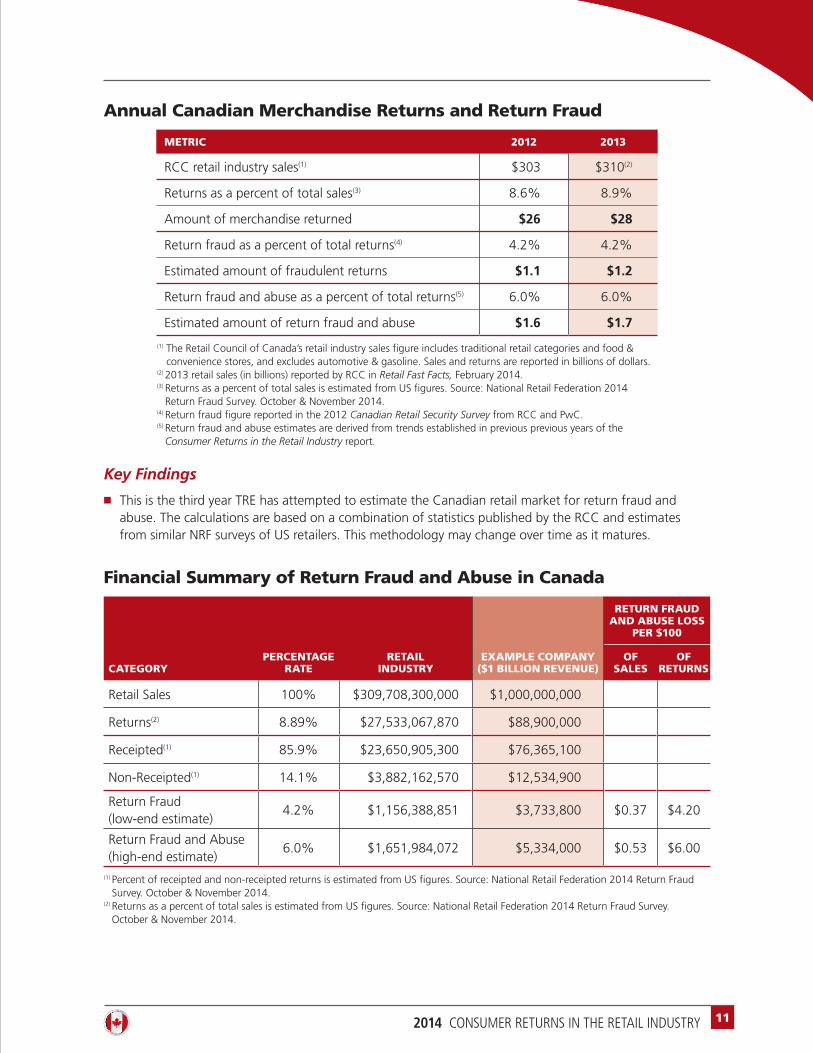
Annual Canadian Merchandise Returns and Return Fraud
METRIC 2012 2013
RCC retail industry sales(1) $303 $310(2)
Returns as a percent of total sales(3) 8.6% 8.9%
Amount of merchandise returned $26 $28
Return fraud as a percent of total returns(4) 4.2% 4.2%
Estimated amount of fraudulent returns $1.1 $1.2
Return fraud and abuse as a percent of total returns(5) 6.0% 6.0%
Estimated amount of return fraud and abuse $1.6 $1.7
(1) The Retail Council of Canada’s retail industry sales figure includes traditional retail categories and food & convenience stores, and excludes automotive & gasoline. Sales and returns are reported in billions of dollars.
(2) 2013 retail sales (in billions) reported by RCC in Retail Fast Facts, February 2014. (3) Returns as a percent of total sales is estimated from US figures. Source: National Retail Federation 2014
Return Fraud Survey. October & November 2014. (4) Return fraud figure reported in the 2012 Canadian Retail Security Survey from RCC and PwC. (5) Return fraud and abuse estimates are derived from trends established in previous previous years of the
Consumer Returns in the Retail Industry report.
Key Findings
◾ This is the third year TRE has attempted to estimate the Canadian retail market for return fraud and abuse. The calculations are based on a combination of statistics published by the RCC and estimates from similar NRF surveys of US retailers. This methodology may change over time as it matures.
Financial Summary of Return Fraud and Abuse in Canada
RETURN FRAUD AND ABUSE LOSS
PER $100
CATEGORYPERCENTAGE
RATERETAIL
INDUSTRYEXAMPLE COMPANY
($1 BILLION REVENUE)OF
SALESOF
RETURNS
Retail Sales 100% $309,708,300,000 $1,000,000,000
Returns(2) 8.89% $27,533,067,870 $88,900,000
Receipted(1) 85.9% $23,650,905,300 $76,365,100
Non-Receipted(1) 14.1% $3,882,162,570 $12,534,900
Return Fraud (low-end estimate)
4.2% $1,156,388,851 $3,733,800 $0.37 $4.20
Return Fraud and Abuse (high-end estimate)
6.0% $1,651,984,072 $5,334,000 $0.53 $6.00
(1) Percent of receipted and non-receipted returns is estimated from US figures. Source: National Retail Federation 2014 Return Fraud Survey. October & November 2014.
(2) Returns as a percent of total sales is estimated from US figures. Source: National Retail Federation 2014 Return Fraud Survey. October & November 2014.
12 2014 CONSUMER RETURNS IN THE RETAIL INDUSTRY
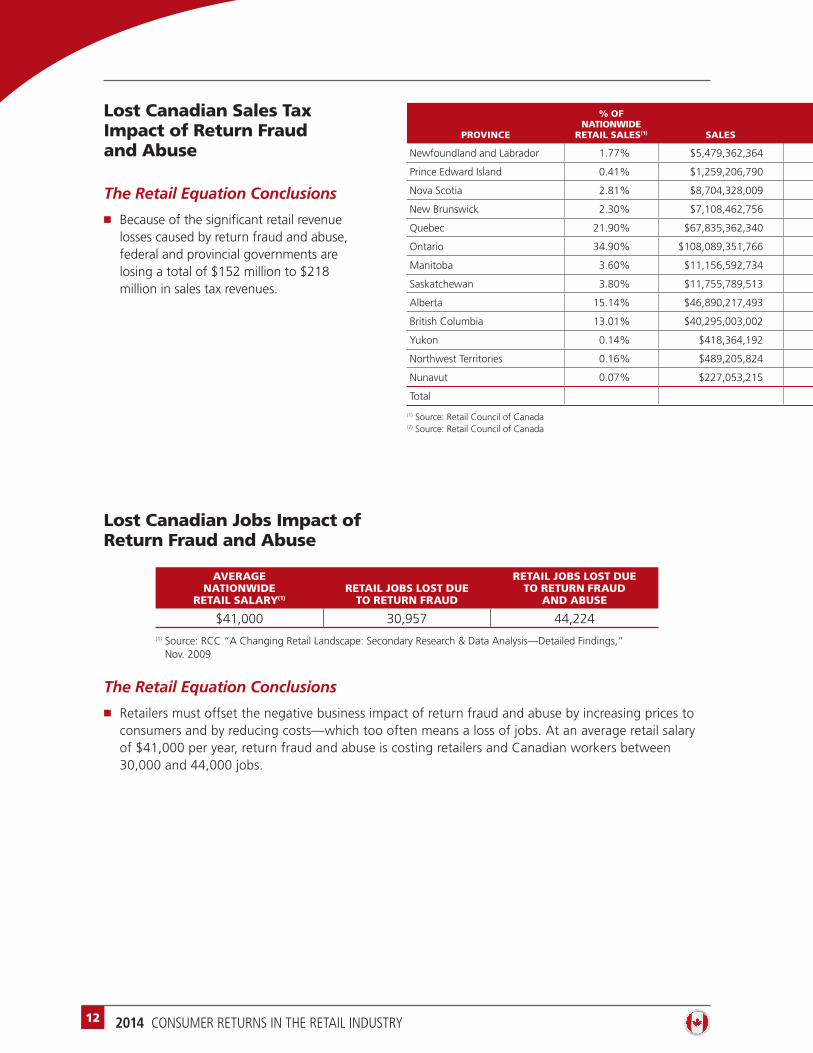
PROVINCE
% OF NATIONWIDE
RETAIL SALES(1) SALES RETURNSCOMBINED TAX RATE(2)
LOW-END ESTIMATE(3) HIGH-END ESTIMATE(4)
RETURN FRAUDLOST SALES
TAX REVENUERETURN
FRAUD/ABUSELOST SALES
TAX REVENUE
Newfoundland and Labrador 1.77% $5,479,362,364 $534,645,280 13.000% $22,455,102 $2,919,163 $32,078,717 $4,170,233
Prince Edward Island 0.41% $1,259,206,790 $122,866,298 14.000% $5,160,384 $722,454 $7,371,978 $1,032,077
Nova Scotia 2.81% $8,704,328,009 $849,319,241 15.000% $35,671,408 $5,350,711 $50,959,154 $7,643,873
New Brunswick 2.30% $7,108,462,756 $693,603,709 13.000% $29,131,356 $3,787,076 $41,616,223 $5,410,109
Quebec 21.90% $67,835,362,340 $6,618,992,111 14.975% $277,997,669 $41,630,151 $397,139,527 $59,471,644
Ontario 34.90% $108,089,351,766 $10,546,749,393 13.000% $442,963,475 $57,585,252 $632,804,964 $82,264,645
Manitoba 3.60% $11,156,592,734 $1,088,597,403 13.000% $45,721,091 $5,943,742 $65,315,844 $8,491,060
Saskatchewan 3.80% $11,755,789,513 $1,147,063,646 10.000% $48,176,673 $4,817,667 $68,823,819 $6,882,382
Alberta 15.14% $46,890,217,493 $4,575,282,993 5.000% $192,161,886 $9,608,094 $274,516,980 $13,725,849
British Columbia 13.01% $40,295,003,002 $3,931,759,156 12.000% $165,133,885 $19,816,066 $235,905,549 $28,308,666
Yukon 0.14% $418,364,192 $40,821,619 5.000% $1,714,508 $85,725 $2,449,297 $122,465
Northwest Territories 0.16% $489,205,824 $47,733,945 5.000% $2,004,826 $100,241 $2,864,037 $143,202
Nunavut 0.07% $227,053,215 $22,154,572 5.000% $930,492 $46,525 $1,329,274 $66,464
Total $152,412,868 $217,732,668
(1) Source: Retail Council of Canada (2) Source: Retail Council of Canada
Lost Canadian Sales Tax Impact of Return Fraud and Abuse
The Retail Equation Conclusions
◾ Because of the significant retail revenue losses caused by return fraud and abuse, federal and provincial governments are losing a total of $152 million to $218 million in sales tax revenues.
Lost Canadian Jobs Impact of Return Fraud and Abuse
AVERAGE NATIONWIDE
RETAIL SALARY(1)RETAIL JOBS LOST DUE
TO RETURN FRAUD
RETAIL JOBS LOST DUE TO RETURN FRAUD
AND ABUSE
$41,000 30,957 44,224
(1) Source: RCC “A Changing Retail Landscape: Secondary Research & Data Analysis—Detailed Findings,” Nov. 2009
The Retail Equation Conclusions
◾ Retailers must offset the negative business impact of return fraud and abuse by increasing prices to consumers and by reducing costs—which too often means a loss of jobs. At an average retail salary of $41,000 per year, return fraud and abuse is costing retailers and Canadian workers between 30,000 and 44,000 jobs.
132014 CONSUMER RETURNS IN THE RETAIL INDUSTRY
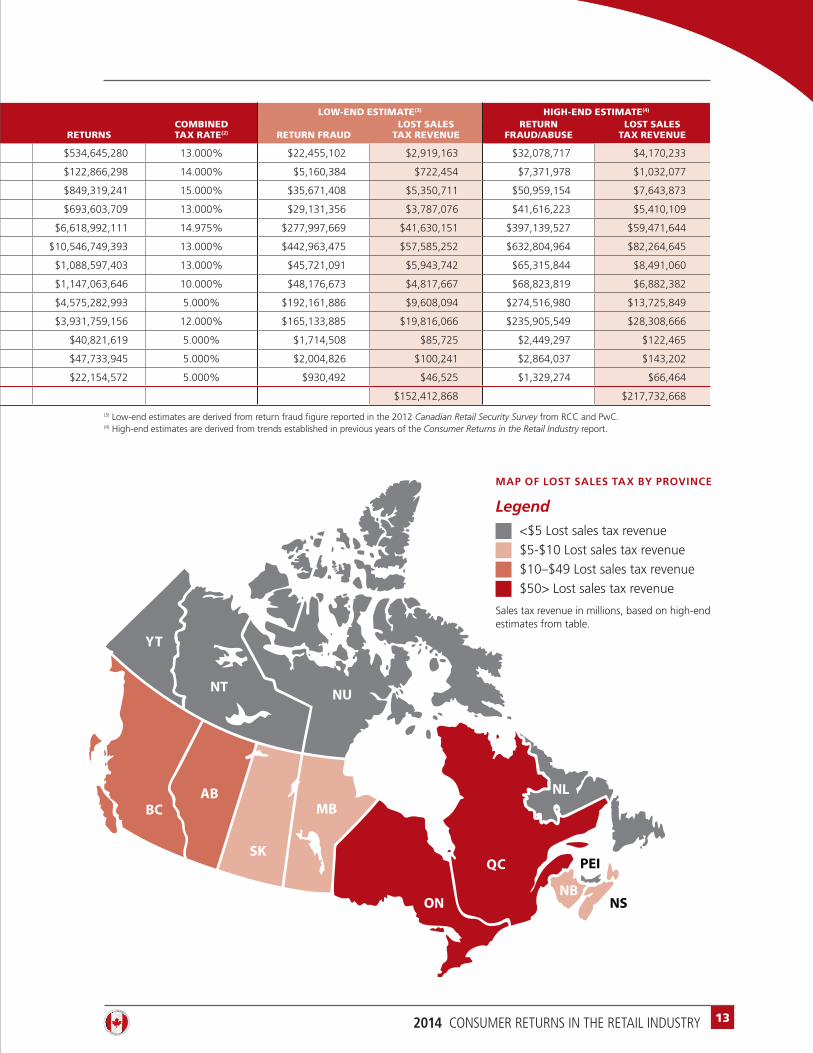
PROVINCE
% OF NATIONWIDE
RETAIL SALES(1) SALES RETURNSCOMBINED TAX RATE(2)
LOW-END ESTIMATE(3) HIGH-END ESTIMATE(4)
RETURN FRAUDLOST SALES
TAX REVENUERETURN
FRAUD/ABUSELOST SALES
TAX REVENUE
Newfoundland and Labrador 1.77% $5,479,362,364 $534,645,280 13.000% $22,455,102 $2,919,163 $32,078,717 $4,170,233
Prince Edward Island 0.41% $1,259,206,790 $122,866,298 14.000% $5,160,384 $722,454 $7,371,978 $1,032,077
Nova Scotia 2.81% $8,704,328,009 $849,319,241 15.000% $35,671,408 $5,350,711 $50,959,154 $7,643,873
New Brunswick 2.30% $7,108,462,756 $693,603,709 13.000% $29,131,356 $3,787,076 $41,616,223 $5,410,109
Quebec 21.90% $67,835,362,340 $6,618,992,111 14.975% $277,997,669 $41,630,151 $397,139,527 $59,471,644
Ontario 34.90% $108,089,351,766 $10,546,749,393 13.000% $442,963,475 $57,585,252 $632,804,964 $82,264,645
Manitoba 3.60% $11,156,592,734 $1,088,597,403 13.000% $45,721,091 $5,943,742 $65,315,844 $8,491,060
Saskatchewan 3.80% $11,755,789,513 $1,147,063,646 10.000% $48,176,673 $4,817,667 $68,823,819 $6,882,382
Alberta 15.14% $46,890,217,493 $4,575,282,993 5.000% $192,161,886 $9,608,094 $274,516,980 $13,725,849
British Columbia 13.01% $40,295,003,002 $3,931,759,156 12.000% $165,133,885 $19,816,066 $235,905,549 $28,308,666
Yukon 0.14% $418,364,192 $40,821,619 5.000% $1,714,508 $85,725 $2,449,297 $122,465
Northwest Territories 0.16% $489,205,824 $47,733,945 5.000% $2,004,826 $100,241 $2,864,037 $143,202
Nunavut 0.07% $227,053,215 $22,154,572 5.000% $930,492 $46,525 $1,329,274 $66,464
Total $152,412,868 $217,732,668
(1) Source: Retail Council of Canada (2) Source: Retail Council of Canada
MAP OF LOST SALES TAX BY PROVINCE
Legend <$5 Lost sales tax revenue $5-$10 Lost sales tax revenue $10–$49 Lost sales tax revenue $50> Lost sales tax revenue
Sales tax revenue in millions, based on high-end estimates from table.
L
(3) Low-end estimates are derived from return fraud figure reported in the 2012 Canadian Retail Security Survey from RCC and PwC.(4) High-end estimates are derived from trends established in previous years of the Consumer Returns in the Retail Industry report.
14 2014 CONSUMER RETURNS IN THE RETAIL INDUSTRY
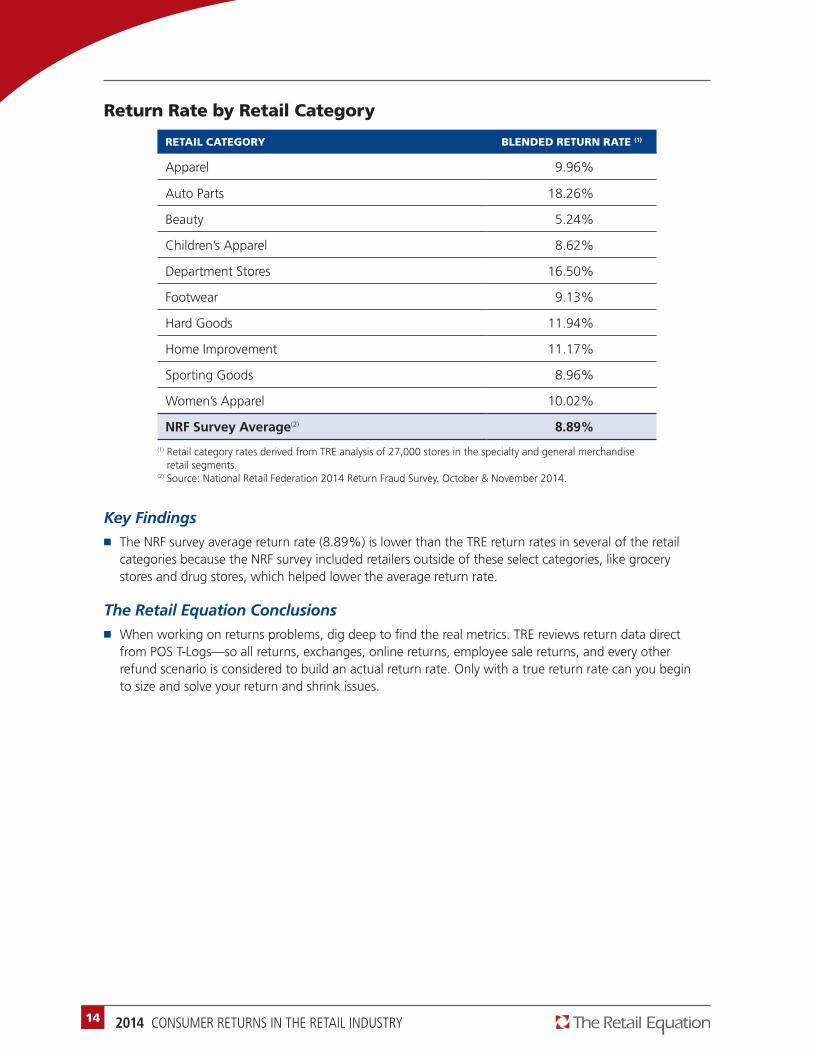
Return Rate by Retail Category
RETAIL CATEGORY BLENDED RETURN RATE (1)
Apparel 9.96%
Auto Parts 18.26%
Beauty 5.24%
Children’s Apparel 8.62%
Department Stores 16.50%
Footwear 9.13%
Hard Goods 11.94%
Home Improvement 11.17%
Sporting Goods 8.96%
Women’s Apparel 10.02%
NRF Survey Average(2) 8.89%
(1) Retail category rates derived from TRE analysis of 27,000 stores in the specialty and general merchandise retail segments.
(2) Source: National Retail Federation 2014 Return Fraud Survey. October & November 2014.
Key Findings ◾ The NRF survey average return rate (8.89%) is lower than the TRE return rates in several of the retail
categories because the NRF survey included retailers outside of these select categories, like grocery stores and drug stores, which helped lower the average return rate.
The Retail Equation Conclusions ◾ When working on returns problems, dig deep to find the real metrics. TRE reviews return data direct
from POS T-Logs—so all returns, exchanges, online returns, employee sale returns, and every other refund scenario is considered to build an actual return rate. Only with a true return rate can you begin to size and solve your return and shrink issues.
15
Summary
The tenth Consumer Returns in the Retail Industry report represents the seventh year that
The Retail Equation sponsored the National Retail Federation (NRF) Return Fraud Survey
as a means to present a single source of metrics to the US retail market. The goal is to
understand the extent of annual merchandise return fraud and abuse, which is estimated
between $10.8 and $17.6 billion in the United States. By raising awareness of the problem,
we hope to stimulate a dialogue that will lead to best practices and solutions.
Additionally, this is the third year we have included return fraud and abuse estimates
for the Canadian retail market, as calculated from statistics compiled by the Retail Council
of Canada (RCC). Annual merchandise return fraud and abuse in the Canadian retail
market is estimated between $1.2 and $1.7 billion.
In the competitive world of retail, it is critical to understand how returns and return
fraud reduce net sales and contribute to inventory shortage (shrink). The results within offer
the industry’s best look into the subject of merchandise return policies and procedures,
as well as potential fraud and abuse. This information can be used by loss prevention
professionals to compare and contrast their own program results to those reported here,
with an eye toward reducing losses from this source.
When considering solutions, remember that broad policy-based initiatives impact every
shopper; potentially adversely affecting good customers as well as abusers, and consumer
satisfaction may suffer as a result. Ultimately, implementing the right solution, combined
with employee training that encourages diligent attention to the issue at the store level, will
help result in reduced return fraud and abuse – leading to lower return rates, lower shrink,
increased net sales, higher profits, and improved customer satisfaction.
For more information on the 2012 Canadian Retail Security Survey that generated
portions of this executive summary report, please contact the RCC at www.retailcouncil.org.
For more information on the 2014 NRF Return Fraud Survey results that generated
portions of this executive summary report, please contact Kathy Grannis at [email protected]
(855.NRF.PRESS) or Robert Moraca, VP, Loss Prevention at [email protected].
2014 CONSUMER RETURNS IN THE RETAIL INDUSTRY
© December, 2014 The Retail Equation, Inc. All Rights Reserved.
1101 New York Ave NW Washington, DC 20005 USA+1-800-673-4692 www.nrf.com
TRE3014
PO Box 51373Irvine, CA 92619-1373 USA+1-888-371-1616www.TheRetailEquation.com
AN
NU
AL
RE
TU
RN
SU
RV
EY
2014 Consumer Returns in the Retail Industry