transient plasma injections in the dayside magnetosphere ... · are dispersed by the velocity...
TRANSCRIPT

Annales Geophysicae (2004) 22: 141–158 © European Geosciences Union 2004Annales
Geophysicae
Transient plasma injections in the dayside magnetosphere:one-to-one correlated observations by Cluster and SuperDARN
A. Marchaudon1, J.-C. Cerisier1, J.-M. Bosqued2, M. W. Dunlop3, *, J. A. Wild 4, P. M. E. Decreau5, M. Forster6,D. Fontaine7, and H. Laakso8
1Centre d’Etude des Environnements Terrestre et Planetaires, 4 avenue de Neptune, 94107 Saint-Maur-des-Fosses Cedex,France2Centre d’Etude Spatiale des Rayonnements, CESR/CNRS, B.P. 4346, 31028 Toulouse Cedex 4, France3Space and Atmospheric Physics, Blackett Laboratory, Imperial College, London SW7 2BZ, UK4Department of Physics and Astronomy, University of Leicester, University Road, Leicester, LE1 7RH, UK5LPCE and Universite d’Orleans, 45071 Orleans, France6Max Planck-Institute fur Extraterrestrische Physik, 85741 Garching, Germany7Centre d’Etude des Environnements Terrestre et Planetaires, 10-12 avenue de l’Europe, 78140 Velizy, France8Space Science Division, ESTEC, Noordwijk, The Netherlands* now at: RAL, Rutherford-Appleton Laboratory, Chilton, Didcot, Oxon, OX11 0QX, UK
Received: 11 December 2002 – Revised: 2 June 2003 – Accepted: 9 June 2003 – Published: 1 January 2004
Abstract. Conjunctions in the cusp between the four Clus-ter spacecraft and SuperDARN ground-based radars offerunique opportunities to compare the signatures of transientplasma injections simultaneously in the high-altitude day-side magnetosphere and in the ionosphere. We report here onsuch observations on 17 March 2001, when the IMF initiallynorthward and duskward, turns southward and dawnward fora short period. The changes in the convection direction atCluster are well correlated with the interplanetary magneticfield (IMF) By variations. Moreover, the changes in the iono-sphere follow those in the magnetosphere, with a 2-3 min de-lay. When mapped into the ionosphere, the convection ve-locity at Cluster is about 1.5 times larger than measured bySuperDARN.
In the high-altitude cusp, field and particle observationsby Cluster display the characteristic signatures of plasma in-jections into the magnetosphere suggestive of Flux TransferEvents (FTEs). Simultaneous impulsive and localized con-vection plasma flows are observed in the ionospheric cuspby the HF radars. A clear one-to-one correlation is observedfor three successive injections, with a 2–3 min delay betweenthe magnetospheric and ionospheric observations. For eachevent, the drift velocity of reconnected flux tubes (phase ve-locity) has been compared in the magnetosphere and in theionosphere. The drift velocity measured at Cluster is of theorder of 400–600 m s−1 when mapped into the ionosphere,in qualitative agreement with SuperDARN observations. Fi-nally, the reconnected flux tubes are elongated in the north-south direction, with an east-west dimension of 30–60 km inthe ionosphere from mapped Cluster observations, which is
Correspondence to:A. Marchaudon([email protected])
consistent with SuperDARN observations, although slightlysmaller.
Key words. Ionosphere (plasma convection) – Magneto-spheric physics (magnetopause, cusp, and boundary layers;magnetosphere-ionosphere interactions)
1 Introduction
Plasma entry from the solar wind into the magnetosphere oc-curs mainly through the dayside magnetopause. Three mainregions just inside the magnetopause with different plasmacharacteristics, have been recognized since the initial surveyby Heos-2 (Haerendel et al., 1978): the low-latitude bound-ary layer (LLBL), the high-altitude cusp and the plasma man-tle. Across these boundary regions, a competition exists be-tween diffusion and reconnection for mass, momentum andenergy transfer from the solar wind to the magnetosphere.The low-latitude magnetopause adjacent to the LLBL is themain site for reconnection (Eastman et al., 1976; Newelland Meng, 1988; Fuselier et al., 1999), when the interplan-etary magnetic field (IMF) is southward. The LLBL is pop-ulated by a mixture of plasmas of magnetosheath and mag-netospheric origin and is partly located on closed field lines.The LLBL is magnetically connected to the ionospheric cleft(Newell and Meng, 1988), where particle fluxes are lowerin intensity and extend to higher energies than in the cusplocated just poleward (Aparicio et al., 1991). The high-altitude cusp (Paschmann et al., 1976) is located on open fieldlines, where magnetosheath plasma entry is more direct, asindicated by the spectral characteristics of the particles whichare close to those observed in the magnetosheath (Newell and

142 A. Marchaudon et al.: Transient plasma injections in the dayside magnetosphere
Meng, 1988). The high-altitude cusp is magnetically con-nected to the “cusp proper” at lower altitudes, where plasmawith magnetosheath characteristics is also observed. Thepersistency of the cusp proper has led many authors (e.g.Newell et al., 1989) to conclude that processes other thanpatchy or transient merging occur in the high-altitude cuspsuch as steady-state merging or diffusion. Poleward of thehigh-altitude cusp, is the plasma mantle (Rosenbauer et al.,1975; Crooker et al., 1977). This boundary layer consistsof magnetosheath-like plasma with a tailward-directed bulkflow parallel to the local magnetic field. Particles entering thecusp may move on mantle field lines through convection andare dispersed by the velocity filter effect (Reiff et al., 1977).For strongly northward IMF, the high-latitude magnetopauseadjacent to the mantle is the preferred site of reconnection(Maezawa, 1976).
Reconnected magnetic flux tubes allow energy and mo-mentum transfer from the solar wind to the magnetosphere.Initially considered as a steady-state process, its intermittentand spatially limited nature was discovered, independentlyby Haerendel (1978) and by Russell and Elphic (1978, 1979).Russell and Elphic (1978) named these bursts of magnetic re-connection, the Flux Transfer Events (FTEs) and first recog-nised their main observational characteristic, the bipolar sig-nature in the magnetic field component normal to the magne-topause. Later studies allowed one to refine the descriptionof FTEs, namely the plasma signature inside the reconnectedflux tube, consisting of a mixture of magnetosheath and mag-netospheric plasma (e.g. Farrugia et al., 1988), the acceler-ated ion flows (e.g. Paschmann et al., 1982) and their largeroccurrence rate during periods of southward interplanetarymagnetic field (e.g. Berchem and Russell, 1984; Lockwoodand Smith, 1992).
Flux transfer events map into the ionosphere along mag-netic field lines. The first observation of the ionospheric sig-nature of an FTE was made by Goertz et al. (1985) with theSTARE VHF coherent radar. Sporadic and spatially limitedflow bursts moving in the northwest direction were attributedto magnetic merging, as indicated by the simultaneous obser-vation of a satellite signature at the magnetopause. Severalstudies with the PACE HF radar followed, and Pinnock etal. (1991, 1993, 1995) presented cases of enhanced convec-tion channels superimposed on the continuous cusp echoes.Inside flow channels, the velocity was larger than in the am-bient plasma and directed mainly northward, as expected bythe Southwood (1987) model for FTEs. Most of these con-vection channels are also characterized by an azimuthal ve-locity component, the sign of which depends upon the signof the IMFBy component. It was observed that in the North-ern Hemisphere, the flow is westward for positiveBy andeastward for negativeBy and reversed in the Southern Hemi-sphere, in agreement with the convection models (Reiff andBurch, 1985; Crooker, 1979, 1988; Cowley et al., 1991),which assume that the convection is driven by the magnetictension at the reconnection site. It was also observed thatthe longitudinal extent of these flow bursts is generally largerthan their latitudinal extent and that their average repetition
rate is about 7 min. Parallel currents flowing on the flanks ofthe flow burst have been modelled (Southwood, 1987; Lock-wood et al., 1990, 2001a) and observed (Milan et al., 2000).All the above observations and models suggested that inter-mittent and patchy magnetic reconnection was the source ofFTEs, including sporadic flow bursts which represent theirionospheric signature. Observations by SuperDARN radarshave complemented this set of observations. For example,Provan et al. (1998), with a high resolution scan mode, andMilan et al. (2000) and Thorolfsson et al. (2000), with the as-sociation of radars and optical observations, determined thesize, shape, velocity and recurrence rate of the ionosphericsignatures of FTEs. These case studies have been confirmedby statistical studies of the location, occurrence and relationwith the IMF By of the flow bursts (Provan and Yeoman,1999; Provan et al., 1999; McWilliams et al., 2000).
Thus, flux transfer events (FTEs) have been extensivelystudied during the last twenty years, both in the magne-tosphere by satellites and in the ionosphere by radars orimagers. However, simultaneous observations in the high-altitude magnetosphere and in the ionosphere are less nu-merous. Elphic et al. (1990) showed a clear association be-tween an FTE, identified near the magnetopause by its mag-netic bipolar signature observed by the ISEE2 satellite, andpoleward-moving ionospheric flow bursts and auroral formsobserved by the EISCAT radar and photometers. Almostten years later, Neudegg et al. (1999) have associated thesignatures of an FTE observed at the magnetopause by theEquator-S satellite and in the ionosphere by a SuperDARNradar. In a statistical study, Neudegg et al. (2000) showed aclear one-to-one association between reconnected flux tubesat the magnetopause and ionospheric poleward moving flowbursts.
The four-spacecraft Cluster mission, with an optimisedinter-satellite separation, is well-suited to analyze the de-tailed structure of FTEs in the magnetosphere (Bosqued etal., 2001; Owen et al., 2001). Coordinated studies be-tween Cluster and magnetically conjugate ground-based in-struments are of primary importance to characterize the elec-trodynamic coupling between the ionosphere and the dis-tant magnetosphere (Opgenoorth et al., 2001; Lockwoodet al., 2001b). Clear FTE signatures have been recentlyobserved simultaneously by ground-based instruments andCluster (Lockwood et al., 2001c; Wild et al., 2001), illustrat-ing the ionosphere-magnetosphere coupling caused by themagnetopause reconnection.
On 17 March 2001, between 05:05 and 06:50 UT, Clus-ter crosses the high-altitude northern cusp while the Super-DARN CUTLASS radars measure line-of-sight (l-o-s) veloc-ities typical of cusp echoes in the conjugate ionosphere. Theinterplanetary conditions are very quiet, with a mainly north-ward and duskward IMF and a low solar wind pressure. Thestudy presented in this paper is limited to a short intervalbetween 05:15 and 06:00 UT, characterised by a southwardand dawnward excursion of the IMF, leading to an increasedrate of magnetic reconnection at the magnetopause. Dur-ing that time period, characteristic FTE signatures are ob-

A. Marchaudon et al.: Transient plasma injections in the dayside magnetosphere 143
served by Cluster in the magnetosphere, and duskward flowbursts are simultaneously observed by the CUTLASS radarsin the ionosphere, at the magnetic footprint of Cluster. Clus-ter and radar observations are well correlated. A detailedcomparison for three successive injections shows that the lo-cal plasma convection velocity and the drift velocity of theflux tubes, evaluated in the ionosphere and at 7–8RE alti-tude (and then mapped into ionosphere) are fully consistent.
2 Instrumentation
2.1 Cluster
The Cluster mission is composed of four identical spacecraftin a tetrahedral formation in order to discriminate betweensmall-scale spatial and temporal structures. Cluster is lo-cated on an elliptical orbit with a perigee of 4RE , an apogeeof 19.6RE and a period of∼58 h. In this paper, we usedata from several experiments: the Cluster Ion Spectrometer(CIS), the Fluxgate Magnetometer (FGM), the Plasma Elec-tron and Current Experiment (PEACE), the Waves of Highfrequency and Sounder for Probing of Electron density byRelaxation instrument (WHISPER), the Electric Field andWave experiment (EFW) and the Electron Drift Instrument(EDI).
The Cluster Ion Spectrometry (CIS) experiment (Reme etal., 2001) provides a full, three-dimensional energy/velocitydistribution of the major magnetospheric ions from ther-mal energies up to about 40 keV/e and the moments with atime resolution up to 4 s. The experiment is composed oftwo different instruments: the COmposition and DIstribu-tion Function analyser (CIS1/CODIF), which gives the massper charge composition with a medium angular resolution(22.5◦), and the Hot Ion Analyser (CIS2/HIA), which offersa better energy and angular resolution without mass resolu-tion. In this study, we use energy spectrograms and the mo-ment data (ion velocity components and density) provided bythe CIS1/CODIF and CIS2/HIA instruments on Cluster 1.
In support of CIS observations, data from four other instru-ments have been used in this paper. The PEACE instrument(Johnstone et al., 1997) is designed to measure the electronvelocity distribution. The WHISPER instrument (Decreau etal., 2001) yields the electron density determined via the pas-sive mode of the relaxation sounder. The EFW instrument(Gustafsson et al., 2001) measures the electric field and thespacecraft potential, of which the variations are, to a largeextent, proportional to those of the plasma density. The EDIinstrument (Paschmann et al., 2001) measures the drift ve-locity of artificially injected electron beams, from which theperpendicular electric field can be deduced.
The magnetic field data are provided by the Fluxgate Mag-netometer (FGM) experiment (Balogh et al., 2001). EachFGM instrument is composed of two tri-axial fluxgate mag-netic field sensors. In this study, the magnetic field data areused with a resolution of∼0.125 s. By identifying similarbut time-lagged signatures of boundaries on each of the four
spacecraft, the FGM data are used to derive the velocity ofthese boundaries.
2.2 SuperDARN
The ionospheric convection is measured by the CUTLASSSuperDARN coherent HF radars at Hankasalmi (Finland)and Pikkvibær (Iceland) (Greenwald et al., 1995). Each radarmeasures the l-o-s plasma velocity in the F-region of theionosphere. As the CUTLASS radars share a common field-of-view, convection velocity vectors can be obtained fromthe simultaneous measurement of two independent compo-nents. The SuperDARN radar beam is narrow, typically 3.3◦
in azimuthal width, and scans successively 16 adjacent di-rections divided into 75 range bins of 45 km length. Thefield-of-view of each radar is large: over 3000 km in rangeand 53◦ in azimuth. During the period under study, the tworadars were operated in the high-resolution common mode,with each beam sounded for 3 s, resulting in a full scan every1 min.
3 Geometry of observations and interplanetary condi-tions
On 17 March 2001, the magnetic footprint of the Clus-ter spacecraft crosses the field-of-view of the CUTLASSradars between 04:50 and 09:20 UT. During the shorter in-terval 05:05–06:50 UT, the Cluster spacecraft (with an av-erage separation of∼600 km) encounters the northern ex-ternal cusp. Cluster is moving sunward from the northernlobe through the cusp towards the dayside magnetopauseclose to the noon magnetic plane, as shown in Fig. 1, whichrepresents a sketch of the projection of Cluster in theXZ
GSM plane. The overall cusp crossing has been analysed byVontrat-Reberac et al. (2003). In the present paper, we fo-cus on a short period between 05:15 and 06:00 UT, duringwhich Cluster and SuperDARN observe in the cusp the re-sponse to a southward and dawnward excursion of the IMF.During this period, the radars are located in the pre-noonsector and observe cusp echoes in the ionosphere at veryfar horizontal ranges between 2700 and 3300 km. Figure 2shows a map of the field-of-view of the CUTLASS radars at05:30 UT, in Altitude-Adjusted Corrected GeoMagnetic co-ordinates (AACGM) (Baker and Wing, 1989). The mappedionospheric footprint of Cluster (black dot) is calculated byprojection along magnetic field lines, with the TsyganenkoT96 model (Tsyganenko, 1995) and real inputs of IMF andsolar wind pressure from the ACE satellite. During the periodof interest, the Cluster footprint remains almost fixed and islocated near 79◦ Magnetic Latitude (MLAT) and 165◦ Mag-netic Longitude (MLON), corresponding to∼11:30 Mag-netic Local Time (MLT), where cusp echoes are observedby the Hankasalmi radar.
The IMF and solar wind data are provided by the ACEsatellite located near the Lagrangian L1 libration point, atabout 226RE upstream of the Earth. The IMF data are plot-

144 A. Marchaudon et al.: Transient plasma injections in the dayside magnetosphere
5 0 5 10
4
2
0
2
4
6
8
10
12
14
Cluster Orbit & s/c configuration 17/03/2001
X Re
Z R
e
01 UT
03 UT
05 UT
09 UT07 UT
Figure 1
15
Fig. 1. Sketch of the projection of the Cluster 1 orbit (black solidline) in the GSMXZ plane, for the period 01:00–09:00 UT on17 March 2001. Magenta dots along the orbit are separated byone hour. The Cluster spacecraft configuration is shown around06:45 UT, each spacecraft corresponding to a coloured dot with theCluster colour-code (SC1-black, SC2-red, SC3-green, SC4-blue).The separation of the spacecraft has been expanded by a factor often to better indicate the tetrahedral configuration in the cusp. Sev-eral magnetospheric field lines (blue solid lines) have also been plot-ted.
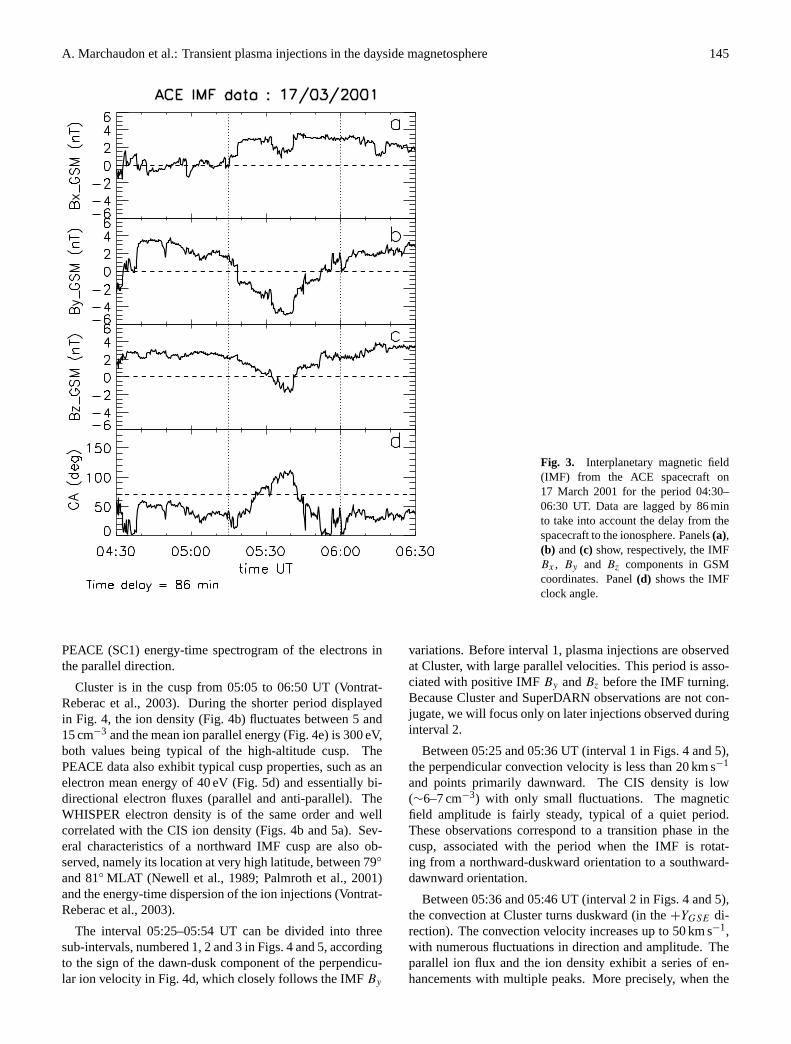
ted in GSM coordinates with an 86-min delay in Fig. 3.The propagation delay to the dayside ionosphere is evalu-ated between 86 and 91 min, taking into account a 78-mindelay between the ACE and the bowshock (with a solar windbulk speed of∼290 km s−1), a 5- to 10-min delay across themagnetosheath (Spreiter and Stahara, 1980) and a 3-min de-lay between the magnetopause and the dayside ionosphere(Etemadi et al., 1988). During the interval 05:05–06:50 UTwhen Cluster is in the cusp, the solar wind pressure is low,less than 0.5 nPa (not shown), and the IMF is characterisedby mainly positiveBy and Bz, both with a mean value of+3 nT (Fig. 3b and c). TheBx component also remainsslightly positive, oscillating between 0 and+3 nT (Fig. 3a).But during the interval under study (05:15–06:00 UT), a ro-tation of the IMF is observed. Initially duskward and north-ward, the IMF progressively turns dawnward and then south-ward to reachBz ∼−2 nT andBy ∼−5 nT between 05:30and 05:45 UT, after which the IMF returns to its initial di-rection. AsBz remains smaller thanBy , the convection pat-tern is mainly controlled by theBy component. The rota-tion of the IMF is evidenced by the clock angle (Fig. 3d)which reaches a maximum of 110◦ at∼05:40 UT. FollowingTaguchi and Hoffman(1996), who showed that the IMFBy
control of the convection requires clock angles larger than
SuperDARN FOV and Cluster footprint - 05:30 UT
-165
75
90
105
120
135
150
165180
70
80
90
12:36 MLT
06:36 MLT
E
FCluster
b2
b14
Figure 2Fig. 2. Common field-of-view (magnetic coordinates) of the Super-DARN Hankasalmi (Finland: F) and Pikkvibær (Iceland East: E)radars at 05:30 UT, with the Pikkvibær beam 2 and the Hankasalmibeam 14 (dashed lines) and the Cluster footprint (black dot) super-imposed.
70◦, we may expect aBy control starting around 05:25 UTand lasting up to 05:43 UT. The IMF clock angle rotationis also favourable to reconnection between the IMF andmagnetospheric field lines at the dawnside northern magne-topause. Thus, except for the short period between∼05:30and∼05:45 UT, when IMFBz < 0, the IMF and solar winddata confirm that very quiet conditions are prevailing andsupport the observation of a polar cusp at very high latitudes,as it will be shown from Cluster and radar data in the nextsection.
4 Observations
4.1 High-altitude cusp
In this section, the presentation will be organised around theCIS and FGM data, with reference to the other instrumentswhen useful. Figure 4 presents data from CIS and FGM onboard Cluster 1, for the interval 05:15–06:00 UT. The panelsfrom top to bottom display the magnetic field amplitude, thetotal ion density, the ion parallel velocity, the ion perpendic-ular velocity projected in theXY GSE plane and the energy-time spectrogram of precipitating H+ ions in the 0− −20◦
pitch angle range. Figure 5 presents data from other instru-ments of the Cluster 1 and 3, from top to bottom, the WHIS-PER (SC1) electron density, thex andy GSE components ofthe electric field from EFW (SC1) and EDI (SC3), and the
A. Marchaudon et al.: Transient plasma injections in the dayside magnetosphere 145
Figure 3
Fig. 3. Interplanetary magnetic field(IMF) from the ACE spacecraft on17 March 2001 for the period 04:30–06:30 UT. Data are lagged by 86 minto take into account the delay from thespacecraft to the ionosphere. Panels(a),(b) and(c) show, respectively, the IMFBx , By and Bz components in GSMcoordinates. Panel(d) shows the IMFclock angle.
PEACE (SC1) energy-time spectrogram of the electrons inthe parallel direction.
Cluster is in the cusp from 05:05 to 06:50 UT (Vontrat-Reberac et al., 2003). During the shorter period displayedin Fig. 4, the ion density (Fig. 4b) fluctuates between 5 and15 cm−3 and the mean ion parallel energy (Fig. 4e) is 300 eV,both values being typical of the high-altitude cusp. ThePEACE data also exhibit typical cusp properties, such as anelectron mean energy of 40 eV (Fig. 5d) and essentially bi-directional electron fluxes (parallel and anti-parallel). TheWHISPER electron density is of the same order and wellcorrelated with the CIS ion density (Figs. 4b and 5a). Sev-eral characteristics of a northward IMF cusp are also ob-served, namely its location at very high latitude, between 79◦
and 81◦ MLAT (Newell et al., 1989; Palmroth et al., 2001)and the energy-time dispersion of the ion injections (Vontrat-Reberac et al., 2003).
The interval 05:25–05:54 UT can be divided into threesub-intervals, numbered 1, 2 and 3 in Figs. 4 and 5, accordingto the sign of the dawn-dusk component of the perpendicu-lar ion velocity in Fig. 4d, which closely follows the IMFBy
variations. Before interval 1, plasma injections are observedat Cluster, with large parallel velocities. This period is asso-ciated with positive IMFBy andBz before the IMF turning.Because Cluster and SuperDARN observations are not con-jugate, we will focus only on later injections observed duringinterval 2.
Between 05:25 and 05:36 UT (interval 1 in Figs. 4 and 5),the perpendicular convection velocity is less than 20 km s−1
and points primarily dawnward. The CIS density is low(∼6–7 cm−3) with only small fluctuations. The magneticfield amplitude is fairly steady, typical of a quiet period.These observations correspond to a transition phase in thecusp, associated with the period when the IMF is rotat-ing from a northward-duskward orientation to a southward-dawnward orientation.
Between 05:36 and 05:46 UT (interval 2 in Figs. 4 and 5),the convection at Cluster turns duskward (in the+YGSE di-rection). The convection velocity increases up to 50 km s−1,with numerous fluctuations in direction and amplitude. Theparallel ion flux and the ion density exhibit a series of en-hancements with multiple peaks. More precisely, when the

146 A. Marchaudon et al.: Transient plasma injections in the dayside magnetosphere
Cluster 1 - FGM and CIS 17/03/2001a
d
c
b
05:18 05:24 05:4805:36 05:4205:30 05:54 06:00
Time UT
1
4
3
2
PA
=0-2
0˚
H +
En
erg
y (e
V)
log
10 c
ou
nts
-2
-1
0
1
2e
1 32
Figure 4
Fig. 4. Cluster 1 FGM and CIS data forthe period 05:15–06:00 UT, with threesub-intervals. (a) Magnetic field am-plitude. (b) Total ion density. (c) Ionparallel velocity. (d) Ion velocity vec-tors perpendicular to the magnetic fieldprojected in theXY GSE plane. (e)Energy-time spectrogram of precipitat-ing H+ ions, in the 0–20◦ pitch anglerange.
perpendicular velocity shows three successive duskward in-tensifications centred at 05:38, 05:40 and 05:43 UT, the par-allel ion velocity (defined as the moment of the total ion dis-tribution function) shows three weak downward peaks (50and 100 km s−1), characteristic of an excess of precipitatingions. Notice that a first peak of parallel velocity also occurs at05:36 UT, associated with dawnward perpendicular velocityand located at the boundary between intervals 1 and 2. Mag-netic field perturbations are also observed, in particular, themagnetic field amplitude decreases during each velocity en-hancement and ion injection (diamagnetic effect). These ob-servations coincide with the period of dawnward and south-ward IMF, favouring the solar wind plasma entry at the dawn-side magnetopause. Therefore, one can anticipate that theseobservations are signatures of cusp plasma injections due tomagnetic reconnection.
Between 05:46 and 05:54 UT (interval 3 in Fig. 4), the per-pendicular convection velocity turns dawnward again, withcharacteristics similar to interval 1, but the speed remainslarge (around 30 km s−1). The density presents a large-scale enhancement, the ion energies decrease slightly and
the energy-time (latitude) dispersion profile is more contin-uous, suggesting a change in the reconnection process. Inaddition to the general decrease due to the motion of Clus-ter towards the magnetopause, the magnetic field amplitudeshows a reduction followed by an enhancement, which is in-verse to the density variation, implying a diamagnetic effect.This interval is associated with the return to the conditions ofduskward and northward IMF. After 05:54 UT, the increasein ion energies suggests the occurrence of a new injection,and the perpendicular velocity turns duskward again for sev-eral minutes, but no apparent change in the IMF can be as-sociated with it. All the above observations of the densityand perpendicular ion velocity during intervals 1-2-3 are con-firmed by the PEACE, WHISPER, EFW and EDI data: theion and electron density profiles measured by CIS, PEACEand WHISPER (Figs. 4b and 5a) are very similar, resultingfrom the need to maintain quasi-neutrality in the cusp (Reiffet al., 1977; Burch, 1985). Also, the electric field measuredby EFW and EDI (Fig. 5b and c) confirms the convectionvelocity obtained by the CIS instrument. The electric fieldprofiles of both experiments are comparable, in spite of the

A. Marchaudon et al.: Transient plasma injections in the dayside magnetosphere 147
Ne
(cm
-3)
Ey_
GS
E (
mV.
m-1
)E
x_G
SE
(m
V.m
-1)
Ey_
GS
E (
mV.
m-1
)E
x_G
SE
(m
V.m
-1)
Cluster 1 & 3 - 17/03/2001
Figure 5
1 32
EDI sc3 EFW sc1
EDI sc3 EFW sc1
WHISPER sc1a
c
b
En
erg
y (
eV)
Flu
x (e
rgs
/(cm
2.st
r.s.
eV))
PEACE sc1 - Parallel Flux
Time UT
d
Fig. 5. WHISPER, EFW, EDI and PEACE data for the period 05:25–05:55 UT, with three sub-intervals.(a) WHISPER (SC1) electrondensity. (b) and(c) x andy components of the electric field in GSE coordinates for EFW (SC1) (red line) and EDI (SC3) (black crosses).The offset of the EFW data has been corrected.(d) PEACE (SC1) energy-time spectrogram of precipitating electrons, in the 0− 20◦ pitchangle range (Calibration 1.5).
use of spacecraft 3 for EDI with less data gaps, introducinga small lag of about 1 min between EDI and EFW. In addi-tion, data (not shown) from the same experiment but fromdifferent satellites show similar signatures, suggesting thatmultipoint measurements can be used safely to deduce thevelocity of propagation of the flux tubes in which injectionoccurs.
4.2 Ionospheric convection
Figure 6 presents three pairs of range-time colour-codedplots showing the ionospheric convection measured by theCUTLASS Hankasalmi and Pikkvibær radars between 05:15
and 06:15 UT. In each pair, the upper plot shows the l-o-svelocity and the lower plot shows the amplitude (dB) of thebackscattered signal. Three beams are presented: from topto bottom, beams 13 and 14 of Hankasalmi and beam 2 ofPikkvibær. These three beams are directed mainly eastwardand thus, measure essentially the dawn-dusk component ofthe convection velocity. The Hankasalmi beam 14 and thePikkvibær beam 2 are the beams on which the Cluster foot-print is located during this period (black and white lines inthe middle and bottom panels). For both radars, the l-o-svelocity shows cusp echoes, and the time period can be sub-divided into the same three intervals as for the Cluster data.Before 05:27 UT and after 05:48–05:50 UT, the two radars

148 A. Marchaudon et al.: Transient plasma injections in the dayside magnetosphere
SuperDARN radial velocity and power
Velo
city (ms -1)
-450-300-1500150300450
Ionosphericscat only
58606264666870
Ran
ge g
ate
586062646668
Ran
ge g
ate
Beam 2 - Thikkvibaer
05:20 05:30 05:40 05:50 06:00 06:105658606264666870
Ran
ge g
ate
60626466
Ran
ge g
ate
0
5
10
15
20
25 Po
wer (d
B)
Ionosphericscat only
UT05:20 05:30 05:40 05:50 06:00 06:10
5658606264666870
Ran
ge g
ate
6062646668
Ran
ge g
ate
58606264666870
Ran
ge g
ate
586062646668
Ran
ge g
ate
Beam 13 - Hankasalmi
UT
58606264666870
Ran
ge g
ate
586062646668
Ran
ge g
ate
Beam 14 - Hankasalmi
05:20 05:30 05:40 05:50 06:00 06:105658606264666870
Ran
ge g
ate
6062646668
Ran
ge g
ate
Velo
city (ms -1)
-450-300-1500150300450
Ionosphericscat only
Velo
city (ms -1)
-450-300-1500150300450
Ionosphericscat only
0
5
10
15
20
25 Po
wer (d
B)
Ionosphericscat only
0
5
10
15
20
25 Po
wer (d
B)
Ionosphericscat only
Cluster
Cluster
UT
Figure 6Fig. 6. Pairs of range-time plots (l-o-s velocity and backscattered power) for three beams of SuperDARN radars for the period 05:15–06:15 UT. The Cluster footprint is superimposed on beam 14 of Hankasalmi and beam 2 of Pikkvibær (black or white line). The slope of therange-time dispersed structures are depicted by black segments on the power plot of the beams 13 and 14 of the Hankasalmi radar.
measure dawnward (positive) velocities associated with theperiods of positive IMFBy . Between 05:27 and 05:48 UT,i.e. during the period of stronger negative IMFBy , they showduskward (negative) velocities. During the whole interval05:15–06:15 UT, the plasma velocity is fairly weak, less than600 m s−1, probably due to the quiet conditions prevailing
during the overall period. The cusp echoes are located atlarge ranges, between 09:30 and 12:30 MLT and between 74◦
and 82◦ MLAT. The dawnward and southward rotation of theIMF is too short for a clear equatorward motion of the cuspechoes to be observed, as expected for a southward IMF ex-cursion.
A. Marchaudon et al.: Transient plasma injections in the dayside magnetosphere 149
During the interval of duskward convection velocity, eachradar observes strong flow enhancements (flow bursts) alsomoving duskward, with an increased velocity. These burstsare typical ionospheric signatures of plasma injection events(Pinnock et al., 1995). Therefore, the two radars observe dif-ferent flow bursts, with those of Hankasalmi being locatedover the Cluster footprint track, while those of Pikkvibær arecloser to the radar. Then the flow bursts detected simultane-ously by the two radars do not represent the same structure.This also explains why, in the range-time velocity plots ofFig. 6, the shapes of the velocity flow bursts are differentfor the two radars. The range-time slope of the bursts in thePikkvibær beam clearly indicates a predominantly duskwardmotion of the burst, whereas no clear motion of the veloc-ity structures is observed along the Hankasalmi beams. Al-though no echoes are observed by the Pikkvibær radar atthe Cluster position, the flow bursts observed at closer rangegates should reach the Cluster footprint after the end of thenegative IMFBy period. On the contrary, the flow bursts ob-served by the Hankasalmi radar pass the Cluster position atthe beginning of their lifetime during the negative IMFBy
period. Therefore, we will later compare only the convectiondata from the Hankasalmi radar with Cluster. The Pikkvibærdata can be used only to demonstrate the global scale of thechanges in the ionospheric convection observed at the Clus-ter footprint by the Hankasalmi radar, and that the negativeIMF By period is associated with several injections.
Figure 6 also indicates that the amplitude of the backscat-tered signal is weak during the periods of dawnward ve-locity before 05:25 UT and after 05:51 UT. Between 05:25and 05:51 UT, the amplitude increases strongly, particularlywithin the velocity flow bursts, possibly due to intense par-ticle precipitation related to upward field-aligned currents.In the range-time backscattered power plots, the flow burstsare characterized by a time dispersion on both radars, con-trary to the velocity structures, where no clear dispersion isseen on the Hankasalmi beams. Two structures are observedon the Pikkvibær radars and three on the Hankasalmi radars(see the three black lines in the top two panels), with thefirst two being hardly separated. The backscattered power islarger along the Pikkvibær beams than along the Hankasalmibeams, and the shape of the structures varies between the tworadars, which again confirms that the flow bursts seen by thetwo radars are different. From the slope of the three powerstructures observed with the Hankasalmi radar, it will be pos-sible to derive the velocity of the flow bursts structures andto compare it with the velocity of plasma structures observedat Cluster and projected into the ionosphere.
5 Comparison between SuperDARN and Cluster
5.1 Plasma convection velocity
In this section, we present a detailed comparison betweenthe convection velocity measured in the ionosphere by Su-perDARN and in the magnetosphere by Cluster. For map-
ping the Cluster velocity into the ionosphere, magnetic fieldlines are assumed to be equipotential and the TsyganenkoT96 model (Tsyganenko, 1995) is used with inputs of IMFand solar wind data measured by ACE and lagged by 86 min.Each data point of perpendicular ion velocity measured bythe CIS instrument on Cluster 1 is projected along magneticfield lines into the ionosphere and then compared with Su-perDARN radial velocities at the Cluster footprint location.We checked the validity of the T96 model by comparing themagnetic field vectors obtained by the model at the Clusterposition and by the FGM instrument. The agreement is goodwithin less than 15% in amplitude and 5◦ in direction.
The comparison of plasma convection velocity at Clusterand SuperDARN is shown in Fig. 7. Panel (a) presents thetime variation of the CIS ion perpendicular velocity in theform of vectors at the Cluster position. Each vector repre-sents the perpendicular-to-B component of the plasma con-vection velocity projected onto theXY GSE plane. Becausethe local magnetic field is close to thezGSE direction, the−yGSE component is mainly dawnward. Panel (b) showsthe same data after projection into the ionosphere at 250 kmaltitude, where Vwest and Vnorth correspond to the veloc-ity components in the magnetic west and north directions inAACGM coordinates. For comparison, panel (c) displays therange-time plot of the l-o-s velocity for the Hankasalmi beam14 with the Cluster footprint (black line). In order to better il-lustrate the correlation between the Cluster and SuperDARNvelocities, the mapped CIS velocity is first averaged with arunning mean over one minute (the time resolution of Su-perDARN measurements), and then projected along the di-rection of the Hankasalmi beam 14 and plotted in panel (d),together with the velocity measured in the appropriate Super-DARN range gate where the Cluster footprint is located (redsegments).
The correlation between satellite and radar convection ve-locity is satisfactory, particularly if a short delay of 2 minbetween Cluster and SuperDARN is allowed. This is the rea-son why the Cluster data are plotted for the 05:15–06:00 UTperiod (panels (a) and (b)) whereas the SuperDARN data andthe SuperDARN-Cluster correlation are plotted at the iono-spheric time for the 05:17–06:02 UT period (panels (c) and(d)). At the range gate of the Cluster footprint, the directionof the beam 14 of Hankasalmi is close to dawn-dusk (west-east), making positive velocities essentially dawnward andnegative velocities duskward. Except for the short intervalof dawnward velocities measured by Cluster between 05:35and 05:36 UT (panels (a) and (b)) which is not observed bySuperDARN, probably because this structure is too short tobe detected by SuperDARN with its 1-min resolution, Super-DARN and Cluster show the same global behaviour of theeast-west component of the convection. A first dawn-to-duskreversal at 05:34 UT (Cluster time) is followed by a step in-crease of the duskward velocity at 05:36 UT after which threeduskward intensifications between 05:36 and 05:46 UT areassociated with the injections (see below) and followed againby a dusk-to-dawn reversal at 05:46 UT. The last dawn-to-dusk reversal observed at Cluster at 05:56 UT is not observed

150 A. Marchaudon et al.: Transient plasma injections in the dayside magnetosphere
Dawn
Ion
osp
her
ic p
oje
ctio
n o
f C
lust
er c
onv
ecti
on
vel
oci
tyC
lust
er 1
- c
onv
ecti
on
ve
loci
ty
05:20 05:30 05:40 05:50 06:00
55
60
65
70
Ran
ge
gat
e
-450
-300
-150
0
150
300
450 Velocity (m.s -1)
Ionosphericscat only
Cluster footprint
Rad
ial v
elo
city
Fin
lan
d
rad
ar -
bea
m 1
4Io
no
sph
eric
co
nvec
tio
n v
elo
city
al
on
g t
he
bea
m 1
4 (m
.s )
Cluster
SuperDARN
Time UT
a
d
c
b
Figure 7
Dawnward
Duskward
Cluster & SuperDARN convection velocity
Fig. 7. Convection velocity measured by SuperDARN and Cluster.(a) Cluster 1 CIS ion perpendicular velocity vectors. Each vectorrepresents the perpendicular-to-B component of the plasma velocity projected onto theXY GSE plane. Because the local magnetic field isclose to thezGSE direction, the−yGSE component is mainly dawnward.(b) Projection into the ionosphere at 250 km altitude of the CISvelocity vectors, whereVwest andVnorth correspond to the velocity components in the magnetic west and north directions, respectively, inAACGM coordinates.(c) Range-time plot of l-o-s velocity for the SuperDARN Hankasalmi beam 14 with the Cluster footprint superimposed(black line). (d) Comparison of velocity measured by Cluster (solid black line) and SuperDARN (red segments). The Cluster CIS velocityhas been averaged over 1 min and projected along the beam 14 of Hankasalmi. The SuperDARN velocity is the radial velocity measured atthe Cluster footprint.
at the same location by SuperDARN, but about one rangegate (45 km) westward of the Cluster footprint (panel (c)).However, this discrepancy remains within the error range,since the uncertainty of the Cluster footprint with respect tothe SuperDARN pattern is as large as±4 gates (±180 km).This evaluation takes into account model-dependent uncer-
tainties in mapping Cluster to the ionosphere and range un-certainties in the localization of SuperDARN echoes for largeranges. Detailed examination of the 05:36–05:46 UT inter-val shows that the three duskward intensifications observedby Cluster (mentioned above) are also observed by Super-DARN, although the one-minute time resolution of the radars

A. Marchaudon et al.: Transient plasma injections in the dayside magnetosphere 151
Table 1. Comparison of the velocity of plasma structures (phase velocity) measured by Cluster and SuperDARN. The Cluster velocity hasbeen deduced from FGM data (first row) and mapped into the ionosphere with T96 model (second row) and projected along beam 14 of theHankasalmi radar (third row). The SuperDARN phase velocity is deduced from the slope of the backscattered power in the range-time plotof beam 14 of the Hankasalmi radar (bottom row). The different observation times at Cluster and at SuperDARN is due to the propagationfrom the magnetosphere to the ionosphere
Cluster structures Burst 1 Burst 2 Burst 305:38:00 UT 05:39:30 UT 05:42:30 UT
High-altitude velocity 7.5 km s−1 15.4 km s−1 10.8 km s−1
(from FGM data)
High-altitude velocity 295 m s−1 640 m s−1 405 m s−1
ionospheric projection
Velocity component 395 m s−1 645 m s−1 590 m s−1
along Hankasalmi beam 14
SuperDARN structures Burst 1 Burst 2 Burst 305:40:00 UT 05:41:30 UT 05:45:00 UT
Ionospheric velocity 420 m s−1 710 m s−1 650 m s−1
SuperDARN data
does not allow one to separate clearly the first two. Onlythe third velocity burst is clearly separated by both instru-ments. Moreover, during this interval of negative velocities,a general decrease in the amplitude of the velocity is alsoobserved by both instruments. The average velocity (panel6(d)) is systematically larger when deduced from the CISdata (up to 1000 m s−1) than when measured by SuperDARN(up to 600 m s−1). This difference can possibly be explainedby the uncertainty in the mapping of the static electric fieldfrom Cluster to the ionosphere and by the fairly large spatialsmoothing in the SuperDARN data.
5.2 Velocity of plasma structures
Independent of convection velocity, we can also comparethe velocity of plasma structures (hereafter named phase ve-locity) observed at Cluster and the velocity of correlatedplasma structures in the ionosphere. This comparison islimited to the interval of duskward convection velocity be-tween 05:36 and 05:46 UT (Cluster time), during which well-defined plasma structures associated with the injections aredetected. In the magnetosphere, the phase velocity of theplasma structures is deduced from the simultaneous four-point Cluster FGM data and in the ionosphere from the slopeof the range-time SuperDARN power plots (Fig. 6). At theCluster altitude, each drifting plasma structure is character-ized by mostly similar magnetic and particle signatures onthe four spacecraft, assuming the size of the structure islarger than the spacecraft separation (∼600 km). Magneticsignatures from FGM have been preferred because of theirhigher time resolution and because the magnetic field vari-ations directly reflect the structure of the plasma injectiontube (diamagnetism affecting the parallel component) andthe presence of parallel currents (affecting the direction of the
magnetic field) (Southwood, 1987; Lockwood et al., 2001a).However, we have checked that the phase velocity deducedby the same method, but from the electron density profilesmeasured by the four WHISPER instruments, is very similar(not shown). We have chosen a coordinate system in whichthe z direction is along the mean field direction (averagedover a 2–3 min period around the event). Thex andy di-rections are given by the maximum and minimum variancein the perpendicular component. Because Cluster is situatedat about 8RE , this coordinate system has been preferred tothe usualL, M, N system used when observations are madeclose to the magnetopause (Russell and Elphic, 1978).
The parallel and maximum variance components, togetherwith the ion density and parallel velocity given by CIS, areplotted for the 05:36–05:46 UT interval in Fig. 8. Threeminima are observed in the parallel component of the mag-netic field (shaded zones) superposed on the large scale de-crease due to the motion of the spacecraft and correlated withdensity maxima. Each of them is associated with a bipo-lar signature in the perpendicular component of the magneticfield, suggestive of a pair of field-aligned currents of oppositesigns, and with a sharp gradient in the parallel velocity. Allthese signatures are typical of plasma injections and FTEs(Russell and Elphic, 1978; Paschmann et al., 1982).
In order to calculate the phase velocity of these three struc-tures in the magnetosphere, we have identified similar fea-tures on each spacecraft. As an example, Fig. 9 shows themagnetic field signatures of the third event, in the directionof the mean magnetic field and in the direction of maximumperpendicular variance. Arrows on Fig. 9 show identifiedsimilar features. Assuming a plane structure with a uniformvelocity through the four Cluster satellites, we determinedthe velocity of the plane along its normal from the time de-lay between the observation of similar signatures at the dif-

152 A. Marchaudon et al.: Transient plasma injections in the dayside magnetosphere
Figure 8Time UT
Fig. 8. Plasma injection events observed at Cluster.(a) Ion density.(b) Ion parallel velocity.(c) Perpendicular component and(d) parallelcomponent of the magnetic field (see text).
ferent spacecraft (Dunlop et al., 2002). This perpendicularvelocity is then mapped into the ionosphere with the Tsyga-nenko T96 model. Finally, the Cluster projected velocity iscompared with the velocity of the SuperDARN ionosphericsignature of the flow burst by projecting the phase velocityalong the Hankasalmi beam 14 and assuming a 2–3 min de-lay between the structures observed by Cluster and by Super-DARN (as for the plasma convection velocity). The resultsare presented in Fig. 10. The top row shows for each eventthe phase velocity at the Cluster location in the plane per-pendicular to the magnetic field, together with the relative
positions of the four spacecraft. The bottom row shows thevelocity projected into the ionosphere with the direction ofbeam 14 of the Hankasalmi radar. The first and third struc-tures move equatorward and eastward, whereas the secondstructure moves essentially eastward. As it was the case forconvection velocity, the Pikkvibær data cannot be used to de-termine a second component of the phase velocity, and there-fore, we are limited to one single component, along the Han-kasalmi beam 14 for the comparison. Table 1 shows the ve-locities at the different stages for each event. The first linegives the velocity in the magnetosphere, while the second

A. Marchaudon et al.: Transient plasma injections in the dayside magnetosphere 153B
// (n
T)
Time UT
Bva
rmax
(nT
)
a b
Figure 9Fig. 9. Cluster magnetic field variations around the burst at05:42:30 UT (Burst 3 of Fig. 10).(a) Parallel component.(b) Per-pendicular component in the direction of maximum variance. Thecolour identification of the spacecraft is the same as for Fig. 1. Ar-rows indicate the time of observation of a similar variation at eachspacecraft.
and the third lines give the velocity in the ionosphere andits component along the Hankasalmi beam 14. Notice thatthe apparent (phase) velocity of a plane structure along anydirection is larger than the velocity along the normal to thestructure. The last line gives the SuperDARN radial phasevelocity obtained from a linear least-square fit to the slope ofthe backscattered power (Fig. 6b). Surprisingly, for all threeevents, the agreement between the two independent determi-nations of the phase velocity is excellent, owing to the largeuncertainties (∼20%) of each determination.
6 Discussion
6.1 Plasma convection velocity and phase velocity of theflow events
In the Southwood (1987) model of the ionospheric signatureof FTEs, the plasma convection velocity is equal to the ve-locity of the flux tube, because of plasma incompressibility.Any discrepancy between these two velocities should thenbe attributed to a phase effect, for instance, related to themotion of the reconnection site on the magnetopause. FromSuperDARN, the plasma convection velocity inside the threeflow events remains relatively stable in amplitude between350 and 500 m s−1, and the phase velocity is between 400and 700 m s−1 (see Table 1). Therefore, the plasma convec-tion velocity is almost equal to the phase velocity for the firstflow burst and is half of it for the last two events. These re-sults are in good agreement with those obtained by Provanet al. (1998) and particularly by McWilliams et al. (2001),
who also found that during the first half of the lifetime of apulsed ionospheric flow, its phase velocity is twice the con-vection velocity, with both velocities being measured in theionosphere. The main difference between our results and thetwo papers listed above is that in our case, there are lowervalues of the plasma flow and phase velocities, which canbe explained by the low solar wind pressure associated withthe dominant northward IMF. On the contrary at Cluster, theplasma velocity measured by CIS appears larger than thephase velocity in two of the bursts (respectively, 25 km s−1
and 20 km s−1 in bursts 2 and 3) and slightly smaller in burst1. So, the mean ratio between the plasma velocity and thephase velocity reverses between Cluster and the ionosphere.However, this result must be considered with care, owing tothe fairly large uncertainty of the phase velocity determina-tions. Furthermore, the bursts observed at Cluster are char-acterised by large gradients in the plasma velocity.
6.2 Flow events dimensions
Here, we evaluate and compare the ionospheric dimensionsof the three flow events. Using the power data of the Han-kasalmi radar, and by identifying the number of beams, aswell as the number of gates for each beam where the struc-tures are observed, the north-south and east-west dimensionsof the flux tubes can be obtained. Since the structures areobserved on 2 beams and on 1 or 2 gates for each beam, theirtypical dimensions are about 300 km in the north-south direc-tion and 45–90 km in the east-west direction. Although theseionospheric dimensions are characteristic of reconnected fluxtubes, the north-south elongation of the structures are un-usual (Provan et al., 1998; McWilliams et al., 2001). Be-cause the structures are moving in the east-west direction,the flow events move over the Cluster satellites along theirsmaller dimension. This result supports the hypothesis of aplane structure used for the determination of the phase veloc-ity at Cluster. At the Cluster altitude, the east-west smallerdimension of the reconnected flux tubes can be evaluated to∼700–1500 km (given by the product of the phase velocity ofthe structure by the time during which Cluster remains insidethe structure). Now, we can compare the east-west dimen-sion of each ionospheric structure observed by the radar withthe dimension deduced from Cluster data and mapped intothe ionosphere. The ionospheric dimension in the east-westdirection of each injection, as deduced from Cluster data, is∼30 km for the first,∼60 km for the second, and∼40 km forthe third. These dimensions are slightly smaller than thosedetermined from the SuperDARN data, but owing to theirpoor spatial resolution, the comparison is quite satisfactoryand adds consistency to the comparison between the convec-tion and phase velocities made in the previous sections.
6.3 Global ionospheric convection and location of the re-connection site
In order to replace the previous results with respect to thelarge-scale ionospheric flow pattern and then to infer the lo-

154 A. Marchaudon et al.: Transient plasma injections in the dayside magnetosphere
Poleward
Equatorward
DuskwardDawnward
km km
Poleward
Equatorward
DuskwardDawnward
km km
Poleward
Equatorward
DuskwardDawnward
km km
Northward
Southward
EastwardWestward Beam 14
H
Northward
Southward
EastwardWestward Beam 14
H
Northward
Southward
EastwardWestward Beam 14
H
ION
OS
PH
ER
EM
agn
etic
Co
ord
inat
esM
AG
NE
TOS
PH
ER
EP
lan
e p
erp
end
icu
lar
to B
05:38 UT 05:42:30 UT05:39:30 UT
Southward
Northward
Poleward
Equatorward Eastward
Duskward
Fig
ure
10
Cluster & SuperDARN phase velocity of the structures
Fig. 10. Phase velocity vector of three injections events determined from Cluster FGM and associated with flow bursts observed by Super-DARN. Top: at the Cluster location in the plane perpendicular to the magnetic field and in GSE coordinates with the relative position of thefour spacecraft. Bottom: projection of the Cluster velocity into the ionosphere in AACGM coordinates. The direction of beam 14 of theHankasalmi radar at the Cluster footprint is also shown.
cation of the reconnection site, we have employed the “mappotential” technique developed by Ruohoniemi and Baker(1998). This technique yields large-scale global convec-tion maps from the l-o-s velocity measurements by multi-ple radars, via mathematical fitting of the data, to an ex-pansion of the electrostatic potential in spherical harmonics.First, the l-o-s data are filtered and then mapped onto a polargrid. These “gridded” measurements are then used to deter-mine the most consistent electrostatic potential distribution.The iso-potential lines represent the plasma streamlines ofthe convection. Since l-o-s velocity measurements are notalways available, information from the statistical model ofRuohoniemi and Greenwald (1996), parameterised by IMFconditions, is used to stabilise the solution where no mea-surements are made. Two of these global maps are plottedin Fig. 11 to show the variations of the global ionosphericconvection.
During the interval 04:40–05:25 UT, when the IMFBy andBz are positive, before the observations described in this pa-per, the Cluster footprint is located close to the Hankasalmiradar echoes, and both instruments observe repeated plasmainjection signatures. These injections observed by Clusterwere already mentioned in Sect. 4.2. The global convectionmap at 05:03–05:04 UT (Fig. 11a) shows an almost circu-
lar clockwise cell, centred close to the magnetic pole. Theconvection velocity is largest in the dawn sector between06:00 and 12:00 MLT. The plasma in the cusp region aroundnoon is purely dawnward, indicating the strong control ofthe dayside convection by the positive IMFBy component.Since the IMFBz component is positive, this central cell canbe the lobe cell driven by reconnection on the high-latitudemagnetopause, tailward of the cusp region, as expected fromthe anti-parallel merging concept of the associated three-cellmodel of Cowley and Lockwood (1992) for positive IMFBy
andBz. From this model, the reconnection site is probablylocated on the dusk side of the northern lobe. Two classicalviscous cells are also expected on both sides of a single lobecell. In Fig. 11a, only the dawn side cell is clearly observed,probably because very few radar echoes are obtained on thedusk side ionosphere below 75◦ MLAT. The reduced size ofthe polar cap and the small convection velocity, both due tothe northward IMF, can explain why the radars do not de-tect the sunward return flow on the equatorward sides of thetwo viscous cells expected around 75◦ MLAT, between 03:00and 09:00 MLT on the morningside and between 15:00 and21:00 MLT on the eveningside.
Between 05:27 and 05:37 UT, an important reorganisationof the convection occurs, with a strong decrease in the plasma

A. Marchaudon et al.: Transient plasma injections in the dayside magnetosphere 155
00
60
65
70
75
80
85
90
A
F
B
GT
E
K
W
-9
-9
-9
3
3
3
3
APL MODEL0<BT<4Bz-/By-moderate
True vecs
05:39:00 - 05:40:00 UT
2000 m/s
m/s
F
00
60
65
70
75
80
85
90A
F
B
G
T
E
K
W-9
-9
3
3
APL MODEL0<BT<4Bz+/By+moderate
True vecs 05:03:00 - 05:04:00 UT
(a)
(b)
Fig. 11. Global convection velocitymaps deduced from SuperDARN dataof the Northern Hemisphere radars ac-cording to the method of Ruohoniemiand Baker (1998), at two selected timesfor (a) IMF By > 0 and (b) IMFBy < 0. The black solid lines repre-sent the equipotential contours and thecolour dots represent the grid pointswhere the convection vectors are deter-mined.
velocity in the cusp region, probably associated with theBy
turning, which is observed both by SuperDARN (not shown)and Cluster (Vontrat-Reberac et al., 2003). Then between05:37 and 05:48 UT, during the time interval studied in thispaper, the convection velocity in the cusp increases again butthe ionospheric flow turns suddenly duskward, as shown bythe global convection map at 05:39–05:40 UT in Fig. 11b.In particular, the flow bursts in the polar cusp are injected inthe pre-noon sector between 11:00 and 12:00 MLT and aredragged duskward. Moreover, a large duskside cell is alsoobserved with a clear crescent-shape due to magnetic tensioneffect. These observations confirm that even during this pe-
riod of negativeBz, the global dayside convection contin-ues to be controlled by the IMFBy . Several other charac-teristics are in agreement with a negative IMFBz, such asthe lower latitude (74◦ MLAT) of the flow bursts appearance,the global convection pattern extending to slightly lower lat-itudes in the dayside and displaying the well-known two-cellcirculation. These observations support a reconnection onthe low-latitude dayside magnetopause. However, the phasevelocity of two of the flow bursts determined from Clusterdata (Fig. 10) shows a southward component, which couldbe interpreted as indicating a reconnection site on the high-latitude magnetopause, tailward of the cusp (Maezawa, 1976;

156 A. Marchaudon et al.: Transient plasma injections in the dayside magnetosphere
Crooker, 1979; Sandholt et al., 1992). A possibility is thatbecause the convection is clearly controlled by the IMFBy ,the reconnection site could be located on the dawn flank ofthe magnetopause (|By | > |Bz|) (Crooker, 1979, 1988) andneither on the high- nor on the low-latitude magnetopause.
After 05:48 UT, the convection velocity in the cusp turnsdawnward again. A clockwise central cell reappears with thesame characteristics as during the interval 04:40–05:27 UT,confirming the return to a positive IMFBy andBz convectionpattern and a reconnection site on the high-latitude magne-topause.
7 Conclusion
A conjunction between the Cluster spacecraft in the daysideexternal cusp and the SuperDARN radars in the ionosphereallows one to compare the plasma convection velocity andthe drift velocity of plasma injection structures at the two lo-cations. We have first compared convection velocity in themagnetosphere and in the ionosphere. The convection pat-tern is dominated by the IMFBy component and reacts al-most instantaneously to its variations. The comparison be-tween the convection directions at both locations is satisfac-tory, if one assumes a 2–3 min delay between the cusp at7–8RE altitude and the ionosphere. The convection veloc-ity measured at Cluster after mapping into the ionosphere,is systematically about 1.5 times larger than at SuperDARN,but the relative variations are at both locations very consis-tent.
The most important result is the clear one-to-one corre-lation observed between three successive particle injectionstructures, each associated with magnetic bipolar signaturestypical of FTEs, and three subsequent bursts of enhancedconvection observed in the ionosphere. The best correla-tion is achieved when a time delay of 2–3 min is appliedbetween the 7–8RE altitude and the ionosphere. Evalua-tion of the drift (phase) velocity at Cluster (7.5–15 km s−1, or400–600 m s−1 when mapped into the ionosphere) and of thephase velocity of the associated flow bursts in the ionospheregives similar results. From SuperDARN measurements, de-pending on the flow bursts, the phase velocity varies fromequal to twice the convection velocity and is in agreementwith previous works (Provan et al., 1998; McWilliams etal., 2001). On the contrary at Cluster, the phase velocity issmaller than the convection velocity. The size of reconnectedflux tubes at Cluster and of their elongated counterpart in theionosphere has been evaluated. From SuperDARN HF radar,the size at ionospheric altitudes is of the order of 45–90 kmin the east-west direction and elongated up to∼300 km inthe north-south direction. The ionospheric east-west dimen-sions evaluated at Cluster are consistent, although smaller(30–60 km). Thus, we may suggest that, during a∼15-mininterval of IMF pointing southward-dawnward, simultaneousmagnetospheric transient observations at Cluster, i.e. spo-radic particle injections within newly-opened flux tubes mov-ing eastward, and in the ionosphere, i.e. transient flow bursts
moving duskward, are related signatures of a pulsed mag-netic reconnection occurring on the dawn flank of the mag-netopause.
Acknowledgements.The authors are grateful to the Principal Inves-tigators, A. Balogh, (FGM), A. Fazakerley (PEACE), G. Gustafsson(EFW), G. Paschmann (EDI) and, H. Reme (CIS), for providingthe Cluster data. The authors acknowledge A. Vontrat-Reberac forhelpful discussions. The CUTLASS HF radars are deployed andoperated by the University of Leicester, and are jointly funded bythe UK Particle Physics and Astronomy Research Council (grantnumber PPA/R/R/1997/00256), the Finnish Meteorological Insti-tute, and the Swedish Institute of Space Physics. The authors ac-knowledge the principal investigator N. Ness and the ACE ScienceCenter for providing the ACE magnetic field data.
Topical Editor T. Pulkkinen thanks two referees for their help inevaluating this paper.
References
Aparicio, B., Thelin, B., and Lundin, R.: The polar cusp from aparticle point of view: a statistical study based on Viking data, J.Geophys. Res., 96, 14 023–14 031, 1991.
Baker, K. B. and Wing, S.: A new magnetic coordinate system forconjugate studies at high latitudes, J. Geophys. Res., 94, 9139–9143, 1989.
Balogh, A., Carr, C. M., Acuna, M. H., Dunlop, M. W., Beek, T.J., Brown, P., Fornacon, K.-H., Georgescu, E., Glassmeier, K.-H., Harris, J., Musmann, G., Oddy, T., and Schwingenschuh,K.: The CLUSTER Magnetic Field Investigation: overview ofin-flight performance and initial results, Ann. Geophysicae, 19,1207–1217, 2001.
Berchem, J. and Russell, C. T.: Flux transfer events on the magne-topause: spatial distribution and controlling factors, J. Geophys.Res., 89, 6689–6703, 1984.
Bosqued, J. M., Phan, T. D., Dandouras, I., Escoubet, C. P.,Reme, H., Balogh, A., Dunlop, M. W., Alcayde, D., Amata, E.,Bavassano-Cattaneo, M.-B., Bruno, R., Carlson, C., DiLellis, A.M., Eliasson, L., Formisano, V., Kistler, L. M., Klecker, B., Ko-rth, A., Kucharek, H., Lundin, R., McCarthy, M., McFadden,J. P., Mobius, E., Parks, G. K., and Sauvaud, J.-A.: CLUSTERobservations of the high-latitude magnetopause and cusp: ini-tial results from the CIS ion instruments, Ann. Geophysicae, 19,1545–1566, 2001.
Burch, J. L.: Quasi-neutrality in the polar cusp, Geophys. Res. Lett.,12, 469–472, 1985.
Cowley, S. W. H., Morelli, J. P., and Lockwood, M.: Dependenceof convective flows and particle precipitation in the high-latitudedayside ionosphere on theX andY components of the interplan-etary magnetic field, J. Geophys. Res., 96, 5557–5564, 1991.
Cowley, S. W. H. and Lockwood, M.: Excitation and decay of so-lar wind-driven flows in the magnetosphere-ionosphere system,Ann. Geophysicae, 10, 103–115, 1992.
Crooker, N. U.: The magnetospheric boundary layers: a geometri-cally explicit model, J. Geophys. Res., 82, 3629–3633, 1977.
Crooker, N. U.: Dayside merging and cusp geometry, J. Geophys.Res., 84, 951–959, 1979.
Crooker, N. U.: Mapping the merging potential from the magne-topause to the ionosphere through the dayside cusp, J. Geophys.Res., 93, 7338–7344, 1988.

A. Marchaudon et al.: Transient plasma injections in the dayside magnetosphere 157
Decreau, P. M. E., Fergeau, P., Krasnoselskikh, V., Le Guirriec,E., Leveque, M., Martin, Ph., Randriamboarison, O., Rauch, J.L., Sene, F. X., Seran, H. C., Trotignon, J. G., Canu, P., Cornil-leau, N., de Feraudy, H., Alleyne, H., Yearby, K., Mogensen,P. B., Gustafsson, G., Andre, M., Gurnett, D. C., Darrouzet, F.,Lemaire, J., Harvey, C. C., Travnicek, P., and Whisper experi-menters: Early results from the Whisper instrument on Cluster:an overview, Ann. Geophysicae, 19, 1241–1258, 2001.
Dunlop, M. W., Balogh, A., and Glassmeier, K.-H.: Four-point Cluster application of magnetic field analysis tools:the discontinuity analyzer, J. Geophys. Res., 107, 1385,doi:10.1029/2001JA005089, 2002.
Eastman, T. E., Hones, Jr., E. W., Bame, S. J., and Asbridge, J. R.:The magnetospheric boundary layer: site of plasma, momentumand energy transfer from the magnetosheath into the magneto-sphere, Geophys. Res. Lett., 3, 685–688, 1976.
Elphic, R. C., Lockwood, M., Cowley, S. W. H., and Sandholt, P. E.:Flux Transfer Events at the magnetopause and in the ionosphere,Geophys. Res. Lett., 17, 2241–2244, 1990.
Etemadi, A., Cowley, S. W. H., Lockwood, M., Bromage, B. J. I.,and Willis, D. M.: The dependence of high-latitude dayside iono-spheric flows on the north-south component of the IMF – A hightime resolution correlation analysis using EISCAT ‘Polar’ andAMPTE UKS and IRM data, Planet. Space. Sci., 36, 471–498,1988.
Farrugia, C. J., Rijnbeek, R. P., Saunders, M. A., Southwood, D. J.,Rodgers, D. J., Smith, M. F., Chaloner, C. P., Hall, D. S., Chris-tiansen, P. J., and Woolliscroft, L. J. C.: A multi-instrument studyof flux transfer event structure, J. Geophys. Res., 93, 14 465–14 477, 1988.
Fuselier, S. A., Lockwood, M., Onsager, T. G., and Peterson, W. K.:The source population for the cusp and cleft/LLBL for southwardIMF, Geophys. Res. Lett., 26, 1665–1668, 1999.
Goertz, C. K., Nielsen, E., Korth, A., Glassmeier, K.-H., Hal-doupis, C., Hoeg, P., and Hayward, D.: Observations of a pos-sible ground signature of flux transfer events, J. Geophys. Res.,90, 4069–4078, 1985.
Greenwald, R. A., Baker, K. B., Dudeney, J. R., Pinnock, M., Jones,T. B., Thomas, E. C., Villain, J.-P., Cerisier, J.-C., Senior, C.,Hanuise, C., Hunsucker, R. D., Sofko, G., Koehler, J., Nielsen,E., Pellinen, R., Walker, A. D. M., Sato, N., and Yamagishi,H.: Darn/SuperDARN: a global view of the dynamics of high-latitude convection, Space Sci. Rev., 71, 761–796, 1995.
Gustafsson, G., Andre, M., Carozzi, T., Eriksson, A. I., Falthammar,C.-G., Grard, R., Holmgren, G., Holtet, J. A., Ivchenko,N., Karlsson, T., Khotyaintsev, Y., Klimov, S., Laakso, H.,Lindqvist, P.-A., Lybekk, B., Marklund, G., Mozer, F., Mur-sula, K., Pedersen, A., Popielawska, B., Savin, S., Stasiewicz, K.,Tanskanen, P., Vaivads, A., and Wahlund, J.-E.: First results ofelectric field and density observations by Cluster EFW based oninitial months of operation, Ann. Geophysicae, 19, 1219–1240,2001.
Haerendel, G., Paschmann, G., Sckopke, N., Rosenbauer, H., andHedgecock, P. C.: The frontside boundary layer of the magne-topause and the problem of reconnection, J. Geophys. Res., 83,3195–3216, 1978.
Johnstone, A. D., Alsop, C., Burge, S., et al.: ‘PEACE: a Plasmaelectron and current experiment’, Space Sci. Rev., 79, 351–398,1997.
Lockwood, M., Cowley, S. W. H., Sandholt, P. E., and Lepping, R.P.: The ionospheric signatures of flux transfer events and solarwind dynamic pressure changes, J. Geophys. Res., 95, 17 113–
17 135, 1990.Lockwood, M. and Smith, M. F.: The variation of reconnection rate
at the dayside magnetopause and cups ion precipitation, J. Geo-phys. Res., 97, 14 841–14 847, 1992.
Lockwood, M., Milan, S. E., Onsager, T., Perry, C. H., Scudder,J. A., Russell, C. T., and Brittnacher, M.: Cusp ion steps, filed-aligned currents and poleward auroral forms, J. Geophys. Res.,106, 29 555–29 569, 2001a.
Lockwood, M., Opgenoorth, H. J., van Eyken, A. P., et al.: Coor-dinated Cluster, ground-based instrumentation and low-altitudesatellite observations of transient poleward-moving events in theionosphere and in the tail lobe, Ann. Geophysicae, 19, 1589–1612, 2001b.
Lockwood, M., Fazerkerley, A., Opgenoorth, H. J., et al.: Coordi-nated Cluster and ground-based instrument observations of tran-sient changes in the magnetopause boundary layer during an in-terval of predominantly northward IMF: relation to reconnectionpulses and FTE signatures, Ann. Geophysicae, 19, 1613–1640,2001c.
Maezawa, K.: Magnetospheric convection induced by the positiveand negativeZ components of the interplanetary magnetic field:quantitative analysis using polar cap magnetic records, J. Geo-phys. Res., 81, 2289–2303, 1976.
McWilliams, K. A., Yeoman, T. K., and Provan, G.: A statisticalsurvey of dayside pulsed ionospheric flows as seen by the CUT-LASS Finland HF radar, Ann. Geophysicae, 18, 445–453, 2000.
McWilliams, K. A., Yeoman, T. K., and Cowley, S. W. H.: Two-dimensional electric field measurements in the ionospheric foot-print of a flux transfer event, Ann. Geophysicae, 18, 1584–1598,2001.
Milan, S. E., Lester, M., Cowley, S. W. H., and Brittnacher, M.:Convection and auroral response to a southward turning of theIMF: Polar UVI, CUTLASS, and IMAGE signatures of transientmagnetic flux transfer at the magnetopause, J. Geophys. Res.,105, 15 741–15 755, 2000.
Neudegg, D. A., Yeoman, T. K., Cowley, S. W. H., Provan, G.,Haerendel, G., Baumjohann, W., Auster, U., Fornacon, K.-H.,Georgescu, E., and Owen, C. J.: A flux transfer event observedat the magnetopause by the Equator-S spacecraft and in the iono-sphere by the CUTLASS HF radar, Ann. Geophysicae, 17, 707–711, 1999.
Neudegg, D. A., Cowley, S. W. H., Milan, S. E., Yeoman, T.K., Lester, M., Provan, G., Haerendel, G., Baumjohann, W.,Nikutowski, B., Buchner, J., Auster, U., Fornacon, K.-H., andGeorgescu, E.: A survey of magnetopause FTEs and associatedflow bursts in the polar ionosphere, Ann. Geophysicae, 18, 416–435, 2000.
Newell, P. T. and, Meng, C.-I.: The cusp and the cleft/boundarylayer: low-altitude identification and statistical local time varia-tion, J. Geophys. Res., 93, 14 549–14 556, 1988.
Newell, P. T., Meng, C.-I., Sibeck, D. G., and, Lepping, R.: Somelow-altitude cusp dependencies on the interplanetary magneticfield, J. Geophys. Res., 94, 8921–8927, 1989.
Opgenoorth, H. J., Lockwood, M., Alcade,D., et al.: Coordinatedground-based, low altitude satellite and Cluster observations onglobal and local scales during a transient post-noon sector excur-sion of the magnetospheric cusp Ann. Geophysicae, 19, 1367–1398, 2001.
Owen, C. J., Fazakerley, A. N., Carter, P. J., Coates, A. J., Krauk-lis, I. C., Szita, S., Taylor, M. G. G. T., Travnicek, P., Watson,G., Wilson, R. J., Balogh, A., and Dunlop, M. W.: CLUS-TER PEACE observations of electrons during magnetosheric

158 A. Marchaudon et al.: Transient plasma injections in the dayside magnetosphere
flux transfer events, , Ann. Geophysicae, 19, 1509–1522, 2001.Palmroth, M., Lakso, H., and Pulkkinen, T.: Location of high-
altitude cusp during steady solar wind conditions, J. Geophys.Res., 110, 21 109–21 122, 2001.
Paschmann, G., Haerendel, G., Sckopke, N., and Rosenbauer, H.:Plasma and magnetic feild characteristics of the distant polarcusp near local noon: the entry layer, J. Geophys. Res., 81, 2883–2899, 1976.
Paschmann, G., Haerendel, G., Papamastorakis, I., Sckopke, N.,Bame, S. J., Gosling, J. T., and Russell, C. T.: Plasma and mag-netic field characteristics of magnetic flux transfer events, J. Geo-phys. Res., 87, 2159–2168, 1982.
Paschmann, G., Quinn, J. M., Torbert, R. B., Vaith, H., McIlwain,C. E., Haerendel, G., Bauer, O. H., Bauer, T., Baumjohann, W.,Fillius, W., Forster, M., Frey, S., Georgescu, E., Kerr, S. S., Klet-zing, C. A., Matsui, H., Puhl-Quinn, P., and Whipple, E. C.: TheElectron Drift Instrument on Cluster: overview of first results,Ann. Geophysicae, 19, 1273–1288, 2001.
Pinnock, M., Rodger, A. S., Dudeney, J. R., Greenwald, R. A.,Baker, K. B., and Ruohoniemi, J. M.: An ionospheric signatureof possible enhanced magnetic field merging on the dayside mag-netopause, J. Atmos. Terr. Phys., 53, 201–212, 1991.
Pinnock, M., Rodger, A. S., Dudeney, J. R., Baker, K. B., Newell, P.T., Greenwald, R. A., and Greenspan, M. E.: Observations of anenhanced convection channel in the cusp ionosphere, J. Geophys.Res., 98, 3767–3776, 1993.
Pinnock, M., Rodger, A. S., Dudeney, J. R., Rich, F., and Baker,K. B.: High spatial and temporal resolution observations of theionospheric cusp, Ann. Geophysicae, 13, 919–925, 1995.
Provan, G., Yeoman, T. K., and Milan, S. E.: CUTLASS Finlandradar observations of the ionospheric signature of flux transferevents and the resulting plasma flow, Ann. Geophysicae, 16,1411–1422, 1998.
Provan, G. and Yeoman, T. K.: Statistical observations of the MLT,latitude and size of pulsed ionospheric flows with the CUTLASSFinland radar, Ann. Geophysicae, 17, 855–867, 1999.
Provan, G., Yeoman, T. K., and Cowley, S. W. H.: The influence ofthe IMFBy component on the location of pulsed flows in the day-side ionosphere observed by an HF radar, Geophys. Res. Lett.,26, 521–524, 1999.
Reiff, P. H. and Burch, J. L.: IMFBy -dependent plasma flow andbirkeland currents in the dayside magnetosphere, 2. A globalmodel for northward and southward IMF, J. Geophys. Res., 90,1595–1609, 1985.
Reiff, P. H., Hill, T. W., and Burch, J. L.: Solar wind injection at thedayside magnetospheric cusp, J. Geophys. Res., 82, 479–491,1977.
Reme H., Aoustin, C., Bosqued, J.-M., et al.: First multispacecraftion measurements in and near the Earth’s magnetosphere withthe identical Cluster ion spectrometry (CIS) experiment, Ann.
Geophysicae, 19, 1303–1354, 2001.Rodger, A. S. and Pinnock, M.: The ionospheric response to flux
transfer events: the first few minutes, Ann. Geophysicae, 15,685–691, 1997.
Rosenbauer, H., Grunwaldt, H., Montgomery, M. D., Paschmann,G., and Sckopke, N.: Heos 2 plasma observations in the distantpolar magnetosphere: the plasma mantle, J. Geophys. Res., 80,2723–2737, 1975.
Ruohoniemi, J. M. and Greenwald, R. A.: Statistical patterns ofhigh-latitude convection obtained from Goose Bay HF radar ob-servations, J. Geophys. Res., 101, 21 746–21 763, 1996.
Ruohoniemi, J. M. and Baker, K. B.: Large-scale imaging of high-latitude convection with Super Dual Auroral Radar Network HFradar observations, J. Geophys. Res., 103, 20 797–20 811, 1998.
Russell, C. T. and Elphic, R. C.: Initial ISEE magnetometer results:magnetopause observations, Space Sci. Rev., 22, 681–715, 1978.
Russell, C. T. and Elphic, R. C.: ISEE observations of flux transferevents at the dayside magnetopause, Geophys. Res. Lett., 6, 33–36, 1979.
Sandholt, P. E., Lockwood, M., Denig, W. F., and Leont’ev, S.: Dy-namical aurora structure in the vicinity of the polar cusp - Mul-tipoint observations during southward and northward IMF, Ann.Geophysicae, 10, 483–497, 1992.
Spreiter J. R. and Stahara, S. S.: A new predictive model for de-termining solar wind-terrestrial planet interactions, J. Geophys.Res., 85, 6769–6777, 1980.
Southwood, D. J.: The ionospheric signature of flux transfer events,J. Geophys. Res., 92, 3207–3213, 1987.
Taguchi, S. and Hoffman, R. A.: Ionospheric convection in the mid-night sector for northward interplanetary magnetic field, J. Geo-mag. Geoelectr., 48, 925–933, 1996.
Thorolfsson A., Cerisier, J.-C., Lockwood, M., Sandholt, P. E., Se-nior, C., and Lester, M.: Simultaneous optical and radar signa-tures of poleward-moving auroral forms, Ann. Geophysicae, 18,1054–1066, 2000.
Tsyganenko, N. A.: Modelling the Earth’s magnetospheric mag-netic field confined within a realistic magnetopause, J. Geophys.Res., 100, 5599–5612, 1995.
Vontrat-Reberac, A., Bosqued, J.-M., Taylor, M. G. G. T., Fontaine,D., Dunlop, M. W., Laakso, H., Cornilleau-Werhlin, N., Canu,P., and Fazakerley, A.: Cluster observations of the high-altitudecusp for northward interplanetary magnetic field: a case study, J.Geophys. Res., in press, 2003.
Wild, J. A., Cowley, S. W. H., Davies, J. A., Khan, H., Milan,S. E., Provan, G., Yeoman, T. K., Balogh, A., Dunlop, M. W.,Fornacon, K.-H., and Georgescu, E.: First simultaneous obser-vations of flux transfer events at the high-latitude magnetopauseby the Cluster spacecraft and pulsed radar signatures in the con-jugate ionosphere by the CUTLASS and EISCAT radars, Ann.Geophysicae, 19, 1491–1508, 2001.