transcriptome profiling reveals mosaic genomic origins of ... · near east to central asia and the...
TRANSCRIPT
Transcriptome profiling reveals mosaic genomic originsof modern cultivated barleyFei Daia, Zhong-Hua Chena,b, Xiaolei Wanga, Zefeng Lia, Gulei Jina, Dezhi Wua, Shengguan Caia, Ning Wangc, Feibo Wua,Eviatar Nevod,1, and Guoping Zhanga,1
aDepartment of Agronomy, Zhejiang Key Laboratory of Crop Germplasm, Zhejiang University, Hangzhou 310058, China; bSchool of Science and Health,University of Western Sydney, Richmond, NSW 2753, Australia; cFaculty of Life and Environmental Sciences, University of Tsukuba, Tsukuba, Ibaraki 305-8577,Japan; and dInstitute of Evolution, University of Haifa, Mount Carmel, Haifa 31905, Israel
Contributed by Eviatar Nevo, July 29, 2014 (sent for review March 2, 2014)
The domestication of cultivated barley has been used as a modelsystem for studying the origins and early spread of agrarianculture. Our previous results indicated that the Tibetan Plateauand its vicinity is one of the centers of domestication of cultivatedbarley. Here we reveal multiple origins of domesticated barleyusing transcriptome profiling of cultivated and wild-barley geno-types. Approximately 48-Gb of clean transcript sequences in 12Hordeum spontaneum and 9 Hordeum vulgare accessions weregenerated. We reported 12,530 de novo assembled transcripts inall of the 21 samples. Population structure analysis showed thatTibetan hulless barley (qingke) might have existed in the earlystage of domestication. Based on the large number of unique ge-nomic regions showing the similarity between cultivated and wild-barley groups, we propose that the genomic origin of moderncultivated barley is derived from wild-barley genotypes in the Fer-tile Crescent (mainly in chromosomes 1H, 2H, and 3H) and Tibet(mainly in chromosomes 4H, 5H, 6H, and 7H). This study indicatesthat the domestication of barley may have occurred over time ingeographically distinct regions.
evolution | genetic diversity | genomic similarity | RNA-Seq |single nucleotide variants
Domestication of crops is the outcome of complex in-dependent or combined processes of artificial and natural
selection that lead to plants adaptive to cultivation and humanconsumption (1, 2). Wild barley (Hordeum spontaneum L.), theprogenitor of cultivated barley (H. vulgare L.), is one of thefounder crops of the Old World for Neolithic food production(3), and it harbors a myriad of mutations favorable for its ad-aptation to harsh environments. Hence, wild barley could pro-vide natural sources of genetic diversity for plant abiotic andbiotic stress tolerance (3, 4). Understanding the domesticationprocess of cultivated barley will therefore be helpful forexploiting elite genetic resources in wild barley and breaking thecurrent bottleneck in modern barley breeding caused by nar-rower genetic diversity (1, 4).The Near East Fertile Crescent is commonly recognized as
a major evolutionary center of wild barley and domestication ofcultivated forms (3–5). Many reports indicate that cultivatedbarley was first domesticated about 10,000 y ago in the Near EastFertile Crescent (3, 5). However, the debate on the mono-phyletic or polyphyletic origin of barley still remains contentious(1, 5–9). Morrell and Clegg, based on the resequencing datafrom 18 loci, proposed that barley has been domesticated at leasttwice, once in the Near East Fertile Crescent and then 1,500–3,000 km farther east (7). Genotyping of chloroplast micro-satellite markers has also suggested that barley has been do-mesticated more than once, on each occasion in a differentgeographical region (10). Unlike wheat and other founder crops,the natural distribution of wild barley scattered widely from theNear East to Central Asia and the Tibetan Plateau (5, 11, 12).There is increasing evidence to support the theory that cultivatedbarley is of polyphyletic origin (7, 9, 13, 14).
Barley is an annual diploid grass species with a large haploidgenome of 5.1-Gb and a high abundance of repetitive elements(15). RNA sequencing (RNA-Seq) is a high-throughput tech-nology for transcriptome profiling using deep-sequencing pro-tocol for rapid characterization of transcript sequences and geneexpression (16). This technique is effective for detecting not onlydifferentially expressed genes, but also sequence variants andnew transcripts (17). Recent advances in the characterizationand quantification of transcriptome with RNA-Seq have beenmade in rice (18), maize (19), and barley (20). In view of thelarge genome of barley and the wide genetic diversity of wildbarley (4, 14, 21), RNA-Seq has become a very effective andpowerful technology in generating comprehensive transcriptomeprofiles (22).Our previous studies have shown significant genetic differ-
ences between wild barley from the Near East and Tibet (14).However, no research has been conducted using comparativetranscriptomics to distinguish between cultivated barley anddifferent wild-barley populations. We hypothesized that the ge-nome segments of cultivated barley should show certain simi-larity with its ancestral wild barley, and using RNA-Seq weshould be able to determine the genomic origin of cultivatedbarley. Specifically, we selected some representative wild-barleygenotypes from the Near East and Tibet, and representativeworld-wide selections of cultivated barley genotypes, conducted
Significance
Archaeological, historic, and molecular studies have indicatedthat the Fertile Crescent in the Near East is a major center oforigin and domestication of cultivated barley. However,growing evidence in recent years supports the theory ofa polyphyletic origin of barley. To our knowledge, this is thefirst attempt using RNA sequencing techniques and genomicsimilarity analysis to study the domestication of barley. Weconfirmed the polyphyletic origin of cultivated barley and ourresults revealed the genomic origin of modern cultivated bar-ley is from both the Near East and Tibet, with different con-tributions on each chromosome. These findings advance ourunderstanding of the early spread of agrarian culture, and areexpected to be of wide interest to evolutionary geneticists andplant breeders.
Author contributions: F.D., E.N., and G.Z. designed research; F.D., X.W., G.J., D.W., S.C.,and F.W. performed research; F.D., Z.-H.C., X.W., Z.L., G.J., D.W., and N.W. analyzed data;and F.D., Z.-H.C., E.N., and G.Z. wrote the paper.
The authors declare no conflict of interest.
Freely available online through the PNAS open access option.
Data deposition: The sequences reported in this paper have been deposited in the Na-tional Center for Biotechnology Information Sequence Read Archive, www.ncbi.nlm.nih.gov (accession nos. SAMN02483491–SAMN02483511).1To whom correspondence may be addressed. Email: [email protected] [email protected].
This article contains supporting information online at www.pnas.org/lookup/suppl/doi:10.1073/pnas.1414335111/-/DCSupplemental.
www.pnas.org/cgi/doi/10.1073/pnas.1414335111 PNAS | September 16, 2014 | vol. 111 | no. 37 | 13403–13408
EVOLU
TION
Dow
nloa
ded
by g
uest
on
Feb
ruar
y 5,
202
0
their transcriptome profiling, and investigated the genomic ori-gin of modern cultivated barley.
ResultsRNA-Seq Performance and Data Analysis. We performed an RNA-Seq analysis on the samples collected at the seedling stage of 12wild (Table S1) and 9 cultivated barley genotypes (Table S2)using the Illumina HiSeq 2000 platform. Overall, paired-endsequencing (100 bp) of transcriptome yielded over 635 millionraw reads (59.16 Gb) for the 21 libraries (Table S3). After re-moving all of the adaptor sequences, empty reads, and low-quality reads, there were around 534 million clean readsremaining (Table S3), with a mean of 2.63 and 1.82 Gb for wildand cultivated barley, respectively. Approximately 81.9–85.5% ofthe clean reads were mapped to the current whole-genomeshotgun (WGS) contigs of cv. Morex (15), yielding 120,837transcripts with a mean length of 2,336 bp (Table S3). In total,61,611 genes were identified for both wild and cultivated barley,in which 16,993 and 9,443 transcripts were unique for wild andcultivated barley, respectively.The remaining reads were aligned to the barley full-length
cDNA (fl-cDNA) (23), resulting in 3,861 transcripts, and 3,276genes in the 21 samples. To discover previously unrecognizedtranscripts, unmapped RNA-Seq reads were de novo assembled,resulting in the assembly of 12,530 de novo transcripts (Fig.S1A). Around 74.0% of the de novo assembled transcripts werefound in all of the samples. However, only 18.6% of thesetranscripts were detected in wild-barley accessions from the NearEast and Tibet (Fig. S1A). These results indicated that wild barleyhas a much larger transcript diversity than cultivated barley.
Discovery of Exon Single Nucleotide Variants and Indels and TheirMapping to the Synthetic Assembly of the Barley Genome. Singlenucleotide variants (SNVs) and indel detection in exons wereperformed using the dataset referring to the current WGS con-tigs of cv. Morex and its assembly. After aligning the reads ineach sample against the WGS contigs of cv. Morex, we identifieda total of 247,611 SNVs and 9,084 indels in 31,084 genes, in-cluding 191,534 SNVs and 6,744 indels in 20,682 genes mapped toseven barley chromosomes (Table S4). A large number of SNVswere detected in wild barley from the Near East, ranging from46,538–58,502, and in wild barley from Tibet, ranging from38,704–52,007 (Table S3). In contrast, there were on average only27,968 SNVs in cultivated barley, indicating the gene pool ofcultivated barley is dramatically smaller than that of wild barley.Moreover, we built a synthetic assembly of the barley genome
based on the WGS contigs assembly of cv. Morex, Baker, andBowman. The 1.7-Gb (1,334,625 contigs) synthetic assembly ofthe barley genome (Dataset S1), which includes approximatelyone-third of the barley genome, has provided a detailed insightinto the physical distribution of genes. By using the five acces-sions (B1K-04-12, Bowman, Barke, Igri, and Haruna Nijo)reported by the International Barley Genome Sequencing Con-sortium (15), we were able to analyze the genomic contributionof different wild-barley populations to the modern cultivars.In total, 111,121 SNVs with no missing data were detected in
all of the 26 samples (Table S4), including 4,099 SNVs showingmultiple variations in a single site. As the missing and multiplevariation sites could make subsequently unreliable inferences inany sample, we only used 107,022 SNVs with no missing data inthe 26 samples to assess the unique SNVs in cultivated barley(Fig. S1B) and in the two main wild-barley populations. Sur-prisingly, there were only 16,977 SNVs detected in all of thecultivated and wild barley in this study (Fig. S1B). The numbersof unique SNVs for wild barley from the Near East and Tibetwere 37,998 and 14,724, respectively. However, the 13 cultivatedbarley genotypes only harbored 12,163 unique SNVs (Fig. S1B).
Furthermore, we created a dataset containing 92,776 SNVswith no missing data, which were anchored to the synthetic as-sembly of the barley genome in all of the 26 genotypes for thepopulation structure analysis and genomic similarity test. All ofthese SNVs were randomly distributed on the seven chromo-somes, with a mean of 13,254 SNVs or 1,678 genes in eachchromosome (Table S4).
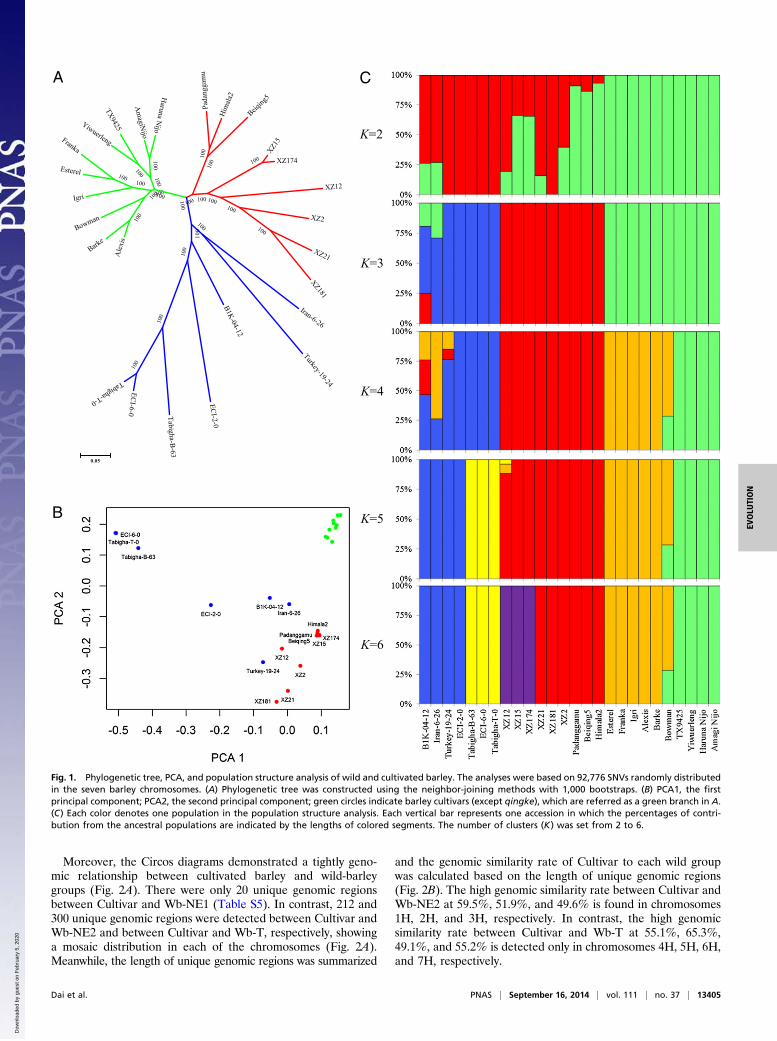
Population Structure and Grouping of Cultivated and Wild Barley.Weconstructed a neighbor-joining tree and conducted a populationstructure analysis and a principle component analysis (PCA)(Fig. 1) based on the dataset of 92,776 SNVs with no missingdata (Table S4). Three major groups could be clearly observedfrom the neighbor-joining tree: the cultivars except Tibetanhulless barley (qingke), the wild barley from the Near East, andthe wild barley and qingke from the Tibetan Plateau (Fig. 1A).According to the first and second eigenvectors of the PCA, all ofthe samples could be divided into cultivars and wild-barleygroups, with the exception of qingke, which demonstrated a veryclose link to the Tibetan wild barley (Fig. 1B). Again, the resultsshowed the cultivars had much less genetic diversity than thewild genotypes.Furthermore, we performed a population structure analysis to
estimate individual ancestry and admixture proportions, assum-ing the existence of certain populations. By analyzing the numberof clusters (K), we found a clear evolutionary divergence be-tween cultivated and wild barley from the Near East and Tibetwith a K = 3 (Fig. 1C). Obviously, qingke was attributed to thepopulation of Tibetan wild barley. When K = 4, the cultivarsfrom East Asia fell right into a new subgroup within the culti-vated barley population (Fig. 1C). With K values at 5 and 6, someIsrael and Tibet wild barley could be separated, respectively.Based on the results of population structure inference, we divided
all of the wild-barley accessions into three groups: the wild barleyfrom Tibet (Wb-T, including XZ2, XZ12, XZ15, XZ21, XZ174,and XZ181), the wild barley from the Near East group 1 (Wb-NE1,including ECI-6-0, Tabigha-T-0, and Tabigha-B-63), and the wildbarley from the Near East group 2 (Wb-NE2, including ECI-2-0,Iran-6-26, Turkey-19-24, and B1K-04-12). All of the cultivatedbarley—except qingke—were classified into one group (Cultivar) tominimize the effect of genetic drift, which may be considered asa representative of modern cultivated barley worldwide.
Genomic Origin of Modern Cultivated Barley. We used the samedataset containing 92,776 SNVs with no missing data to analyzegenomic similarity between modern cultivated barley (Cultivar)and Wb-T, Wb-NE1, and Wb-NE2, respectively. The averageheterozygosity of Cultivar, Wb-NE1, Wb-NE2, and Wb-T was0.135, 0.091, 0.198, and 0.161, respectively. To avoid the occur-rence of multivariants in one site, we combined each group ofbarley accessions as a gene pool according to the methods de-scribed by Rubin et al. (24). We used 300-kb windows and 150-kboverlapping slide windows to detect the potential similarity ofgenomic regions, resulting in the best coverage along the syn-thetic assembly genome of barley between Cultivar and threewild-barley groups. As a result, 600 windows with high similaritywere detected in a total of 21,880 SNVs fell into the selectioncriteria, which account for ∼8.7% of the synthetic assembly of thebarley genome. Among these windows, only 51 similar windowswere detected between Cultivar and Wb-NE1. However, thenumber increased dramatically to 289 and 384 between Cultivarand Wb-NE2, and Wb-T, respectively. Meanwhile, a tight re-lationship between Wb-NE2 and Wb-T was found based ona total of 298 similar windows (Fig. S2). However, the number ofsimilar windows between Wb-NE1 and Wb-NE2 and betweenWb-NE1 and Wb-T is only 101 and 31, respectively. These resultsindicate that the domestication process might have happened ina certain population of wild barley from the Fertile Crescent.
13404 | www.pnas.org/cgi/doi/10.1073/pnas.1414335111 Dai et al.
Dow
nloa
ded
by g
uest
on
Feb
ruar
y 5,
202
0
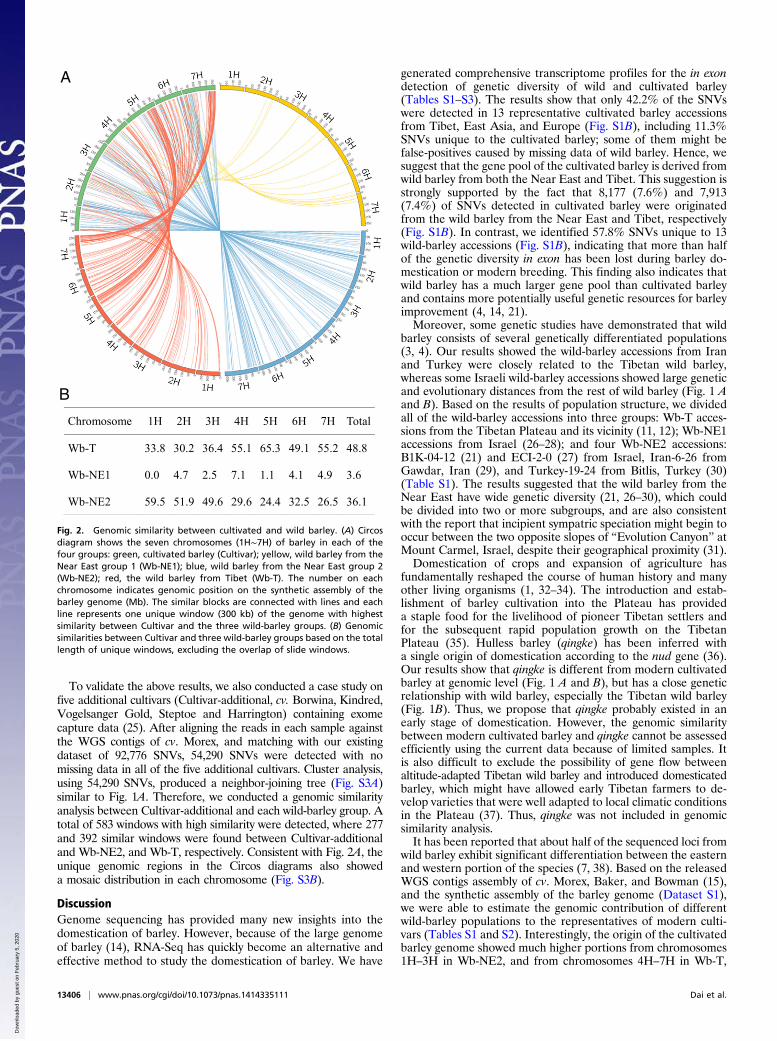
Moreover, the Circos diagrams demonstrated a tightly geno-mic relationship between cultivated barley and wild-barleygroups (Fig. 2A). There were only 20 unique genomic regionsbetween Cultivar and Wb-NE1 (Table S5). In contrast, 212 and300 unique genomic regions were detected between Cultivar andWb-NE2 and between Cultivar and Wb-T, respectively, showinga mosaic distribution in each of the chromosomes (Fig. 2A).Meanwhile, the length of unique genomic regions was summarized
and the genomic similarity rate of Cultivar to each wild groupwas calculated based on the length of unique genomic regions(Fig. 2B). The high genomic similarity rate between Cultivar andWb-NE2 at 59.5%, 51.9%, and 49.6% is found in chromosomes1H, 2H, and 3H, respectively. In contrast, the high genomicsimilarity rate between Cultivar and Wb-T at 55.1%, 65.3%,49.1%, and 55.2% is detected only in chromosomes 4H, 5H, 6H,and 7H, respectively.
Ale
xis
Barke
100
Bowman
100
Igri
Esterel
Franka
100100
100
Yiwuerleng
TX9425
100A
magiN
ijo
Haruna N
ijo100
100
100Pa
dang
gam
u
Him
ala2
100
Beiqing
5
100
XZ15
XZ174100
XZ12
XZ2
XZ21
XZ181
100
100
100100100100
Iran-6-26
Turkey-19-24
100
B1K-04-12
ECI-2-0
Tabigha-B-63
ECI-6-0
Tabigha-T-0
100
100
100
100
0.05
B
K=3
K=4
K=5
K=6
K=2
CA
Fig. 1. Phylogenetic tree, PCA, and population structure analysis of wild and cultivated barley. The analyses were based on 92,776 SNVs randomly distributedin the seven barley chromosomes. (A) Phylogenetic tree was constructed using the neighbor-joining methods with 1,000 bootstraps. (B) PCA1, the firstprincipal component; PCA2, the second principal component; green circles indicate barley cultivars (except qingke), which are referred as a green branch in A.(C) Each color denotes one population in the population structure analysis. Each vertical bar represents one accession in which the percentages of contri-bution from the ancestral populations are indicated by the lengths of colored segments. The number of clusters (K) was set from 2 to 6.
Dai et al. PNAS | September 16, 2014 | vol. 111 | no. 37 | 13405
EVOLU
TION
Dow
nloa
ded
by g
uest
on
Feb
ruar
y 5,
202
0
To validate the above results, we also conducted a case study onfive additional cultivars (Cultivar-additional, cv. Borwina, Kindred,Vogelsanger Gold, Steptoe and Harrington) containing exomecapture data (25). After aligning the reads in each sample againstthe WGS contigs of cv. Morex, and matching with our existingdataset of 92,776 SNVs, 54,290 SNVs were detected with nomissing data in all of the five additional cultivars. Cluster analysis,using 54,290 SNVs, produced a neighbor-joining tree (Fig. S3A)similar to Fig. 1A. Therefore, we conducted a genomic similarityanalysis between Cultivar-additional and each wild-barley group. Atotal of 583 windows with high similarity were detected, where 277and 392 similar windows were found between Cultivar-additionaland Wb-NE2, and Wb-T, respectively. Consistent with Fig. 2A, theunique genomic regions in the Circos diagrams also showeda mosaic distribution in each chromosome (Fig. S3B).
DiscussionGenome sequencing has provided many new insights into thedomestication of barley. However, because of the large genomeof barley (14), RNA-Seq has quickly become an alternative andeffective method to study the domestication of barley. We have
generated comprehensive transcriptome profiles for the in exondetection of genetic diversity of wild and cultivated barley(Tables S1–S3). The results show that only 42.2% of the SNVswere detected in 13 representative cultivated barley accessionsfrom Tibet, East Asia, and Europe (Fig. S1B), including 11.3%SNVs unique to the cultivated barley; some of them might befalse-positives caused by missing data of wild barley. Hence, wesuggest that the gene pool of the cultivated barley is derived fromwild barley from both the Near East and Tibet. This suggestion isstrongly supported by the fact that 8,177 (7.6%) and 7,913(7.4%) of SNVs detected in cultivated barley were originatedfrom the wild barley from the Near East and Tibet, respectively(Fig. S1B). In contrast, we identified 57.8% SNVs unique to 13wild-barley accessions (Fig. S1B), indicating that more than halfof the genetic diversity in exon has been lost during barley do-mestication or modern breeding. This finding also indicates thatwild barley has a much larger gene pool than cultivated barleyand contains more potentially useful genetic resources for barleyimprovement (4, 14, 21).Moreover, some genetic studies have demonstrated that wild
barley consists of several genetically differentiated populations(3, 4). Our results showed the wild-barley accessions from Iranand Turkey were closely related to the Tibetan wild barley,whereas some Israeli wild-barley accessions showed large geneticand evolutionary distances from the rest of wild barley (Fig. 1 Aand B). Based on the results of population structure, we dividedall of the wild-barley accessions into three groups: Wb-T acces-sions from the Tibetan Plateau and its vicinity (11, 12); Wb-NE1accessions from Israel (26–28); and four Wb-NE2 accessions:B1K-04-12 (21) and ECI-2-0 (27) from Israel, Iran-6-26 fromGawdar, Iran (29), and Turkey-19-24 from Bitlis, Turkey (30)(Table S1). The results suggested that the wild barley from theNear East have wide genetic diversity (21, 26–30), which couldbe divided into two or more subgroups, and are also consistentwith the report that incipient sympatric speciation might begin tooccur between the two opposite slopes of “Evolution Canyon” atMount Carmel, Israel, despite their geographical proximity (31).Domestication of crops and expansion of agriculture has
fundamentally reshaped the course of human history and manyother living organisms (1, 32–34). The introduction and estab-lishment of barley cultivation into the Plateau has provideda staple food for the livelihood of pioneer Tibetan settlers andfor the subsequent rapid population growth on the TibetanPlateau (35). Hulless barley (qingke) has been inferred witha single origin of domestication according to the nud gene (36).Our results show that qingke is different from modern cultivatedbarley at genomic level (Fig. 1 A and B), but has a close geneticrelationship with wild barley, especially the Tibetan wild barley(Fig. 1B). Thus, we propose that qingke probably existed in anearly stage of domestication. However, the genomic similaritybetween modern cultivated barley and qingke cannot be assessedefficiently using the current data because of limited samples. Itis also difficult to exclude the possibility of gene flow betweenaltitude-adapted Tibetan wild barley and introduced domesticatedbarley, which might have allowed early Tibetan farmers to de-velop varieties that were well adapted to local climatic conditionsin the Plateau (37). Thus, qingke was not included in genomicsimilarity analysis.It has been reported that about half of the sequenced loci from
wild barley exhibit significant differentiation between the easternand western portion of the species (7, 38). Based on the releasedWGS contigs assembly of cv. Morex, Baker, and Bowman (15),and the synthetic assembly of the barley genome (Dataset S1),we were able to estimate the genomic contribution of differentwild-barley populations to the representatives of modern culti-vars (Tables S1 and S2). Interestingly, the origin of the cultivatedbarley genome showed much higher portions from chromosomes1H–3H in Wb-NE2, and from chromosomes 4H–7H in Wb-T,
Chromosome 1H 2H 3H 4H 5H 6H 7H Total
Wb-T 33.8 30.2 36.4 55.1 65.3 49.1 55.2 48.8
Wb-NE1 0.0 4.7 2.5 7.1 1.1 4.1 4.9 3.6
Wb-NE2 59.5 51.9 49.6 29.6 24.4 32.5 26.5 36.1
B
A
Fig. 2. Genomic similarity between cultivated and wild barley. (A) Circosdiagram shows the seven chromosomes (1H∼7H) of barley in each of thefour groups: green, cultivated barley (Cultivar); yellow, wild barley from theNear East group 1 (Wb-NE1); blue, wild barley from the Near East group 2(Wb-NE2); red, the wild barley from Tibet (Wb-T). The number on eachchromosome indicates genomic position on the synthetic assembly of thebarley genome (Mb). The similar blocks are connected with lines and eachline represents one unique window (300 kb) of the genome with highestsimilarity between Cultivar and the three wild-barley groups. (B) Genomicsimilarities between Cultivar and three wild-barley groups based on the totallength of unique windows, excluding the overlap of slide windows.
13406 | www.pnas.org/cgi/doi/10.1073/pnas.1414335111 Dai et al.
Dow
nloa
ded
by g
uest
on
Feb
ruar
y 5,
202
0
respectively, according to the length of unique windows betweenCultivar and wild-barley groups (Fig. 2). This finding was nota coincidence, as supported by the results obtained in many re-cent studies. Some genes related to spike morphology andflowering time, as the main traits of early domestication, havebeen cloned from chromosome 2H: genes such as Ppd-H1 (39),vrs1 (40), HvAP2 (41, 42), and HvCEN (43). On the other hand,VRN-H3, another early domesticated gene conferring a springgrowth habit (44), has been cloned from chromosome 7H, whichcoincides with the spring-type of Tibetan wild barley (12). Mostimportantly, tough (nonbrittle) rachis, one of the earliest do-mesticated traits, encoded by two closely linked complementarygenes, had been mapped to chromosome 3H, supporting theconcept of polyphyletic domestication of cultivated barley (6, 9).Similarly, our data show that the difference of genomic contri-bution between two wild-barley populations was smaller inchromosome 3H than other chromosomes (Fig. 2).Accordingly, it may be concluded that the genome of modern
cultivated barley originated from two major wild-barley pop-ulations, one from the Near East Fertile Crescent and the otherfrom the Tibetan Plateau, with different contributions on eachchromosome. Our case study on five cultivated barley accessionsalso verified this finding. Because of the unavoidable gene flowbetween early domesticated genotypes and their wild ancestors(45, 46), the domestication process of barley is more complexthan that expected previously. The current data cannot excludethe possibility that the Tibetan wild-barley genome was mergedinto cultivated barley during a second domestication followingthe first domestication that occurred in the Fertile Crescent.Hence, further evidence is required through a comprehensivegenomic investigation of wild and cultivated barley from theNear East Fertile Crescent and Tibetan Plateau.
Materials and MethodsBarley Plants. We used 12 wild (H. spontaneum) (Table S1) and 9 cultivatedbarley plants (Table S2) to conduct an RNA-seq analysis. Six wild-barleyaccessions from the Near East were collected and previously characterized byNevo et al. (26–28). Six wild-barley genotypes were from the collection ofXu, since the 1960s, from the extensive area of the Tibetan Plateau (11, 12),and evaluated by Dai et al. (14, 47) and Qiu et al. (48). Among the cultivatedbarley genotypes used in this study, Padanggamu, Beiqing5, and Himala2were hulless, also called qingke, and cultivated on the Tibetan Plateau andits vicinity. Three cultivars from East Asia and three cultivars from Europewere reported in our previous work (14). Moreover, for comparative studies,one wild barley (B1K-04-12) and four cultivated barley (Bowman, Barke, Igri,and Haruna Nijo) with WGS sequence were selected as references, which
have been investigated by the International Barley Genome SequencingConsortium (15) (Tables S1 and S2).
Phylogenetic, Population Structure, and PCA Analysis. A dataset of 92,776 SNVswith no missing data anchored to the synthetic assembly of the barley ge-nome was used to conduct phylogenetic analysis, population structureanalysis, and PCA. The phylogenetic tree of the 26 accessions was constructedusing MEGA 5.1 program (49) with neighbor-joining methods (1,000 boot-straps). FRAPPE (50) was used to investigate the population structure basedon a maximum-likelihood method, with 10,000 iterations, and the numberof clusters (K) was set from 2 to 6. Moreover, we performed a PCA analysisusing EIGENSOFT (51).
Genomic Similarity Analysis. The same dataset was used for genomic similarityanalysis as an addition to the phylogenetic analysis. Each type of SNV witha known site referring to the synthetic assembly of the barley genome wascounted for four groups: Cultivar, Wb-T, Wb-NE1, and Wb-NE2. Therefore,barley gene pools for the four groups were constructed according to Rubinet al. (24). Briefly, for all sites with two or more variants, the minority var-iants were treated as errors rather than using the reference base. If thevariants in a certain site had the same frequency, they were selected ran-domly. Finally, we constructed four (Cultivar, Wb-T, Wb-NE1, and Wb-NE2)barley gene pools, where all of the SNVs were linearly distributed on theseven chromosomes of the synthetic assembly of the barley genome.Moreover, average heterozygosity for the four barley groups was estimatedaccording to Nei (52).
To maximize the genomic coverage and maintain the high accuracy, weused 300-kb windows and 150-kb overlapping slide windows along thesynthetic assembly of the barley genome to study the genomic similarity.Largewindows usually have poor coverage and small windows do not containenough SNVs, leading to inaccuracy in the similarity analysis. The numbers ofSNVs were counted for each window, and the windows were removed withthe number of SNVs ≤ 20. We selected the windows with no missing data inall of the three pairs between Cultivar and Wb-T, Wb-NE1, or Wb-NE2 alongthe synthetic assembly of the barley genome for further analysis. Thenumber of identical SNVs in each window was counted in all of the threepairs. Then, the similarity of each window was calculated in all of the threepairs, which was the number of identical SNVs divided by the total numberof SNVs in each window. The windows were kept with similarity ≥95%. Fi-nally, unique windows with the highest similarity among three pairs wereselected for the visualization of synthetic relationships using Circos (53).
Additional experimental details on sample and cDNA library preparation,deep sequencing, read mapping and de novo assembly, and SNVs or indelcalling can be found in SI Materials and Methods.
ACKNOWLEDGMENTS. We thank Hangzhou Guhe Information and Technol-ogy Co., Ltd, for help in sequencing and bioinformatics analysis, Profs. A. Beilesand A. Beattie for critical reading of the manuscript, and Prof. D. F. Sun forproviding seeds of Tibetan wild barley. This study was supported by theNatural Science Foundation of China (31330055, 31201166, 31301246, and31171544).
1. Brown TA, Jones MK, Powell W, Allaby RG (2009) The complex origins of domesti-cated crops in the Fertile Crescent. Trends Ecol Evol 24(2):103–109.
2. Allaby RG, Fuller DQ, Brown TA (2008) The genetic expectations of a protractedmodel for the origins of domesticated crops. Proc Natl Acad Sci USA 105(37):13982–13986.
3. Zohary D, Hopf M, Weiss E (2012) Domestication of Plants in the Old World: TheOrigin and Spread of Domesticated Plants in Southwest Asia, Europe, and the Med-iterranean Basin (Oxford Univ Press, Oxford).
4. Nevo E (2006) Genome evolution of wild cereal diversity and prospects for crop im-provement. Plant Genet Resour 4(1):36–46.
5. Harlan JR, Zohary D (1966) Distribution of wild wheats and barley. Science 153(3740):1074–1080.
6. Zohary D (1999) Monophyletic vs. polyphyletic origin of the crops on which agricul-ture was founded in the Near East. Genet Resour Crop Evol 46(2):133–142.
7. Morrell PL, Clegg MT (2007) Genetic evidence for a second domestication of barley(Hordeum vulgare) east of the Fertile Crescent. Proc Natl Acad Sci USA 104(9):3289–3294.
8. Nevo E, Korol AB, Beiles A, Fahima T (2002) Evolution of Wild Emmer and WheatImprovement. Population Genetics, Genetic Resources, and Genome Organization ofWheat’s Progenitor, Triticum dicoccoides (Springer, Berlin).
9. Azhaguvel P, Komatsuda T (2007) A phylogenetic analysis based on nucleotide se-quence of a marker linked to the brittle rachis locus indicates a diphyletic origin ofbarley. Ann Bot (Lond) 100(5):1009–1015.
10. Molina-Cano JL, et al. (2005) Chloroplast DNA microsatellite analysis supportsa polyphyletic origin for barley. Theor Appl Genet 110(4):613–619.
11. Xu TW (1975) On the origin and phylogeny of cultivated barley with preference tothe discovery of Ganze wild two-rowed barley Hordeum spontaneum c. Koch. ActaGenet Sin 2(2):129–137.
12. Xu TW (1982) Origin and evolution of cultivated barley in China. Acta Genet Sin 9:440–446.13. von Bothmer R, Komatsuda T (2011) in Barley: Production, Improvement, and Uses, ed
Ullrich SE (Wiley-Blackwell, Chichester, UK), pp 14–62.14. Dai F, et al. (2012) Tibet is one of the centers of domestication of cultivated barley.
Proc Natl Acad Sci USA 109(42):16969–16973.15. Mayer KF, et al.; International Barley Genome Sequencing Consortium (2012) A
physical, genetic and functional sequence assembly of the barley genome. Nature491(7426):711–716.
16. Wang Z, Gerstein M, Snyder M (2009) RNA-Seq: A revolutionary tool for tran-scriptomics. Nat Rev Genet 10(1):57–63.
17. Marioni JC, Mason CE, Mane SM, Stephens M, Gilad Y (2008) RNA-seq: An assessmentof technical reproducibility and comparison with gene expression arrays. Genome Res18(9):1509–1517.
18. Mizuno H, et al. (2010) Massive parallel sequencing of mRNA in identification ofunannotated salinity stress-inducible transcripts in rice (Oryza sativa L.). BMC Ge-nomics 11:683–695.
19. Swanson-Wagner R, et al. (2012) Reshaping of the maize transcriptome by domesti-cation. Proc Natl Acad Sci USA 109(29):11878–11883.
20. Kohl S, et al. (2012) A putative role for amino acid permeases in sink-source com-munication of barley tissues uncovered by RNA-seq. BMC Plant Biol 12:154.
21. Hübner S, et al. (2009) Strong correlation of wild barley (Hordeum spontaneum) pop-ulation structure with temperature and precipitation variation. Mol Ecol 18(7):1523–1536.
Dai et al. PNAS | September 16, 2014 | vol. 111 | no. 37 | 13407
EVOLU
TION
Dow
nloa
ded
by g
uest
on
Feb
ruar
y 5,
202
0
22. Martin JA, Wang Z (2011) Next-generation transcriptome assembly. Nat Rev Genet12(10):671–682.
23. Matsumoto T, et al. (2011) Comprehensive sequence analysis of 24,783 barley full-length cDNAs derived from 12 clone libraries. Plant Physiol 156(1):20–28.
24. Rubin CJ, et al. (2010) Whole-genome resequencing reveals loci under selectionduring chicken domestication. Nature 464(7288):587–591.
25. Mascher M, et al. (2013) Barley whole exome capture: A tool for genomic research inthe genus Hordeum and beyond. Plant J 76(3):494–505.
26. Nevo E, Zohary D, Brown AHD, Haber M (1979) Genetic diversity and environmentalassociations of wild barley, Hordeum spontaneum, in Israel. Evolution 33(3):815–833.
27. Nevo E, Apelbaum-Elkaher I, Garty J, Beiles A (1997) Natural selection causes micro-scale allozyme diversity in wild barley and a lichen at “Evolution Canyon”Mt. Carmel,Israel. Heredity 78(4):373–382.
28. Nevo E, Brown AHD, Zohary D, Storch N, Beiles A (1981) Microgeographic edaphicdifferentiation in allozyme polymorphisms of wild barley (Hordeum spontaneum,Poaceae). Plant Syst Evol 138(3-4):287–292.
29. Nevo E, Beiles A, Kaplan D, Storch N, Zohary D (1986a) Genetic diversity and envi-ronmental associations of wild barley, Hordeum spontaneum (Poaceae), in Iran. PlantSyst Evol 153(3-4):141–164.
30. Nevo E, Zohary D, Beiles A, Kaplan D, Storch N (1986b) Genetic diversity and envi-ronmental associations of wild barley, Hordeum spontaneum, in Turkey. Genetica68(3):203–213.
31. Parnas T (2006) Evidence for incipient sympatric speciation in wild barley, Hordeumspontaneum, at “Evolution Canyon”, Mount Carmel, Israel, based on hybridizationand physiological and genetic diversity estimates. Master Thesis, (Univ of Haifa, Haifa,Israel).
32. Purugganan MD, Fuller DQ (2009) The nature of selection during plant domestica-tion. Nature 457(7231):843–848.
33. Riehl S, Zeidi M, Conard NJ (2013) Emergence of agriculture in the foothills of theZagros Mountains of Iran. Science 341(6141):65–67.
34. Skoglund P, et al. (2012) Origins and genetic legacy of Neolithic farmers and hunter-gatherers in Europe. Science 336(6080):466–469.
35. Qi X, et al. (2013) Genetic evidence of paleolithic colonization and neolithic expansionof modern humans on the Tibetan plateau. Mol Biol Evol 30(8):1761–1778.
36. Taketa S, et al. (2008) Barley grain with adhering hulls is controlled by an ERF familytranscription factor gene regulating a lipid biosynthesis pathway. Proc Natl Acad SciUSA 105(10):4062–4067.
37. Guedes J, et al. (2014) Moving agriculture onto the Tibetan Plateau: The archae-obotanical evidence. Archaeol Anthropol Sci, 10.1007/s12520-013-0153-4.
38. Morrell PL, Lundy KE, Clegg MT (2003) Distinct geographic patterns of genetic di-versity are maintained in wild barley (Hordeum vulgare ssp. spontaneum) despitemigration. Proc Natl Acad Sci USA 100(19):10812–10817.
39. Turner A, Beales J, Faure S, Dunford RP, Laurie DA (2005) The pseudo-response reg-ulator Ppd-H1 provides adaptation to photoperiod in barley. Science 310(5750):1031–1034.
40. Komatsuda T, et al. (2007) Six-rowed barley originated from a mutation in a home-odomain-leucine zipper I-class homeobox gene. Proc Natl Acad Sci USA 104(4):1424–1429.
41. Houston K, et al. (2013) Variation in the interaction between alleles of HvAPETALA2and microRNA172 determines the density of grains on the barley inflorescence. ProcNatl Acad Sci USA 110(41):16675–16680.
42. Nair SK, et al. (2010) Cleistogamous flowering in barley arises from the suppression ofmicroRNA-guided HvAP2 mRNA cleavage. Proc Natl Acad Sci USA 107(1):490–495.
43. Comadran J, et al. (2012) Natural variation in a homolog of Antirrhinum CENTROR-ADIALIS contributed to spring growth habit and environmental adaptation in culti-vated barley. Nat Genet 44(12):1388–1392.
44. Yan L, et al. (2006) The wheat and barley vernalization gene VRN3 is an orthologue ofFT. Proc Natl Acad Sci USA 103(51):19581–19586.
45. Ellstrand NC, Prentice HC, Hancock JF (1999) Gene flow and introgression from do-mesticated plants into their wild relatives. Annu Rev Ecol Syst 30:539–563.
46. Hübner S, et al. (2012) Islands and streams: clusters and gene flow in wild barleypopulations from the Levant. Mol Ecol 21(5):1115–1129.
47. Dai F, et al. (2010) Differences in phytase activity and phytic acid content betweencultivated and Tibetan annual wild barleys. J Agric Food Chem 58(22):11821–11824.
48. Qiu L, et al. (2011) Evaluation of salinity tolerance and analysis of allelic function ofHvHKT1 and HvHKT2 in Tibetan wild barley. Theor Appl Genet 122(4):695–703.
49. Tamura K, et al. (2011) MEGA5: Molecular evolutionary genetics analysis usingmaximum likelihood, evolutionary distance, and maximum parsimony methods. MolBiol Evol 28(10):2731–2739.
50. Tang H, Peng J, Wang P, Risch NJ (2005) Estimation of individual admixture: Analyticaland study design considerations. Genet Epidemiol 28(4):289–301.
51. Price AL, et al. (2006) Principal components analysis corrects for stratification ingenome-wide association studies. Nat Genet 38(8):904–909.
52. Nei M (1978) Estimation of average heterozygosity and genetic distance from a smallnumber of individuals. Genetics 89(3):583–590.
53. Krzywinski M, et al. (2009) Circos: An information aesthetic for comparativegenomics. Genome Res 19(9):1639–1645.
13408 | www.pnas.org/cgi/doi/10.1073/pnas.1414335111 Dai et al.
Dow
nloa
ded
by g
uest
on
Feb
ruar
y 5,
202
0