transcanada 2016 corporate social responsibility...
TRANSCRIPT

TRANSCANADA MAP
TABLE OF CONTENTS
CEO’S MESSAGE
WHO WE ARE
ABOUT THIS REPORT
WHAT CSR MEANS TO US
A HEALTHY AND SAFE ENVIRONMENT AND COMMUNITY
AN ENGAGED COMMUNITY
A THRIVING ECONOMY
CAUTIONARY NOTE
APPENDIX
GLOBAL REPORTING INITIATIVE G4 INDEX
GLOSSARY
Delivering Energy Responsibly
Corporate Social Responsibility Report 2016
Brad Stermer tends to seedlings planted near the Woolfolk Compressor Station in Michigan as part of our Pollinator Pathway project. More than one-third of the food we eat requires pollinators to grow. (learn more inside)

TRANSCANADA CSR REPORT 2016
PAGE 2
TRANSCANADA MAP
TransCanada map
Nuclear Power Generation
June 2017
Natural Gas Power Generation
Wind Power Generation
Solar Power Generation
Liquids Tank Terminal
Office Location
Natural Gas Storage
Liquids Pipeline
In Development/Construction
Natural Gas Pipeline
In Development/Construction
KEY
CANADA
UNITED STATES
MEXICO
CALGARY
TORONTO
CHARLESTON
MEXICO CITY
HOUSTON
500 km200 mi
TRANSCANADA MAP
TABLE OF CONTENTS
CEO’S MESSAGE
WHO WE ARE
ABOUT THIS REPORT
WHAT CSR MEANS TO US
A HEALTHY AND SAFE ENVIRONMENT AND COMMUNITY
AN ENGAGED COMMUNITY
A THRIVING ECONOMY
CAUTIONARY NOTE
APPENDIX
GLOBAL REPORTING INITIATIVE G4 INDEX
GLOSSARY

TRANSCANADA CSR REPORT 2016
PAGE 3
TABLE OF CONTENTS
TRANSCANADA MAP
TABLE OF CONTENTS
CEO’S MESSAGE
WHO WE ARE
ABOUT THIS REPORT
WHAT CSR MEANS TO US
A HEALTHY AND SAFE ENVIRONMENT AND COMMUNITY
AN ENGAGED COMMUNITY
A THRIVING ECONOMY
CAUTIONARY NOTE
APPENDIX
GLOBAL REPORTING INITIATIVE G4 INDEX
GLOSSARY
Table of contents
TRANSCANADA MAP 2
CEO’S MESSAGE 4
WHO WE ARE 6
Our business at a glance 7
Our people 9
ABOUT THIS REPORT 10
Our priorities 11
Our approach to disclosure 14
Report profile 14
WHAT CSR MEANS TO US 15
Our commitment 16
Our approach 16
Our impact 21
A HEALTHY AND SAFE ENVIRONMENT AND COMMUNITY 23
Integrity of pipelines and facilities 24
Emergency preparedness and response 30
Health and safety of communities, employees and contractors 32
Climate change and greenhouse gas emissions 34
AN ENGAGED COMMUNITY 41
Stakeholder and Indigenous engagement 42
Community investment, employee giving and volunteering 46
Employee attraction, retention and development 49
A THRIVING ECONOMY 51
Financial performance 52
Economic benefits of development 55
Access to markets 57
CAUTIONARY NOTE 59
APPENDIX 61
GLOBAL REPORTING INITIATIVE G4 INDEX 64
GLOSSARY 69
FORWARD-LOOKING STATEMENTSThis CSR report contains forward-looking statements and non-GAAP financial measures and includes information for the 2016 calendar year as well as relevant information up to July 31, 2017. Please see the “Cautionary note” for the statement regarding forward-looking information.
Our report also has links to websites owned and operated by third parties. When clicking on those links, users will leave our website. These links are provided for additional information and convenience only. TransCanada is not responsible for these websites or their content.
ON THE COVER
TransCanada has partnered with the Save Our Monarchs Foundation to develop a Pollinator Pathway along the migratory route of the monarch butterfly. This large-scale effort will directly benefit the long-term health of pollinators across North America through conservation and the restoration of habitat on TransCanada property. Click here for the full story.

TRANSCANADA CSR REPORT 2016
PAGE 4
CEO’S MESSAGE
CEO’s message
Russ Girling, President and Chief Executive Officer
Welcome to TransCanada’s 2016 Corporate Social Responsibility (CSR) report. It has been a time of exceptional growth and transformation for our company and I am pleased to provide an update on the successes and challenges of the last year as we continue to safely and responsibly deliver the energy millions of people rely on every day.
Our company has experienced significant change over the last year as we welcomed colleagues from the acquisition of Columbia Pipeline Group (CPG), won a number of pipeline projects in Mexico, continued significant expansion of our natural gas pipeline networks in Canada and the U.S., and divested our power generation assets in the U.S. Northeast. The strong performance of our assets, combined with our expanded footprint in the United States, resulted in a banner year for financial results.
We are proud of this success but we know it’s not just what we do that’s important, it’s how we do it. We know that long-term success depends on our ability to balance safety, profitability, and social and environmental responsibility.
TRANSCANADA MAP
TABLE OF CONTENTS
CEO’S MESSAGE
WHO WE ARE
ABOUT THIS REPORT
WHAT CSR MEANS TO US
A HEALTHY AND SAFE ENVIRONMENT AND COMMUNITY
AN ENGAGED COMMUNITY
A THRIVING ECONOMY
CAUTIONARY NOTE
APPENDIX
GLOBAL REPORTING INITIATIVE G4 INDEX
GLOSSARY
Part of our commitment to operating in a sustainable manner is listening to those who are involved with or affected by our business and communicating honestly about our performance on the issues that matter most to our key stakeholders. This edition of our CSR report represents a shift in approach to our disclosure on key environmental, social and governance matters to better reflect the topics that are most important to our company and the diverse stakeholders and communities we work and engage with.
Following our acquisition of CPG in the second half of 2016, we reached out to our key stakeholder and rights-holder groups—Indigenous groups, landowners, employees, customers, environmental organizations, investors and political leaders—to ask them about what they feel are the most important issues when it comes to dealing with our company and to find out how we can do a better job of keeping them informed. This report reflects the important input we received. It is shorter than in past years and focuses on providing more concise information about the topics that are most relevant to our work:
• Ensuring our pipelines and other facilities operate safely every day;
• Minimizing our environmental footprint and addressing climate change and our own emissions of greenhouse gases; and
• Listening to our neighbours and working with them to develop better project plans and create long-term opportunities and economic benefits in their communities.
I am pleased that this is also our first CSR report to follow the Global Reporting Initiative’s (GRI) G4 Core requirements, the most widely used comprehensive sustainability reporting standard in the world. Applying this standard will enhance our transparency and allow us to produce a report that truly matters.
With more than 65 years of experience, our performance is at the forefront of the energy infrastructure industry, and we continue to be recognized for our achievements. For the 16th year in a row, we were named to the Dow Jones Sustainability Index (DJSI) World Index, and we earned a place on DJSI’s North American Sustainability Index for the fourth year in a row. For the seventh consecutive year, we are also listed among Canada’s Best 50 Corporate Citizens by Corporate Knights magazine and were acknowledged as the top company in our industry when it comes to gender diversity on our executive leadership team.
TRANSCANADA CSR REPORT 2016
PAGE 5
CEO’S MESSAGE
CEO’s message (continued)
There is always room for improvement, however, and we continue to strive to meet the high standards we set for ourselves by collaborating with our peers, investing in research and innovation, and learning from our mistakes. We have occupational and facility safety records that are among the best in the industry, but we believe that no safety-related incidents are acceptable. Two notable incidents did occur in 2016: the tragic death of a contractor at a construction site and the discovery of a small but persistent leak on the Keystone oil pipeline. These incidents reinforced that we need to be constantly vigilant and prompted us to enhance our already significant efforts to achieve top-quartile safety performance. At the end of 2016, we enhanced our commitment to our goal of zero incidents by adopting safety as the first of our four corporate values and launched new programs to ensure safety is always top of mind for our employees and contractors.
Looking forward, the world’s demand for reliable and affordable energy will continue to grow. And while renewables are the fastest growing form of new power generation, respected authorities such as the International Energy Agency forecast that natural gas and oil will continue to be dominant energy sources for decades to come. This outlook is reflected in the make-up of our current business and our growth plans as we continue to play a leading role in developing a balanced and sustainable energy future for North America.
With assets that traverse thousands of kilometres and are in place for generations, we do more than just transport the energy products that we all use every day. The communities where we operate pipelines and power generation facilities are also home to our more than 7,100 employees across Canada, the United States and Mexico—we are committed to making those communities great places to live and work.
Nothing is more satisfying than when I hear we have helped make a difference, whether it’s through creating jobs, supporting students or partnering with other organizations to protect sensitive landscapes for future generations. To that end, our community investment program invested a record $16.6 million in more than 1,200 non-profit organizations last year and it was very satisfying to see TransCanada and Columbia employees come together
and volunteer more than 11,000 hours to community initiatives they care about through our employee giving and volunteering program. We also launched an innovative new scholarships program that will help 300 post-secondary students in each of our operating countries pursue their career goals and develop leadership skills.
These are the things that make me proud to work for TransCanada. It tells me we have heart and that the communities where we operate truly benefit from our presence.
Thank you for taking the time to learn more about our company. We are proud of the positive relationships we have across North America, and we are committed to listening to what matters to you. I encourage you to ask us questions, tell us how we’re doing and let us know what we can do to improve.
Sincerely,
Russ Girling President and Chief Executive Officer
TRANSCANADA MAP
TABLE OF CONTENTS
CEO’S MESSAGE
WHO WE ARE
ABOUT THIS REPORT
WHAT CSR MEANS TO US
A HEALTHY AND SAFE ENVIRONMENT AND COMMUNITY
AN ENGAGED COMMUNITY
A THRIVING ECONOMY
CAUTIONARY NOTE
APPENDIX
GLOBAL REPORTING INITIATIVE G4 INDEX
GLOSSARY

TRANSCANADA CSR REPORT 2016
PAGE 6
WHO WE ARE
Who we are
TRANSCANADA MAP
TABLE OF CONTENTS
CEO’S MESSAGE
WHO WE ARE
Our business at a glance
Our people
ABOUT THIS REPORT
WHAT CSR MEANS TO US
A HEALTHY AND SAFE ENVIRONMENT AND COMMUNITY
AN ENGAGED COMMUNITY
A THRIVING ECONOMY
CAUTIONARY NOTE
APPENDIX
GLOBAL REPORTING INITIATIVE G4 INDEX
GLOSSARY
Southern Alberta

TRANSCANADA CSR REPORT 2016
PAGE 7
WHO WE ARE > OUR BUSINESS AT A GLANCE
Our business at a glanceFor more than 65 years, TransCanada Corporation (TransCanada) has proudly delivered the energy that millions of North Americans rely on to power their lives and industries. Headquartered in Calgary, Alta., TransCanada is a leader in the responsible development and reliable operation of North American energy infrastructure, including natural gas and liquids pipelines, power generation and gas storage facilities.
Our facilities operate safely, reliably and with minimal impact on the environment, while our more than 7,100 employees play an active part in the communities where they live in Canada, the U.S. and Mexico.
THREE COMPLEMENTARY ENERGY INFRASTRUCTURE BUSINESSES
Natural gas pipelinesOur 91,500-kilometre (56,900-mile) network of natural gas pipelines supplies more than 25 per cent of the clean-burning natural gas consumed daily across North America. This pipeline network strategically connects growing supply to key markets across our three operating geographies of Canada, the U.S. and Mexico. We are also the continent’s largest provider of natural gas storage, with 653 billion cubic feet of regulated and unregulated storage capacity.
Liquids pipelinesOur 4,300-kilometre (2,700-mile) Keystone Pipeline System transports 545,000 barrels of crude oil per day, or approximately 20 per cent of western Canadian exports to key refinery markets in the U.S. Midwest and Gulf Coast where it is converted into fuel and other useful petroleum products. Keystone has safely delivered more than 1.5 billion barrels since it began operation in June 2010.
Energy TransCanada owns or has interests in 12 power generation facilities with capacity of approximately 6,200 megawatts (MW)—enough to power more than 6 million homes. More than half of the power we provide is generated from emission-less sources, including nuclear, wind and solar, and we are leaders in the development and operation of high efficiency natural gas-fired power facilities.
Power generation mix
• 51% Nuclear
• 42% Natural Gas
• 6% Wind • 1% Solar
6,200MW
The information listed above on TransCanada’s three businesses is current as of July 31, 2017.
For further details about our business, including additional details on the scope, size and strategy of our operations, please refer to our 2016 Annual Report and our Business at Glance. TransCanada is traded on the TSX and NYSE.
OUR MISSION To provide reliable supplies of energy across the continent—safely and responsibly. We are proud that millions of North Americans can depend on us for the energy they need.
OUR VISION To be the leading energy infrastructure company in North America, focusing on pipeline and power generation opportunities where we have, or can develop, a significant competitive advantage.
OUR VALUES Values guide how we work, treat one another and interact with our stakeholders every single day. Our values are Safety, Integrity, Responsibility and Collaboration.
Please visit our website and our Code of Business Ethics for more information about our commitment to the highest standards of ethics and corporate governance.
TRANSCANADA MAP
TABLE OF CONTENTS
CEO’S MESSAGE
WHO WE ARE
Our business at a glance
Our people
ABOUT THIS REPORT
WHAT CSR MEANS TO US
A HEALTHY AND SAFE ENVIRONMENT AND COMMUNITY
AN ENGAGED COMMUNITY
A THRIVING ECONOMY
CAUTIONARY NOTE
APPENDIX
GLOBAL REPORTING INITIATIVE G4 INDEX
GLOSSARY

TRANSCANADA CSR REPORT 2016
PAGE 8
WHO WE ARE > OUR BUSINESS AT A GLANCE
Our business at a glance (continued)
CHANGES TO OUR ASSET PORTFOLIO AND OPERATIONS IN 2016
Acquisitions and divestituresIn 2016, TransCanada solidified its position as one of the largest natural gas transmission companies and a strategically important player across North America with the US$13 billion acquisition of Columbia Pipeline Group (CPG).
The CPG acquisition represented a rare opportunity to invest in a growing network of regulated natural gas pipeline and storage assets in one of the world’s fastest growing and lowest cost natural gas production basins—the Appalachian Basin in the U.S. Northeast. Combined with our existing North American footprint, we now own and operate one of North America’s largest natural gas transmission businesses with strong competitive positions in the continent’s fastest growing supply and market regions.
Other key developments during the year to prudently finance our growth and deliver long-term shareholder value included the following:
• We announced the decision to permanently divest our power generation assets in the U.S. Northeast. In April 2017 we completed the sale of our New England hydroelectric generation assets for US$1.065 billion and in June 2017 we completed the sale of the remaining assets for approximately US$2.1 billion. Proceeds were used to partially finance the CPG acquisition.
• Over the past year we added $13 billion of new projects to our near-term, commercially secured growth portfolio, including two additional natural gas pipeline projects in Mexico that will see us invest an additional US$1.9 billion in that country, as well as ongoing expansions of our NOVA Gas Transmission Ltd. (NGTL) system.
For details about the scope and boundaries of this report, please refer to the About this report section.
Key operational changesThis year, we completed the integration of our various management systems into a single management system—TransCanada’s Operational Management System (TOMS). This included the integration of the Capital Projects Management Systems (CPMS); the Health, Safety and Environment (HSE) Management System; the Commercial Services and Design (CSD) Management System; and the Asset Management System (AMS) into one overarching framework across TransCanada’s three business units. Moving to a single management system is part of our ongoing efforts to reduce complexity and strive for efficiency, ultimately making it easier and more intuitive for employees to ensure compliance, reduce operational risk and carry out day-to-day activities.
Throughout 2016 we worked to successfully integrate CPG into the TransCanada organization. For CPG, the integration of TOMS will occur throughout 2017 and will include alignment of CPG’s existing practices and procedures with those in TOMS. In addition, CPG employees will participate in specific training sessions to ensure that the integrated practices are sustained. This alignment and harmonization of practices will ensure that we continue to manage our operations in a safe, compliant and reliable manner. Along with efforts to integrate facilities, assets, systems and processes, we continue to work together to build a team that is best in class in our industry and shares a commitment to safety, good stewardship of the environment and building a better future.
For further details about TOMS, please refer to the What CSR means to us section.
TRANSCANADA MAP
TABLE OF CONTENTS
CEO’S MESSAGE
WHO WE ARE
Our business at a glance
Our people
ABOUT THIS REPORT
WHAT CSR MEANS TO US
A HEALTHY AND SAFE ENVIRONMENT AND COMMUNITY
AN ENGAGED COMMUNITY
A THRIVING ECONOMY
CAUTIONARY NOTE
APPENDIX
GLOBAL REPORTING INITIATIVE G4 INDEX
GLOSSARY

TRANSCANADA CSR REPORT 2016
PAGE 9
WHO WE ARE > OUR PEOPLE
Our peopleOur overall success is due to the diversity of the more than 7,100 employees and 3,500 contract professionals who work on our behalf. From the corporate head office to our field operations, we actively seek out a wide range of candidates for all positions. A diversity of backgrounds, culture, opinions, expertise and skills drives innovation and strengthens our teams.
Our commitment to developing a representative workforce is demonstrated with women, Indigenous groups, persons with disabilities, visible minorities and veterans being represented throughout the organization.
Employee breakdown 2012 2013 2014 2015 2016
Full-time employees (#) 4,823 5,437 6,059 5,512 7,147
Canada 2,994 3,487 4,010 3,603 3,374
U.S. 1,771 1,859 1,914 1,757 3,563
Mexico 58 91 135 152 210
Contract professionals (#) 2,525 2,796 2,442 3,586
Employees represented by independent trade unions or covered by collective bargaining agreements (%)
4.9
4.5
4.3
4.7
5.1
New hire employees (#) 748 919 927 385 302
Canada 475 686 726 226 147
U.S. 215 195 154 125 117
Mexico 58 38 47 34 38
Women in workforce (%) 29.3 29.5 31.5 30.5 27.5
Canada 35.0 35.3 37.3 36.6 36.5
U.S. 19.5 18.6 19.3 18.3 18.7
Mexico – – – – 30.1
Note: Figures for full-time employees, contractor professionals, new hire employees and women in workforce are inclusive of all TransCanada operations and assets, including CPG assets as of July 1, 2016. Employees represented by independent trade union/bargaining agreements do not include CPG. Please refer to the 2016 Corporate Social Responsibility Report Data Sheet for a breakdown of contractors by gender.
For information about our employee attraction, retention and development activities, including information about employee turnover, please refer to the Employee attraction, retention and development section. For a detailed breakdown of employee diversity numbers, please refer to the 2016 Corporate Social Responsibility Report Data Sheet.
TRANSCANADA MAP
TABLE OF CONTENTS
CEO’S MESSAGE
WHO WE ARE
Our business at a glance
Our people
ABOUT THIS REPORT
WHAT CSR MEANS TO US
A HEALTHY AND SAFE ENVIRONMENT AND COMMUNITY
AN ENGAGED COMMUNITY
A THRIVING ECONOMY
CAUTIONARY NOTE
APPENDIX
GLOBAL REPORTING INITIATIVE G4 INDEX
GLOSSARY

TRANSCANADA CSR REPORT 2016
PAGE 10
ABOUT THIS REPORT
About this report
TRANSCANADA MAP
TABLE OF CONTENTS
CEO’S MESSAGE
WHO WE ARE
ABOUT THIS REPORT
Our priorities
Our approach to disclosure
Report profile
WHAT CSR MEANS TO US
A HEALTHY AND SAFE ENVIRONMENT AND COMMUNITY
AN ENGAGED COMMUNITY
A THRIVING ECONOMY
CAUTIONARY NOTE
APPENDIX
GLOBAL REPORTING INITIATIVE G4 INDEX
GLOSSARY
Charleston, West Virginia

TRANSCANADA CSR REPORT 2016
PAGE 11
ABOUT THIS REPORT > OUR PRIORITIES
Our prioritiesThis report—produced since 2001—provides us with the opportunity to comprehensively and transparently report on our performance in the areas of Corporate Social Responsibility (CSR), which we define as our “commitment to operating in an economically, socially and environmentally sustainable manner while recognizing the interests of our stakeholders.” It also demonstrates our commitment to deepen our understanding of the issues that matter most to our key stakeholders and continuously improve our business practices and reporting.
A key element of our CSR reporting process is the concept of materiality. We define materiality in the context of CSR reporting as the economic, environmental and social issues most important to our stakeholders. This is different from financial materiality, which is the threshold for influencing the economic decisions of investors. Material corporate sustainability aspects are not limited to issues that could affect an investor’s decision to invest in TransCanada if information pertaining to the issue was omitted or misstated.
We conducted our first materiality analysis in 2012. Because our business strategy, the energy landscape and stakeholder expectations have shifted since then, we conducted a refreshed materiality analysis in 2016 to ensure we are focused on those topics most important to our business and stakeholders.
Based on this analysis, we refreshed our top 10 material aspects that are grouped into three key CSR pillars: a healthy and safe environment and community, an engaged community, and a thriving economy.
The following table details TransCanada’s scope (the range of material aspects) and boundaries (where impacts occur for each aspect inside and outside our organization), and their alignment to our CSR pillars:
CSR pillar
Material aspect
TransCanada’s definition
Management approach: scope and boundary1 inside the organization
Scope and boundary outside2 the organization
A healthy and safe environment and community
Integrity of pipelines and facilities
Our ability to construct and operate our pipelines and facilities safely and reliably every day.
All TransCanada assets where TransCanada has majority operating control in Canada, the U.S. and Mexico
Public and landowners Contractors Regulators
Emergency preparedness and response
Our ability to plan, practise and collaborate to respond to incidents and unplanned events quickly and efficiently.
All TransCanada assets where TransCanada has majority operating control in Canada, the U.S. and Mexico
Emergency responders Regulators
Health and safety of communities
Our promotion and implementation of a culture and actions that prevent safety incidents that impact people.
All TransCanada assets where TransCanada has majority operating control in Canada, the U.S. and Mexico
Contractors Regulators
Climate change and greenhouse gas emissions
Our ability to manage our GHG emissions and impact on climate.
All TransCanada assets where TransCanada has majority operating control in Canada, the U.S. and Mexico
Contractors Regulators
TRANSCANADA MAP
TABLE OF CONTENTS
CEO’S MESSAGE
WHO WE ARE
ABOUT THIS REPORT
Our priorities
Our approach to disclosure
Report profile
WHAT CSR MEANS TO US
A HEALTHY AND SAFE ENVIRONMENT AND COMMUNITY
AN ENGAGED COMMUNITY
A THRIVING ECONOMY
CAUTIONARY NOTE
APPENDIX
GLOBAL REPORTING INITIATIVE G4 INDEX
GLOSSARY
1 Please note that this scope and boundary is applicable to the management of the material aspect only. Data for specific performance indicators may omit certain asset types or locations; footnotes are provided in these instances.2 Material aspects can be impacted by organizations and individuals that are not included in TransCanada’s consolidated financial statements, including participants in TransCanada’s value chain.

TRANSCANADA CSR REPORT 2016
PAGE 12
ABOUT THIS REPORT > OUR PRIORITIES
Our priorities (continued)
CSR pillar
Material aspect
TransCanada’s definition
Management approach: scope and boundary1 inside the organization
Scope and boundary outside2 the organization
An engaged community
Stakeholder and Indigenous engagement
Our ability to foster mutual trust and respect through engagement and consultation with stakeholders and Indigenous groups where we propose projects and operate assets.
All TransCanada assets where TransCanada has majority operating control in Canada, the U.S. and Mexico
Indigenous groups Landowners Regulators
Community investment, employee giving and volunteering
Our ability to demonstrate the value of our presence in the communities where we live and work and to support and encourage our employees to give back to their communities in ways that resonate with them personally.
All TransCanada assets where TransCanada has majority operating control in Canada, the U.S. and Mexico
Contractors Landowners Indigenous groups Local communities
Employee attraction, retention and development
Our ability to foster a diverse and inclusive workplace and maintain the talent, skills and expertise of our people required today and in the future.
All TransCanada assets where TransCanada has majority operating control in Canada, the U.S. and Mexico
Contractors Local communities
A thriving economy
Financial performance Our ability to manage the long-term financial stability, competitiveness and return expected by our shareholders in consideration of business risks and opportunities.
All TransCanada assets where TransCanada has majority operating control in Canada, the US and Mexico
Shareholders Customers
Economic benefits of development
Our ability to bring job opportunities and financial benefits to communities across North America.
All TransCanada assets where TransCanada has majority operating control in Canada, the U.S. and Mexico
Suppliers Customers
Access to markets Our ability to construct and operate new pipeline assets to enhance access to markets and contribute to North American energy security.
All liquids and natural gas pipeline assets in Canada where TransCanada has majority operating control
Customers Regulators
1 Please note that this scope and boundary is applicable to the management of the material aspect only. Data for specific performance indicators may omit certain asset types or locations; footnotes are provided in these instances.2 Material aspects can be impacted by organizations and individuals that are not included in TransCanada’s consolidated financial statements, including participants in TransCanada’s value chain.
TRANSCANADA MAP
TABLE OF CONTENTS
CEO’S MESSAGE
WHO WE ARE
ABOUT THIS REPORT
Our priorities
Our approach to disclosure
Report profile
WHAT CSR MEANS TO US
A HEALTHY AND SAFE ENVIRONMENT AND COMMUNITY
AN ENGAGED COMMUNITY
A THRIVING ECONOMY
CAUTIONARY NOTE
APPENDIX
GLOBAL REPORTING INITIATIVE G4 INDEX
GLOSSARY

TRANSCANADA CSR REPORT 2016
PAGE 13
ABOUT THIS REPORT > OUR PRIORITIES
Our priorities (continued)
Outside of our top 10 material aspects, we continue to identify, monitor, manage and communicate on other CSR issues—such as biodiversity, water use, regulatory compliance, ethics, governance and diversity—that are important to our stakeholders and business. Our performance on many of these issues is included in this report, and we provide further details on our website. For example, details about our commitment and approach to protecting water along a proposed pipeline route are available in our online fact sheet.
MATERIALITY PROCESS
VALIDATE RESEARCH
INTERVIEWSIDENTIFY
SURVEYS
MATERIALITY PROCESS
MATERIALITY PROCESS
• Research and stakeholder identification
• Interviews with internal and external stakeholders
• Surveys with internal and external stakeholders
• Top 10 material issues identified
• Validate material issues with stakeholders
MATERIALITY ANALYSIS By conducting materiality analyses, we are able to better identify and prioritize the issues that matter most to our business and stakeholders.
Since conducting our first materiality analysis in 2012, we have regularly reviewed our material aspects and updated them to reflect any notable changes.
Our materiality analysis process follows the recommended practices outlined by the GRI and largely focuses on prioritizing the following:
• aspects that TransCanada has an impact on due to the nature and location of activities
• aspects that influence stakeholders’ perceptions of or actions toward TransCanada
• aspects that could have a positive or negative impact on TransCanada’s ability to generate short- and long-term value
Our analysis also included direct engagement with select external stakeholders to find out what matters most to them about CSR and how to effectively communicate our performance on CSR topics. These stakeholders included landowners, community investment partners, community leaders, suppliers, peers and customers as well as representatives from Indigenous groups who were invited to share their perspectives through interviews and surveys. We also asked employees to participate in a survey and conducted interviews with select senior leadership and board members to further understand those CSR topics that are most important to them and pose the greatest risks and opportunities for our business.
TRANSCANADA MAP
TABLE OF CONTENTS
CEO’S MESSAGE
WHO WE ARE
ABOUT THIS REPORT
Our priorities
Our approach to disclosure
Report profile
WHAT CSR MEANS TO US
A HEALTHY AND SAFE ENVIRONMENT AND COMMUNITY
AN ENGAGED COMMUNITY
A THRIVING ECONOMY
CAUTIONARY NOTE
APPENDIX
GLOBAL REPORTING INITIATIVE G4 INDEX
GLOSSARY

TRANSCANADA CSR REPORT 2016
PAGE 14
ABOUT THIS REPORT > OUR APPROACH TO DISCLOSURE / REPORT PROFILE
Our approach to disclosureOne of the key findings from our latest materiality analysis is that our reporting needs to be more focused and meaningful to our stakeholders. To that end, we engaged an external third party to analyze our 2015 CSR Report and identify opportunities to align our reporting with the GRI’s G4 Guidelines. These Guidelines place a greater emphasis on the most critical CSR impacts and issues, resulting in a clearer and more strategic, balanced, transparent and reliable report that better meets the needs and expectations of stakeholders.
This is the first year we are reporting to the GRI’s G4 Core option Guidelines, including the disclosures in the Oil and Gas sector supplement. We have also improved the report by updating its structure to focus on our top 10 material topics, including more information on scope and boundaries and methodologies for data collection and further clarity on our year-over-year performance. TransCanada’s work to continuously improve our reporting is ongoing.
While these improvements are designed to make our CSR report a more meaningful communications tool for all audiences, we will continue to engage key stakeholders and Indigenous groups through a number of avenues to gather feedback about our performance on our material and other CSR topics. These include community open houses and town halls, regulatory meetings and our revamped website, which is intended to provide timely access to the latest news and information on TransCanada.
To help us continually improve, we invite all stakeholders and interested parties to provide feedback on this report or any other facet of our performance. Please email us at [email protected] or visit the Contact page on our website for additional ways to reach out to us.
INDICATOR:
Throughout this report, this icon references performance indicators—qualitative or quantitative information about results or outcomes—related to our material aspects. GRI G4 indicators (e.g., G4-EN24) are referenced, where applicable. All other indicators are TransCanada-specific performance indicators.
TRANSCANADA MAP
TABLE OF CONTENTS
CEO’S MESSAGE
WHO WE ARE
ABOUT THIS REPORT
Our priorities
Our approach to disclosure
Report profile
WHAT CSR MEANS TO US
A HEALTHY AND SAFE ENVIRONMENT AND COMMUNITY
AN ENGAGED COMMUNITY
A THRIVING ECONOMY
CAUTIONARY NOTE
APPENDIX
GLOBAL REPORTING INITIATIVE G4 INDEX
GLOSSARY
Report profileThis report covers our management of material aspects for the 2016 calendar year for assets where TransCanada has direct operating control. We include climate change and GHG emissions information and data for the Bruce Power nuclear power generation facility, which is a non-operated asset. However, we do not include Bruce Power information for any other material aspects because the management of these assets is not under our direct operational control.
TransCanada reports our performance on an annual basis. This report covers performance for the 2016 calendar year. The production cycle for this year’s report was extended due to factors such as the CPG acquisition and integration, the revisions to our material aspects, and the work to align our reporting with the GRI’s G4 Core requirements. Data collection and review for this report occurred between January and April, followed by development—in consultation with subject matter experts—through July, and ending with management and executive review and validation in July and August.
Performance data for specific indicators may not be inclusive of all assets. Footnotes are included to note any data and material disclosures that vary from this report’s scope, boundary or reporting period. Relevant definitions for performance indicators can be found in the Glossary provided at the end of this report.
All financial figures are expressed in Canadian dollars unless otherwise noted.
This report has been prepared in accordance with the GRI G4 Core option guidelines, including the Oil and Gas sector disclosures. Under these guidelines, we disclose specific standard disclosures related to our identified material aspects as disclosures on management approach (DMA) and/or indicators. Indicators are noted throughout the report and in our companion document for stakeholders, the 2016 Corporate Social Responsibility Report Data Sheet. The GRI Index states which disclosures we are reporting on and our data sheet includes details on our performance.
Limited external assurance has been provided on data that was included in our CDP report. Other indicators that have been externally assured are noted in the footnotes. TransCanada does not have a policy for assurance of the data included in this report.
In 2016, there were two minor corrections to data reported in previous CSR reports: re-statements for spills (see page 26) and payroll and benefit costs (see page 56). The effect of these re-statements is immaterial. Footnotes have been added to indicate where re-statements have been made.
Copies of our previous CSR reports, including our most recent report in 2015, are available on our website.

TRANSCANADA CSR REPORT 2016
PAGE 15
WHAT CSR MEANS TO US
What CSR means to us
TRANSCANADA MAP
TABLE OF CONTENTS
CEO’S MESSAGE
WHO WE ARE
ABOUT THIS REPORT
WHAT CSR MEANS TO US
Our commitment
Our approach
Our impact
A HEALTHY AND SAFE ENVIRONMENT AND COMMUNITY
AN ENGAGED COMMUNITY
A THRIVING ECONOMY
CAUTIONARY NOTE
APPENDIX
GLOBAL REPORTING INITIATIVE G4 INDEX
GLOSSARY
Hardisty, Alberta

TRANSCANADA CSR REPORT 2016
PAGE 16
WHAT CSR MEANS TO US > OUR COMMITMENT / OUR APPROACH
Our commitment We strive to safely deliver the energy society needs by demonstrating our commitment to operating in an economically, socially and environmentally sustainable manner, while recognizing the interests of our stakeholders.
Even though the energy landscape is changing, our facilities are in place for generations and we are unwavering in our commitment to:
• the safety of our workplace and communities
• protecting land, air, water and wildlife
• building relationships in the communities where we work
• respecting Indigenous groups, traditions and lands
We are also required to comply with all federal, provincial and state laws and regulations governing the management of health and safety, environment, land use and other material aspects of our business.
Engaging stakeholders early and often, listening and sharing information strengthens relationships and helps us better understand the issues that matter most throughout the life cycle of our assets.
TRANSCANADA MAP
TABLE OF CONTENTS
CEO’S MESSAGE
WHO WE ARE
ABOUT THIS REPORT
WHAT CSR MEANS TO US
Our commitment
Our approach
Our impact
A HEALTHY AND SAFE ENVIRONMENT AND COMMUNITY
AN ENGAGED COMMUNITY
A THRIVING ECONOMY
CAUTIONARY NOTE
APPENDIX
GLOBAL REPORTING INITIATIVE G4 INDEX
GLOSSARY
Our approachWe work to manage both strategic and operational risks linked to our material aspects.
To better understand these risks and improve our approach to managing them, we build risk assessments into our decision-making process at all levels, listen to our stakeholders’ concerns and collaborate with our industry peers. This holistic approach reflects our corporate values of Safety, Integrity, Responsibility and Collaboration, and is central to our ability to make important decisions about our business and operations as well as to manage our impacts on the environment and communities where we work.
THE ROLE OF STRATEGIC RISK MANAGEMENT Through risk identification and assessment, we are able to better understand our risk exposure; make more informed business decisions; and develop strategies for monitoring, mitigating, and preventing impacts on people, communities and our organization.
For more information about our governance of and approach to risk management, please refer to page 92 of our 2016 Annual Report.
THE ROLE OF A MANAGEMENT SYSTEMTransCanada’s Operational Management System (TOMS) provides a framework for how our assets are designed, constructed, operated and decommissioned to ensure the safety, security and protection of our personnel, property, physical assets and the environment. This approach assures that the principles and requirements that drive consistent, effective and efficient business results are followed and that company policy and regulatory requirements are met. Through the “plan, do, check, act” cycle of our management system, we can improve our day-to-day activities and achieve performance requirements and targets. The TOMS continual improvement cycle enables us to:
• comprehensively assess the operational risks of our businesses
• develop programs, standards and procedures to address those risks
• identify appropriate goals, objectives and targets for risk reduction or performance improvement
• periodically report on performance, incidents and nonconformances
• identify root causes and corrective actions to prevent recurrences of incidents and nonconformances
• further refine our management system over time

TRANSCANADA CSR REPORT 2016
PAGE 17
WHAT CSR MEANS TO US > OUR APPROACH
In 2016, we completed the integration of four of our management systems—including our HSE Management System, which provided the foundation for all of our HSE protection programs—into a single management system, TOMS.
TRANSCANADA MAP
TABLE OF CONTENTS
CEO’S MESSAGE
WHO WE ARE
ABOUT THIS REPORT
WHAT CSR MEANS TO US
Our commitment
Our approach
Our impact
A HEALTHY AND SAFE ENVIRONMENT AND COMMUNITY
AN ENGAGED COMMUNITY
A THRIVING ECONOMY
CAUTIONARY NOTE
APPENDIX
GLOBAL REPORTING INITIATIVE G4 INDEX
GLOSSARY
TransCanada’s Operational Management System (TOMS) is the overarching framework for how we effectively and efficiently act, work and move forward together.
TOMS provides expectations on how our assets are designed, constructed, operated and decommissioned to ensure the safety, security and protection of our personnel, property, physical assets and the environment.
PRESENTPAST
CONTINUALIMPROVEMENT
The management system will continue to change and evolve, ensuring we stay relevant while driving business value.
GOVERNANCE
How the organization is directed and monitored to assure its core purpose.
ELEMENTSNine foundational elements set the common principles and requirements that must be addressed, driving consistent and better business results.
1 Leadership Commitment & Strategy
2 Risk Management
3 Operational Controls
4 Roles, Responsibilities & Competency
5 Management of Change
6 Information Management
7 Compliance
8 Incident & Nonconformance Management
9 Performance Monitoring, Audit & Management Review
TOMSC
ontin
ual I
mpr
ovem
ent
Continual Improvement
GO
VE
RN
AN
CE
SAFE, RELIABLE & RESPONSIBLE
OPERATIONS
CONSTRUCT OPERATE DECOMMISSIONDESIGN
Centralized technical requirements, standards, and assurance functions and services.
Capital Projects Management
Systems
Health, Safety &
Environment
Commercial Services
& Design
Asset Management
System
CP
MS
HS
EC
SD
AM
S
ELEMENTS
PRACTICES
REQUIREMENTS
ELEMENTS
PROCESSES
ELEMENTS
PROCESSES
REQUIREMENTS
STANDARDS
REQUIREMENTS
PROCESSES
PROGRAMS
PROCEDURES
PROCEDURES
PROGRAMS
BUSINESS UNITS
BUSINESS UNITS
CO
RP
OR
AT
E P
OL
ICIE
S &
CO
MM
ITM
EN
T S
TAT
EM
EN
TS
PLAN
DOACT
CHECK
TECHNICAL CENTRE & PROJECTS
ENERGY
ENERGY
CORPSERVICES
LIQUIDS
LIQUIDSGAS
GAS
In the past, TransCanada worked within four separate management systems with overlapping elements, programs, requirements, processes and procedures. This created additional challenges on our organization’s ability to ensure we are compliant, consistent and coordinated in meeting our business objectives.
In 2016, these four systems were integrated into one overarching framework - TransCanada's Operational Management System.
TransCanada’s Operational Management System (TOMS)
1 2 3 4 5 6 7 8 9
ELEMENTS
MA
ND
ATE
D
PR
OG
RA
MS
STA
ND
AR
DS
SPEC
IFIC
ATI
ON
S
PR
OC
ED
UR
ES
REGULATIONS
REGULATIONS
www.cartogroup.com 4/24/17
Our approach (continued)

TRANSCANADA CSR REPORT 2016
PAGE 18
WHAT CSR MEANS TO US > OUR APPROACH
Our approach (continued)
HSE GOVERNANCE AND ASSURANCE ACTIVITIESOur governance structure enables us to make the decisions about how and where our business operates. Accountability for our Health, Safety and Environment Commitment Statement lies with our CEO and is supported by our board through the HSE Committee.
To assist TransCanada and its business entities in ensuring that HSE governance and due diligence requirements are monitored, measured, met and modified appropriately, we utilize a four-tier assurance approach:
HSE tier Notable 2016 activities
Tier 1 activities: These are the foundation of our HSE governance and entail fundamental workplace safety activities conducted by field and/or office employees on a daily, weekly and monthly basis. Examples are site facility and equipment inspections, and routine general maintenance tasks.
Of the 215,193 Tier 1 Regulatory Preventive Maintenance activities planned for completion in 2016, 99.9 per cent were completed on time. The remaining 0.1 per cent were reviewed by management to understand the potential impact. All were determined to be low risk.
Tier 2 activities: Planned workplace and facility inspections to identify hazards—including physical conditions of the workplace—and review documents, records and compliance with applicable regulations.
There were 945 Tier 2 inspections scheduled in 2016, and 100 per cent were completed.
Tier 3 internal audits: Triennial assessments of TransCanada’s HSE programs across various assets through internal operational audits.
One audit was planned and completed for the HSE programs within our energy business across North America.
Tier 4 external agencies: Quality assurance and quality control assessment of TransCanada’s HSE governance process through independent regulatory inspections and audits.
No activities were planned or conducted in 2016.
For further details on our HSE governance, please refer to page 93 of our 2016 Annual Report.
Another key development during the year was related to the 2013 management system and protection programs audits by the National Energy Board (NEB). NEB auditors reviewed our remaining Corrective Action Plan (CAP) deliverables and issued a final Implementation Assessment Report, closing out the audit and completing one of the most thorough reviews of TransCanada’s system.
More information on the elements of our management system and the results of the management system audit are available on the NEB website.
TRANSCANADA MAP
TABLE OF CONTENTS
CEO’S MESSAGE
WHO WE ARE
ABOUT THIS REPORT
WHAT CSR MEANS TO US
Our commitment
Our approach
Our impact
A HEALTHY AND SAFE ENVIRONMENT AND COMMUNITY
AN ENGAGED COMMUNITY
A THRIVING ECONOMY
CAUTIONARY NOTE
APPENDIX
GLOBAL REPORTING INITIATIVE G4 INDEX
GLOSSARY

TRANSCANADA CSR REPORT 2016
PAGE 19
WHAT CSR MEANS TO US > OUR APPROACH
Our approach (continued)
THE ROLE OF ENGAGEMENT WITH STAKEHOLDERS AND INDIGENOUS GROUPSWe strive to engage stakeholders and Indigenous groups early and often and we listen to them through both formal and informal engagement. By transparently sharing information and seeking their input on proposed projects, ongoing operations, and our CSR activities and reporting, we are better equipped to make the right decisions for our business and better manage our material aspects.
An overview of our stakeholders—who we generally define as those people or groups that significantly affect or who may be affected by our business activities, be it directly or indirectly—is detailed in the accompanying graphic. Because Indigenous groups have distinct rights, we consider these groups to be separate from other stakeholders. Our approach to engagement with stakeholders and Indigenous groups is discussed below.
TRANSCANADA’S STAKEHOLDERS
Community Investment
Partners
Landowners
Landowner Associations
Community Residents
Joint Venture Partners
Local Businesses
Contract and Service
Providers
Industry Associations
Local Municipal
Governments
Customers
Indigenous Groups
Media
Educators
Human Health and Wellness
Providers
Non-Governmental Organizations
Emergency Responders
Government RegulatorsEmployees Shareholders
For further details on our approach, please refer to the Stakeholder and Indigenous engagement section.
For the discussion covering our engagement with stakeholders to determine our material aspects, please refer to the About this report—materiality analysis section.
TRANSCANADA MAP
TABLE OF CONTENTS
CEO’S MESSAGE
WHO WE ARE
ABOUT THIS REPORT
WHAT CSR MEANS TO US
Our commitment
Our approach
Our impact
A HEALTHY AND SAFE ENVIRONMENT AND COMMUNITY
AN ENGAGED COMMUNITY
A THRIVING ECONOMY
CAUTIONARY NOTE
APPENDIX
GLOBAL REPORTING INITIATIVE G4 INDEX
GLOSSARY

TRANSCANADA CSR REPORT 2016
PAGE 20
WHAT CSR MEANS TO US > OUR APPROACH
Our approach (continued)
THE ROLE OF DIALOGUE AND PARTICIPATION WITH POLICY-MAKERS AND INDUSTRY GROUPSWe work continuously to build and maintain positive and constructive relationships with governments and regulators to obtain and maintain support for our activities and initiatives. We also work closely with industry organizations to improve our performance and to define, share and implement leading safety, environmental and socio-economic practices.
TransCanada engages in the public policy process by participating in direct advocacy before governments, including support of the political process through political contributions where permitted by law. In order to ensure that our advocacy efforts are in compliance with legal requirements and consistent with our core values, we have several policies pertaining to lobbying activities and political contributions, each of which applies to all directors, officers and employees as well as contractors.
Our memberships in industry organizations—such as the Canadian Energy Pipeline Association (CEPA), the Canadian Electricity Association (CEA), the Association of Oil Pipelines (AOPL), and the Interstate Natural Gas Association of America (INGAA)—are primarily for sharing knowledge and discussing technical and industry standards. While these organizations may participate in or lead lobbying activities, our membership does not necessarily signify comprehensive support for all positions undertaken by the organizations.
For information about our 2016 political contributions and further details, please refer to Oversight and policies on lobbying, political contributions and corporate memberships in the Appendix.
THE ROLE OF TECHNOLOGY MANAGEMENTOur pipelines, oil and gas facilities and power plants are some of the most technologically advanced in the industry. We have one of the industry’s largest research and development (R&D) programs and we are among Canada’s top 100 corporate R&D spenders, according to Research Infosource Inc.
Since 2010, we have dedicated approximately $150 million toward technology development to support an internal research program as well as joint partnerships. We collaborate with industry associations and peers, academia, government and non-governmental organizations in Canada, the U.S. and Mexico to enhance the safety, efficiency and reliability of our pipeline construction and operations.
Our R&D activities focus on technology advancements in the areas of in-line inspection, cathodic protection, leak detection and coating technology, and we support research that benefits many areas of our business, such as gas quality, flow efficiency, health, safety and environment, as well as facilities and measurement.
TRANSCANADA MAP
TABLE OF CONTENTS
CEO’S MESSAGE
WHO WE ARE
ABOUT THIS REPORT
WHAT CSR MEANS TO US
Our commitment
Our approach
Our impact
A HEALTHY AND SAFE ENVIRONMENT AND COMMUNITY
AN ENGAGED COMMUNITY
A THRIVING ECONOMY
CAUTIONARY NOTE
APPENDIX
GLOBAL REPORTING INITIATIVE G4 INDEX
GLOSSARY

TRANSCANADA CSR REPORT 2016
PAGE 21
WHAT CSR MEANS TO US > OUR IMPACT
TRANSCANADA MAP
TABLE OF CONTENTS
CEO’S MESSAGE
WHO WE ARE
ABOUT THIS REPORT
WHAT CSR MEANS TO US
Our commitment
Our approach
Our impact
A HEALTHY AND SAFE ENVIRONMENT AND COMMUNITY
AN ENGAGED COMMUNITY
A THRIVING ECONOMY
CAUTIONARY NOTE
APPENDIX
GLOBAL REPORTING INITIATIVE G4 INDEX
GLOSSARY
Our impactTransCanada’s pipelines, storage facilities and power generating stations provide the energy that millions of people across Canada, the U.S. and Mexico rely on every day.
To achieve our vision of being the leading energy infrastructure company in North America, we recognize the importance of operating in a sustainable manner while creating value for society.
Our operations are associated with a number of direct and indirect impacts and benefits to communities and the environment, all of which are of interest to our business and our key stakeholders.
Among our positive impacts are jobs, business opportunities for local suppliers, the broader local economic stimulation associated with new project developments and benefits such as tax revenue and community investment activities related to our ongoing presence in local communities.
Through our pipelines that deliver natural gas—the cleanest burning fossil fuel—we support the shift from coal to lower-carbon energy sources. In North America, we transport more than 25 per cent of the continent’s growing natural gas supply, and we are playing a key role in developing the emerging liquid natural gas (LNG) export industry.
We support the transition to a more balanced energy future through our emission-less assets, and by being a leader in the development and operation of high-efficiency, natural gas-fired electricity generation, which produces greenhouse gas (GHG) emissions but at a substantially lower intensity than coal.
We also face challenges and must manage the impacts and risks inherent in our business.
Pipelines are the safest and most efficient way to transport large volumes of oil and gas; however, incidents that impact the health and safety of our employees and contractors, communities and the environment can occur. Stakeholders are particularly concerned about spills that have the potential to impact waterways.
In addition, there are broader societal concerns about the impacts that the oil and other carbon-based fuels we transport have on climate change. The growing demand to transition to lower-carbon energy sources is both a risk and opportunity for our business. We support public policy frameworks that focus on managing emissions and encourage the development of a balanced energy portfolio that includes low-carbon energy production and emissions.
We believe our efforts and ongoing commitment to reduce the intensity of our operations, combined with the substantial investments we have made in low-emission and emission-less energy sources, position us well to adapt to and thrive in the coming low-carbon economy.
OUR ROLE IN THE ENERGY VALUE CHAINThe energy industry is complex and multi-faceted. TransCanada works as an intermediary in the oil and gas value chain, moving crude oil and natural gas from supply basins to markets. We also are a supplier of power, generating electricity for companies that distribute energy to homes and businesses.
The graphic on the following page illustrates the major stages of the energy value chain and how we provide safe, reliable and affordable fuel transportation and power generation every day.
Through our Energy East Pipeline Project, we are supporting training programs for apprentice welders to gain the skills and experience necessary to work in the pipeline industry. Visit our Energy East website for more information.

TRANSCANADA CSR REPORT 2016
PAGE 22
WHAT CSR MEANS TO US > OUR IMPACT
ENERGY
Local distributors sell natural gas to consumers
Energy to power homes
Refineries transform crude oil into useful products
Petroleum-based products are distributed by the refinery and enter the market through various avenues
Some petrochemicals are used to create everyday products
Some petroleum products are ultimately burned and used as
fuel for machinery and transportation
Export facilities turnnatural gas into
liquefied natural gas
Power is bought and sold and ultimately transmitted
to consumers
Natural gas-fired powergeneration facilities
Crude oil and natural gas
Wind and solarfacilities
Nuclearfacilities
Denotes TransCanada value chain activity
Denotes other activity
CRUDE OIL
ENERGY
NATURAL GAS
Crude oil and natural gas are transported
from their initial supply sources to TransCanada pipelines and/or storage facilities
TRANSCANADA’S VALUE CHAIN
Our impact (continued)TRANSCANADA MAP
TABLE OF CONTENTS
CEO’S MESSAGE
WHO WE ARE
ABOUT THIS REPORT
WHAT CSR MEANS TO US
Our commitment
Our approach
Our impact
A HEALTHY AND SAFE ENVIRONMENT AND COMMUNITY
AN ENGAGED COMMUNITY
A THRIVING ECONOMY
CAUTIONARY NOTE
APPENDIX
GLOBAL REPORTING INITIATIVE G4 INDEX
GLOSSARY

TRANSCANADA CSR REPORT 2016
PAGE 23
A HEALTHY AND SAFE ENVIRONMENT AND COMMUNITY
A healthy and safe environment and community
TRANSCANADA MAP
TABLE OF CONTENTS
CEO’S MESSAGE
WHO WE ARE
ABOUT THIS REPORT
WHAT CSR MEANS TO US
A HEALTHY AND SAFE ENVIRONMENT AND COMMUNITY
Integrity of pipelines and facilities
Emergency preparedness and response
Health and safety of communities, employees and contractors
Climate change and greenhouse gas emissions
AN ENGAGED COMMUNITY
A THRIVING ECONOMY
CAUTIONARY NOTE
APPENDIX
GLOBAL REPORTING INITIATIVE G4 INDEX
GLOSSARY
Northern Alberta

TRANSCANADA CSR REPORT 2016
PAGE 24
A HEALTHY AND SAFE ENVIRONMENT AND COMMUNITY > INTEGRITY OF PIPELINES AND FACILITIES
Integrity of pipelines and facilitiesOur ability to construct and operate our pipelines and facilities safely and reliably every day.
OPERATING CONTEXTEnsuring our pipelines and other facilities operate safely and reliably is our top priority and contributes to the long-term sustainability of our business. Pipelines are the safest way to transport natural gas and petroleum. However, releases of oil or gas, while rare, are possible and can impact the safety of people and communities and the health of the environment.
In any natural gas pipeline leak, the greatest potential risk to the public or the environment is the chance of ignition in proximity to the public. Methane gas fugitive emissions are also a potent GHG.
In a crude oil leak, the greatest potential risk to the public or the environment is water contamination. The protection of water resources is of the utmost importance to us.
Incidents resulting in a release of oil or gas can be caused by a variety of factors. These include material corrosion and defects, soil erosion that may expose a pipeline, and the significant threat from third parties conducting unauthorized excavations, encroachments and other activities within a pipeline right of way (ROW).
Our integrity and preventative maintenance programs, monitoring systems, leak-detection technologies, aerial patrols, public awareness programs and services to locate underground utilities are among the many management tools we use to help keep our communities safe and the environment protected.
COMMITMENTTransCanada is committed to ensuring we operate in a safe and reliable manner, and maintaining the integrity of our assets is one of our guiding principles that helps prevent unplanned releases that could result in a major incident.
We aim for our pipelines and facilities to operate incident-free and to ensure our assets serve our people and communities across the continent for years to come. In the rare event of a failure of one of our assets, TransCanada will assume full responsibility for the impacts associated with the incident, including timely remediation and restoration of third-party property or impacts on the environment.
We are committed to continually improving industry-wide standards and we regularly invest in R&D activities with a focus on technology advancements in the areas of pipeline integrity, including in-line inspection, cathodic protection, leak detection and coating technology.
To learn more, download our Health, Safety and Environment Commitment Statement.
APPROACHOur integrity management programs include requirements and expectations for the integrity of our pipelines and facilities, and they are aligned with TOMS to enable continuous improvement. All assets are designed, constructed and commissioned with full consideration given to safety and integrity. Assets are brought into service only after all necessary requirements have been satisfied.
Pipeline integrityOur Pipeline Integrity Program governs the processes used to manage the integrity of our pipelines across the life cycle of the asset:
• At design, TransCanada selects high-quality materials, uses the latest proven technology and applies industry-leading engineering practices.
• During construction of pipelines, qualified independent inspectors inspect all welds, and we use radiography and automated ultrasonic testing techniques to check for irregularities before pipelines go into service.
• To sustain and maximize the value of our assets during operation, we focus on preventing damage and degradation, detecting irregularities, and preventing and minimizing the chances of a leak.
Preventing damage and degradation Our Public Awareness (PA) program emphasizes the importance of using local “click or call before you dig” services to locate underground utilities and helps mitigate third-party damage threats. We also conduct integrity and preventative maintenance activities on a regular basis.
TRANSCANADA MAP
TABLE OF CONTENTS
CEO’S MESSAGE
WHO WE ARE
ABOUT THIS REPORT
WHAT CSR MEANS TO US
A HEALTHY AND SAFE ENVIRONMENT AND COMMUNITY
Integrity of pipelines and facilities
Emergency preparedness and response
Health and safety of communities, employees and contractors
Climate change and greenhouse gas emissions
AN ENGAGED COMMUNITY
A THRIVING ECONOMY
CAUTIONARY NOTE
APPENDIX
GLOBAL REPORTING INITIATIVE G4 INDEX
GLOSSARY

TRANSCANADA CSR REPORT 2016
PAGE 25
A HEALTHY AND SAFE ENVIRONMENT AND COMMUNITY > INTEGRITY OF PIPELINES AND FACILITIES
Integrity of pipelines and facilities (continued)
Detecting irregularitiesOur Operations Control Centres (OCCs) are staffed 24 hours a day, seven days a week, by trained personnel who use the most sophisticated monitoring equipment and technology available.
We assess the condition of underground pipelines through a number of programs, including aerial patrols and surveys as well as geotechnical monitoring. We also conduct in-line inspections called “pigging” that use specialized “smart pig” devices that travel through the pipeline. The data is analyzed to determine any areas of concern. We conduct investigative digs based on this data analysis or other information to determine if and when repairs are required.
If an abnormal condition is detected, we activate our emergency response systems and procedures.
Please see the Emergency preparedness and response section for details about our approach toward reducing any impacts on the environment and communities in the rare event of an incident.
Leak prevention We employ state-of-the-art construction standards and use cutting-edge leak detection technologies. In the unlikely event of an incident, our pipelines have site-specific Emergency Response Plans (ERPs), which we develop in collaboration with local emergency responders, to ensure a quick response.
Facility integrityOur Facility Integrity and Reliability Management (FIRM) Program provides a systematic approach of processes and procedures to supplement TransCanada’s normal maintenance practices for facilities across North America. Internally, we measure our facility performance and the effectiveness of maintenance measures through metrics, such as the number of facility incidents involving injury or impact on the environment and the mean time between equipment failures.
Continuous improvement and performance measurementTo enable continuous improvement and learning from incidents, TransCanada conducts comprehensive failure investigations into pipeline and facility incidents, including all crude oil spills, to make system-wide improvements and prevent similar incidents. We also track and investigate near misses. These investigations identify causal and contributing factors that help us improve our integrity programs and reach our goal of preventing all incidents. In addition, we review publicly released audit and incident reports from external industry pipeline failure incidents to identify applicable recommendations that can be proactively implemented.
Our performance in effectively managing pipeline safety and integrity is measured by indicators related to our investment in integrity and preventative maintenance programs, the number and distance of in-line inspections and the number of completed integrity digs. We also measure the total number and volume of significant spills and third-party damage to pipelines.
No significant adjustments to our approach were identified for the 2016 reporting period.
For additional details on our approach to pipeline safety and integrity, please refer to Ensuring our pipelines are safe fact sheet.
For additional details on TOMS, please refer to the What CSR means to us—our approach section.
TRANSCANADA MAP
TABLE OF CONTENTS
CEO’S MESSAGE
WHO WE ARE
ABOUT THIS REPORT
WHAT CSR MEANS TO US
A HEALTHY AND SAFE ENVIRONMENT AND COMMUNITY
Integrity of pipelines and facilities
Emergency preparedness and response
Health and safety of communities, employees and contractors
Climate change and greenhouse gas emissions
AN ENGAGED COMMUNITY
A THRIVING ECONOMY
CAUTIONARY NOTE
APPENDIX
GLOBAL REPORTING INITIATIVE G4 INDEX
GLOSSARY

TRANSCANADA CSR REPORT 2016
PAGE 26
A HEALTHY AND SAFE ENVIRONMENT AND COMMUNITY > INTEGRITY OF PIPELINES AND FACILITIES
Integrity of pipelines and facilities (continued)
PERFORMANCE
INDICATOR: Total number and volume of significant spills (G4-EN24)
This is the first year we are reporting the number and volume of reportable releases from our natural gas pipelines in both Canada and the U.S. Our natural gas pipelines operated safely throughout 2016, with no significant* natural gas pipeline incidents.
Our liquids pipelines performance improved in 2016, continuing the trend of reductions in the number of reportable spills since 2011. However, spill volume in 2016 increased due to an incident on our Keystone Pipeline System that did not result in any injuries or pose a serious environmental impact or threat to public safety.
On April 2, 2016, a landowner along our Keystone Pipeline System in Hutchinson County, S.D., reported oil on the ground following a period of heavy rainfall. The pipeline was immediately shut down and excavation of the area identified the source of the leak. A subsequent investigation involving the U.S. Pipelines and Hazardous Materials Safety Administration (PHMSA)
and independent third-party experts determined that approximately 400 bbl (63,595 L) of crude oil had gradually leaked from a pinhole-sized defect at a weld between two sections of pipe.
Working co-operatively with state and federal authorities, we completed initial cleanup and repair work and were able to restart the pipeline on April 10, 2016. We continued to work with regulators and the affected landowners for several months to restore the land to its normal condition and provide appropriate compensation for the inconvenience related to our activities.
A detailed analysis of the weld found that the small size and unusual characteristics of the defect allowed it to go unnoticed by our pipeline control centre, as well as by the detailed testing and inspections we conducted during construction and as part of our ongoing pipeline maintenance and integrity programs. These findings have been used to improve our welding inspection procedures and operational pipeline monitoring practices to prevent similar leaks from occurring in the future.
* See the Glossary for the definition.
Liquids pipeline spills 2012 2013 2014 2015 2016
Number of reportable1 crude oil spills (#)
44
22
10
1
2
Canada2 44 21 9 1 0
U.S. 0 1 1 0 2
Volume of reportable crude oil spills (litres)
214
3,130
220
2,300
63,614
Canada 214 3,054 61 2,300 0
U.S. 0 76 2383 0 63,614
Note: This indicator is inclusive of all TransCanada liquid pipeline assets where TransCanada has majority operating control, including CPG assets as of July 1, 2016. It does not include gas storage, energy assets or leaks from natural gas pipelines. Spills by third-party contractors are not reflective of TransCanada’s integrity management performance and thus are excluded.
1 See the Glossary for the definition.2 Prior to July 1, 2014, in Canada, all Keystone crude oil spills, regardless of volume, were reportable to the Canadian
Transportation Safety Board (TSB). The higher number of reportable spills prior to 2014 reflects this previous requirement.3 Data reported in previous TransCanada CSR reports may differ from the above, as the data has been updated to reflect
finalized incident information. The volume of U.S. spills in 2014 has been restated based on final incident information.
Natural gas pipeline releases 2016
Number of reportable1 gas releases (#) 22
Canada 14
U.S. 8
Mexico 9
Volume of reportable gas releases (m3) 2,174,126
Canada 3,131
U.S.2 2,170,995
Mexico 78,321
Note: This indicator is inclusive of all TransCanada natural gas pipeline assets where TransCanada has majority operating control, including CPG assets as of July 1, 2016, but excluding assets in Mexico. It does not include liquids pipelines, gas storage, or energy assets.
1 See the Glossary for the definition.2 Thresholds for reporting of gas releases are lower in the U.S. than in Canada with respect to the cost of damage to
operators and/or adjacent facilities. In the U.S., a release resulting in damages of $50,000 to the operator is considered a reportable release. In Canada, a release resulting in damages of $50,000 is below the reporting threshold for a reportable release. The discrepancy between U.S. and Canadian reportable releases is the result of this difference in reporting requirements.
Data reported in previous TransCanada CSR reports may differ from the above, as the data has been updated to reflect finalized incident information.
TRANSCANADA MAP
TABLE OF CONTENTS
CEO’S MESSAGE
WHO WE ARE
ABOUT THIS REPORT
WHAT CSR MEANS TO US
A HEALTHY AND SAFE ENVIRONMENT AND COMMUNITY
Integrity of pipelines and facilities
Emergency preparedness and response
Health and safety of communities, employees and contractors
Climate change and greenhouse gas emissions
AN ENGAGED COMMUNITY
A THRIVING ECONOMY
CAUTIONARY NOTE
APPENDIX
GLOBAL REPORTING INITIATIVE G4 INDEX
GLOSSARY

TRANSCANADA CSR REPORT 2016
PAGE 27
A HEALTHY AND SAFE ENVIRONMENT AND COMMUNITY > INTEGRITY OF PIPELINES AND FACILITIES
Integrity of pipelines and facilities (continued)
INDICATOR: Process safety events (G4-OG13)
Our integrity program contributes to process safety and aids in preventing releases of product that can pose a hazard to people and the environment. Since 2014, the number of oil or gas pipeline ruptures on our pipelines has decreased. In 2016 we experienced no oil or gas pipeline ruptures impacting the serviceability of our pipelines. However, our oil pipelines experienced one process safety event related to the incident on our Keystone Pipeline System (please see the discussion on our number and volume of significant spills).
Process safety events involving oil and gas pipelines
2014
2015
2016
Oil or gas pipeline ruptures1 3 1 0
Oil pipeline releases >5 barrels 0 0 1
Note: This indicator is inclusive of all natural gas and liquids pipeline assets in Canada, the U.S. and Mexico, with the exclusion of CPG assets. It does not include gas storage or energy assets.
1 See the Glossary for the definition. At this time, internal processes for tracking do not include facility pipeline ruptures, so the April 2016 Keystone Pipeline System leak is not captured here. For details on this event, please see the discussion on our number and volume of significant spills.
INDICATOR: Third-party encroachments, unauthorized activities and one-calls
In 2016, unauthorized excavations decreased but total unauthorized activities (including pipeline encroachments) increased. We continue to analyze the factors behind the total increase but we believe that the NEB Damage Prevention Regulations that went into effect in June 2016 could be a factor in the increase. These new regulations include more prescriptive requirements for crossing approvals and reporting obligations for unauthorized crossings in Canada.
Not all encroachments or unauthorized activities result in third-party damage, which we define as impact or exposure resulting in the need to repair an underground facility.
Third-party damage 2012 2013 2014 2015 2016
Unauthorized excavations per 1,000 km of ROW1
1.81
1.28
1.34
1.5
1.28
One-calls1 per km of ROW 2.77 2.88 2.91 2.76 2.56
Unauthorized pipeline encroachments (normalized by 1,000 km of ROW and one-calls)
5.15
4.33
3.30
3.9
4.62
Note: This indicator is inclusive of all TransCanada liquid and natural gas pipeline assets where TransCanada has majority operating control but does not include CPG assets, gas storage or energy assets.
1 See the Glossary for the definition.
TRANSCANADA MAP
TABLE OF CONTENTS
CEO’S MESSAGE
WHO WE ARE
ABOUT THIS REPORT
WHAT CSR MEANS TO US
A HEALTHY AND SAFE ENVIRONMENT AND COMMUNITY
Integrity of pipelines and facilities
Emergency preparedness and response
Health and safety of communities, employees and contractors
Climate change and greenhouse gas emissions
AN ENGAGED COMMUNITY
A THRIVING ECONOMY
CAUTIONARY NOTE
APPENDIX
GLOBAL REPORTING INITIATIVE G4 INDEX
GLOSSARY

TRANSCANADA CSR REPORT 2016
PAGE 28
A HEALTHY AND SAFE ENVIRONMENT AND COMMUNITY > INTEGRITY OF PIPELINES AND FACILITIES
Integrity of pipelines and facilities (continued)
INDICATOR: Investment in integrity and preventative maintenance programs
Our total pipeline integrity spending can be impacted by maintenance activities and evaluations from inspections and annual risk assessments of our pipeline system.
To effectively manage pipeline safety and integrity, TransCanada invested $809 million in integrity and preventative maintenance programs directed toward improving the life and integrity of facilities in 2016, a $6 million increase over 2015.
Investment in integrity and preventative maintenance programs (millions of dollars)
2012
2013
2014
2015
2016
Investment for natural gas and liquids pipelines
~$312
$376
$550
$803
$809
Note: This indicator is inclusive of all TransCanada liquid and natural gas pipeline assets where TransCanada has majority operating control, including CPG assets as of July 1, 2016. It does not include gas storage or energy assets.
INDICATOR: In-line inspections
To prevent and detect leaks and irregularities, during 2016 TransCanada conducted in-line inspection runs across 18,075 kilometres (km) of pipeline, analyzing 201 runs. The increase of 55 runs over 2015 reflects the addition of the CPG assets in July 2016.
In-line inspections 2015 2016
Runs analyzed (total #) 146 201
Canada
Gas 86 87
Liquid 4 1
U.S.
Gas 43 111
Liquid 10 2
Mexico
Gas 3 0
In-line inspections (km/mi) 12,968 km/8,056 mi 18,074 km/11,233 mi
Canada
Gas 5,243 km/3,257 mi 10,400 km/6,465 mi
Liquid 1,149 km/714 mi 315 km/196 mi
U.S.
Gas 3,759 km/2,335 mi 6,257 km/3,889 mi
Liquid 2,460 km/1,528 mi 1,102 km/685 mi
Mexico
Gas 357 km/222 mi 0 km/0 mi
Note: This indicator is inclusive of all TransCanada liquid and natural gas pipeline assets where TransCanada has majority operating control, including CPG assets as of July 1, 2016. It does not include gas storage or energy assets.
1 The number of in-line inspections can vary year over year depending on annual program requirements.
TRANSCANADA MAP
TABLE OF CONTENTS
CEO’S MESSAGE
WHO WE ARE
ABOUT THIS REPORT
WHAT CSR MEANS TO US
A HEALTHY AND SAFE ENVIRONMENT AND COMMUNITY
Integrity of pipelines and facilities
Emergency preparedness and response
Health and safety of communities, employees and contractors
Climate change and greenhouse gas emissions
AN ENGAGED COMMUNITY
A THRIVING ECONOMY
CAUTIONARY NOTE
APPENDIX
GLOBAL REPORTING INITIATIVE G4 INDEX
GLOSSARY

TRANSCANADA CSR REPORT 2016
PAGE 29
A HEALTHY AND SAFE ENVIRONMENT AND COMMUNITY > INTEGRITY OF PIPELINES AND FACILITIES
Integrity of pipelines and facilities (continued)
INDICATOR: Integrity digs
Integrity digs are another key element of TransCanada’s commitment to pipeline safety and integrity. In 2016 we completed 799 integrity digs, 75 more digs than in 2015, largely due to the addition of the CPG assets in July 2016.
Integrity digs 2015 2016
Completed integrity digs (#) 724 799
Canada
Gas 618 545
Liquid 21 2
U.S.
Gas 73 235
Liquid 12 14
Mexico
Gas 0 3
Note: This indicator is inclusive of all TransCanada liquid and natural gas pipeline assets where TransCanada has majority operating control, including CPG assets as of July 1, 2016. It does not include gas storage or energy assets.
1 The number of integrity digs can vary year over year depending on annual program requirements.
Work in 2016 to continually improve industry-wide standards included our ongoing participation in CEPA’s Integrity First program and INGAA’s Integrity Management Continuous Improvement initiative.
Please refer to CEPA’s 2017 Transmission Pipeline Industry Performance Report for further details on industry-wide initiatives and performance.
In July 2017, TransCanada sent a PIG (Pipeline Inspection Gauge) on a record four-day journey of 941 kilometres along the Canadian Mainline. This distance far surpassed the industry norm of 200 to 300 kilometres, significantly reducing customer disruptions as well as curtailing greenhouse gas emissions. Click here for the full story.
TRANSCANADA MAP
TABLE OF CONTENTS
CEO’S MESSAGE
WHO WE ARE
ABOUT THIS REPORT
WHAT CSR MEANS TO US
A HEALTHY AND SAFE ENVIRONMENT AND COMMUNITY
Integrity of pipelines and facilities
Emergency preparedness and response
Health and safety of communities, employees and contractors
Climate change and greenhouse gas emissions
AN ENGAGED COMMUNITY
A THRIVING ECONOMY
CAUTIONARY NOTE
APPENDIX
GLOBAL REPORTING INITIATIVE G4 INDEX
GLOSSARY
TRANSCANADA CSR REPORT 2016
PAGE 30
A HEALTHY AND SAFE ENVIRONMENT AND COMMUNITY > EMERGENCY PREPAREDNESS AND RESPONSE
Emergency preparedness and responseOur ability to plan, practise and collaborate to respond to incidents and unplanned events quickly and efficiently.
OPERATING CONTEXTTransCanada has an industry-leading safety record and a goal of achieving zero incidents. However, incidents and emergencies involving worker safety, damage to facilities and pipelines, malicious acts and natural disasters can happen. In addition, natural gas and oil can be hazardous under certain conditions. Responding to environmental and health and safety incidents in an efficient and effective manner enables us to minimize the impact of an event.
COMMITMENTBeing prepared to respond quickly and appropriately in the rare cases when something does go wrong is part of our commitment to the safety of the communities where we operate.
We are committed to operating as emergency response partners with our communities.
We plan to activate an effective, coordinated response to contain and control any incident in order to minimize harm to people, property, company operations and the environment.
APPROACHThrough alignment to TOMS, our Emergency Management Program provides a consistent and comprehensive approach to emergency preparedness and response within TransCanada and allows us to activate a quick and appropriate response to emergencies involving any of our assets.
Emergency preparednessBecause emergency preparedness is the foundation that supports our response, all head, regional and facilities offices as well as power facilities, gas storage facilities, compressor stations and metering stations—and any other areas deemed necessary—have site-specific Emergency Response Plans. These plans include procedures to ensure we carry out required notifications and response actions as efficiently and safely as possible.
A key element of our preparedness is training. We conduct emergency response simulations on a regular basis to allow our own personnel to work with local first responders and to hone our skills and develop communications protocols in the unlikely event of a serious incident.
Building relationships and partnerships with local first responders, communities and industry members is another important part of our approach. We work collaboratively with emergency responders through face-to-face meetings and invitations to participate in exercises and training. In addition, the Mutual Emergency Assistance Agreement (MEAA)—which was signed by all member companies of CEPA—provides a mechanism for CEPA members to request assistance from one another in the event of an emergency.
For more information about our Emergency Response Plans or to request a copy of our Emergency Management Corporate Program Manual, please visit our website.
Emergency responseIn an emergency, local field staff will handle direct response activities, such as isolation of the emergency, containment and control, co-ordination of response activities and restoration of service.
We use the Incident Command System (ICS)—an internationally recognized and standardized on-scene, all-hazard incident management system—to manage the emergency response process. The ICS allows us to adopt a flexible and integrated organizational structure to work jointly with public safety agencies, emergency services responders, regulators and other stakeholders in a manner appropriate to the severity of the incident.
For incidents involving a release, we have a number of systems in place to reduce the impact on the environment and communities:
• For liquids pipelines, if an abnormal condition is detected, our Supervisory Control and Data Acquisition (SCADA) system will immediately alert OCC operators to shut down operations along the pipeline, isolating the product in the pipe and limiting potential impacts.
• For gas pipelines, valves spaced at intervals along pipelines are used to stop the flow of gas and allow incidents to be quickly and effectively isolated. If pipeline pressure drops due to a leak, the valves automatically stop the flow of gas. Valves can also be manually closed.
We will not restart the pipeline until the issue has been identified and resolved and it is safe to do so.
TRANSCANADA MAP
TABLE OF CONTENTS
CEO’S MESSAGE
WHO WE ARE
ABOUT THIS REPORT
WHAT CSR MEANS TO US
A HEALTHY AND SAFE ENVIRONMENT AND COMMUNITY
Integrity of pipelines and facilities
Emergency preparedness and response
Health and safety of communities, employees and contractors
Climate change and greenhouse gas emissions
AN ENGAGED COMMUNITY
A THRIVING ECONOMY
CAUTIONARY NOTE
APPENDIX
GLOBAL REPORTING INITIATIVE G4 INDEX
GLOSSARY

TRANSCANADA CSR REPORT 2016
PAGE 31
A HEALTHY AND SAFE ENVIRONMENT AND COMMUNITY > EMERGENCY PREPAREDNESS AND RESPONSE
Emergency preparedness and response (continued)
Our Emergency Operations Centres (EOCs) are designed and equipped to support all personnel and activities at the scene through communications, resource deployment and technical expertise. Our Community Information Centres (CICs) serve as an outreach hub for keeping communities informed during incidents. Built on best practices, our CIC process quickly mobilizes teams to engage with all stakeholders in an impacted community.
Continuous improvement and performance measurementTo ensure that our planning and response remain appropriate for changing business and community conditions and to enable ongoing continuous improvement, we review ERPs on an annual basis and document and test our system through annual exercises involving both our employees and the community. Emergency event analyses are completed and updated if there is a significant change in the business practices or facilities.
We measure the effectiveness of our approach by the number of emergency preparedness and response training exercises provided to our employees and by internal indicators, such as emergency response time.
No significant adjustments to our emergency preparedness approach and response were identified for the 2016 reporting period.
PERFORMANCEIn 2016, we experienced one emergency response incident related to a spill on our Keystone pipeline. While the incident resulted in the release of 400 bbl of crude oil, it did not involve any injuries or pose a significant environmental impact or threat to public safety.
For further details about our response to this spill, please refer to the Integrity of pipelines—performance section.
INDICATOR: Emergency preparedness and response exercises
To prepare for emergencies before they happen, we conducted 117 emergency preparedness and response exercises in 2016, a slight decline from the 125 we conducted in 2015. This reduction was primarily attributable to administrative changes, including a change to operating region boundaries resulting in the elimination of an operating region.
Emergency preparedness and response exercises
2012
2013
2014
2015
2016
Total exercises completed (#) 96 104 113 125 117
Annual field exercises 18 23 22 22 22
Equipment deployment exercises 10 10 10 10 10
Field tabletop exercises1 62 66 61 67 64
Calgary and Houston support department tabletop exercises
6
5
19
26
21
Note: This indicator is inclusive of all TransCanada assets where TransCanada has majority operating control, with the exception of the CPG assets.
1 See the Glossary for the definition.
INDICATOR: Emergency preparedness and response training completions
As per regulatory requirements, personnel exposed to hazardous substances and engaged in cleanup, treatment, storage and disposal of hazardous waste must participate in specific training activities. In 2016, 404 personnel completed hazardous waste operations and emergency response (HAZWOPER) training. In addition, 2,537 TransCanada employees completed best practice training on our Incident Command System.
Emergency preparedness and response training
2012
2013
2014
2015
2016
Regulatory training (HAZWOPER)1 439 547 532 446 404
Best practice training on Incident Command System1
1,144
1,559
2,576
2,364
2,537
Note: This indicator is inclusive of all TransCanada assets where TransCanada has majority operating control, with the exception of the CPG assets.
1 See the Glossary for the definition.
TRANSCANADA MAP
TABLE OF CONTENTS
CEO’S MESSAGE
WHO WE ARE
ABOUT THIS REPORT
WHAT CSR MEANS TO US
A HEALTHY AND SAFE ENVIRONMENT AND COMMUNITY
Integrity of pipelines and facilities
Emergency preparedness and response
Health and safety of communities, employees and contractors
Climate change and greenhouse gas emissions
AN ENGAGED COMMUNITY
A THRIVING ECONOMY
CAUTIONARY NOTE
APPENDIX
GLOBAL REPORTING INITIATIVE G4 INDEX
GLOSSARY

TRANSCANADA CSR REPORT 2016
PAGE 32
A HEALTHY AND SAFE ENVIRONMENT AND COMMUNITY > HEALTH AND SAFETY OF COMMUNITIES, EMPLOYEES AND CONTRACTORS
Health and safety of communities, employees and contractorsOur promotion and implementation of a culture and actions that prevent safety incidents that impact people.
OPERATING CONTEXTOur top priority is the safety of our workers and of those who live in the communities where we operate.
While pipelines are the safest method of transporting natural gas and liquids, worker and community safety concerns include the risks associated with leaks, spills and explosions. Motor vehicle incidents and working with heavy equipment are among the most significant hazards for our employees and contractors.
Being a good neighbour means being a safe neighbour, which is why safety considerations factor into everything we do.
COMMITMENTWe are committed to ensuring that our facilities operate safely every day and that the health and safety of people is protected in the unlikely event of an incident involving our assets.
Key to making health, safety and environmental protection a top-of-mind and around-the-clock concern is our commitment to foster a robust and positive safety culture, along with effective processes and systems. By reinforcing a disciplined set of rules and providing rigorous training, we approach every day with our goal of a zero-incident workplace.
To learn more, download our Health, Safety and Environment Commitment Statement.
APPROACHOur approach to operating our pipelines and other facilities safely and reliably is guided by our safety value—which we adopted as the first of our four corporate values in 2016.
Through alignment to TOMS, our Safety Management Program sets expectations, identifies specific roles and responsibilities, and outlines the processes and procedures that enable our employees to work safely and deliver business results in a manner that protects the public.
These expectations are reinforced through our safety culture, which is the continual modelling and reinforcement of safety through our behaviours and actions. Our Safety 24–7 program encourages employees to continue to foster this culture away from work by sharing about off-the-job incidents, supporting extended family safety training and providing information on a range of safety topics.
To prevent incidents, we empower all TransCanada employees to carry out their work in a safe and effective manner. Our Life Saving Rules, which we implemented in 2016, states nine rules to control our highest safety hazards and ensure the safety of our employees, contractors and stakeholders. All personnel must adhere to the rules and failure to comply may result in disciplinary action.
Employees are trained in hazardous material handling, first aid/CPR, fire and driver training, and other training and certifications demanded by specific jobs. All employees can report Safety Hazard Awareness Reporting Events (SHARE)—which are proactive incident or issue notifications that focus on Safety 24–7, safe acts and safe observations via our Incident Management Program.
Our Contractor Safety Management Program ensures that we do business only with organizations that share our values and commitment to maintaining a safe workplace and reducing occupational injuries and illnesses.
Learn more about our Life Saving Rules on our website.
Continuous improvement and performance measurementIn the event of any health or safety incident, we conduct incident response, notification, investigation, documentation and follow-up, and share learnings. These are completed in a uniform, thorough and timely manner and in accordance with our Incident Management Program to promote continuous improvement and to help prevent recurrence.
To measure our performance, we track industry standard safety performance indicators as well as incidents that have a high potential to injure personnel.
No significant adjustments to our approach to managing the health and safety of people were identified for the 2016 reporting period.
In 2016, we received the following recognition for our work toward developing and demonstrating a culture of safety:
• Our Grand Rapids Pipeline Project received the 2016 Occupational Health and Safety Award from the Sherwood Park Chamber of Commerce in Alberta.
• TransCanada won the American Gas Association award for lowest injury rate among transmission operators for the third consecutive year.
TRANSCANADA MAP
TABLE OF CONTENTS
CEO’S MESSAGE
WHO WE ARE
ABOUT THIS REPORT
WHAT CSR MEANS TO US
A HEALTHY AND SAFE ENVIRONMENT AND COMMUNITY
Integrity of pipelines and facilities
Emergency preparedness and response
Health and safety of communities, employees and contractors
Climate change and greenhouse gas emissions
AN ENGAGED COMMUNITY
A THRIVING ECONOMY
CAUTIONARY NOTE
APPENDIX
GLOBAL REPORTING INITIATIVE G4 INDEX
GLOSSARY

TRANSCANADA CSR REPORT 2016
PAGE 33
A HEALTHY AND SAFE ENVIRONMENT AND COMMUNITY > HEALTH AND SAFETY OF COMMUNITIES, EMPLOYEES AND CONTRACTORS
Health and safety of communities, employees and contractors (continued)
PERFORMANCE
INDICATOR: Type of injury and rates of injury, occupational disease, lost days and absenteeism, and total number of work-related fatalities (G4-LA6)
While we strive for top-quartile performance as a minimum, our ultimate goal is zero incidents at our facilities and ensuring everyone makes it home safely every day. In 2016 we did not achieve the tough standards we set for ourselves.
In March 2016 we experienced the tragic fatality of a contractor at one of our worksites. This is unacceptable and we have increased our already significant efforts to work with our contractors to ensure the safety of their workers at our sites.
Our recordable case rates and high potential incident rates for employees increased in 2016. These increases are in part due to an overall increase in the number of incidents in addition to a reduction in total number of hours worked in 2016 compared to previous years. Substantially more mileage was recorded for CPG operations in 2016, yet the total number of recordable vehicle incidents relative to the total kilometres travelled decreased.
Occupational health and safety 2012 2013 2014 2015 2016 Industry average1
Employees
Fatalities 0 0 0 0 0 –
Total recordable case rate2 0.62 0.57 0.59 0.61 0.90 1.04
Away from work case rate2 0.18 0.14 0.16 0.27 0.25 0.32
Vehicle incident frequency rate2 2.46 2.02 1.63 2.01 1.07 2.18
High potential incidents rate3 0.44 0.24 0.18 0.11 0.28 –
Contractors
Fatalities 0 04 –
Total recordable case rate 2.34 1.75 1.32 1.17 1.38 3.5
Away from work case rate 0.29 0.29 0.19 0.15 0.13 1.35
Vehicle incident frequency rate 2.77 2.70 2.51 3.01 2.52 –
High potential incidents rate 1.05 0.76 0.47 0.63 0.49 –
Note: This indicator is inclusive of all TransCanada assets where TransCanada has majority operating control, including CPG assets as of July 1, 2016, with the exception of vehicle incident frequency rates for contractors (which excludes CPG assets).
1 Industry averages are reported through a number of industry organizations and regulators. Reporting cycles are different for each source and metric and, as a result, industry averages are based on combined data for between 2013 and 2016. Sources used and data include:• Canadian Energy Pipeline Association—2014, 2015 and 2016• Canadian Gas Association—2014 and 2015• American Gas Association—2013, 2014 and 2015• Alberta Government and Construction Trade Services—2014• U.S. Bureau of Labor Statistics—2014
TransCanada’s 2016 data is thus not directly comparable to the industry average presented.
2 See the Glossary for the definition.
3 See the Glossary for the definition. Vehicle incidents involving animal strikes are not relevant to this indicator and have been removed from this data.
4 A prime contractor experienced a fatality while working on a TransCanada project. This is not considered a recordable incident for TransCanada.
TRANSCANADA MAP
TABLE OF CONTENTS
CEO’S MESSAGE
WHO WE ARE
ABOUT THIS REPORT
WHAT CSR MEANS TO US
A HEALTHY AND SAFE ENVIRONMENT AND COMMUNITY
Integrity of pipelines and facilities
Emergency preparedness and response
Health and safety of communities, employees and contractors
Climate change and greenhouse gas emissions
AN ENGAGED COMMUNITY
A THRIVING ECONOMY
CAUTIONARY NOTE
APPENDIX
GLOBAL REPORTING INITIATIVE G4 INDEX
GLOSSARY

TRANSCANADA CSR REPORT 2016
PAGE 34
A HEALTHY AND SAFE ENVIRONMENT AND COMMUNITY > CLIMATE CHANGE AND GREENHOUSE GAS EMISSIONS
Climate change and greenhouse gas emissionsOur ability to manage our GHG emissions and impact on climate.
OPERATING CONTEXTThe energy landscape is rapidly changing. New oil and natural gas technologies have increased energy supplies, spurred growth in jobs and economies and enhanced North American energy security. At the same time, growing concern about the impacts of GHG emissions is spurring technological innovation and increasing energy generation from low-carbon (i.e., natural gas) and emission-less (i.e., nuclear, wind and solar) sources.
As an energy infrastructure company, we understand our role in the energy system, including our own GHG emissions.
With regard to climate change issues in our business, stakeholders are focused on two key areas: the first is how we manage the GHG emissions generated by our facilities and assets. Our operations generate GHG emissions from the use of natural gas as a fuel source at our facilities, releases of methane gas and the infrequent use of backup generators. We also generate indirect emissions when we purchase energy connected to the electrical grid to power our facilities—such as compressor stations and pumping stations. In regions where we operate that have implemented carbon-pricing regulations, our natural gas pipeline emissions can have a financial impact on our business.
The second area of interest is how our pipelines—which transport carbon-based fuels—fit into the broader global efforts to address GHG emissions. While some argue that pipelines encourage fossil fuel use, independent studies—such as the Ontario Energy Board’s commissioned research on the Energy East Pipeline Project—suggest that pipelines do not have a significant impact on production or consumption levels.* Rather, pipelines are a safer, superior alternative to trains, trucks and tankers, modes of transportation that produce far greater GHGs.
Beyond our pipelines, we actively support the energy shift from coal-fired generation to cleaner energy sources including natural gas and nuclear. We have invested more than $5 billion in emission-less energy sources, accounting for 40 per cent of the power we produce (as of the end of 2016).
Through our programs and initiatives to manage our GHG emissions and develop a balanced energy portfolio, we are always working to reduce our carbon intensity and energy consumption to meet the growing demand for a lower-carbon future.
For further details about the impact of climate change on our business and financial performance, please refer to the Financial performance section.
Further details on the sources of our GHG emissions are available on our 2016 Corporate Social Responsibility Report Data Sheet.
COMMITMENTTransCanada is committed to the management of GHG emission issues across our operations.
As a founding partner in the U.S. Environmental Protection Agency’s Natural Gas STAR Methane Challenge Program, which was launched in 2016, we will implement an industry-leading best management practice across our operations within five years to address emission sources specified by the program.
Our commitment to transition to a balanced energy future includes investing in new pipeline infrastructure and reliable, low-carbon and emission-less energy sources and power generation.
We comply with all applicable laws concerning GHG emissions, including policy mechanisms—such as carbon pricing—that are becoming more commonplace where TransCanada operates.
We recognize the need for sensible public policy frameworks focused on managing emissions and will continue to engage in dialogue to help our industry to fully participate in the North American discussion on climate change.
We publicly document our responses to climate initiatives and voluntarily disclose our performance through the CDP (formerly called the Carbon Disclosure Project) and the Dow Jones Sustainability Index (DJSI) in addition to our annual CSR reporting.
TRANSCANADA MAP
TABLE OF CONTENTS
CEO’S MESSAGE
WHO WE ARE
ABOUT THIS REPORT
WHAT CSR MEANS TO US
A HEALTHY AND SAFE ENVIRONMENT AND COMMUNITY
Integrity of pipelines and facilities
Emergency preparedness and response
Health and safety of communities, employees and contractors
Climate change and greenhouse gas emissions
AN ENGAGED COMMUNITY
A THRIVING ECONOMY
CAUTIONARY NOTE
APPENDIX
GLOBAL REPORTING INITIATIVE G4 INDEX
GLOSSARY
* This report was originally issued with the following statement: “While some argue that pipelines encourage fossil fuel use, independent studies—such as the Ontario Energy Board’s research on the Energy East Pipeline Project— support the fact that pipelines do not have an impact on production or consumption levels.” This has since been amended.

TRANSCANADA CSR REPORT 2016
PAGE 35
Climate change and greenhouse gas emissions (continued)
APPROACHAn internal team made up of representatives from corporate functional groups and business units, and informed by input from external stakeholders, continuously reviews and refines our approach toward managing climate change risks and opportunities. The team provides updates to executives and the HSE Committee of the Board of Directors. Our president and CEO holds the highest level of responsibility for addressing these issues and accountability and responsibility cascades throughout the organization.
TOMS—our operational management system—includes the framework for capturing, organizing, documenting, monitoring and improving our environmental policies, programs and procedures. Integrated into TOMS is our Environment Program, which provides a systematic approach to regulatory compliance and the management of environmental risks, including those related to climate change.
Taking action to reduce emissionsOur work to improve the efficiency of our operations begins with investing in operational and process improvements and efficiencies that can lead to GHG emission reductions. Examples include:
• When conducting natural gas pipeline maintenance, whenever possible we use pull-down compressors that pump the natural gas into another section of pipeline, thereby reducing the amount of methane released into the atmosphere.
• We conduct hot tapping, a procedure that makes a new pipeline connection while the pipeline remains in service, avoiding product loss, methane emissions and disruption of service.
• Through waste-heat recovery units, we provide access to waste-heat power while a third party owns and operates the heat-recovery facilities.
Because technological innovation is critical to managing the complex and interrelated issues surrounding GHG emissions, we continuously seek promising new technologies that improve system and process efficiencies and help limit the release of emissions.
We work to prevent leaks and reduce fugitive methane gas emissions through our Pipeline Integrity Program. Our Fugitive Emissions Inspection and Leak Repair (FEILR) Program, in particular, identifies leaks on pipeline and compressor station components (such as valves), helping reduce releases of methane.
For more details on our approach to pipeline integrity, please refer to the Integrity of pipelines and facilities section.
Providing low-carbon and renewable energy Another important element of our approach is our existing and growing investment in low-carbon and emission-less energy to meet the growing consumer expectations for alternative sources of energy.
We continue to pursue additional opportunities for new power generation assets in our established market areas.
A HEALTHY AND SAFE ENVIRONMENT AND COMMUNITY > CLIMATE CHANGE AND GREENHOUSE GAS EMISSIONS
More than half of the power TransCanada generates comes from emission-less sources, including nuclear, solar and wind from the Cartier Wind facility (above). Click here to learn more.
TRANSCANADA MAP
TABLE OF CONTENTS
CEO’S MESSAGE
WHO WE ARE
ABOUT THIS REPORT
WHAT CSR MEANS TO US
A HEALTHY AND SAFE ENVIRONMENT AND COMMUNITY
Integrity of pipelines and facilities
Emergency preparedness and response
Health and safety of communities, employees and contractors
Climate change and greenhouse gas emissions
AN ENGAGED COMMUNITY
A THRIVING ECONOMY
CAUTIONARY NOTE
APPENDIX
GLOBAL REPORTING INITIATIVE G4 INDEX
GLOSSARY

TRANSCANADA CSR REPORT 2016
PAGE 36
Climate change and greenhouse gas emissions (continued)
Working with others on climate changeWe contribute to a unified North American response to climate change through memberships in organizations like CEPA, INGAA, the Canadian Gas Association (CGA) and the Canadian Electricity Association (CEA); engagement with government and stakeholder representatives on climate change policy developments; and funding research in response to climate change.
Our impact on climate and our efforts to reduce emissions is measured by our absolute direct and indirect emissions of CO
2e and the intensity of our GHG emissions. Our
contribution to the transition to low-carbon energy sources is measured by our investments in low-carbon and emission-less energy sources.
Continuous improvement and performance measurementWe have publicly documented our climate change-related activities for more than 20 years and have voluntarily reported to the CDP since 2006. In 2016, we received a B “management-level” score for our actions to disclose carbon emissions and our strategy to mitigate the business risks of climate change.
We also set absolute and intensity-based GHG emissions targets based on the following regulatory requirements in Alberta, Québec and certain states in the U.S. Northeast:
• Our Alberta natural gas pipeline facilities and energy assets are subject to Alberta’s Specified Gas Emitters Regulation (SGER). This regulation requires a 12 per cent annual intensity reduction applied to the average of that facility’s baseline emissions intensity. Options for meeting SGER targets include operational changes, payments, use of offsets and use of performance credits.
• In Québec and the U.S. Northeast where cap-and-trade programs are in place, we can employ a variety of operational and market mechanisms to obtain emission units, offset credits and credits for early reductions.
In all the jurisdictions where we operate in Canada, the U.S. and Mexico, we employ TransCanada’s operating procedures to inspect and repair pipeline leaks of GHG emissions, and we comply with regulatory requirements to track and report our emissions. Beginning with our operations in Canada, we are rolling out a new technology we developed to track our natural gas pipelines operations’ data for fugitive emissions at our pipeline valve sites, meter stations and compressor stations.
No significant adjustments to our approach to managing our impact on climate change were identified for the 2016 reporting period.
For further details on how we manage climate change risks and a complete list of industry initiatives we are involved in related to climate change, please refer to our 2016 CDP Report.
Please refer to the Financial performance section for details on climate change risks to our business and approach to managing climate change-related risks.
A HEALTHY AND SAFE ENVIRONMENT AND COMMUNITY > CLIMATE CHANGE AND GREENHOUSE GAS EMISSIONS
TRANSCANADA MAP
TABLE OF CONTENTS
CEO’S MESSAGE
WHO WE ARE
ABOUT THIS REPORT
WHAT CSR MEANS TO US
A HEALTHY AND SAFE ENVIRONMENT AND COMMUNITY
Integrity of pipelines and facilities
Emergency preparedness and response
Health and safety of communities, employees and contractors
Climate change and greenhouse gas emissions
AN ENGAGED COMMUNITY
A THRIVING ECONOMY
CAUTIONARY NOTE
APPENDIX
GLOBAL REPORTING INITIATIVE G4 INDEX
GLOSSARY

TRANSCANADA CSR REPORT 2016
PAGE 37
Climate change and greenhouse gas emissions (continued)
PERFORMANCE
INDICATOR: Direct greenhouse gas emissions (G4-EN15)
TransCanada assets subject to regulation are in full compliance. TransCanada’s direct emissions increased by 3.1 million tonnes of carbon dioxide equivalent (tCO2e) in 2016. While we
continue to achieve reductions in our emissions for specific assets, our business grew substantially this year with the addition of the CPG pipeline system and acquisition of Ironwood, a natural gas power facility that was sold in June 2017.
Greenhouse gas emissions 2012 2013 2014 2015 2016
Direct GHG emissions (tCO2e) 12,300,000 12,200,000 12,700,000 13,100,000 16,200,000
Natural gas pipelines 6,000,000 7,100,000 7,400,000 7,300,000 8,300,000
Liquids pipelines 0 0 0 0 0
Power 6,300,000 5,100,000 5,300,000 5,700,000 7,800,000
Transportation fuel – – – – 180,000
Note: TransCanada calculates its direct GHG emissions using a combination of methods required by various regulations in different jurisdictions. We report our emissions to British Columbia, Alberta, Ontario, Québec, Environment and Climate Change Canada, the U.S. Environmental Protection Agency (EPA), California, Oregon, Washington, the Regional Greenhouse Gas Initiative and Mexico’s Ministry of Environment and Natural Resources (SEMARNAT). These calculation methods can include direct measurement and emission factors in conjunction with operating conditions. Emissions are estimated for vented and fugitive emissions and based on assumptions about operations using experienced staff with direct operational knowledge, including, for example, estimated fuel consumption.
CO2, methane and nitrous oxide are included in Scope 1 emissions:
• CO2 emissions are calculated based on fuel gas measurements at pipeline and power generation facilities.
• Methane (CH4) emissions from pipelines are calculated using field reports for blowdowns and an extensive
in-house set of emission factors for calculating fugitive emissions. • Nitrous oxide (N
2O) is calculated based on engine-specific emission factors.
The global warming potentials for CO2, CH
4 and N
2O are based on the Intergovernmental Panel on Climate
Change (IPCC) assessments. An emission factor of 0.0086 for methane combustion at natural gas turbines is based on EPA AP 42, fifth edition.
Note: For 2012 data onward, TransCanada’s direct GHG emissions reporting boundary is based on an asset equity share. TransCanada does not track emissions based on an operational control boundary, and thus this information is omitted. However, our 2012 CDP Report, which disclosed 2011 data, used an operational control boundary.
This data includes: • Canada, the U.S. (including CPG assets as of July 1, 2016) and Mexico natural gas pipeline assets • power assets • transportation fuel associated with aviation and fleet vehicles
The following assets are excluded: • Oil and gas storage assets and liquids pipelines—both are below direct GHG regulatory reporting thresholds.
Emissions from pumping operations are low, as pumps are mainly electrically driven and, therefore, have no emissions for normal operation; however, auxiliary power units during power outages can generate some GHG emissions.
• TransGas Natural Gas Pipeline System—TransCanada holds an ownership interest in this pipeline. We do not have any plans to extend our voluntary reporting to this asset at this time and it is expected that the emissions from this pipeline would not be significant compared to our overall emissions profile.
CO2 emissions from biologically sequestered carbon are not relevant to TransCanada.
Numbers may not add up due to rounding. Values reported in previous TransCanada reports may differ from the above, as inputs may be updated after the date of publication of annual reports such as the CSR, and we regularly review reporting scopes and methodologies.
A HEALTHY AND SAFE ENVIRONMENT AND COMMUNITY > CLIMATE CHANGE AND GREENHOUSE GAS EMISSIONS
TRANSCANADA MAP
TABLE OF CONTENTS
CEO’S MESSAGE
WHO WE ARE
ABOUT THIS REPORT
WHAT CSR MEANS TO US
A HEALTHY AND SAFE ENVIRONMENT AND COMMUNITY
Integrity of pipelines and facilities
Emergency preparedness and response
Health and safety of communities, employees and contractors
Climate change and greenhouse gas emissions
AN ENGAGED COMMUNITY
A THRIVING ECONOMY
CAUTIONARY NOTE
APPENDIX
GLOBAL REPORTING INITIATIVE G4 INDEX
GLOSSARY

TRANSCANADA CSR REPORT 2016
PAGE 38
Climate change and greenhouse gas emissions (continued)
INDICATOR: Indirect greenhouse gas emissions (G4-EN16)
TransCanada’s indirect GHG emissions increased by 160,000 tCO2e in 2016 largely due to including Scope 2 emissions for our U.S. pipelines based on new electricity consumption data.
Further, electricity consumption increased across all pipeline systems in Canada and, most notably, on the Foothills Pipeline System in Alberta.
Greenhouse gas emissions 2012 2013 2014 2015 2016
Indirect GHG emissions (tCO2e) 220,000 190,000 190,000 190,000 350,000
Natural gas pipelines 210,000 190,000 190,000 190,000 350,000
Power 1,800 700 2,900 4,000 7,000
Total direct and indirect GHG emissions (tCO2e) 12,500,000 12,300,000 12,900,000 13,300,000 16,500,000
Natural gas pipelines 6,200,000 7,300,000 7,600,000 7,500,000 8,700,000
Power 6,300,000 5,100,000 5,300,000 5,700,000 7,800,000
Note: Scope 2 emissions are calculated based on accurate invoices for procured electric power. Assumptions include the completeness of the invoice process and grid average factors. We continue to develop processes and procedures to potentially collect emissions data from currently excluded sources to include them in the future.
Note: This data includes: • natural gas pipeline assets in Canada, the U.S. (including CPG assets as of July 1, 2016) and Mexico
• power assets in Canada
This data does not include: • utility consumption of natural gas pipeline assets in the U.S. • power assets in the U.S. • oil and gas storage assets and liquids pipelines in Canada, the U.S. and Mexico • TransGas Natural Gas Pipeline System in Colombia
Numbers may not add up due to rounding.Values reported in previous TransCanada reports may differ from the above, as inputs may be updated after the date of publication of annual reports such as the CSR, and we regularly review reporting scopes and methodologies.
A HEALTHY AND SAFE ENVIRONMENT AND COMMUNITY > CLIMATE CHANGE AND GREENHOUSE GAS EMISSIONS
TRANSCANADA MAP
TABLE OF CONTENTS
CEO’S MESSAGE
WHO WE ARE
ABOUT THIS REPORT
WHAT CSR MEANS TO US
A HEALTHY AND SAFE ENVIRONMENT AND COMMUNITY
Integrity of pipelines and facilities
Emergency preparedness and response
Health and safety of communities, employees and contractors
Climate change and greenhouse gas emissions
AN ENGAGED COMMUNITY
A THRIVING ECONOMY
CAUTIONARY NOTE
APPENDIX
GLOBAL REPORTING INITIATIVE G4 INDEX
GLOSSARY

TRANSCANADA CSR REPORT 2016
PAGE 39
Climate change and greenhouse gas emissions (continued)
INDICATOR: Greenhouse gas emissions intensity (G4-EN18)
To better align with CDP reporting requirements and increase visibility of our performance, we are reporting GHG intensity data by region for the first time. Year-over-year comparison on our regional performance will become available in future reports. We disclose our direct and indirect GHG emissions in this report under the G4-EN15 and G4-EN16 indicators.
Greenhouse gas emissions 2012 2013 2014 2015 2016
Natural gas pipelines emissions intensity (tCO2e/Bcf)1 540 500 520 560 –
U.S. – – – – 293
Canada – – – – 991
Mexico – – – – 136
Power generation emissions intensity (tCO2e/MWh)2 0.23 0.17 0.17 0.15 0.19
Note: For natural gas pipelines emissions intensity, the scope of this indicator changed in 2016. In previous years, TransCanada provided a single emissions intensity for all natural gas transmission pipeline assets. Going forward, emissions intensity will be provided based on business segment and, therefore, is not comparable to previous years.
The scope of the power generation emissions intensity remains unchanged over 2015.
Note: Emissions intensity is calculated based on Scope 1 and Scope 2 emissions, excluding heat products (for power generation emissions intensity).
For natural gas pipelines emissions intensity: This data includes: • natural gas pipeline assets in Canada, the U.S. (including CPG assets as of July 1, 2016) and Mexico
This data does not include: • oil and gas storage assets and liquids pipelines in Canada, the U.S. and Mexico • power facilities in Canada, the U.S. and Mexico
For power generation emissions intensity: This data includes: • all TransCanada power facilities
This data does not include: • liquids and natural gas pipeline assets in Canada, the U.S. and Mexico
1 The relationship between natural gas transmission pipeline GHG emissions and the volume of gas transported is complex. Comparisons of emissions intensities between natural gas transmission pipeline systems must consider the type of pipeline network and the service that it is providing.
2 Many of TransCanada’s electricity generating facilities also generate a heat product, which is not accounted for here. Therefore, the emissions intensity presented for this indicator is only partially representative of the company’s true emissions intensity.
Numbers may not add up due to rounding.Values reported in previous TransCanada reports may differ from the above, as inputs may be updated after the date of publication of annual reports such as the CSR, and we regularly review reporting scopes and methodologies.
A HEALTHY AND SAFE ENVIRONMENT AND COMMUNITY > CLIMATE CHANGE AND GREENHOUSE GAS EMISSIONS
TRANSCANADA MAP
TABLE OF CONTENTS
CEO’S MESSAGE
WHO WE ARE
ABOUT THIS REPORT
WHAT CSR MEANS TO US
A HEALTHY AND SAFE ENVIRONMENT AND COMMUNITY
Integrity of pipelines and facilities
Emergency preparedness and response
Health and safety of communities, employees and contractors
Climate change and greenhouse gas emissions
AN ENGAGED COMMUNITY
A THRIVING ECONOMY
CAUTIONARY NOTE
APPENDIX
GLOBAL REPORTING INITIATIVE G4 INDEX
GLOSSARY

TRANSCANADA CSR REPORT 2016
PAGE 40
Climate change and greenhouse gas emissions (continued)
INDICATOR: Total amount invested in renewable energy (G4-OG2 partial)
During 2016, TransCanada continued to invest in renewable energy. At the end of 2016, the value of our renewable energy portfolio totalled more than $935 million. This total includes our U.S. Northeast wind and hydro assets that were held for sale in 2016 and monetized in 2017.
INDICATOR: Percentage of power produced from emission-less sources
We have focused our low-carbon and emission-less energy portfolio on reliable sources of energy, including natural gas and nuclear. In 2016, we continued to deliver a balanced portfolio of energy, increasing the amount of power produced from emission-less sources by 8 per cent. This increase is primarily due to the role we played in 2016 to transition away from coal-fired electricity generation in Alberta and Ontario. During the year, we terminated all power purchase agreements for coal-fired generation and continued to make substantial upgrades to the Bruce Power nuclear facility.
Emission-less power 2012 2013 2014 2015 20161
Power produced from emission-less sources (%)
31
31
31
32
40
Power assets by fuel source (%)
Natural gas 34 34 34 36 37
Natural gas/oil 21 21 21 19 23
Coal 14 14 14 13 0
Nuclear 21 21 21 23 29
Hydro 5 5 5 4 5
Wind 4 4 4 4 5
Solar 1 1 1 1 1
Note: This indicator is inclusive of all TransCanada assets where TransCanada has majority operating control, including CPG assets as of July 1, 2016, and includes Northeastern Power assets held for sale in 2016.
1 TransCanada’s asset mix has changed in 2017 following the sale of Northeastern Power assets. This data is as of December 31, 2016.
A HEALTHY AND SAFE ENVIRONMENT AND COMMUNITY > CLIMATE CHANGE AND GREENHOUSE GAS EMISSIONS
In 2016, we also invested in an initiative that will better determine the condition of pipelines, aiding in lower energy consumption and higher efficiency of operations and ultimately reducing GHG emissions.
We continue to engage with policy-makers and industry peers. In 2016, we provided comments and participated in discussions about our business as it relates to the unified response to climate change.
In Canada, we provided comments on the Pan-Canadian Framework on Clean Growth and Climate Change and provided comments and participated in data-gathering activities for the Government of Canada’s outreach on its commitment to reduce methane emissions in the oil and gas sector. We also sponsored and were involved in a Conference Board of Canada study on Canadian GHG reductions.
In the U.S., we met with representatives of the U.S. Environmental Protection Agency (EPA) to discuss the agency’s developing policy related to reducing methane emissions for equipment at natural gas transmission compressor stations and storage.
TRANSCANADA MAP
TABLE OF CONTENTS
CEO’S MESSAGE
WHO WE ARE
ABOUT THIS REPORT
WHAT CSR MEANS TO US
A HEALTHY AND SAFE ENVIRONMENT AND COMMUNITY
Integrity of pipelines and facilities
Emergency preparedness and response
Health and safety of communities, employees and contractors
Climate change and greenhouse gas emissions
AN ENGAGED COMMUNITY
A THRIVING ECONOMY
CAUTIONARY NOTE
APPENDIX
GLOBAL REPORTING INITIATIVE G4 INDEX
GLOSSARY

TRANSCANADA CSR REPORT 2016
PAGE 41
AN ENGAGED COMMUNITY
An engaged community
TRANSCANADA MAP
TABLE OF CONTENTS
CEO’S MESSAGE
WHO WE ARE
ABOUT THIS REPORT
WHAT CSR MEANS TO US
A HEALTHY AND SAFE ENVIRONMENT AND COMMUNITY
AN ENGAGED COMMUNITY
Stakeholder and Indigenous engagement
Community investment, employee giving and volunteering
Employee attraction, retention and development
A THRIVING ECONOMY
CAUTIONARY NOTE
APPENDIX
GLOBAL REPORTING INITIATIVE G4 INDEX
GLOSSARY
Stanwood, Michigan

TRANSCANADA CSR REPORT 2016
PAGE 42
AN ENGAGED COMMUNITY > STAKEHOLDER AND INDIGENOUS ENGAGEMENT
Stakeholder and Indigenous engagementOur ability to foster mutual trust and respect through engagement and consultation with stakeholders and Indigenous groups where we propose projects and operate assets.
OPERATING CONTEXTMaking sure stakeholders and rights-holders, including landowners and Indigenous groups, are meaningfully engaged and respected is critical to TransCanada’s success. The strength of these relationships has a direct impact on our ability to competitively build and operate our assets. We recognize that our projects and activities have the potential to impact stakeholders and rights-holders and that some members of these groups are currently opposed to energy infrastructure development.
The legal landscape and regulatory requirements pertaining to the protection of Indigenous rights and interests are rapidly evolving, not only in the countries where we operate but also elsewhere internationally. We monitor these changes and developments to ensure that they are reflected in our approach to engagement and that Indigenous groups have a full understanding of a project so they can make their own determinations of potential project effects.
Building relationships with local communities, landowners and Indigenous groups helps us to understand our potential impacts on the community, mitigate adverse effects and seek opportunities for economic participation and community investments.
Engagement also supports our overarching goal to maintain the safety and integrity of our assets. Local stakeholders and Indigenous groups are important partners in preventing damage and reporting hazards and risks to pipelines, people and the environment.
Our stakeholders also include the scientific community, policy-makers, public interest groups and non-profit organizations with whom we engage on research, standards and initiatives that contribute to environmental stewardship and the well-being of communities where we operate.
By transparently sharing information and seeking input from stakeholders, landowners and Indigenous groups, we will be able to create better project plans for us, our rights-holders, stakeholders and all our communities and maintain positive relationships for the duration of our activities.
For an overview of TransCanada’s stakeholders, please refer to the What CSR means to us section.
COMMITMENTTransCanada’s core values of Safety, Integrity, Responsibility and Collaboration are the foundation for how we engage with stakeholders and Indigenous groups.
While we have strong relationships with thousands of communities and landowners, backed by generations of co-operation and trust, we are also committed to earning public confidence from those communities we haven’t worked with yet.
Our stakeholder engagement is guided by the following principles:
• We identify and consider the perspectives of our stakeholders.
• We are visible, present and approachable in the community.
• We recognize that diverse thoughts, opinions and experiences contribute to better decisions and outcomes.
We recognize the rights of Indigenous groups and their distinct relationship to the land, and we are committed to developing better project plans for rights-holders, stakeholders, communities and our business.
We are committed to listening closely to the needs of all our stakeholders, including our opponents, and responding with positive solutions that enable us to meet people’s energy needs in a manner that builds trust. We also acknowledge that building trust takes time and that, in some cases, we may not be able to meet all stakeholder expectations.
Our Stakeholder Engagement Commitment Statement, Health, Safety and Environment Commitment Statement, Aboriginal Relations Policy and Native American Relations Policy outline our promise to stakeholders and provide guiding principles that employees and contractors are expected to follow.
TRANSCANADA MAP
TABLE OF CONTENTS
CEO’S MESSAGE
WHO WE ARE
ABOUT THIS REPORT
WHAT CSR MEANS TO US
A HEALTHY AND SAFE ENVIRONMENT AND COMMUNITY
AN ENGAGED COMMUNITY
Stakeholder and Indigenous engagement
Community investment, employee giving and volunteering
Employee attraction, retention and development
A THRIVING ECONOMY
CAUTIONARY NOTE
APPENDIX
GLOBAL REPORTING INITIATIVE G4 INDEX
GLOSSARY

TRANSCANADA CSR REPORT 2016
PAGE 43
AN ENGAGED COMMUNITY > STAKEHOLDER AND INDIGENOUS ENGAGEMENT
Stakeholder and Indigenous engagement (continued)
APPROACHTransCanada requires community engagement through all phases of our assets’ life cycle, from project approval to decommissioning.
Our approach and engagement practices are informed by our Stakeholder Engagement Commitment Statement; Health, Safety and Environment Commitment Statement; Aboriginal Relations policy; Native American Relations policy; and our Indigenous Relations strategy.
These documents are publicly available on our website.
Our approach to engagement, from acquisition and new construction to ongoing maintenance and upgrades, is integrated into our Project Delivery Standard (PDS).
Prior to and during the project-approval process, we work to identify early on any potential environmental and socio-economic effects by hosting local open houses, conducting public presentations with affected stakeholders and having one-on-one discussions. Written materials and other forms of communication—including fact sheets, brochures, websites, email and toll-free telephone lines—supplement our in-person outreach.
Throughout the life of an asset, ongoing engagement efforts include helplines and online accounts, to enable landowners to reach TransCanada personnel 24 hours a day, as well as integrity initiatives—such as “call and click before you dig”—to educate and raise public awareness about pipelines. We also participate in industry groups and engage in policy discussions with regulators and government.
Engagement with Indigenous groupsTransCanada remains committed to engaging with Indigenous groups where our activities may affect their rights and interests. TransCanada strives to create enduring relationships with Indigenous groups based on mutual trust and respect beginning with our recognition of Indigenous peoples as rights-holders who have a distinct relationship to the land.
A key component of delivering on our commitment is to foster understanding within our company of Indigenous cultures, history and experience through cultural awareness programs and a robust governance structure.
The Indigenous relations program provides a consistent approach to the delivery of Indigenous relations (IR), which is fit-for-purpose and adaptable across geographies. Our Indigenous relations strategy guides the IR team’s work, which encompasses four elements: engaging communities, community legacy, people, and contracting and project participation.
TransCanada’s IR group identifies Indigenous communities potentially affected by proposed projects. The regulatory process—as well as our internal expertise, past projects in the region, asserted traditional territory, proximity to Indigenous communities, reservations or settlements, and declared interests or concerns—guides our identification of Indigenous groups.
TransCanada’s practice is to engage early in project development to work with Indigenous groups to develop a project engagement plan that may include cultural protocols and governance procedures unique to that community. These community-specific engagement plans inform project planning.
We create opportunities and provide resources to participate in the project regulatory process through activities, such as fieldwork and traditional land-use studies, to enable Indigenous groups to make their own determination of potential project effects. We seek the participation of Indigenous groups in the development of mitigation strategies for environmental, socio-economic and other potential effects.
Members of TransCanada’s Indigenous Relations team visit the Osage Nation in Oklahoma. In 2008, Osage became the first U.S. tribal group to partner with TransCanada as we began consultation on the Keystone Pipeline System. Since then, we have continued to collaborate on initiatives such as cultural preservation programs. Click here for the full story.
TRANSCANADA MAP
TABLE OF CONTENTS
CEO’S MESSAGE
WHO WE ARE
ABOUT THIS REPORT
WHAT CSR MEANS TO US
A HEALTHY AND SAFE ENVIRONMENT AND COMMUNITY
AN ENGAGED COMMUNITY
Stakeholder and Indigenous engagement
Community investment, employee giving and volunteering
Employee attraction, retention and development
A THRIVING ECONOMY
CAUTIONARY NOTE
APPENDIX
GLOBAL REPORTING INITIATIVE G4 INDEX
GLOSSARY

TRANSCANADA CSR REPORT 2016
PAGE 44
AN ENGAGED COMMUNITY > STAKEHOLDER AND INDIGENOUS ENGAGEMENT
Stakeholder and Indigenous engagement (continued)
TransCanada maintains a list of Indigenous groups and their proximity to TransCanada assets, which helps inform engagement and ongoing relationship building. When projects move to the operations phase, liaisons maintain relationships with Indigenous groups and carry out activities, including the delivery of community legacy and addressing issues or concerns as they arise. All our learnings on building relationships and understanding of perspectives and land-use activities are carried forward to inform engagement on projects and throughout our operations.
One way that TransCanada acknowledges the legal status of Indigenous groups and their unique relationship to the land is through entering into agreements. These agreements take many forms and reflect a number of considerations aimed at maintaining our commitments, formalizing engagement and establishing long-term relationships, while creating certainty for both parties. Agreements are kept confidential as part of our commitment to maintaining trust.
We work with Indigenous groups to develop employment and training programs, including project-specific plans for economic participation. Our Indigenous Relations Business Engagement (IRBE) program strives to engage with a group’s leaders, members and Indigenous businesses to develop an understanding of local skill sets, capacities and qualifications to provide contracting support for our projects. This understanding allows us to work with our facilities’ constructors to facilitate contracting with Indigenous businesses. In recognition of the evolving landscape of Indigenous businesses in North America, TransCanada continuously reviews and revises its Indigenous Relations Business Engagement practices. This helps to support projects’ economic contribution to Indigenous groups and provides high-quality contracting services to our projects. These continuous improvements will also make the IRBE program fit-for-purpose as we implement it across our asset footprint.
To contribute to a legacy of sustainable, healthy and vibrant communities, our engagement team plays an important role in delivering our community legacy work with Indigenous groups. The key to our community legacy investment is that the Indigenous community identifies the needs first, and they lead the delivery of those initiatives on the ground.
Please visit our website for more information about how TransCanada engages Indigenous communities and to view TransCanada’s asset map.
Continuous improvement and performance measurementTo enable continuous improvement, we document lessons learned from engagement activities and share these learnings with project teams and operations staff.
We measure the effectiveness of our engagement approach by tracking and responding to all the issues and concerns raised by stakeholder groups and Indigenous groups with which we engage. We measure our level of stakeholder engagement by recording the number of meetings attended and the number of new projects partnered on. To better understand the effectiveness of our Indigenous Relations strategy and demonstrate our commitment to transparency, we tracked our engagement during the year with Indigenous groups in Canada, the U.S. and Mexico, and we are reporting our engagement numbers for the first time.
For the first time this year, we are also reporting data on stakeholder engagement conducted through our community relations group. As we continuously improve our reporting processes, we intend to report the full scope of stakeholder engagement activities conducted, including engagement conducted by our project and land teams.
No significant adjustments to our approach to managing stakeholder and Indigenous engagement were identified for the 2016 reporting period.
PERFORMANCE
INDICATOR: Percentage of operations with implemented local community engagement, impact assessments and development programs (G4-SO1)
We develop community engagement plans for 100 per cent of our projects and all operating regions have personnel dedicated to engagement and the ongoing management of issues. We also conduct impact assessments for all projects requiring regulatory approval in Canada, the U.S and Mexico. These assessments involve local community engagement, which is complemented by ongoing community engagement activities conducted by our community relations group.
TRANSCANADA MAP
TABLE OF CONTENTS
CEO’S MESSAGE
WHO WE ARE
ABOUT THIS REPORT
WHAT CSR MEANS TO US
A HEALTHY AND SAFE ENVIRONMENT AND COMMUNITY
AN ENGAGED COMMUNITY
Stakeholder and Indigenous engagement
Community investment, employee giving and volunteering
Employee attraction, retention and development
A THRIVING ECONOMY
CAUTIONARY NOTE
APPENDIX
GLOBAL REPORTING INITIATIVE G4 INDEX
GLOSSARY

TRANSCANADA CSR REPORT 2016
PAGE 45
AN ENGAGED COMMUNITY > STAKEHOLDER AND INDIGENOUS ENGAGEMENT
Stakeholder and Indigenous engagement (continued)
INDICATOR: Operations where Indigenous communities are present or affected by activities and where specific engagement strategies are in place (G4-OG9)
Indigenous groups are present where TransCanada operates in Canada, the U.S. and Mexico. Our natural gas and liquids pipeline assets are the operations in closest proximity to Indigenous groups.
In 2016, we improved the tracking of our engagement activities with Indigenous groups and are reporting these figures for the first time. We conducted extensive engagement with Indigenous groups in Canada, the U.S. and Mexico. In total, we engaged with 504 groups over the course of the year, including 2,098 recorded meetings and 39 projects.*
We received no human rights complaints involving Indigenous groups in 2016.
* TransCanada has not disclosed a complete list of company operations taking place in/adjacent to Indigenous groups’ communities and does not share the details of formal plans and agreements, as we value the importance of confidentiality in respect to the Indigenous groups we work with.
Engagement with Indigenous groups 2016
Indigenous groups in Canada1
Number of groups 273
Number of recorded meetings 1,301
Indigenous groups in the U.S.
Number of groups 35
Number of recorded meetings 64
Indigenous groups in Mexico
Number of groups 196
Number of recorded meetings 733
Note: This indicator is inclusive of all TransCanada operations and assets, with the exception of CPG assets.1 Includes First Nations, Métis groups, First Nations organizations and Métis organizations.
INDICATOR: Community relations engagement with TransCanada stakeholders
In 2016, we conducted extensive stakeholder engagement on all of our capital projects, largely by our community relations team but also by other groups, including personnel in our land, environment, government relations and Indigenous relations departments. We also conducted ongoing issue management, public awareness and community engagement through our field community relations staff. These activities complement the engagement conducted during project regulatory approval processes.
We conduct extensive state and local stakeholder and community engagement in the U.S., with our engagement in 2016 spanning 32 states and nearly 600 counties. With the acquisition of CPG, integration of our stakeholder engagement philosophy and activities in the U.S. continued through 2016 and remains ongoing. As part of this integration, we continue to enhance our performance tracking in the U.S. and will work to present a breakdown of U.S. performance data in future reports.
Community relations engagement with stakeholders 20161,2
Canada
Number of stakeholder groups 675
Number of in-person engagement activities 600
Mexico
Number of communities 190
Number of in-person engagement activities 730
Scope: Data presented is an approximate total by project and is based on activities conducted by the community relations group.
This data is not wholly reflective of all TransCanada stakeholder engagement activities conducted in 2016. Additional stakeholder engagement activities are conducted by other TransCanada groups. In addition, data for stakeholder engagement activities conducted by community relations teams in the U.S. was not available for this reporting period.
Note: This indicator is inclusive of all TransCanada operations and assets in Mexico and Canada.1 Numbers are approximate and illustrative, as communities and stakeholders engaged across multiple projects may be
counted more than once. We are currently working to improve our processes for recording and reporting our stakeholder engagement activities for future reporting years.
2 Data includes “in person” or “face-to-face engagement”, such as open houses, meetings, presentations, tours and emergency response engagement. Conference calls are not included.
TRANSCANADA MAP
TABLE OF CONTENTS
CEO’S MESSAGE
WHO WE ARE
ABOUT THIS REPORT
WHAT CSR MEANS TO US
A HEALTHY AND SAFE ENVIRONMENT AND COMMUNITY
AN ENGAGED COMMUNITY
Stakeholder and Indigenous engagement
Community investment, employee giving and volunteering
Employee attraction, retention and development
A THRIVING ECONOMY
CAUTIONARY NOTE
APPENDIX
GLOBAL REPORTING INITIATIVE G4 INDEX
GLOSSARY

TRANSCANADA CSR REPORT 2016
PAGE 46
AN ENGAGED COMMUNITY > COMMUNITY INVESTMENT, EMPLOYEE GIVING AND VOLUNTEERING
Community investment, employee giving and volunteeringOur ability to demonstrate the value of our presence in the communities where we live and work and to support and encourage our employees to give back to their communities in ways that resonate with them personally.
OPERATING CONTEXTWith operations spanning Canada, the U.S. and Mexico, investing in and giving back to the communities where we operate are important parts of being an employer of choice, a good neighbour and a trusted community partner.
Community investments also support our efforts to prevent and mitigate potential adverse environmental and social impacts caused by our operations. Investments—particularly ones that are well designed and align with both our business and communities’ needs—help build long-term relationships based on trust and contribute to strong and vibrant communities across North America.
COMMITMENTWe focus our community investment efforts on our commitment to the safety and well-being of communities, building strong and vibrant communities and protecting and enhancing the environment.
APPROACHOur Community Investment Program and Empower—our employee giving and volunteering program—guide our approach to helping support local communities.
Community investmentsBecause the needs and priorities of any community are best determined by those who live and work within it, our local staff members play a large role in implementing our Community Investment Program.
We define community investment as a voluntary contribution on behalf of the company in support of a not-for-profit registered charity or social enterprise that generates clear and demonstrable value to the communities where we live and work.
We concentrate our efforts on the following three areas that are most aligned with the interests of the communities where we operate and our business:
• Safety – We fund initiatives that enable emergency personnel to respond quickly and effectively to local needs and focus on emergency preparedness, accident prevention and education, and training.
• Community – We support organizations that bring communities together, develop leadership and engage citizens.
• Environment – We work with national and local organizations to conserve important habitats, protect species at risk and educate individuals about the importance of the environment.
Employee giving and volunteeringOur Empower program supports and encourages our employees and contractors to give back to their communities by matching charitable donations, matching volunteer time with financial contributions, providing volunteer opportunities, and supporting team volunteering and fundraising. We also have an annual campaign called “Get Empowered” that encourages employees and in-house contractors across the company to give and volunteer.
Continuous improvement and performance measurementEach year, we participate in a detailed, line-by-line third-party audit of our entire community investment portfolio. The results enable TransCanada and external stakeholders to be confident that reported figures are accurate while also benchmarking against peers.
No significant adjustments to our approach to managing community investment and employee giving were identified for the 2016 reporting period.
PERFORMANCEFor a list of organizations we partner with, please visit our website.
Please visit TransCanada’s Community page for examples of our giving and volunteering program, Empower, in action.
TRANSCANADA MAP
TABLE OF CONTENTS
CEO’S MESSAGE
WHO WE ARE
ABOUT THIS REPORT
WHAT CSR MEANS TO US
A HEALTHY AND SAFE ENVIRONMENT AND COMMUNITY
AN ENGAGED COMMUNITY
Stakeholder and Indigenous engagement
Community investment, employee giving and volunteering
Employee attraction, retention and development
A THRIVING ECONOMY
CAUTIONARY NOTE
APPENDIX
GLOBAL REPORTING INITIATIVE G4 INDEX
GLOSSARY

TRANSCANADA CSR REPORT 2016
PAGE 47
AN ENGAGED COMMUNITY > COMMUNITY INVESTMENT, EMPLOYEE GIVING AND VOLUNTEERING
Community investment, employee giving and volunteering (continued)
INDICATOR: Direct economic value generated and distributed—community investments (G4-EC1)
TransCanada’s direct community investments in 2016 totalled more than $16 million—our largest annual investment amount ever.
We improved our coding procedures to better classify our investments, and learned that the percentage of social investments increased and philanthropic investments decreased.
Our investments as a percentage of total revenue decreased in 2016, in part due to an overall increase in total revenue from 2015.
Community investment1 (millions of dollars unless otherwise indicated) 2012 2013 2014 2015 2016
Community investment—direct only $11.8 $12.7 $14.6 $14.7 $16.6
Investments by motivation (as a percentage of total portfolio)
Social investments2 – – – 39 48
Commercial investments2 – – – 11 12
Philanthropic investments2 – – – 50 40
In-kind giving2 – – – $0.34 $0.14
Community investment, including funds leveraged through outside sources3 $13.4 $14.7 $20.6 $20.4 $21.9
(As a percentage of total revenue (%)) – 14 14 15 13
Note: This indicator is inclusive of all TransCanada operations and assets, with the exception of CPG assets.1 As part of our membership with the London Benchmarking Group, this performance data has been assured by an external third party. 2 See the Glossary for the definition.3 This figure takes into consideration contributions to community projects that can be directly linked to TransCanada’s involvement (but are not included
in the investment cost), including additional investment generated from other companies, governments and TransCanada employees.
TRANSCANADA MAP
TABLE OF CONTENTS
CEO’S MESSAGE
WHO WE ARE
ABOUT THIS REPORT
WHAT CSR MEANS TO US
A HEALTHY AND SAFE ENVIRONMENT AND COMMUNITY
AN ENGAGED COMMUNITY
Stakeholder and Indigenous engagement
Community investment, employee giving and volunteering
Employee attraction, retention and development
A THRIVING ECONOMY
CAUTIONARY NOTE
APPENDIX
GLOBAL REPORTING INITIATIVE G4 INDEX
GLOSSARY

TRANSCANADA CSR REPORT 2016
PAGE 48
AN ENGAGED COMMUNITY > COMMUNITY INVESTMENT, EMPLOYEE GIVING AND VOLUNTEERING
Community investment, employee giving and volunteering (continued)
INDICATOR: Employee giving and volunteering
In 2016, TransCanada employees and contractors—combined with the company’s matching contribution—donated $2.8 million to charities across North America to support the communities where they live and work. Our matching contribution represents a 12 per cent increase from 2015. Our employees and contractors also logged 25 per cent more volunteer hours in 2016 compared to 2015.
Contributions to the year-over-year increase include the launch of Empower—our online platform for giving and volunteering—in Mexico, as well as an increase in overall giving and volunteering due to the growing adoption of Empower by employees and contractors company-wide. Natural disasters close to the communities where our people live and work—such as the Fort McMurray fire in Alberta and flooding in the U.S.—also mobilized significant volunteering and giving across TransCanada.
Employee giving and volunteering (millions of dollars unless otherwise indicated)
2012
2013
2014
2015
2016
Employee and contractor donations – – – $0.76 $0.77
Company donations matching employee and contractor donations – – – $1.81 $2.03
Volunteer hours logged by employees and contractors (# of hours) – 6,801 11,553 9,151 11,452
During non-paid time (#) – – – 7,531 8,666
During paid time (#) – – – 1,620 2,786
Value of volunteer hours during paid work time (in actual dollars) – – – $76,228 $131,089
Note: This indicator is inclusive of all TransCanada operations and assets, with the exception of CPG assets.
In the fall of 2016, employees from TransCanada and Columbia Pipeline Group came together, in some cases meeting each other for the first time, in Houston to build houses for Habitat for Humanity. Click here for the full story.
TRANSCANADA MAP
TABLE OF CONTENTS
CEO’S MESSAGE
WHO WE ARE
ABOUT THIS REPORT
WHAT CSR MEANS TO US
A HEALTHY AND SAFE ENVIRONMENT AND COMMUNITY
AN ENGAGED COMMUNITY
Stakeholder and Indigenous engagement
Community investment, employee giving and volunteering
Employee attraction, retention and development
A THRIVING ECONOMY
CAUTIONARY NOTE
APPENDIX
GLOBAL REPORTING INITIATIVE G4 INDEX
GLOSSARY
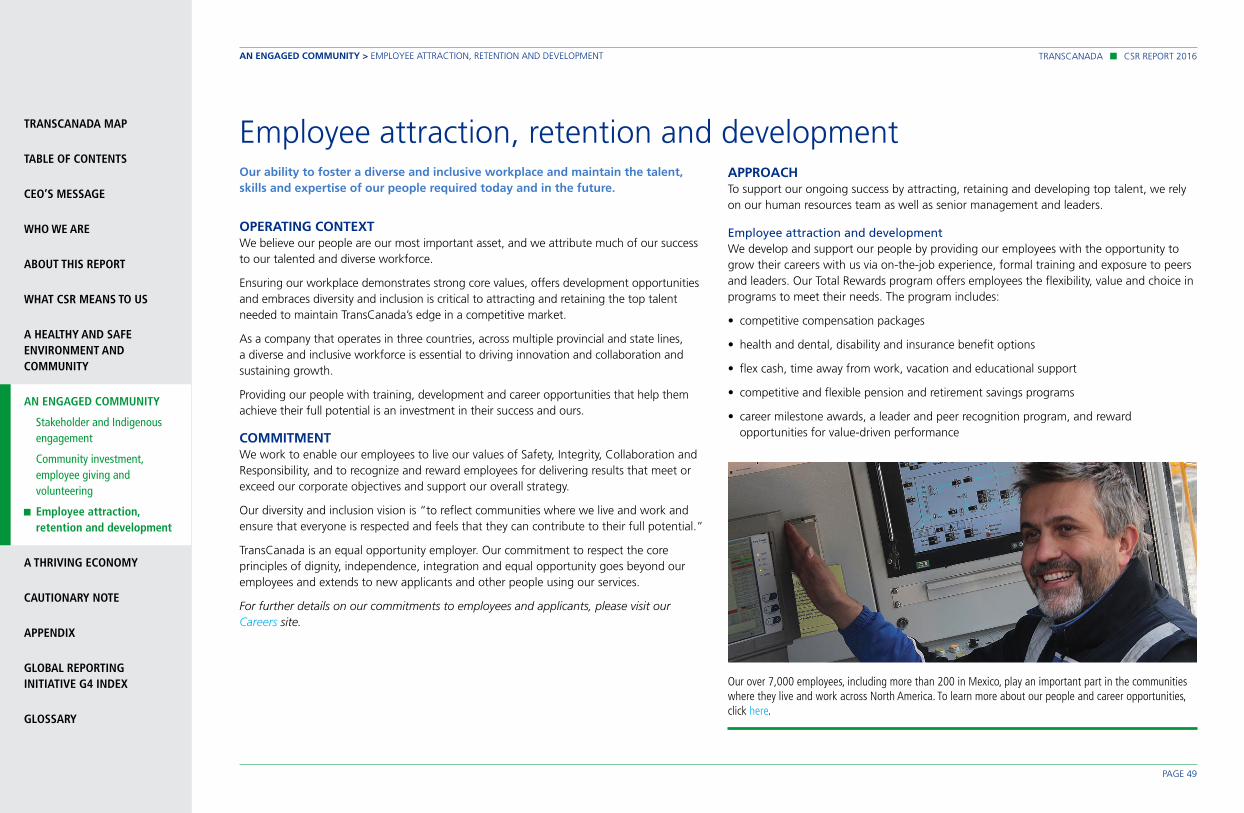
TRANSCANADA CSR REPORT 2016
PAGE 49
AN ENGAGED COMMUNITY > EMPLOYEE ATTRACTION, RETENTION AND DEVELOPMENT
Employee attraction, retention and developmentOur ability to foster a diverse and inclusive workplace and maintain the talent, skills and expertise of our people required today and in the future.
OPERATING CONTEXTWe believe our people are our most important asset, and we attribute much of our success to our talented and diverse workforce.
Ensuring our workplace demonstrates strong core values, offers development opportunities and embraces diversity and inclusion is critical to attracting and retaining the top talent needed to maintain TransCanada’s edge in a competitive market.
As a company that operates in three countries, across multiple provincial and state lines, a diverse and inclusive workforce is essential to driving innovation and collaboration and sustaining growth.
Providing our people with training, development and career opportunities that help them achieve their full potential is an investment in their success and ours.
COMMITMENTWe work to enable our employees to live our values of Safety, Integrity, Collaboration and Responsibility, and to recognize and reward employees for delivering results that meet or exceed our corporate objectives and support our overall strategy.
Our diversity and inclusion vision is “to reflect communities where we live and work and ensure that everyone is respected and feels that they can contribute to their full potential.”
TransCanada is an equal opportunity employer. Our commitment to respect the core principles of dignity, independence, integration and equal opportunity goes beyond our employees and extends to new applicants and other people using our services.
For further details on our commitments to employees and applicants, please visit our Careers site.
APPROACHTo support our ongoing success by attracting, retaining and developing top talent, we rely on our human resources team as well as senior management and leaders.
Employee attraction and developmentWe develop and support our people by providing our employees with the opportunity to grow their careers with us via on-the-job experience, formal training and exposure to peers and leaders. Our Total Rewards program offers employees the flexibility, value and choice in programs to meet their needs. The program includes:
• competitive compensation packages
• health and dental, disability and insurance benefit options
• flex cash, time away from work, vacation and educational support
• competitive and flexible pension and retirement savings programs
• career milestone awards, a leader and peer recognition program, and reward opportunities for value-driven performance
TRANSCANADA MAP
TABLE OF CONTENTS
CEO’S MESSAGE
WHO WE ARE
ABOUT THIS REPORT
WHAT CSR MEANS TO US
A HEALTHY AND SAFE ENVIRONMENT AND COMMUNITY
AN ENGAGED COMMUNITY
Stakeholder and Indigenous engagement
Community investment, employee giving and volunteering
Employee attraction, retention and development
A THRIVING ECONOMY
CAUTIONARY NOTE
APPENDIX
GLOBAL REPORTING INITIATIVE G4 INDEX
GLOSSARY
Our over 7,000 employees, including more than 200 in Mexico, play an important part in the communities where they live and work across North America. To learn more about our people and career opportunities, click here.

TRANSCANADA CSR REPORT 2016
PAGE 50
AN ENGAGED COMMUNITY > EMPLOYEE ATTRACTION, RETENTION AND DEVELOPMENT
Employee attraction, retention and development (continued)
Diversity and inclusionTo attract the most diverse range of candidates, in 2014 we developed our 2014–2016 Diversity and Inclusion Strategic Plan. This strategy adopts the Canadian Human Rights Commission’s Human Rights Maturity Model (HRMM). While the HRMM is a Canadian model, the framework is grounded in fundamental human rights principles and, therefore, applies to all our locations, including the U.S. and Mexico.
Internally, our diversity and inclusion efforts are supported through diversity training that all new employees are required to complete within 30 days of starting on the job. We also support three employee resource groups (ERGs)—the Evolve, Indigenous and the Veteran’s Employee Resource Groups—that work to promote inclusion and provide advice to our management on diversity needs.
PERFORMANCE
INDICATOR: Total number and rates of new employee hires and employee turnover by age group, gender and region (G4-LA1)
TransCanada’s total number of employees increased significantly in 2016 due to the CPG acquisition.
Involuntary turnover rates decreased compared to 2015, but they remained above 2014 levels. Along with organizational changes associated with the CPG acquisition, the company continued a business restructuring and transformation initiative, which began in 2015, to reduce overall costs and maximize the effectiveness and efficiency of our existing operations. This work involves moving greater accountability for operations, capital spending and support services directly into our three lines of business. We continue to believe that placing greater control in the hands of those closest to assets will improve safety, availability, cost control and, ultimately, profitability. Additional work on this initiative will be completed in 2017.
For all staffing decisions, we aim to always be fair and respectful and to ensure that all employees have the opportunity to hear restructuring and transformation information from their leaders first and that they have the support and tools needed to help manage the transition.
Despite the changes and uncertainty associated with the acquisition and initiative, employee retention improved in 2016 compared to 2015, with a decrease in the voluntary turnover rate.
Employee hires and turnover 2012 2013 2014 2015 2016
New hire employees (#) 748 919 927 385 302
Canada 475 686 726 226 147
U.S. 215 195 154 125 117
Mexico 58 38 47 34 38
Employee total turnover rate (%) 4.9 5.5 7.5 17.4 11.6
Employee voluntary turnover rate (%)1 3.8 4.1 4.1 5.1 3.6
Employee involuntary turnover rate (%)2 1.1 1.4 3.4 12.3 8.0
Note: This indicator is inclusive of all TransCanada operations and assets from 2015 onward, including CPG assets as of July 1, 2016. Prior to 2015, employee turnover rates excluded Mexico.
1 Voluntary turnover includes employees who retired or resigned from employment at TransCanada or are deceased. 2 Involuntary turnover includes severances, discharges and layoffs.
TRANSCANADA MAP
TABLE OF CONTENTS
CEO’S MESSAGE
WHO WE ARE
ABOUT THIS REPORT
WHAT CSR MEANS TO US
A HEALTHY AND SAFE ENVIRONMENT AND COMMUNITY
AN ENGAGED COMMUNITY
Stakeholder and Indigenous engagement
Community investment, employee giving and volunteering
Employee attraction, retention and development
A THRIVING ECONOMY
CAUTIONARY NOTE
APPENDIX
GLOBAL REPORTING INITIATIVE G4 INDEX
GLOSSARY

TRANSCANADA CSR REPORT 2016
PAGE 51
A THRIVING ECONOMY
A thriving economy
TRANSCANADA MAP
TABLE OF CONTENTS
CEO’S MESSAGE
WHO WE ARE
ABOUT THIS REPORT
WHAT CSR MEANS TO US
A HEALTHY AND SAFE ENVIRONMENT AND COMMUNITY
AN ENGAGED COMMUNITY
A THRIVING ECONOMY
Financial performance
Economic benefits of development
Access to markets
CAUTIONARY NOTE
APPENDIX
GLOBAL REPORTING INITIATIVE G4 INDEX
GLOSSARY
Charleston, West Virginia

TRANSCANADA CSR REPORT 2016
PAGE 52
A THRIVING ECONOMY > FINANCIAL PERFORMANCE
Financial performanceOur ability to manage the long-term financial stability, competitiveness and return expected by our shareholders in consideration of business risks and opportunities.
OPERATING CONTEXTTransCanada’s vision is to be the leading energy infrastructure company in North America, focusing on pipeline and power generation opportunities in regions where we have or can develop a significant competitive advantage.
Achieving our vision requires the ability to prepare and adapt to the opportunities and challenges we face operating in an undeniably complex and changing energy environment.
These challenges include the growing global demand for energy, new climate change policies that are accelerating the transition to cleaner energy alternatives, and volatile oil and gas prices.
Our opportunities for continued success are fuelled by our visible growth portfolio, predictable and low-risk businesses, track record of delivering long-term shareholder value, industry-leading safety record, and demonstrated commitment to responsible development.
Of interest to our stakeholders is how climate change will impact our business and how we integrate the management of these risks and opportunities into our decision-making and long-term strategy.
COMMITMENTTransCanada will continue to build and enhance our competitive advantage by executing on the following elements of our strategy:
• maximize the full-life value of our infrastructure assets and commercial positions
• commercially develop and build new asset investment programs
• cultivate a focused portfolio of high-quality development and investment options
• maximize our strengths and core competencies in safety, operational excellence, supply chain management, project execution and stakeholder management
TransCanada integrates climate change risks and opportunities into our business strategy and considers regulatory developments, exposure of our assets to the physical climate and the influence of changing public opinion in our business planning. We also consider investments in low-carbon infrastructure as an element of our continued capital program.
We have provided a summary of our financial performance and implications of climate change risks and opportunities on our business in the following section. Please refer to our 2016 Annual Report for details on our commitments, management approach and performance with respect to economic value generated. Please refer to our 2016 CDP Report for details on our climate change commitments, management approach and performance with respect to the risks that climate change poses to our business. Please also refer to page 95 of our 2016 Annual Report for further information about GHG emissions regulation risks.
TRANSCANADA MAP
TABLE OF CONTENTS
CEO’S MESSAGE
WHO WE ARE
ABOUT THIS REPORT
WHAT CSR MEANS TO US
A HEALTHY AND SAFE ENVIRONMENT AND COMMUNITY
AN ENGAGED COMMUNITY
A THRIVING ECONOMY
Financial performance
Economic benefits of development
Access to markets
CAUTIONARY NOTE
APPENDIX
GLOBAL REPORTING INITIATIVE G4 INDEX
GLOSSARY

TRANSCANADA CSR REPORT 2016
PAGE 53
A THRIVING ECONOMY > FINANCIAL PERFORMANCE
Financial performance (continued)
PERFORMANCE
INDICATOR: Direct economic value generated (G4-EC1, partial)
TransCanada has effectively navigated the turbulent waters facing the energy industry over the last several years and has emerged a larger, stronger and more competitive enterprise as a result. The addition of CPG, along with the completion of several growth projects, has resulted in our asset base growing to $88 billion. TransCanada’s share price reached all-time highs, reflecting our strategic repositioning, unparalleled growth prospects and strong operational performance. Comparable earnings per share* increased by 12 per cent compared to 2015, while net cash provided by operations exceeded $5 billion for the first time in our history.
TransCanada’s total revenue in 2016 increased 10.6 per cent compared to 2015. Comparable earnings in 2016 were $353 million higher than in 2015.
Based on this sustainable growth, in February 2017 our Board of Directors approved our 17th consecutive annual increase in the common share dividend, increasing the annualized dividend from $2.26 to $2.50, an increase of 10.6 per cent. Shareholders have been rewarded with a 14 per cent average annual total return since 2000. Looking forward, our portfolio of $24 billion in commercially secured near-term growth projects supports our ability to grow our common share dividend at an expected average rate at the upper end of an 8- to 10-per cent range through 2020.
* Comparable earnings per share is a non-GAAP measure. See “Non-GAAP measures” in the “Cautionary note” of this report for further information.
Financial performance (millions of dollars unless otherwise indicated) 2012 2013 2014 2015 2016
Revenues $8,007 $8,797 $10,185 $11,300 $12,505
Comparable EBITDA1 $4,245 $4,859 $5,521 $5,908 $6,647
Net income/(loss) attributable to common shares $1,299 $1,712 $1,743 $(1,240) $124
Net income/(loss) attributable to common shares ($/share) $1.84 $2.42 $2.46 $(1.75) $ 0.16
Comparable earnings1 $1,330 $1,584 $1,715 $1,755 $2,108
Comparable earnings per common share ($/share)1 $1.89 $2.24 $2.42 $2.48 $2.78
Funds generated from operations1 $3,344 $4,120 $4,415 $4,730 $4,821
Proceeds from sale of assets, net of transaction costs – – $196 – $6
Cash dividends paid on common and preferred shares $1,281 $1,356 $1,439 $1,538 $1,536
Common dividends declared per share ($/share) $1.76 $1.84 $1.92 $2.08 $2.26
Capital spending, equity investments and acquisitions $3,464 $5,131 $4,834 $5,158 $19,745
Interest expense $976 $985 $1,198 $1,370 $1,998
Income tax expense $466 $611 $831 $34 $352
1 Denotes a non-GAAP measure.
Please refer to our 2016 Annual Report for further details on economic value generated.
TRANSCANADA MAP
TABLE OF CONTENTS
CEO’S MESSAGE
WHO WE ARE
ABOUT THIS REPORT
WHAT CSR MEANS TO US
A HEALTHY AND SAFE ENVIRONMENT AND COMMUNITY
AN ENGAGED COMMUNITY
A THRIVING ECONOMY
Financial performance
Economic benefits of development
Access to markets
CAUTIONARY NOTE
APPENDIX
GLOBAL REPORTING INITIATIVE G4 INDEX
GLOSSARY

TRANSCANADA CSR REPORT 2016
PAGE 54
A THRIVING ECONOMY > FINANCIAL PERFORMANCE
Financial performance (continued)
INDICATOR: Financial implications and other risks and opportunities for the organization’s activities due to climate change (G4-EC2)
Across our North American operations, there are a variety of new and evolving initiatives in development at the federal, regional, provincial and state levels aimed at achieving GHG emission reductions. We recorded $62 million of expenses under existing GHG pricing programs in 2016.
In 2016, we continued to monitor the financial impacts of climate change on our business, which include the following:
• Business interruptions, including operational risks from natural disasters (e.g., significant changes in temperature and extreme weather events), could impact revenues and increase operating costs, legal proceedings or other expenses, all of which could reduce our earnings. Losses not covered by insurance could have an adverse effect on operations, cash flow and financial position.
• Changes in temperature extremes and energy reliability during extreme weather events are expected to increase demand for natural gas. We are well positioned to continue to capture a significant portion of that growth.
• Public opinion about crude oil development and production can have an impact on the regulatory processes with which we are required to comply, and this may be influenced by some individuals and interest groups lobbying against the construction of liquids pipelines. Notwithstanding the current economic conditions, we continue to see a role for liquids pipelines in contributing to the balanced portfolio of energy that North America and the world continue to demand.
• Efforts to transition to less carbon-intensive forms of power generation, driven in part by regulatory developments, are well aligned with our expertise in building and operating highly efficient natural gas-fired and renewable energy facilities. We believe our energy business is well positioned to capitalize on these opportunities.
• We expect supply and demand for natural gas to continue to grow. Our Canadian, U.S. and Mexican natural gas pipelines are well positioned to capitalize on this opportunity.
• We see additional opportunity to develop new low- and non-emitting energy sources as consumer behaviour changes and market conditions shift to reflect these behaviours.
TransCanada cannot estimate the potential financial implications of proposed international agreements, GHG policies or changes in environmental and other laws and regulations on our future consolidated results of operations, financial position or cash flows. Legislation or regulation could materially increase our operating costs, require material capital expenditures or create additional requirements for permitting, which could delay proposed projects.
Please refer to our 2016 CDP Report for further details on our climate change risks and opportunities.
Note: This indicator is inclusive of all TransCanada operations and assets, including CPG assets as of July 1, 2016.
TRANSCANADA MAP
TABLE OF CONTENTS
CEO’S MESSAGE
WHO WE ARE
ABOUT THIS REPORT
WHAT CSR MEANS TO US
A HEALTHY AND SAFE ENVIRONMENT AND COMMUNITY
AN ENGAGED COMMUNITY
A THRIVING ECONOMY
Financial performance
Economic benefits of development
Access to markets
CAUTIONARY NOTE
APPENDIX
GLOBAL REPORTING INITIATIVE G4 INDEX
GLOSSARY

TRANSCANADA CSR REPORT 2016
PAGE 55
A THRIVING ECONOMY > ECONOMIC BENEFITS OF DEVELOPMENT
Economic benefits of developmentOur ability to bring job opportunities and financial benefits to communities across North America.
OPERATING CONTEXTTransCanada delivers more than just the energy that powers our lives and economies. Our operations also generate a number of direct economic benefits for the communities and governments where we operate.
These benefits include cash and property tax payments that support essential government services, such as schools, roads and hospitals, as well as investments in local non-profits and other charitable organizations. Our projects and assets also support thousands of direct and indirect jobs opportunities, and they create business opportunities for local suppliers.
Taken together, these benefits can have a positive impact on the economies where we operate.
COMMITMENTTransCanada is committed to bringing economic value to our communities by:
• generating tax revenues for federal, provincial and state governments
• providing financial and non-financial support to non-profit organizations in our communities
• engaging with a broad range of qualified suppliers
• working to enhance the diversity and local participation of suppliers to realize greater economic benefits for local communities in association with our project
• providing employees with a competitive compensation and benefits package
APPROACH
INDICATOR: Significant indirect economic impacts (G4-EC8, partial)
Through our core business activities, community investments, and approach to local employment and business opportunities, we work to support economic development where we operate.
When undertaking new projects, we consult with local Indigenous groups and stakeholders, in accordance with regulatory requirements, to identify both positive and negative potential indirect economic and socio-economic impacts. Mitigation and management strategies are developed in cases where TransCanada’s operations are likely to have significant negative socio-economic impacts, such as effects on community infrastructure and services.
For additional details on our approach, please refer to the Stakeholder and Indigenous engagement section.
Local skills building and employmentEducation and training is integrated into our engagement strategy and incorporated into project planning at the outset of engagement with local communities and Indigenous groups. Working directly with communities to develop an education and training plan ensures the plan supports the needs of the communities. This approach facilitates the planning and implementation of community education/training initiatives in advance of projects and helps to maximize the benefits of Indigenous groups’ project participation.
For details about our financial and non-financial support of communities, please refer to the Community investment section.
For further details on our approach to employee benefits, please refer to the Employee attraction, retention and development section.
Local suppliersTo realize greater economic benefits for our communities, while meeting our service requirements, we developed a Supplier Diversity and Local Participation program. This program includes an overarching framework for business policy, processes and tools to enhance supplier diversity, local participation and capacity development opportunities.
As part of our work to build and maintain relationships with Indigenous groups, we support the development of reciprocal business relationships. We engage with community leadership and businesses to understand capacity and capabilities and align community capacity with project requirements. Our Indigenous contracting program designates certain key activities for qualified Indigenous businesses, requirements for general contractors to meaningfully engage with local Indigenous groups and rigorous reporting requirements.
In 2016, TransCanada generated more than $100 million in work for Indigenous businesses or their joint-venture partners in Canada and the U.S. for goods, contract services and employment on TransCanada projects and operations.*
While all potential suppliers are evaluated based on safety, financial, technical, quality, and anti-bribery and anti-corruption criteria during pre-qualification, factors such as diversity and local spend are considered during supplier selection.
No significant adjustments to our approach to managing economic benefits of development were identified for the 2016 reporting period.
* Please see page 8 of the 2016 Corporate Social Responsibility Report Data Sheet for a breakdown of TransCanada’s total Indigenous direct and indirect spend, and supporting information.
TRANSCANADA MAP
TABLE OF CONTENTS
CEO’S MESSAGE
WHO WE ARE
ABOUT THIS REPORT
WHAT CSR MEANS TO US
A HEALTHY AND SAFE ENVIRONMENT AND COMMUNITY
AN ENGAGED COMMUNITY
A THRIVING ECONOMY
Financial performance
Economic benefits of development
Access to markets
CAUTIONARY NOTE
APPENDIX
GLOBAL REPORTING INITIATIVE G4 INDEX
GLOSSARY

TRANSCANADA CSR REPORT 2016
PAGE 56
A THRIVING ECONOMY > ECONOMIC BENEFITS OF DEVELOPMENT
Economic benefits of development (continued)
PERFORMANCE
INDICATOR: Direct economic value distributed (G4-EC1, partial)
In 2016, TransCanada’s direct economic contributions included $610 million in cash and property taxes, $1.47 billion in payroll costs and $199 million in employee benefits. The company also invested $16 million in local communities through voluntary contributions.
Economic benefit to communities1
(millions of dollars except as indicated) 2012 2013 2014 2015 2016
Property taxes $434 $445 $473 $517 $555
Cash income taxes paid $190 $202 $109 $162 $105
Total payroll costs2 – – – $1,090.6 $1,468.3
Canada – – – $699.9 $636.6
U.S. (US dollar) – – – $261.8 $604.6
Mexico (MXN peso) – – – $368.0 $307.0
Total employee benefits3 – – – $180.8 $236.8
Canada – – – $98.7 $84.8
U.S. (US dollar) – – – $58.7 $112.5
Mexico (MXN peso) – – – $14.1 $15.8
Note: This indicator is inclusive of all TransCanada operations and assets, including CPG’s payroll and employee benefits as of July 1, 2016, but excluding CPG’s property and cash taxes. 1 For total payroll income costs and total employee benefits, we have applied the 2016 and 2015 average US$ to CAD$ exchange rates published in the TransCanada Annual Report. We have applied the 2016 and 2015 average Mexican peso
to CAD$ exchange rates published by the Bank of Canada. A correction has been made to 2015 data due to a conversion error.2 Total payroll costs are based on T4, W2 and Constancia de Percepciones earnings for Canadian, U.S. and Mexican core employees.3 Employee Benefit Costs include the overall costs for the following programs, where applicable: pension plans, benefits (including medical, dental and vision), stock and savings plans, life and accident insurance, long-term disability,
employee-assistance programs and other benefits not included in Total Payroll Costs.
TRANSCANADA MAP
TABLE OF CONTENTS
CEO’S MESSAGE
WHO WE ARE
ABOUT THIS REPORT
WHAT CSR MEANS TO US
A HEALTHY AND SAFE ENVIRONMENT AND COMMUNITY
AN ENGAGED COMMUNITY
A THRIVING ECONOMY
Financial performance
Economic benefits of development
Access to markets
CAUTIONARY NOTE
APPENDIX
GLOBAL REPORTING INITIATIVE G4 INDEX
GLOSSARY

TRANSCANADA CSR REPORT 2016
PAGE 57
A THRIVING ECONOMY > ACCESS TO MARKETS
Access to marketsOur ability to construct and operate new pipeline assets to enhance access to markets and contribute to North American energy security.
OPERATING CONTEXTTransCanada plays a central role in developing North America’s energy future, operating critical infrastructure and providing access to a safe and reliable mix of energy sources that powers our lives.
Our pipelines help to connect our oil and gas customers to where their products are needed most in a safe and efficient manner. TransCanada’s record of safe and reliable energy transportation and our respectful, long-standing relationships with the communities where we operate have made us one of North America’s most sought-after partners in energy infrastructure.
We strongly believe that North America is well positioned to supply the world’s growing demand for safe and affordable energy. We remain dedicated to exploring opportunities to further expand our network of natural gas and liquids pipelines, and to working with our customers and regulators to continue to grow much-needed pipeline infrastructure for safe and reliable access to domestic and international markets.
Natural gas pipelinesIncreased demand for natural gas, coupled with the annual decline rate of 15–20 per cent for natural gas production, implies that up to 25 billion cubic feet per day (Bcf/d) of new production per year will be required to meet current and forecasted demand.
Natural gas producers continue to progress opportunities to sell natural gas to global markets, which involves connecting natural gas supplies to new LNG export terminals being proposed primarily along the west coast of Canada and the Gulf of Mexico in the U.S.
Liquids pipelinesDespite the emergence of new technologies that have made vehicles more fuel efficient, demand for crude oil and the products derived from it is projected by the International Energy Agency to increase between 8 million bbl/d and 21 million bbl/d between now and 2040, driven primarily by growth in Asia and developing countries.
Growth in oil sands production is driving the need for new intra-Alberta pipelines, such as our 50 per cent owned Grand Rapids Pipeline Project, which can move crude oil production from the source to the market hub at Edmonton, Alta. Grand Rapids was placed into service during the third quarter of 2017.
While the markets we currently serve are facing short-term commodity price fluctuations and supply adjustments, we expect global demand for crude oil will continue to grow in the long term, ultimately resulting in the continued growth of North American crude oil supply production and demand for new pipeline infrastructure as well as a need for shippers to seamlessly connect pipelines that transport crude oil outside of Alberta to the markets where it is needed most.
COMMITMENTWhen planning new projects, we are committed to engaging stakeholders and Indigenous groups to understand their concerns and identify any potential social, environmental and economic effects.
Our goal is to ensure all of our projects are placed in service on time and on budget while also ensuring the safety of our staff, contractors and anyone impacted by the construction and operation of these facilities.
APPROACHWe provide additional information about our engagement in the Stakeholder and Indigenous engagement section.
Visit Life Cycle of a Pipeline for more information about our project design and approval process.
No significant adjustments to our approach to access to markets were identified for the 2016 reporting period.
TRANSCANADA MAP
TABLE OF CONTENTS
CEO’S MESSAGE
WHO WE ARE
ABOUT THIS REPORT
WHAT CSR MEANS TO US
A HEALTHY AND SAFE ENVIRONMENT AND COMMUNITY
AN ENGAGED COMMUNITY
A THRIVING ECONOMY
Financial performance
Economic benefits of development
Access to markets
CAUTIONARY NOTE
APPENDIX
GLOBAL REPORTING INITIATIVE G4 INDEX
GLOSSARY

TRANSCANADA CSR REPORT 2016
PAGE 58
A THRIVING ECONOMY > ACCESS TO MARKETS
Access to markets (continued)
PERFORMANCEIn 2016, we significantly enhanced our ability to construct and operate new assets to deliver even more to our communities, shareholders and other stakeholders.
Through our US$13 billion acquisition of CPG, we now operate natural gas pipeline and storage assets in one of the world’s fastest-growing and lowest-cost natural gas production basins—the Appalachian Basin in the U.S. Northeast.
As of July 31, 2017, new capital projects included both $24 billion in short-term projects and more than $40 billion in commercially secured, but as of yet unapproved, medium- to longer-term projects.
Notable capital projects that are expected to enhance access to markets include:
• Growth in our natural gas pipelines business in Canada, the U.S. and Mexico, which will play a critical role in meeting the transportation requirements for supply and demand for natural gas in North America.
• Long-term growth in our liquids pipelines business in Canada and the U.S. through the development of the Energy East and Keystone XL pipeline projects, both of which are currently undergoing regulatory review and approval.
For further details on our proposed natural gas and liquids pipeline capital projects, please refer to our Quarterly Report to Shareholders dated July 27, 2017.
INDICATOR: Development and impact of infrastructure investments and services supported (G4-EC7)
For detailed information on the expected impact of infrastructure investments on a project-by-project basis, please visit our website or refer to the Energy East Pipeline and Keystone XL websites.
Final work was completed in August 2017 on the Grand Rapids Pipeline in Northern Alberta. It’s the first Canadian crude oil pipeline commissioned by TransCanada since 2010. Click here for more information.
TRANSCANADA MAP
TABLE OF CONTENTS
CEO’S MESSAGE
WHO WE ARE
ABOUT THIS REPORT
WHAT CSR MEANS TO US
A HEALTHY AND SAFE ENVIRONMENT AND COMMUNITY
AN ENGAGED COMMUNITY
A THRIVING ECONOMY
Financial performance
Economic benefits of development
Access to markets
CAUTIONARY NOTE
APPENDIX
GLOBAL REPORTING INITIATIVE G4 INDEX
GLOSSARY

TRANSCANADA CSR REPORT 2016
PAGE 59
CAUTIONARY NOTE
Cautionary note This CSR report contains forward-looking information that is subject to important risks and uncertainties.
Statements that are forward-looking are based on certain assumptions and on what we know and expect today and generally include words like anticipate, expect, believe, may, will, should, estimate or other similar words.
Forward-looking statements in this report include information about the following, among other things:
• planned changes in our business
• our financial and operational performance, including the performance of our subsidiaries
• expectations or projections about strategies and goals for growth and expansion
• expected cash flows and future financing options available to us
• expected dividend growth
• expected costs for planned projects, including projects under construction, under permitting and in development
• expected schedules for planned projects (including anticipated construction and completion dates)
• expected regulatory processes and outcomes
• expected impact of regulatory outcomes
• expected capital expenditures and contractual obligations
• expected operating and financial results
• expected industry, market and economic conditions
Forward-looking statements do not guarantee future performance. Actual events and results could be significantly different because of assumptions, risks or uncertainties related to our business or events that happen after the date of this report.
Our forward-looking information is based on key assumptions and subject to the following risks and uncertainties:
ASSUMPTIONS• inflation rates, commodity prices and capacity prices
• nature and scope of hedging
• regulatory decisions and outcomes
• foreign exchange rates
• interest rates
• tax rates
• planned and unplanned outages and the use of our pipeline and energy assets
• integrity and reliability of our assets
• access to capital markets
• anticipated construction costs, schedules and completion dates
RISKS AND UNCERTAINTIES• our ability to realize the anticipated benefits of the acquisition of Columbia
• our ability to successfully implement our strategic initiatives
• whether our strategic initiatives will yield the expected benefits
• the operating performance of our pipeline and energy assets
• the amount of capacity sold and rates achieved in our pipelines businesses
• the availability and price of energy commodities
• the amount of capacity payments and revenues we receive from our energy business
• regulatory decisions and outcomes
• outcomes of legal proceedings, including arbitration and insurance claims
TRANSCANADA MAP
TABLE OF CONTENTS
CEO’S MESSAGE
WHO WE ARE
ABOUT THIS REPORT
WHAT CSR MEANS TO US
A HEALTHY AND SAFE ENVIRONMENT AND COMMUNITY
AN ENGAGED COMMUNITY
A THRIVING ECONOMY
CAUTIONARY NOTE
APPENDIX
GLOBAL REPORTING INITIATIVE G4 INDEX
GLOSSARY

TRANSCANADA CSR REPORT 2016
PAGE 60
CAUTIONARY NOTE
Cautionary note (continued)
• performance and credit risk of our counterparties
• changes in market commodity prices
• changes in the political environment
• changes in environmental and other laws and regulations
• competitive factors in the pipeline and energy sectors
• construction and completion of capital projects
• costs for labour, equipment and materials
• access to capital markets
• interest, tax and foreign exchange rates
• weather
• cyber security
• technological developments
• economic conditions in North America as well as globally
You can read more about these factors and others in reports we have filed with Canadian securities regulators under TransCanada’s profile on SEDAR at www.sedar.com and with the U.S. Securities and Exchange Commission (the SEC) at www.sec.gov, including our Quarterly Report to Shareholders, dated July 27, 2017, and 2016 Annual Report.
As actual results could vary significantly from the forward-looking information, you should not put undue reliance on forward-looking information and should not use future-oriented information or financial outlooks for anything other than their intended purpose. We do not update our forward-looking statements due to new information or future events, unless we are required to by law.
This report contains references to TransCanada’s website. These references are for the readers’ convenience only. TransCanada is not incorporating by reference any information posted on www.transcanada.com.
NON-GAAP MEASURESThis report references the following non-GAAP measures:
• comparable earnings
• comparable earnings per share
• funds generated from operations
• comparable earnings before interest, taxes, depreciation and amortization (EBITDA)
These measures do not have any standardized meaning as prescribed by U.S. generally accepted accounting principles (GAAP) and, therefore, are unlikely to be comparable to similar measures presented by other companies. These non-GAAP measures are calculated on a consistent basis from period to period and are adjusted for specific items in each period, as applicable.
For more information on reconciliations of non-GAAP measures to the most closely related GAAP measures, refer to TransCanada’s Quarterly Report to Shareholders, dated July 27, 2017, and our 2016 Annual Report filed with Canadian securities regulators at www.sedar.com, with the SEC at www.sec.gov and available at www.transcanada.com.
We believe that this report contains information that is accurate, timely and balanced. While the report and the data within have not been externally assured in its entirety, we completed an internal assessment process to review the contents for clarity. We make no warranty, expressed or implied, regarding accuracy, adequacy, completeness, legality, reliability or usefulness of any information.
TRANSCANADA MAP
TABLE OF CONTENTS
CEO’S MESSAGE
WHO WE ARE
ABOUT THIS REPORT
WHAT CSR MEANS TO US
A HEALTHY AND SAFE ENVIRONMENT AND COMMUNITY
AN ENGAGED COMMUNITY
A THRIVING ECONOMY
CAUTIONARY NOTE
APPENDIX
GLOBAL REPORTING INITIATIVE G4 INDEX
GLOSSARY

TRANSCANADA CSR REPORT 2016
PAGE 61
APPENDIX
AppendixOVERSIGHT AND POLICIES ON LOBBYING, POLITICAL CONTRIBUTIONS AND CORPORATE MEMBERSHIPSThe governance committee of the Board of Directors oversees lobbying, political contributions and corporate memberships. It receives a report annually that provides information on our lobbying activities, a complete list of our political contributions and a detailed list of our corporate memberships, including industry associations and policy organizations. TransCanada prides itself on being a company that all our stakeholders can count on to make the right choices and do the right thing.
TransCanada has several policies pertaining to lobbying activities and political contributions, each of which applies to all directors, officers and employees as well as contractors, as summarized in the following:
Avoiding Bribery and Corruption PolicyTransCanada prohibits the payment of bribes and kickbacks, or provision to government officials of gifts, entertainment or something of value, in order to improperly influence a government official’s decisions or actions in the performance of his or her duties. TransCanada also prohibits the offer or provision of facilitation payments. This policy outlines TransCanada’s expectations of personnel regarding integrity-based business practices to avoid the occurrence or even the appearance of improper or illegal conduct and to encourage ethical behaviour in all of TransCanada’s business.
Code of Business EthicsTransCanada’s Code of Business Ethics (COBE) provides personnel with the expected standards of conduct to ensure TransCanada’s reputation for honesty, integrity and reliability is maintained. COBE states that we respect the political process and only make political contributions and engage in lobbying activities that are legal and transparent. COBE refers our personnel to the Avoiding Bribery and Corruption Policy for more specific guidance on those issues.
Political Activities and Contributions PolicyThis policy:
• sets out the role of our government relations department and provides guidance to TransCanada’s personnel to ensure ethical behaviour when dealing with government officials
• outlines expectations around lobbying compliance for both in-house and consultant lobbyists
• outlines the criteria for TransCanada’s contributions to political organizations and candidates for public office
TransCanada is committed to the responsible development of public policy. The company engages in the public policy process by participating in direct advocacy of governments, as well as working with third parties, such as industry associations. As part of this commitment, the company focuses on constructive engagement and support of the political process through contributions to political organizations and political campaigns to the extent permitted by applicable law.
TransCanada is non-partisan and participates in the political process only when permitted by applicable law, in accordance with company policies, and in a responsible and ethical way that serves the best interests of the company and its stakeholders.
In Canada and the United States, TransCanada makes political contributions in regions where TransCanada conducts business. TransCanada does not make political contributions in Mexico. All political contributions are approved by the senior vice-president responsible for public affairs and communications.
In the U.S.:
• All non-U.S. personnel are strictly prohibited from having any role, direct or indirect, in making political contributions.
• No corporate funds may be used to make political contributions to candidates and political committees in federal elections.
• Only funds generated from U.S. operations may be used to make political contributions.
In 2016, TransCanada spent approximately $111,000 on political contributions, with $54,000 contributed in Canada and $57,000 in the U.S.
TRANSCANADA MAP
TABLE OF CONTENTS
CEO’S MESSAGE
WHO WE ARE
ABOUT THIS REPORT
WHAT CSR MEANS TO US
A HEALTHY AND SAFE ENVIRONMENT AND COMMUNITY
AN ENGAGED COMMUNITY
A THRIVING ECONOMY
CAUTIONARY NOTE
APPENDIX
GLOBAL REPORTING INITIATIVE G4 INDEX
GLOSSARY

TRANSCANADA CSR REPORT 2016
PAGE 62
APPENDIX
Appendix (continued)
POLITICAL ACTION COMMITTEESTransCanada USA Services Inc., a U.S. subsidiary of TransCanada Corporation, has established the TransCanada USA Services Inc. Political Action Committee to make political contributions in connection with federal, state and local elections in the U.S. using funds voluntarily donated by employees of TransCanada USA Services Inc. and affiliated entities. The TransCanada USA Services Inc. Political Action Committee is administered in compliance with the restrictions and requirements of the Federal Election Campaign Act of 1971, as amended (FECA), and the rules and regulations of the Federal Election Commission, which administers FECA. In 2016, a total of $4,500 was disbursed by the TransCanada USA Services Inc. Political Action Committee. More information on contributions made by the TransCanada USA Services Inc. Political Action Committee can be found at www.fec.gov.
Columbia Pipeline Group Political Action Committee is established under the U.S. federal election code, which allows employees to contribute to a fund for the purposes of making contributions to candidates for public office. Under U.S. law, no corporate funding is allowed to make contributions to federal candidates for public office. Between July 1, 2016 and December 31, 2016, a total of $81,550 was disbursed by the Columbia Pipeline Group Political Action Committee.
LOBBYINGTransCanada’s business can be significantly impacted by government actions and decisions. The company works continuously to build and maintain positive and constructive relationships with government officials at all levels. This allows TransCanada to gain trust and respect in the public sector, obtain government support for its activities and initiatives, and to contribute to and collaborate with the communities where the company operates.
TransCanada maintains registrations for in-house lobbyists where required by law. Our lobbying activities are registered in various jurisdictions in Canada and the U.S., many of which provide public disclosure with details of registrations. Links to each of the lobbyist registrations, where available, can be found on our website at www.transcanada.com.
In addition, our consultant lobbyists in all jurisdictions are expected to comply with all applicable laws.
CORPORATE MEMBERSHIPSTransCanada is a member of various trade associations and policy organizations across our lines of business. Our primary purpose for involvement in trade associations is for general business reasons and discussion of technical and industry standards. Trade associations also provide opportunities for our employees to engage in professional development and networking.
While trade associations and policy organizations may use membership fees for lobbying purposes, TransCanada does not direct how membership fees are used and payment of membership fees does not necessarily reflect significant involvement with the trade association or policy organization from a policy perspective. Our participation in a specific trade association or policy organization does not signify comprehensive support for all positions undertaken by the associations. TransCanada’s approval process for membership in these organizations requires vice-president-level approval.
Approval of memberships involves consideration of the following:
• the objectives of the association
• the association’s affiliations
• the benefits provided to TransCanada
• the cost of the membership
• whether the membership aligns with TransCanada’s strategic focus
• whether there are other alternatives to membership that would provide the same benefits
The government relations and policy department is responsible for payments and maintains a roster of memberships. This process has been established to ensure TransCanada receives value from its memberships.
In addition, the governance committee of the Board of Directors receives a report annually on our memberships in trade association and policy organizations, including a detailed discussion of our key memberships and their value to TransCanada.
TRANSCANADA MAP
TABLE OF CONTENTS
CEO’S MESSAGE
WHO WE ARE
ABOUT THIS REPORT
WHAT CSR MEANS TO US
A HEALTHY AND SAFE ENVIRONMENT AND COMMUNITY
AN ENGAGED COMMUNITY
A THRIVING ECONOMY
CAUTIONARY NOTE
APPENDIX
GLOBAL REPORTING INITIATIVE G4 INDEX
GLOSSARY

TRANSCANADA CSR REPORT 2016
PAGE 63
APPENDIX
Appendix (continued)
List of membershipsThe most significant corporate memberships that TransCanada maintains from a policy perspective are the following:
• American Petroleum Institute
• Association of Oil Pipe Lines
• Interstate Natural Gas Association of America
• Canadian Energy Pipeline Association
The following is a list of industry associations and policy organizations that received more than $50,000 from us during 2016. We have also included industry associations and policy organizations where we play a significant role in contributing to their policy stance, even if payments did not exceed $50,000.
• Canadian Energy Pipeline Association
• Interstate Natural Gas Association of America
• Electric Power Research Institute
• American Petroleum Institute
• Association of Oil Pipe Lines
• Confederacion Patronal de la Republica Mexicana
• Business Roundtable
• Canadian Gas Association
• Canadian Association of Petroleum Producers
• Asociacion Mexicana de Gas Natural, A.C.
• Ontario Energy Association
• American Gas Association
• National Association of Manufacturers
• Northwest Gas Association
• New England Power Generators Association
• Canadian Electricity Association
• Business Council of Canada
• Independent Power Producers of New York Inc.
• Corporate Executive Board
• Canadian Manufacturers and Exporters
• Canadian Electricity Association
• Association of Power Producers of Ontario
TRANSCANADA MAP
TABLE OF CONTENTS
CEO’S MESSAGE
WHO WE ARE
ABOUT THIS REPORT
WHAT CSR MEANS TO US
A HEALTHY AND SAFE ENVIRONMENT AND COMMUNITY
AN ENGAGED COMMUNITY
A THRIVING ECONOMY
CAUTIONARY NOTE
APPENDIX
GLOBAL REPORTING INITIATIVE G4 INDEX
GLOSSARY

TRANSCANADA CSR REPORT 2016
PAGE 64
GLOBAL REPORTING INITIATIVE G4 INDEX > STANDARD DISCLOSURES
Global Reporting Initiative G4 Index GRI G4 Standard Disclosures
G4 Indicator Section Title CSR Report Page Number Additional Sources
Strategy and Analysis
G4-1 CEO’s message 4
Organizational Profile
G4-3 Who we are – Our business at a glance 7 www.transcanada.com
G4-4 Who we are – Our business at a glance 7 www.transcanada.com
G4-5 Who we are – Our business at a glance 7 www.transcanada.com
G4-6 Who we are – Our business at a glance 7 www.transcanada.com
G4-7 Who we are – Our business at a glance 7 www.transcanada.com
G4-8 Who we are – Our business at a glance 7 www.transcanada.com
G4-9 Who we are – Our business at a glance 7 www.transcanada.com, Annual Report
G4-10 Who we are – Our people 9 www.transcanada.com
G4-11 Who we are – Our people 9 www.transcanada.com
G4-12 Who we are – Our people 9
Economic benefits of development – Approach 55
G4-13 Who we are – Our business at a glance – Changes to our asset portfolio and operations in 2016
8
www.transcanada.com, Annual Report
G4-14 What CSR means to us – Our approach 16
G4-15 About this report – Our approach to disclosure 14
What CSR means to us – Our approach 16
G4-16 What CSR means to us – Our approach 16
Identified Material Aspects and Boundaries
G4-17 About this report – Report profile 14
G4-18 About this report – Our priorities – Materiality analysis 13
G4-19 About this report – Our priorities 11
G4-20 About this report – Our priorities 11
G4-21 About this report – Our priorities 11
G4-22 About this report – Report profile 14
G4-23 Global Reporting Initiative G4 Index 64
TRANSCANADA MAP
TABLE OF CONTENTS
CEO’S MESSAGE
WHO WE ARE
ABOUT THIS REPORT
WHAT CSR MEANS TO US
A HEALTHY AND SAFE ENVIRONMENT AND COMMUNITY
AN ENGAGED COMMUNITY
A THRIVING ECONOMY
CAUTIONARY NOTE
APPENDIX
GLOBAL REPORTING INITIATIVE G4 INDEX
Standard disclosures
Specific standard disclosures
GLOSSARY

TRANSCANADA CSR REPORT 2016
PAGE 65
GLOBAL REPORTING INITIATIVE G4 INDEX > STANDARD DISCLOSURES
Global Reporting Initiative G4 Index (continued)
GRI G4 Standard Disclosures
G4 Indicator Section Title CSR Report Page Number Additional Sources
Stakeholder Engagement
G4-24 About this report – Our priorities – Materiality analysis 13
What CSR means to us – Our approach 16
An engaged community – Stakeholder and Indigenous engagement – Operating context
42
G4-25 About this report – Our priorities – Materiality analysis 13
What CSR means to us – Our approach 16
An engaged community – Stakeholder and Indigenous engagement – Operating context
42
G4-26 About this report – Our priorities – Materiality analysis 13
An engaged community – Stakeholder and Indigenous engagement – Performance
44
G4-27 About this report 10
An engaged community – Stakeholder and Indigenous engagement 42
Report Profile
G4-28 About this report – Report profile 14
G4-29 About this report – Report profile 14
G4-30 About this report – Report profile 14
G4-31 About this report – Our approach to disclosure 14
G4-32 About this report – Report profile 14
Global Reporting Initiative G4 Index 64
G4-33 About this report – Report profile 14
Governance
G4-34 What CSR means to us – Our approach 16 Management Information Circular
Ethics
G4-56 Who we are – Our mission, vision, values 7 www.transcanada.com
Code of Business Ethics
TRANSCANADA MAP
TABLE OF CONTENTS
CEO’S MESSAGE
WHO WE ARE
ABOUT THIS REPORT
WHAT CSR MEANS TO US
A HEALTHY AND SAFE ENVIRONMENT AND COMMUNITY
AN ENGAGED COMMUNITY
A THRIVING ECONOMY
CAUTIONARY NOTE
APPENDIX
GLOBAL REPORTING INITIATIVE G4 INDEX
Standard disclosures
Specific standard disclosures
GLOSSARY

TRANSCANADA CSR REPORT 2016
PAGE 66
GLOBAL REPORTING INITIATIVE G4 INDEX > SPECIFIC STANDARD DISCLOSURES
Global Reporting Initiative G4 Index (continued)
GRI G4 Specific Standard Disclosures
Material Issue G4 Indicator CSR Report Page Number Omissions
Integrity of pipelines and facilities
G4-DMA 24 –
G4-EN24 26 Spills by third-party contractors are not reflective of TransCanada’s integrity management performance and are thus excluded.
G4-OG13 27 Significant gas pipeline body leaks are omitted from 2016 process safety data, as internal processes for reporting changed during the course of this reporting cycle. TransCanada continues to enhance its reporting of process safety events and will consider enhancing disclosure of process safety events for all assets going forward.
Emergency preparedness and response
G4-DMA 30 Please note that no GRI Specific Standard Disclosures were available for this Aspect. Internal performance indicators have been reported.
Health and safety of communities, employees and contractors
G4-DMA 32 –
G4-LA6 33 TransCanada tracks occupational health and safety performance according to regulatory requirements and industry standards – as a result, indicators may not align fully with GRI requirements. TransCanada does not publicly report OHS performance by gender, as we consider this to be private information and therefore do not track it. A Prime Contractor experienced a fatality while working on a TransCanada project. This is not considered a recordable incident for TransCanada. However, measures are currently being undertaken to continue to prioritize safety across TransCanada’s business.
Climate change and greenhouse gas emissions
G4-DMA 34 –
G4-EN15 37 Emissions from activities of special interest are not applicable to TransCanada’s business. For 2012 data onward, TransCanada’s direct GHG emissions reporting boundary is based on an asset equity share. TransCanada does not track emissions based on an operational control boundary and, thus, this information is not applicable.
G4-EN16 38 Emissions from activities of special interest are not applicable to TransCanada’s business.
G4-EN18 39 –
TRANSCANADA MAP
TABLE OF CONTENTS
CEO’S MESSAGE
WHO WE ARE
ABOUT THIS REPORT
WHAT CSR MEANS TO US
A HEALTHY AND SAFE ENVIRONMENT AND COMMUNITY
AN ENGAGED COMMUNITY
A THRIVING ECONOMY
CAUTIONARY NOTE
APPENDIX
GLOBAL REPORTING INITIATIVE G4 INDEX
Standard disclosures
Specific standard disclosures
GLOSSARY

TRANSCANADA CSR REPORT 2016
PAGE 67
GLOBAL REPORTING INITIATIVE G4 INDEX > SPECIFIC STANDARD DISCLOSURES
Global Reporting Initiative G4 Index (continued)
GRI G4 Specific Standard Disclosures
Material Issue G4 Indicator CSR Report Page Number Omissions
Stakeholder and Indigenous engagement
G4-DMA 42 –
G4-SO1 44 –
G4-OG9 45 TransCanada has not disclosed a complete list of company operations taking place in/adjacent to Indigenous people’s communities and does not share the details of formal plans and agreements, as we value the importance of confidentiality in respect to the Indigenous groups we work with.
Community investment, employee giving and volunteering
G4-DMA 46 –
G4-EC1 (partial)
47 –
Employee attraction, retention and development
G4-DMA 49 –
G4-LA1 50 TransCanada has not provided a breakdown of hires and turnover rates by gender, as we consider this to be private information and therefore do not track it.
Financial performance G4-DMA 52 –
G4-EC1 (partial)
53 Please refer to TransCanada’s annual report for further relevant information by region and assets.
G4-EC2 54 Please refer to TransCanada’s CDP report for additional detail on risks and opportunities posed by climate change, including our management approach and costs.
Economic benefits of development
G4–DMA 55 –
G4-EC1 (partial)
56 Please refer to TransCanada’s annual report for further detailed information by region and assets. Payments to host governments are not applicable to TransCanada’s operations.
G4-EC8 55 TransCanada does not currently assess the significance of the economic impacts of development in the context of external benchmarks.
TRANSCANADA MAP
TABLE OF CONTENTS
CEO’S MESSAGE
WHO WE ARE
ABOUT THIS REPORT
WHAT CSR MEANS TO US
A HEALTHY AND SAFE ENVIRONMENT AND COMMUNITY
AN ENGAGED COMMUNITY
A THRIVING ECONOMY
CAUTIONARY NOTE
APPENDIX
GLOBAL REPORTING INITIATIVE G4 INDEX
Standard disclosures
Specific standard disclosures
GLOSSARY

TRANSCANADA CSR REPORT 2016
PAGE 68
GLOBAL REPORTING INITIATIVE G4 INDEX > SPECIFIC STANDARD DISCLOSURES
Global Reporting Initiative G4 Index (continued)
GRI G4 Specific Standard Disclosures
Material Issue G4 Indicator CSR Report Page Number Omissions
Access to markets G4-DMA 57 –
G4-EC7 58 –
TRANSCANADA MAP
TABLE OF CONTENTS
CEO’S MESSAGE
WHO WE ARE
ABOUT THIS REPORT
WHAT CSR MEANS TO US
A HEALTHY AND SAFE ENVIRONMENT AND COMMUNITY
AN ENGAGED COMMUNITY
A THRIVING ECONOMY
CAUTIONARY NOTE
APPENDIX
GLOBAL REPORTING INITIATIVE G4 INDEX
Standard disclosures
Specific standard disclosures
GLOSSARY

TRANSCANADA CSR REPORT 2016
PAGE 69
GLOSSARY
GlossaryMeasurements
Barrel bbl
Barrels per day bbl/d
Billion cubic feet Bcf
Billion cubic feet per day Bcf/d
Kilometres km
Megawatt MW
Megawatt-hour MWh
Tonnes of carbon dioxide equivalent tCO2e
General terms and terms related to our operations
Carbon dioxide CO2
Columbia Pipeline Group CPG
Community Information Centre CIC
Corporate Social Responsibility CSR
Corrective Action Plan CAP
Emergency Response Plan ERP
Employee resource group ERG
Hazardous waste operations and emergency response HAZWOPER
Health, Safety and Environment HSE
Incident Command System ICS
Indigenous Relations Business Engagement IRBE
Liquid natural gas LNG
Methane CH4
Nitrous oxide N2O
NOVA Gas Transmission Ltd NGTL
Operations Control Centre OCC
Project Delivery Standard PDS
Research and development R&D
Right of way ROW
General terms and terms related to our operations
Safety Hazard Awareness Reporting Events SHARE
Supervisory Control and Data Acquisition SCADA
TransCanada’s Operational Management System TOMS
Accounting terms
Earnings before interest, taxes, depreciation and amortization EBITDA
Generally accepted accounting principles (U.S.) GAAP
Other acronyms referred to in this report
Canadian Electricity Association CEA
Canadian Energy Pipeline Association CEPA
Canadian Gas Association CGA
Canadian Human Rights Commission’s Human Rights Maturity Model HRMM
Carbon Disclosure Project (former name for the CDP) CDP
Dow Jones Sustainability Index World Index DJSI
Environmental Protection Agency (U.S.) EPA
Global Reporting Initiative GRI
Independent Electricity System Operator (Ontario) IESO
Intergovernmental Panel on Climate Change IPCC
Interstate Natural Gas Association of America INGAA
Ministry of Environment and Natural Resources (Mexico) SEMARNAT
Mutual Emergency Assistance Agreement MEAA
National Energy Board (Canada) NEB
Pipelines and Hazardous Materials Safety Administration (U.S.) PMSHA
Securities and Exchange Commission (U.S.) SEC
Specified Gas Emitters Regulation (Alberta) SGER
Transportation Safety Board (Canada) TSB
TRANSCANADA MAP
TABLE OF CONTENTS
CEO’S MESSAGE
WHO WE ARE
ABOUT THIS REPORT
WHAT CSR MEANS TO US
A HEALTHY AND SAFE ENVIRONMENT AND COMMUNITY
AN ENGAGED COMMUNITY
A THRIVING ECONOMY
CAUTIONARY NOTE
APPENDIX
GLOBAL REPORTING INITIATIVE G4 INDEX
GLOSSARY

TRANSCANADA CSR REPORT 2016
PAGE 70
GLOSSARY
Glossary (continued)
Definitions for performance indicators
Away from Work Case Rate Refers to an incident resulting in an injury or illness that prevents an employee from returning to work on the next scheduled shift. The number of away from work cases, where the employee would have worked but could not because of an occupational injury or illness, is related to a common exposure base of 100 full-time workers. This performance indicator is often referred to as the Lost-Time Case Rate.
Commercial investments Activities in the community that directly support our business objectives or that promote or protect our commercial interests.
Field tabletop exercises Involves key personnel discussing simulated scenarios in an informal setting.
HAZWOPER The hazardous waste operations and emergency response standard regulates the safety and health of employees involved in management and cleanup operations at uncontrolled hazardous waste sites, employees engaged in certain hazardous waste sites, and employees engaged in certain hazardous waste.
High Potential Incident Rate Refers to incidents with a high potential to result in a serious, debilitating injury to the worker related to a common exposure base of 100 full-time employees. Examples of high potential incidents include, but are not limited to, high-speed vehicle incidents, vehicle rollovers, high-voltage or high-pressure incidents, injuries to the head, falls from heights.
Incident Command System Best Practice training
Best practice training includes ICS 100 and 200 courses, which provide introductory and basic training designed to describe the history, features and principles, and organization structure of the ICS and enable personnel to operate efficiently during an incident or event.
In-kind giving Donations of equipment or resources to support community programs.
Oil or gas pipeline rupture An unplanned release of a liquid or gas product that impacts serviceability of the pipeline.
One-calls Local one-call centres field requests to have all underground utilities located and marked free of charge prior to any commercial or residential project involving digging.
Philanthropic investments One-off or intermittent donations in response to charity appeals or in support of employee charitable activities.
Reportable release A natural gas release that is reportable to an external agency or authority, such as a federal, provincial or state regulator.
Reportable spill A crude oil spill that is reportable to a regulatory body such as a federal, provincial or state regulator.
Scope 1 Direct GHG emissions that come from sources (physical units or processes that release GHG into the atmosphere) that are owned or controlled by TransCanada. These include, but are not limited to, the CO
2 emissions from the fuel consumption reported under indicator G4-EN3.
Scope 2 Indirect GHG emissions that result from the generation of purchased or acquired electricity, heating, cooling and steam consumed by TransCanada.
Scope 3 All indirect emissions (not included in Scope 2) that occur outside of TransCanada, including both upstream and downstream emissions.
Significant release For natural gas pipelines, a significant release is defined by our business as a release that has a direct impact on the public, employees or contractors, results in an uncontrolled fire, results in a regulatory enforcement, and/or causes an “other” significant unplanned event. For liquids pipelines, a significant spill is defined by the GRI as a hydrocarbon spill greater than 100 bbl released into the environment and/or a hydrocarbon spill released into a sensitive environment.
Social investments Involve longer-term strategic involvement in community partnerships that address a specific range of social issues and are important to the company or to company stakeholders.
Third-party damage Impact or exposure caused by a third party resulting in the need to repair an underground facility.
TRANSCANADA MAP
TABLE OF CONTENTS
CEO’S MESSAGE
WHO WE ARE
ABOUT THIS REPORT
WHAT CSR MEANS TO US
A HEALTHY AND SAFE ENVIRONMENT AND COMMUNITY
AN ENGAGED COMMUNITY
A THRIVING ECONOMY
CAUTIONARY NOTE
APPENDIX
GLOBAL REPORTING INITIATIVE G4 INDEX
GLOSSARY

TRANSCANADA CSR REPORT 2016
PAGE 71
GLOSSARY
Glossary (continued)
Definitions for performance indicators
Total Recordable Case Rate Refers to the number of recordable cases related to a common exposure base of 100 full-time employees. Recordable cases are all work-related deaths and illnesses, and those work-related injuries that result in a loss of consciousness, restriction of work or motion, transfer to another job or require medical treatment beyond first aid.
Vehicle Incident Frequency Rate
Refers to the number of recordable vehicle incidents related to a common exposure base of 1,000,000 km driven. A recordable vehicle incident (regardless of fault) involves a fleet or rental motor vehicle that results in an injury to any person or damage to any vehicle or property, unless the vehicle was safely and legally parked at the time of the incident.
GRI reporting definitions
Disclosures on Management Approach (DMA)
The DMA provides narrative information on how TransCanada identifies, analyzes and responds to its actual and potential material economic, environmental and social impacts.
External assurance Third-party analysis and verification of TransCanada’s practices, public disclosures and regulatory adherence.
GRI G4 Core option The Core option contains the essential elements of a sustainability report and provides the background against which TransCanada communicates the impacts of its economic and ESG performance.
In accordance The GRI Guidelines offer two options for preparing a sustainability report “in accordance” with those Guidelines: the Core option and the Comprehensive option. To claim that the sustainability report has been prepared in accordance with the GRI Standards, the reporting organization must meet all criteria for the respective option.
Material aspects Issues that are significant to a business’s economic, environmental and social impacts, and that substantively influence the assessments and decisions of its stakeholders.
Re-statement The G4 Guidelines indicate that companies should provide information and comparison data when changes occur with the aspect boundaries, scope, length of reporting period and use of any indicator in the report. Re-statement may result from mergers or acquisitions, change of base years or periods, the nature of business and/or measurement methods.
TRANSCANADA MAP
TABLE OF CONTENTS
CEO’S MESSAGE
WHO WE ARE
ABOUT THIS REPORT
WHAT CSR MEANS TO US
A HEALTHY AND SAFE ENVIRONMENT AND COMMUNITY
AN ENGAGED COMMUNITY
A THRIVING ECONOMY
CAUTIONARY NOTE
APPENDIX
GLOBAL REPORTING INITIATIVE G4 INDEX
GLOSSARY
Concept and Design: THE WORKS DESIGN COMMUNICATIONS worksdesign.com

TRANSCANADA MAP
TABLE OF CONTENTS
CEO’S MESSAGE
WHO WE ARE
ABOUT THIS REPORT
WHAT CSR MEANS TO US
A HEALTHY AND SAFE ENVIRONMENT AND COMMUNITY
AN ENGAGED COMMUNITY
A THRIVING ECONOMY
CAUTIONARY NOTE
APPENDIX
GLOBAL REPORTING INITIATIVE G4 INDEX
GLOSSARY