trai audit wireless report-west bengal circle- jfm quarter ... qos audit report qe jan... · list...
TRANSCRIPT

EAST
ZONE TRAI AUDIT WIRELESS REPORT-WEST
BENGAL CIRCLE- JFM QUARTER, 2014

TRAI Audit Wireless Report-West Bengal Circle- JFM Quarter, 2014 JFM Quarter-2014
2
1 TABLE OF CONTENTS
2 INTRODUCTION ......................................................................................................................................... 4
2.1 About TRAI .......................................................................................................................................... 4
2.2 Objectives ............................................................................................................................................ 4
2.3 Framework used .................................................................................................................................. 5
2.3.1 PMR Reports ................................................................................................................................... 5
2.3.2 Drive Test ....................................................................................................................................... 17
2.3.3 Live Calling ..................................................................................................................................... 19
2.4 Operators Covered ............................................................................................................................. 21
3 Executive Summary .................................................................................................................................... 22
3.1 PMR Data – 3 Months- consolidateD .............................................................................................. 22
3.2 3 Day Data - Consolidated................................................................................................................ 23
3.3 Live Calling Data - Consolidated ..................................................................................................... 25
3.4 Billing and customer care - Consolidated ...................................................................................... 26
3.5 Inter Operator Call Assessment – Consolidated ............................................................................ 28
4 Detailed Findings - Drive Test Data ......................................................................................................... 29
5 Detailed FinDings - COmparison Between PMR Data, 3 Day Lve Data and Live Calling Data ......... 37
5.1 BTS Accumulated Downtime ........................................................................................................... 37
5.2 Worst Affected BTS due to downtime ............................................................................................ 37
5.3 Call Set Up Success Rate................................................................................................................... 38
5.4 SDCCH/Paging Channel Congestion .............................................................................................. 38
5.5 TCH Congestion ................................................................................................................................ 39
5.6 Call Drop Rate ................................................................................................................................... 39
5.7 Cells having greater than 3% TCH drop ......................................................................................... 40
5.8 Voice Quality ..................................................................................................................................... 40
6 Detailed Findings – Non Network Parameters ......................................................................................... 41
6.1 Billing Disputes-Postpaid .................................................................................................................. 41
6.2 Billing Disputes-PREPAID ............................................................................................................... 42

TRAI Audit Wireless Report-West Bengal Circle- JFM Quarter, 2014 JFM Quarter-2014
3
6.3 Resolution of Billing Complaints ..................................................................................................... 42
6.4 Period of Applying Credit/Wavier .................................................................................................. 43
6.5 Call Centre Performance-IVR .......................................................................................................... 43
6.6 Call Centre Performance-Voice to Voice ........................................................................................ 44
6.7 Termination/Closure of Service ....................................................................................................... 44
6.8 Refund of Deposits After closure ..................................................................................................... 45
7 Annexure ..................................................................................................................................................... 46
7.1 Network Availability ......................................................................................................................... 46
7.2 Connection Establishment (Accessibility) ..................................................................................... 47
7.3 Connection Maintenance (Retainability) ....................................................................................... 48
7.4 Voice quality ...................................................................................................................................... 50
7.5 POI Congestion .................................................................................................................................. 51
7.6 Metering and Billing credibility ....................................................................................................... 52
7.7 Customer Care ................................................................................................................................... 53
7.8 Drive Test ........................................................................................................................................... 55
7.8.1 January- Asansol ........................................................................................................................... 55
7.8.2 February- Baharampur ................................................................................................................. 56
7.8.3 March-Jalpaiguri ........................................................................................................................... 58
7.8.4 Signal Strength Data For CDMA Operators............................................................................... 59
7.9 Termination / closure of service ...................................................................................................... 60
7.10 Time taken for refund of deposits after closure ............................................................................. 60
7.11 Additional Network Related parameters ......................................................................................... 61
7.12 Total call made during the drive test .............................................................................................. 63

TRAI Audit Wireless Report-West Bengal Circle- JFM Quarter, 2014 JFM Quarter-2014
4
2 INTRODUCTION
2.1 ABOUT TRAI
TRAI's mission is to create and nurture conditions for growth of telecommunications in the country in a
manner and at a pace that will enable India to play a leading role in the emerging global information
society. One of the main objectives of TRAI is to provide a fair and transparent policy environment
which promotes a level playing field and facilitates fair competition.
In pursuance of above objective, TRAI has been issuing regulations, order and directives to deal with
the issues or complaints raised by the operators as well as the consumers. These regulations, order and
directives have helped the nurture the growth of multi operator multi service- an open competitive
market from a government owned monopoly. Also, the directions, orders and regulations issued cover a
wide range of subjects including tariff, interconnection and quality of service as well as governance of
the Authority.
TRAI initiated a regulation- The Standard of Quality of Service of Basic Telephone Service (Wireline)
and Cellular Mobile Telephone Service regulations, 2009 (7 of 2009) dated the March 20, 2009 and
Quality of Service of Broadband Service Regulations, 2006 (11 of 2006) dated the October 6, 2006
provide for benchmarks for the parameters on customer perception of service to be achieved by service
provider.
In order to assess the above regulations TRAI has commissioned a third party agency to conduct the
audit of the service providers and check the performance of the operators on the various benchmarks
set by Telecom Regulatory Authority of India (TRAI).
2.2 OBJECTIVES
The primary objective of the Audit module is to-
Audit and Assess the Quality of Services being rendered by Basic (Wireline), Cellular Mobile
(Wireless), and Broadband service against the parameters notified by TRAI. (The parameters of
Quality of Services (QoS) have been specified by in the respective regulations published by
TRAI).

TRAI Audit Wireless Report-West Bengal Circle- JFM Quarter, 2014 JFM Quarter-2014
5
2.3 FRAMEWORK USED
Let’s discuss each of the activity in detail and the methodology adopted for each of the module-
2.3.1 PMR REPORTS
Audit Actvities
PMR Reports
Monthly PMR
3 Day Live Data
Customer Service
Drive Test
Operator Assisted
Independent
Live Calling
Billing Complaints
Service Requests
Level 1 Service
Customer Care
Inter Operator call

TRAI Audit Wireless Report-West Bengal Circle- JFM Quarter, 2014 JFM Quarter-2014
6
2.3.1.1 MONTHLY PMR
This involved calculation of the various Quality of Service parameters through monthly Performance
Monitoring Reports (PMR’s). The PMR reports were extracted in presence of IMRB representative from
the operator’s premises for the month of January, February and March. The performance of operators
on various parameters was assessed against the benchmarks. Parameters include-
2.3.1.2 AUDIT PROCEDURE
Below is the key steps followed for extraction of reports at operator premise-
• BTS accumulated downtime
• Worst affected BTS due to downtime
Network Availability
• Call Set Up success Rate (CSSR)
Connection Establishment (Accessibility)
• SDCCH/Paging Channel Congestion
• TCH Congestion
• Point of Interconnection
Network Congestion Parameters
• Call Drop rate
• Worst affected cells having more than 3% TCH drop
Connection Maintenance
• % Connections with good voice quality
Voice Quality

TRAI Audit Wireless Report-West Bengal Circle- JFM Quarter, 2014 JFM Quarter-2014
7
2.3.1.3 AUDIT PARAMETRS
Network Related
The final audit sheet is signed by the operato person in-charge and IMRB personnel along with Stamp.
IMRB Auditors validate the values with raw data and also put in their comments whereever required.
Operators are asked to prepare a report in presence of IMRB personnel from the data extracted and give their comments wherever required. All the comments are stamped and signed by the comcerned person.
After extraction of the parametrs, neceassy mathemetical operations are done to arrive at figures.
The extracted data is validated and verfied by the IMRB auditors.
IMRB auditors visit the respective NOC and extract the information from the server/exchanges/central NOC through FTP.
Audit formats and schedule is shared with the concerned persons. It includes day of the visit and date of 3 day data collection and other requirements.
All the operators operating in the Wireless domain are informed about the Audit. Tender document is taken as a reference document for assimilating the presence of operators.

TRAI Audit Wireless Report-West Bengal Circle- JFM Quarter, 2014 JFM Quarter-2014
8
Customer Service Quality-
Let’s look at each of the parameter in detail and how the value is calculated-
2.3.1.3.1 BTS ACCUMULATED DOWNTIME
The parameter of network availability would be measured from following sub-parameters

TRAI Audit Wireless Report-West Bengal Circle- JFM Quarter, 2014 JFM Quarter-2014
9
1. BTSs Accumulated downtime (not available for service)
2. Worst affected BTSs due to downtime
1. Definition - BTSs accumulated downtime (not available for service) shall basically measure
the downtime of the BTSs, including its transmission links/circuits during the period of a
month, but excludes all planned service downtime for any maintenance or software up
gradation. For measuring the performance against the benchmark for this parameter the
downtime of each BTS lasting more than 1 hour at a time in a day during the period of a month
were considered.
2. Computation Methodology –
BTS accumulated downtime (not available for service) = Sum of downtime of BTSs in a
month in hours i.e. total outage time of all BTSs in hours during a month / (24 x
Number of days in a month x Number of BTSs in the network in licensed service area) x
100
3. TRAI Benchmark –
a. BTSs Accumulated downtime (not available for service) ≤ 2%
4. Audit Procedure –
The fault alarm details at the OMC (MSC) for the network outages (due to own
network elements and infrastructure service provider end outages) was audited
All the BTS in service area were considered. Planned outages due to network
up gradation, routine maintenance were not considered.
Any outage as a result of force majeure were not considered at the time of
calculation
Data is extracted from the server of the operator. This data is in raw format
which is further processed to arrive at the cumulative values.
List of operating sites with cell details and ids are taken from the operator.
When there is any outage a performance report gets generated in line with that
cell resulting and master base of the Accumulated downtime and worst
affected BTS due to downtime.

TRAI Audit Wireless Report-West Bengal Circle- JFM Quarter, 2014 JFM Quarter-2014
10
2.3.1.3.2 WORST AFFECTED BTS DUE TO DOWNTIME
1. Definition – Worst Affected BTS due to downtime shall basically measure percentage of
BTS having downtime greater than 24 hours in a month. Planned outages was not considered as
part while computing.
For measuring the parameter “Percentage of worst affected BTSs due to downtime" the
downtime of each BTS lasting for more than 1 hour at a time in a day during the period of a
month was considered.
2. Computation Methodology –
Worst affected BTSs due to downtime = (Number of BTSs having accumulated
downtime greater than 24 hours in a month / Number of BTS in Licensed Service Area)
* 100
3. TRAI Benchmark –
a. Worst affected BTSs due to downtime ≤ 2%
4. Audit Procedure –
i. The fault alarm details at the OMC (MSC) for the network outages (due to own
network elements and infrastructure service provider end outages) was audited
ii. All the BTS in service area were considered. Planned outages due to network
up gradation, routine maintenance were not considered.
iii. Any outage as a result of force majeure were not considered at the time of
calculation
iv. All the BTS having down time greater than 24 hours is assessed and values of
BTS accumulated downtime is computed in accordance.
2.3.1.3.3 CALL SET-UP SUCCESS RATE (CSSR)
1. Definition: The ratio of calls established to total calls is known Call Set-Up Success Rate
(CSSR).
2. Computation Methodology-
(Calls Established / Total Call Attempts) * 100
Call Established means the following events have happened in call setup:-

TRAI Audit Wireless Report-West Bengal Circle- JFM Quarter, 2014 JFM Quarter-2014
11
call attempt is made
the TCH is allocated
the call is routed to the outward path of the concerned MSC
3. TRAI Benchmark ≥ 95%
4. Audit Procedure –
The cell-wise data generated through counters/ MMC available in the switch
for traffic measurements
CSSR calculation should be measured using OMC generated data only
Measurement should be only in Time Consistent Busy Hour (CBBH) period for
all days of the week
Counter data is extracted from the NOC of the operators.
Total calls established include all calls established excluding Signaling
blocking, TCH Drop and TCH blocking.
The numerator and denominator values are derived from adding the counter
values from the MSC.
2.3.1.3.4 NETWORK CHANNEL CONGESTION- PAGING CHANNEL /TCH
CONGESTION/POI
1. Definition: It means a call is not connected because there is no free channel to serve the call
attempt. This parameter represents congestion in the network. It happens at three levels:
SDCCH Level: Stand-alone dedicated control channel
TCH Level: Traffic Channel
POI Level: Point of Interconnect
2. Computational Methodology:
SDCCH / TCH Congestion% = [(A1 x C1) + (A2 x C2) +…….+ (An x Cn)] / (A1 + A2
+…+ An)
Where:-A1 = Number of attempts to establish SDCCH / TCH made on day 1
C1 = Average SDCCH / TCH Congestion % on day 1

TRAI Audit Wireless Report-West Bengal Circle- JFM Quarter, 2014 JFM Quarter-2014
12
A2 = Number of attempts to establish SDCCH / TCH made on day 2
C2 = Average SDCCH / TCH Congestion % on day 2
An = Number of attempts to establish SDCCH / TCH made on day n
Cn = Average SDCCH / TCH Congestion % on day n
POI Congestion% = [(A1 x C1) + (A2 x C2) +…….+ (An x Cn)] / (A1 + A2 +…+ An)
Where:-A1 = POI traffic offered on all POIs (no. of calls) on day 1
C1 = Average POI Congestion % on day 1
A2 = POI traffic offered on all POIs (no. of calls) on day 2
C2 = Average POI Congestion % on day 2
An = POI traffic offered on all POIs (no. of calls) on day n
Cn = Average POI Congestion % on day n
3. Benchmark:
SDCCH Congestion: ≤ 1%
TCH Congestion: ≤ 2%
POI Congestion: ≤ 0.5%
4. Audit Procedure –
Audit of the details of SDCCH and TCH congestion percentages computed by
the operator (using OMC–Switch data only) would be conducted
The operator should be measuring this parameter during Time consistent busy
hour (TCBH) only SDCCH.
2.3.1.3.5 CALL DROP RATE
1. Definition - The dropped call rate is the ratio of successfully originated calls that were found
to drop to the total number of successfully originated calls that were correctly released.

TRAI Audit Wireless Report-West Bengal Circle- JFM Quarter, 2014 JFM Quarter-2014
13
Total calls dropped = All calls ceasing unnaturally i.e. due to handover or due to radio
loss
Total calls established = All calls that have TCH allocation during busy hour
2. Computational Methodology: (Total Calls Dropped / Total Calls Established) x 100
3. TRAI Benchmark –
Call drop rate ≤ 2%
4. Audit Procedure –
Audit of traffic data of the relevant quarter kept in OMC-R at MSCs and used for
arriving at CDR was used
The operator should only be considering those calls which are dropped during Time
consistent busy hour (TCBH) for all days of the relevant quarter.
2.3.1.3.6 WORST AFFECTED CELLS HAVING MORE THAN 3% TCH DROP
1. Definition- Worst Affected Cells having more than 3% TCH drop shall measure the ratio
of total number of cells in the network to the ratio of cells having more than 3% TCH drop.
2. Computational Methodology: (Total number of cells having more than 3% TCH drop /
Total number of cells in the network) x 100
3. TRAI Benchmark –
Worst affected cells having more than 3% TCH drop rate ≤ 3%
4. Audit Procedure –
Audit of traffic data of the relevant quarter kept in OMC-R at MSCs and used for
arriving at CDR would be conducted.
The operator should only be considering those calls which are dropped during Cell
Bouncing Busy hour (CBBH) for all days of the relevant quarter.
2.3.1.3.7 VOICE QUALITY
1. Definition:

TRAI Audit Wireless Report-West Bengal Circle- JFM Quarter, 2014 JFM Quarter-2014
14
for GSM service providers the calls having a value of 0 –5 are considered to be of good
quality (on a seven point scale)
For CDMA the measure of voice quality is Frame Error Rate (FER). FER is the
probability that a transmitted frame will be received incorrectly. Good voice quality of
a call is considered when it FER value lies between 0 – 4 %
2. Computational Methodology:
% Connections with good voice quality = (No. of voice samples with good voice
quality / Total number of samples) x 100
3. TRAI Benchmark: ≥ 95%
4. Audit Procedure –
a. A sample of calls would be taken randomly from the total calls established.
b. The operator should only be considering those calls which are meeting the desired
benchmark of good voice quality
2.3.1.4 3 DAY LIVE DATA
Network related parameters were evaluated for a period of 3 days in each month. 3 day live audit was
conducted for 3 consecutive weekdays for each month. The data was extracted from each operator’s
server at the end of the 3rd
day. The extracted data was analyzed to assess the various QoS parameters.
2.3.1.5 CUSTOMER SERVICE PARAMETERS
The Customer Service Quality Parameters include metering and billing credibility (postpaid and
prepaid), resolution of billing/charging complaints, period of applying credit/waiver/adjustment to
customer’s account, response time to the customer for assistance, termination/closure of service and
time taken for refund of security deposit after closures. All the customer service parameters were
calculated on the quarterly basis-
Let’s look at each of the parameter one by one -
2.3.1.5.1 METERING AND BILLING CREDIBILITY

TRAI Audit Wireless Report-West Bengal Circle- JFM Quarter, 2014 JFM Quarter-2014
15
Billing complaints includes any of the following complaints related to billing from the point of
view of customer which include:
Local call charges billed as STD/ISD or vice-versa
Toll free numbers charged
Wrong roaming charges
Call made/received disputed
Wrongly charged extra for some service (SIM replacement charged twice, service not
used but charged etc.)
Cheque submitted on time but charged penalty for paying beyond due date (in case
customer is not at fault i.e. all those that operator cannot prove that he/she is not
lying)
Payment made but not reflected (may be wrongly adjusted to another customer etc.)
All the complaints related to billing as per clause 3.7.2 of QoS regulation of 20th
March, 2009 were
covered.
Computational Methodology:
Billing complaints per 100 bills issued = (Total billing complaints** received during
the relevant quarter / Total bills generated* during the relevant quarter)*100
*Operator to include all types of bills generated for customers. This would include
printed bills, online bills and any other forms of bills generated
**Billing complaints here shall include only dispute related issues (including those that
may arise because of a lack of awareness at the subscribers’ end). It does not include
any provisional issues (such as delayed dispatch of billing statements, etc.) in which
the operator has opened a ticket internally.
TRAI Benchmark: <= 0.1%
Audit Procedure:
Audit of billing complaint details for the complaints received during the quarter and
used for arriving at the benchmark reported to TRAI would be conducted
Invalid Complaints: Operator has an automated complain log in system, few of the complaints
get clarified from the IVRS and rest of calls which are through the V2V, dealt by customer

TRAI Audit Wireless Report-West Bengal Circle- JFM Quarter, 2014 JFM Quarter-2014
16
representatives. There are solutions to all possible complaints attended by Customer care
representative.
As per the operators, Complaints pertaining to below categories are classified as invalid-
Activated VAS service by mistake leading to deduction of Balance
Not aware of tariff plan
Internet activated leading to deduction in balance
Not aware of data charges
MMS sent instead of SMS
Someone else in the family made some calls due to which balance is deducted
Roaming resulting in deduction of balance.
Calls made to special numbers
Money not credited for recharge, in some cases vendor has not done it correctly leading to
complaints
This list is indicative and not exhaustive.
2.3.1.5.2 RESOLUTION OF BILLING/CHARGING COMPLAINTS
Computational Methodology:
%age of billing complaints resolved within 4 weeks=(Complaints resolved*** in 4
weeks from date of receipt / Total billing complaints** received during the period) x
100
**Billing complaints here shall include only dispute related issues (including those that
may arise because of a lack of awareness at the subscribers’ end). It does not include
any provisional issues (such as delayed dispatch of billing statements, etc.) in which
the operator has opened a ticket internally. Complaints raised by the consumers to
operator are only considered as part of the calculation.
*** Date of resolution in this case would refer to the date when a communication has
taken place from the operator’s end to inform the complainant about the final
resolution of the issue / dispute.
%age of billing complaints resolved within 4 weeks: 100% within 4 weeks
Period of applying credit/ waiver/adjustment to customer’s account from the date of resolution of complaints: Within One week of resolution of complaints

TRAI Audit Wireless Report-West Bengal Circle- JFM Quarter, 2014 JFM Quarter-2014
17
Audit Procedure:
Audit of ratio of billing complaints resolved to total complaints received during the
quarter used for reporting the benchmark to TRAI would be conducted. At the same
time we would also conduct random live back checks of complaints.
Percentage of cases where credit/wavier or adjustment is given within one week of
resolution of complaints.
2.3.1.5.3 PERIOD OF REFUNDS / PAYMENTS DUE TO CUSTOMERS
Computational Methodology:
Time taken for refund for deposit after closures = (number of cases of refund
after closure done within 60 days/ total number of cases of refund after closure)
* 100
Any case where the operators need to return the amount back to consumers post
closure of service in form of cheque/cash is considered to be refund.
TRAI Benchmark:
Termination/Closure of Service: <=7 days
Time taken for refund for deposit after closures: 100% within 60 days
Audit Procedure:
Operator to provide details of:-
Dates of lodging of all closure request resolved resulting in
requirement of a refund by the operator.
Dates of refund pertaining to all closure request received during the
relevant quarter
Also random live checks of all subscribers entitled for refund would be conducted
2.3.2 DRIVE TEST

TRAI Audit Wireless Report-West Bengal Circle- JFM Quarter, 2014 JFM Quarter-2014
18
A total of 3 SSA were selected and audited in each quarter, 1 SSA in each month.. The methodology
adopted for the drive test-
3 consecutive days drive test in one SSA every month. SSA would be defined as per BSNL and
month wise SSA list will be finalized by regional TRAI office.
Route map was designed in such a way that all the major roads, highways and all the important
towns and villages were covered as part of audit.
Special emphasis will be given to those areas where the number of complaints received is on
the higher side.
We need to define route details so that we cover maximum area in the SSA and try to cover
maximum villages and cities within the SSA. We should also try to design the route such that
there is no overlap and we can start from the point from where we had left last day(if possible).
The route were classified as-
o With In city
o Major Roads
o Highways
o Shopping complex
o Office Complex
There were no fixed calls which we need to do for within city, major roads and highways, but a
minimum of 30 calls in each route, i.e., within city, major roads and highways on each day. For
indoors, 20 calls each for shopping and office complex each day preferably in relatively bigger
city.
The drive test covered selected cities and adjoining towns/rural areas where the service
provider has commenced service, including congested areas and indoor sites.
The drive test of each mobile network was conducted between 10 am and 8 pm on weekdays.
The Vehicle used in the drive tests was equipped with the test tool that automatically generates
calls on the mobile telephone networks.
The speed of the vehicle was kept at around 30-50km/hour (around 30 km/hr in case of
geographically small cities)
The holding period of each test call was 120 seconds.
A test call was generated 10 seconds after the previous test call is completed.
Height of the antenna was kept uniform in case of all service providers.
The parameters which were captured during the drive test include. Below are the parameters which are
captured for the GSM and CDMA operators-
Coverage-Signal strength (GSM)
Total calls made (A)

TRAI Audit Wireless Report-West Bengal Circle- JFM Quarter, 2014 JFM Quarter-2014
19
Number of calls with signal strength between 0 to -75 dBm
Number of calls with signal strength between -75 to -85 dBm
Number of calls with signal strength between -85 to -120 dBm
Coverage-Signal strength (CDMA)
Total Ec/Io BINS (A)
Total Ec/Io BINS with less than –15 (B)
Low Interference = [1 - (B/A)] x 100
Voice quality (GSM)
Total Rx Qual Samples– A
Rx Qual samples with 0-5 value – B
%age samples with good voice quality = B/A x 100
Voice quality (CDMA)
Total FER BINs (forward FER) – A
FER BINs with 0-2 value (forward FER) – B
FER BINs with 0-4 value (forward FER) – C
%age samples with FER bins having 0-2 value (forward FER) = B/A x 100
%age samples with FER bins having 0-4 value (forward FER) = C/A x 100
No. of FER samples with value > 4 = [A-C]
Call setup success rate
Total number of call attempts – A
Total Calls successfully established – B
Call success rate (%age) = (B/A) x 100
Blocked calls
100% - Call Set up Rate
Call drop rate
Total Calls successfully established – A
Total calls dropped after being established – B
Call Drop Rate (%age) = (B/A) x 100
2.3.3 LIVE CALLING
2.3.3.1 BILLING COMPLAINTS
All the complaints booked were treated as the total population for selection of samples. From the population a sample of 100 calls was taken. Telephonic Interviews were done with 100 subscribers per service provider for each service in a licensed service area
TRAI benchmark- % of complaints resolved in 4 weeks – 100%
TRAI Audit Wireless Report-West Bengal Circle- JFM Quarter, 2014 JFM Quarter-2014
20
Metering and billing credibility–Post Paid- Not more than 0.1% of bills issued should be disputed over a billing cycle Metering and billing credibility –- Prepaid - Not more than 1 complaint per 1000 customers i.e. 0.1% complaints for metering, charging, credit, and validity Resolution of billing/ charging complaints - 100% within 4 weeks
2.3.3.2 SERVICE COMPLAINTS REQUESTS
“Service request” means a request made to a service provider by its consumer pertaining to his account,
and includes-
A request for change of tariff plan;
A request for activation or deactivation of a value added service or a supplementary
service or a special pack;
A request for activation of any service available on the service provider’s network;
A request for shift or closure or termination of service or for billing details;
All the complaints other than billing were covered. A total of 100 calls per service provider for each
service in licensed service area were done by the IMRB auditors.
2.3.3.3 LEVEL 1 SERVICE
Level 1 Services include services such as police, fire, ambulance (Emergency services) Test calls were made from all the levels working in a particular SDCA visited. Total sample size (150 per license service area per service per quarter) was equally distributed among the different SDCAs visited, and the distribution among the active levels would be in proportion to the capacity of each level in that SDCA.
2.3.3.4 CUSTOMER CARE
Overall sample size is 2*50 calls per service provider per circle at different points of time, to be evenly distributed across the selected exchanges – 50 calls between 10:00 HRS to 13:00 HRS and 50 calls between 15:00 HRS to 17:00 HRS. The time taken to answer the call through IVR and Customer Care is recorded by the audit agency. TRAI Benchmark- Response time to the customer for assistance: (a) Accessibility of call center/customer care/IVR>= 95% (b) % age of calls answered by the operator (voice to voice): within 60 seconds = 90%
2.3.3.5 INTER OPERATOR CALL ASSESEMENT
A total of 100 calls per service provider to all the other service providers in a licensed service area were done for the purpose of audit.

TRAI Audit Wireless Report-West Bengal Circle- JFM Quarter, 2014 JFM Quarter-2014
21
2.4 OPERATORS COVERED
Operator Number of Subscriber as per VLR
Aircel(DWL) 2886764
Airtel 10203794
BSNL 1432216
Idea 3213944
MTS 1274644
Reliance CDMA 896788
Reliance GSM 6115317
TATA CDMA 10911
TATA GSM 537071
Vodafone 12712243
Not Meeting the benchmark Best Performing Operator
TRAI Audit Wireless Report-West Bengal Circle- JFM Quarter, 2014 JFM Quarter-2014
22
3 EXECUTIVE SUMMARY
3.1 PMR DATA – 3 MONTHS- CONSOLIDATED
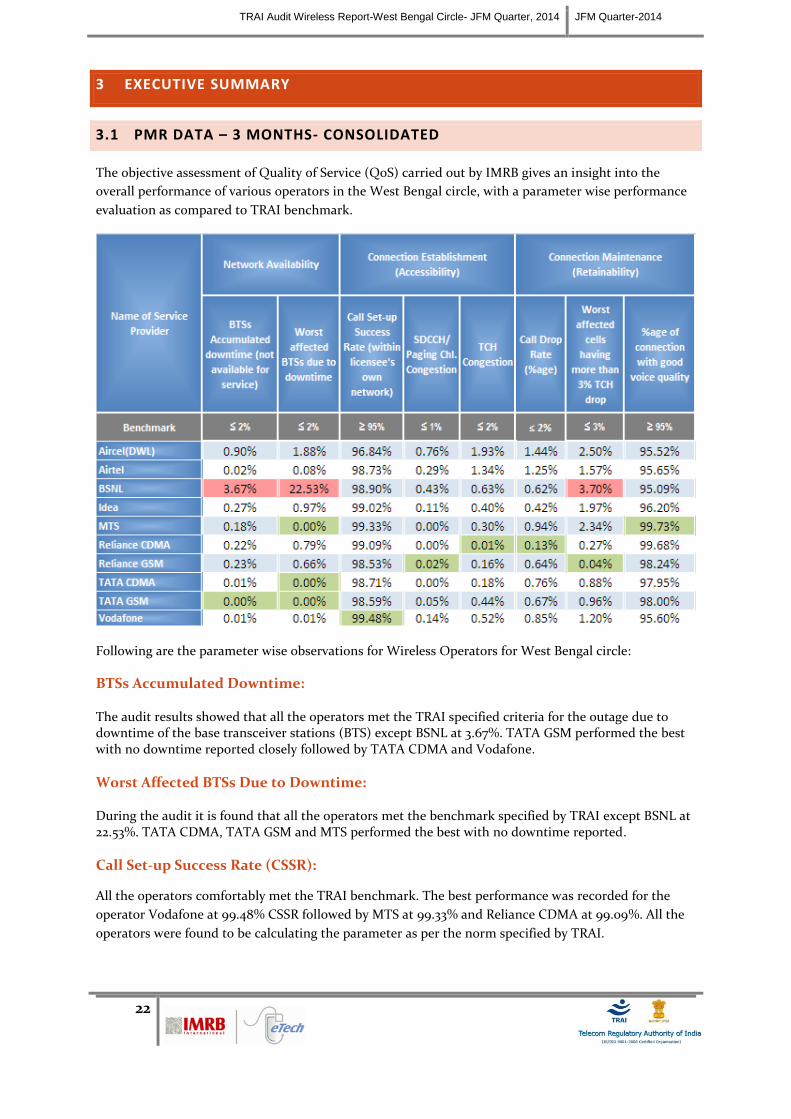
The objective assessment of Quality of Service (QoS) carried out by IMRB gives an insight into the
overall performance of various operators in the West Bengal circle, with a parameter wise performance
evaluation as compared to TRAI benchmark.
Following are the parameter wise observations for Wireless Operators for West Bengal circle:
BTSs Accumulated Downtime: The audit results showed that all the operators met the TRAI specified criteria for the outage due to downtime of the base transceiver stations (BTS) except BSNL at 3.67%. TATA GSM performed the best with no downtime reported closely followed by TATA CDMA and Vodafone.
Worst Affected BTSs Due to Downtime: During the audit it is found that all the operators met the benchmark specified by TRAI except BSNL at 22.53%. TATA CDMA, TATA GSM and MTS performed the best with no downtime reported.
Call Set-up Success Rate (CSSR):
All the operators comfortably met the TRAI benchmark. The best performance was recorded for the
operator Vodafone at 99.48% CSSR followed by MTS at 99.33% and Reliance CDMA at 99.09%. All the
operators were found to be calculating the parameter as per the norm specified by TRAI.

TRAI Audit Wireless Report-West Bengal Circle- JFM Quarter, 2014 JFM Quarter-2014
23
Network Congestion parameters: SDCCH / Paging Channel Congestion, TCH and POI are part of the network congestion parameters. All the operators are meeting the TRAI specified benchmarks on the congestion parameters. Reliance GSM was performing the best in SDCCH congestion of 0.02% and Reliance CDMA in TCH congestion of 0.01%. The calculation methodology of these parameters was found to be in complete accordance with what has been specified by TRAI.
Call Drop Rate: During the audit it was found that all the service providers were measuring this parameter as per the TRAI guidelines. The call drop rate was measured as the ratio of total calls dropped to the total number of call attempts for all operators. All of service providers were found to be meeting the TRAI specified benchmark with Reliance CDMA performing the best vis-à-vis other operator.
Worst Affected Cells Having More than 3% TCH Drop: During the audit it was found that all the service providers were measuring this parameter as per the TRAI guidelines. All the operators were comfortably meeting the benchmark on this parameter except BSNL having 3.70% as call drop. Reliance GSM was performing the best when compared to other service providers.
Voice Quality:
During the audit it was found that all the service providers were meeting the benchmark specified by
TRAI. MTS performed the best having 99.73% as %age of connections with good voice quality.
3.2 3 DAY DATA - CONSOLIDATED

TRAI Audit Wireless Report-West Bengal Circle- JFM Quarter, 2014 JFM Quarter-2014
24
BTSs Accumulated Downtime: The audit results showed that all the operators met the TRAI specified criteria for the outage due to downtime of the base transceiver stations (BTS) except BSNL which recorded accumulated downtime of 2.98%. TATA CDMA performed the best of the lot with near negligible downtime reported, followed by the BTS for TATA GSM and Airtel.
Worst Affected BTSs Due to Downtime: During the audit it is found that all the operators met the benchmark specified by TRAI.
Call Set-up Success Rate (CSSR):
All the operators comfortably met the TRAI benchmark. The best performance was recorded for the
operator MTS at 99.73% CSSR closely followed by Vodafone at 99.70%. All the operators were found to
be calculating the parameter as per the norm specified by TRAI.
Network Congestion parameters: SDCCH / Paging Channel Congestion, TCH and POI are part of the network congestion parameters. All the operators are meeting the TRAI specified benchmarks on the congestion parameters except Aircel and BSNL. Reliance GSM was performing the best on SDCCH congestion parameter and Reliance CDMA on TCH congestion parameter. The calculation methodology of these parameters was found to be in complete accordance with what has been specified by TRAI.
Call Drop Rate: During the audit it was found that all the service providers were measuring this parameter as per the TRAI guidelines. The call drop rate was measured as the ratio of total calls dropped to the total number

TRAI Audit Wireless Report-West Bengal Circle- JFM Quarter, 2014 JFM Quarter-2014
25
of call attempts for all operators. Also, all of service providers were found to be meeting the TRAI specified benchmark. Reliance CDMA was observed to have the lowest call drop rate of 0.12%.
Worst Affected Cells Having More than 3% TCH Drop: During the audit it was found that all the service providers were measuring this parameter as per the TRAI guidelines. All the operators were comfortably meeting the benchmark on this parameter except BSNL, TATA CDMA and TATA GSM. Vodafone followed by Reliance GSM were performing well on this parameter when compared to other service providers.
Voice Quality:
During the audit it was found that all the service providers were meeting the benchmark specified by
TRAI. Reliance CDMA having a score of 99.68% was the best performer on this parameter.
3.3 LIVE CALLING DATA - CONSOLIDATED
Complaints Resolved within 4 weeks
As per the audited records, all the operators resolve the complaints within 4 weeks of registration of
complaints. However, as per the consumers (live calling data) except for only Vodafone no other
operator is able to meet the benchmark.
Complaint/Request Attended to Satisfaction
TRAI Audit Wireless Report-West Bengal Circle- JFM Quarter, 2014 JFM Quarter-2014
26
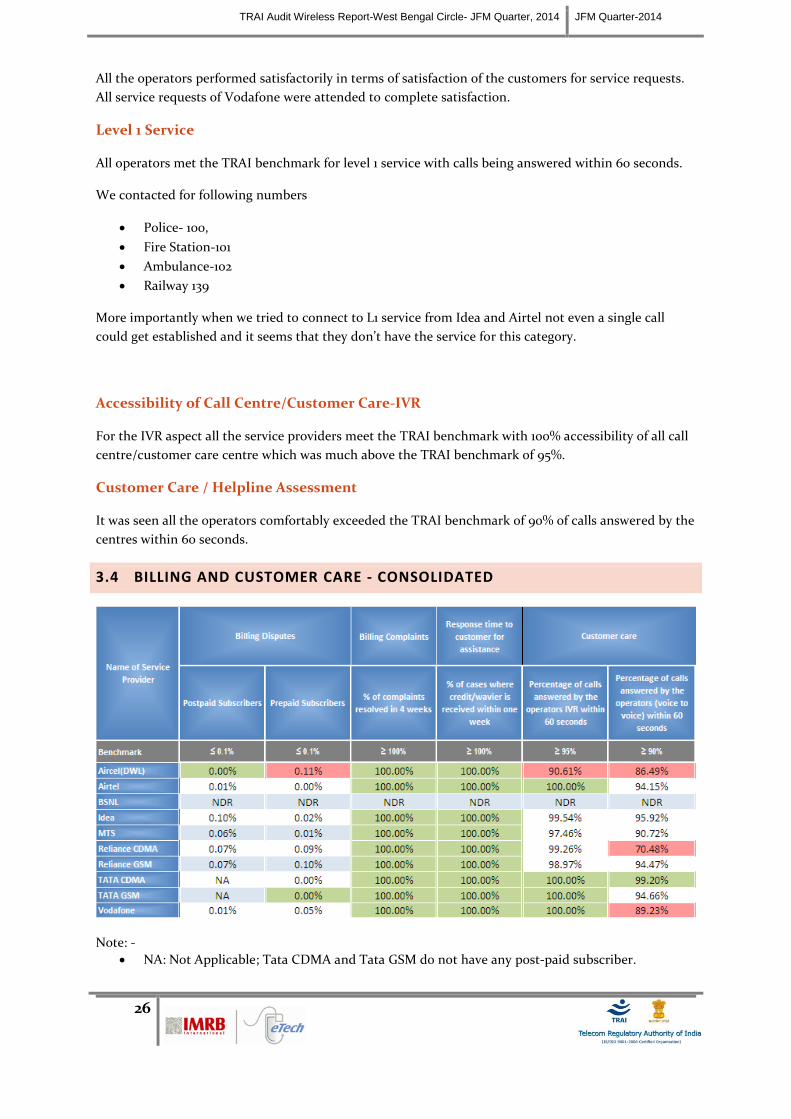
All the operators performed satisfactorily in terms of satisfaction of the customers for service requests.
All service requests of Vodafone were attended to complete satisfaction.
Level 1 Service
All operators met the TRAI benchmark for level 1 service with calls being answered within 60 seconds.
We contacted for following numbers
Police- 100,
Fire Station-101
Ambulance-102
Railway 139
More importantly when we tried to connect to L1 service from Idea and Airtel not even a single call
could get established and it seems that they don’t have the service for this category.
Accessibility of Call Centre/Customer Care-IVR
For the IVR aspect all the service providers meet the TRAI benchmark with 100% accessibility of all call
centre/customer care centre which was much above the TRAI benchmark of 95%.
Customer Care / Helpline Assessment
It was seen all the operators comfortably exceeded the TRAI benchmark of 90% of calls answered by the
centres within 60 seconds.
3.4 BILLING AND CUSTOMER CARE - CONSOLIDATED
Note: -
NA: Not Applicable; Tata CDMA and Tata GSM do not have any post-paid subscriber.

TRAI Audit Wireless Report-West Bengal Circle- JFM Quarter, 2014 JFM Quarter-2014
27
BSNL did not the share the data for customer service Billing Disputes – Postpaid Subscribers
For the billing disputes for the postpaid subscribers, it was seen that all operators met the benchmark
with an average of only 0.05% complaints per operator which was well within the TRAI benchmark of
less than 0.1%. Aircel showed the best performance with no billing dispute against it followed by
Vodafone and Airtel.
Billing Disputes – Prepaid Subscribers
For the prepaid customers, all the operators meet the benchmark comfortably except Aircel. TATA GSM
performed exceedingly well with no billing dispute against it followed by Airtel and TATA CDMA.
Billing Complaints -% of complaints resolved in 4 weeks
It was observed that that all the operators met the TRAI criteria of resolution of complaint within 4
weeks.
Response Time to customer for assistance - % of cases in which advance wavier is
received within one week
It was observed that all the operators met the TRAI benchmark of providing credit or waiver within one
week in case of complaints received.
Customer Care Percentage of calls answered by the operators IVR within 60 seconds
From the audit it can be seen that on an average 98.23% of the calls were answered by the operators IVR
within 60 seconds. Operators Airtel, TATA CDMA, TATA GSM, and Vodafone performed much better
than their counterparts. Aircel did not meet the benchmark of 95% as it was with only 90.61% of its IVR
call being attended within 60 seconds.
Customer Care Percentage of calls answered by the operators (Voice to Voice) within
60 seconds
For the voice to voice calls, on an average 90.11% of the calls were answered within 60 seconds. TATA
CDMA had the highest percentage of calls being answered whereas Aircel, Reliance CDMA, and
Vodafone had failed to meet the TRAI benchmark.

3.5 INTER OPERATOR CALL ASSESSMENT – CONSOLIDATED
In the inter-operator call assessment, calls were made from the test SIMs of service provider whose audit was being conducted to all the other service providers. All
operators were comfortably able to connect with each other where Airtel, BSNL, Reliance CDMA, Reliance GSM, TATA CDMA, TATA GSM and Vodafone were having
100% connectivity.
However, we observe that Aircel faced a little problem while connecting to all other operators except BSNL and Vodafone.
Maximum Problem faced by the calling operator to other operator

4 DETAILED FINDINGS - DRIVE TEST DATA
The drive test was conducted simultaneously for all the operators present in the West Bengal circle. As per the new directive given by TRAI headquarters, drive test
for the month of January, February and March, 2014 were conducted at a SSA level. Drive test was conducted for three days in each SSA and the selection of routes
ensured that the maximum towns, villages, highways are covered as part of drive test. The routes were selected on basis of the complaints received from the
customers. IMRB auditors were present in vehicles of every operator. The holding period for all test calls was 120 seconds.
For measuring voice quality RxQual samples for GSM operators and Frame Error Rate (FERs) for CDMA service providers were measured. RxQual greater than 5
meant that the sample was not of appropriate voice quality and for CDMA operators FERs of more than 4 were considered bad. Call drops were measured by the
number of calls that were dropped to the total number of calls established during the drive test. Similarly CSSR was measured as the ratio of total calls established to
the total call attempts made. Signal strength was measured in Dbm with strength > -75dbm for indoor, -85 dbm for in-vehicle and > -95 dbm outdoor routes.
Below is the schedule of the drive test for the West Bengal circle-
Note: - Before seeing the results for this quarter, it is important to highlight that Vodafone did not share the Signal Strength
data for any of the month.

TRAI Audit Wireless Report-West Bengal Circle- JFM Quarter, 2014 JFM Quarter-2014
30
Route Details – January – Asansol SSA –
January
Asansol
Type of location Day 1 Day 2 Day 3
Outdoor
Major Roads Asansol Sts- Kalipahari-
Roopnarayan-Chittaranjan CLW
Gamon Bridge-DVC More-Piyala More (Gitanjali Park), Ausgram-
Galsi Memari to Kalna
Highways Asansol-Kulti-Salanpur-
Roopnarayanpur-NH2-Ranigunj-Andal-Durgapur
Durgapur Mucchapara-Burdwan-Ghoskhara-ausgram
Burdwan Alamgunj to Memari,Dhatrigram-
Samudragarh-Raigram
With in the City Barakar to NH2 Chourangee More
& Bhirangi more Durgapur
Piyala More-City Centre-Phoolijhor-Hatko More-Bidhan Nagar-Muchipara & City Centre-Gandhimore-Maya Bazar-ASP-
Rauthra-Angadhpur-Gamon Bridge.
Burdwan station to alamgunj & Memari
Indoor Office complex Food Plaza Roy Hotel Hotel priyadarshini
Shopping complex
Govt. Polytechnic College,Chittaranjan
Ghoskhara Municipality Kalna Court

TRAI Audit Wireless Report-West Bengal Circle- JFM Quarter, 2014 JFM Quarter-2014
31
Drive Test Result – January – Asansol SSA
Signal Strength
Voice quality:
In Asansol only Airtel and Reliance CDMA met the benchmark set by TRAI on Voice quality. The benchmark for voice quality is 95%. Reliance GSM and TATA GSM
do not meet the benchmark in indoor and outdoor areas.

TRAI Audit Wireless Report-West Bengal Circle- JFM Quarter, 2014 JFM Quarter-2014
32
CSSR:
All the operators comfortably meet the benchmark except BSNL, Idea, and TATA GSM
Call drop rate:
All the networks comfortably clear the benchmark except BSNL, Reliance GSM, TATA CDMA, and TATA GSM.
Route Details – February – Baharampur SSA –
February
BAHARAMPUR
Type of location Day 1 Day 2 Day 3
Outdoor
Major Roads
Imrb Office – Science City – Rajpur More – Ns Road (Garia) – Tollygunge
– Deshpran Shashmal Road – Tollygunge Faari – Prince Anwar Shah
Road – Golf Green
Joka Diamond Harbour Road – James Long Sarani – Mg Road – Thakurpukur Bus Stand – Durgapur Bridge
South City – Raja Sc Mallick Road – Patuli – Kheada – Nazirabad – Ruby Hospital – Kasba Bridge – Ballygunge – Park Circus – Imrb
Highways
Science City – Leather Complex – Bantala – Jalpath – Khurigachi Road – Sonarpur Railway Gate – Rajpur Faari
– Baruipur More
Baruipur Via Harinavi – Baruipur Poddopukur – Baruiur
Amtala Road – Diamond Harbour Road – Joka – Behal –
Taratala
Taratala Mint – Jhinjira Bazaar – Ankra Station – Nature Park – Cement Kol – Ramnagar – Metiabruz
With in the City Aurobindo Nagar – Jadavpur Central Road – Bijoygarh – Shree Colony – 8b Bus Stand – Central Park -Golfgreen
Motilal Gupta Road – Sakher Bazar – Santosh Ray Road – Barisha – Ray Bahadur Road
New Alipore Road – Tollygunge Circular Road – Patuli Township – Baishnabghata- Peerless Hospital
Indoor Office complex Woodsquare Mall Radhekrishna Dhaba South City Mall
Shopping complex Rajpur Municipality Baruipur Court Patuli Police Station

TRAI Audit Wireless Report-West Bengal Circle- JFM Quarter, 2014 JFM Quarter-2014
33
Drive Test Result – February – Baharampur SSA
Signal Strength
Voice Quality
In Baharampur all the operator meet the benchmark set by TRAI except Aircel, BSNL, Idea, and MTS for outdoor areas. The benchmark for voice quality is 95%.
Whereas BSNL, Idea, MTS, TATA CDMA and Vodafone in outdoor areas.
CSSR:

TRAI Audit Wireless Report-West Bengal Circle- JFM Quarter, 2014 JFM Quarter-2014
34
All the operators comfortably meet the benchmark.
Call drop rate:
All the operators comfortably meet the benchmark except TATA CDMA.
Route Details – March – Jalpaiguri SSA -
March
Jalpaiguri
Type of location Day 1 Day 2 Day 3
Outdoor
Major Roads Dreamland to Pandapara Jalpaiguri town roads Jalpaiguri town roads
Highways Jalpaiguri-Moinaguri-Dhupguri-
Gyarkata-Birpara-banarhat-Chalsa Dhupguri-Salbari-Falakata-Sonarpur-Alipurduar Jalpaiguri-Mohit Nagar-Fulbari-Siliguri
With in the City Dhupgri & Birpara Alipurduar Town Jalpaiguri Town
Indoor
Office complex Janani Hotel Dhupguri Annapurna Hotel Falakata Pizza Restorant
Shopping complex
Jalpaiguri Polytechnic College LIC office Jalpaiguri BDO Office Jalpaiguri

TRAI Audit Wireless Report-West Bengal Circle- JFM Quarter, 2014 JFM Quarter-2014
35
Drive Test Result – March – Jalpaiguri SSA
Signal Strength
Voice Quality
In Baharampur all operator met the benchmark set by TRAI except BSNL and TATA GSM. BSNL does not meet the benchmark in both indoor and outdoor areas
whereas Aircel, TATA CDMA, and TATA GSM do not meet the benchmark only in outdoor areas. The benchmark for voice quality is 95%.

TRAI Audit Wireless Report-West Bengal Circle- JFM Quarter, 2014 JFM Quarter-2014
36
CSSR:
All the operators comfortably meet the benchmark except BSNL in both indoor and outdoor areas
Call drop rate:
All the operators comfortably meet the benchmark except Aircel and TATA GSM.

5 DETAILED FINDINGS - COMPARISON BETWEEN PMR DATA, 3 DAY LVE DATA
AND LIVE CALLING DATA
5.1 BTS ACCUMULATED DOWNTIME
All operators meet the TRAI benchmark of having BTS downtime less than 2% except BSNL. The data in both PMR and Live measurement is similar in all operators.
5.2 WORST AFFECTED BTS DUE TO DOWNTIME
All operators meet the benchmark for the worst affected BTS due to downtime except BSNL and BSNL had a significant difference between PMR and Live Measurement data.
0.90% 0.02% 3.67% 0.27% 0.18% 0.22% 0.23% 0.01% 0.00%
0.01%
1.46%
0.03%
2.98%
0.34%
0.18% 0.37%
0.22%
0.00% 0.01%
0.44%
0%
2%
4%
BTS
s n
ot
avai
lab
le f
or
serv
ice
BTSs acumulated downtime
PMR Data -3 Month Average Live Measurement- 3 Month Average
TRAI Benchmark ≤ 2%
1.88% 0.08%
22.53%
0.97% 0.00%
0.79% 0.66%
0.00% 0.00%
0.01% 1.39% 0.00%
1.63%
0.27% 0.00% 0.00% 0.00% 0.00% 0.00% 0.00% 0.0%2.0%4.0%
6.0%8.0%
10.0%12.0%14.0%16.0%
18.0%20.0%
22.0%24.0%
BTS
s h
avin
g d
ow
nti
me
>2
4 h
ou
rs
Worst affected BTSs
PMR DATA - 3 Month Average Live Measurement- 3 Month Average
TRAI Benchmark ≤ 2%
TRAI Audit Wireless Report-West Bengal Circle- JFM Quarter, 2014 JFM Quarter-2014
38
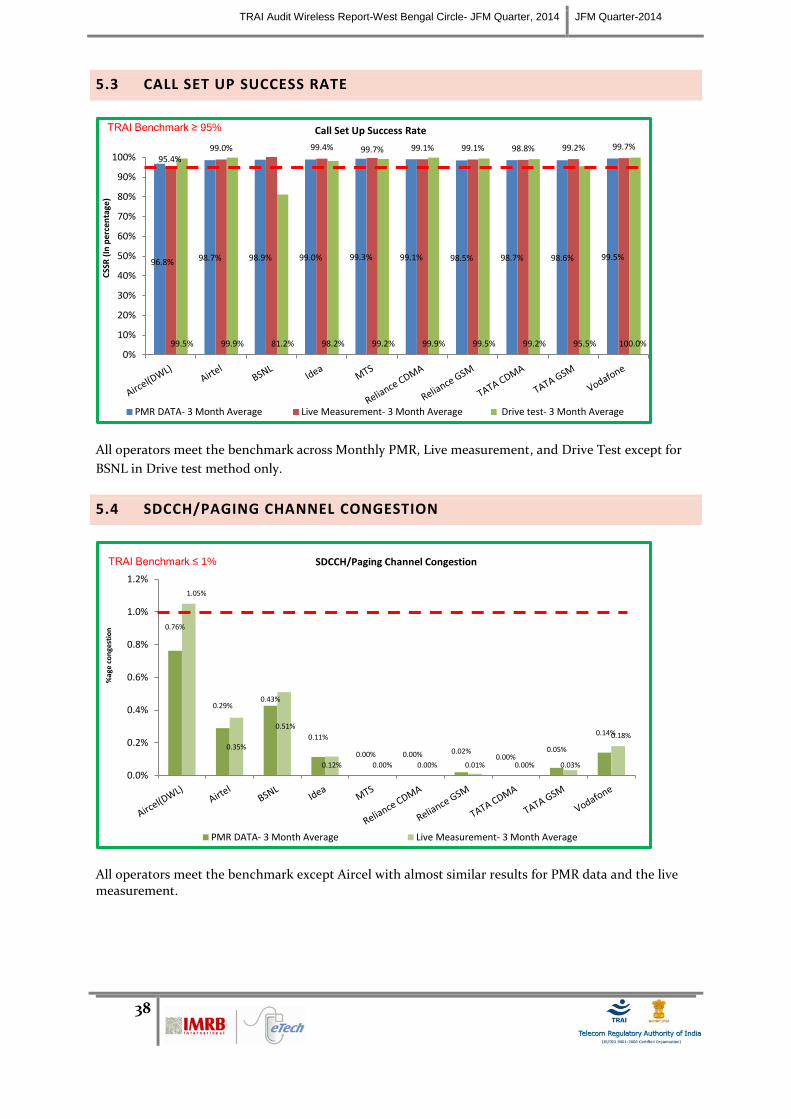
5.3 CALL SET UP SUCCESS RATE
All operators meet the benchmark across Monthly PMR, Live measurement, and Drive Test except for
BSNL in Drive test method only.
5.4 SDCCH/PAGING CHANNEL CONGESTION
All operators meet the benchmark except Aircel with almost similar results for PMR data and the live measurement.
96.8% 98.7% 98.9% 99.0% 99.3% 99.1% 98.5% 98.7% 98.6% 99.5%
95.4% 99.0% 99.4% 99.7% 99.1% 99.1% 98.8% 99.2% 99.7%
99.5% 99.9% 81.2% 98.2% 99.2% 99.9% 99.5% 99.2% 95.5% 100.0% 0%
10%
20%
30%
40%
50%
60%
70%
80%
90%
100%
CSS
R (
In p
erce
nta
ge)
Call Set Up Success Rate
PMR DATA- 3 Month Average Live Measurement- 3 Month Average Drive test- 3 Month Average
TRAI Benchmark ≥ 95%
0.76%
0.29% 0.43%
0.11%
0.00% 0.00% 0.02% 0.00%
0.05%
0.14%
1.05%
0.35%
0.51%
0.12% 0.00% 0.00% 0.01% 0.00% 0.03%
0.18%
0.0%
0.2%
0.4%
0.6%
0.8%
1.0%
1.2%
%ag
e co
nge
stio
n
SDCCH/Paging Channel Congestion
PMR DATA- 3 Month Average Live Measurement- 3 Month Average
TRAI Benchmark ≤ 1%

TRAI Audit Wireless Report-West Bengal Circle- JFM Quarter, 2014 JFM Quarter-2014
39
5.5 TCH CONGESTION
All operators meet the benchmark except Aircel and BSNL but BSNL also had a significant difference between PMR and Live Measurement data.
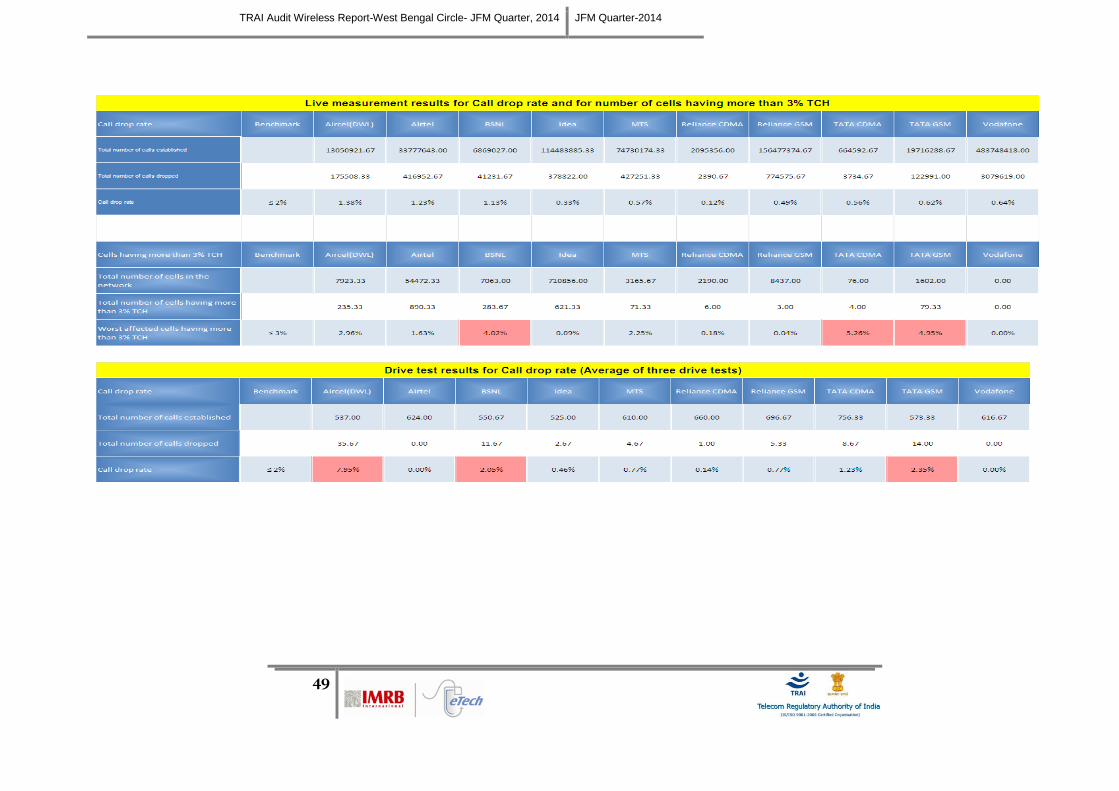
5.6 CALL DROP RATE
All operators meet the benchmark on PMR Data and Live measurement. For the drive test Aircel, BSNL, and TATA GSM do not meet the benchmark.
1.93%
1.34% 0.63% 0.40% 0.30%
0.01% 0.16% 0.18%
0.44% 0.52%
2.14%
1.45%
15.21%
0.19% 0.09%
0.01% 0.04% 0.01% 0.10% 0.30%
0.0%
2.0%
4.0%
6.0%
8.0%
10.0%
12.0%
14.0%
16.0%
18.0%
%ag
e c
on
gest
ion
TCH Congestion
PMR DATA- 3 Month Average Live Measurement- 3 Month Average
TRAI Benchmark ≤ 2%
1.44% 1.25%
0.62%
0.42%
0.94% 0.13%
0.64%
0.76%
0.67% 0.85%
1.38% 1.23%
1.13% 0.33%
0.57%
0.12%
0.49%
0.56%
0.62%
0.64%
7.95%
0.00%
2.05%
0.46% 0.77% 0.14%
0.77%
1.23%
2.35%
0.00%
0.0%
1.0%
2.0%
3.0%
4.0%
5.0%
6.0%
7.0%
8.0%
9.0%
%ag
e c
alls
dro
pp
ed
Call Drop Rate
PMR DATA- 3 Month Average Live Measurement- 3 Month Average Drive Test- 3 Month Average
TRAI Benchmark ≤ 2%

TRAI Audit Wireless Report-West Bengal Circle- JFM Quarter, 2014 JFM Quarter-2014
40
5.7 CELLS HAVING GREATER THAN 3% TCH DROP
All operators have met the benchmark for cells having more than 3% TCH drop except BSNL, TATA CDMA and TATA GSM. There is a huge difference in Three month and Live data for all the operators namely TATA CDMA, and TATA GSM.
5.8 VOICE QUALITY
All operators meet the benchmark for PMR and Live data but for drive test method Aircel, BSNL, Idea,
TATA CDMA, and TATA GSM operator are not able to meet the benchmark
2.50% 1.57%
3.70%
1.97% 2.34% 0.27% 0.04% 0.88% 0.96%
1.20%
2.96%
1.63%
4.02%
0.09%
2.25%
0.18% 0.04%
5.26% 4.95%
0.00%
0.0%
1.0%
2.0%
3.0%
4.0%
5.0%
6.0%
%a
ge
ca
lls d
rop
pe
d
Cells having >3% TCH Drop
PMR Data - Three Month Average Live measurement results-Three Month Average
TRAI Benchmark ≤ 3%
95.52% 95.65% 95.09% 96.20% 99.73% 99.68% 98.24% 97.95% 98.00% 95.60%
95.48% 95.57% 95.07% 97.65% 99.28% 99.68% 98.06% 97.96% 98.21% 96.75%
98.91% 93.39% 91.54% 93.02% 93.76% 94.02% 93.65% 84.07% 92.28% 95.84%
0%
20%
40%
60%
80%
100%
%ag
e c
on
ne
ctio
ns
wit
h g
oo
d v
oic
e q
ual
ity
Voice Quality
PMR DATA- 3 Month Average Live Measurement- 3 Month Average Drive Test- 3 Month Average
TRAI Benchmark ≥ 95%

TRAI Audit Wireless Report-West Bengal Circle- JFM Quarter, 2014 JFM Quarter-2014
41
6 DETAILED FINDINGS – NON NETWORK PARAMETERS
6.1 BILLING DISPUTES-POSTPAID
NDR: No data received
All operators meet the TRAI benchmark for percentage billing disputes for postpaid. We observe that
Idea with 0.1% billing disputes is equal to the benchmark.
0.00%
0.01%
0.10%
0.06%
0.00% 0.00% 0.00% 0.00%
0.01%
0.00%
0.05%
0.10%
0.15%
0.20%
Pe
rce
nta
ge
bill
s d
isp
ute
d
Billing disputes - Postpaid
Audit Results for Billing performance
TRAI Benchmark ≤ 0.1%
NDR

TRAI Audit Wireless Report-West Bengal Circle- JFM Quarter, 2014 JFM Quarter-2014
42
6.2 BILLING DISPUTES-PREPAID
NDR: No data received All the operators met the TRAI benchmark for percentage billing disputes for prepaid except Aircel having 0.11% percentage of bills
6.3 RESOLUTION OF BILLING COMPLAINTS
NDR: No data received
The audit results showed that all the operators met the TRAI benchmark for 100% resolution of
complaints within four weeks however in live calling only Vodafone is able to meet the benchmark.
0.11%
0.00%
0.02% 0.01%
0.00% 0.00% 0.00% 0.00%
0.05%
0.00%
0.05%
0.10%
0.15%
0.20%
Pe
rce
nta
ge
bill
s d
isp
ute
d
Billing disputes - Prepaid
Percentage of complaints
TRAI Benchmark ≤ 0.1%
100.00% 100.00% 100.00% 100.00%
0.00% 0.00%
100.00% 100.00% 100.00%
92.86% 82.00% 85.00%
99.00% 89.00%
95.24% 92.00%
90.00%
89.00%
100.00%
0%
20%
40%
60%
80%
100%
Pe
rce
nta
ge
ca
se
s r
eso
lve
d in
4 w
ee
ks
Resolution of billing complaints
Percentage cases resolved in 4 weeks:Audit results Percentage cases resolved in 4 weeks:Live calling
TRAI Benchmark =100%
NDR
TRAI Audit Wireless Report-West Bengal Circle- JFM Quarter, 2014 JFM Quarter-2014
43
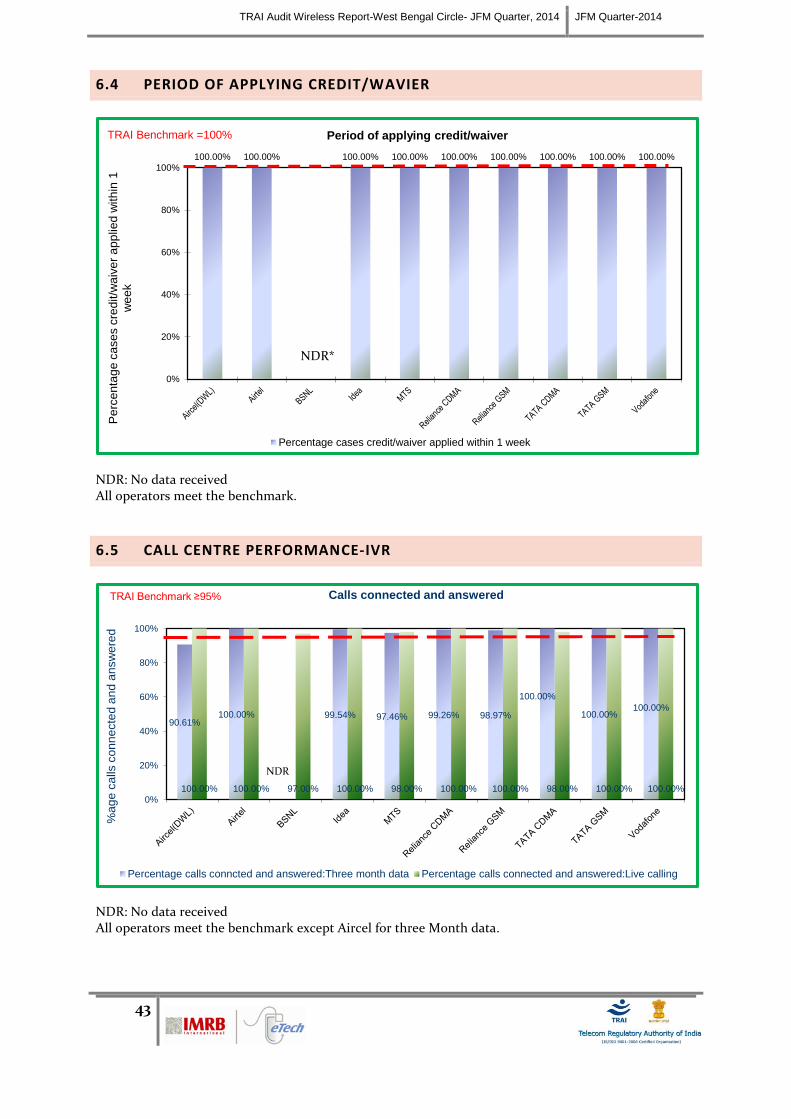
6.4 PERIOD OF APPLYING CREDIT/WAVIER
NDR: No data received All operators meet the benchmark.
6.5 CALL CENTRE PERFORMANCE-IVR
NDR: No data received All operators meet the benchmark except Aircel for three Month data.
100.00% 100.00% 100.00% 100.00% 100.00% 100.00% 100.00% 100.00% 100.00%
0%
20%
40%
60%
80%
100%
Pe
rce
nta
ge
ca
se
s c
red
it/w
aiv
er
ap
plie
d w
ith
in 1
w
ee
k
Period of applying credit/waiver
Percentage cases credit/waiver applied within 1 week
TRAI Benchmark =100%
90.61% 100.00% 99.54% 97.46% 99.26% 98.97%
100.00%
100.00% 100.00%
100.00% 100.00% 97.00% 100.00% 98.00% 100.00% 100.00% 98.00% 100.00% 100.00%
0%
20%
40%
60%
80%
100%
%a
ge
ca
lls c
on
ne
cte
d a
nd
an
sw
ere
d
Calls connected and answered
Percentage calls conncted and answered:Three month data Percentage calls connected and answered:Live calling
TRAI Benchmark ≥95%
NDR*
NDR

TRAI Audit Wireless Report-West Bengal Circle- JFM Quarter, 2014 JFM Quarter-2014
44
6.6 CALL CENTRE PERFORMANCE-VOICE TO VOICE
All operators meet the benchmark except Aircel and Reliance for three Month data.
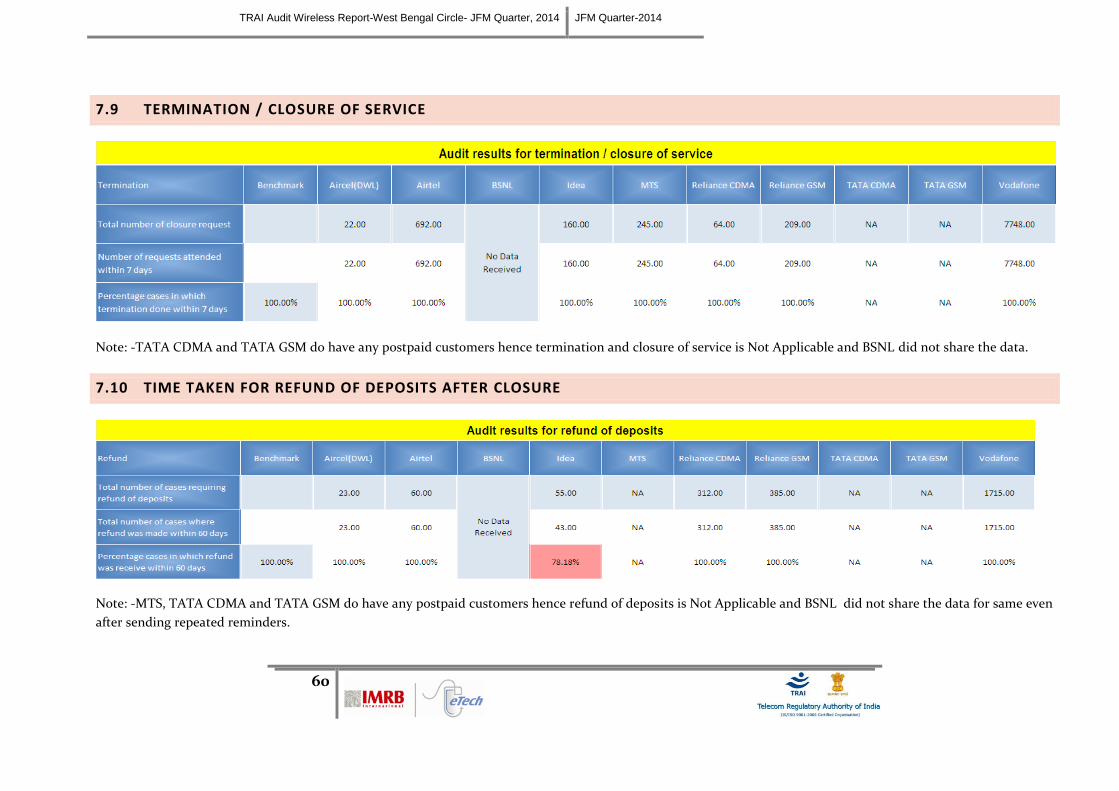
6.7 TERMINATION/CLOSURE OF SERVICE
NA; Not Applicable; No postpaid subscriber All operators meet the benchmark.
86.49% 94.15% 95.92%
90.72%
70.48%
94.47% 99.20%
94.66% 89.23%
100.00% 100.00% 97.00% 100.00% 98.00% 100.00% 100.00% 98.00% 100.00% 100.00%
0%
20%
40%
60%
80%
100%
%a
ge
ca
lls a
nsw
ere
d in
60
se
co
nd
s
Calls answered in 60 seconds (Voice to Voice)
Percentage calls answered in 60 Seconds:One month data Percentage calls answered in 60 seconds: Live calling
TRAI Benchmark ≥ 90%
100.00% 100.00% 100.00% 100.00% 100.00% 100.00%
NA NA
100.00%
0%
20%
40%
60%
80%
100%
Perc
enta
ge c
ases c
losure
att
ended w
ithin
7 d
ays
Termination/Closure of service
Percentage cases closure done within 7 days
TRAI Benchmark =100%
NA

TRAI Audit Wireless Report-West Bengal Circle- JFM Quarter, 2014 JFM Quarter-2014
45
6.8 REFUND OF DEPOSITS AFTER CLOSURE
NA; Not Applicable; No postpaid subscriber All the operators meet the benchmark except Idea.
100.00%
100.00%
78.18%
NA
100.00%
100.00%
NA NA
100.00%
0%
20%
40%
60%
80%
100%
Perc
enta
ge c
ases r
efu
nd p
rovid
ed w
ithin
60 d
ays
Refund of deposts after closure
Percentage cases closure done within 7 days
TRAI Benchmark =100%
NA

7 ANNEXURE
7.1 NETWORK AVAILABILITY

TRAI Audit Wireless Report-West Bengal Circle- JFM Quarter, 2014 JFM Quarter-2014
47
7.2 CONNECTION ESTABLISHMENT (ACCESSIBILITY)

TRAI Audit Wireless Report-West Bengal Circle- JFM Quarter, 2014 JFM Quarter-2014
48
7.3 CONNECTION MAINTENANCE (RETAINABILITY)
TRAI Audit Wireless Report-West Bengal Circle- JFM Quarter, 2014 JFM Quarter-2014
49

TRAI Audit Wireless Report-West Bengal Circle- JFM Quarter, 2014 JFM Quarter-2014
50
7.4 VOICE QUALITY
Note: - Reliance GSM is not sharing the bases for calculating the voice quality, as per the operator it is not feasible to fetch the parameters from the current
equipment being used.

TRAI Audit Wireless Report-West Bengal Circle- JFM Quarter, 2014 JFM Quarter-2014
51
7.5 POI CONGESTION

TRAI Audit Wireless Report-West Bengal Circle- JFM Quarter, 2014 JFM Quarter-2014
52
Note: - It is important to highlight, BSNL failed to share the data for customer service data.
7.6 METERING AND BILLING CREDIBILITY

TRAI Audit Wireless Report-West Bengal Circle- JFM Quarter, 2014 JFM Quarter-2014
53
7.7 CUSTOMER CARE

TRAI Audit Wireless Report-West Bengal Circle- JFM Quarter, 2014 JFM Quarter-2014
54

TRAI Audit Wireless Report-West Bengal Circle- JFM Quarter, 2014 JFM Quarter-2014
55
7.8 DRIVE TEST
Note: - Before seeing the results for this quarter, it is important to highlight that Vodafone did not share the Signal Strength data for any of the month while
submitting the report to IMRB even after contacting the respected person operator failed to share the data.
7.8.1 JANUARY- ASANSOL

TRAI Audit Wireless Report-West Bengal Circle- JFM Quarter, 2014 JFM Quarter-2014
56
7.8.2 FEBRUARY- BAHARAMPUR

TRAI Audit Wireless Report-West Bengal Circle- JFM Quarter, 2014 JFM Quarter-2014
57

TRAI Audit Wireless Report-West Bengal Circle- JFM Quarter, 2014 JFM Quarter-2014
58
7.8.3 MARCH-JALPAIGURI

TRAI Audit Wireless Report-West Bengal Circle- JFM Quarter, 2014 JFM Quarter-2014
59
7.8.4 SIGNAL STRENGTH DATA FOR CDMA OPERATORS
TRAI Audit Wireless Report-West Bengal Circle- JFM Quarter, 2014 JFM Quarter-2014
60
7.9 TERMINATION / CLOSURE OF SERVICE
Note: -TATA CDMA and TATA GSM do have any postpaid customers hence termination and closure of service is Not Applicable and BSNL did not share the data.
7.10 TIME TAKEN FOR REFUND OF DEPOSITS AFTER CLOSURE
Note: -MTS, TATA CDMA and TATA GSM do have any postpaid customers hence refund of deposits is Not Applicable and BSNL did not share the data for same even
after sending repeated reminders.
TRAI Audit Wireless Report-West Bengal Circle- JFM Quarter, 2014 JFM Quarter-2014
61
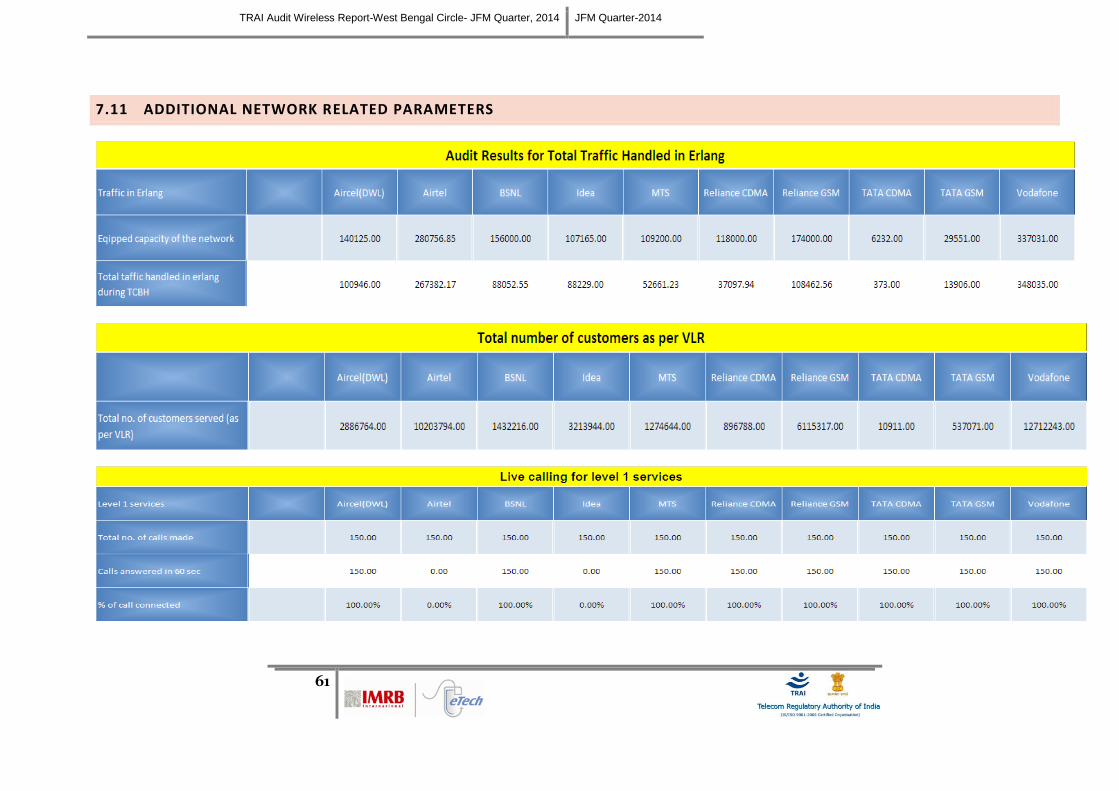
7.11 ADDITIONAL NETWORK RELATED PARAMETERS

TRAI Audit Wireless Report-West Bengal Circle- JFM Quarter, 2014 JFM Quarter-2014
62
Note: -Please note that we were not able to connect to none of the level 1 service numbers for Idea and Airtel. The calls were not going through to any of the level 1
numbers for these two operators.

TRAI Audit Wireless Report-West Bengal Circle- JFM Quarter, 2014 JFM Quarter-2014
63
7.12 TOTAL CALL MADE DURING THE DRIVE TEST
Note: - IMRB International, ensures minimum of 100 km is travelled on each day.

8, Balaji Estate, Guru RavidassMarg,
New Delhi, DL 110 019, India
+91 (11) 4269 7800
www.imrbint.com