trai audit wireless report for kolkata circle · trai audit wireless report-kolkata circle jas...
TRANSCRIPT
TRAI Audit Wireless
Report for Kolkata
Circle
EAST ZONE
Prepared by:
`
Submitted to:
QE September 2016
TRAI Audit Wireless Report-Kolkata Circle JAS Quarter-2016
1
1 TABLE OF CONTENTS
2 Introduction .................................................................................................................................................. 7
2.1 About TRAI .......................................................................................................................................... 7
2.2 Objectives ............................................................................................................................................ 7
2.3 Coverage ............................................................................................................................................... 8
2.4 Framework used .................................................................................................................................. 8
2.4.1 PMR Reports ................................................................................................................................... 9
2.4.2 Live Calling .................................................................................................................................... 22
2.4.3 Voice Drive Test – 2g & 3G........................................................................................................... 25
2.4.4 Wireless Data Drive Test – 2G & 3G ........................................................................................... 28
2.5 Operators Covered 2G and 3G ......................................................................................................... 32
2.6 Colour Codes to read the report ...................................................................................................... 32
3 Executive Summary-2G .............................................................................................................................. 33
3.1 PMR Data – 3 Months- Consolidated for 2G .................................................................................. 33
3.1.1 PMR Data - JULY FOR 2G ............................................................................................................ 35
3.1.2 PMR Data – AUGUST FOR 2G .................................................................................................... 35
3.1.3 PMR Data - SEPTEMBER FOR 2G .............................................................................................. 36
3.2 3 Days live Data – Consolidated for 2G ........................................................................................... 37
3.2.1 3 Day Data - JULY FOR 2G ........................................................................................................... 38
3.2.2 3 Day Data – AUGUST FOR 2G ................................................................................................... 38
3.2.3 3 Day Data - SEPTEMBER FOR 2G ............................................................................................. 39
3.3 PMR Data – 3 Months- Consolidated for 3G .................................................................................. 40
3.3.1 PMR Data - July for 3G .................................................................................................................. 41
3.3.2 PMR Data – August for 3G ............................................................................................................ 41
3.3.3 PMR Data - September for 3G ...................................................................................................... 41
3.4 3 Day live Data – Consolidated for 3G ............................................................................................ 42
3.4.1 3 Day Data - July for 3G ................................................................................................................ 43
3.4.2 3 Day Data – August for 3G .......................................................................................................... 43
3.4.3 3 Day Data - September for 3G .................................................................................................... 43
3.5 Wireless data PMR & 3 Day Live – Consolidated for 2G ............................................................... 44
TRAI Audit Wireless Report-Kolkata Circle JAS Quarter-2016
2
3.6 Wireless data PMR & 3 Day Live – Consolidated for 3G ............................................................... 45
3.7 Live Calling Data - Consolidated ..................................................................................................... 46
3.8 Billing and customer care - Consolidated ...................................................................................... 47
3.9 Inter Operator Call Assessment - Consolidated ............................................................................ 48
3.10 Comparison Between IMRB and Operator’s data for PMR 2G ..................................................... 49
3.11 Comparison Between IMRB and Operator’s data for PMR 3G ..................................................... 49
4 Critical Findings.......................................................................................................................................... 50
5 Parameter Description & Detailed Findings - Comparison Between PMR Data, 3 Day Live Data and Live Calling Data for 2G ...................................................................................................................................... 51
5.1 BTS Accumulated Downtime ............................................................................................................ 51
5.1.1 Parameter Description .................................................................................................................. 51
5.1.2 Key Findings - Consolidated ........................................................................................................ 52
5.2 Worst Affected BTS due to downtime ............................................................................................ 55
5.2.1 Parameter Description ................................................................................................................. 55
5.2.2 Key Findings – Consolidated ....................................................................................................... 56
5.3 Call Set Up Success Rate................................................................................................................... 59
5.3.1 Parameter Description ................................................................................................................. 59
5.3.2 Key Findings - Consolidated ........................................................................................................ 60
5.4 Network Channel Congestion- Paging Channel /TCH Congestion/POI .................................... 62
5.4.1 Parameter Description ................................................................................................................. 62
5.4.2 Key Findings - SDCCH/Paging Channel Congestion (Consolidated) ..................................... 63
5.4.3 Key Findings – TCH Congestion (Consolidated)....................................................................... 66
5.4.4 Key Findings – POI Congestion (Consolidated) – Average of 3 months ................................. 68
5.5 Call Drop Rate ................................................................................................................................... 72
5.5.1 Parameter Description ................................................................................................................. 72
5.5.2 Key Findings - Consolidated ........................................................................................................ 73
5.6 Cells having greater than 3% TCH drop ......................................................................................... 75
5.6.1 Parameter Description ................................................................................................................. 75
5.6.2 Key Findings - Consolidated ........................................................................................................ 75
5.7 Voice Quality ..................................................................................................................................... 78
5.7.1 Parameter Description ................................................................................................................. 78

TRAI Audit Wireless Report-Kolkata Circle JAS Quarter-2016
3
5.7.2 Key Findings .................................................................................................................................. 79
6 Parameter Description & Detailed Findings - Comparison Between PMR Data, 3 Day Live Data and Live Calling Data for 3G ...................................................................................................................................... 81
6.1 Node Bs downtime ............................................................................................................................. 81
6.1.1 Parameter Description .................................................................................................................. 81
6.1.2 Key Findings - Consolidated ........................................................................................................ 82
6.2 Worst affected Node Bs due to downtime ..................................................................................... 85
6.2.1 Parameter Description ................................................................................................................. 85
6.2.2 Key Findings – Consolidated ....................................................................................................... 86
6.3 Call Set Up Success Rate................................................................................................................... 88
6.3.1 Parameter Description ................................................................................................................. 88
6.3.2 Key Findings - Consolidated ........................................................................................................ 89
6.4 Network Channel Congestion- RRC Congestion/ Circuit Switched RAB Congestion ............... 92
6.4.1 Parameter Description ................................................................................................................. 92
6.4.2 Key Findings - RRC Congestion (Consolidated) ........................................................................ 94
6.4.3 Key Findings – Circuit Switched RAB Congestion (Consolidated) ......................................... 96
6.5 Circuit Switched Voice Drop Rate ................................................................................................... 98
6.5.1 Parameter Description ................................................................................................................. 98
6.5.2 Key Findings - Consolidated ........................................................................................................ 99
6.6 Worst affected cells having more than 3% Circuit Switched Voice Drop Rate ......................... 101
6.6.1 Parameter Description ................................................................................................................ 101
6.6.2 Key Findings - Consolidated ....................................................................................................... 102
6.7 Circuit Switch Voice Quality ..........................................................................................................104
6.7.1 Parameter Description ................................................................................................................104
6.7.2 Key Findings ................................................................................................................................. 105
7 Parameter Description & Detailed Findings - Wireless Data Services 2G ........................................... 107
7.1 Service Activation /Provisioning for 2G ......................................................................................... 107
7.1.1 Parameter Description ................................................................................................................ 107
7.2 PDP Context Activation Success Rate for 2G ................................................................................ 110
7.2.1 Parameter Description ................................................................................................................ 110
7.2.2 Key Findings .................................................................................................................................. 111
TRAI Audit Wireless Report-Kolkata Circle JAS Quarter-2016
4
7.3 Drop rate for 2G ................................................................................................................................ 113
7.3.1 Parameter Description ................................................................................................................. 113
7.3.2 Key Findings .................................................................................................................................. 113
8 Parameter Description & Detailed Findings - Wireless Data Services 3G ........................................... 116
8.1 Service Activation /Provisioning for 3G ......................................................................................... 116
8.1.1 Parameter Description ................................................................................................................ 116
8.1.2 Key Findings ................................................................................................................................. 116
8.2 PDP Context Activation Success Rate for 3G ................................................................................ 119
8.2.1 Parameter Description ................................................................................................................ 119
8.2.2 Key Findings ................................................................................................................................. 120
8.3 Drop rate for 3G ............................................................................................................................... 122
8.3.1 Parameter Description ................................................................................................................ 122
8.3.2 Key Findings ................................................................................................................................. 122
9 Parameter Description and Detailed Findings – Non-Network Parameters ....................................... 125
9.1 Metering and billing credibility ...................................................................................................... 125
9.1.1 Parameter Description ................................................................................................................ 125
9.1.2 Key Findings – Metering and billing credibility (Postpaid) .................................................... 127
9.1.3 Key Findings - Metering and billing credibility (Prepaid) ...................................................... 128
9.2 Resolution of Billing/ Charging Complaints ................................................................................. 129
9.2.1 Parameter Description ................................................................................................................ 129
9.2.2 Key Findings - within 4 weeks .................................................................................................... 130
9.2.3 Key Findings within 6 weeks ....................................................................................................... 131
9.3 Period of Applying Credit/Wavier ................................................................................................. 132
9.3.1 Parameter Description ................................................................................................................ 132
9.3.2 Key Findings ................................................................................................................................. 133
9.4 Call Centre Performance-IVR ......................................................................................................... 134
9.4.1 Parameter Description ................................................................................................................ 134
9.4.2 Key Findings ................................................................................................................................. 135
9.5 Call Centre Performance-Voice to Voice ....................................................................................... 136
9.5.1 Parameter Description ................................................................................................................ 136

TRAI Audit Wireless Report-Kolkata Circle JAS Quarter-2016
5
9.5.2 Key Findings ................................................................................................................................. 137
9.6 Termination/Closure of Service ...................................................................................................... 138
9.6.1 Parameter Description ................................................................................................................ 138
9.6.2 Key Findings ................................................................................................................................. 138
9.7 Refund of Deposits After closure .................................................................................................... 139
9.7.1 Parameter Description ................................................................................................................ 139
9.7.2 Key Findings .................................................................................................................................140
10 Detailed Findings - Drive Test Data ........................................................................................................ 141
10.1 Operator Assisted Drive Test - voice ............................................................................................. 141
10.1.1 Kolkata SSA .............................................................................................................................. 142
11 Annexure – Consolidated-2G ................................................................................................................... 152
11.1 Network Availability ........................................................................................................................ 152
11.2 Connection Establishment (Accessibility) .................................................................................... 153
11.3 Connection Maintenance (Retainability) ...................................................................................... 154
11.4 Voice quality ..................................................................................................................................... 155
11.5 POI Congestion ................................................................................................................................ 156
11.6 Additional Network Related parameters ....................................................................................... 157
12 Annexure – Consolidated-3G ................................................................................................................... 158
12.1 Network Availability ........................................................................................................................ 158
12.2 Connection Establishment (Accessibility) .................................................................................... 159
12.3 Connection Maintenance (Retainability) ..................................................................................... 160
12.4 Voice quality ..................................................................................................................................... 161
12.5 POI Congestion ................................................................................................................................ 162
12.6 Additional Network Related parameters ....................................................................................... 163
13 Annexure – Customer Services .................................................................................................................164
13.1 Metering and billing credibility ......................................................................................................164
13.2 Customer Care .................................................................................................................................. 167
13.3 Termination / closure of service .................................................................................................... 168
13.4 Time taken for refund of deposits after closure ........................................................................... 168
13.5 Live Calling Results for Resolution of Service Requests ............................................................. 169

TRAI Audit Wireless Report-Kolkata Circle JAS Quarter-2016
6
13.6 Live Calling Results for Level 1 Services ........................................................................................ 169
13.7 Level 1 Service calls made ................................................................................................................ 170
13.8 Counter Details ................................................................................................................................ 185
13.8.1 Ericsson .................................................................................................................................... 187
13.8.2 NSN (Nokia Siemens Networks) ........................................................................................... 188
13.8.3 Huawei..................................................................................................................................... 189
13.9 Block Schematic Diagrams .............................................................................................................. 191
13.9.1 Ericsson .................................................................................................................................... 191
13.9.2 NSN (Nokia Siemens Networks) ............................................................................................ 192
13.9.3 Huawei...................................................................................................................................... 193
14 Annexure – July -2G .................................................................................................................................. 194
15 Annexure – August-2G ............................................................................................................................. 199
16 Annexure – September-2G ....................................................................................................................... 204
17 Annexure – July -3G .................................................................................................................................. 209
18 Annexure – August-3G .............................................................................................................................. 214
19 Annexure – September-3G ........................................................................................................................ 219
20 Abbreviations ............................................................................................................................................ 224
TRAI Audit Wireless Report-Kolkata Circle JAS Quarter-2016
7
2 INTRODUCTION
2.1 ABOUT TRAI
TRAI's mission is to create and nurture conditions for growth of telecommunications in the country in a
manner and at a pace that will enable India to play a leading role in the emerging global information
society. One of the main objectives of TRAI is to provide a fair and transparent policy environment
which promotes a level playing field and facilitates fair competition.
In pursuance of above objective, TRAI has been issuing regulations, order and directives to deal with
the issues or complaints raised by the operators as well as the consumers. These regulations, order and
directives have helped to nurture the growth of multi operator multi service - an open competitive
market from a government owned monopoly. Also, the directions, orders and regulations issued cover a
wide range of subjects including tariff, interconnection and quality of service as well as governance of
the Authority.
TRAI initiated a regulation - The Standard of Quality of Service of Basic Telephone Service (Wireline)
and Cellular Mobile Telephone Service regulations, 2009 (7 of 2009) dated December 20, 2009 and
Quality of Service of Broadband Service Regulations, 2006 (11 of 2006) dated October 6, 2006 that
provide the benchmarks for the parameters on customer perception of service to be achieved by service
provider.
In order to assess the above regulations, TRAI has commissioned a third party agency to conduct the
audit of the service providers and check the performance of the operators on the various benchmarks
set by Telecom Regulatory Authority of India (TRAI).
2.2 OBJECTIVES
The primary objective of the Audit module is to-
Audit and Assess the Quality of Services being rendered by Basic (Wireline), Cellular Mobile
(Wireless), and Broadband service against the parameters notified by TRAI. (The parameters of
Quality of Services (QoS) have been specified by in the respective regulations published by
TRAI).
This report covers the audit results of the audit conducted for Cellular Mobile (Wireless)
services in Kolkata circle.

TRAI Audit Wireless Report-Kolkata Circle JAS Quarter-2016
8
2.3 COVERAGE
The audit was conducted in Kolkata circle covering all the SSAs (Secondary Switching Areas).
2.4 FRAMEWORK USED
Let’s discuss each of the activity in detail and the methodology adopted for each of the module.
Audit Actvities
PMR Reports
Monthly PMR
3 Day Live Data
Customer Service
Drive Test
Operator Assisted
Independent
Live Calling
Billing Complaints
Service Requests
Level 1 Service
Customer Care
Inter Operator call
TRAI Audit Wireless Report-Kolkata Circle JAS Quarter-2016
9
2.4.1 PMR REPORTS
2.4.1.1 SIGNIFICANCE AND METHODOLOGY
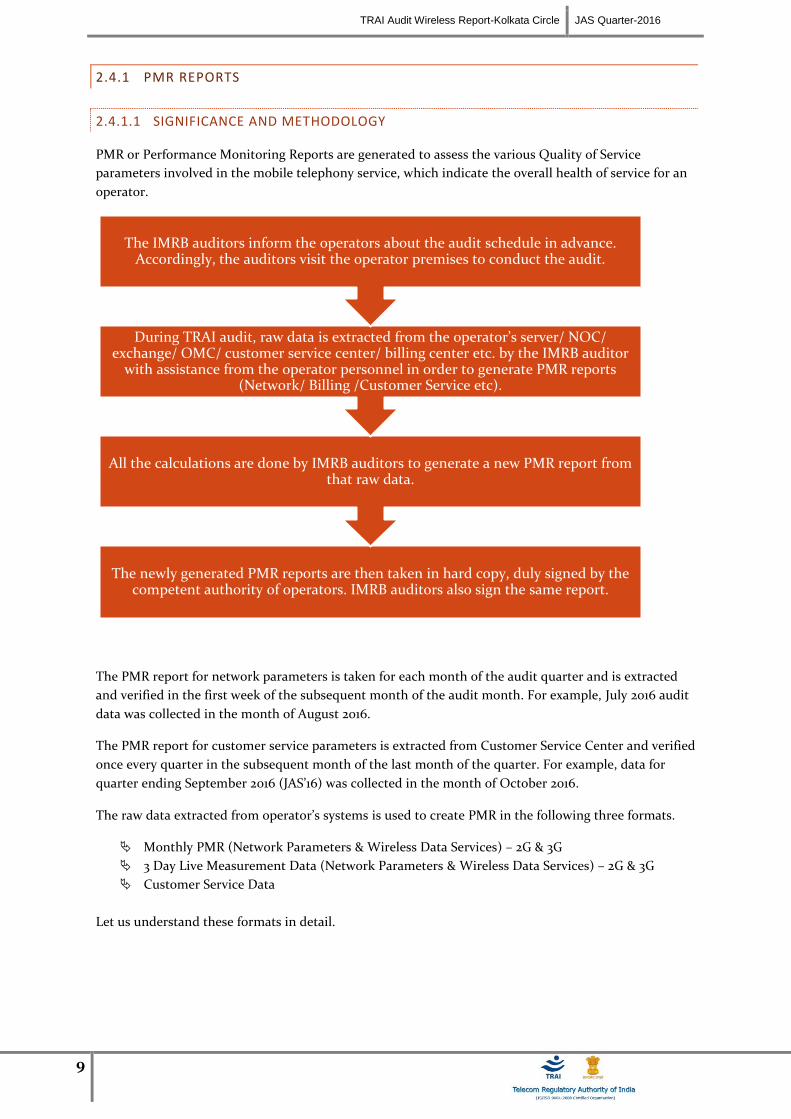
PMR or Performance Monitoring Reports are generated to assess the various Quality of Service
parameters involved in the mobile telephony service, which indicate the overall health of service for an
operator.
The PMR report for network parameters is taken for each month of the audit quarter and is extracted
and verified in the first week of the subsequent month of the audit month. For example, July 2016 audit
data was collected in the month of August 2016.
The PMR report for customer service parameters is extracted from Customer Service Center and verified
once every quarter in the subsequent month of the last month of the quarter. For example, data for
quarter ending September 2016 (JAS’16) was collected in the month of October 2016.
The raw data extracted from operator’s systems is used to create PMR in the following three formats.
Monthly PMR (Network Parameters & Wireless Data Services) – 2G & 3G
3 Day Live Measurement Data (Network Parameters & Wireless Data Services) – 2G & 3G
Customer Service Data
Let us understand these formats in detail.
The newly generated PMR reports are then taken in hard copy, duly signed by the competent authority of operators. IMRB auditors also sign the same report.
All the calculations are done by IMRB auditors to generate a new PMR report from that raw data.
During TRAI audit, raw data is extracted from the operator’s server/ NOC/ exchange/ OMC/ customer service center/ billing center etc. by the IMRB auditor
with assistance from the operator personnel in order to generate PMR reports (Network/ Billing /Customer Service etc).
The IMRB auditors inform the operators about the audit schedule in advance. Accordingly, the auditors visit the operator premises to conduct the audit.

TRAI Audit Wireless Report-Kolkata Circle JAS Quarter-2016
10
2.4.1.2 MONTHLY PMR 2G
This involved calculation of the various 2G Quality of Service network parameters through monthly
Performance Monitoring Reports (PMR). The PMR reports were generated from the data extracted from
operator’s systems by the IMRB representative with the assistance of the operator at the operator’s
premises for the month of July, August and September 2016. The performance of operators on various
parameters was assessed against the benchmarks. Parameters include-
All the parameters have been described in detail along with key findings of the parameters in section 5
of the report. The benchmark values for each parameter have been given in the table below.
• BTS accumulated downtime
• Worst affected BTS due to downtime
Network Availability
• Call Set Up success Rate (CSSR)
Connection Establishment (Accessibility)
• SDCCH/Paging Channel Congestion
• TCH Congestion
• Point of Interconnection
Network Congestion Parameters
• Call Drop rate
• Worst affected cells having more than 3% TCH drop
Connection Maintenance
• % Connections with good voice quality
Voice Quality
TRAI Audit Wireless Report-Kolkata Circle JAS Quarter-2016
11
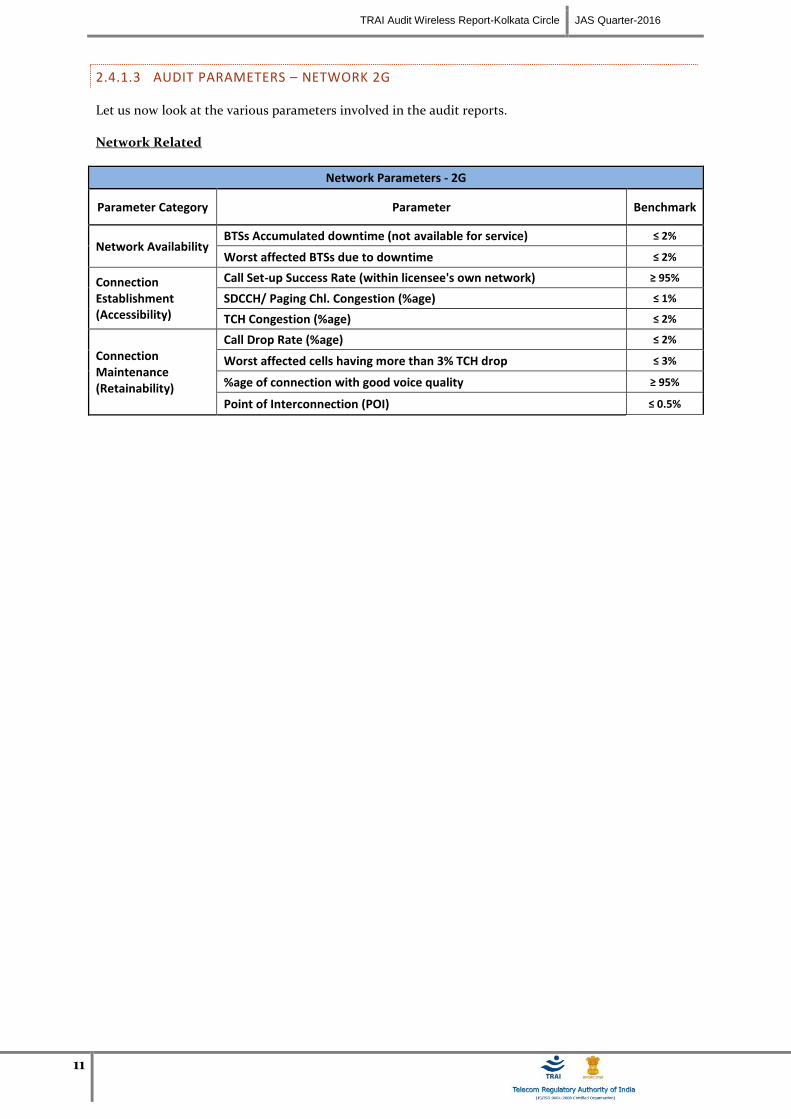
2.4.1.3 AUDIT PARAMETERS – NETWORK 2G
Let us now look at the various parameters involved in the audit reports.
Network Related
Network Parameters - 2G
Parameter Category Parameter Benchmark
Network Availability BTSs Accumulated downtime (not available for service) ≤ 2%
Worst affected BTSs due to downtime ≤ 2%
Connection Establishment (Accessibility)
Call Set-up Success Rate (within licensee's own network) ≥ 95%
SDCCH/ Paging Chl. Congestion (%age) ≤ 1%
TCH Congestion (%age) ≤ 2%
Connection Maintenance (Retainability)
Call Drop Rate (%age) ≤ 2%
Worst affected cells having more than 3% TCH drop ≤ 3%
%age of connection with good voice quality ≥ 95%
Point of Interconnection (POI) ≤ 0.5%
TRAI Audit Wireless Report-Kolkata Circle JAS Quarter-2016
12
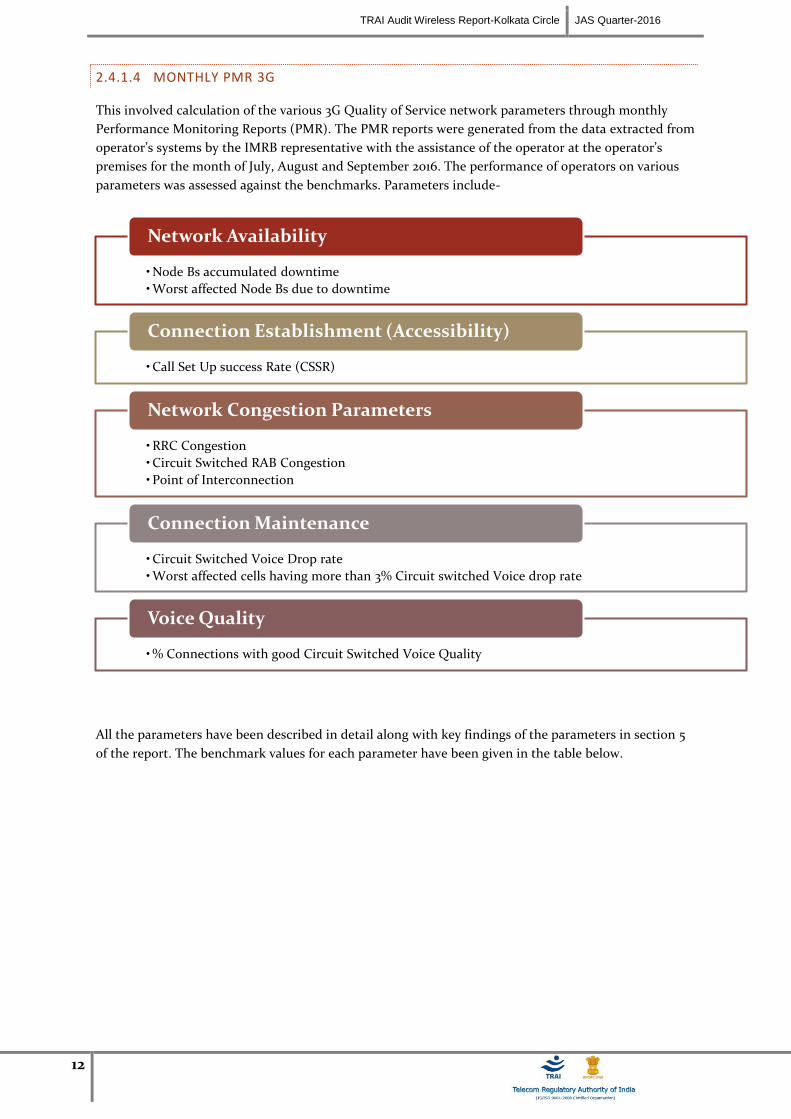
2.4.1.4 MONTHLY PMR 3G
This involved calculation of the various 3G Quality of Service network parameters through monthly
Performance Monitoring Reports (PMR). The PMR reports were generated from the data extracted from
operator’s systems by the IMRB representative with the assistance of the operator at the operator’s
premises for the month of July, August and September 2016. The performance of operators on various
parameters was assessed against the benchmarks. Parameters include-
All the parameters have been described in detail along with key findings of the parameters in section 5
of the report. The benchmark values for each parameter have been given in the table below.
• Node Bs accumulated downtime
• Worst affected Node Bs due to downtime
Network Availability
• Call Set Up success Rate (CSSR)
Connection Establishment (Accessibility)
• RRC Congestion
• Circuit Switched RAB Congestion
• Point of Interconnection
Network Congestion Parameters
• Circuit Switched Voice Drop rate
• Worst affected cells having more than 3% Circuit switched Voice drop rate
Connection Maintenance
• % Connections with good Circuit Switched Voice Quality
Voice Quality
TRAI Audit Wireless Report-Kolkata Circle JAS Quarter-2016
13
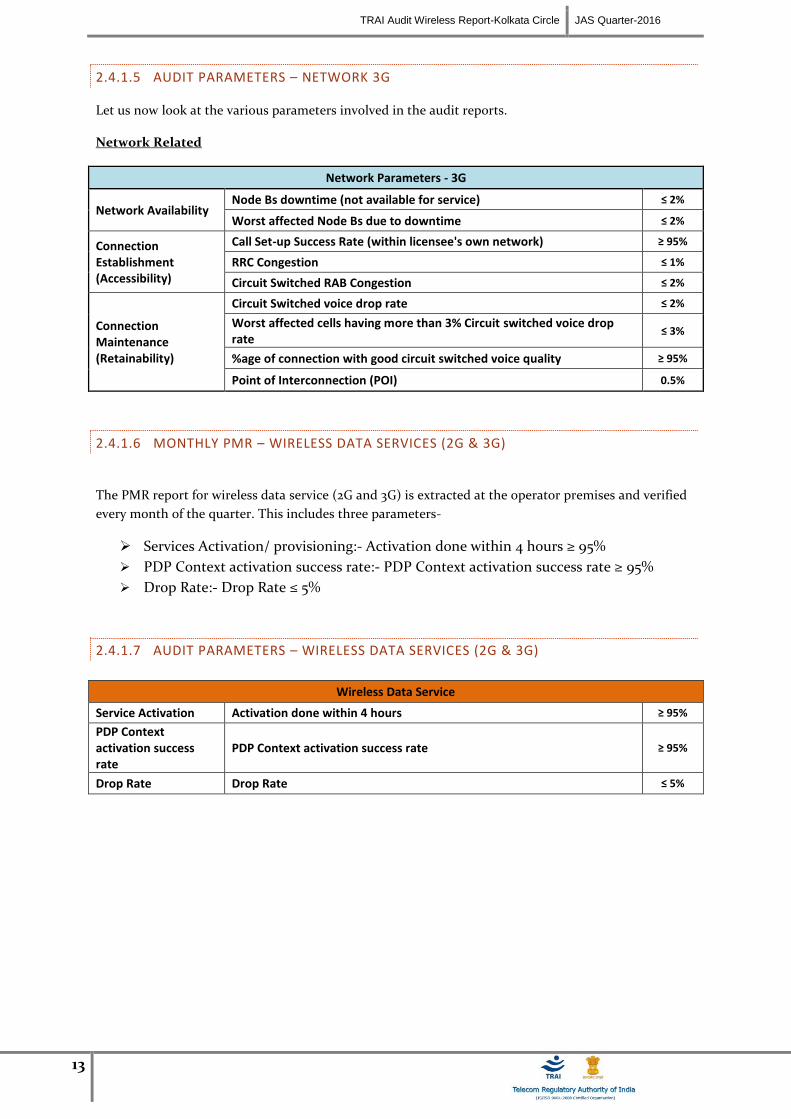
2.4.1.5 AUDIT PARAMETERS – NETWORK 3G
Let us now look at the various parameters involved in the audit reports.
Network Related
Network Parameters - 3G
Network Availability Node Bs downtime (not available for service) ≤ 2%
Worst affected Node Bs due to downtime ≤ 2%
Connection Establishment (Accessibility)
Call Set-up Success Rate (within licensee's own network) ≥ 95%
RRC Congestion ≤ 1%
Circuit Switched RAB Congestion ≤ 2%
Connection Maintenance (Retainability)
Circuit Switched voice drop rate ≤ 2%
Worst affected cells having more than 3% Circuit switched voice drop rate
≤ 3%
%age of connection with good circuit switched voice quality ≥ 95%
Point of Interconnection (POI) 0.5%
2.4.1.6 MONTHLY PMR – WIRELESS DATA SERVICES (2G & 3G)
The PMR report for wireless data service (2G and 3G) is extracted at the operator premises and verified
every month of the quarter. This includes three parameters-
Services Activation/ provisioning:- Activation done within 4 hours ≥ 95%
PDP Context activation success rate:- PDP Context activation success rate ≥ 95%
Drop Rate:- Drop Rate ≤ 5%
2.4.1.7 AUDIT PARAMETERS – WIRELESS DATA SERVICES (2G & 3G)
Wireless Data Service
Service Activation Activation done within 4 hours ≥ 95%
PDP Context activation success rate
PDP Context activation success rate ≥ 95%
Drop Rate Drop Rate ≤ 5%

TRAI Audit Wireless Report-Kolkata Circle JAS Quarter-2016
14
2.4.1.8 POINT OF DATA EXTRACTION
The data is extracted from a terminal/computer connected to OMCR & OSS on the operator network.
TRAI Audit Wireless Report-Kolkata Circle JAS Quarter-2016
15
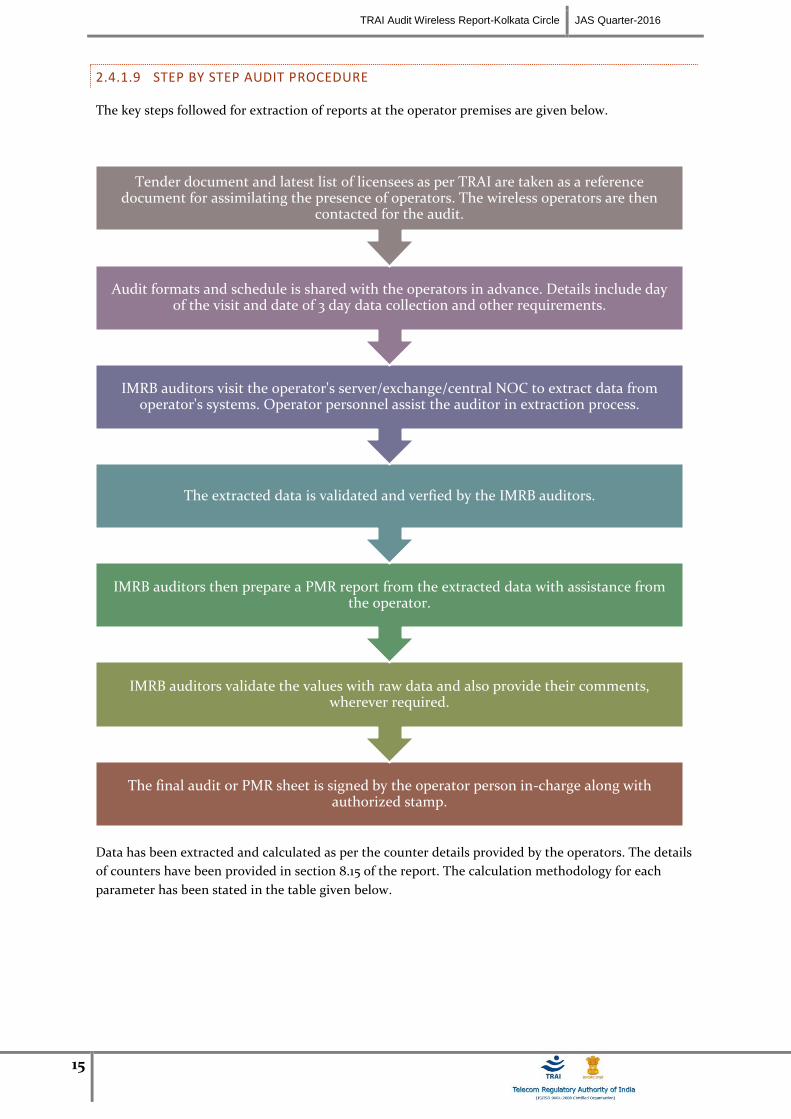
2.4.1.9 STEP BY STEP AUDIT PROCEDURE
The key steps followed for extraction of reports at the operator premises are given below.
Data has been extracted and calculated as per the counter details provided by the operators. The details
of counters have been provided in section 8.15 of the report. The calculation methodology for each
parameter has been stated in the table given below.
The final audit or PMR sheet is signed by the operator person in-charge along with authorized stamp.
IMRB auditors validate the values with raw data and also provide their comments, wherever required.
IMRB auditors then prepare a PMR report from the extracted data with assistance from the operator.
The extracted data is validated and verfied by the IMRB auditors.
IMRB auditors visit the operator's server/exchange/central NOC to extract data from operator's systems. Operator personnel assist the auditor in extraction process.
Audit formats and schedule is shared with the operators in advance. Details include day of the visit and date of 3 day data collection and other requirements.
Tender document and latest list of licensees as per TRAI are taken as a reference document for assimilating the presence of operators. The wireless operators are then
contacted for the audit.
TRAI Audit Wireless Report-Kolkata Circle JAS Quarter-2016
16
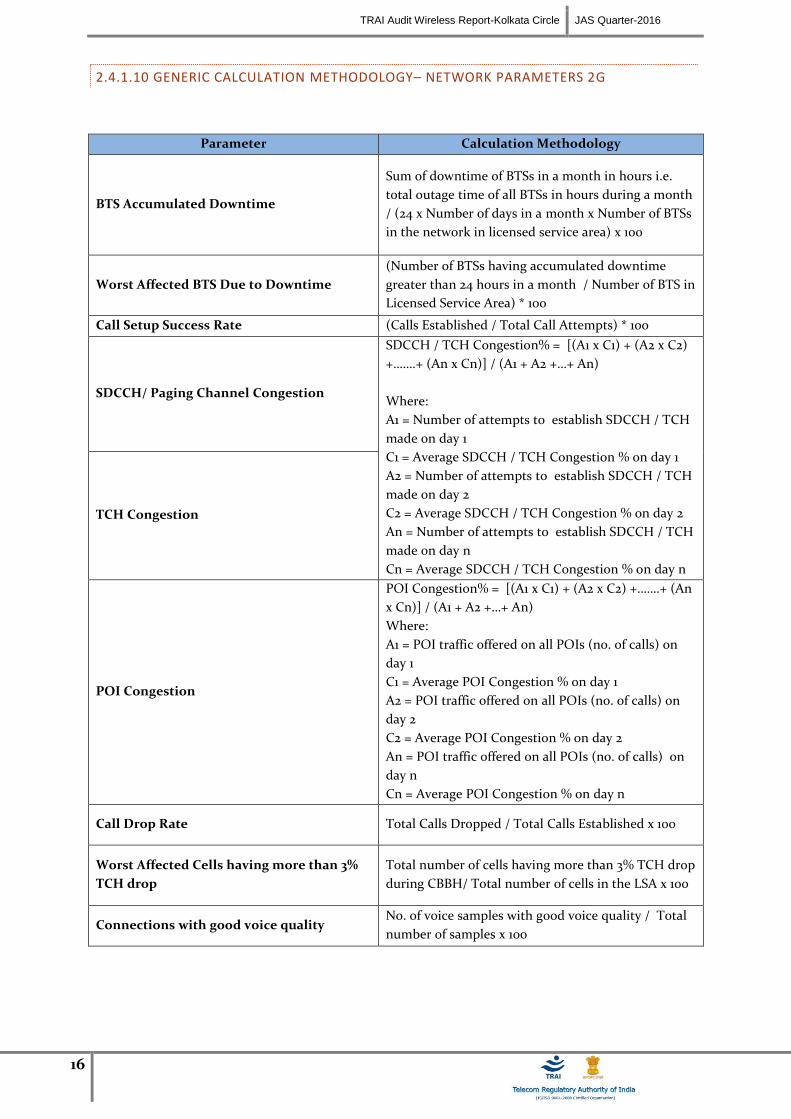
2.4.1.10 GENERIC CALCULATION METHODOLOGY– NETWORK PARAMETERS 2G
Parameter Calculation Methodology
BTS Accumulated Downtime
Sum of downtime of BTSs in a month in hours i.e.
total outage time of all BTSs in hours during a month
/ (24 x Number of days in a month x Number of BTSs
in the network in licensed service area) x 100
Worst Affected BTS Due to Downtime
(Number of BTSs having accumulated downtime
greater than 24 hours in a month / Number of BTS in
Licensed Service Area) * 100
Call Setup Success Rate (Calls Established / Total Call Attempts) * 100
SDCCH/ Paging Channel Congestion
SDCCH / TCH Congestion% = [(A1 x C1) + (A2 x C2)
+…….+ (An x Cn)] / (A1 + A2 +…+ An)
Where:
A1 = Number of attempts to establish SDCCH / TCH
made on day 1
C1 = Average SDCCH / TCH Congestion % on day 1
A2 = Number of attempts to establish SDCCH / TCH
made on day 2
C2 = Average SDCCH / TCH Congestion % on day 2
An = Number of attempts to establish SDCCH / TCH
made on day n
Cn = Average SDCCH / TCH Congestion % on day n
TCH Congestion
POI Congestion
POI Congestion% = [(A1 x C1) + (A2 x C2) +…….+ (An
x Cn)] / (A1 + A2 +…+ An)
Where:
A1 = POI traffic offered on all POIs (no. of calls) on
day 1
C1 = Average POI Congestion % on day 1
A2 = POI traffic offered on all POIs (no. of calls) on
day 2
C2 = Average POI Congestion % on day 2
An = POI traffic offered on all POIs (no. of calls) on
day n
Cn = Average POI Congestion % on day n
Call Drop Rate Total Calls Dropped / Total Calls Established x 100
Worst Affected Cells having more than 3%
TCH drop
Total number of cells having more than 3% TCH drop
during CBBH/ Total number of cells in the LSA x 100
Connections with good voice quality No. of voice samples with good voice quality / Total
number of samples x 100
TRAI Audit Wireless Report-Kolkata Circle JAS Quarter-2016
17
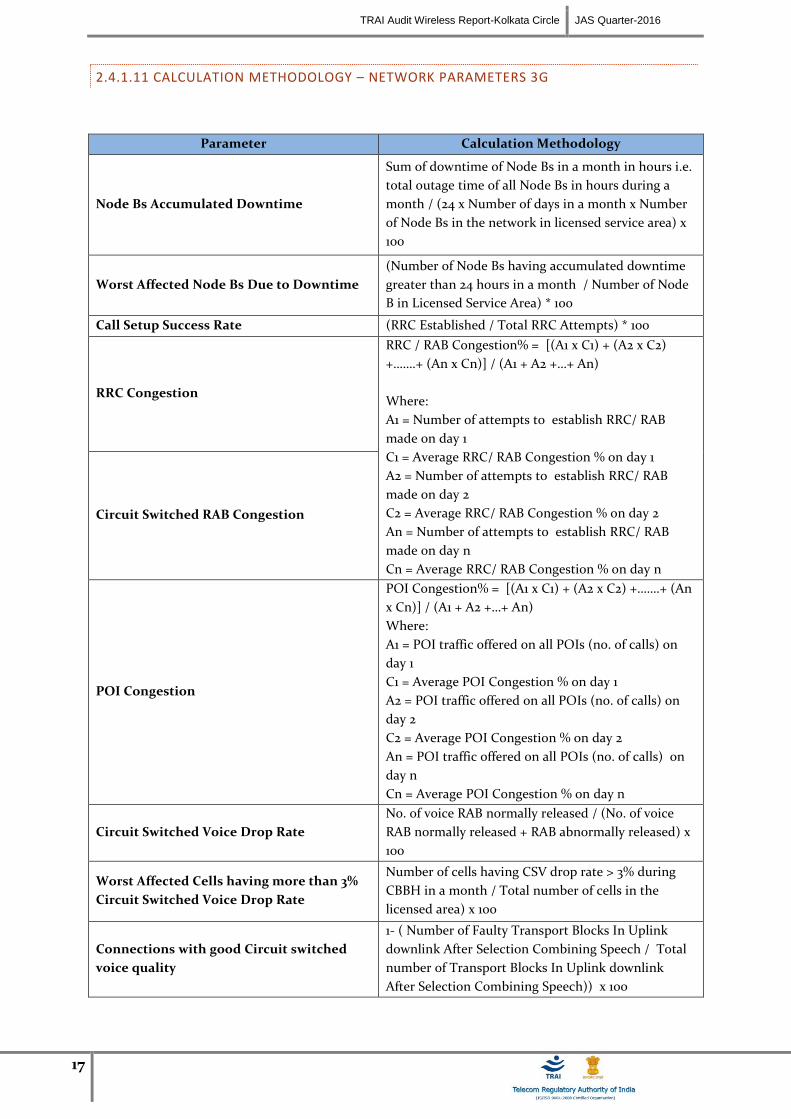
2.4.1.11 CALCULATION METHODOLOGY – NETWORK PARAMETERS 3G
Parameter Calculation Methodology
Node Bs Accumulated Downtime
Sum of downtime of Node Bs in a month in hours i.e.
total outage time of all Node Bs in hours during a
month / (24 x Number of days in a month x Number
of Node Bs in the network in licensed service area) x
100
Worst Affected Node Bs Due to Downtime
(Number of Node Bs having accumulated downtime
greater than 24 hours in a month / Number of Node
B in Licensed Service Area) * 100
Call Setup Success Rate (RRC Established / Total RRC Attempts) * 100
RRC Congestion
RRC / RAB Congestion% = [(A1 x C1) + (A2 x C2)
+…….+ (An x Cn)] / (A1 + A2 +…+ An)
Where:
A1 = Number of attempts to establish RRC/ RAB
made on day 1
C1 = Average RRC/ RAB Congestion % on day 1
A2 = Number of attempts to establish RRC/ RAB
made on day 2
C2 = Average RRC/ RAB Congestion % on day 2
An = Number of attempts to establish RRC/ RAB
made on day n
Cn = Average RRC/ RAB Congestion % on day n
Circuit Switched RAB Congestion
POI Congestion
POI Congestion% = [(A1 x C1) + (A2 x C2) +…….+ (An
x Cn)] / (A1 + A2 +…+ An)
Where:
A1 = POI traffic offered on all POIs (no. of calls) on
day 1
C1 = Average POI Congestion % on day 1
A2 = POI traffic offered on all POIs (no. of calls) on
day 2
C2 = Average POI Congestion % on day 2
An = POI traffic offered on all POIs (no. of calls) on
day n
Cn = Average POI Congestion % on day n
Circuit Switched Voice Drop Rate
No. of voice RAB normally released / (No. of voice
RAB normally released + RAB abnormally released) x
100
Worst Affected Cells having more than 3%
Circuit Switched Voice Drop Rate
Number of cells having CSV drop rate > 3% during
CBBH in a month / Total number of cells in the
licensed area) x 100
Connections with good Circuit switched
voice quality
1- ( Number of Faulty Transport Blocks In Uplink
downlink After Selection Combining Speech / Total
number of Transport Blocks In Uplink downlink
After Selection Combining Speech)) x 100

TRAI Audit Wireless Report-Kolkata Circle JAS Quarter-2016
18
2.4.1.12 3 DAY LIVE DATA
The main purpose of 3 day live measurement is to evaluate the network parameters on intraday basis.
While the monthly PMR report provides an overall view of the performance of QoS parameters, the 3
day live data helps looking at intraday performance on the network parameters discussed earlier. All the
calculations are done on the basis of that raw data of 3 days.
The 3 day live data provides a sample of 9 days in a quarter (3 days each month of a quarter) with hourly
performance, which enables the auditor to identify and validate intraday issues for an operator on the
Q0S network parameters. For example, network congestion being faced by an operator during
busy/peak hours.
Network related parameters were evaluated for a period of 3 days in each month. 3 day live audit was
conducted for 3 consecutive weekdays for each month. The data was extracted from each operator’s
server/ NOC etc. at the end of the 3rd
day. The extracted data is then used to create a report (similar to
PMR report) to assess the various QoS parameters.
The 3 day live measurement was conducted for network parameters (2G & 3G) and wireless data
services (2G & 3G).
2.4.1.13 TCBH – SIGNIFICANCE AND SELECTION METHODOLOGY
As per QoS regulations 2009 (7 of 2009), Time Consistent Busy Hour” or “TCBH” means the one hour
period starting at the same time each day for which the average traffic of the resource group concerned
is greatest over the days under consideration and such Time Consistent Busy Hour shall be established
on the basis of analysis of traffic data for a period of ninety days.
Step by step procedure to identify TCBH for an operator:
Day wise raw data is fetched from the operator's OMCR and kept in a readable format (preferably MS-Excel). Data for a period of 90 days is used to identify TCBH.
The 90 day period is decided upon the basis of month of audit. For example, for audit of Aug 2015, the 90 day period data used to identify TCBH would be the data of Jun, Jul and Aug 2015
For each day, the hour in which average traffic of the resource group concerned is greatest for the day will be the 'Busy Hour' for the operator.
The modal frequency of the busy hour is calculated for 90 days period and the hour with highest modal frequency will be considered as TCBH for the operator
TRAI Audit Wireless Report-Kolkata Circle JAS Quarter-2016
19
2.4.1.14 CBBH – SIGNIFICANCE AND SELECTION METHODOLOGY
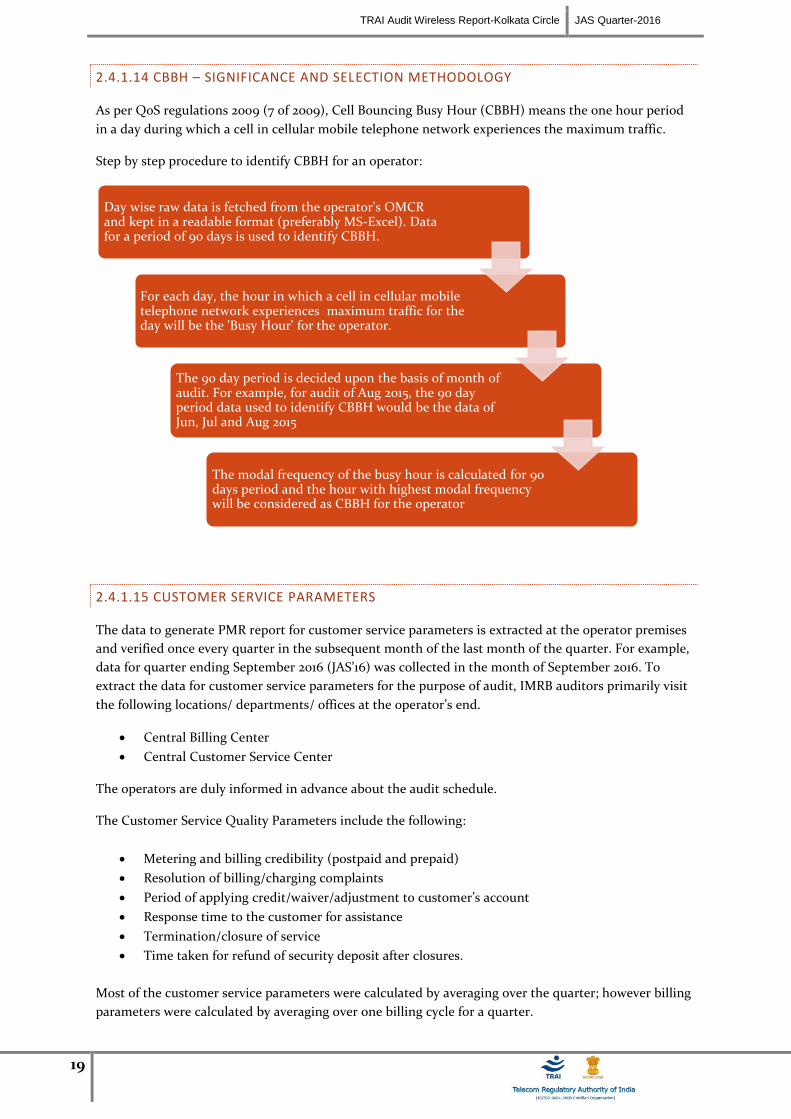
As per QoS regulations 2009 (7 of 2009), Cell Bouncing Busy Hour (CBBH) means the one hour period
in a day during which a cell in cellular mobile telephone network experiences the maximum traffic.
Step by step procedure to identify CBBH for an operator:
2.4.1.15 CUSTOMER SERVICE PARAMETERS
The data to generate PMR report for customer service parameters is extracted at the operator premises
and verified once every quarter in the subsequent month of the last month of the quarter. For example,
data for quarter ending September 2016 (JAS’16) was collected in the month of September 2016. To
extract the data for customer service parameters for the purpose of audit, IMRB auditors primarily visit
the following locations/ departments/ offices at the operator’s end.
Central Billing Center
Central Customer Service Center
The operators are duly informed in advance about the audit schedule.
The Customer Service Quality Parameters include the following:
Metering and billing credibility (postpaid and prepaid)
Resolution of billing/charging complaints
Period of applying credit/waiver/adjustment to customer’s account
Response time to the customer for assistance
Termination/closure of service
Time taken for refund of security deposit after closures.
Most of the customer service parameters were calculated by averaging over the quarter; however billing
parameters were calculated by averaging over one billing cycle for a quarter.
Day wise raw data is fetched from the operator's OMCR and kept in a readable format (preferably MS-Excel). Data for a period of 90 days is used to identify CBBH.
For each day, the hour in which a cell in cellular mobile telephone network experiences maximum traffic for the day will be the 'Busy Hour' for the operator.
The 90 day period is decided upon the basis of month of audit. For example, for audit of Aug 2015, the 90 day period data used to identify CBBH would be the data of Jun, Jul and Aug 2015
The modal frequency of the busy hour is calculated for 90 days period and the hour with highest modal frequency will be considered as CBBH for the operator
TRAI Audit Wireless Report-Kolkata Circle JAS Quarter-2016
20
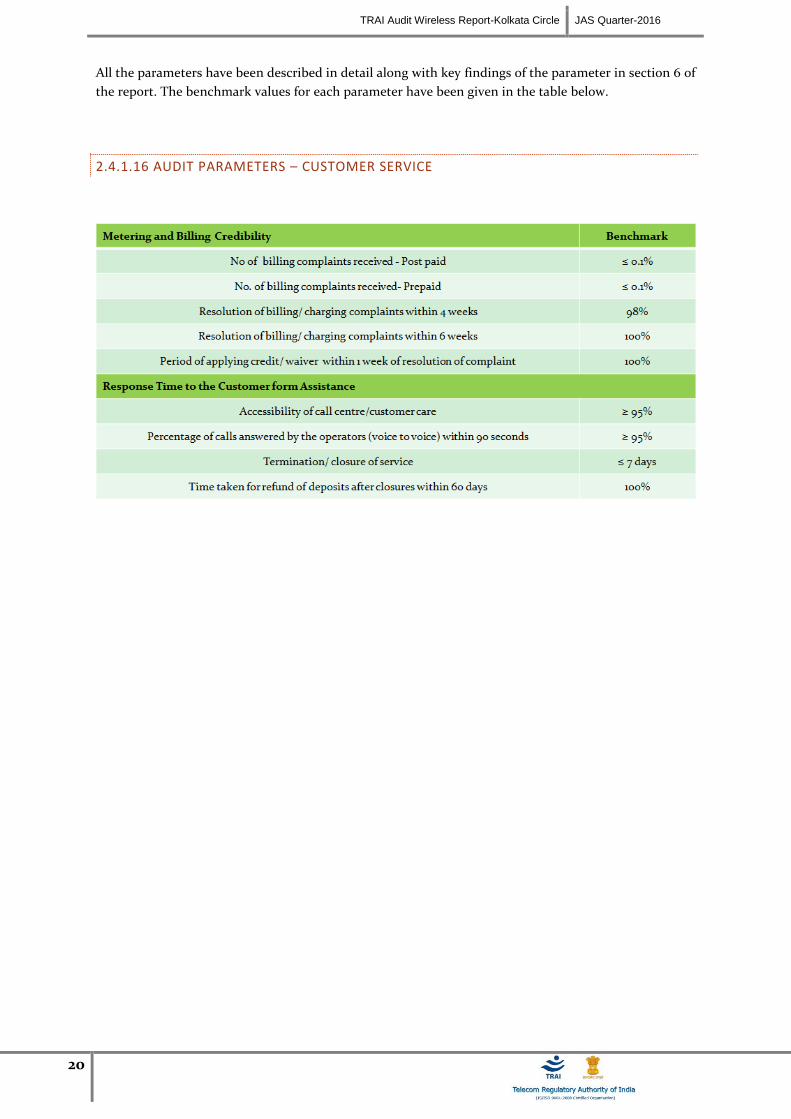
All the parameters have been described in detail along with key findings of the parameter in section 6 of
the report. The benchmark values for each parameter have been given in the table below.
2.4.1.16 AUDIT PARAMETERS – CUSTOMER SERVICE
TRAI Audit Wireless Report-Kolkata Circle JAS Quarter-2016
21
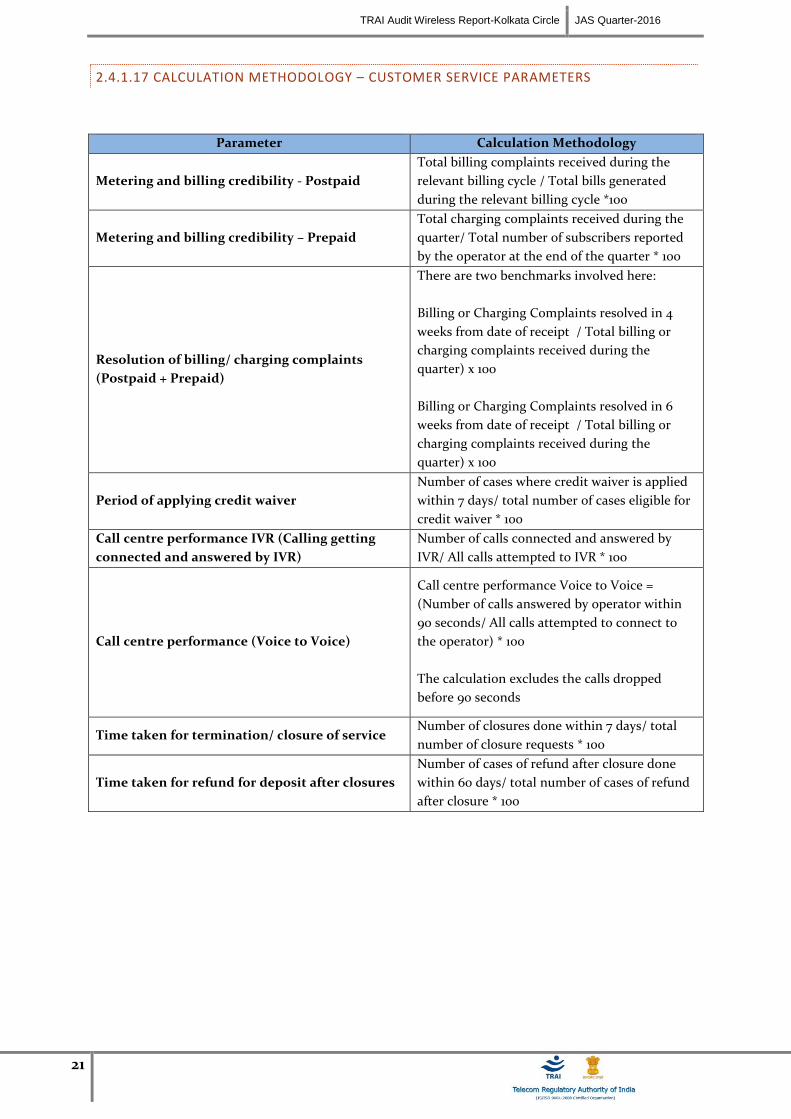
2.4.1.17 CALCULATION METHODOLOGY – CUSTOMER SERVICE PARAMETERS
Parameter Calculation Methodology
Metering and billing credibility - Postpaid
Total billing complaints received during the
relevant billing cycle / Total bills generated
during the relevant billing cycle *100
Metering and billing credibility – Prepaid
Total charging complaints received during the
quarter/ Total number of subscribers reported
by the operator at the end of the quarter * 100
Resolution of billing/ charging complaints
(Postpaid + Prepaid)
There are two benchmarks involved here:
Billing or Charging Complaints resolved in 4
weeks from date of receipt / Total billing or
charging complaints received during the
quarter) x 100
Billing or Charging Complaints resolved in 6
weeks from date of receipt / Total billing or
charging complaints received during the
quarter) x 100
Period of applying credit waiver
Number of cases where credit waiver is applied
within 7 days/ total number of cases eligible for
credit waiver * 100
Call centre performance IVR (Calling getting
connected and answered by IVR)
Number of calls connected and answered by
IVR/ All calls attempted to IVR * 100
Call centre performance (Voice to Voice)
Call centre performance Voice to Voice =
(Number of calls answered by operator within
90 seconds/ All calls attempted to connect to
the operator) * 100
The calculation excludes the calls dropped
before 90 seconds
Time taken for termination/ closure of service Number of closures done within 7 days/ total
number of closure requests * 100
Time taken for refund for deposit after closures
Number of cases of refund after closure done
within 60 days/ total number of cases of refund
after closure * 100
TRAI Audit Wireless Report-Kolkata Circle JAS Quarter-2016
22
2.4.2 LIVE CALLING
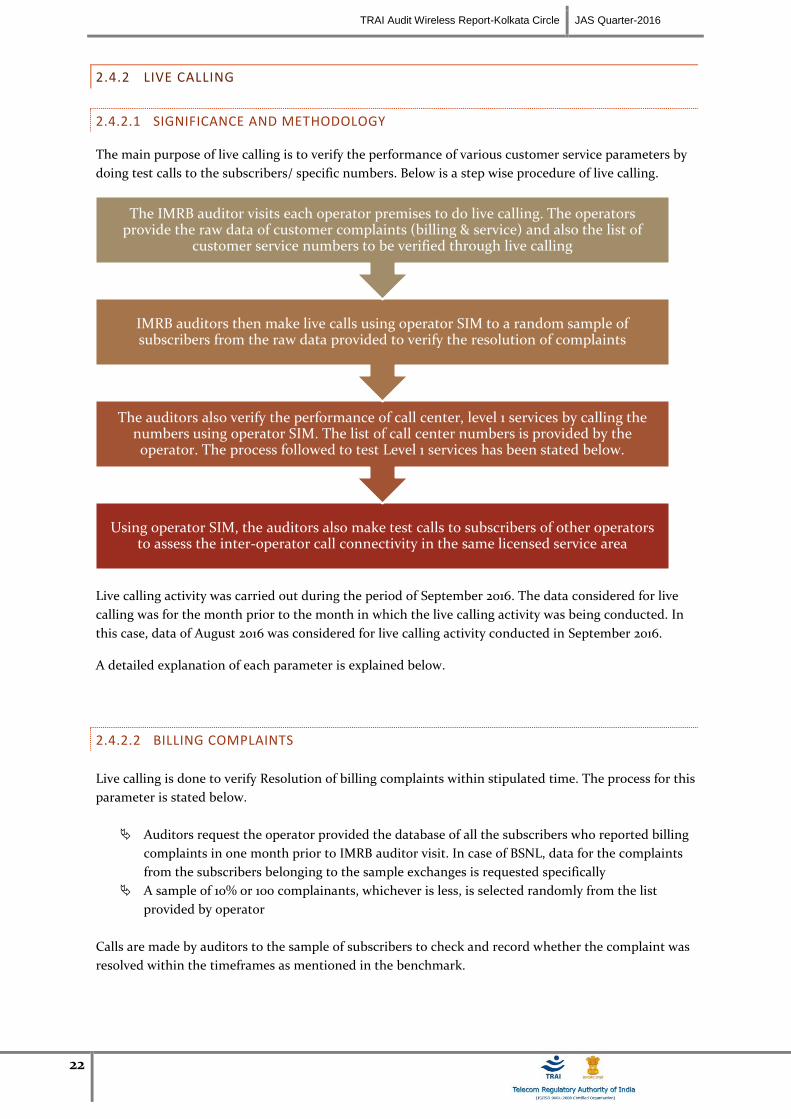
2.4.2.1 SIGNIFICANCE AND METHODOLOGY
The main purpose of live calling is to verify the performance of various customer service parameters by
doing test calls to the subscribers/ specific numbers. Below is a step wise procedure of live calling.
Live calling activity was carried out during the period of September 2016. The data considered for live
calling was for the month prior to the month in which the live calling activity was being conducted. In
this case, data of August 2016 was considered for live calling activity conducted in September 2016.
A detailed explanation of each parameter is explained below.
2.4.2.2 BILLING COMPLAINTS
Live calling is done to verify Resolution of billing complaints within stipulated time. The process for this
parameter is stated below.
Auditors request the operator provided the database of all the subscribers who reported billing
complaints in one month prior to IMRB auditor visit. In case of BSNL, data for the complaints
from the subscribers belonging to the sample exchanges is requested specifically
A sample of 10% or 100 complainants, whichever is less, is selected randomly from the list
provided by operator
Calls are made by auditors to the sample of subscribers to check and record whether the complaint was
resolved within the timeframes as mentioned in the benchmark.
Using operator SIM, the auditors also make test calls to subscribers of other operators to assess the inter-operator call connectivity in the same licensed service area
The auditors also verify the performance of call center, level 1 services by calling the numbers using operator SIM. The list of call center numbers is provided by the operator. The process followed to test Level 1 services has been stated below.
IMRB auditors then make live calls using operator SIM to a random sample of subscribers from the raw data provided to verify the resolution of complaints
The IMRB auditor visits each operator premises to do live calling. The operators provide the raw data of customer complaints (billing & service) and also the list of
customer service numbers to be verified through live calling
TRAI Audit Wireless Report-Kolkata Circle JAS Quarter-2016
23
All the complaints related to billing as per clause 3.7.2 of QoS regulation of 20th
December, 2009 were
considered as population for selection of samples. A complete list of the same has been provided in
Section 6.1.1.
TRAI benchmark-
Resolution of billing/ charging complaints - 98% within 4 weeks, 100% within 6 weeks
2.4.2.3 SERVICE COMPLAINTS REQUESTS
“Service request” means a request made to a service provider by its consumer pertaining to his account,
and includes.
A request for change of tariff plan
A request for activation or deactivation of a value added service or a supplementary
service or a special pack
A request for activation of any service available on the service provider’s network
A request for shift or closure or termination of service or for billing details
All the complaints other than billing were covered. A total of 100 calls per service provider for each
service in licensed service area were done by the IMRB auditors.
2.4.2.4 LEVEL 1 SERVICE
Level 1 is used for accessing special services like emergency services, supplementary services, inquiry
and operator-assisted services.
Level 1 Services include services such as police, fire, ambulance (Emergency services). Test calls were
made from operator SIMs. A total of 300 test calls were made per service provider in the quarter.
In JAS’16, IMRB has tried contacting the list of Level 1 services provided by TRAI as per the NNP
(National Numbering Plan).
2.4.2.4.1 PROCESS TO TEST LEVEL 1 SERVICES
On visiting the operator’s premises (Exchange/Central Server etc.), auditors ask the operator authorized personnel to provide a list of Level 1 services being active in their service. The list should contain a description of the numbers along with dialing code.
Operators might provide a long list of L1 services. To identify emergency L1 service numbers, auditors check if there is any number that starts with code ‘10’ in that list. If auditors find any emergency number in addition to the below list, that number is also tested during live calling.
On receiving the list, auditors verify it if the below given list of numbers are active in the service provider’s network.
If there are any other additional numbers provided by the operator, auditors also do live calling on those numbers along with below list.
If any of these numbers is not active, then we would write the same in our report, auditors write in the report.
Post verifying the list, auditors do live calling by equally distributing the calls among the various numbers and update the results in the live calling sheet.

TRAI Audit Wireless Report-Kolkata Circle JAS Quarter-2016
24
2.4.2.5 CUSTOMER CARE
Live calling is done to verify response time for customer assistance is done to verify the performance of
call center in terms of
Calls getting connected and answered by operator’s IVR.
% age of calls answered by operator / voice to voice) within 90 seconds: In 95% of the cases or
more
The process for this parameter is stated below.
TRAI Audit Wireless Report-Kolkata Circle JAS Quarter-2016
25
Overall sample size is 100 calls per service provider per circle at different points of time, evenly
distributed across the selected exchanges – 50 calls between 1100 HRS to 1400 HRS and 50 calls
between 1600 HRS to 1900 HRS.
Time to answer the call by the operator was assessed from the time interviewer pressed the
requisite button for being assisted by the operator.
All the supplementary services that have any kind of human intervention are to be covered
here. It also includes the IVR assisted services.
2.4.2.6 INTER OPERATOR CALL ASSESEMENT
A total of 100 calls per service provider to all the other service providers in a licensed service area were
done for the purpose of audit.
2.4.3 VOICE DRIVE TEST – 2G & 3G
2.4.3.1 SIGNIFICANCE AND METHODOLOGY
Drive test, as the name suggests, is conducted to measure the performance of an operator in a moving
vehicle in a specified network coverage area.
The main purpose of the drive test is to check the health of the mobile network of various operators in
the area in terms of coverage (signal strength), voice quality, call drop rate, call set up success rate etc.
To assess the indoor coverage, the test is also conducted at two static indoor locations in each SSA, such
as Malls, office buildings, shopping complexes, government buildings etc.
IMRB conducted two types of drive tests as mentioned below.
Operator Assisted Drive Test
Independent Drive Test (No IDT conducted)
The main difference between the two is that in the operator assisted, operators participate in the drive
test along with their hardware, software, phones etc. while in the independent drive test IMRB conducts
the drive test on solitary basis and uses its own hardware. Operators generally do not have any
knowledge of the drive test being conducted.
A detailed explanation of the two methodologies has been provided below.
2.4.3.2 OPERATOR ASSISTED DRIVE TEST – VOICE 2G & 3G
SSAs are selected according to the total no. of SSAs on that region and audited according to the TRAI
instruction; it depends on the total no. of drive on that circle. The drive tests were conducted for all
operators in the circle, for both 2G and 3G voice services. As per TRAI instructions, the 2G drive was
done in 2G only mode, while 3G drive test was conducted in dual mode (3G on priority).
As per the new directive given by TRAI headquarters, drive test in the quarter were conducted at a SSA
level. SSAs have been defined in two categories by TRAI as per the criticality of the SSA.
TRAI Audit Wireless Report-Kolkata Circle JAS Quarter-2016
26
1. Normal SSA
2. Difficult SSA
During the drive test in normal SSA, the methodology adopted for the drive test is:
3 consecutive days were selected for drive test in selected SSA. SSAs were defined as per BSNL
and SSA list was finalized by regional TRAI office.
On an average, a minimum of 80 kilometers was covered each day, covering a minimum
distance of 250kms in 3 days.
Route map was designed in such a way that all the major roads, highways and all the important
towns and villages were covered as part of audit.
Special emphasis was given to those areas where the number of complaints received were on
the higher side, if provided by TRAI.
The route is defined in a way that we cover maximum area in the SSA and try to cover
maximum villages and cities within the SSA. The route is designed such that there is no overlap
of roads (if possible).
The route was classified as-
o With In city
o Major Roads
o Highways
o Shopping complex/ Mall
o Office Complex/ Government Building
There were no fixed calls which we need to do for within city, major roads and highways, but a
minimum of 30 calls in each route, i.e., within city, major roads and highways on each day. For
indoors, 20 calls each for shopping and office complex each day preferably in relatively bigger
city.
The drive test covered selected cities and adjoining towns/rural areas where the service
provider has commenced service, including congested areas and indoor sites.
The drive test of each mobile network was conducted between 10 am and 8 pm on weekdays.
The Vehicle used in the drive tests was equipped with the test tool that automatically generates
calls on the mobile telephone networks.
The speed of the vehicle was kept at around 30-50 km/hr.
The holding period of each test call was 120 seconds.
A test call was generated 10 seconds after the previous test call is completed. For 3G, the gap
between two calls was 30 seconds.
Height of the antenna was kept uniform in case of all service providers.
In drive test for difficult SSAs, the methodology adopted for the drive test is:-
Drive test was conducted for 6 consecutive days in selected SSAs; SSAs are defined as per BSNL
and SSA list was finalized by regional TRAI office.
On an average, a minimum of 80 kilometers was covered each day, covering a minimum
distance of 500kms in 6 days.
Rest of the activities for drive test in difficult SSAs are same as drive test for normal SSAs.
TRAI Audit Wireless Report-Kolkata Circle JAS Quarter-2016
27
2.4.3.3 INDEPENDENT DRIVE TEST – 2G & 3G
The number of independent drive tests to be conducted and their locations are decided basis TRAI
recommendation.
A minimum of 80 kilometers was traversed during the independent drive test in a SSA on each
day. The SSAs were defined as per BSNL and SSA list was finalized by regional TRAI office.
Route map was designed in such a way that all the major roads, highways and all the important
towns and villages were covered as part of audit.
Special emphasis was given to those areas where the number of complaints received were on
the higher side, if provided by TRAI.
The route is defined in a way that we cover maximum area in the SSA and try to cover
maximum villages and cities within the SSA. The route is designed such that there is no overlap
of roads (if possible).
The route was classified as-
o With In city
o Major Roads
o Highways
o Shopping complex/ Mall
o Office Complex/ Government Building
There were no fixed calls which we need to do for within city, major roads and highways, but a
minimum of 30 calls in each route, i.e., within city, major roads and highways on each day. For
indoors, 20 calls each for shopping and office complex each day preferably in relatively bigger
city.
The drive test covered selected cities and adjoining towns/rural areas where the service
provider has commenced service, including congested areas and indoor sites.
The drive test of each mobile network was conducted between 10 am and 8 pm on weekdays.
The Vehicle used in the drive tests was equipped with the test tool that automatically generates
calls on the mobile telephone networks.
The speed of the vehicle was kept at around 30-50 km/hr.
The holding period of each test call was 120 seconds.
A test call was generated 10 seconds after the previous test call is completed. For 3G, the gap
between two calls was 30 seconds.
Height of the antenna was kept uniform in case of all service providers.
2.4.3.4 PARAMETERS EVALUATED DURING VOICE DRIVE TEST – 2G & 3G
The parameters which were captured during the drive test include. Below are the parameters which are
captured for the GSM and CDMA operators.
Coverage-Signal strength (GSM)
Total calls made (A)
Number of calls with signal strength between 0 to -75 dBm
Number of calls with signal strength between 0 to -85 dBm
Number of calls with signal strength between 0 to -95 dBm
Coverage-Signal strength (CDMA)
Total Ec/Io BINS (A)
Total Ec/Io BINS with less than –15 (B)
Low Interference = [1 - (B/A)] x 100
Voice quality (GSM)
TRAI Audit Wireless Report-Kolkata Circle JAS Quarter-2016
28
Total Rx Qual Samples– A
Rx Qual samples with 0-5 value – B
%age samples with good voice quality = B/A x 100
Voice quality (CDMA)
Total FER BINs (forward FER) – A
FER BINs with 0-2 value (forward FER) – B
FER BINs with 0-4 value (forward FER) – C
%age samples with FER bins having 0-2 value (forward FER) = B/A x 100
%age samples with FER bins having 0-4 value (forward FER) = C/A x 100
No. of FER samples with value > 4 = [A-C]
Call setup success rate
Total number of call attempts – A
Total Calls successfully established – B
Call success rate (%age) = (B/A) x 100
Blocked calls
100% - Call Set up Rate
Call drop rate
Total Calls successfully established – A
Total calls dropped after being established – B
Call Drop Rate (%age) = (B/A) x 100
2.4.4 WIRELESS DATA DRIVE TEST – 2G & 3G
The data drive test is conducted at stationary places called hotspots in a SSA for all the days the voice
drive test is conducted in the same SSA.
2.4.4.1 METHODOLOGY
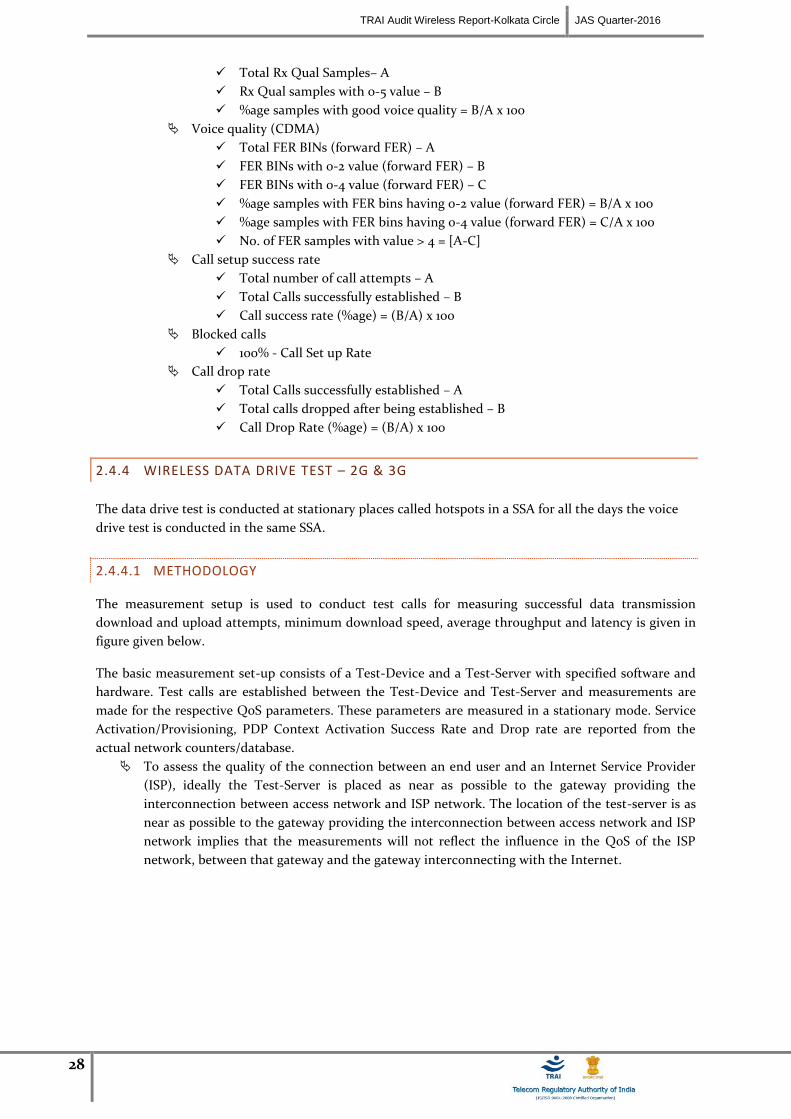
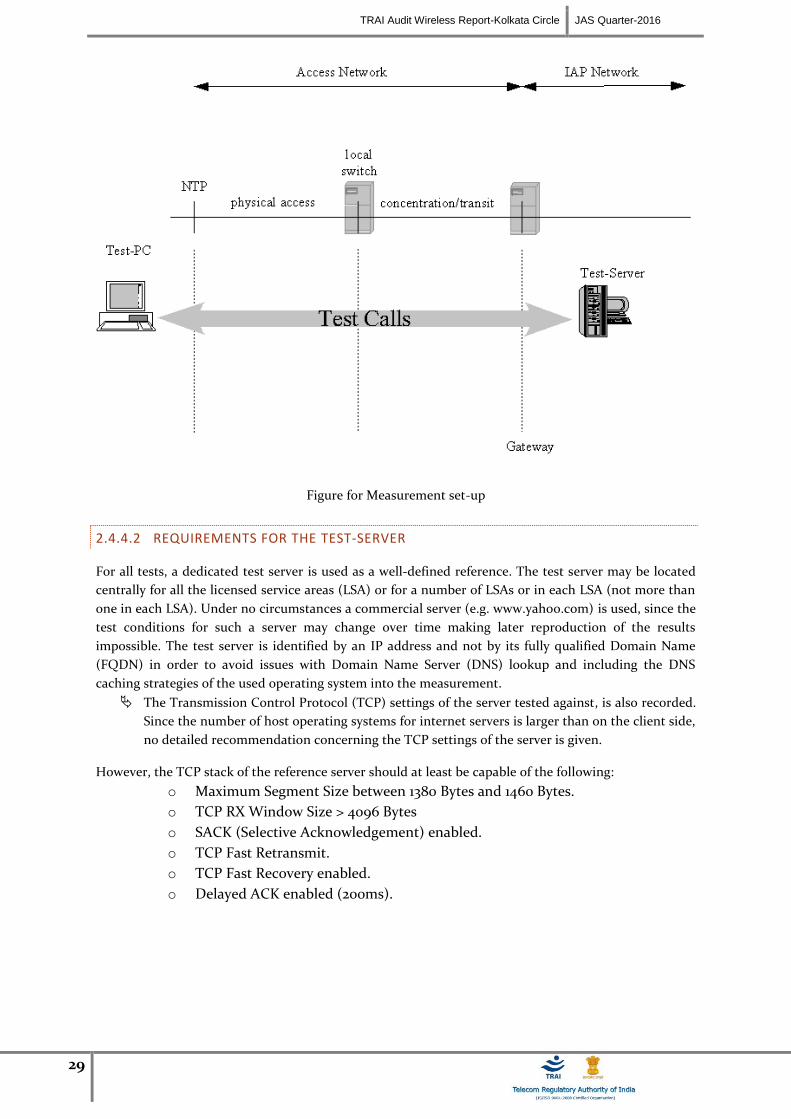
The measurement setup is used to conduct test calls for measuring successful data transmission
download and upload attempts, minimum download speed, average throughput and latency is given in
figure given below.
The basic measurement set-up consists of a Test-Device and a Test-Server with specified software and
hardware. Test calls are established between the Test-Device and Test-Server and measurements are
made for the respective QoS parameters. These parameters are measured in a stationary mode. Service
Activation/Provisioning, PDP Context Activation Success Rate and Drop rate are reported from the
actual network counters/database.
To assess the quality of the connection between an end user and an Internet Service Provider
(ISP), ideally the Test-Server is placed as near as possible to the gateway providing the
interconnection between access network and ISP network. The location of the test-server is as
near as possible to the gateway providing the interconnection between access network and ISP
network implies that the measurements will not reflect the influence in the QoS of the ISP
network, between that gateway and the gateway interconnecting with the Internet.
TRAI Audit Wireless Report-Kolkata Circle JAS Quarter-2016
29
Figure for Measurement set-up
2.4.4.2 REQUIREMENTS FOR THE TEST-SERVER
For all tests, a dedicated test server is used as a well-defined reference. The test server may be located
centrally for all the licensed service areas (LSA) or for a number of LSAs or in each LSA (not more than
one in each LSA). Under no circumstances a commercial server (e.g. www.yahoo.com) is used, since the
test conditions for such a server may change over time making later reproduction of the results
impossible. The test server is identified by an IP address and not by its fully qualified Domain Name
(FQDN) in order to avoid issues with Domain Name Server (DNS) lookup and including the DNS
caching strategies of the used operating system into the measurement.
The Transmission Control Protocol (TCP) settings of the server tested against, is also recorded.
Since the number of host operating systems for internet servers is larger than on the client side,
no detailed recommendation concerning the TCP settings of the server is given.
However, the TCP stack of the reference server should at least be capable of the following:
o Maximum Segment Size between 1380 Bytes and 1460 Bytes.
o TCP RX Window Size > 4096 Bytes
o SACK (Selective Acknowledgement) enabled.
o TCP Fast Retransmit.
o TCP Fast Recovery enabled.
o Delayed ACK enabled (200ms).
TRAI Audit Wireless Report-Kolkata Circle JAS Quarter-2016
30
2.4.4.3 TEST FILES
The test file consist of incompressible data i.e. a data file that is already compressed, e.g. like a zip or jpg
file. The test file has at least twice the size (in Kbit) of the theoretically maximum data transmission rate
per second (in Kbit/s) of the Internet access under consideration.
2.4.4.4 REPRESENTATIVENESS OR NUMBER OF TEST CALLS
The choice of adequate test calls, i.e. geographical locations of origin and destination of calls as
well as traffic variations, is a crucial point with respect to the comparability and validation of
the statistics are calculated for the measured parameters. For each parameter, it is ensured that
the samples are aggregated over all classes of customers for fairness in reflecting the QoS
actually perceived by the user and the statistics are preserved to substantiate the same.
The necessary number of samples (test calls) are 1067 for each of the category “A” and “Metro”
licensed service area (LSA), 600 for each of the category “B” LSA and 384 for each of the
category “C” LSA for all the parameters.
2.4.4.5 PARAMETERS EVALUATED DURING DATA DRIVE TEST AT HOTSPOTS
2.4.4.5.1 SUCCESSFUL DATA TRANSMISSIONS DOWNLOAD ATTEMPTS
The successful data download attempts is defined as the ratio of successful data downloads to the total
number of data download attempts in a specified time period. A data transmission is successful if a test
file is downloaded completely and with no errors.
Measurement:
The percentage that is the sum total of successful data downloads, divided by the sum total of all
attempts to download a test file is provided. The statistics are calculated from test calls made according
to the measurement set-up and taking into account the representativeness requirements. The successful
data download is measured by downloading a test file. An attempt to transmit the test file is considered
unsuccessful if it takes longer than 60 seconds.
Successful data transmission download attempts =
Total Successful download attempts ×100
Total download attempts

TRAI Audit Wireless Report-Kolkata Circle JAS Quarter-2016
31
2.4.4.5.2 SUCCESSFUL DATA TRANSMISSION UPLOAD ATTEMPTS
The successful data upload attempts is defined as the ratio of successful data uploads to the total
number of data upload attempts in a specified time period. A data upload is successful if a test file is
uploaded completely and with no errors.
Measurement:
The percentage that is the sum total of successful data uploads, divided by the sum total of all attempts
to upload a test file should be provided. The statistics are calculated from test calls made according to
the measurement set-up and taking into account the representativeness requirements. The successful
data upload is measured by uploading a test file. An attempt to transmit the test file is considered
unsuccessful if it takes longer than 60 seconds.
Successful data transmission upload attempts = Total Successful upload attempts ×100
Total upload attempts
2.4.4.5.3 MINIMUM DOWNLOAD SPEED
The download speed is defined as the data transmission rate that is achieved for downloading a test file from a test server to a test device.
Measurement: The minimum download speed is calculated from test calls made according to the measurement set-up. Test calls are to be made to weigh the results according to the patterns of real traffic. Minimum download speed is the average of the lower 10% of all such test calls. Minimum download speed (average of lower 10% of all test calls) = Download speed (A1+A2+A3+A4+A5+A6) ×100 6 Note- A1, A2, A3, A4 A5 & A6 are download speeds at 6 hotspots
2.4.4.5.4 AVERAGE THROUGHPUT FOR PACKET DATA
It is defined as the rate at which packets are transmitted in a network. In a mobile network the download speed varies depending on the number of users in a particular location. Even though a service provider may be advertising certain speed, the actual speed may vary as per the number of users in the network and there could be customer dissatisfaction on account of relatively slow speed. Hence, there is a need to prescribe an average throughput to protect the interest of consumers. The service providers need to constantly upgrade their network to meet average throughput benchmark.
The throughput is defined as the data transmission rate that is achieved for downloading a test
file from a test server to a test device.
The service provider will advertise the throughput being offered to its customers as per their
category or plan and it should be meted out as per their commitment.
Measurement: The average throughput for packet data should be calculated from all the test calls made according to the measurement setup.
TRAI Audit Wireless Report-Kolkata Circle JAS Quarter-2016
32
Test calls are made to weigh the results according to the patterns of real traffic. Average throughput is calculated as the average of all such test calls.
Average Throughput for Packet data = Average of download attempts in Kbit/ average download time in secs
2.4.4.5.5 LATENCY
Latency is the amount of time taken by a packet to reach the receiving endpoint after being transmitted from the sending point. This time period is termed the "end-to-end delay" occurring along the transmission path. Latency generally refers to network conditions, such as congestion, that may affect the overall time required for transit.
Measurement: Latency is measured with the test server for ping connected directly to the server on the same Intranet domain. Latency (Percentage of successful pinged) = Total number of successful ping ×100 Total number of ping sent to the Test Server
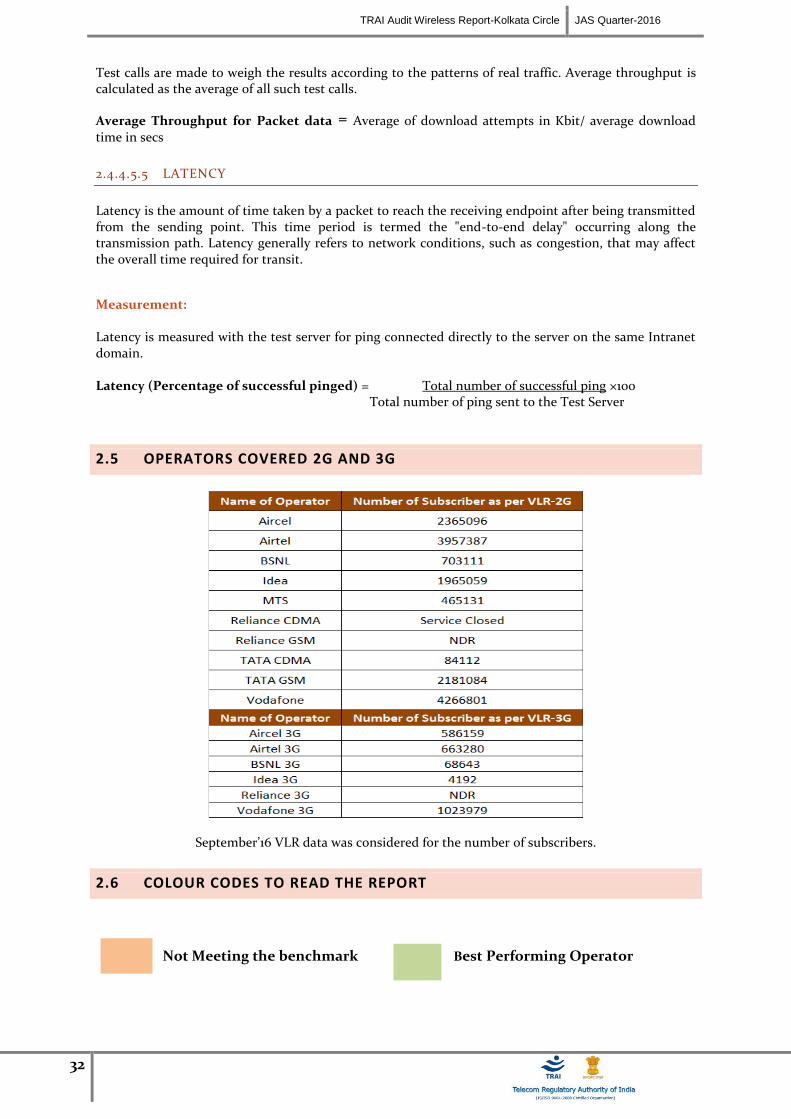
2.5 OPERATORS COVERED 2G AND 3G
September’16 VLR data was considered for the number of subscribers.
2.6 COLOUR CODES TO READ THE REPORT
Not Meeting the benchmark Best Performing Operator
TRAI Audit Wireless Report-Kolkata Circle JAS Quarter-2016
33
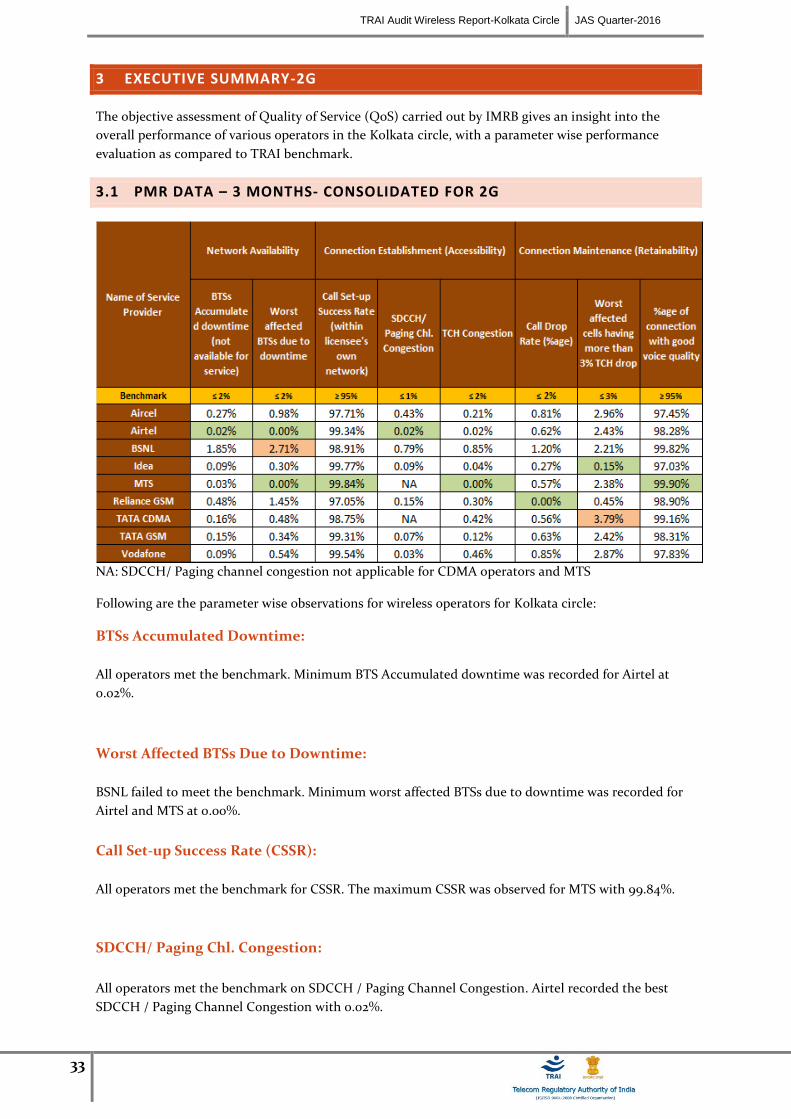
3 EXECUTIVE SUMMARY-2G
The objective assessment of Quality of Service (QoS) carried out by IMRB gives an insight into the
overall performance of various operators in the Kolkata circle, with a parameter wise performance
evaluation as compared to TRAI benchmark.
3.1 PMR DATA – 3 MONTHS- CONSOLIDATED FOR 2G
NA: SDCCH/ Paging channel congestion not applicable for CDMA operators and MTS
Following are the parameter wise observations for wireless operators for Kolkata circle:
BTSs Accumulated Downtime:
All operators met the benchmark. Minimum BTS Accumulated downtime was recorded for Airtel at
0.02%.
Worst Affected BTSs Due to Downtime:
BSNL failed to meet the benchmark. Minimum worst affected BTSs due to downtime was recorded for
Airtel and MTS at 0.00%.
Call Set-up Success Rate (CSSR):
All operators met the benchmark for CSSR. The maximum CSSR was observed for MTS with 99.84%.
SDCCH/ Paging Chl. Congestion:
All operators met the benchmark on SDCCH / Paging Channel Congestion. Airtel recorded the best
SDCCH / Paging Channel Congestion with 0.02%.
TRAI Audit Wireless Report-Kolkata Circle JAS Quarter-2016
34
TCH Congestion:
All operators met the benchmark on TCH congestion, while MTS performed the best on TCH
congestion with 0.00%
Call Drop Rate:
All operators met the benchmark for the parameter. Minimum call drop rate was recorded for Reliance
GSM at 0.00%.
Worst Affected Cells Having More than 3% TCH Drop:
Tata CDMA failed to meet the benchmark for the parameter. Best performance was recorded for Idea at
0.15%.
Voice Quality
All operators met the benchmark for the parameter. Best performance was recorded for MTS at 99.90%.
All the service providers were measuring this parameter as per the TRAI guidelines that have been
stated in parameter description section.

35
Below are the month wise summary tables for each network parameter basis PMR data.
3.1.1 PMR DATA - JULY FOR 2G
3.1.2 PMR DATA – AUGUST FOR 2G
TRAI Audit Wireless Report-Kolkata Circle JAS Quarter-2016
36
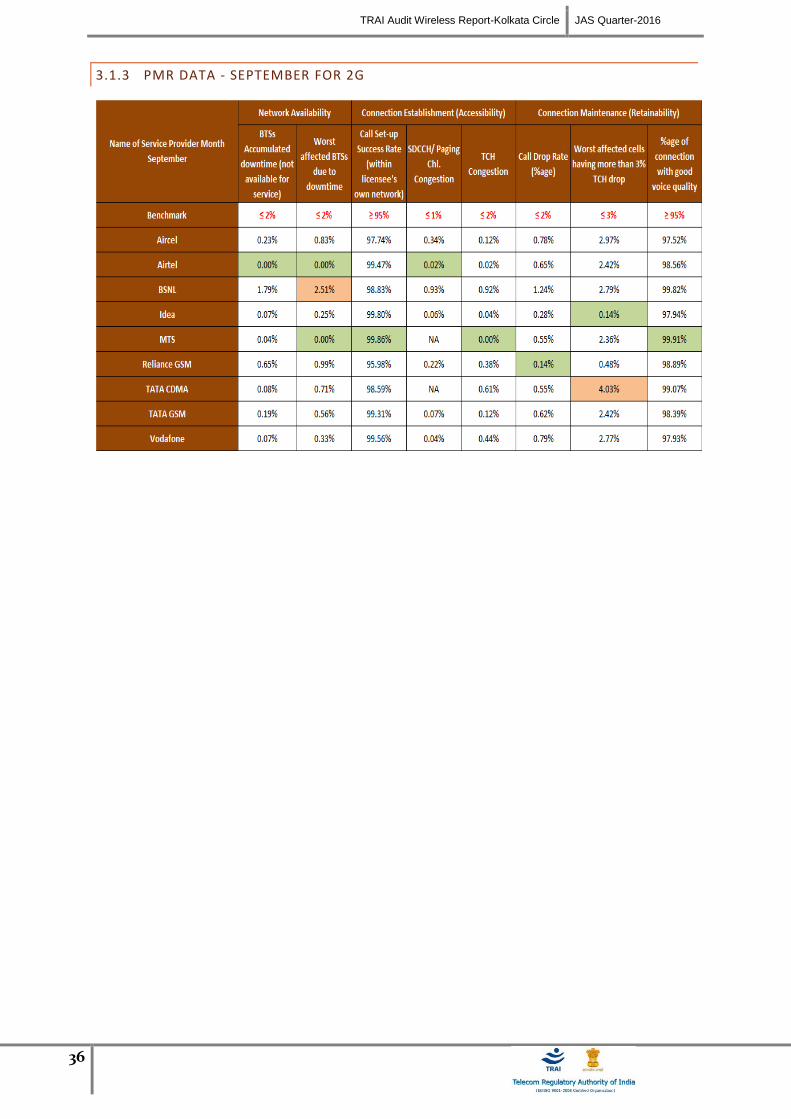
3.1.3 PMR DATA - SEPTEMBER FOR 2G
TRAI Audit Wireless Report-Kolkata Circle JAS Quarter-2016
37
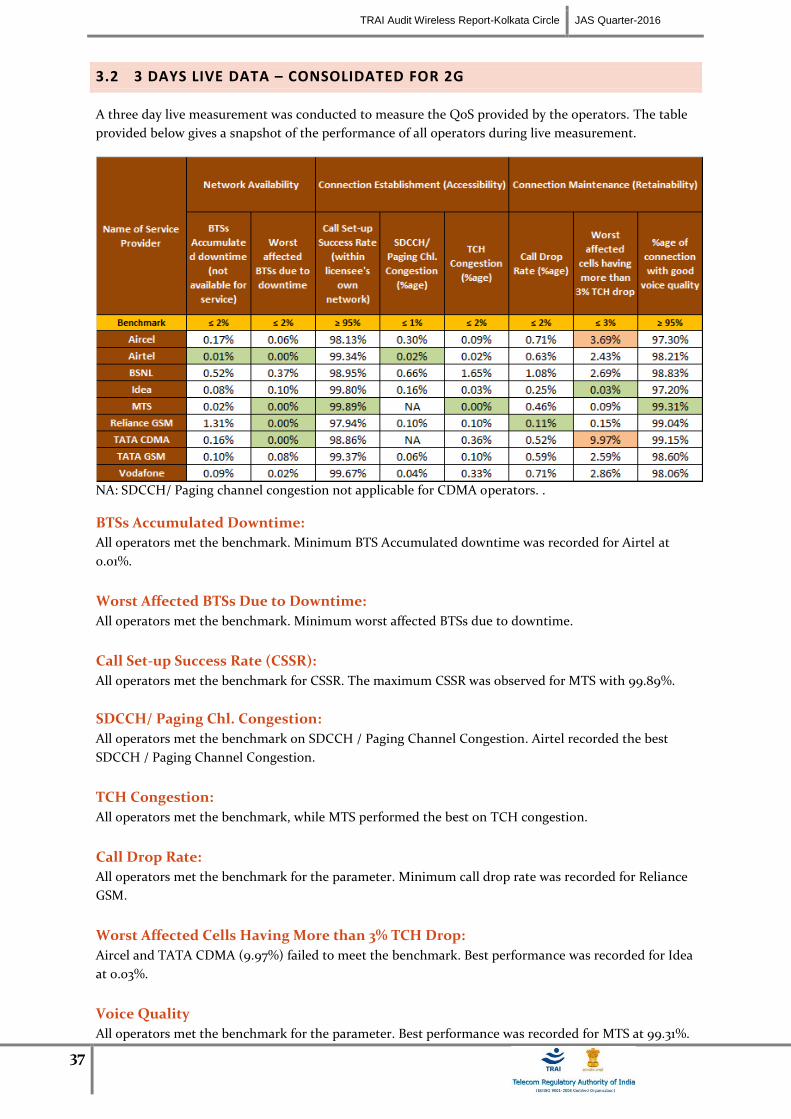
3.2 3 DAYS LIVE DATA – CONSOLIDATED FOR 2G
A three day live measurement was conducted to measure the QoS provided by the operators. The table
provided below gives a snapshot of the performance of all operators during live measurement.
NA: SDCCH/ Paging channel congestion not applicable for CDMA operators. .
BTSs Accumulated Downtime:
All operators met the benchmark. Minimum BTS Accumulated downtime was recorded for Airtel at
0.01%.
Worst Affected BTSs Due to Downtime:
All operators met the benchmark. Minimum worst affected BTSs due to downtime.
Call Set-up Success Rate (CSSR):
All operators met the benchmark for CSSR. The maximum CSSR was observed for MTS with 99.89%.
SDCCH/ Paging Chl. Congestion:
All operators met the benchmark on SDCCH / Paging Channel Congestion. Airtel recorded the best
SDCCH / Paging Channel Congestion.
TCH Congestion:
All operators met the benchmark, while MTS performed the best on TCH congestion.
Call Drop Rate:
All operators met the benchmark for the parameter. Minimum call drop rate was recorded for Reliance
GSM.
Worst Affected Cells Having More than 3% TCH Drop:
Aircel and TATA CDMA (9.97%) failed to meet the benchmark. Best performance was recorded for Idea
at 0.03%.
Voice Quality
All operators met the benchmark for the parameter. Best performance was recorded for MTS at 99.31%.
TRAI Audit Wireless Report-Kolkata Circle JAS Quarter-2016
38
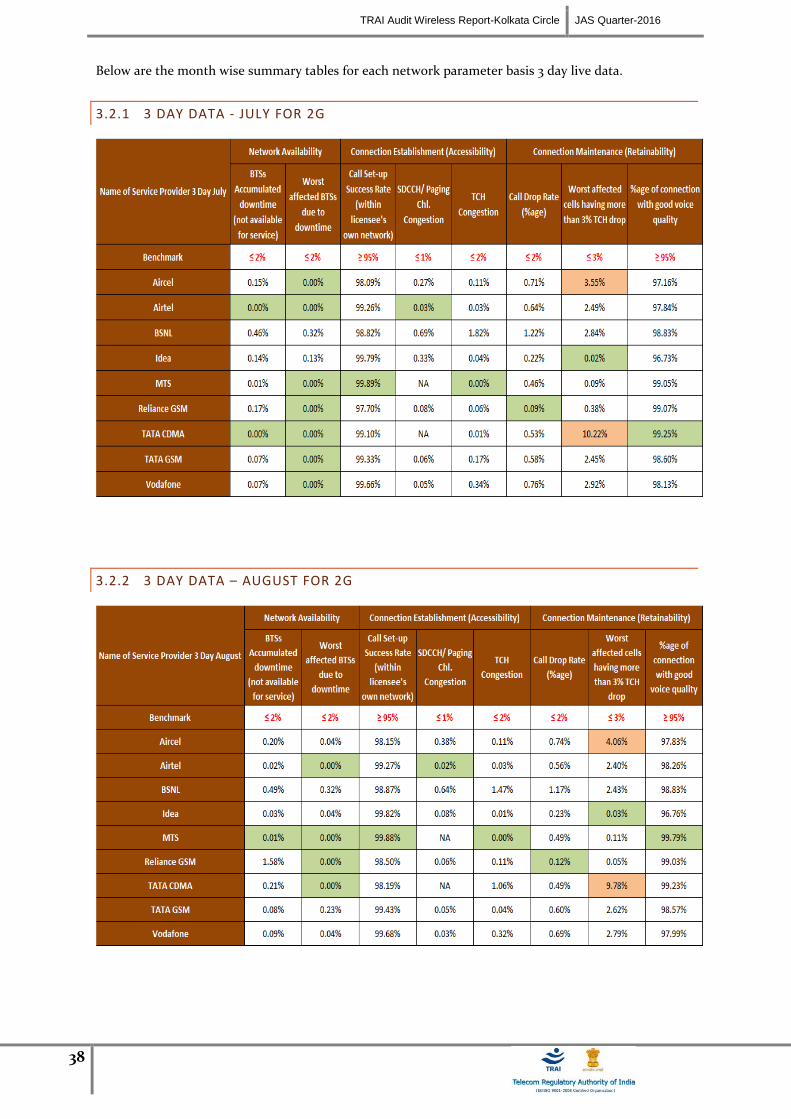
Below are the month wise summary tables for each network parameter basis 3 day live data.
3.2.1 3 DAY DATA - JULY FOR 2G
3.2.2 3 DAY DATA – AUGUST FOR 2G
TRAI Audit Wireless Report-Kolkata Circle JAS Quarter-2016
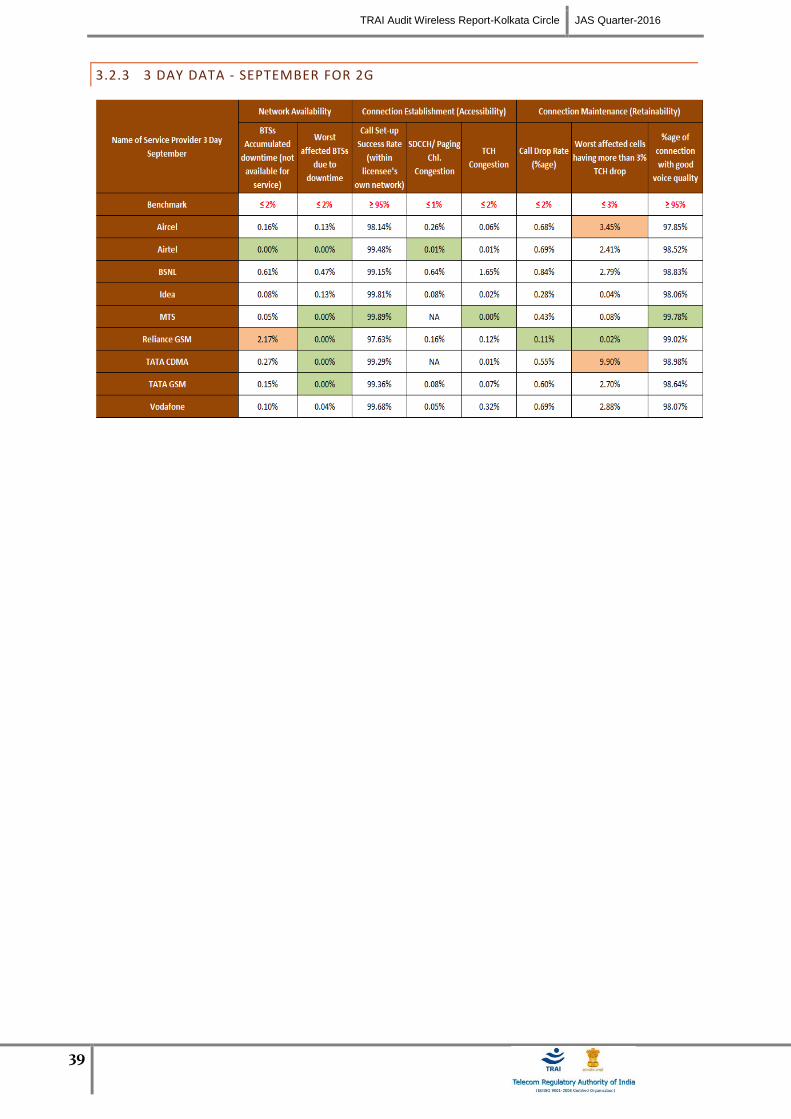
39
3.2.3 3 DAY DATA - SEPTEMBER FOR 2G
TRAI Audit Wireless Report-Kolkata Circle JAS Quarter-2016
40
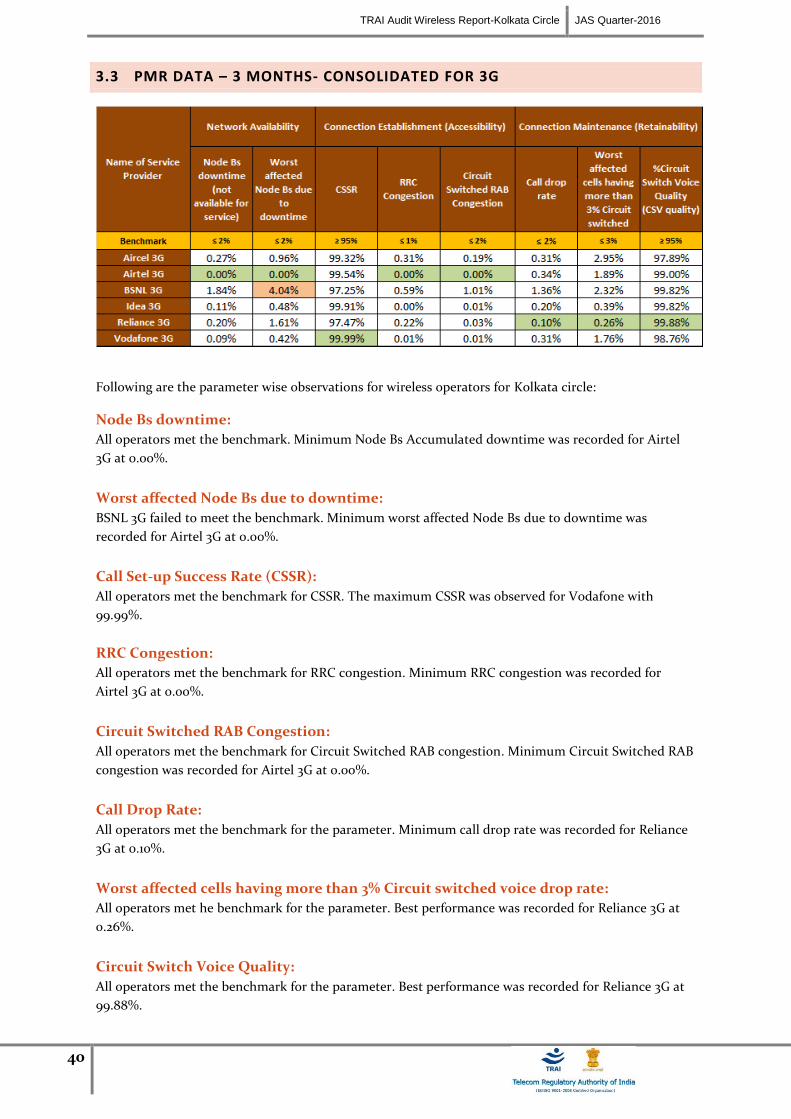
3.3 PMR DATA – 3 MONTHS- CONSOLIDATED FOR 3G
Following are the parameter wise observations for wireless operators for Kolkata circle:
Node Bs downtime:
All operators met the benchmark. Minimum Node Bs Accumulated downtime was recorded for Airtel
3G at 0.00%.
Worst affected Node Bs due to downtime:
BSNL 3G failed to meet the benchmark. Minimum worst affected Node Bs due to downtime was
recorded for Airtel 3G at 0.00%.
Call Set-up Success Rate (CSSR):
All operators met the benchmark for CSSR. The maximum CSSR was observed for Vodafone with
99.99%.
RRC Congestion:
All operators met the benchmark for RRC congestion. Minimum RRC congestion was recorded for
Airtel 3G at 0.00%.
Circuit Switched RAB Congestion:
All operators met the benchmark for Circuit Switched RAB congestion. Minimum Circuit Switched RAB
congestion was recorded for Airtel 3G at 0.0o%.
Call Drop Rate:
All operators met the benchmark for the parameter. Minimum call drop rate was recorded for Reliance
3G at 0.10%.
Worst affected cells having more than 3% Circuit switched voice drop rate:
All operators met he benchmark for the parameter. Best performance was recorded for Reliance 3G at
0.26%.
Circuit Switch Voice Quality:
All operators met the benchmark for the parameter. Best performance was recorded for Reliance 3G at
99.88%.
TRAI Audit Wireless Report-Kolkata Circle JAS Quarter-2016
41
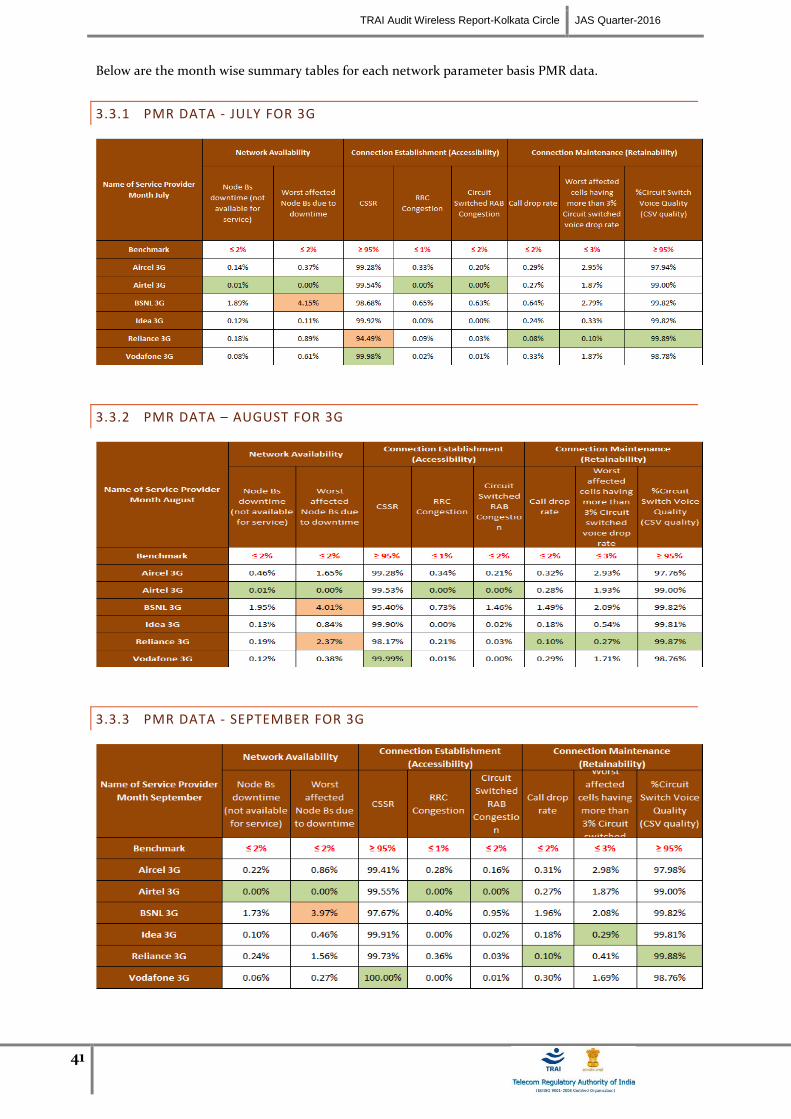
Below are the month wise summary tables for each network parameter basis PMR data.
3.3.1 PMR DATA - JULY FOR 3G
3.3.2 PMR DATA – AUGUST FOR 3G
3.3.3 PMR DATA - SEPTEMBER FOR 3G
42
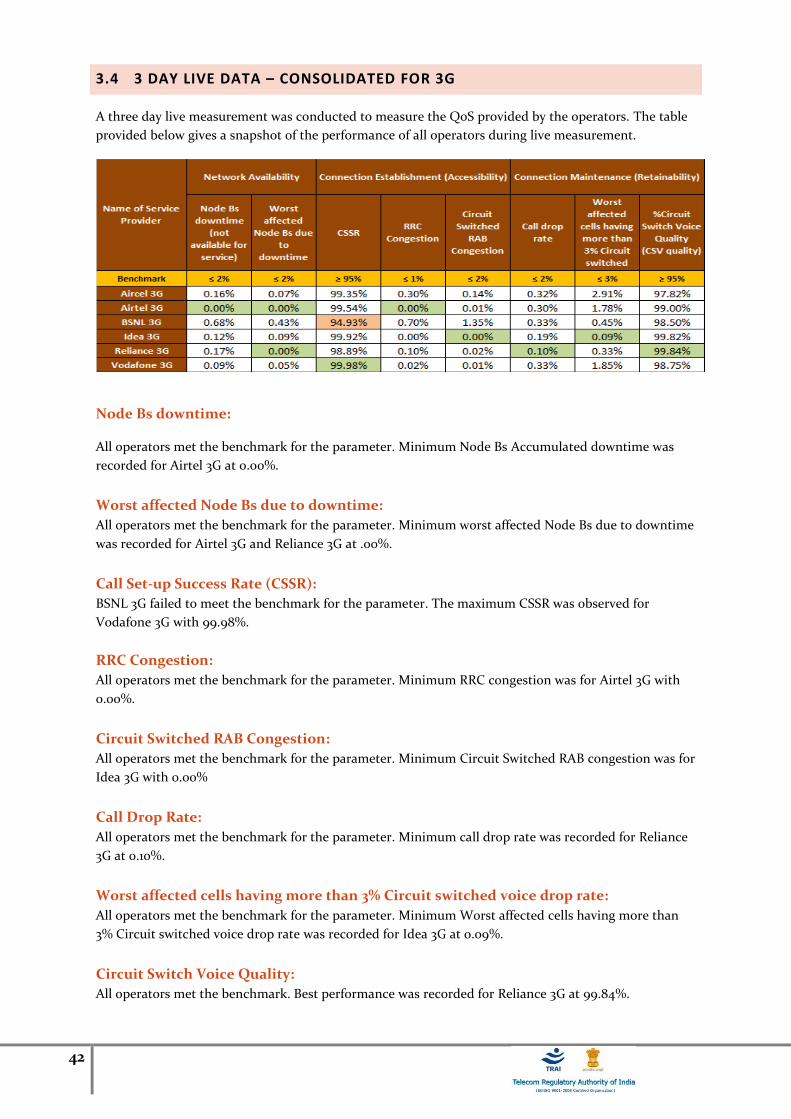
3.4 3 DAY LIVE DATA – CONSOLIDATED FOR 3G
A three day live measurement was conducted to measure the QoS provided by the operators. The table
provided below gives a snapshot of the performance of all operators during live measurement.
Node Bs downtime:
All operators met the benchmark for the parameter. Minimum Node Bs Accumulated downtime was
recorded for Airtel 3G at 0.00%.
Worst affected Node Bs due to downtime:
All operators met the benchmark for the parameter. Minimum worst affected Node Bs due to downtime
was recorded for Airtel 3G and Reliance 3G at .00%.
Call Set-up Success Rate (CSSR):
BSNL 3G failed to meet the benchmark for the parameter. The maximum CSSR was observed for
Vodafone 3G with 99.98%.
RRC Congestion:
All operators met the benchmark for the parameter. Minimum RRC congestion was for Airtel 3G with
0.00%.
Circuit Switched RAB Congestion:
All operators met the benchmark for the parameter. Minimum Circuit Switched RAB congestion was for
Idea 3G with 0.00%
Call Drop Rate:
All operators met the benchmark for the parameter. Minimum call drop rate was recorded for Reliance
3G at 0.10%.
Worst affected cells having more than 3% Circuit switched voice drop rate:
All operators met the benchmark for the parameter. Minimum Worst affected cells having more than
3% Circuit switched voice drop rate was recorded for Idea 3G at 0.09%.
Circuit Switch Voice Quality:
All operators met the benchmark. Best performance was recorded for Reliance 3G at 99.84%.
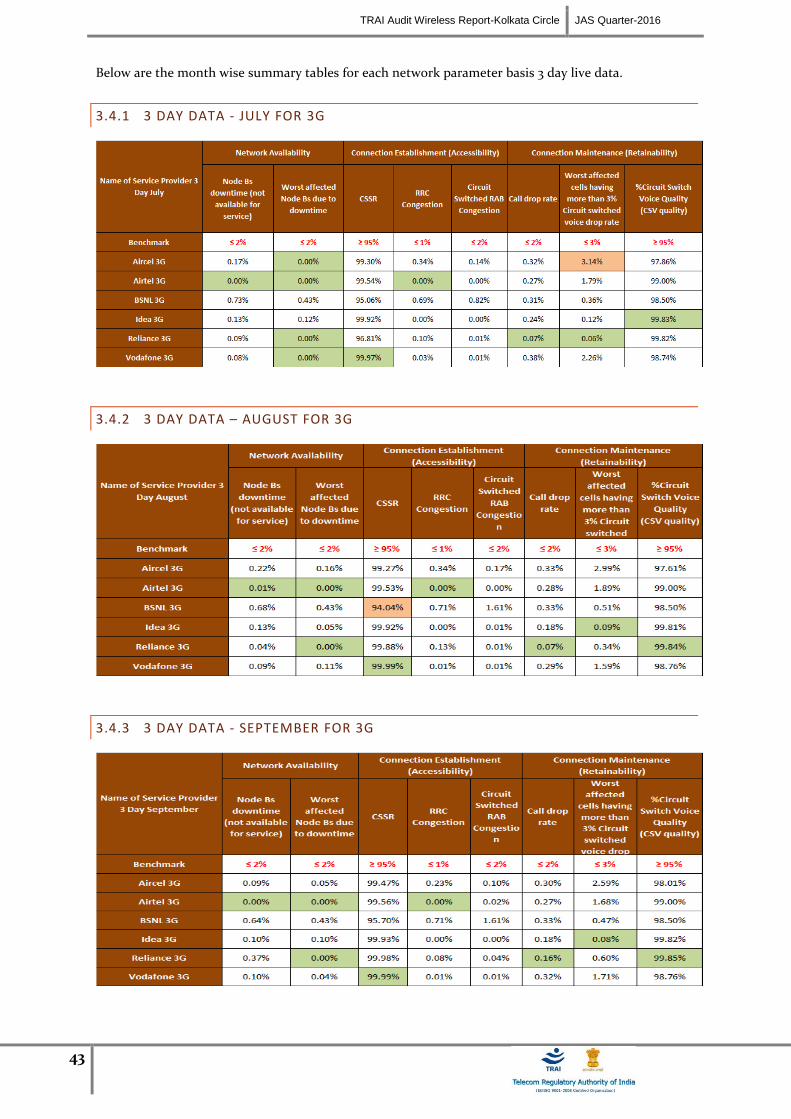
TRAI Audit Wireless Report-Kolkata Circle JAS Quarter-2016
43
Below are the month wise summary tables for each network parameter basis 3 day live data.
3.4.1 3 DAY DATA - JULY FOR 3G
3.4.2 3 DAY DATA – AUGUST FOR 3G
3.4.3 3 DAY DATA - SEPTEMBER FOR 3G

TRAI Audit Wireless Report-Kolkata Circle JAS Quarter-2016
44
3.5 WIRELESS DATA PMR & 3 DAY LIVE – CONSOLIDATED FOR 2G
NA: - No data received from operators
Following are the parameter wise observations for wireless operators for Kolkata circle:
Activation done within 4 hours:
During 3Days live Tata CDMA failed to meet the benchmark. Maximum Activation done within 4 hours
was recorded for TATA GSM at 100.00%. However in 3day live maximum Activation done within 4
hours was recorded for TATA GSM and BSNL at 100.00%.
PDP Context activation success rate:
In PMR as well as 3Days live all operators met the benchmark. Maximum PDP content Activation
success rate was recorded for Tata GSM at 99.94%. However in 3day live maximum PDP content
Activation success rate was recorded for Aircel at 99.97%.
Drop Rate:
All operators met the benchmark in PMR as well as 3day live. The minimum drop rate was observed in
PMR for Reliance GSM at 0.54% and 3days live for Reliance GSM at 0.44%
Note: - BSNL did not submit Drop rate data for both PMR as well as 3day live.
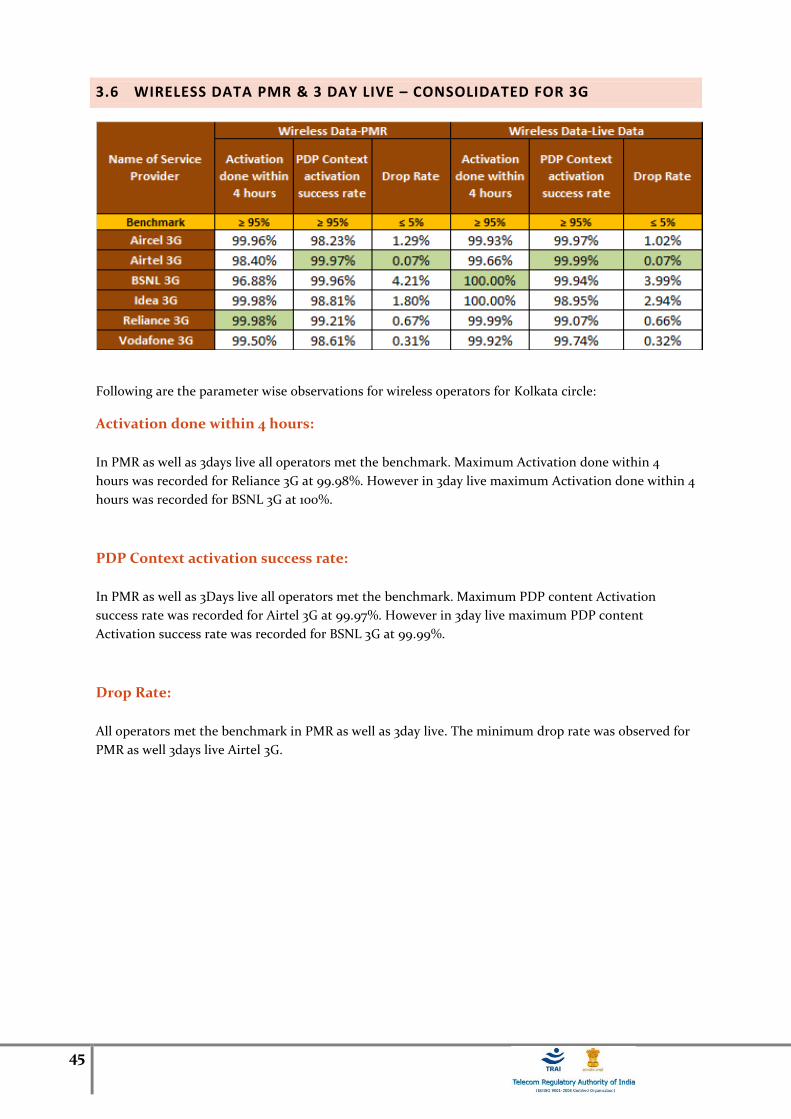
45
3.6 WIRELESS DATA PMR & 3 DAY LIVE – CONSOLIDATED FOR 3G
Following are the parameter wise observations for wireless operators for Kolkata circle:
Activation done within 4 hours:
In PMR as well as 3days live all operators met the benchmark. Maximum Activation done within 4
hours was recorded for Reliance 3G at 99.98%. However in 3day live maximum Activation done within 4
hours was recorded for BSNL 3G at 100%.
PDP Context activation success rate:
In PMR as well as 3Days live all operators met the benchmark. Maximum PDP content Activation
success rate was recorded for Airtel 3G at 99.97%. However in 3day live maximum PDP content
Activation success rate was recorded for BSNL 3G at 99.99%.
Drop Rate:
All operators met the benchmark in PMR as well as 3day live. The minimum drop rate was observed for
PMR as well 3days live Airtel 3G.
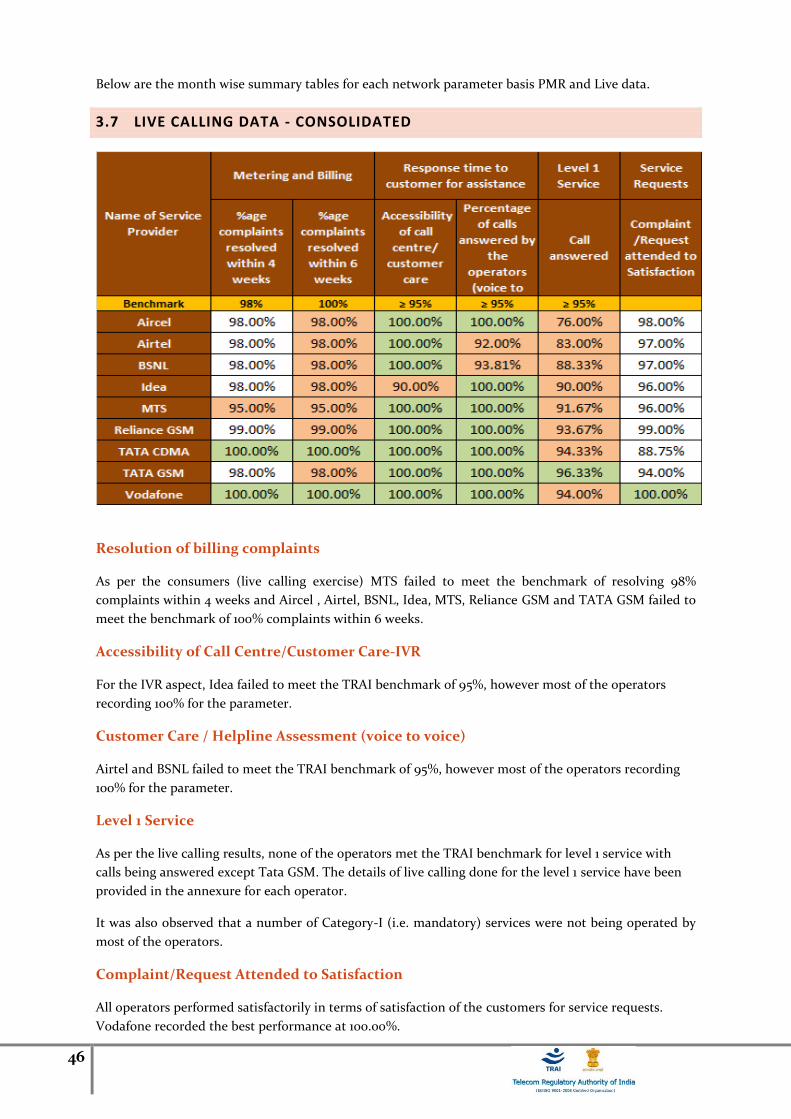
46
Below are the month wise summary tables for each network parameter basis PMR and Live data.
3.7 LIVE CALLING DATA - CONSOLIDATED
Resolution of billing complaints
As per the consumers (live calling exercise) MTS failed to meet the benchmark of resolving 98%
complaints within 4 weeks and Aircel , Airtel, BSNL, Idea, MTS, Reliance GSM and TATA GSM failed to
meet the benchmark of 100% complaints within 6 weeks.
Accessibility of Call Centre/Customer Care-IVR
For the IVR aspect, Idea failed to meet the TRAI benchmark of 95%, however most of the operators
recording 100% for the parameter.
Customer Care / Helpline Assessment (voice to voice)
Airtel and BSNL failed to meet the TRAI benchmark of 95%, however most of the operators recording
100% for the parameter.
Level 1 Service
As per the live calling results, none of the operators met the TRAI benchmark for level 1 service with
calls being answered except Tata GSM. The details of live calling done for the level 1 service have been
provided in the annexure for each operator.
It was also observed that a number of Category-I (i.e. mandatory) services were not being operated by
most of the operators.
Complaint/Request Attended to Satisfaction
All operators performed satisfactorily in terms of satisfaction of the customers for service requests.
Vodafone recorded the best performance at 100.00%.
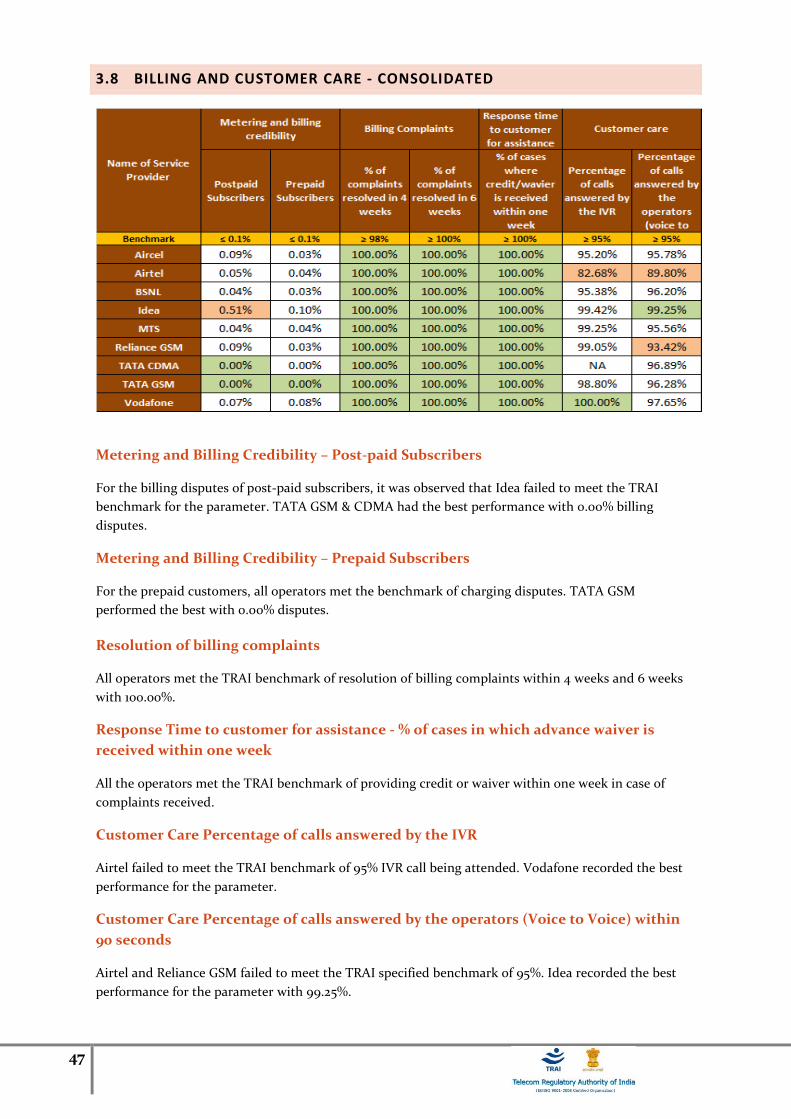
47
3.8 BILLING AND CUSTOMER CARE - CONSOLIDATED
Metering and Billing Credibility – Post-paid Subscribers
For the billing disputes of post-paid subscribers, it was observed that Idea failed to meet the TRAI
benchmark for the parameter. TATA GSM & CDMA had the best performance with 0.00% billing
disputes.
Metering and Billing Credibility – Prepaid Subscribers
For the prepaid customers, all operators met the benchmark of charging disputes. TATA GSM
performed the best with 0.00% disputes.
Resolution of billing complaints
All operators met the TRAI benchmark of resolution of billing complaints within 4 weeks and 6 weeks
with 100.00%.
Response Time to customer for assistance - % of cases in which advance waiver is
received within one week
All the operators met the TRAI benchmark of providing credit or waiver within one week in case of
complaints received.
Customer Care Percentage of calls answered by the IVR
Airtel failed to meet the TRAI benchmark of 95% IVR call being attended. Vodafone recorded the best
performance for the parameter.
Customer Care Percentage of calls answered by the operators (Voice to Voice) within
90 seconds
Airtel and Reliance GSM failed to meet the TRAI specified benchmark of 95%. Idea recorded the best
performance for the parameter with 99.25%.
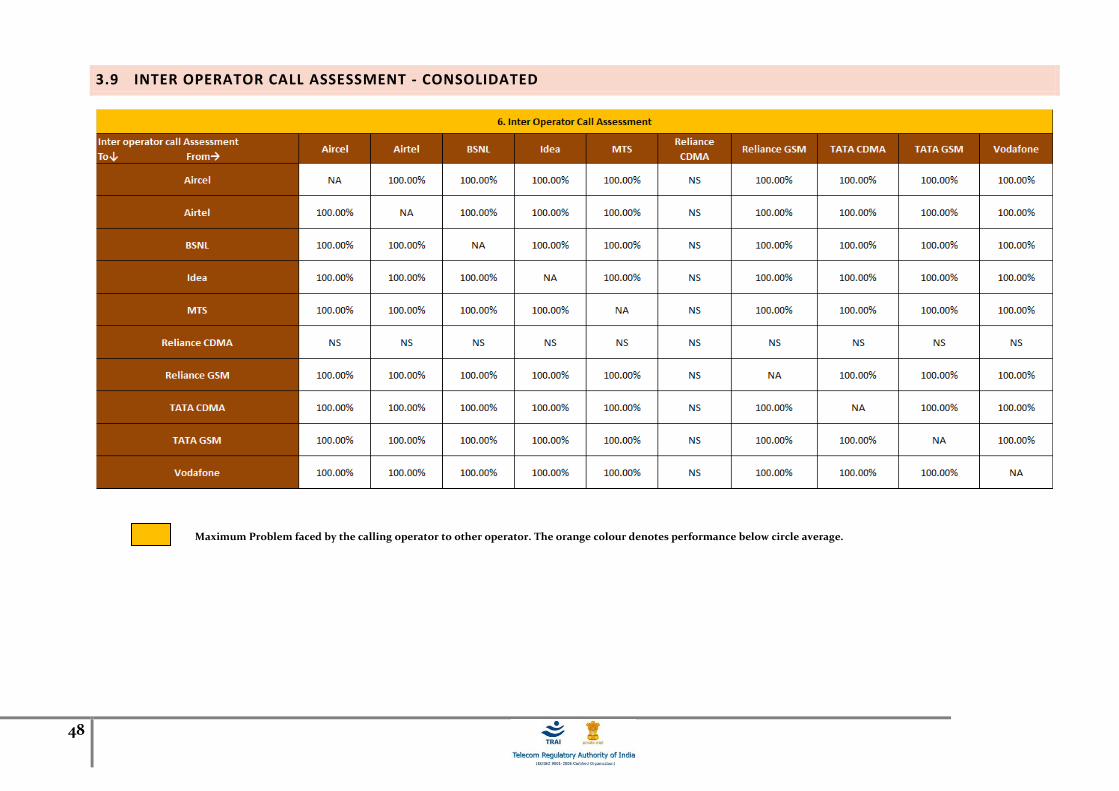
48
3.9 INTER OPERATOR CALL ASSESSMENT - CONSOLIDATED
Maximum Problem faced by the calling operator to other operator. The orange colour denotes performance below circle average.

TRAI Audit Wireless Report-Kolkata Circle JAS Quarter-2016
49
3.10 COMPARISON BETWEEN IMRB AND OPERATOR’S DATA FOR PMR 2G
3.11 COMPARISON BETWEEN IMRB AND OPERATOR’S DATA FOR PMR 3G
Value calculated by Operator and IMRB match Value calculated by Operator and IMRB do not match
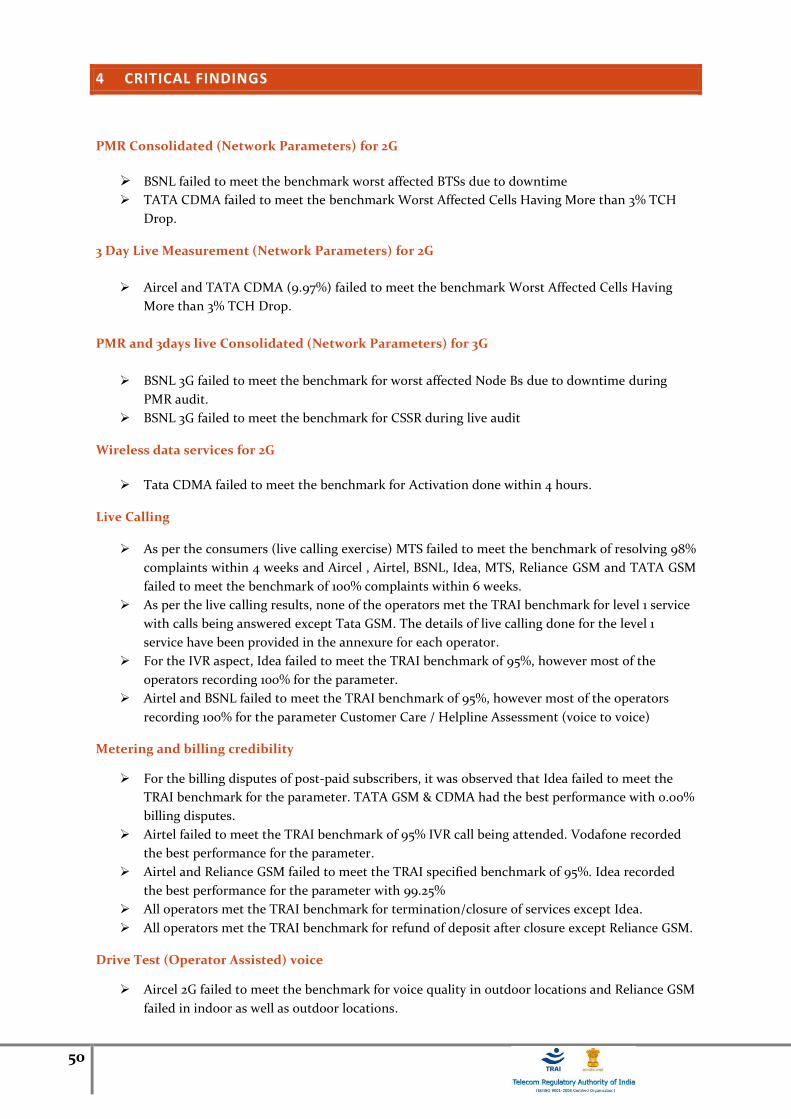
50
4 CRITICAL FINDINGS
PMR Consolidated (Network Parameters) for 2G
BSNL failed to meet the benchmark worst affected BTSs due to downtime
TATA CDMA failed to meet the benchmark Worst Affected Cells Having More than 3% TCH
Drop.
3 Day Live Measurement (Network Parameters) for 2G
Aircel and TATA CDMA (9.97%) failed to meet the benchmark Worst Affected Cells Having
More than 3% TCH Drop.
PMR and 3days live Consolidated (Network Parameters) for 3G
BSNL 3G failed to meet the benchmark for worst affected Node Bs due to downtime during
PMR audit.
BSNL 3G failed to meet the benchmark for CSSR during live audit
Wireless data services for 2G
Tata CDMA failed to meet the benchmark for Activation done within 4 hours.
Live Calling
As per the consumers (live calling exercise) MTS failed to meet the benchmark of resolving 98%
complaints within 4 weeks and Aircel , Airtel, BSNL, Idea, MTS, Reliance GSM and TATA GSM
failed to meet the benchmark of 100% complaints within 6 weeks.
As per the live calling results, none of the operators met the TRAI benchmark for level 1 service
with calls being answered except Tata GSM. The details of live calling done for the level 1
service have been provided in the annexure for each operator.
For the IVR aspect, Idea failed to meet the TRAI benchmark of 95%, however most of the
operators recording 100% for the parameter.
Airtel and BSNL failed to meet the TRAI benchmark of 95%, however most of the operators
recording 100% for the parameter Customer Care / Helpline Assessment (voice to voice)
Metering and billing credibility
For the billing disputes of post-paid subscribers, it was observed that Idea failed to meet the
TRAI benchmark for the parameter. TATA GSM & CDMA had the best performance with 0.00%
billing disputes.
Airtel failed to meet the TRAI benchmark of 95% IVR call being attended. Vodafone recorded
the best performance for the parameter.
Airtel and Reliance GSM failed to meet the TRAI specified benchmark of 95%. Idea recorded
the best performance for the parameter with 99.25%
All operators met the TRAI benchmark for termination/closure of services except Idea.
All operators met the TRAI benchmark for refund of deposit after closure except Reliance GSM.
Drive Test (Operator Assisted) voice
Aircel 2G failed to meet the benchmark for voice quality in outdoor locations and Reliance GSM
failed in indoor as well as outdoor locations.
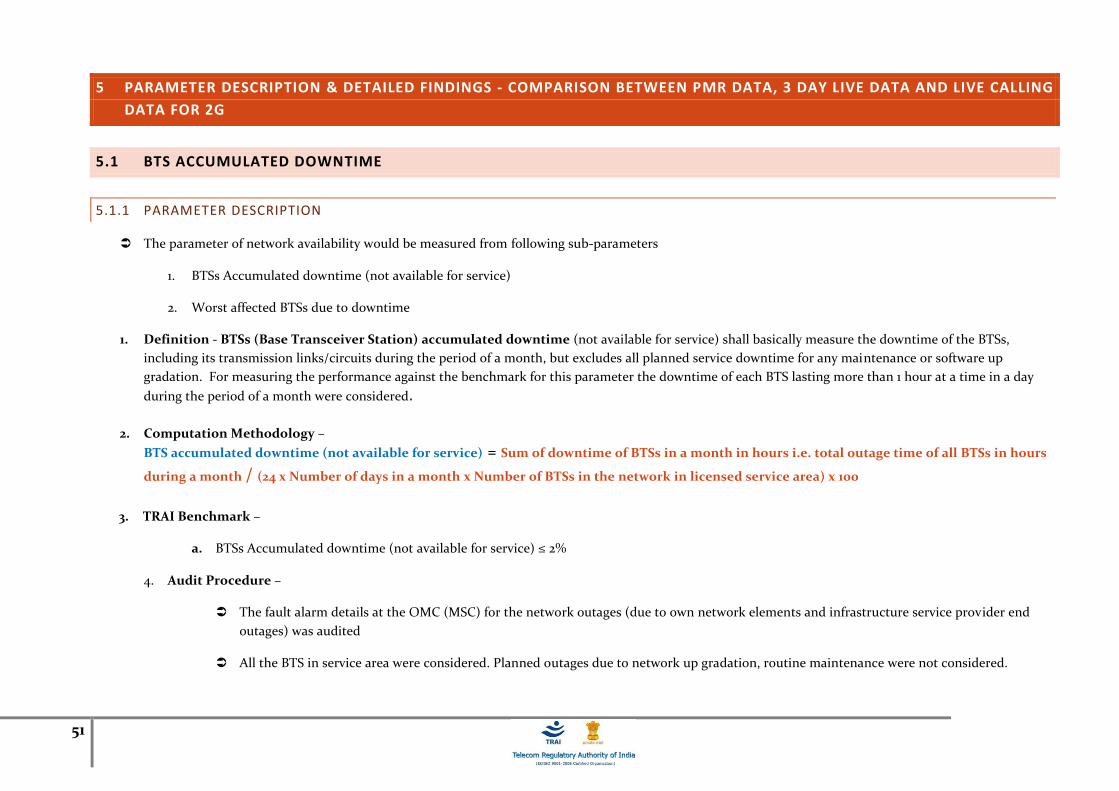
51
5 PARAMETER DESCRIPTION & DETAILED FINDINGS - COMPARISON BETWEEN PMR DATA, 3 DAY LIVE DATA AND LIVE CALLING
DATA FOR 2G
5.1 BTS ACCUMULATED DOWNTIME
5.1.1 PARAMETER DESCRIPTION
The parameter of network availability would be measured from following sub-parameters
1. BTSs Accumulated downtime (not available for service)
2. Worst affected BTSs due to downtime
1. Definition - BTSs (Base Transceiver Station) accumulated downtime (not available for service) shall basically measure the downtime of the BTSs,
including its transmission links/circuits during the period of a month, but excludes all planned service downtime for any maintenance or software up
gradation. For measuring the performance against the benchmark for this parameter the downtime of each BTS lasting more than 1 hour at a time in a day
during the period of a month were considered.
2. Computation Methodology –
BTS accumulated downtime (not available for service) = Sum of downtime of BTSs in a month in hours i.e. total outage time of all BTSs in hours
during a month / (24 x Number of days in a month x Number of BTSs in the network in licensed service area) x 100
3. TRAI Benchmark –
a. BTSs Accumulated downtime (not available for service) ≤ 2%
4. Audit Procedure –
The fault alarm details at the OMC (MSC) for the network outages (due to own network elements and infrastructure service provider end
outages) was audited
All the BTS in service area were considered. Planned outages due to network up gradation, routine maintenance were not considered.
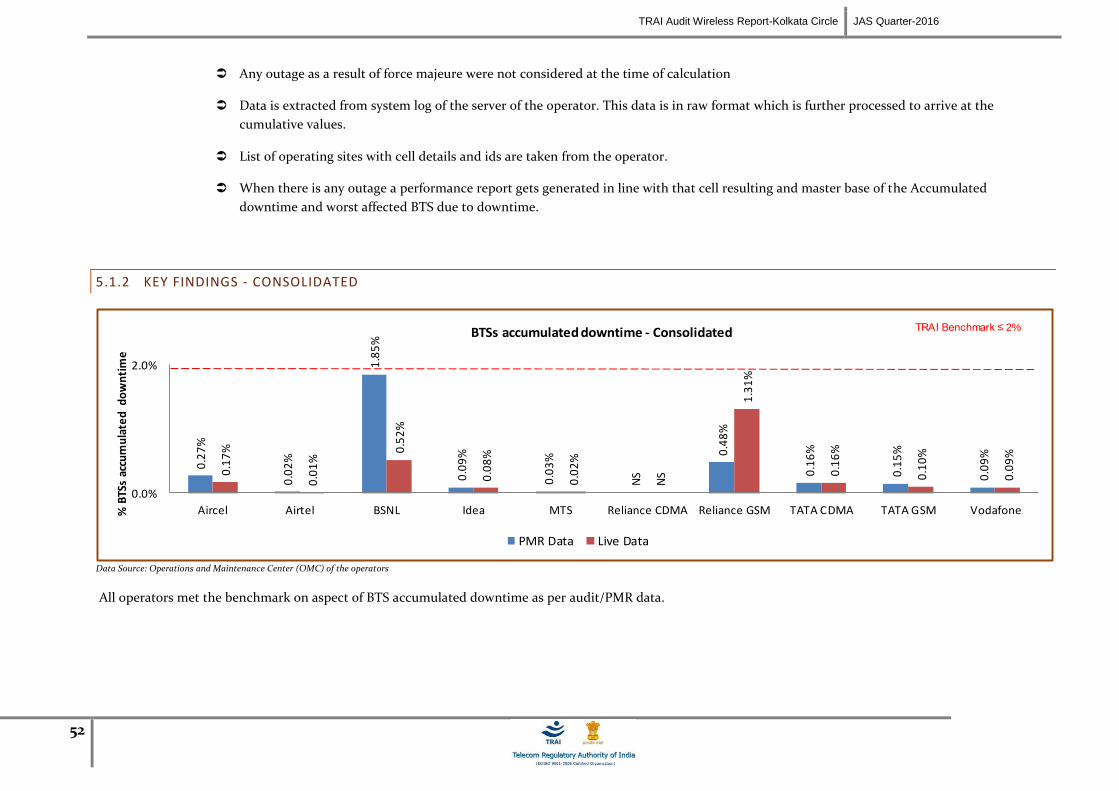
TRAI Audit Wireless Report-Kolkata Circle JAS Quarter-2016
52
Any outage as a result of force majeure were not considered at the time of calculation
Data is extracted from system log of the server of the operator. This data is in raw format which is further processed to arrive at the
cumulative values.
List of operating sites with cell details and ids are taken from the operator.
When there is any outage a performance report gets generated in line with that cell resulting and master base of the Accumulated
downtime and worst affected BTS due to downtime.
5.1.2 KEY FINDINGS - CONSOLIDATED
0.2
7%
0.0
2%
1.8
5%
0.0
9%
0.0
3%
NS
0.4
8%
0.1
6%
0.1
5%
0.0
9%
0.1
7%
0.0
1%
0.5
2%
0.0
8%
0.0
2%
NS
1.3
1%
0.1
6%
0.1
0%
0.0
9%
0.0%
2.0%
Aircel Airtel BSNL Idea MTS Reliance CDMA Reliance GSM TATA CDMA TATA GSM Vodafone% B
TSs
accu
mu
late
d d
ow
nti
me
BTSs accumulated downtime - Consolidated
PMR Data Live Data
TRAI Benchmark ≤ 2%
Data Source: Operations and Maintenance Center (OMC) of the operators
All operators met the benchmark on aspect of BTS accumulated downtime as per audit/PMR data.
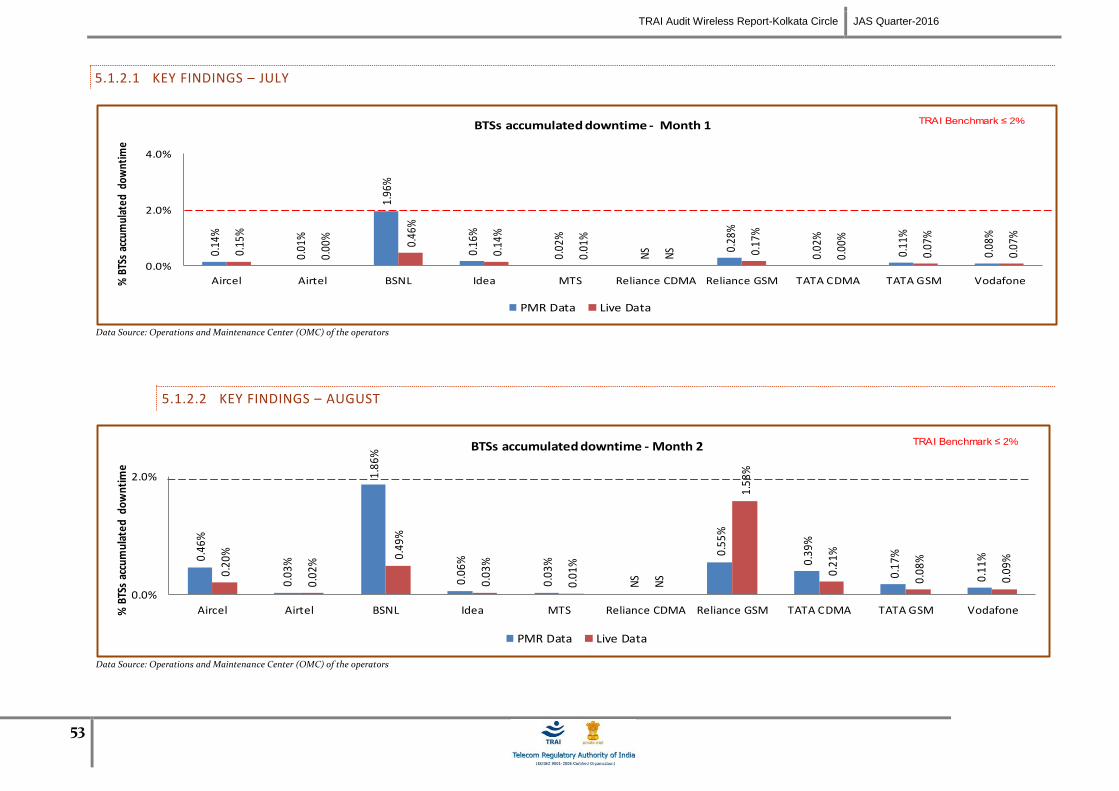
TRAI Audit Wireless Report-Kolkata Circle JAS Quarter-2016
53
5.1.2.1 KEY FINDINGS – JULY
0.14
%
0.01
%
1.96
%
0.16
%
0.02
%
NS 0.
28%
0.02
%
0.11
%
0.08
%
0.15
%
0.00
%
0.46
%
0.14
%
0.01
%
NS 0.
17%
0.00
%
0.07
%
0.07
%
0.0%
2.0%
4.0%
Aircel Airtel BSNL Idea MTS Reliance CDMA Reliance GSM TATA CDMA TATA GSM Vodafone% B
TSs
accu
mul
ated
dow
ntim
e BTSs accumulated downtime - Month 1
PMR Data Live Data
TRAI Benchmark ≤ 2%
Data Source: Operations and Maintenance Center (OMC) of the operators
5.1.2.2 KEY FINDINGS – AUGUST
0.46
%
0.03
%
1.86
%
0.06
%
0.03
%
NS
0.55
%
0.39
%
0.17
%
0.11
%
0.20
%
0.02
%
0.49
%
0.03
%
0.01
%
NS
1.58
%
0.21
%
0.08
%
0.09
%
0.0%
2.0%
Aircel Airtel BSNL Idea MTS Reliance CDMA Reliance GSM TATA CDMA TATA GSM Vodafone% B
TSs
accu
mul
ated
dow
ntim
e
BTSs accumulated downtime - Month 2
PMR Data Live Data
TRAI Benchmark ≤ 2%
Data Source: Operations and Maintenance Center (OMC) of the operators
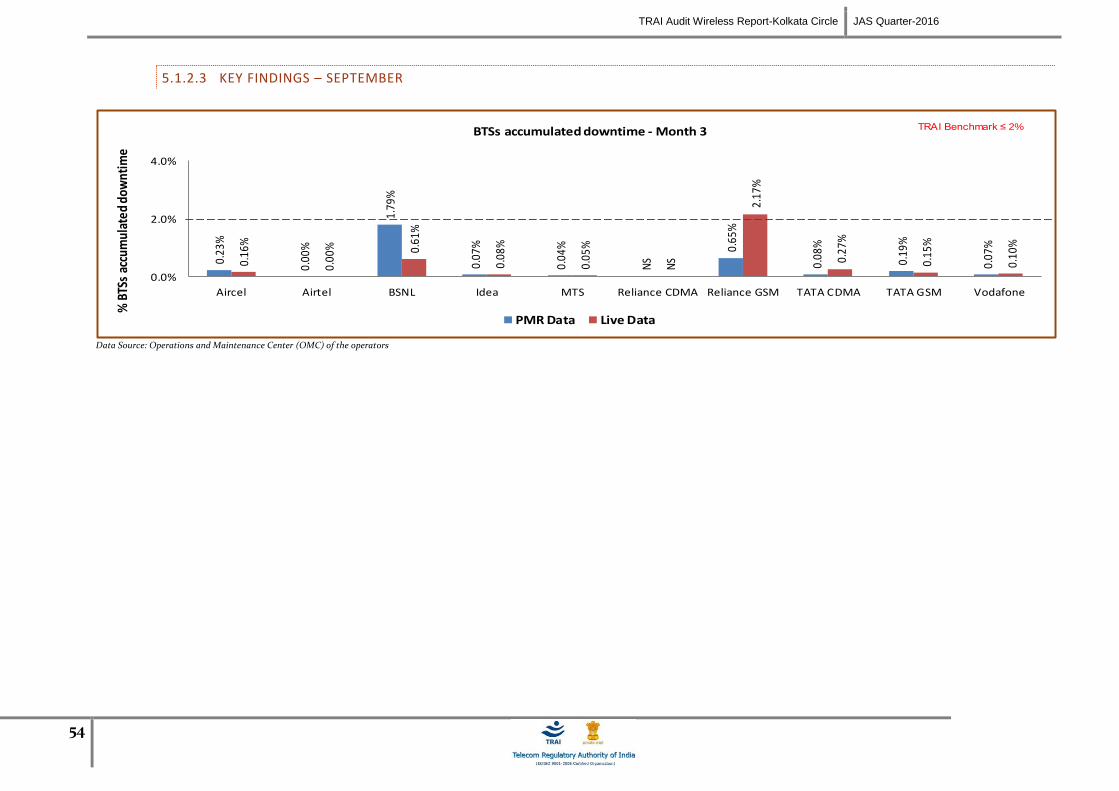
TRAI Audit Wireless Report-Kolkata Circle JAS Quarter-2016
54
5.1.2.3 KEY FINDINGS – SEPTEMBER
0.23
%
0.00
%
1.79
%
0.07
%
0.04
%
NS
0.65
%
0.08
%
0.19
%
0.07
%
0.16
%
0.00
% 0.61
%
0.08
%
0.05
%
NS
2.17
%
0.27
%
0.15
%
0.10
%
0.0%
2.0%
4.0%
Aircel Airtel BSNL Idea MTS Reliance CDMA Reliance GSM TATA CDMA TATA GSM Vodafone
% B
TSs
accu
mul
ated
dow
ntim
e BTSs accumulated downtime - Month 3
PMR Data Live Data
TRAI Benchmark ≤ 2%
Data Source: Operations and Maintenance Center (OMC) of the operators
TRAI Audit Wireless Report-Kolkata Circle JAS Quarter-2016
55
5.2 WORST AFFECTED BTS DUE TO DOWNTIME
5.2.1 PARAMETER DESCRIPTION
Definition – Worst Affected BTS due to downtime shall basically measure percentage of BTS having downtime greater than 24 hours in a month. Planned
outages were not considered as part while computing.
For measuring the parameter “Percentage of worst affected BTSs due to downtime" the downtime of each BTS lasting for more than 1 hour at a time in a day
during the period of a month was considered.
Computation Methodology –
Worst affected BTSs due to downtime = (Number of BTSs having accumulated downtime greater than 24 hours in a month / Number of BTS in
Licensed Service Area) * 100
TRAI Benchmark –
a. Worst affected BTSs due to downtime ≤ 2%
Audit Procedure –
i. The fault alarm details at the OMC (MSC) for the network outages (due to own network elements and infrastructure service provider end
outages) was audited
ii. All the BTS in service area were considered. Planned outages due to network up gradation, routine maintenance were not considered.
iii. Data is extracted from system log of the server of the operator. This data is in raw format which is further processed to arrive at the
cumulative values.
iv. Any outage as a result of force majeure was not considered at the time of calculation.
v. List of operating sites with cell details and ids are taken from the operator.
vi. All the BTS having down time greater than 24 hours is assessed and values of BTS accumulated downtime is computed in accordance.
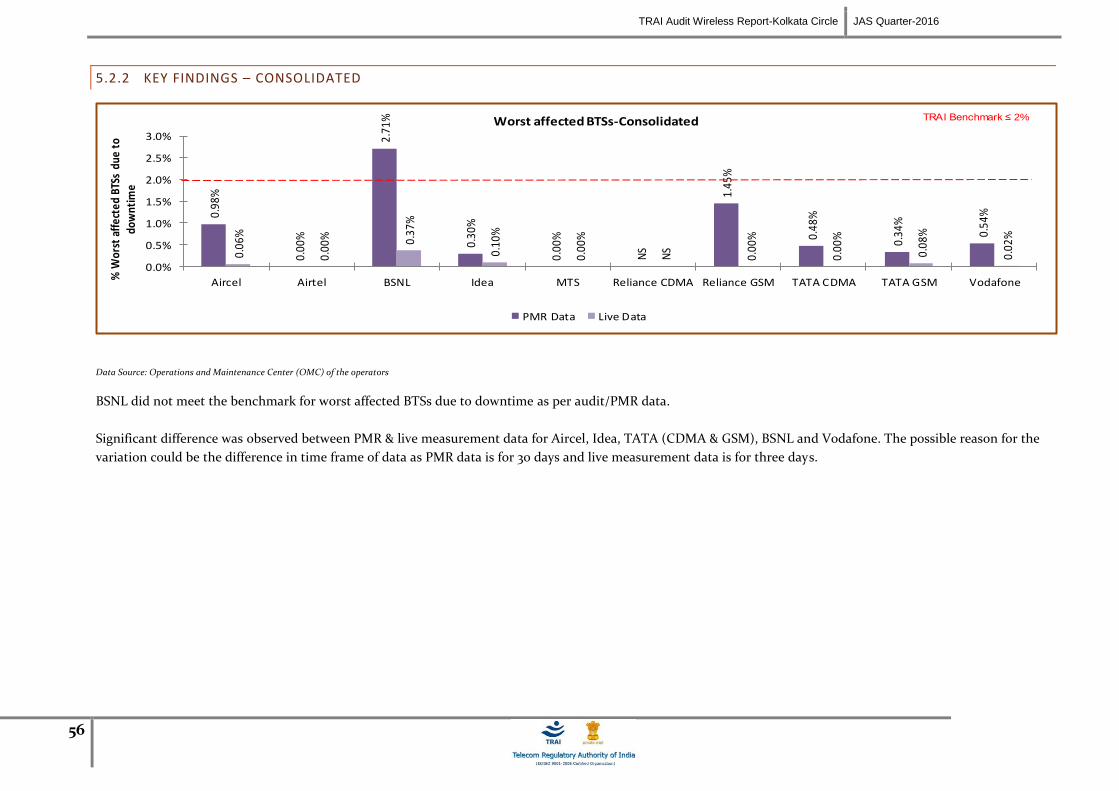
TRAI Audit Wireless Report-Kolkata Circle JAS Quarter-2016
56
5.2.2 KEY FINDINGS – CONSOLIDATED
0.98
%
0.00
%
2.71
%
0.30
%
0.00
%
NS
1.45
%
0.48
%
0.34
%
0.54
%
0.06
%
0.00
% 0.37
%
0.10
%
0.00
%
NS
0.00
%
0.00
%
0.08
%
0.02
%
0.0%
0.5%
1.0%
1.5%
2.0%
2.5%
3.0%
Aircel Airtel BSNL Idea MTS Reliance CDMA Reliance GSM TATA CDMA TATA GSM Vodafone
% W
orst
aff
ecte
d BT
Ss d
ue t
o do
wnt
ime
Worst affected BTSs-Consolidated
PMR Data Live Data
TRAI Benchmark ≤ 2%
Data Source: Operations and Maintenance Center (OMC) of the operators
BSNL did not meet the benchmark for worst affected BTSs due to downtime as per audit/PMR data.
Significant difference was observed between PMR & live measurement data for Aircel, Idea, TATA (CDMA & GSM), BSNL and Vodafone. The possible reason for the
variation could be the difference in time frame of data as PMR data is for 30 days and live measurement data is for three days.

TRAI Audit Wireless Report-Kolkata Circle JAS Quarter-2016
57
5.2.2.1 KEY FINDINGS – JULY
0.43
%
0.00
%
2.77
%
0.43
%
0.00
%
NS
1.41
%
0.00
%
0.17
%
0.92
%
0.00
%
0.00
%
0.32
%
0.13
%
0.00
%
NS
0.00
%
0.00
%
0.00
%
0.00
%
0.0%
0.5%
1.0%
1.5%
2.0%
2.5%
3.0%
Aircel Airtel BSNL Idea MTS Reliance CDMA Reliance GSM TATA CDMA TATA GSM Vodafone
% W
orst
aff
ecte
d BT
Ss d
ue t
o do
wnt
ime
Worst affected BTSs- Month 1
PMR Data Live Data
TRAI Benchmark ≤ 2%
Data Source: Operations and Maintenance Center (OMC) of the operators
5.2.2.2 KEY FINDINGS – AUGUST
1.68
%
0.00
%
2.85
%
0.21
%
0.00
%
NS
1.96
%
0.71
%
0.28
%
0.37
%
0.04
%
0.00
%
0.32
%
0.04
%
0.00
%
NS
0.00
%
0.00
%
0.23
%
0.04
%
0.0%
0.5%
1.0%
1.5%
2.0%
2.5%
3.0%
Aircel Airtel BSNL Idea MTS Reliance CDMA Reliance GSM TATA CDMA TATA GSM Vodafone
% W
orst
aff
ecte
d BT
Ss d
ue t
o do
wnt
ime
Worst affected BTSs- Month 2
PMR Data Live Data
TRAI Benchmark ≤ 2%
Data Source: Operations and Maintenance Center (OMC) of the operators

TRAI Audit Wireless Report-Kolkata Circle JAS Quarter-2016
58
5.2.2.3 KEY FINDINGS – SEPTEMBER
0.83
%
0.00
%
2.51
%
0.25
%
0.00
%
NS
0.99
%
0.71
%
0.56
%
0.33
%
0.13
%
0.00
% 0.47
%
0.13
%
0.00
%
NS
0.00
%
0.00
%
0.00
%
0.04
%
0.0%
0.5%
1.0%
1.5%
2.0%
2.5%
3.0%
Aircel Airtel BSNL Idea MTS Reliance CDMA Reliance GSM TATA CDMA TATA GSM Vodafone
% W
orst
aff
ecte
d BT
Ss d
ue t
o do
wnt
ime
Worst affected BTSs-Month 3
PMR Data Live Data
TRAI Benchmark ≤ 2%
Data Source: Operations and Maintenance Center (OMC) of the operators
TRAI Audit Wireless Report-Kolkata Circle JAS Quarter-2016
59
5.3 CALL SET UP SUCCESS RATE
5.3.1 PARAMETER DESCRIPTION
1. Definition: The ratio of successful calls established to total calls is known as Call Set-Up Success Rate (CSSR).
2. Computation Methodology-
(Calls Established / Total Call Attempts) * 100
Call Established means the following events have happened in call setup:-
call attempt is made
the TCH is allocated
the call is routed to the outward path of the concerned MSC
3. TRAI Benchmark ≥ 95%
4. Audit Procedure –
The cell-wise data generated through counters/ MMC available in the switch for traffic measurements
CSSR calculation should be measured using OMC generated data only
Measurement should be only in Time Consistent Busy Hour (CBBH) period for all days of the week
Counter data is extracted from the NOC of the operators.
Total calls established include all calls established excluding Signaling blocking, TCH Drop and TCH blocking.
The numerator and denominator values are derived from adding the counter values from the MSC.
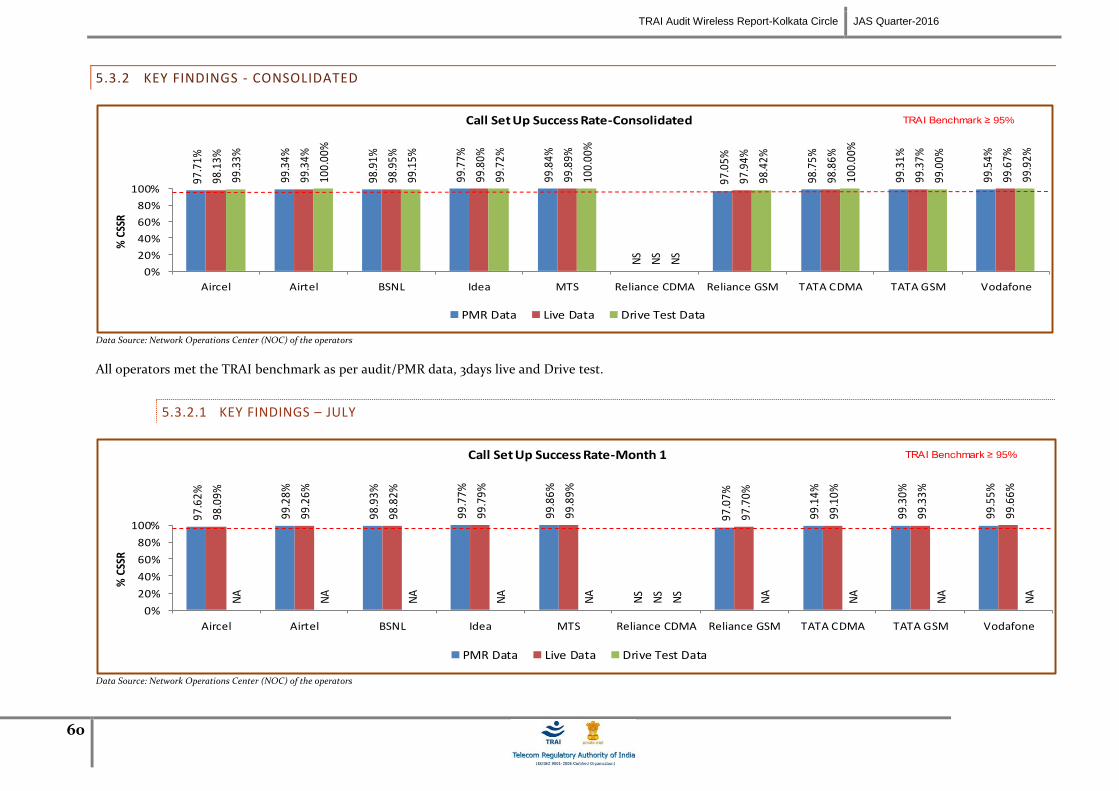
TRAI Audit Wireless Report-Kolkata Circle JAS Quarter-2016
60
5.3.2 KEY FINDINGS - CONSOLIDATED
97.7
1%
99.3
4%
98.9
1%
99.7
7%
99.8
4%
NS
97.0
5%
98.7
5%
99.3
1%
99.5
4%
98.1
3%
99.3
4%
98.9
5%
99.8
0%
99.8
9%
NS
97.9
4%
98.8
6%
99.3
7%
99.6
7%
99.3
3%
100.
00%
99.1
5%
99.7
2%
100.
00%
NS
98.4
2%
100.
00%
99.0
0%
99.9
2%
0%
20%
40%
60%
80%
100%
Aircel Airtel BSNL Idea MTS Reliance CDMA Reliance GSM TATA CDMA TATA GSM Vodafone
% C
SSR
Call Set Up Success Rate-Consolidated
PMR Data Live Data Drive Test Data
TRAI Benchmark ≥ 95%
Data Source: Network Operations Center (NOC) of the operators
All operators met the TRAI benchmark as per audit/PMR data, 3days live and Drive test.
5.3.2.1 KEY FINDINGS – JULY
97.6
2%
99.2
8%
98.9
3%
99.7
7%
99.8
6%
NS
97.0
7%
99.1
4%
99.3
0%
99.5
5%
98.0
9%
99.2
6%
98.8
2%
99.7
9%
99.8
9%
NS
97.7
0%
99.1
0%
99.3
3%
99.6
6%
NA
NA
NA
NA
NA
NS
NA
NA
NA
NA
0%
20%
40%
60%
80%
100%
Aircel Airtel BSNL Idea MTS Reliance CDMA Reliance GSM TATA CDMA TATA GSM Vodafone
% C
SSR
Call Set Up Success Rate-Month 1
PMR Data Live Data Drive Test Data
TRAI Benchmark ≥ 95%
Data Source: Network Operations Center (NOC) of the operators
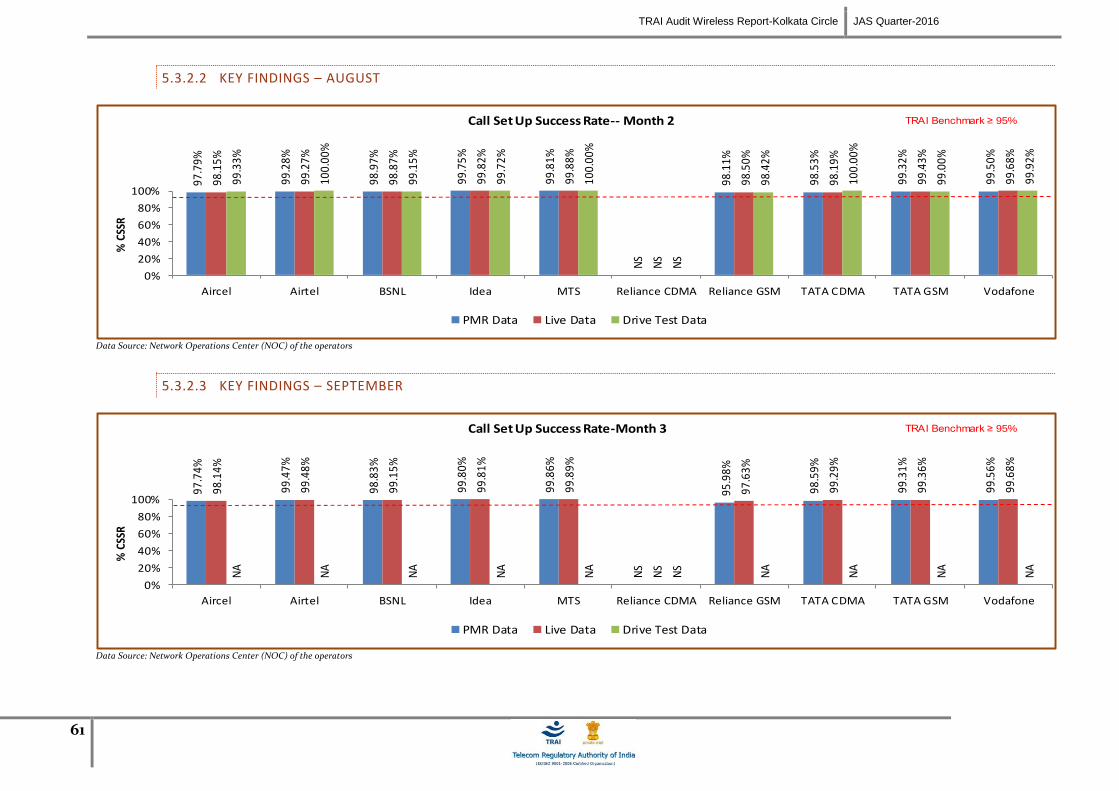
TRAI Audit Wireless Report-Kolkata Circle JAS Quarter-2016
61
5.3.2.2 KEY FINDINGS – AUGUST
97.7
9%
99.2
8%
98.9
7%
99.7
5%
99.8
1%
NS
98.1
1%
98.5
3%
99.3
2%
99.5
0%
98.1
5%
99.2
7%
98.8
7%
99.8
2%
99.8
8%
NS
98.5
0%
98.1
9%
99.4
3%
99.6
8%
99.3
3%
100.
00%
99.1
5%
99.7
2%
100.
00%
NS
98.4
2%
100.
00%
99.0
0%
99.9
2%
0%
20%
40%
60%
80%
100%
Aircel Airtel BSNL Idea MTS Reliance CDMA Reliance GSM TATA CDMA TATA GSM Vodafone
% C
SSR
Call Set Up Success Rate-- Month 2
PMR Data Live Data Drive Test Data
TRAI Benchmark ≥ 95%
Data Source: Network Operations Center (NOC) of the operators
5.3.2.3 KEY FINDINGS – SEPTEMBER
97.7
4%
99.4
7%
98.8
3%
99.8
0%
99.8
6%
NS
95.9
8%
98.5
9%
99.3
1%
99.5
6%
98.1
4%
99.4
8%
99.1
5%
99.8
1%
99.8
9%
NS
97.6
3%
99.2
9%
99.3
6%
99.6
8%
NA
NA
NA
NA
NA
NS
NA
NA
NA
NA
0%
20%
40%
60%
80%
100%
Aircel Airtel BSNL Idea MTS Reliance CDMA Reliance GSM TATA CDMA TATA GSM Vodafone
% C
SSR
Call Set Up Success Rate-Month 3
PMR Data Live Data Drive Test Data
TRAI Benchmark ≥ 95%
Data Source: Network Operations Center (NOC) of the operators

TRAI Audit Wireless Report-Kolkata Circle JAS Quarter-2016
62
5.4 NETWORK CHANNEL CONGESTION- PAGING CHANNEL /TCH CONGESTION/POI
5.4.1 PARAMETER DESCRIPTION
1. Definition: It means a call is not connected because there is no free channel to serve the call attempt. This parameter represents congestion in the network.
It happens at three levels:
SDCCH Level: Stand-alone dedicated control channel
TCH Level: Traffic Channel
POI Level: Point of Interconnect
2. Computational Methodology:
SDCCH / TCH Congestion% = [(A1 x C1) + (A2 x C2) +…….+ (An x Cn)] / (A1 + A2 +…+ An)
Where:-A1 = Number of attempts to establish SDCCH / TCH made on day 1
C1 = Average SDCCH / TCH Congestion % on day 1
A2 = Number of attempts to establish SDCCH / TCH made on day 2
C2 = Average SDCCH / TCH Congestion % on day 2
An = Number of attempts to establish SDCCH / TCH made on day n
Cn = Average SDCCH / TCH Congestion % on day n
POI Congestion% = [(A1 x C1) + (A2 x C2) +…….+ (An x Cn)] / (A1 + A2 +…+ An)
Where:-A1 = POI traffic offered on all POIs (no. of calls) on day 1
C1 = Average POI Congestion % on day 1
A2 = POI traffic offered on all POIs (no. of calls) on day 2
C2 = Average POI Congestion % on day 2
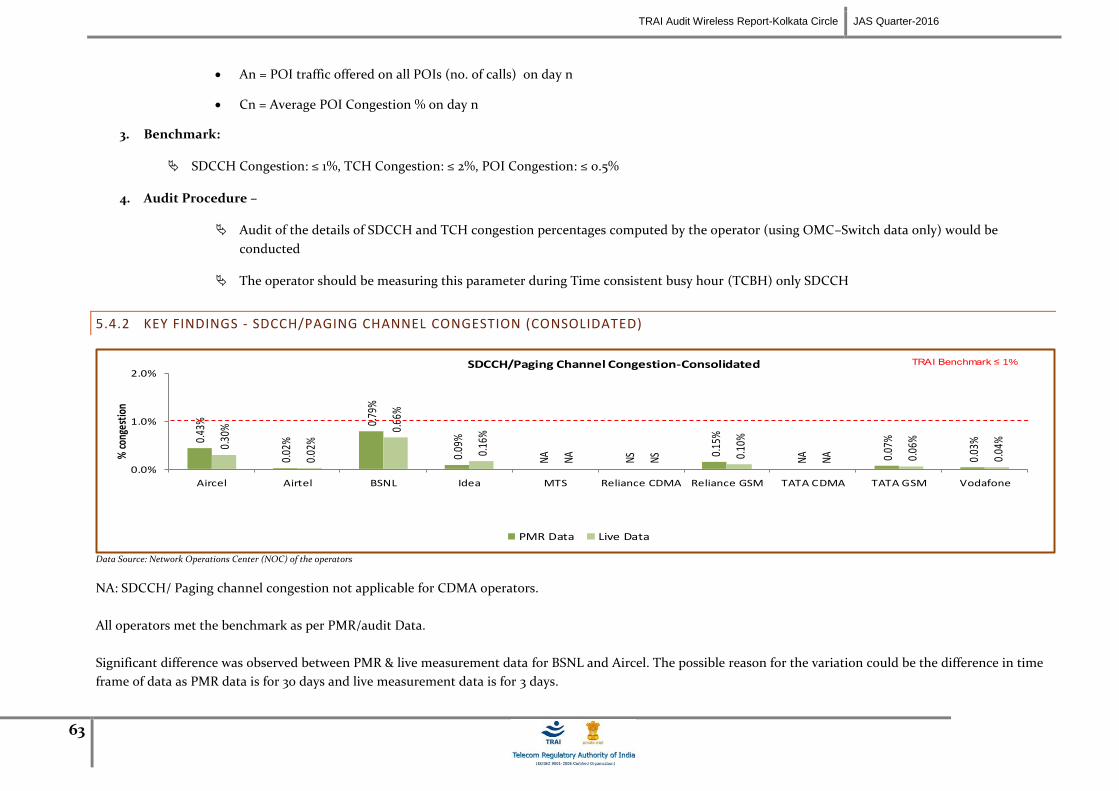
TRAI Audit Wireless Report-Kolkata Circle JAS Quarter-2016
63
An = POI traffic offered on all POIs (no. of calls) on day n
Cn = Average POI Congestion % on day n
3. Benchmark:
SDCCH Congestion: ≤ 1%, TCH Congestion: ≤ 2%, POI Congestion: ≤ 0.5%
4. Audit Procedure –
Audit of the details of SDCCH and TCH congestion percentages computed by the operator (using OMC–Switch data only) would be
conducted
The operator should be measuring this parameter during Time consistent busy hour (TCBH) only SDCCH
5.4.2 KEY FINDINGS - SDCCH/PAGING CHANNEL CONGESTION (CONSOLIDATED)
0.43
%
0.02
%
0.79
%
0.09
%
NA NS
0.15
%
NA 0.07
%
0.03
%0.30
%
0.02
%
0.66
%
0.16
%
NA NS 0.10
%
NA 0.06
%
0.04
%
0.0%
1.0%
2.0%
Aircel Airtel BSNL Idea MTS Reliance CDMA Reliance GSM TATA CDMA TATA GSM Vodafone
% c
onge
stio
n
SDCCH/Paging Channel Congestion-Consolidated
PMR Data Live Data
TRAI Benchmark ≤ 1%
Data Source: Network Operations Center (NOC) of the operators
NA: SDCCH/ Paging channel congestion not applicable for CDMA operators.
All operators met the benchmark as per PMR/audit Data.
Significant difference was observed between PMR & live measurement data for BSNL and Aircel. The possible reason for the variation could be the difference in time
frame of data as PMR data is for 30 days and live measurement data is for 3 days.
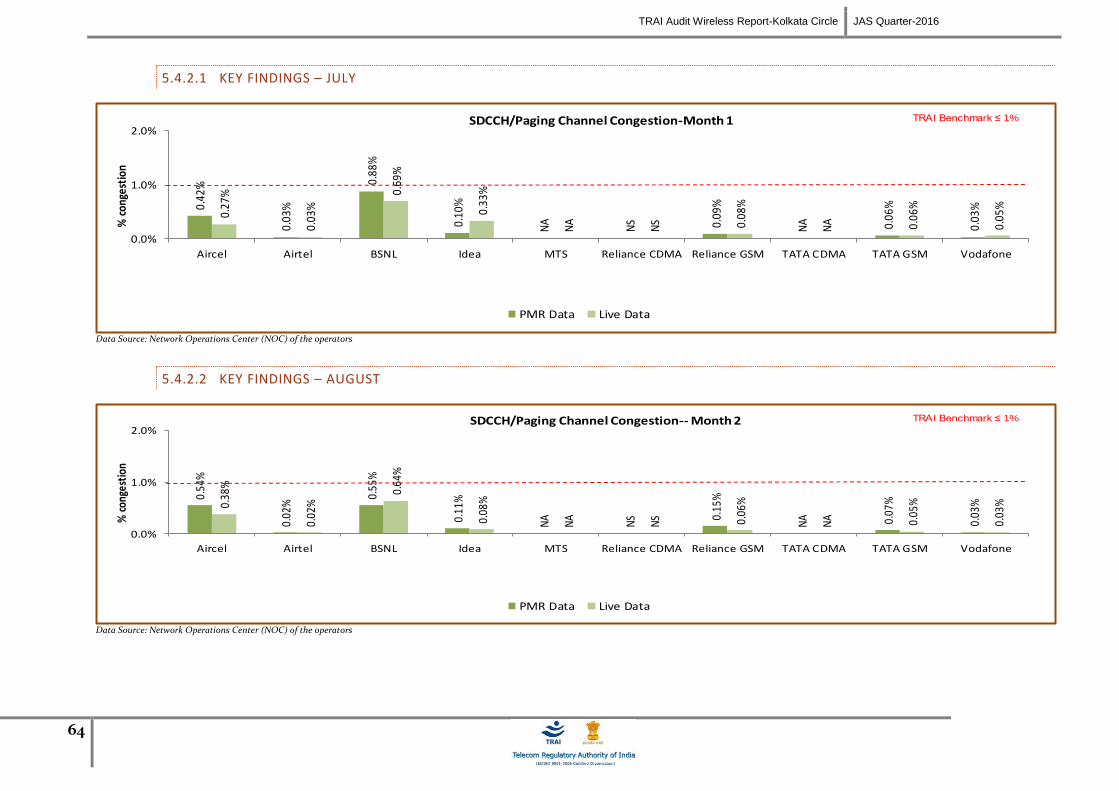
TRAI Audit Wireless Report-Kolkata Circle JAS Quarter-2016
64
5.4.2.1 KEY FINDINGS – JULY
0.42
%
0.03
%
0.88
%
0.10
%
NA
NS 0.
09%
NA 0.06
%
0.03
%
0.27
%
0.03
%
0.69
%
0.33
%
NA
NS 0.
08%
NA 0.06
%
0.05
%
0.0%
1.0%
2.0%
Aircel Airtel BSNL Idea MTS Reliance CDMA Reliance GSM TATA CDMA TATA GSM Vodafone
% c
onge
stio
n SDCCH/Paging Channel Congestion-Month 1
PMR Data Live Data
TRAI Benchmark ≤ 1%
Data Source: Network Operations Center (NOC) of the operators
5.4.2.2 KEY FINDINGS – AUGUST
0.54
%
0.02
%
0.55
%
0.11
%
NA
NS 0.
15%
NA 0.
07%
0.03
%0.38
%
0.02
%
0.64
%
0.08
%
NA
NS 0.06
%
NA 0.05
%
0.03
%
0.0%
1.0%
2.0%
Aircel Airtel BSNL Idea MTS Reliance CDMA Reliance GSM TATA CDMA TATA GSM Vodafone
% c
onge
stio
n
SDCCH/Paging Channel Congestion-- Month 2
PMR Data Live Data
TRAI Benchmark ≤ 1%
Data Source: Network Operations Center (NOC) of the operators

TRAI Audit Wireless Report-Kolkata Circle JAS Quarter-2016
65
5.4.2.3 KEY FINDINGS – SEPTEMBER
0.34
%
0.02
%
0.93
%
0.06
%
NA
NS 0.
22%
NA 0.07
%
0.04
%
0.26
%
0.01
%
0.64
%
0.08
%
NA
NS 0.
16%
NA 0.
08%
0.05
%
0.0%
1.0%
2.0%
Aircel Airtel BSNL Idea MTS Reliance CDMA Reliance GSM TATA CDMA TATA GSM Vodafone
% c
onge
stio
n SDCCH/Paging Channel Congestion-Month 3
PMR Data Live Data
TRAI Benchmark ≤ 1%
Data Source: Network Operations Center (NOC) of the operators
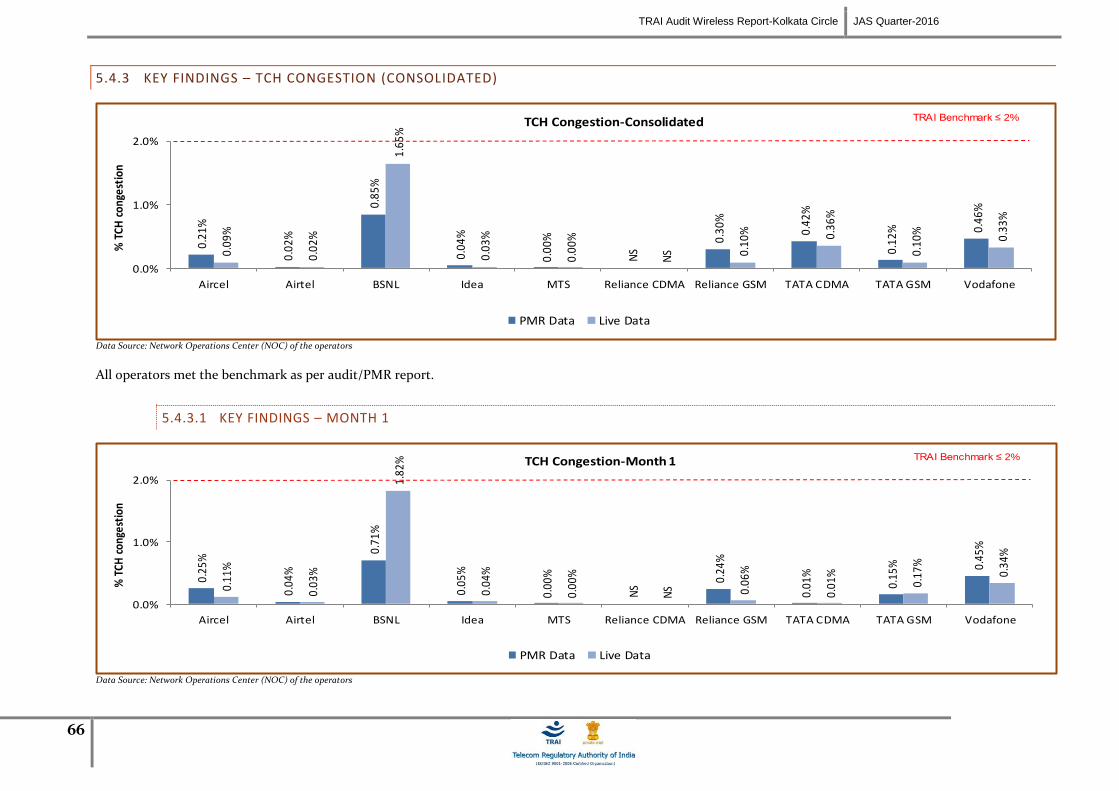
TRAI Audit Wireless Report-Kolkata Circle JAS Quarter-2016
66
5.4.3 KEY FINDINGS – TCH CONGESTION (CONSOLIDATED)
0.21
%
0.02
%
0.85
%
0.04
%
0.00
%
NS
0.30
%
0.42
%
0.12
% 0.46
%
0.09
%
0.02
%
1.65
%
0.03
%
0.00
%
NS 0.
10% 0.36
%
0.10
%
0.33
%
0.0%
1.0%
2.0%
Aircel Airtel BSNL Idea MTS Reliance CDMA Reliance GSM TATA CDMA TATA GSM Vodafone
% T
CH c
onge
stio
n TCH Congestion-Consolidated
PMR Data Live Data
TRAI Benchmark ≤ 2%
Data Source: Network Operations Center (NOC) of the operators
All operators met the benchmark as per audit/PMR report.
5.4.3.1 KEY FINDINGS – MONTH 1
0.25
%
0.04
%
0.71
%
0.05
%
0.00
%
NS
0.24
%
0.01
%
0.15
% 0.45
%
0.11
%
0.03
%
1.82
%
0.04
%
0.00
%
NS 0.
06%
0.01
%
0.17
%
0.34
%
0.0%
1.0%
2.0%
Aircel Airtel BSNL Idea MTS Reliance CDMA Reliance GSM TATA CDMA TATA GSM Vodafone
% T
CH c
onge
stio
n
TCH Congestion-Month 1
PMR Data Live Data
TRAI Benchmark ≤ 2%
Data Source: Network Operations Center (NOC) of the operators
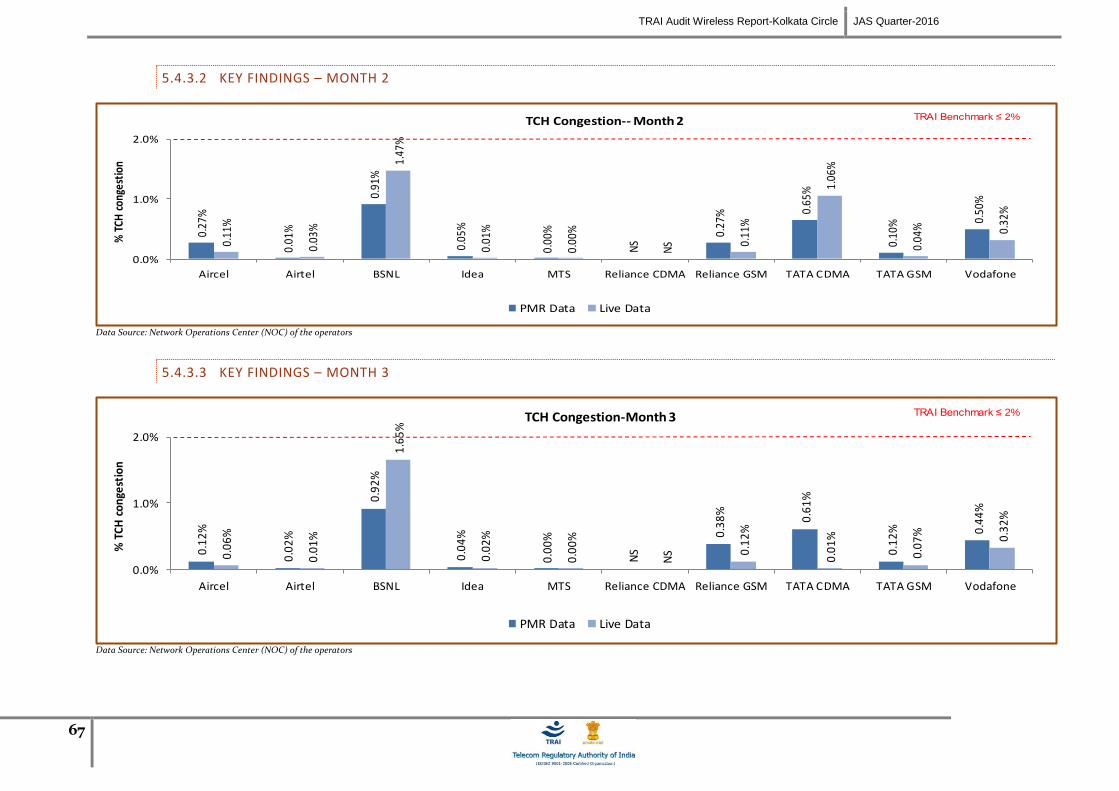
TRAI Audit Wireless Report-Kolkata Circle JAS Quarter-2016
67
5.4.3.2 KEY FINDINGS – MONTH 2
0.27
%
0.01
%
0.91
%
0.05
%
0.00
%
NS
0.27
% 0.65
%
0.10
% 0.50
%
0.11
%
0.03
%
1.47
%
0.01
%
0.00
%
NS 0.
11%
1.06
%
0.04
% 0.32
%
0.0%
1.0%
2.0%
Aircel Airtel BSNL Idea MTS Reliance CDMA Reliance GSM TATA CDMA TATA GSM Vodafone
% T
CH c
onge
stio
n TCH Congestion-- Month 2
PMR Data Live Data
TRAI Benchmark ≤ 2%
Data Source: Network Operations Center (NOC) of the operators
5.4.3.3 KEY FINDINGS – MONTH 3
0.1
2%
0.0
2%
0.9
2%
0.0
4%
0.0
0%
NS
0.3
8%
0.6
1%
0.1
2% 0.4
4%
0.0
6%
0.0
1%
1.6
5%
0.0
2%
0.0
0%
NS 0
.12
%
0.0
1%
0.0
7% 0.3
2%
0.0%
1.0%
2.0%
Aircel Airtel BSNL Idea MTS Reliance CDMA Reliance GSM TATA CDMA TATA GSM Vodafone
% T
CH
co
nge
stio
n
TCH Congestion-Month 3
PMR Data Live Data
TRAI Benchmark ≤ 2%
Data Source: Network Operations Center (NOC) of the operators
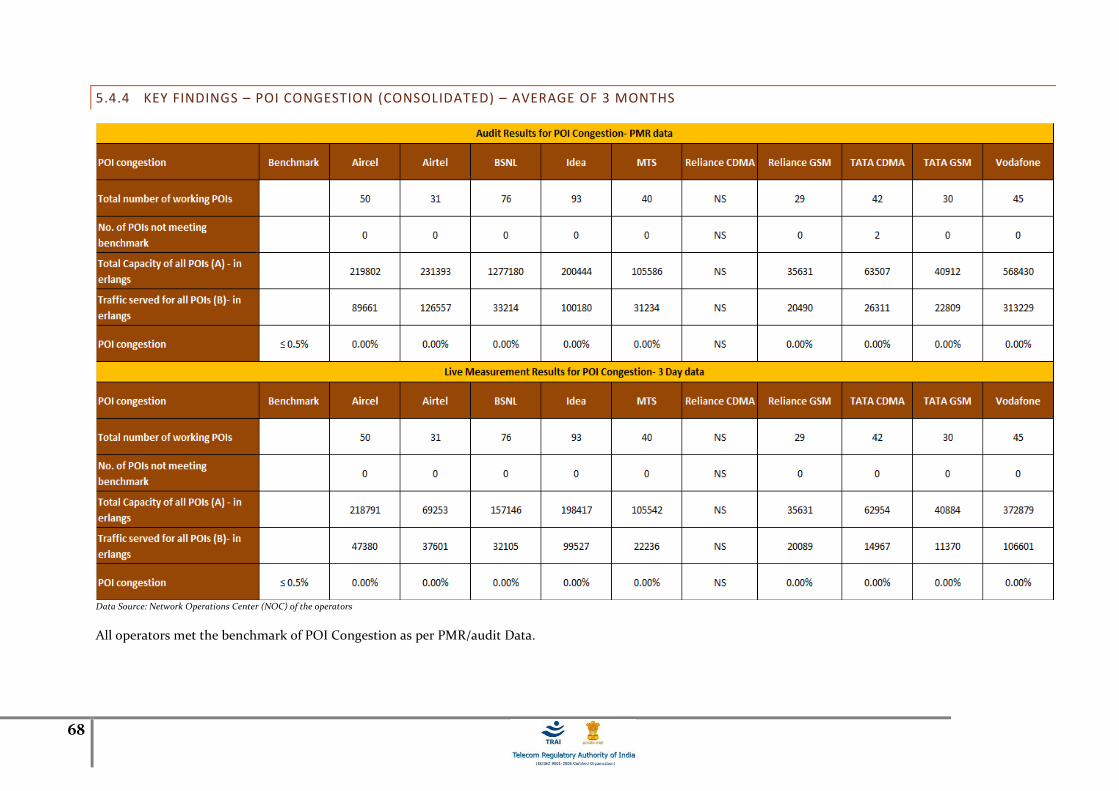
68
5.4.4 KEY FINDINGS – POI CONGESTION (CONSOLIDATED) – AVERAGE OF 3 MONTHS
Data Source: Network Operations Center (NOC) of the operators
All operators met the benchmark of POI Congestion as per PMR/audit Data.
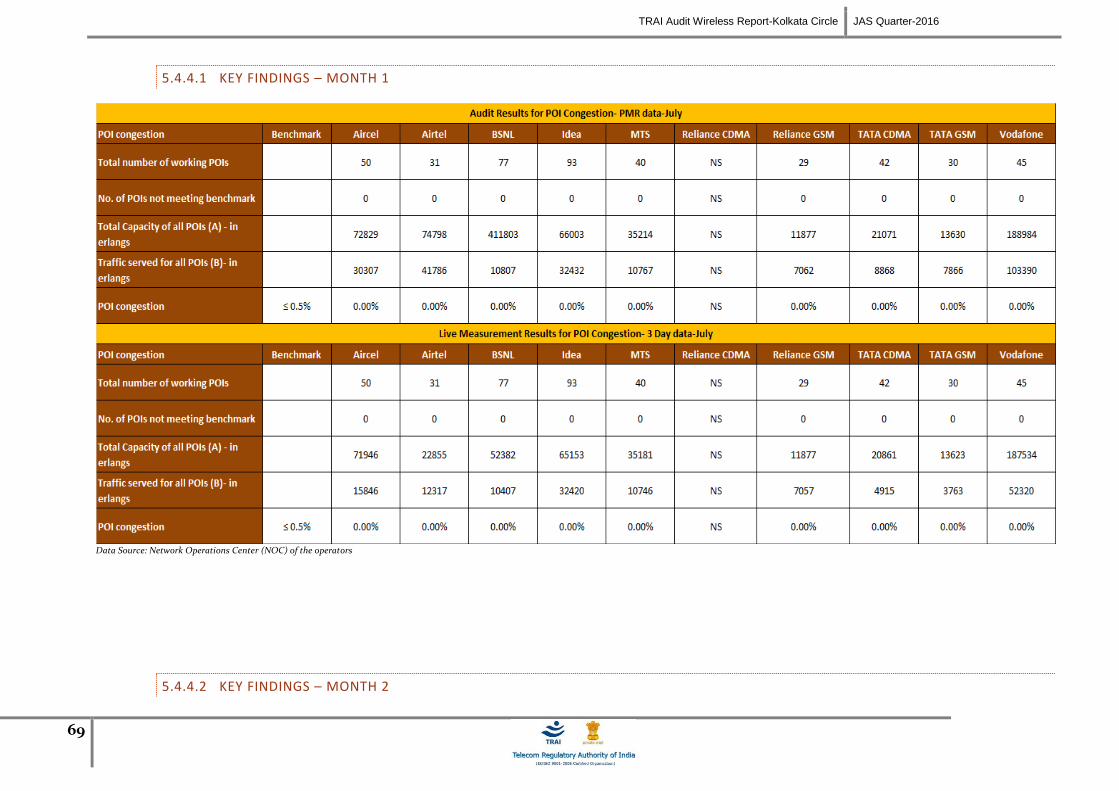
TRAI Audit Wireless Report-Kolkata Circle JAS Quarter-2016
69
5.4.4.1 KEY FINDINGS – MONTH 1
Data Source: Network Operations Center (NOC) of the operators
5.4.4.2 KEY FINDINGS – MONTH 2
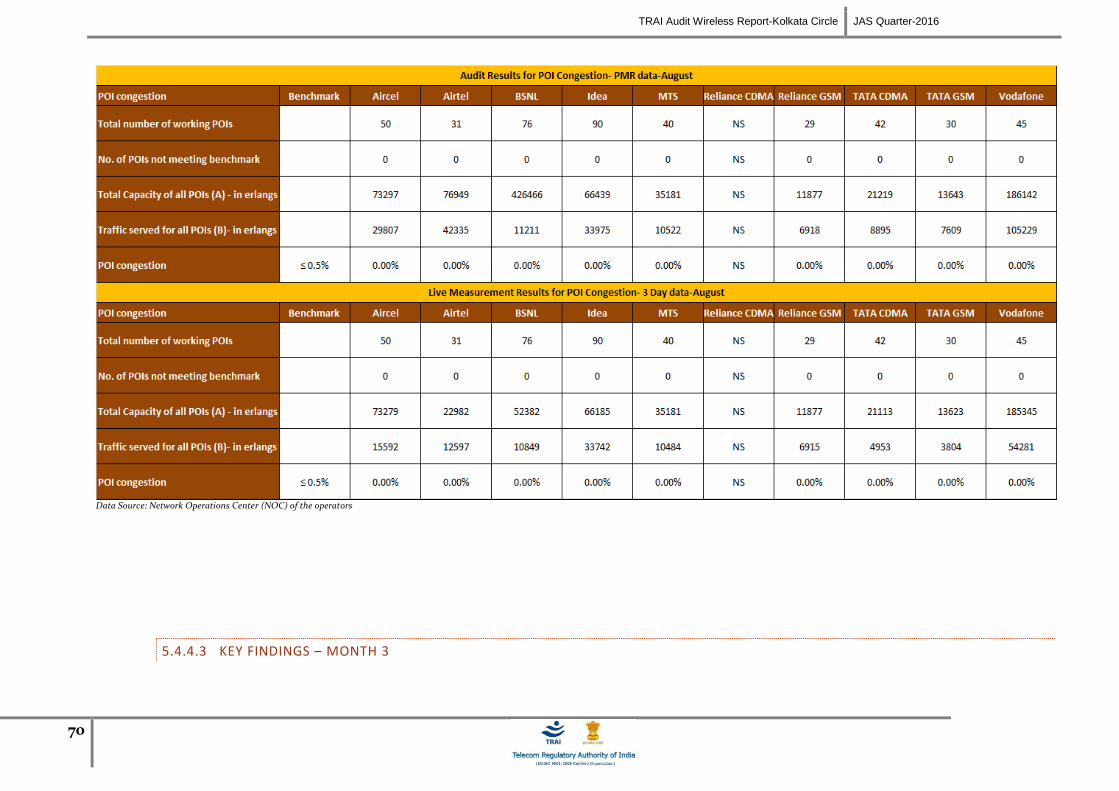
TRAI Audit Wireless Report-Kolkata Circle JAS Quarter-2016
70
Data Source: Network Operations Center (NOC) of the operators
5.4.4.3 KEY FINDINGS – MONTH 3

TRAI Audit Wireless Report-Kolkata Circle JAS Quarter-2016
71
Data Source: Network Operations Center (NOC) of the operators
72
5.5 CALL DROP RATE
5.5.1 PARAMETER DESCRIPTION
1. Definition - The dropped call rate is the ratio of successfully originated calls that were found to drop to the total number of successfully originated calls that
were correctly released.
Total calls dropped = All calls ceasing unnaturally i.e. due to handover or due to radio loss
Total calls established = All calls that have TCH allocation during busy hour
2. Computational Methodology: (Total Calls Dropped / Total Calls Established) x 100
3. TRAI Benchmark –
Call drop rate ≤ 2%
4. Audit Procedure –
Audit of traffic data of the relevant quarter kept in OMC-R at MSCs and used for arriving at CDR was used
The operator should only be considering those calls which are dropped during Time consistent busy hour (TCBH) for all days of the relevant quarter.
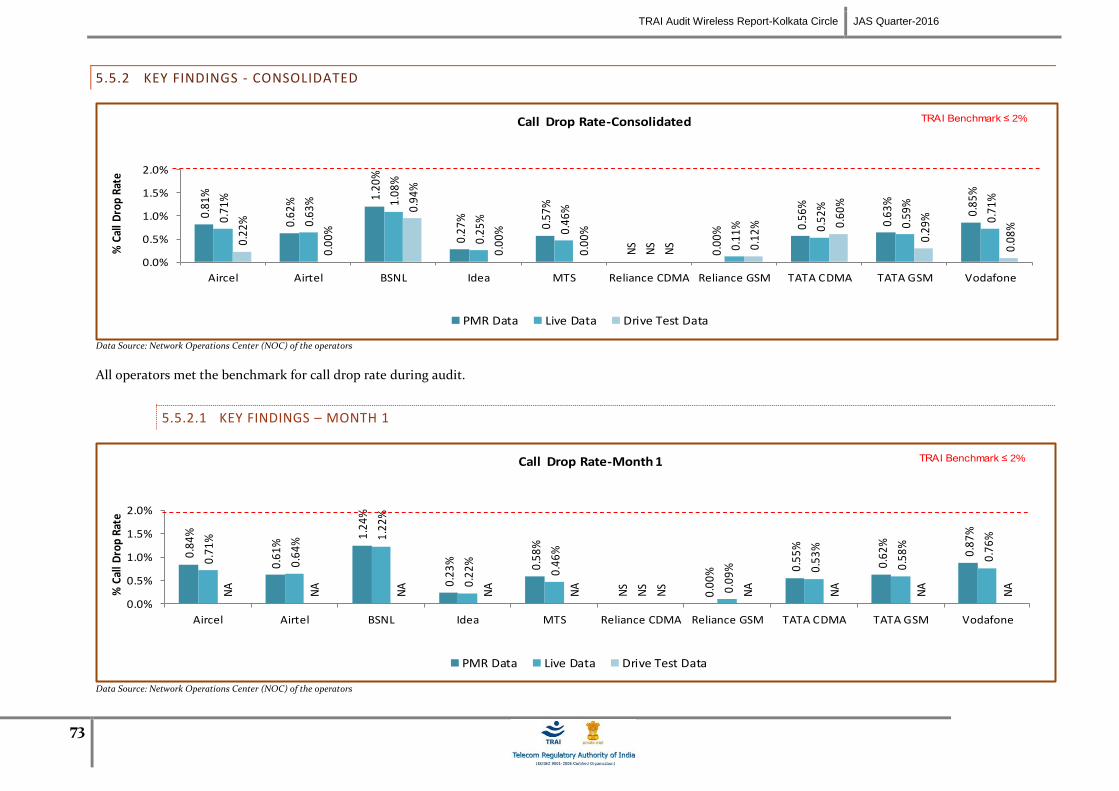
TRAI Audit Wireless Report-Kolkata Circle JAS Quarter-2016
73
5.5.2 KEY FINDINGS - CONSOLIDATED
0.81
%
0.62
% 1.20
%
0.27
%
0.57
%
NS
0.00
% 0.56
%
0.63
%
0.85
%
0.71
%
0.63
% 1.08
%
0.25
%
0.46
%
NS 0.
11% 0.
52%
0.59
%
0.71
%
0.22
%
0.00
%
0.94
%
0.00
%
0.00
%
NS 0.
12% 0.
60%
0.29
%
0.08
%
0.0%
0.5%
1.0%
1.5%
2.0%
Aircel Airtel BSNL Idea MTS Reliance CDMA Reliance GSM TATA CDMA TATA GSM Vodafone
% C
all D
rop
Rate
Call Drop Rate-Consolidated
PMR Data Live Data Drive Test Data
TRAI Benchmark ≤ 2%
Data Source: Network Operations Center (NOC) of the operators
All operators met the benchmark for call drop rate during audit.
5.5.2.1 KEY FINDINGS – MONTH 1
0.84
%
0.61
%
1.24
%
0.23
% 0.58
%
NS
0.00
% 0.55
%
0.62
%
0.87
%
0.71
%
0.64
% 1.22
%
0.22
%
0.46
%
NS 0.
09% 0.
53%
0.58
%
0.76
%
NA
NA
NA
NA
NA
NS
NA
NA
NA
NA
0.0%
0.5%
1.0%
1.5%
2.0%
Aircel Airtel BSNL Idea MTS Reliance CDMA Reliance GSM TATA CDMA TATA GSM Vodafone
% C
all
Dro
p Ra
te
Call Drop Rate-Month 1
PMR Data Live Data Drive Test Data
TRAI Benchmark ≤ 2%
Data Source: Network Operations Center (NOC) of the operators
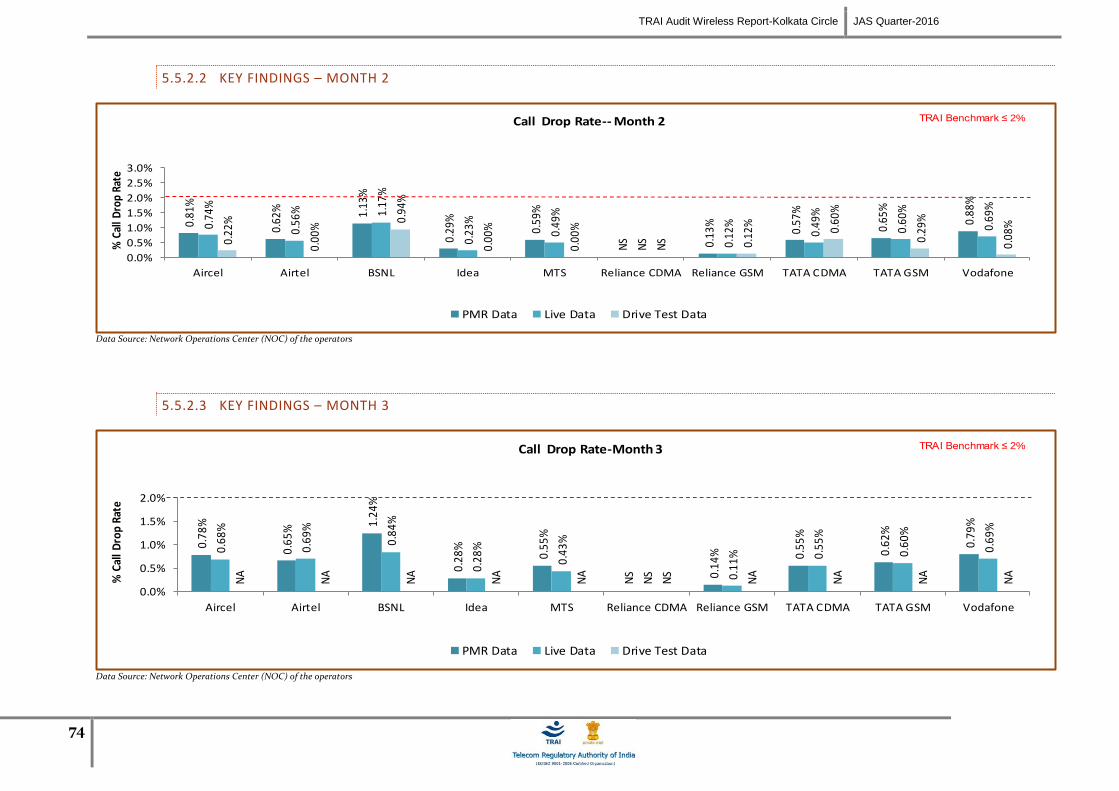
TRAI Audit Wireless Report-Kolkata Circle JAS Quarter-2016
74
5.5.2.2 KEY FINDINGS – MONTH 2
0.81
%
0.62
% 1.13
%
0.29
%
0.59
%
NS 0.13
%
0.57
%
0.65
%
0.88
%
0.74
%
0.56
% 1.17
%
0.23
%
0.49
%
NS 0.12
%
0.49
%
0.60
%
0.69
%
0.22
%
0.00
%
0.94
%
0.00
%
0.00
%
NS 0.12
%
0.60
%
0.29
%
0.08
%
0.0%
0.5%
1.0%
1.5%
2.0%
2.5%
3.0%
Aircel Airtel BSNL Idea MTS Reliance CDMA Reliance GSM TATA CDMA TATA GSM Vodafone
% C
all D
rop
Rate
Call Drop Rate-- Month 2
PMR Data Live Data Drive Test Data
TRAI Benchmark ≤ 2%
Data Source: Network Operations Center (NOC) of the operators
5.5.2.3 KEY FINDINGS – MONTH 3
0.78
%
0.65
% 1.24
%
0.28
%
0.55
%
NS 0.
14% 0.
55%
0.62
%
0.79
%
0.68
%
0.69
%
0.84
%
0.28
%
0.43
%
NS 0.
11% 0.
55%
0.60
%
0.69
%
NA
NA
NA
NA
NA
NS
NA
NA
NA
NA
0.0%
0.5%
1.0%
1.5%
2.0%
Aircel Airtel BSNL Idea MTS Reliance CDMA Reliance GSM TATA CDMA TATA GSM Vodafone
% C
all
Dro
p Ra
te
Call Drop Rate-Month 3
PMR Data Live Data Drive Test Data
TRAI Benchmark ≤ 2%
Data Source: Network Operations Center (NOC) of the operators

TRAI Audit Wireless Report-Kolkata Circle JAS Quarter-2016
75
5.6 CELLS HAVING GREATER THAN 3% TCH DROP
5.6.1 PARAMETER DESCRIPTION
1. Definition- Worst Affected Cells having more than 3% TCH drop shall measure the ratio of total number of cells in the network to the ratio of cells
having more than 3% TCH drop.
2. Computational Methodology: (Total number of cells having more than 3% TCH drop during CBBH/ Total number of cells in the network) x 100
3. TRAI Benchmark –
Worst affected cells having more than 3% TCH drop rate ≤ 3%
4. Audit Procedure –
Audit of traffic data of the relevant quarter kept in OMC-R at MSCs and used for arriving at CDR would be conducted.
The operator should only be considering those calls which are dropped during Cell Bouncing Busy hour (CBBH) for all days of the relevant quarter.
5.6.2 KEY FINDINGS - CONSOLIDATED
2.96
%
2.43
%
2.21
%
0.15
% 2.38
%
NS 0.
45%
3.79
%
2.42
%
2.87
%
3.69
%
2.43
%
2.69
%
0.03
%
0.09
%
NS
0.15
%
9.97
%
2.59
%
2.86
%
0.0%
2.0%
4.0%
6.0%
8.0%
10.0%
12.0%
Aircel Airtel BSNL Idea MTS Reliance CDMA Reliance GSM TATA CDMA TATA GSM Vodafone
%ag
e ca
lls d
ropp
ed
Cells having >3% TCH Drop -Consolidated
PMR Data Live Data
TRAI Benchmark ≤ 3%
Data Source: Network Operations Center (NOC) of the operators
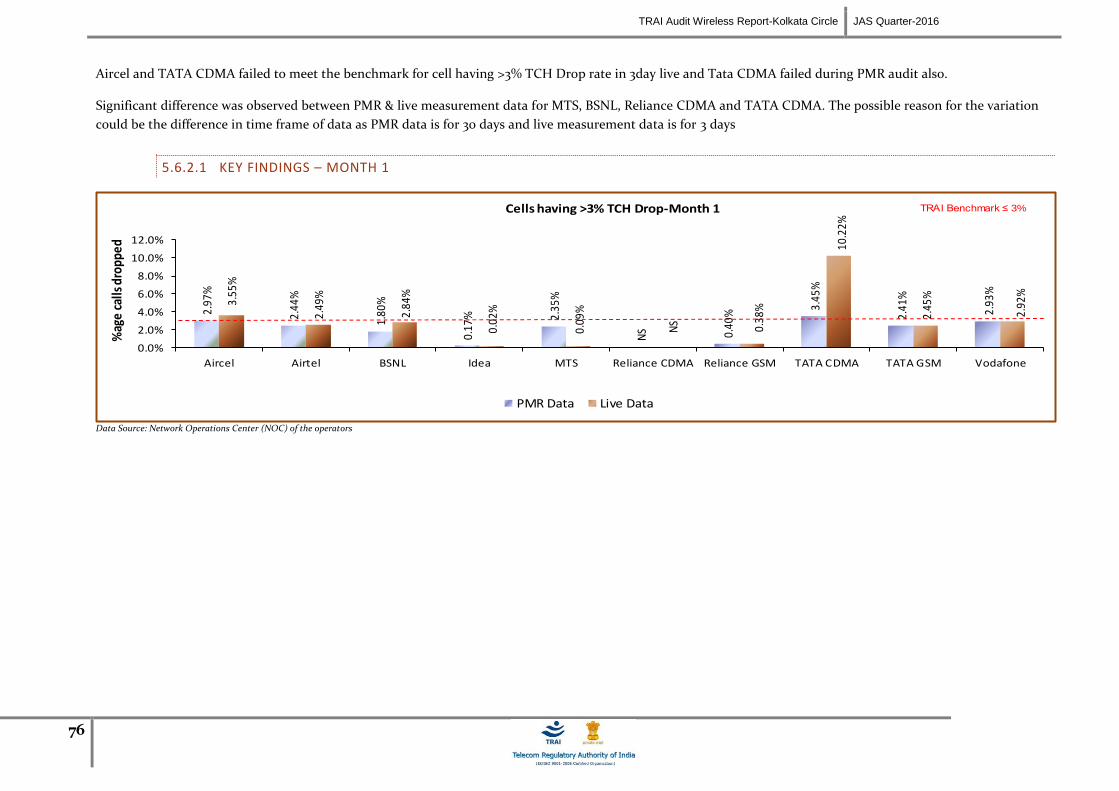
TRAI Audit Wireless Report-Kolkata Circle JAS Quarter-2016
76
Aircel and TATA CDMA failed to meet the benchmark for cell having >3% TCH Drop rate in 3day live and Tata CDMA failed during PMR audit also.
Significant difference was observed between PMR & live measurement data for MTS, BSNL, Reliance CDMA and TATA CDMA. The possible reason for the variation
could be the difference in time frame of data as PMR data is for 30 days and live measurement data is for 3 days
5.6.2.1 KEY FINDINGS – MONTH 1
2.97
%
2.44
%
1.80
%
0.17
% 2.35
%
NS 0.40
%
3.45
%
2.41
%
2.93
%
3.55
%
2.49
%
2.84
%
0.02
%
0.09
%
NS 0.38
%
10.2
2%
2.45
%
2.92
%
0.0%
2.0%
4.0%
6.0%
8.0%
10.0%
12.0%
Aircel Airtel BSNL Idea MTS Reliance CDMA Reliance GSM TATA CDMA TATA GSM Vodafone
%ag
e ca
lls d
ropp
ed
Cells having >3% TCH Drop-Month 1
PMR Data Live Data
TRAI Benchmark ≤ 3%
Data Source: Network Operations Center (NOC) of the operators
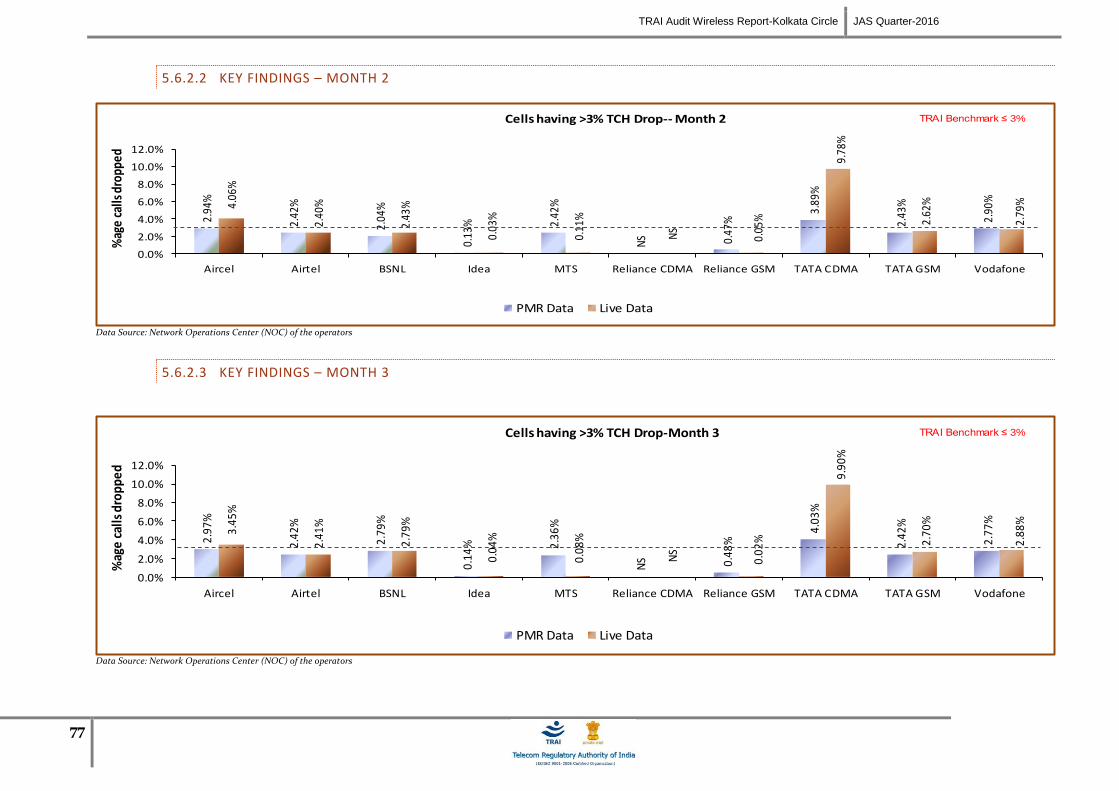
TRAI Audit Wireless Report-Kolkata Circle JAS Quarter-2016
77
5.6.2.2 KEY FINDINGS – MONTH 2
2.94
%
2.42
%
2.04
%
0.13
% 2.42
%
NS 0.
47%
3.89
%
2.43
%
2.90
%4.06
%
2.40
%
2.43
%
0.03
%
0.11
%
NS
0.05
%
9.78
%
2.62
%
2.79
%
0.0%
2.0%
4.0%
6.0%
8.0%
10.0%
12.0%
Aircel Airtel BSNL Idea MTS Reliance CDMA Reliance GSM TATA CDMA TATA GSM Vodafone
%ag
e ca
lls d
ropp
edCells having >3% TCH Drop-- Month 2
PMR Data Live Data
TRAI Benchmark ≤ 3%
Data Source: Network Operations Center (NOC) of the operators
5.6.2.3 KEY FINDINGS – MONTH 3
2.97
%
2.42
%
2.79
%
0.14
% 2.36
%
NS 0.
48%
4.03
%
2.42
%
2.77
%
3.45
%
2.41
%
2.79
%
0.04
%
0.08
%
NS
0.02
%
9.90
%
2.70
%
2.88
%
0.0%
2.0%
4.0%
6.0%
8.0%
10.0%
12.0%
Aircel Airtel BSNL Idea MTS Reliance CDMA Reliance GSM TATA CDMA TATA GSM Vodafone
%ag
e ca
lls d
ropp
ed
Cells having >3% TCH Drop-Month 3
PMR Data Live Data
TRAI Benchmark ≤ 3%
Data Source: Network Operations Center (NOC) of the operators
TRAI Audit Wireless Report-Kolkata Circle JAS Quarter-2016
78
5.7 VOICE QUALITY
5.7.1 PARAMETER DESCRIPTION
1. Definition:
for GSM service providers the calls having a value of 0 –5 are considered to be of good quality (on a seven point scale)
For CDMA the measure of voice quality is Frame Error Rate (FER). FER is the probability that a transmitted frame will be received incorrectly. Good
voice quality of a call is considered when it FER value lies between 0 – 4 %
2. Computational Methodology:
% Connections with good voice quality = (No. of voice samples with good voice quality / Total number of samples) x 100
3. TRAI Benchmark: ≥ 95%
4. Audit Procedure –
a. A sample of calls would be taken randomly from the total calls established.
b. The operator should only be considering those calls which are meeting the desired benchmark of good voice quality.

TRAI Audit Wireless Report-Kolkata Circle JAS Quarter-2016
79
5.7.2 KEY FINDINGS
97.4
5%
98.2
8%
99.8
2%
97.0
3%
99.9
0%
NS
98.9
0%
99.1
6%
98.3
1%
97.8
3%
97.3
0%
98.2
1%
98.8
3%
97.2
0%
99.3
1%
NS
99.0
4%
99.1
5%
98.6
0%
98.0
6%
91.9
7%
97.7
8%
96.2
7%
96.1
1%
96.8
6%
NS
85.6
7%
96.7
9%
96.8
8%
99.4
9%
0%
20%
40%
60%
80%
100%
Aircel Airtel BSNL Idea MTS Reliance CDMA Reliance GSM TATA CDMA TATA GSM Vodafone
%a
voi
ce q
ualit
yVoice Quality-Consolidated
PMR Data Live Data Drive Test Data
TRAI Benchmark ≥ 95%
Data Source: Network Operations Center (NOC) of the operators
All operators met the benchmark for Voice quality as per PMR audit. During drive test Aircel, Reliance GSM failed to meet the TRAI benchmark for voice quality.
5.7.2.1 KEY FINDINGS – MONTH 1
97.4
0%
97.8
2%
99.8
2%
96.5
3%
99.8
7%
NS
98.9
2%
99.2
0%
98.2
8%
97.8
5%
97.1
6%
97.8
4%
98.8
3%
96.7
3%
99.0
5%
NS
99.0
7%
99.2
5%
98.6
0%
98.1
3%
NA
NA
NA
NA
NA
NS
NA
NA
NA
NA
0%
20%
40%
60%
80%
100%
Aircel Airtel BSNL Idea MTS Reliance CDMA Reliance GSM TATA CDMA TATA GSM Vodafone
%a
voi
ce q
ualit
y
Voice Quality-Month 1
PMR Data Live Data Drive Test Data
TRAI Benchmark ≥ 95%
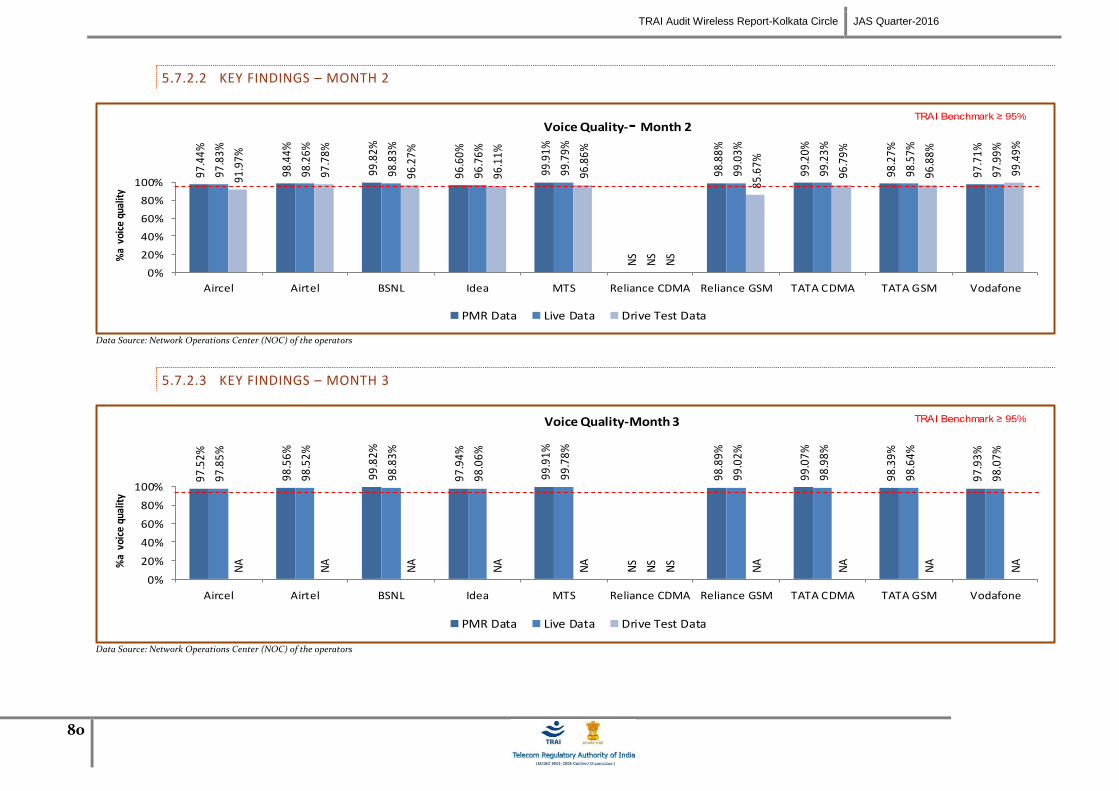
TRAI Audit Wireless Report-Kolkata Circle JAS Quarter-2016
80
5.7.2.2 KEY FINDINGS – MONTH 2
97.4
4%
98.4
4%
99.8
2%
96.6
0%
99.9
1%
NS
98.8
8%
99.2
0%
98.2
7%
97.7
1%
97.8
3%
98.2
6%
98.8
3%
96.7
6%
99.7
9%
NS
99.0
3%
99.2
3%
98.5
7%
97.9
9%
91.9
7%
97.7
8%
96.2
7%
96.1
1%
96.8
6%
NS
85.6
7%
96.7
9%
96.8
8%
99.4
9%
0%
20%
40%
60%
80%
100%
Aircel Airtel BSNL Idea MTS Reliance CDMA Reliance GSM TATA CDMA TATA GSM Vodafone
%a
voi
ce q
ualit
yVoice Quality-- Month 2
PMR Data Live Data Drive Test Data
TRAI Benchmark ≥ 95%
Data Source: Network Operations Center (NOC) of the operators
5.7.2.3 KEY FINDINGS – MONTH 3
97.5
2%
98.5
6%
99.8
2%
97.9
4%
99.9
1%
NS
98.8
9%
99.0
7%
98.3
9%
97.9
3%
97.8
5%
98.5
2%
98.8
3%
98.0
6%
99.7
8%
NS
99.0
2%
98.9
8%
98.6
4%
98.0
7%
NA
NA
NA
NA
NA
NS
NA
NA
NA
NA
0%
20%
40%
60%
80%
100%
Aircel Airtel BSNL Idea MTS Reliance CDMA Reliance GSM TATA CDMA TATA GSM Vodafone
%a
voi
ce q
ualit
y
Voice Quality-Month 3
PMR Data Live Data Drive Test Data
TRAI Benchmark ≥ 95%
Data Source: Network Operations Center (NOC) of the operators

TRAI Audit Wireless Report-Kolkata Circle JAS Quarter-2016
81
6 PARAMETER DESCRIPTION & DETAILED FINDINGS - COMPARISON BETWEEN PMR DATA, 3 DAY LIVE DATA AND LIVE CALLING
DATA FOR 3G
6.1 NODE BS DOWNTIME
6.1.1 PARAMETER DESCRIPTION
The parameter of network availability would be measured from following sub-parameters
1. Node Bs downtime (not available for service)
2. Worst affected Node Bs due to downtime
Definition - Node Bs downtime (not available for service): In the case of 3G networks, instead of BTS the nomenclature is Node B. The
measurement methodology for the parameter Node B Accumulated downtime (not available for service) will be similar to the existing
parameter for BTSs Accumulated downtime (not available for service).
Data Extraction/collection methodology - Data extraction to be done from appropriate counters. Auditors should be aware of counter
details and definitions for each operator.
Source of Data: Network Operation Center (NOC) or a Central Server
Computation Methodology –
Node Bs downtime (not available for service) = Sum of downtime of Node Bs in a month in hours i.e. total outage time of all Node
Bs in hours during a month / (24 x Number of days in a month x Number of Node Bs in the network in licensed service area) x 100
3. TRAI Benchmark –
a. Node Bs downtime (not available for service) ≤ 2%
4. Audit Procedure –
The fault alarm details at the OMC (MSC) for the network outages (due to own network elements and infrastructure service provider end outages)
was audited
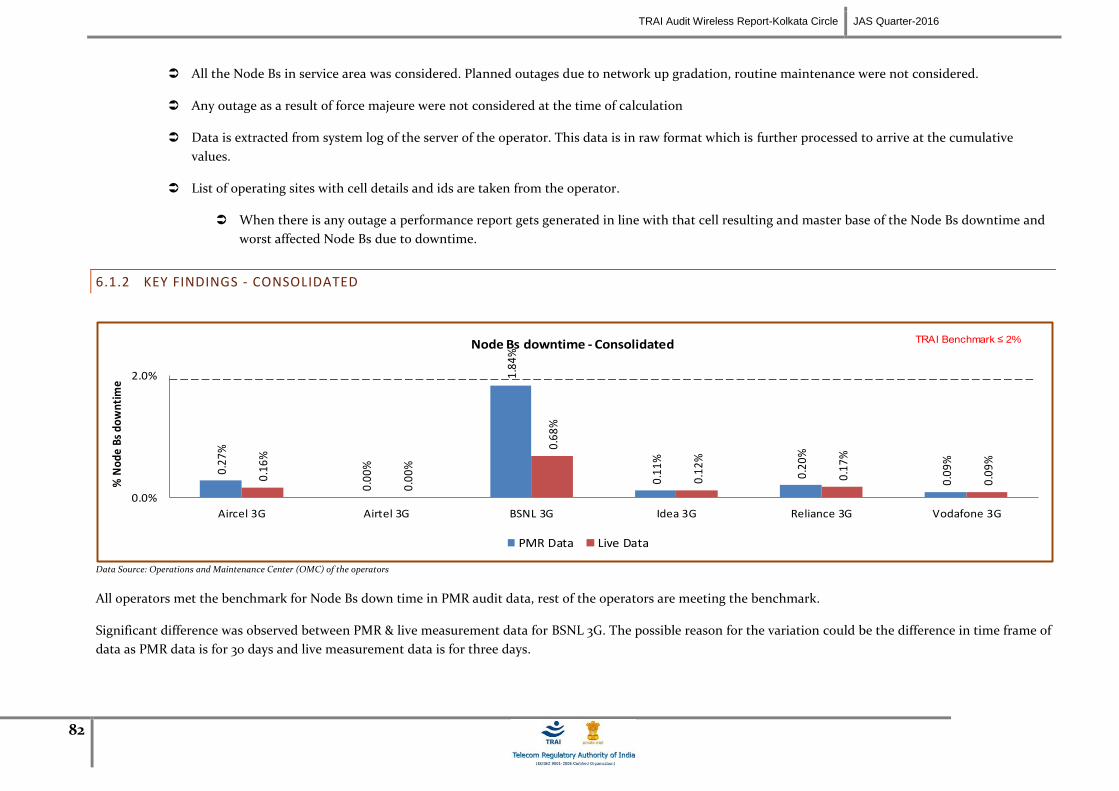
TRAI Audit Wireless Report-Kolkata Circle JAS Quarter-2016
82
All the Node Bs in service area was considered. Planned outages due to network up gradation, routine maintenance were not considered.
Any outage as a result of force majeure were not considered at the time of calculation
Data is extracted from system log of the server of the operator. This data is in raw format which is further processed to arrive at the cumulative
values.
List of operating sites with cell details and ids are taken from the operator.
When there is any outage a performance report gets generated in line with that cell resulting and master base of the Node Bs downtime and
worst affected Node Bs due to downtime.
6.1.2 KEY FINDINGS - CONSOLIDATED
0.27
%
0.0
0%
1.84
%
0.1
1%
0.20
%
0.0
9%
0.16
%
0.0
0%
0.68
%
0.1
2%
0.1
7%
0.0
9%
0.0%
2.0%
Aircel 3G Airtel 3G BSNL 3G Idea 3G Reliance 3G Vodafone 3G
% N
od
e B
s do
wnt
ime
Node Bs downtime - Consolidated
PMR Data Live Data
TRAI Benchmark ≤ 2%
Data Source: Operations and Maintenance Center (OMC) of the operators
All operators met the benchmark for Node Bs down time in PMR audit data, rest of the operators are meeting the benchmark.
Significant difference was observed between PMR & live measurement data for BSNL 3G. The possible reason for the variation could be the difference in time frame of
data as PMR data is for 30 days and live measurement data is for three days.
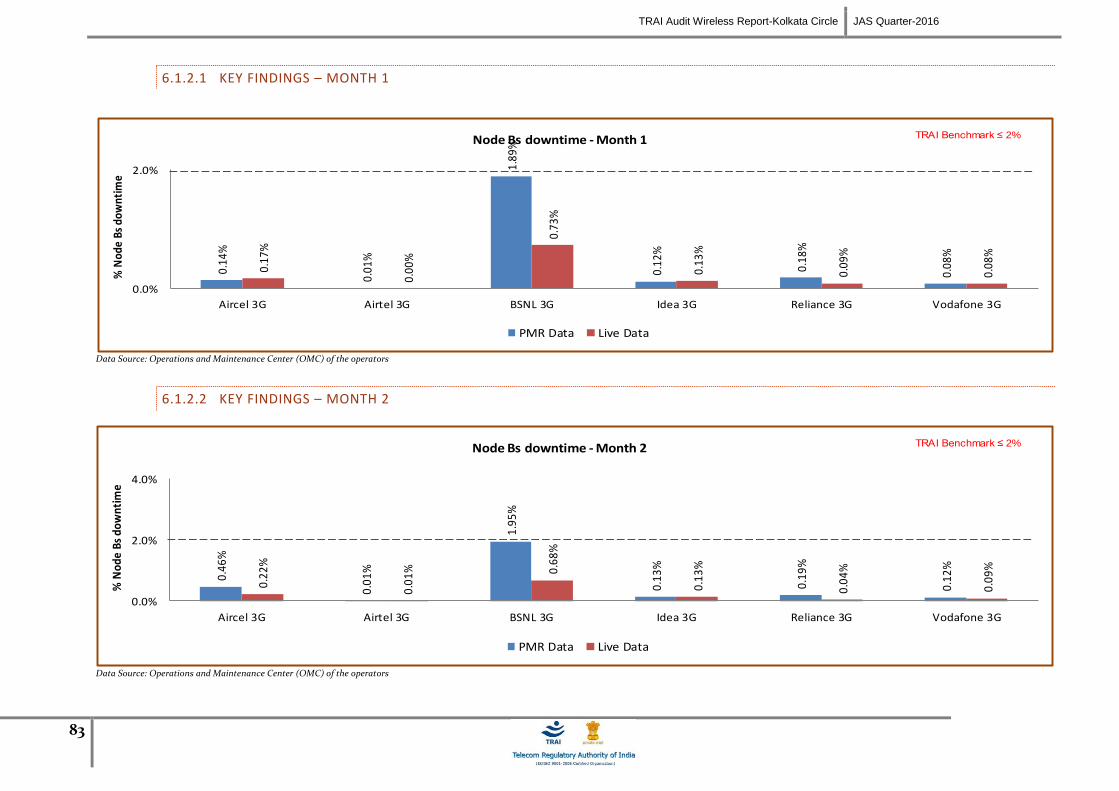
TRAI Audit Wireless Report-Kolkata Circle JAS Quarter-2016
83
6.1.2.1 KEY FINDINGS – MONTH 1
0.14
%
0.01
%
1.89
%
0.12
%
0.18
%
0.08
%
0.17
%
0.00
%
0.73
%
0.13
%
0.09
%
0.08
%
0.0%
2.0%
Aircel 3G Airtel 3G BSNL 3G Idea 3G Reliance 3G Vodafone 3G
% N
ode
Bs d
ownt
ime
Node Bs downtime - Month 1
PMR Data Live Data
TRAI Benchmark ≤ 2%
Data Source: Operations and Maintenance Center (OMC) of the operators
6.1.2.2 KEY FINDINGS – MONTH 2
0.46
%
0.0
1%
1.9
5%
0.13
%
0.19
%
0.12
%
0.2
2%
0.0
1% 0.6
8%
0.13
%
0.0
4%
0.0
9%
0.0%
2.0%
4.0%
Aircel 3G Airtel 3G BSNL 3G Idea 3G Reliance 3G Vodafone 3G
% N
od
e B
s do
wnt
ime
Node Bs downtime - Month 2
PMR Data Live Data
TRAI Benchmark ≤ 2%
Data Source: Operations and Maintenance Center (OMC) of the operators

TRAI Audit Wireless Report-Kolkata Circle JAS Quarter-2016
84
6.1.2.3 KEY FINDINGS – MONTH 3
0.2
2%
0.0
0%
1.7
3%
0.1
0%
0.2
4%
0.0
6%
0.0
9%
0.0
0%
0.6
4%
0.1
0% 0.3
7%
0.1
0%
0.0%
2.0%
Aircel 3G Airtel 3G BSNL 3G Idea 3G Reliance 3G Vodafone 3G
% N
od
e B
s d
ow
nti
me
Node Bs downtime - Month 3
PMR Data Live Data
TRAI Benchmark ≤ 2%
Data Source: Operations and Maintenance Center (OMC) of the operators
TRAI Audit Wireless Report-Kolkata Circle JAS Quarter-2016
85
6.2 WORST AFFECTED NODE BS DUE TO DOWNTIME
6.2.1 PARAMETER DESCRIPTION
Definition – Worst Affected Node Bs due to downtime shall basically measure percentage of Node Bs having downtime greater than 24 hours in a month.
Planned outages were not considered as part while computing.
For measuring the parameter “Percentage of worst affected Node Bs due to downtime" the downtime of each Node B lasting for more than 1 hour at a time in
a day during the period of a month was considered.
Computation Methodology –
Worst affected Node Bs due to downtime = (Number of Node Bs having accumulated downtime greater than 24 hours in a month / Number of
Node Bs in Licensed Service Area) * 100
TRAI Benchmark –
b. Worst affected Node Bss due to downtime ≤ 2%
Audit Procedure –
i. The fault alarm details at the OMC (MSC) for the network outages (due to own network elements and infrastructure service provider end
outages) was audited
ii. All the Node Bs in service area were considered. Planned outages due to network up gradation, routine maintenance were not considered.
iii. Data is extracted from system log of the server of the operator. This data is in raw format which is further processed to arrive at the
cumulative values.
iv. Any outage as a result of force majeure was not considered at the time of calculation.
v. List of operating sites with cell details and ids are taken from the operator.
vi. All the Node Bs having down time greater than 24 hours is assessed and values of Node Bs accumulated downtime is computed in
accordance.
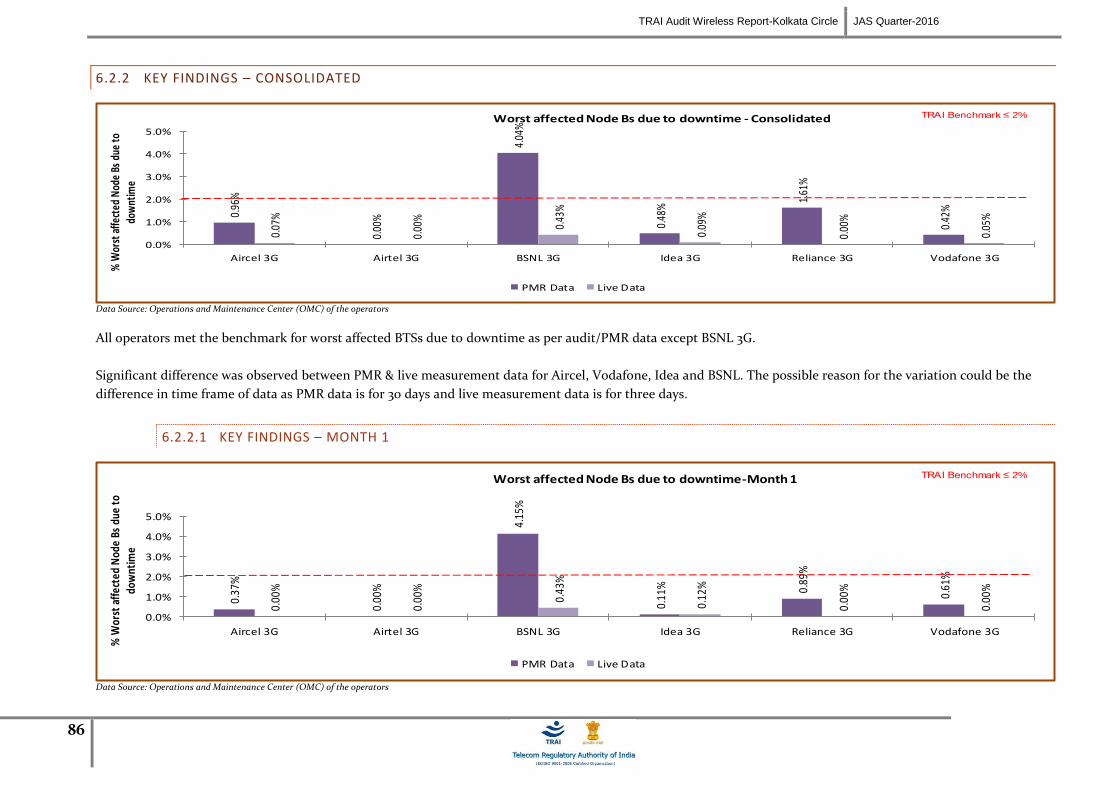
TRAI Audit Wireless Report-Kolkata Circle JAS Quarter-2016
86
6.2.2 KEY FINDINGS – CONSOLIDATED
0.96
%
0.00
%
4.04
%
0.48
%
1.61
%
0.42
%
0.07
%
0.00
%
0.43
%
0.09
%
0.00
%
0.05
%
0.0%
1.0%
2.0%
3.0%
4.0%
5.0%
Aircel 3G Airtel 3G BSNL 3G Idea 3G Reliance 3G Vodafone 3G
% W
orst
affe
cted
Nod
e Bs
due
to
dow
ntim
eWorst affected Node Bs due to downtime - Consolidated
PMR Data Live Data
TRAI Benchmark ≤ 2%
Data Source: Operations and Maintenance Center (OMC) of the operators
All operators met the benchmark for worst affected BTSs due to downtime as per audit/PMR data except BSNL 3G.
Significant difference was observed between PMR & live measurement data for Aircel, Vodafone, Idea and BSNL. The possible reason for the variation could be the
difference in time frame of data as PMR data is for 30 days and live measurement data is for three days.
6.2.2.1 KEY FINDINGS – MONTH 1
0.37
%
0.00
%
4.15
%
0.11
% 0.89
%
0.61
%
0.00
%
0.00
%
0.43
%
0.12
%
0.00
%
0.00
%
0.0%
1.0%
2.0%
3.0%
4.0%
5.0%
Aircel 3G Airtel 3G BSNL 3G Idea 3G Reliance 3G Vodafone 3G
% W
orst
aff
ecte
d N
ode
Bs d
ue t
o do
wnt
ime
Worst affected Node Bs due to downtime-Month 1
PMR Data Live Data
TRAI Benchmark ≤ 2%
Data Source: Operations and Maintenance Center (OMC) of the operators

TRAI Audit Wireless Report-Kolkata Circle JAS Quarter-2016
87
6.2.2.2 KEY FINDINGS – MONTH 2
1.65
%
0.00
%
4.01
%
0.84
%
2.37
%
0.38
%
0.16
%
0.00
%
0.43
%
0.05
%
0.00
%
0.11
%
0.0%
1.0%
2.0%
3.0%
4.0%
5.0%
Aircel 3G Airtel 3G BSNL 3G Idea 3G Reliance 3G Vodafone 3G
% W
orst
aff
ecte
d N
ode
Bs d
ue t
o do
wnt
ime
Worst affected Node Bs due to downtime-Month 2
PMR Data Live Data
TRAI Benchmark ≤ 2%
Data Source: Operations and Maintenance Center (OMC) of the operators
6.2.2.3 KEY FINDINGS – MONTH 3
0.86
%
0.00
%
3.97
%
0.46
% 1.56
%
0.27
%
0.05
%
0.00
%
0.43
%
0.10
%
0.00
%
0.04
%
0.0%
1.0%
2.0%
3.0%
4.0%
5.0%
Aircel 3G Airtel 3G BSNL 3G Idea 3G Reliance 3G Vodafone 3G
% W
orst
aff
ecte
d N
ode
Bs d
ue t
o do
wnt
ime
Worst affected Node Bs due to downtime-Month 3
PMR Data Live Data
TRAI Benchmark ≤ 2%
Data Source: Operations and Maintenance Center (OMC) of the operators
TRAI Audit Wireless Report-Kolkata Circle JAS Quarter-2016
88
6.3 CALL SET UP SUCCESS RATE
6.3.1 PARAMETER DESCRIPTION
1. Definition: This parameter is same for 2G Networks as well as 3G Networks. However, the network elements involved in both the networks are different. Call
Set-up Success Rate is defined as the ratio of Established Calls to Call Attempts. For establishing a call in 3G Networks, User Equipment (UE) accesses the
Universal Terrestrial Radio Access Network (UTRAN) and establishes an RRC connection. Once RRC connection is established the Non Access Stratum (NAS)
messages are exchanged between the UE and the Core Network (CN). The last step of the call setup is the establishment of a Radio Access Bearer (RAB)
between the CN and the UE. However, any RAB abnormal release after RAB Assignment Response or Alerting/Connect message is to be considered as a
dropped call.
2. Data Extraction/collection methodology - Data extraction to be done from appropriate counters. Auditors should be aware of counter details and
definitions for each operator.
3. Source of Data: Network Operation Center (NOC) or a Central Server
4. Computation Methodology-
(RRC Established / Total RRC Attempts) * 100
RRC Established means the following events have happened in RRC setup:-
RRC attempt is made
The RRC established
The RRC is routed to the outward path of the concerned MSC
5. TRAI Benchmark ≥ 95%
6. Audit Procedure –
The cell-wise data generated through counters/ MMC available in the switch for traffic measurements
CSSR calculation should be measured using OMC generated data only
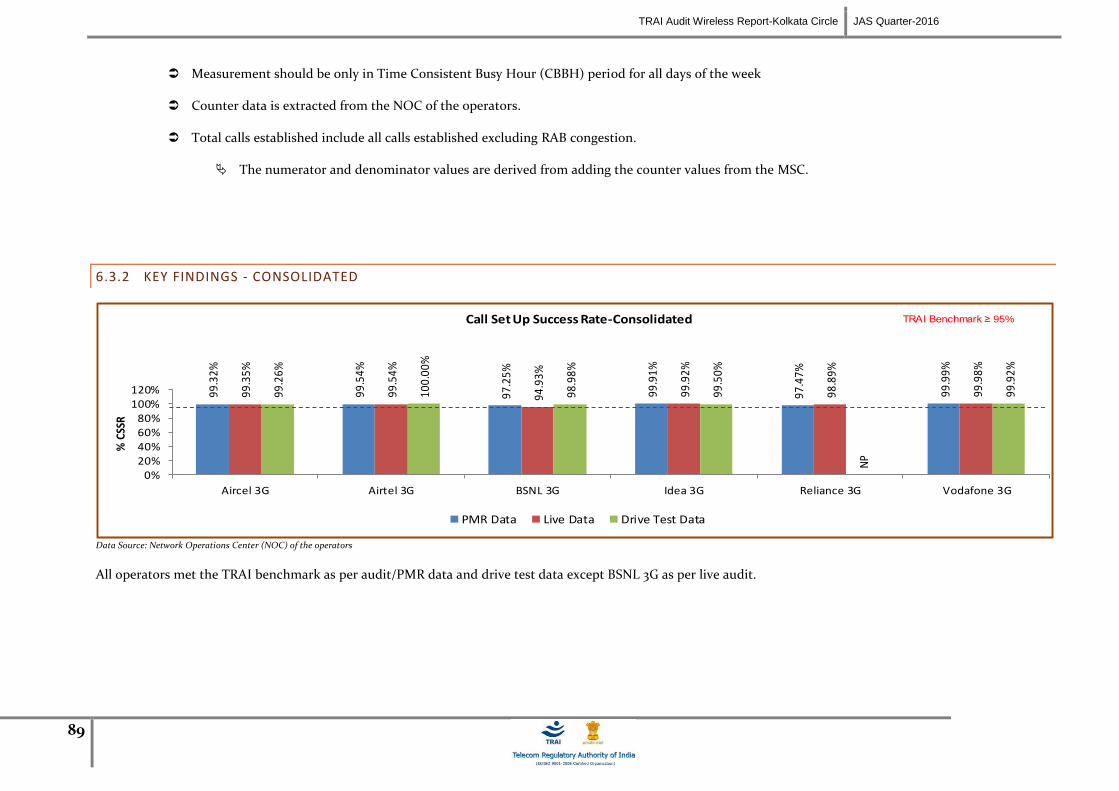
TRAI Audit Wireless Report-Kolkata Circle JAS Quarter-2016
89
Measurement should be only in Time Consistent Busy Hour (CBBH) period for all days of the week
Counter data is extracted from the NOC of the operators.
Total calls established include all calls established excluding RAB congestion.
The numerator and denominator values are derived from adding the counter values from the MSC.
6.3.2 KEY FINDINGS - CONSOLIDATED
99.3
2%
99.5
4%
97.2
5%
99.9
1%
97.4
7%
99.9
9%
99.3
5%
99.5
4%
94.9
3%
99.9
2%
98.8
9%
99.9
8%
99.2
6%
100.
00%
98.9
8%
99.5
0%
NP
99.9
2%
0%20%40%60%80%
100%120%
Aircel 3G Airtel 3G BSNL 3G Idea 3G Reliance 3G Vodafone 3G
% C
SSR
Call Set Up Success Rate-Consolidated
PMR Data Live Data Drive Test Data
TRAI Benchmark ≥ 95%
Data Source: Network Operations Center (NOC) of the operators
All operators met the TRAI benchmark as per audit/PMR data and drive test data except BSNL 3G as per live audit.
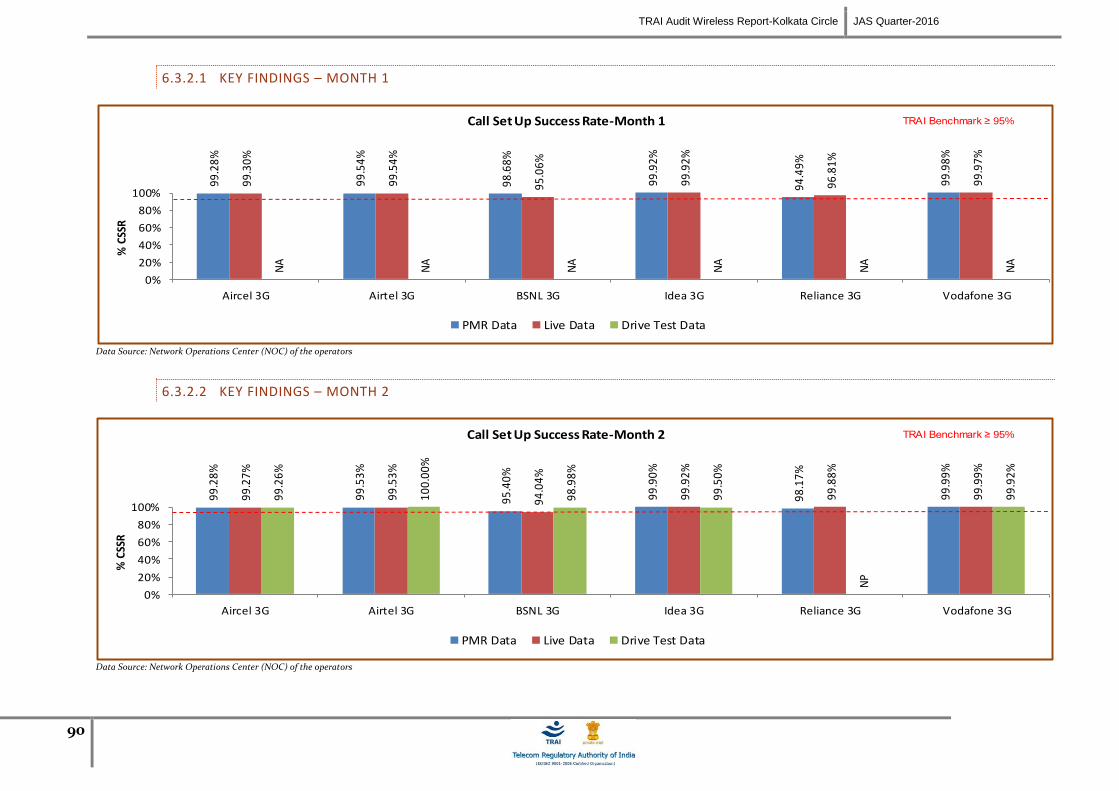
TRAI Audit Wireless Report-Kolkata Circle JAS Quarter-2016
90
6.3.2.1 KEY FINDINGS – MONTH 1
99.2
8%
99
.54
%
98
.68%
99
.92%
94
.49
%
99
.98
%
99
.30%
99
.54
%
95.0
6%
99.9
2%
96.8
1%
99.9
7%
NA
NA
NA
NA
NA
NA
0%
20%
40%
60%
80%
100%
Aircel 3G Airtel 3G BSNL 3G Idea 3G Reliance 3G Vodafone 3G
% C
SSR
Call Set Up Success Rate-Month 1
PMR Data Live Data Drive Test Data
TRAI Benchmark ≥ 95%
Data Source: Network Operations Center (NOC) of the operators
6.3.2.2 KEY FINDINGS – MONTH 2
99
.28
%
99
.53
%
95
.40
%
99
.90
%
98
.17
%
99
.99
%
99
.27
%
99
.53
%
94
.04
%
99
.92
%
99
.88
%
99
.99
%
99
.26
%
10
0.0
0%
98
.98
%
99
.50
%
NP
99
.92
%
0%
20%
40%
60%
80%
100%
Aircel 3G Airtel 3G BSNL 3G Idea 3G Reliance 3G Vodafone 3G
% C
SSR
Call Set Up Success Rate-Month 2
PMR Data Live Data Drive Test Data
TRAI Benchmark ≥ 95%
Data Source: Network Operations Center (NOC) of the operators
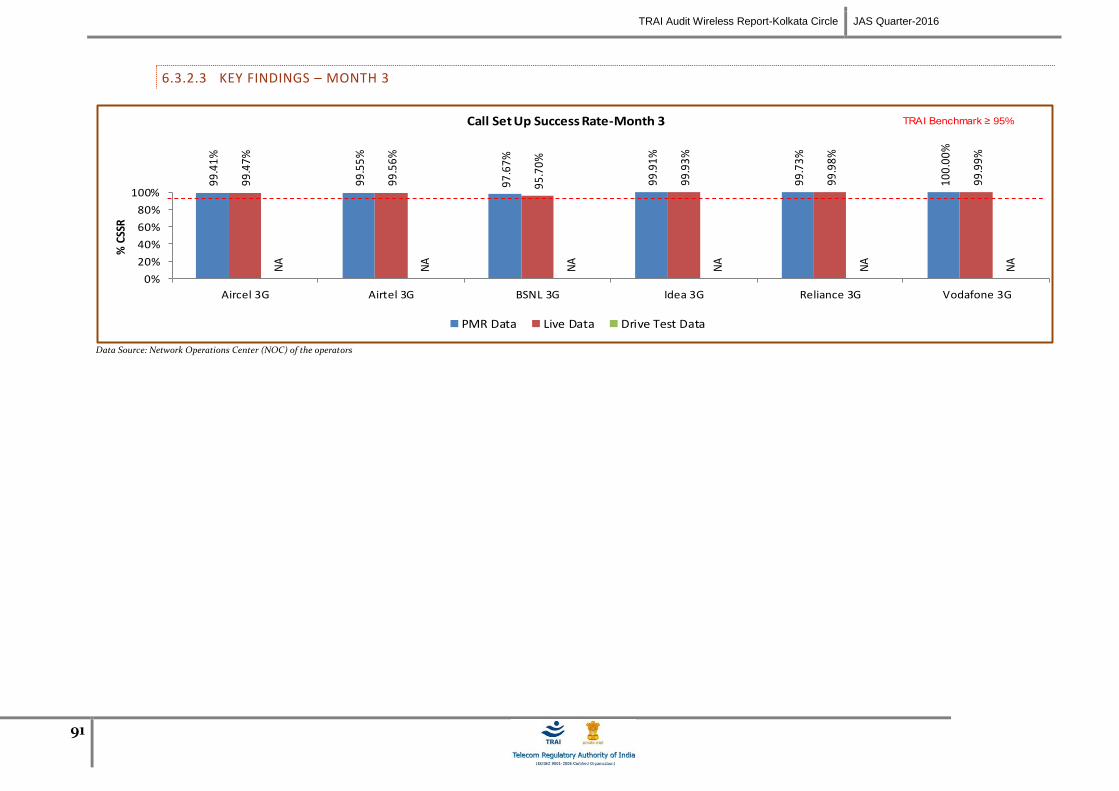
TRAI Audit Wireless Report-Kolkata Circle JAS Quarter-2016
91
6.3.2.3 KEY FINDINGS – MONTH 3
99.4
1%
99.5
5%
97.6
7%
99.9
1%
99.7
3%
100.
00%
99.4
7%
99.5
6%
95.7
0%
99.9
3%
99.9
8%
99.9
9%
NA
NA
NA
NA
NA
NA
0%
20%
40%
60%
80%
100%
Aircel 3G Airtel 3G BSNL 3G Idea 3G Reliance 3G Vodafone 3G
% C
SSR
Call Set Up Success Rate-Month 3
PMR Data Live Data Drive Test Data
TRAI Benchmark ≥ 95%
Data Source: Network Operations Center (NOC) of the operators
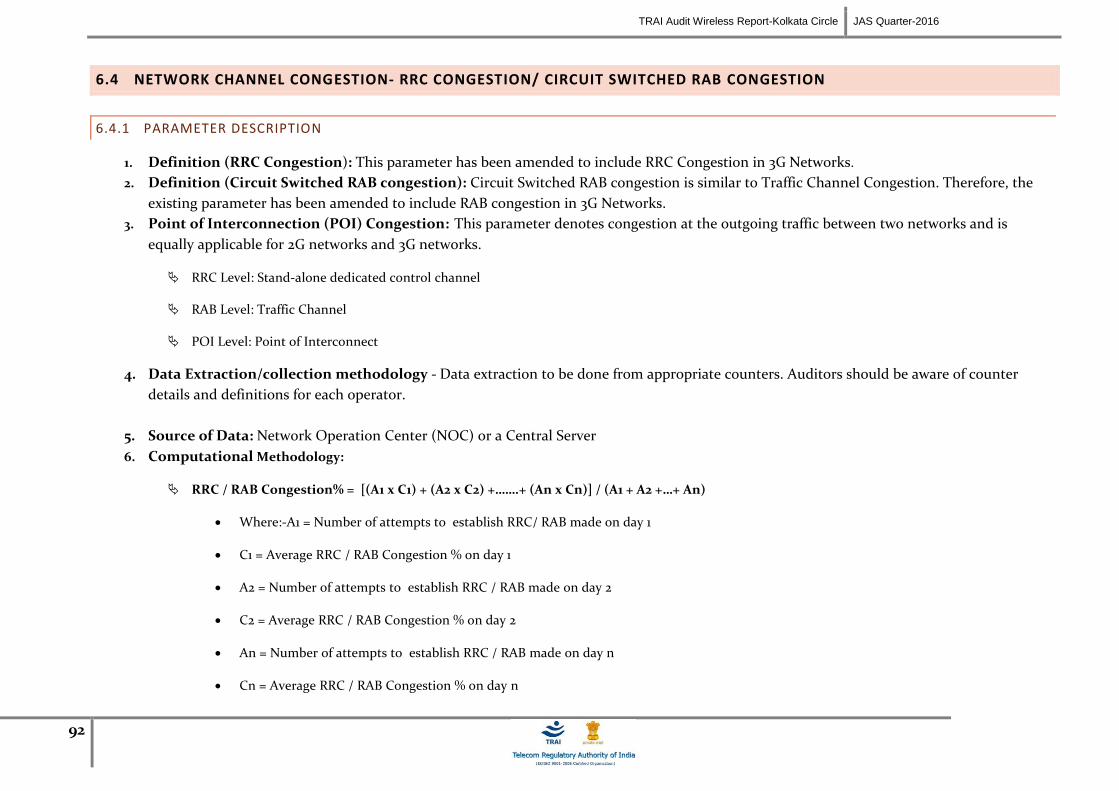
TRAI Audit Wireless Report-Kolkata Circle JAS Quarter-2016
92
6.4 NETWORK CHANNEL CONGESTION- RRC CONGESTION/ CIRCUIT SWITCHED RAB CONGESTION
6.4.1 PARAMETER DESCRIPTION
1. Definition (RRC Congestion): This parameter has been amended to include RRC Congestion in 3G Networks.
2. Definition (Circuit Switched RAB congestion): Circuit Switched RAB congestion is similar to Traffic Channel Congestion. Therefore, the
existing parameter has been amended to include RAB congestion in 3G Networks.
3. Point of Interconnection (POI) Congestion: This parameter denotes congestion at the outgoing traffic between two networks and is
equally applicable for 2G networks and 3G networks.
RRC Level: Stand-alone dedicated control channel
RAB Level: Traffic Channel
POI Level: Point of Interconnect
4. Data Extraction/collection methodology - Data extraction to be done from appropriate counters. Auditors should be aware of counter
details and definitions for each operator.
5. Source of Data: Network Operation Center (NOC) or a Central Server
6. Computational Methodology:
RRC / RAB Congestion% = [(A1 x C1) + (A2 x C2) +…….+ (An x Cn)] / (A1 + A2 +…+ An)
Where:-A1 = Number of attempts to establish RRC/ RAB made on day 1
C1 = Average RRC / RAB Congestion % on day 1
A2 = Number of attempts to establish RRC / RAB made on day 2
C2 = Average RRC / RAB Congestion % on day 2
An = Number of attempts to establish RRC / RAB made on day n
Cn = Average RRC / RAB Congestion % on day n
TRAI Audit Wireless Report-Kolkata Circle JAS Quarter-2016
93
POI Congestion% = [(A1 x C1) + (A2 x C2) +…….+ (An x Cn)] / (A1 + A2 +…+ An)
Where:-A1 = POI traffic offered on all POIs (no. of calls) on day 1
C1 = Average POI Congestion % on day 1
A2 = POI traffic offered on all POIs (no. of calls) on day 2
C2 = Average POI Congestion % on day 2
An = POI traffic offered on all POIs (no. of calls) on day n
Cn = Average POI Congestion % on day n
7. Benchmark:
RRC Congestion: ≤ 1%, RAB Congestion: ≤ 2%, POI Congestion: ≤ 0.5%
8. Audit Procedure –
Audit of the details of RRC and RAB congestion percentages computed by the operator (using OMC–Switch data only) would be conducted
The operator should be measuring this parameter during Time consistent busy hour (TCBH) only RRC
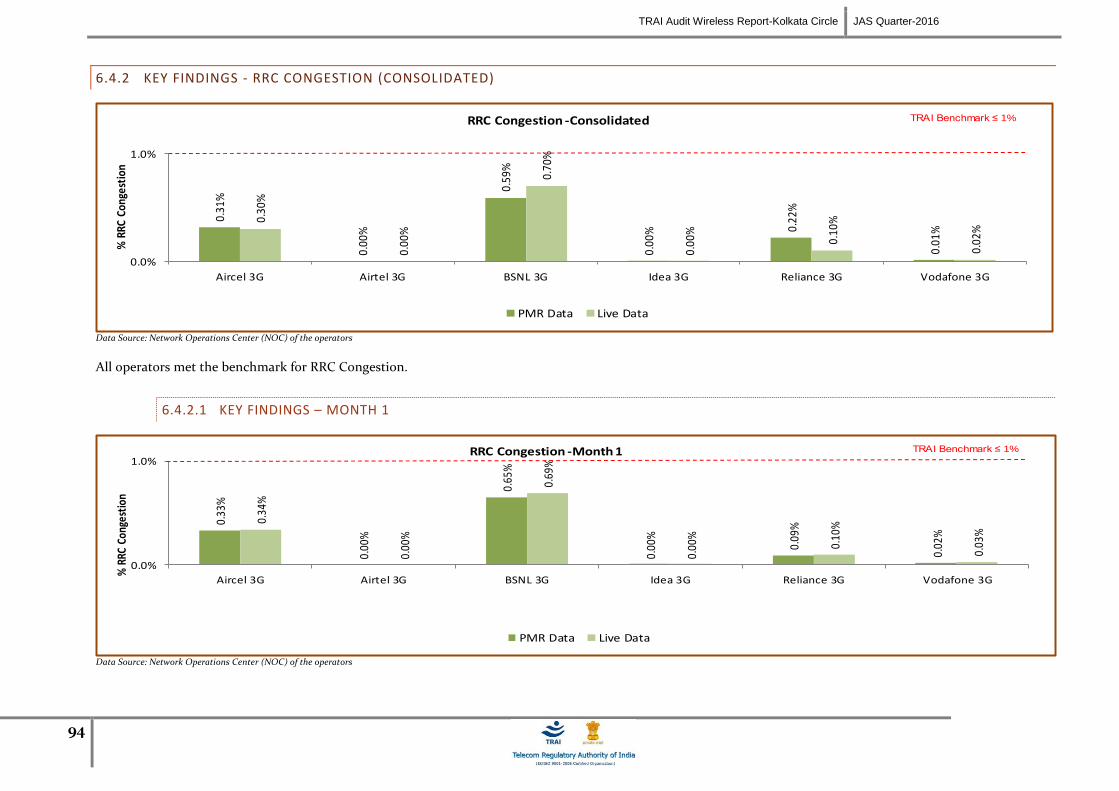
TRAI Audit Wireless Report-Kolkata Circle JAS Quarter-2016
94
6.4.2 KEY FINDINGS - RRC CONGESTION (CONSOLIDATED)
0.31
%
0.00
%
0.59
%
0.00
% 0.22
%
0.01
%
0.30
%
0.00
%
0.70
%
0.00
%
0.10
%
0.02
%
0.0%
1.0%
Aircel 3G Airtel 3G BSNL 3G Idea 3G Reliance 3G Vodafone 3G
% R
RC C
onge
stio
n RRC Congestion -Consolidated
PMR Data Live Data
TRAI Benchmark ≤ 1%
Data Source: Network Operations Center (NOC) of the operators
All operators met the benchmark for RRC Congestion.
6.4.2.1 KEY FINDINGS – MONTH 1
0.33
%
0.00
%
0.65
%
0.00
%
0.09
%
0.02
%
0.34
%
0.00
%
0.69
%
0.00
%
0.10
%
0.03
%
0.0%
1.0%
Aircel 3G Airtel 3G BSNL 3G Idea 3G Reliance 3G Vodafone 3G
% R
RC C
onge
stio
n
RRC Congestion -Month 1
PMR Data Live Data
TRAI Benchmark ≤ 1%
Data Source: Network Operations Center (NOC) of the operators
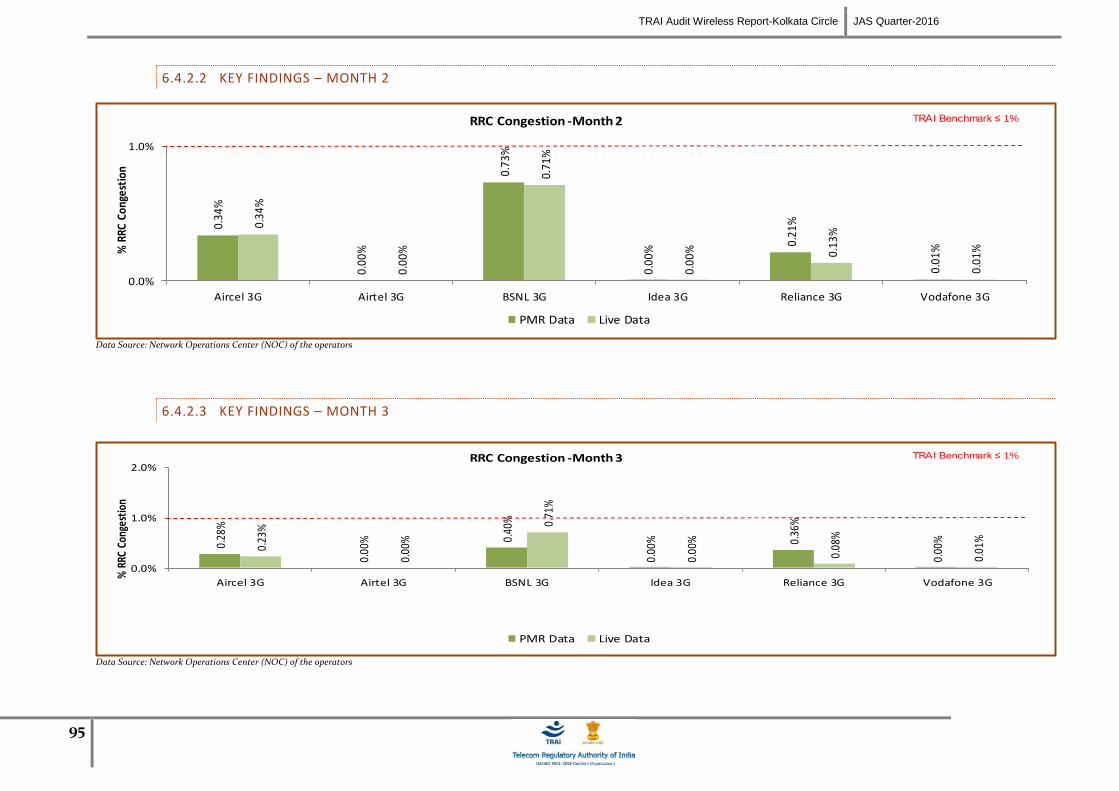
TRAI Audit Wireless Report-Kolkata Circle JAS Quarter-2016
95
6.4.2.2 KEY FINDINGS – MONTH 2
0.34
%
0.00
%
0.73
%
0.00
%
0.21
%
0.01
%
0.34
%
0.00
%
0.71
%
0.00
% 0.13
%
0.01
%
0.0%
1.0%
Aircel 3G Airtel 3G BSNL 3G Idea 3G Reliance 3G Vodafone 3G
% R
RC C
onge
stio
n RRC Congestion -Month 2
PMR Data Live Data
TRAI Benchmark ≤ 1%
Data Source: Network Operations Center (NOC) of the operators
6.4.2.3 KEY FINDINGS – MONTH 3
0.28
%
0.00
% 0.40
%
0.00
% 0.36
%
0.00
%
0.23
%
0.00
%
0.71
%
0.00
%
0.08
%
0.01
%
0.0%
1.0%
2.0%
Aircel 3G Airtel 3G BSNL 3G Idea 3G Reliance 3G Vodafone 3G
% R
RC C
onge
stio
n
RRC Congestion -Month 3
PMR Data Live Data
TRAI Benchmark ≤ 1%
Data Source: Network Operations Center (NOC) of the operators
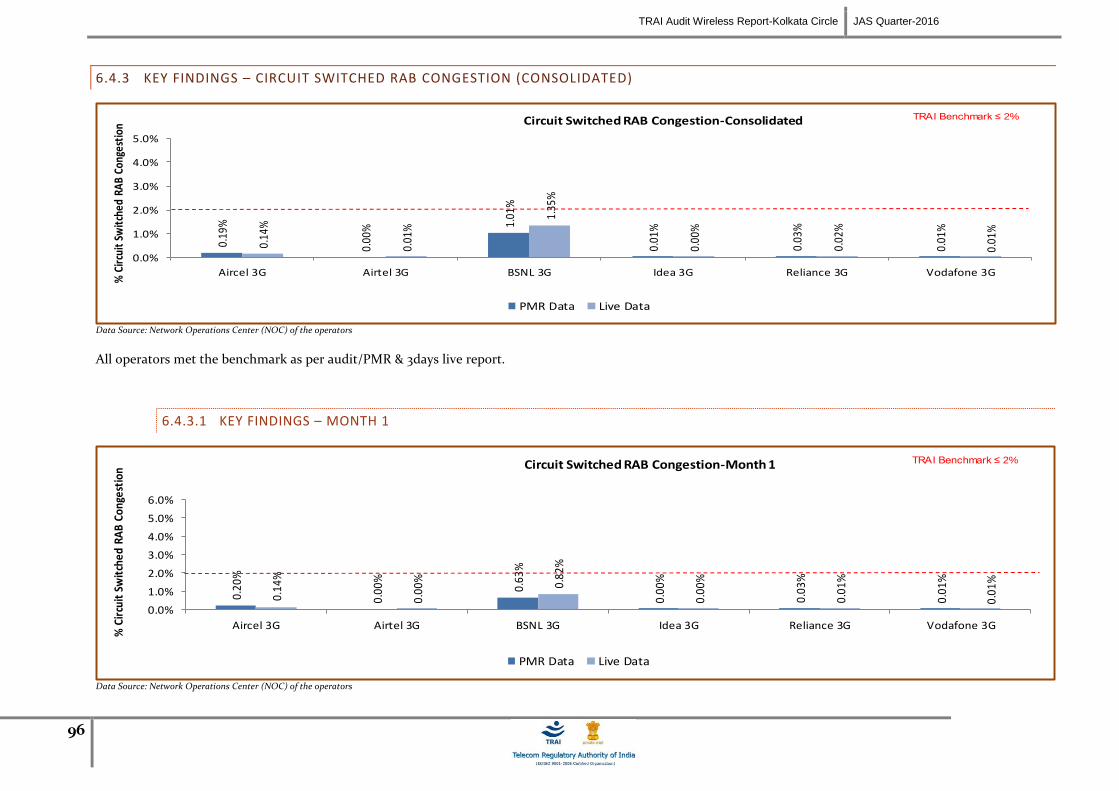
TRAI Audit Wireless Report-Kolkata Circle JAS Quarter-2016
96
6.4.3 KEY FINDINGS – CIRCUIT SWITCHED RAB CONGESTION (CONSOLIDATED)
0.19
%
0.00
% 1.01
%
0.01
%
0.03
%
0.01
%
0.14
%
0.01
%
1.35
%
0.00
%
0.02
%
0.01
%
0.0%
1.0%
2.0%
3.0%
4.0%
5.0%
Aircel 3G Airtel 3G BSNL 3G Idea 3G Reliance 3G Vodafone 3G
% C
ircu
it S
wit
ched
RA
B Co
nges
tion
Circuit Switched RAB Congestion-Consolidated
PMR Data Live Data
TRAI Benchmark ≤ 2%
Data Source: Network Operations Center (NOC) of the operators
All operators met the benchmark as per audit/PMR & 3days live report.
6.4.3.1 KEY FINDINGS – MONTH 1
0.20
%
0.00
%
0.63
%
0.00
%
0.03
%
0.01
%
0.14
%
0.00
% 0.82
%
0.00
%
0.01
%
0.01
%
0.0%
1.0%
2.0%
3.0%
4.0%
5.0%
6.0%
Aircel 3G Airtel 3G BSNL 3G Idea 3G Reliance 3G Vodafone 3G
% C
ircu
it S
wit
ched
RA
B Co
nges
tion
Circuit Switched RAB Congestion-Month 1
PMR Data Live Data
TRAI Benchmark ≤ 2%
Data Source: Network Operations Center (NOC) of the operators
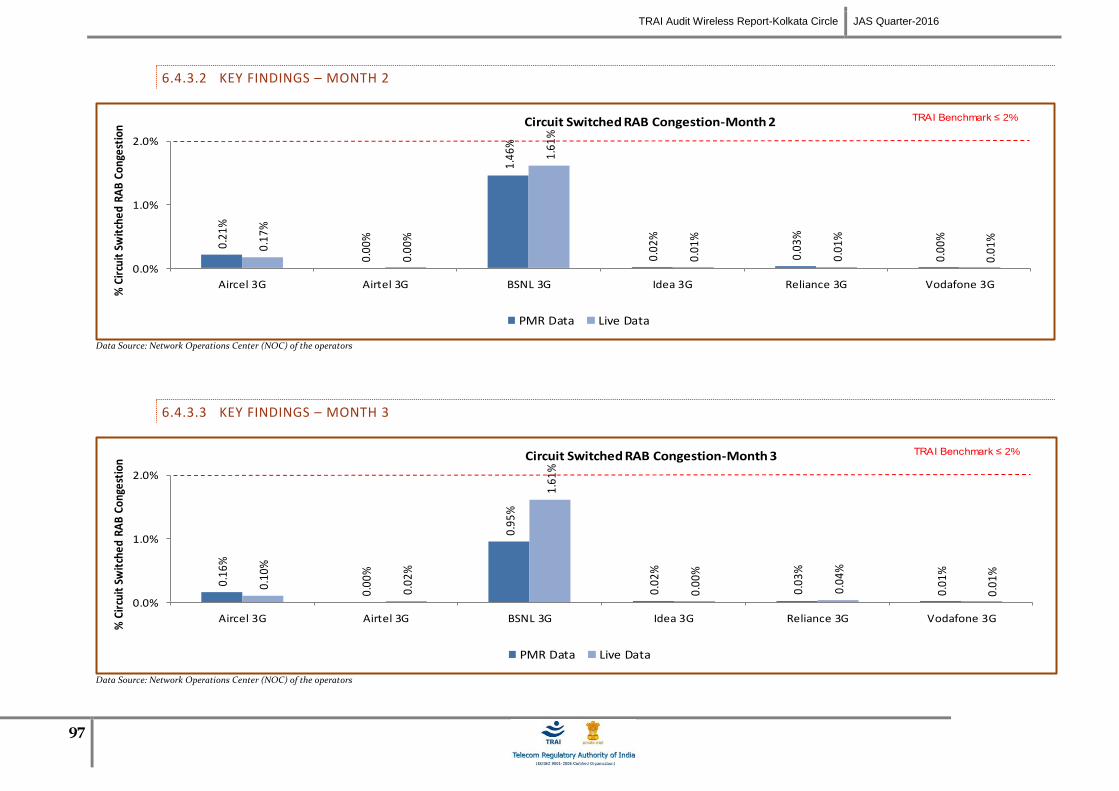
TRAI Audit Wireless Report-Kolkata Circle JAS Quarter-2016
97
6.4.3.2 KEY FINDINGS – MONTH 2
0.21
%
0.00
%
1.46
%
0.02
%
0.03
%
0.00
%
0.17
%
0.00
%
1.61
%
0.01
%
0.01
%
0.01
%
0.0%
1.0%
2.0%
Aircel 3G Airtel 3G BSNL 3G Idea 3G Reliance 3G Vodafone 3G
% C
ircu
it S
wit
ched
RA
B Co
nges
tion
Circuit Switched RAB Congestion-Month 2
PMR Data Live Data
TRAI Benchmark ≤ 2%
Data Source: Network Operations Center (NOC) of the operators
6.4.3.3 KEY FINDINGS – MONTH 3
0.16
%
0.00
%
0.95
%
0.02
%
0.03
%
0.01
%
0.10
%
0.02
%
1.61
%
0.00
%
0.04
%
0.01
%
0.0%
1.0%
2.0%
Aircel 3G Airtel 3G BSNL 3G Idea 3G Reliance 3G Vodafone 3G
% C
ircu
it S
wit
ched
RA
B Co
nges
tion
Circuit Switched RAB Congestion-Month 3
PMR Data Live Data
TRAI Benchmark ≤ 2%
Data Source: Network Operations Center (NOC) of the operators
98
6.5 CIRCUIT SWITCHED VOICE DROP RATE
6.5.1 PARAMETER DESCRIPTION
1. Definition - The Call Drop Rate measures the inability of Network to maintain a call and is defined as the ratio of abnormal speech disconnects with respect
to all speech disconnects (both normal and abnormal). In 3G Networks, a normal disconnect is initiated from the Mobile Switching Centre (MSC) at
completion of the call by a RAB Disconnect message. An abnormal RAB disconnect can be initiated by either UTRAN or CN and includes Radio Link Failures,
Uplink (UL) or Downlink (DL) interference or any other reason.
Total No. of voice RAB abnormally released = All calls ceasing unnaturally i.e. due to handover or due to radio loss
No. of voice RAB normally released = All calls that have RAB allocation during busy hour
2. Data Extraction/collection methodology - Data extraction to be done from appropriate counters. Auditors should be aware of counter
details and definitions for each operator.
3. Source of Data: Network Operation Center (NOC) or a Central Server
4. Computational Methodology: (No. of voice RAB normally released / (No. of voice RAB normally released + RAB abnormally released )x 100
Key Performance Indicator Term Definition
#RAB Normal Release(CSV) Number of voice RAB normally Released
#RAB Abnormal Release(CSV) Number of voice RAB abnormally Released
5. TRAI Benchmark –
Circuit switched voice drop rate ≤ 2%
6. Audit Procedure –
Audit of traffic data of the relevant quarter kept in OMC-R at MSCs and used for arriving at CDR was used
The operator should only be considering those calls which are dropped during Time consistent busy hour (TCBH) for all days of the relevant quarter.
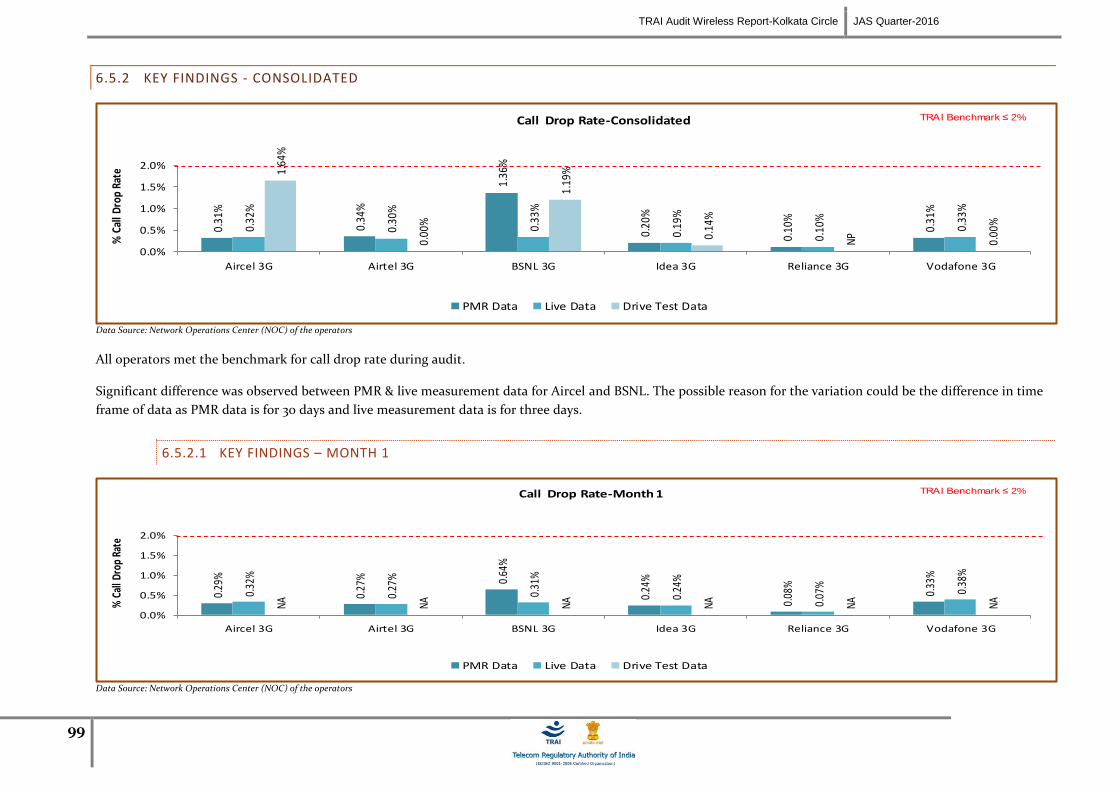
TRAI Audit Wireless Report-Kolkata Circle JAS Quarter-2016
99
6.5.2 KEY FINDINGS - CONSOLIDATED
0.31
%
0.34
%
1.36
%
0.20
%
0.10
%
0.31
%
0.32
%
0.30
%
0.33
%
0.19
%
0.10
%
0.33
%
1.64
%
0.00
%
1.19
%
0.14
%
NP
0.00
%
0.0%
0.5%
1.0%
1.5%
2.0%
Aircel 3G Airtel 3G BSNL 3G Idea 3G Reliance 3G Vodafone 3G
% C
all D
rop
Rate
Call Drop Rate-Consolidated
PMR Data Live Data Drive Test Data
TRAI Benchmark ≤ 2%
Data Source: Network Operations Center (NOC) of the operators
All operators met the benchmark for call drop rate during audit.
Significant difference was observed between PMR & live measurement data for Aircel and BSNL. The possible reason for the variation could be the difference in time
frame of data as PMR data is for 30 days and live measurement data is for three days.
6.5.2.1 KEY FINDINGS – MONTH 1
0.29
%
0.27
% 0.64
%
0.24
%
0.08
%
0.33
%
0.32
%
0.27
%
0.31
%
0.24
%
0.07
% 0.38
%
NA NA NA NA NA NA
0.0%
0.5%
1.0%
1.5%
2.0%
Aircel 3G Airtel 3G BSNL 3G Idea 3G Reliance 3G Vodafone 3G
% C
all D
rop
Rate
Call Drop Rate-Month 1
PMR Data Live Data Drive Test Data
TRAI Benchmark ≤ 2%
Data Source: Network Operations Center (NOC) of the operators
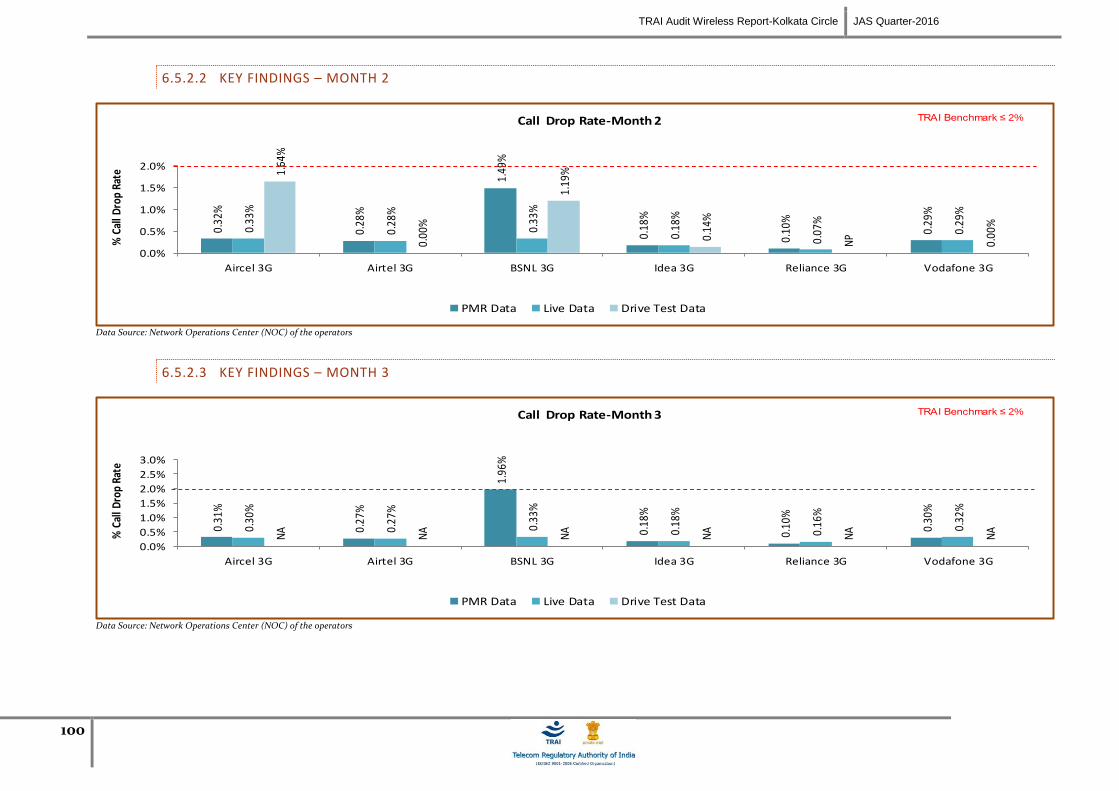
TRAI Audit Wireless Report-Kolkata Circle JAS Quarter-2016
100
6.5.2.2 KEY FINDINGS – MONTH 2
0.32
%
0.28
%
1.49
%
0.18
%
0.10
%
0.29
%
0.33
%
0.28
%
0.33
%
0.18
%
0.07
%
0.29
%
1.64
%
0.00
%
1.19
%
0.14
%
NP
0.00
%
0.0%
0.5%
1.0%
1.5%
2.0%
Aircel 3G Airtel 3G BSNL 3G Idea 3G Reliance 3G Vodafone 3G
% C
all D
rop
Rate
Call Drop Rate-Month 2
PMR Data Live Data Drive Test Data
TRAI Benchmark ≤ 2%
Data Source: Network Operations Center (NOC) of the operators
6.5.2.3 KEY FINDINGS – MONTH 3
0.31
%
0.27
%
1.96
%
0.18
%
0.10
%
0.30
%
0.30
%
0.27
%
0.33
%
0.18
%
0.16
%
0.32
%
NA
NA
NA
NA
NA
NA
0.0%
0.5%
1.0%
1.5%
2.0%
2.5%
3.0%
Aircel 3G Airtel 3G BSNL 3G Idea 3G Reliance 3G Vodafone 3G
% C
all D
rop
Rate
Call Drop Rate-Month 3
PMR Data Live Data Drive Test Data
TRAI Benchmark ≤ 2%
Data Source: Network Operations Center (NOC) of the operators
TRAI Audit Wireless Report-Kolkata Circle JAS Quarter-2016
101
6.6 WORST AFFECTED CELLS HAVING MORE THAN 3% CIRCUIT SWITCHED VOICE DROP RATE
6.6.1 PARAMETER DESCRIPTION
1. Definition- Cells having more than 3% circuit switch voice quality: The existing parameter has been amended to cover 3G Networks to
assess worst affected cells having more than 3% CSV Drop Rate.
2. Data Extraction/collection methodology - Data extraction to be done from appropriate counters. Auditors should be aware of counter
details and definitions for each operator.
3. Source of Data: Network Operation Center (NOC) or a Central Server
4. Computational Methodology: (Number of cells having CSV drop rate > 3% during CBBH in a month / Total number of cells in the licensed area) x
100
5. TRAI Benchmark –
Worst affected cells having CSV drop rate > 3% during CBBH in a month ≤ 3%
6. Audit Procedure –
Audit of traffic data of the relevant quarter kept in OMC-R at MSCs and used for arriving at CDR would be conducted.
The operator should only be considering those calls which are dropped during Cell Bouncing Busy hour (CBBH) for all days of the relevant quarter.
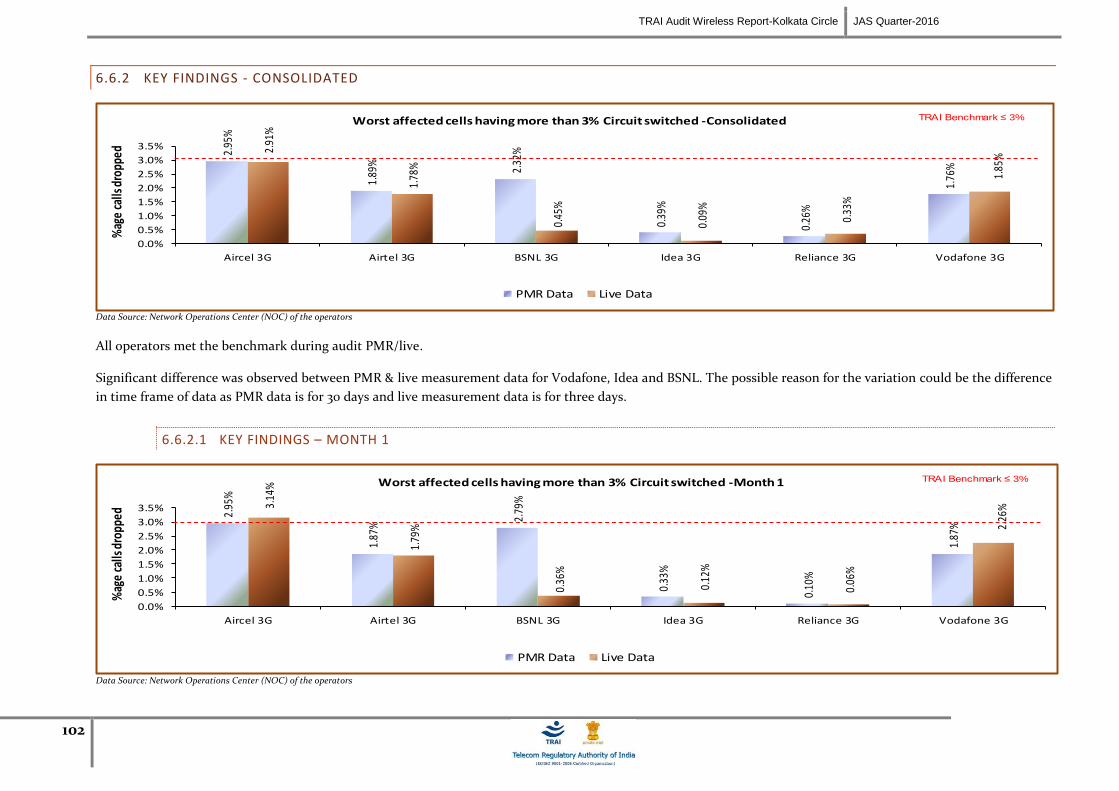
TRAI Audit Wireless Report-Kolkata Circle JAS Quarter-2016
102
6.6.2 KEY FINDINGS - CONSOLIDATED
2.95
%
1.89
%
2.32
%
0.39
%
0.26
%
1.76
%
2.91
%
1.78
%
0.45
%
0.09
%
0.33
%
1.85
%
0.0%
0.5%
1.0%
1.5%
2.0%
2.5%
3.0%
3.5%
Aircel 3G Airtel 3G BSNL 3G Idea 3G Reliance 3G Vodafone 3G
%ag
e ca
lls d
ropp
edWorst affected cells having more than 3% Circuit switched -Consolidated
PMR Data Live Data
TRAI Benchmark ≤ 3%
Data Source: Network Operations Center (NOC) of the operators
All operators met the benchmark during audit PMR/live.
Significant difference was observed between PMR & live measurement data for Vodafone, Idea and BSNL. The possible reason for the variation could be the difference
in time frame of data as PMR data is for 30 days and live measurement data is for three days.
6.6.2.1 KEY FINDINGS – MONTH 1
2.95
%
1.87
%
2.79
%
0.33
%
0.10
%
1.87
%
3.14
%
1.79
%
0.36
%
0.12
%
0.06
%
2.26
%
0.0%
0.5%
1.0%
1.5%
2.0%
2.5%
3.0%
3.5%
Aircel 3G Airtel 3G BSNL 3G Idea 3G Reliance 3G Vodafone 3G
%ag
e ca
lls d
ropp
ed
Worst affected cells having more than 3% Circuit switched -Month 1
PMR Data Live Data
TRAI Benchmark ≤ 3%
Data Source: Network Operations Center (NOC) of the operators
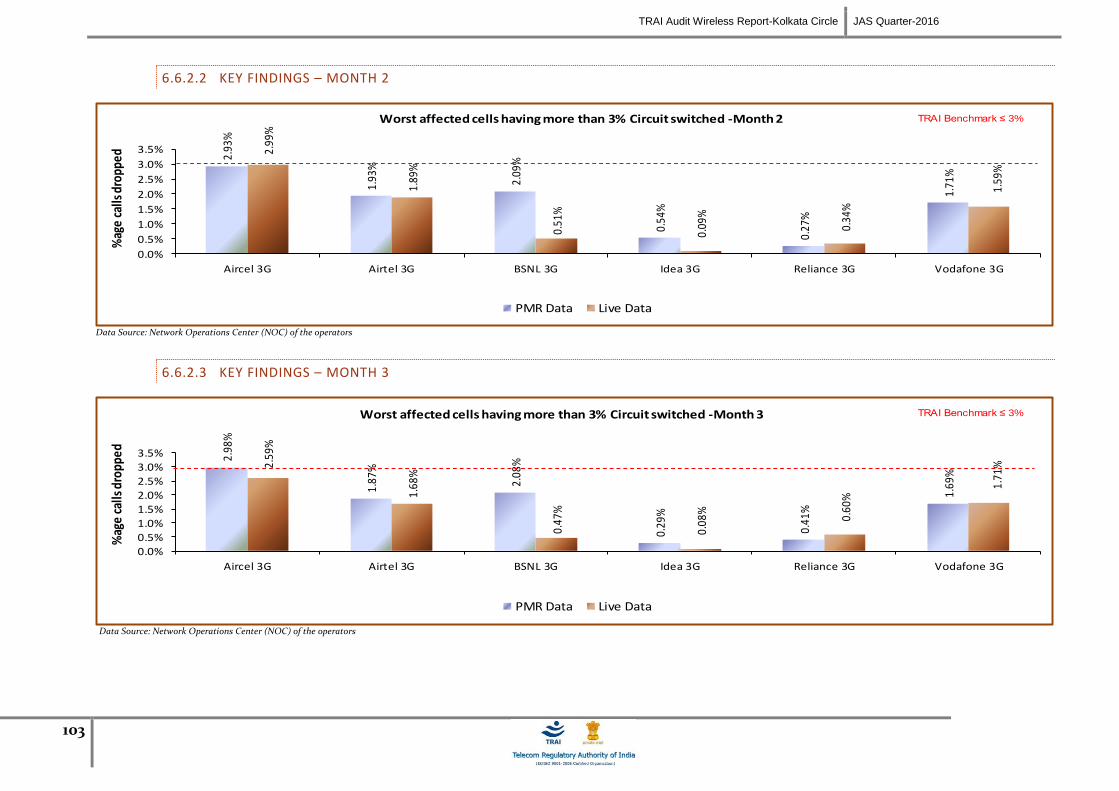
TRAI Audit Wireless Report-Kolkata Circle JAS Quarter-2016
103
6.6.2.2 KEY FINDINGS – MONTH 2
2.93
%
1.93
%
2.09
%
0.54
%
0.27
%
1.71
%
2.99
%
1.89
%
0.51
%
0.09
%
0.34
%
1.59
%
0.0%
0.5%
1.0%
1.5%
2.0%
2.5%
3.0%
3.5%
Aircel 3G Airtel 3G BSNL 3G Idea 3G Reliance 3G Vodafone 3G
%ag
e ca
lls d
ropp
edWorst affected cells having more than 3% Circuit switched -Month 2
PMR Data Live Data
TRAI Benchmark ≤ 3%
Data Source: Network Operations Center (NOC) of the operators
6.6.2.3 KEY FINDINGS – MONTH 3
2.98
%
1.87
%
2.08
%
0.29
%
0.41
%
1.69
%
2.59
%
1.68
%
0.47
%
0.08
%
0.60
%
1.71
%
0.0%
0.5%
1.0%
1.5%
2.0%
2.5%
3.0%
3.5%
Aircel 3G Airtel 3G BSNL 3G Idea 3G Reliance 3G Vodafone 3G
%ag
e ca
lls d
ropp
ed
Worst affected cells having more than 3% Circuit switched -Month 3
PMR Data Live Data
TRAI Benchmark ≤ 3%
Data Source: Network Operations Center (NOC) of the operators

TRAI Audit Wireless Report-Kolkata Circle JAS Quarter-2016
104
6.7 CIRCUIT SWITCH VOICE QUALITY
6.7.1 PARAMETER DESCRIPTION
5. Definition:
for GSM service providers the calls having a value of 0 –5 are considered to be of good quality (on a seven point scale)
For CDMA the measure of voice quality is Frame Error Rate (FER). FER is the probability that a transmitted frame will be received incorrectly. Good
voice quality of a call is considered when it FER value lies between 0 – 4 %
6. Computational Methodology:
% Connections with good voice quality = (No. of voice samples with good voice quality / Total number of samples) x 100
7. TRAI Benchmark: ≥ 95%
8. Audit Procedure –
a. A sample of calls would be taken randomly from the total calls established.
b. The operator should only be considering those calls which are meeting the desired benchmark of good voice quality.
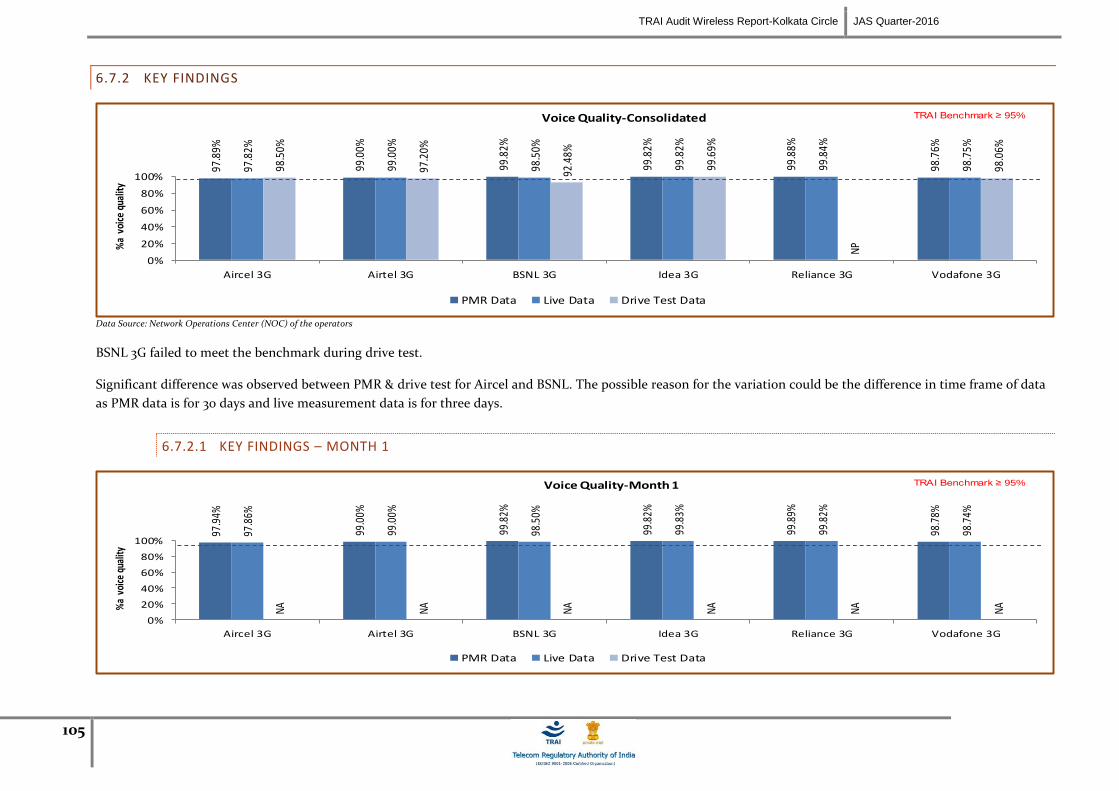
TRAI Audit Wireless Report-Kolkata Circle JAS Quarter-2016
105
6.7.2 KEY FINDINGS
97.8
9%
99.0
0%
99.8
2%
99.8
2%
99.8
8%
98.7
6%
97.8
2%
99.0
0%
98.5
0%
99.8
2%
99.8
4%
98.7
5%
98.5
0%
97.2
0%
92.4
8%
99.6
9%
NP
98.0
6%
0%
20%
40%
60%
80%
100%
Aircel 3G Airtel 3G BSNL 3G Idea 3G Reliance 3G Vodafone 3G
%a
voi
ce q
ualit
yVoice Quality-Consolidated
PMR Data Live Data Drive Test Data
TRAI Benchmark ≥ 95%
Data Source: Network Operations Center (NOC) of the operators
BSNL 3G failed to meet the benchmark during drive test.
Significant difference was observed between PMR & drive test for Aircel and BSNL. The possible reason for the variation could be the difference in time frame of data
as PMR data is for 30 days and live measurement data is for three days.
6.7.2.1 KEY FINDINGS – MONTH 1
97.9
4%
99.0
0%
99.8
2%
99.8
2%
99.8
9%
98.7
8%
97.8
6%
99.0
0%
98.5
0%
99.8
3%
99.8
2%
98.7
4%
NA NA NA NA NA NA
0%
20%
40%
60%
80%
100%
Aircel 3G Airtel 3G BSNL 3G Idea 3G Reliance 3G Vodafone 3G
%a
voi
ce q
ualit
y
Voice Quality-Month 1
PMR Data Live Data Drive Test Data
TRAI Benchmark ≥ 95%
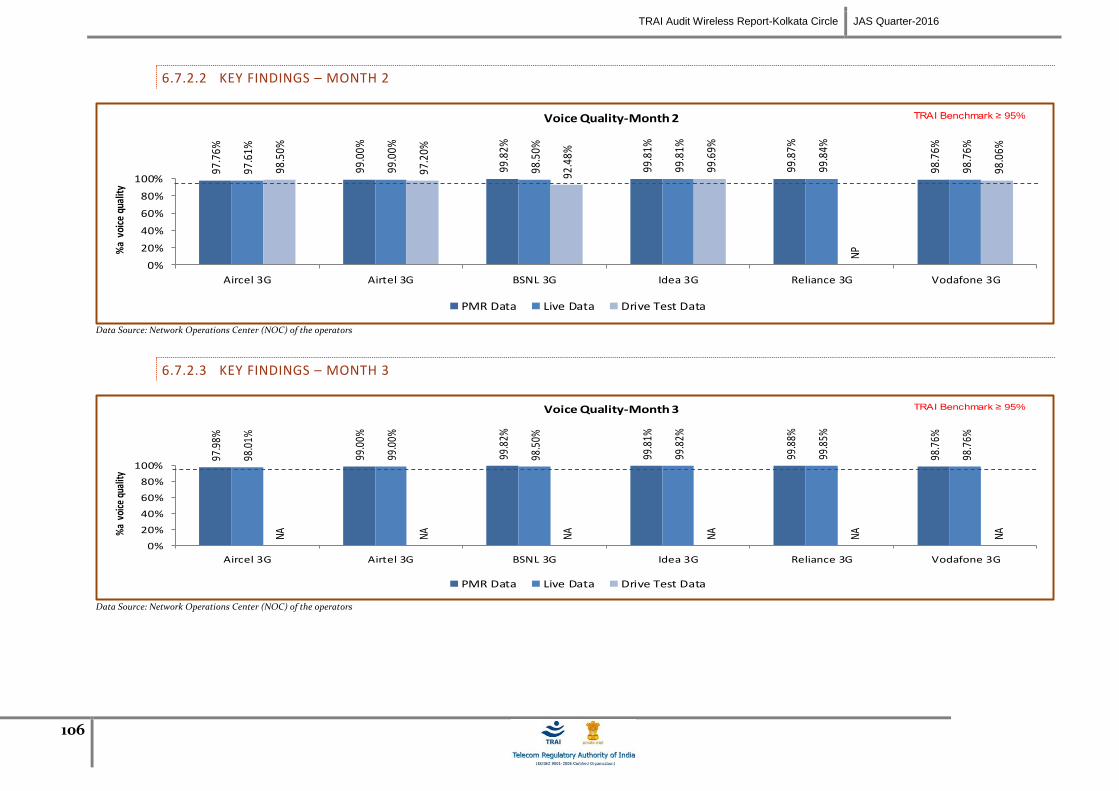
TRAI Audit Wireless Report-Kolkata Circle JAS Quarter-2016
106
6.7.2.2 KEY FINDINGS – MONTH 2
97.7
6%
99.0
0%
99.8
2%
99.8
1%
99.8
7%
98.7
6%
97.6
1%
99.0
0%
98.5
0%
99.8
1%
99.8
4%
98.7
6%
98.5
0%
97.2
0%
92.4
8%
99.6
9%
NP
98.0
6%
0%
20%
40%
60%
80%
100%
Aircel 3G Airtel 3G BSNL 3G Idea 3G Reliance 3G Vodafone 3G
%a
voi
ce q
ualit
yVoice Quality-Month 2
PMR Data Live Data Drive Test Data
TRAI Benchmark ≥ 95%
Data Source: Network Operations Center (NOC) of the operators
6.7.2.3 KEY FINDINGS – MONTH 3
97.9
8%
99.0
0%
99.8
2%
99.8
1%
99.8
8%
98.7
6%
98.0
1%
99.0
0%
98.5
0%
99.8
2%
99.8
5%
98.7
6%
NA NA NA NA NA NA
0%
20%
40%
60%
80%
100%
Aircel 3G Airtel 3G BSNL 3G Idea 3G Reliance 3G Vodafone 3G
%a
voi
ce q
ualit
y
Voice Quality-Month 3
PMR Data Live Data Drive Test Data
TRAI Benchmark ≥ 95%
Data Source: Network Operations Center (NOC) of the operators
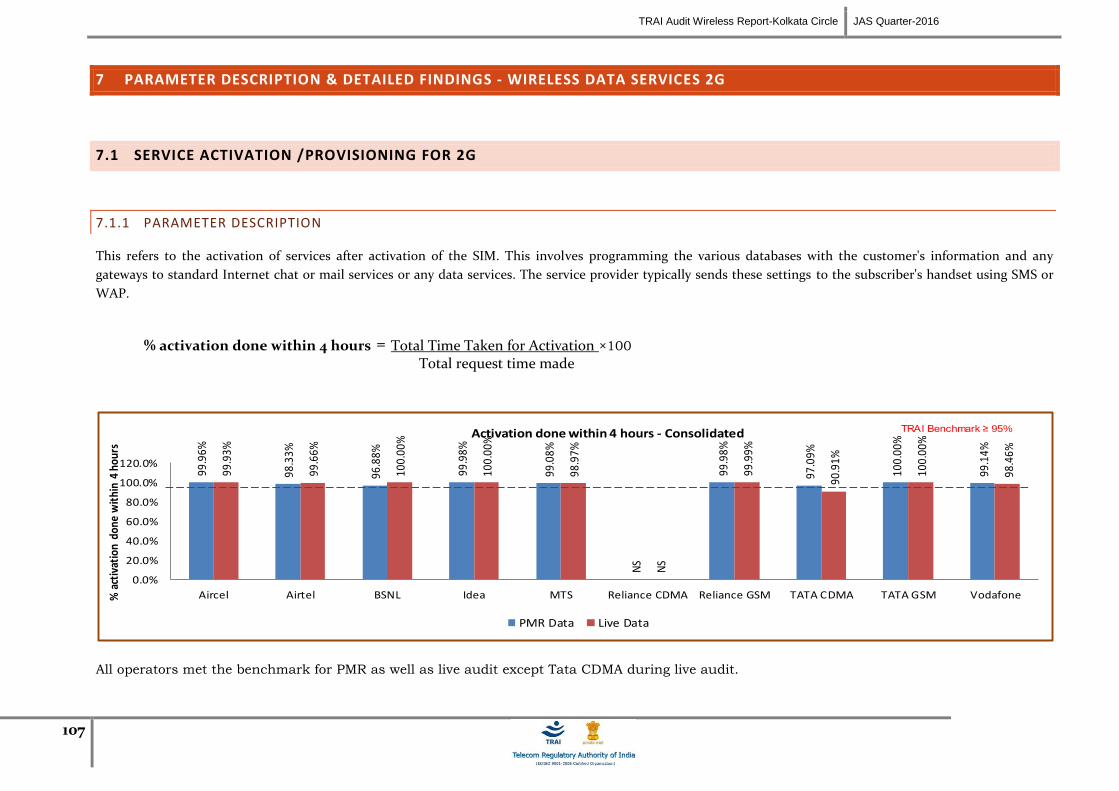
TRAI Audit Wireless Report-Kolkata Circle JAS Quarter-2016
107
7 PARAMETER DESCRIPTION & DETAILED FINDINGS - WIRELESS DATA SERVICES 2G
7.1 SERVICE ACTIVATION /PROVISIONING FOR 2G
7.1.1 PARAMETER DESCRIPTION
This refers to the activation of services after activation of the SIM. This involves programming the various databases with the customer's information and any
gateways to standard Internet chat or mail services or any data services. The service provider typically sends these settings to the subscriber's handset using SMS or
WAP.
% activation done within 4 hours = Total Time Taken for Activation ×100 Total request time made
99.9
6%
98.3
3%
96.8
8%
99.9
8%
99.0
8%
NS
99.9
8%
97.0
9%
100.
00%
99.1
4%
99.9
3%
99.6
6%
100.
00%
100.
00%
98.9
7%
NS
99.9
9%
90.9
1%
100.
00%
98.4
6%
0.0%
20.0%
40.0%
60.0%
80.0%
100.0%
120.0%
Aircel Airtel BSNL Idea MTS Reliance CDMA Reliance GSM TATA CDMA TATA GSM Vodafone% a
ctiv
atio
n do
ne w
ithi
n 4
hour
s
Activation done within 4 hours - Consolidated
PMR Data Live Data
TRAI Benchmark ≥ 95%
All operators met the benchmark for PMR as well as live audit except Tata CDMA during live audit.

TRAI Audit Wireless Report-Kolkata Circle JAS Quarter-2016
108
Significant difference was observed between PMR & live measurement data for TATA CDMA and BSNL. The possible reason for the variation could be the difference
in time frame of data as PMR data is for 30 days and live measurement data is for three days.
7.1.1.1 KEY FINDINGS – MONTH 1
99.9
8%
97.0
0%
99.3
7%
99.9
9%
99.7
7%
NS
99.9
7%
96.3
6%
100.
00%
100.
00%
99.8
3%
NA
100.
00%
99.9
9%
100.
00%
NS
99.9
8%
80.0
0% 100.
00%
100.
00%
0.0%
20.0%
40.0%
60.0%
80.0%
100.0%
120.0%
Aircel Airtel BSNL Idea MTS Reliance CDMA Reliance GSM TATA CDMA TATA GSM Vodafone% a
ctiv
atio
n do
ne w
ithi
n 4
hour
s
Activation done within 4 hours - Month 1
PMR Data Live Data
TRAI Benchmark ≥ 95%
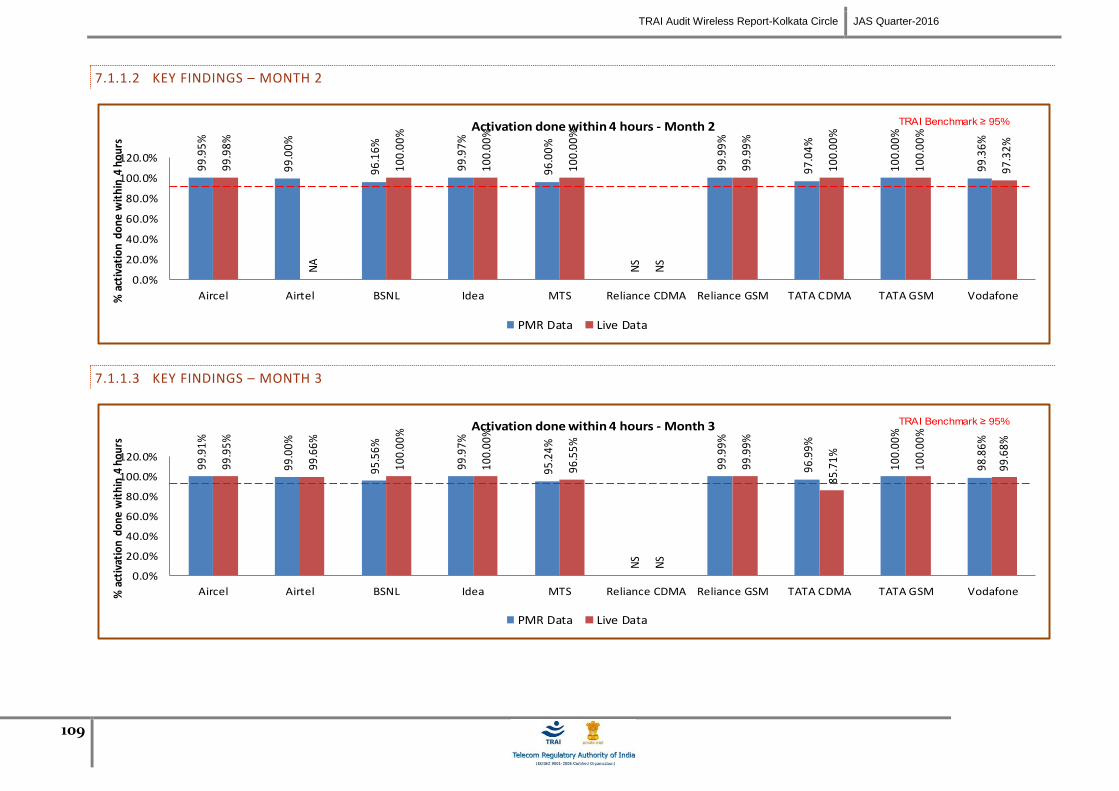
TRAI Audit Wireless Report-Kolkata Circle JAS Quarter-2016
109
7.1.1.2 KEY FINDINGS – MONTH 2
99
.95
%
99
.00
%
96
.16
%
99
.97
%
96
.00
%
NS
99
.99
%
97
.04
%
10
0.0
0%
99
.36
%
99
.98
%
NA
10
0.0
0%
10
0.0
0%
100.
00%
NS
99
.99
%
100.
00%
100.
00%
97
.32
%
0.0%
20.0%
40.0%
60.0%
80.0%
100.0%
120.0%
Aircel Airtel BSNL Idea MTS Reliance CDMA Reliance GSM TATA CDMA TATA GSM Vodafone% a
ctiv
atio
n d
on
e w
ith
in 4
ho
urs
Activation done within 4 hours - Month 2
PMR Data Live Data
TRAI Benchmark ≥ 95%
7.1.1.3 KEY FINDINGS – MONTH 3
99.9
1%
99.0
0%
95.5
6%
99.9
7%
95.2
4%
NS
99.9
9%
96.9
9%
100.
00%
98.8
6%
99.9
5%
99.6
6%
100.
00%
100.
00%
96.5
5%
NS
99.9
9%
85.7
1%
100.
00%
99.6
8%
0.0%
20.0%
40.0%
60.0%
80.0%
100.0%
120.0%
Aircel Airtel BSNL Idea MTS Reliance CDMA Reliance GSM TATA CDMA TATA GSM Vodafone% a
ctiv
atio
n do
ne w
ithi
n 4
hour
s
Activation done within 4 hours - Month 3
PMR Data Live Data
TRAI Benchmark ≥ 95%
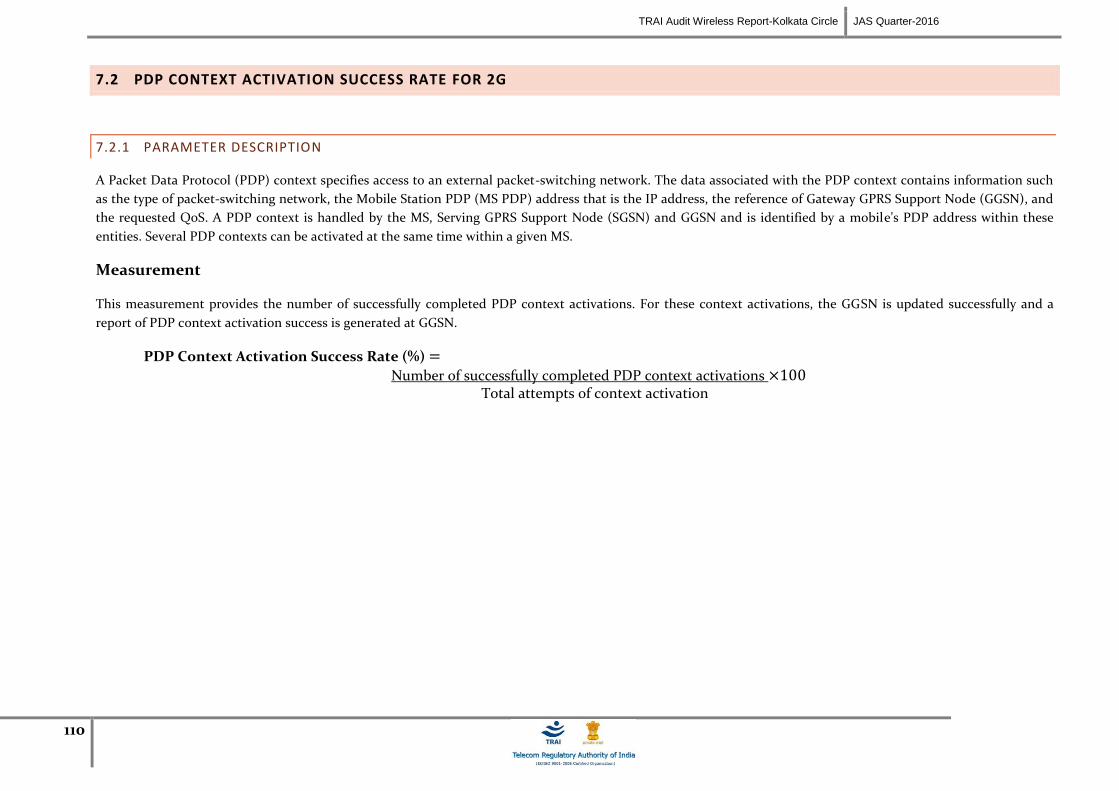
TRAI Audit Wireless Report-Kolkata Circle JAS Quarter-2016
110
7.2 PDP CONTEXT ACTIVATION SUCCESS RATE FOR 2G
7.2.1 PARAMETER DESCRIPTION
A Packet Data Protocol (PDP) context specifies access to an external packet-switching network. The data associated with the PDP context contains information such
as the type of packet-switching network, the Mobile Station PDP (MS PDP) address that is the IP address, the reference of Gateway GPRS Support Node (GGSN), and
the requested QoS. A PDP context is handled by the MS, Serving GPRS Support Node (SGSN) and GGSN and is identified by a mobile's PDP address within these
entities. Several PDP contexts can be activated at the same time within a given MS.
Measurement
This measurement provides the number of successfully completed PDP context activations. For these context activations, the GGSN is updated successfully and a
report of PDP context activation success is generated at GGSN.
PDP Context Activation Success Rate (%) = Number of successfully completed PDP context activations ×100
Total attempts of context activation
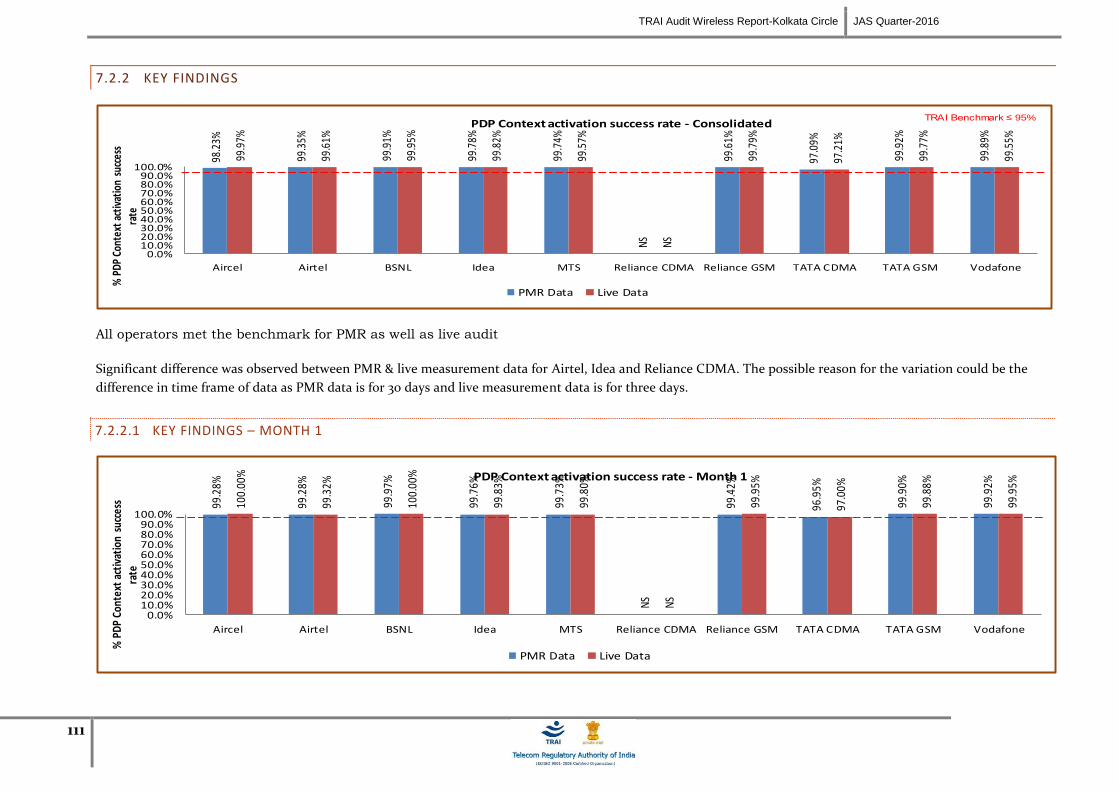
TRAI Audit Wireless Report-Kolkata Circle JAS Quarter-2016
111
7.2.2 KEY FINDINGS
98.2
3%
99.3
5%
99.9
1%
99.7
8%
99.7
4%
NS
99.6
1%
97.0
9%
99.9
2%
99.8
9%
99.9
7%
99.6
1%
99.9
5%
99.8
2%
99.5
7%
NS
99.7
9%
97.2
1%
99.7
7%
99.5
5%
0.0%10.0%20.0%30.0%40.0%50.0%60.0%70.0%80.0%90.0%
100.0%
Aircel Airtel BSNL Idea MTS Reliance CDMA Reliance GSM TATA CDMA TATA GSM Vodafone
% P
DP C
onte
xt a
ctiv
atio
n su
cces
s ra
te
PDP Context activation success rate - Consolidated
PMR Data Live Data
TRAI Benchmark ≤ 95%
All operators met the benchmark for PMR as well as live audit
Significant difference was observed between PMR & live measurement data for Airtel, Idea and Reliance CDMA. The possible reason for the variation could be the
difference in time frame of data as PMR data is for 30 days and live measurement data is for three days.
7.2.2.1 KEY FINDINGS – MONTH 1
99.2
8%
99.2
8%
99.9
7%
99.7
6%
99.7
3%
NS
99.4
2%
96.9
5%
99.9
0%
99.9
2%
100.
00%
99.3
2%
100.
00%
99.8
3%
99.8
0%
NS
99.9
5%
97.0
0%
99.8
8%
99.9
5%
0.0%10.0%20.0%30.0%40.0%50.0%60.0%70.0%80.0%90.0%
100.0%
Aircel Airtel BSNL Idea MTS Reliance CDMA Reliance GSM TATA CDMA TATA GSM Vodafone
% P
DP
Cont
ext
acti
vati
on s
ucce
ss
rate
PDP Context activation success rate - Month 1
PMR Data Live Data
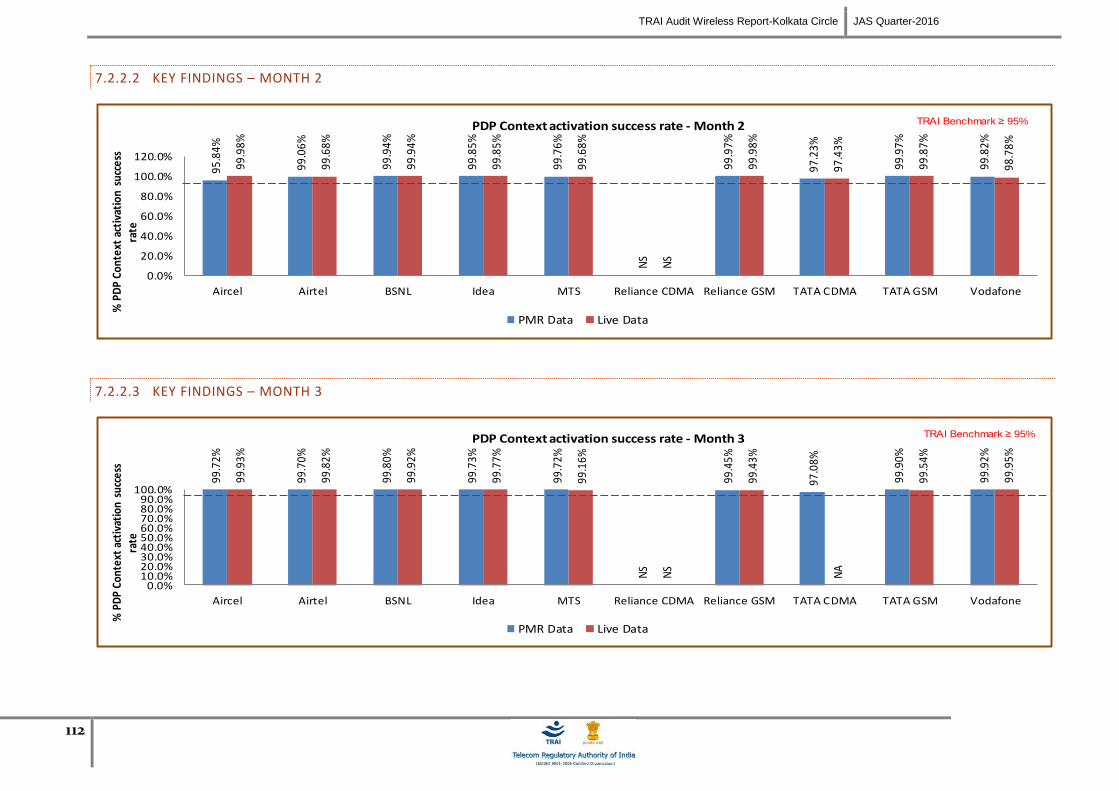
TRAI Audit Wireless Report-Kolkata Circle JAS Quarter-2016
112
7.2.2.2 KEY FINDINGS – MONTH 2
95.8
4%
99.0
6%
99.9
4%
99.8
5%
99.7
6%
NS
99.9
7%
97.2
3%
99.9
7%
99.8
2%
99.9
8%
99.6
8%
99.9
4%
99.8
5%
99.6
8%
NS
99.9
8%
97.4
3%
99.8
7%
98.7
8%
0.0%
20.0%
40.0%
60.0%
80.0%
100.0%
120.0%
Aircel Airtel BSNL Idea MTS Reliance CDMA Reliance GSM TATA CDMA TATA GSM Vodafone
% P
DP
Cont
ext
acti
vati
on s
ucce
ss
rate
PDP Context activation success rate - Month 2
PMR Data Live Data
TRAI Benchmark ≥ 95%
7.2.2.3 KEY FINDINGS – MONTH 3
99.7
2%
99.7
0%
99.8
0%
99.7
3%
99.7
2%
NS
99.4
5%
97.0
8%
99.9
0%
99.9
2%
99.9
3%
99.8
2%
99.9
2%
99.7
7%
99.1
6%
NS
99.4
3%
NA
99.5
4%
99.9
5%
0.0%10.0%20.0%30.0%40.0%50.0%60.0%70.0%80.0%90.0%
100.0%
Aircel Airtel BSNL Idea MTS Reliance CDMA Reliance GSM TATA CDMA TATA GSM Vodafone
% P
DP
Cont
ext
acti
vati
on s
ucce
ss
rate
PDP Context activation success rate - Month 3
PMR Data Live Data
TRAI Benchmark ≥ 95%
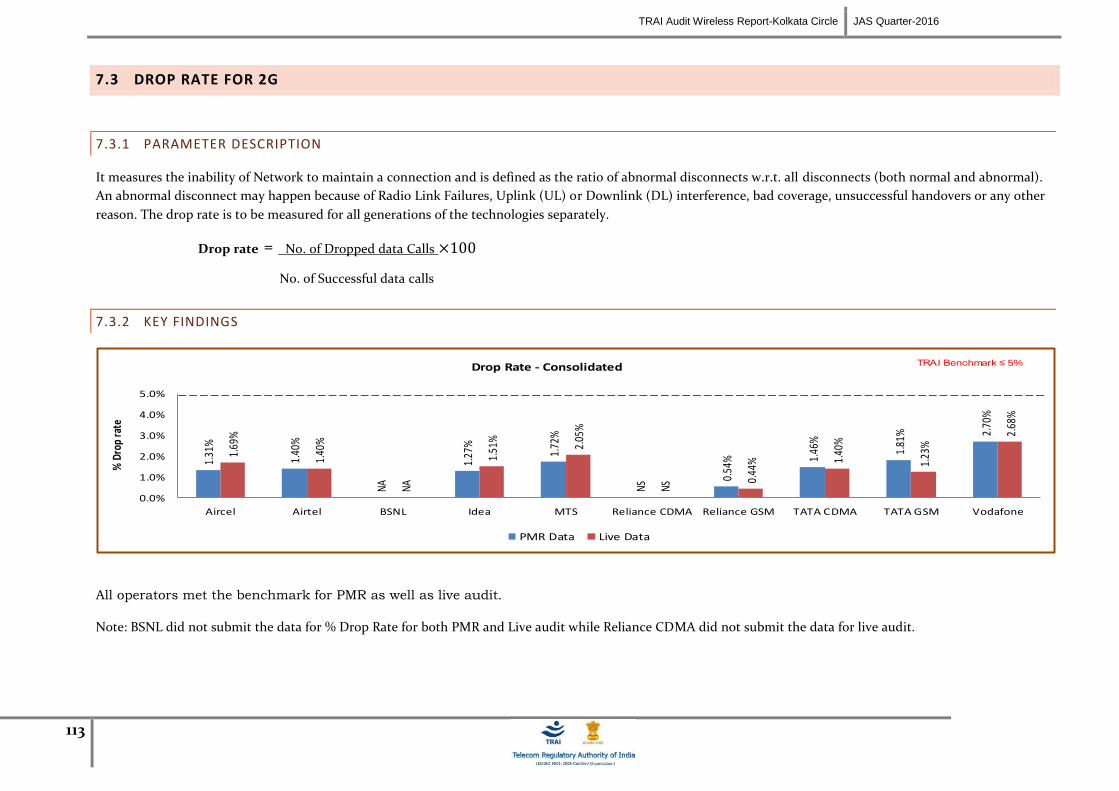
TRAI Audit Wireless Report-Kolkata Circle JAS Quarter-2016
113
7.3 DROP RATE FOR 2G
7.3.1 PARAMETER DESCRIPTION
It measures the inability of Network to maintain a connection and is defined as the ratio of abnormal disconnects w.r.t. all disconnects (both normal and abnormal).
An abnormal disconnect may happen because of Radio Link Failures, Uplink (UL) or Downlink (DL) interference, bad coverage, unsuccessful handovers or any other
reason. The drop rate is to be measured for all generations of the technologies separately.
Drop rate = No. of Dropped data Calls ×100
No. of Successful data calls
7.3.2 KEY FINDINGS
1.31
%
1.40
%
NA
1.27
%
1.72
%
NS
0.54
% 1.46
%
1.81
% 2.70
%
1.69
%
1.40
%
NA
1.51
%
2.05
%
NS
0.44
% 1.40
%
1.23
%
2.68
%
0.0%
1.0%
2.0%
3.0%
4.0%
5.0%
Aircel Airtel BSNL Idea MTS Reliance CDMA Reliance GSM TATA CDMA TATA GSM Vodafone
% D
rop
rate
Drop Rate - Consolidated
PMR Data Live Data
TRAI Benchmark ≤ 5%
All operators met the benchmark for PMR as well as live audit.
Note: BSNL did not submit the data for % Drop Rate for both PMR and Live audit while Reliance CDMA did not submit the data for live audit.
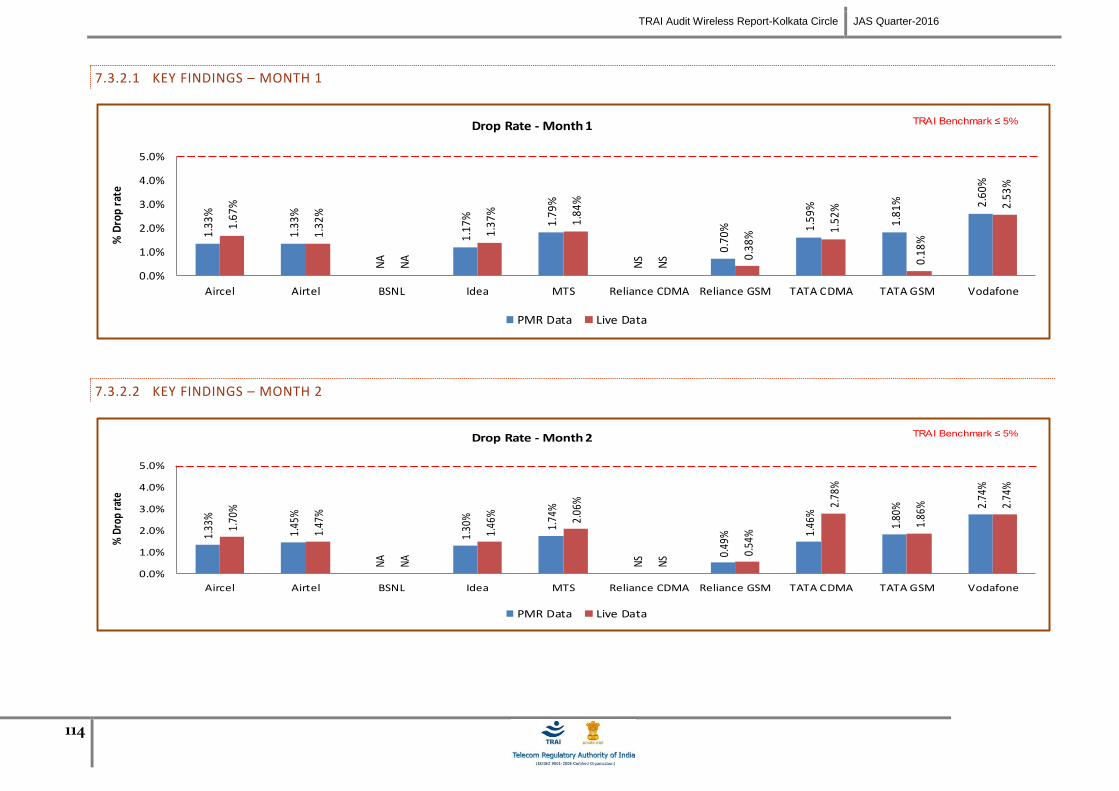
TRAI Audit Wireless Report-Kolkata Circle JAS Quarter-2016
114
7.3.2.1 KEY FINDINGS – MONTH 1
1.33
%
1.33
%
NA
1.17
%
1.79
%
NS
0.70
% 1.59
%
1.81
% 2.60
%
1.67
%
1.32
%
NA
1.37
%
1.84
%
NS 0.
38% 1.
52%
0.18
%
2.53
%
0.0%
1.0%
2.0%
3.0%
4.0%
5.0%
Aircel Airtel BSNL Idea MTS Reliance CDMA Reliance GSM TATA CDMA TATA GSM Vodafone
% D
rop
rate
Drop Rate - Month 1
PMR Data Live Data
TRAI Benchmark ≤ 5%
7.3.2.2 KEY FINDINGS – MONTH 2
1.33
%
1.45
%
NA
1.30
%
1.74
%
NS 0.
49% 1.
46%
1.80
% 2.74
%
1.70
%
1.47
%
NA
1.46
% 2.06
%
NS 0.
54%
2.78
%
1.86
% 2.74
%
0.0%
1.0%
2.0%
3.0%
4.0%
5.0%
Aircel Airtel BSNL Idea MTS Reliance CDMA Reliance GSM TATA CDMA TATA GSM Vodafone
% D
rop
rate
Drop Rate - Month 2
PMR Data Live Data
TRAI Benchmark ≤ 5%
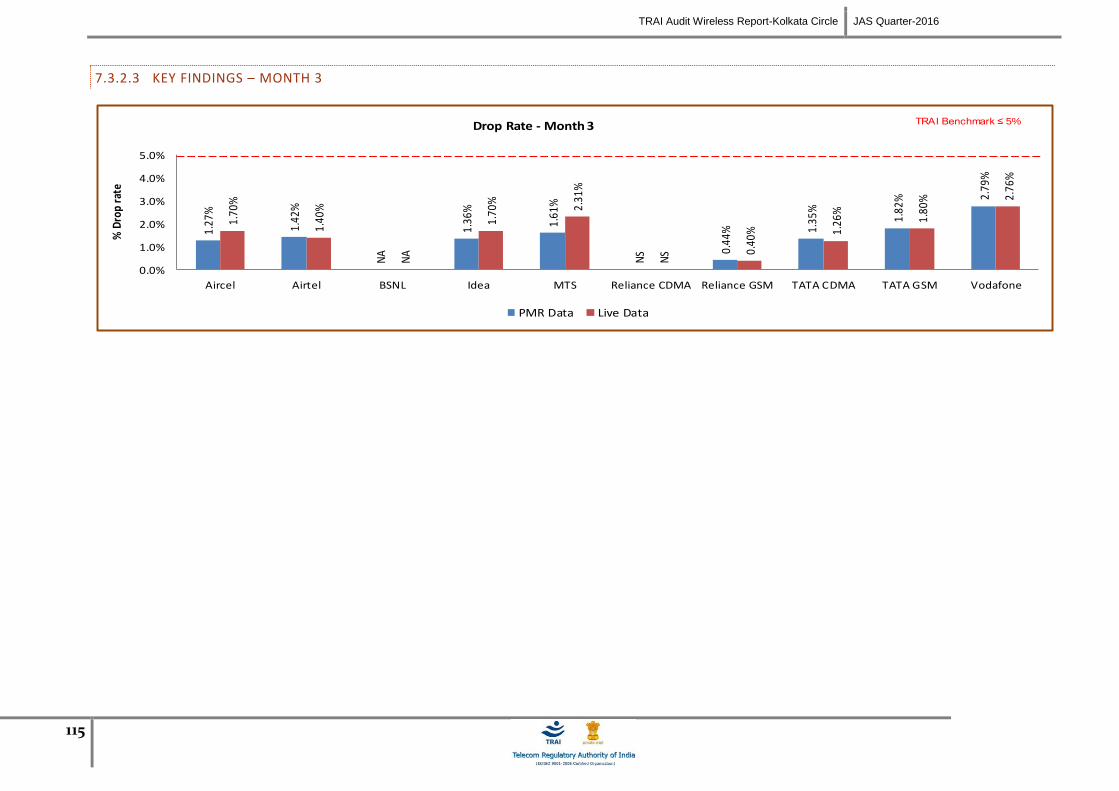
TRAI Audit Wireless Report-Kolkata Circle JAS Quarter-2016
115
7.3.2.3 KEY FINDINGS – MONTH 3
1.27
%
1.42
%
NA
1.36
%
1.61
%
NS 0.
44% 1.
35%
1.82
% 2.79
%
1.70
%
1.40
%
NA
1.70
%
2.31
%
NS 0.
40% 1.
26%
1.80
% 2.76
%
0.0%
1.0%
2.0%
3.0%
4.0%
5.0%
Aircel Airtel BSNL Idea MTS Reliance CDMA Reliance GSM TATA CDMA TATA GSM Vodafone
% D
rop
rate
Drop Rate - Month 3
PMR Data Live Data
TRAI Benchmark ≤ 5%

TRAI Audit Wireless Report-Kolkata Circle JAS Quarter-2016
116
8 PARAMETER DESCRIPTION & DETAILED FINDINGS - WIRELESS DATA SERVICES 3G
8.1 SERVICE ACTIVATION /PROVISIONING FOR 3G
8.1.1 PARAMETER DESCRIPTION
This refers to the activation of services after activation of the SIM. This involves programming the various databases with the customer's information and any
gateways to standard Internet chat or mail services or any data services. The service provider typically sends these settings to the subscriber's handset using SMS or
WAP.
% activation done within 4 hours = Total Time Taken for Activation ×100 Total request time made
8.1.2 KEY FINDINGS
99.9
6%
98.4
0%
96.8
8%
99.9
8%
99.9
8%
99.5
0%
99.9
3%
99.6
6%
100.
00%
100.
00%
99.9
9%
99.9
2%
0.0%10.0%20.0%30.0%40.0%50.0%60.0%70.0%80.0%90.0%
100.0%
Aircel 3G Airtel 3G BSNL 3G Idea 3G Reliance 3G Vodafone 3G% a
ctiv
atio
n do
ne w
ithi
n 4
hour
s
Activation done within 4 hours - Consolidated
PMR Data Live Data
TRAI Benchmark ≥ 95%
All operators met the benchmark for PMR as well as live audit.
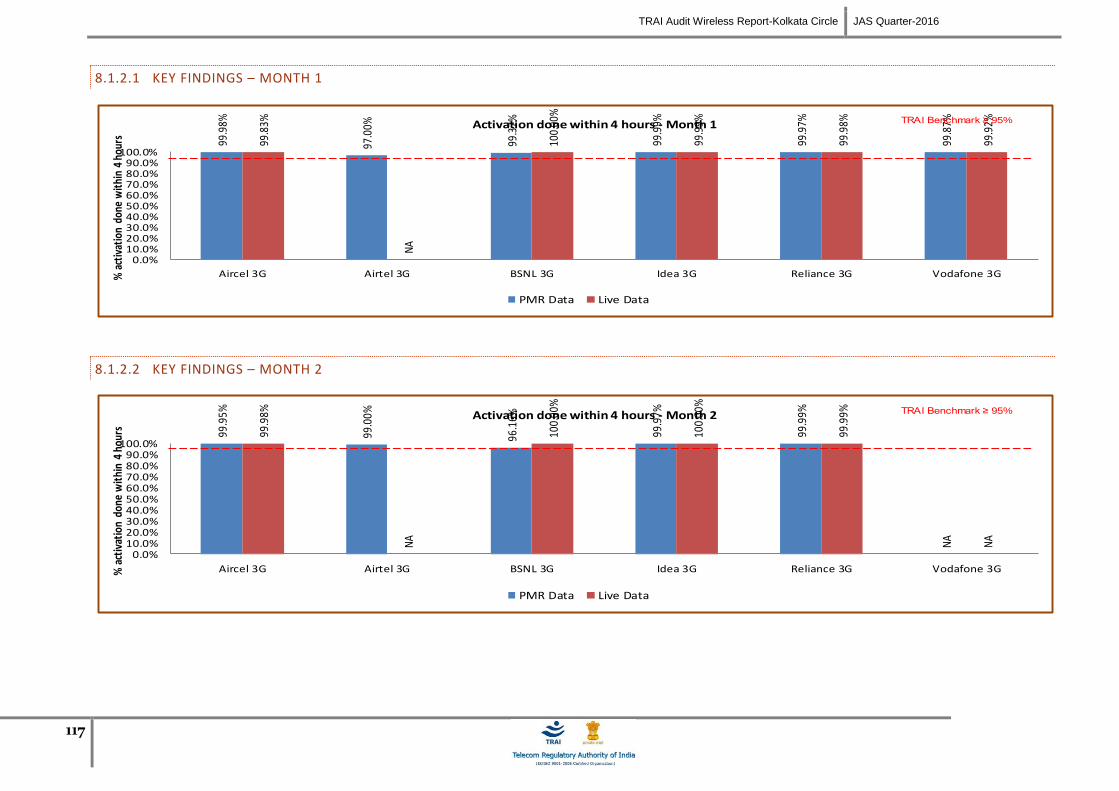
TRAI Audit Wireless Report-Kolkata Circle JAS Quarter-2016
117
8.1.2.1 KEY FINDINGS – MONTH 1
99.9
8%
97.0
0%
99.3
7%
99.9
9%
99.9
7%
99.8
7%
99.8
3%
NA
100.
00%
99.9
9%
99.9
8%
99.9
2%
0.0%10.0%20.0%30.0%40.0%50.0%60.0%70.0%80.0%90.0%
100.0%
Aircel 3G Airtel 3G BSNL 3G Idea 3G Reliance 3G Vodafone 3G% a
ctiv
atio
n do
ne w
ithi
n 4
hour
s Activation done within 4 hours - Month 1
PMR Data Live Data
TRAI Benchmark ≥ 95%
8.1.2.2 KEY FINDINGS – MONTH 2
99.9
5%
99.0
0%
96.1
6%
99.9
7%
99.9
9%
NA
99.9
8%
NA
100.
00%
100.
00%
99.9
9%
NA
0.0%10.0%20.0%30.0%40.0%50.0%60.0%70.0%80.0%90.0%
100.0%
Aircel 3G Airtel 3G BSNL 3G Idea 3G Reliance 3G Vodafone 3G% a
ctiv
atio
n do
ne w
ithi
n 4
hour
s
Activation done within 4 hours - Month 2
PMR Data Live Data
TRAI Benchmark ≥ 95%
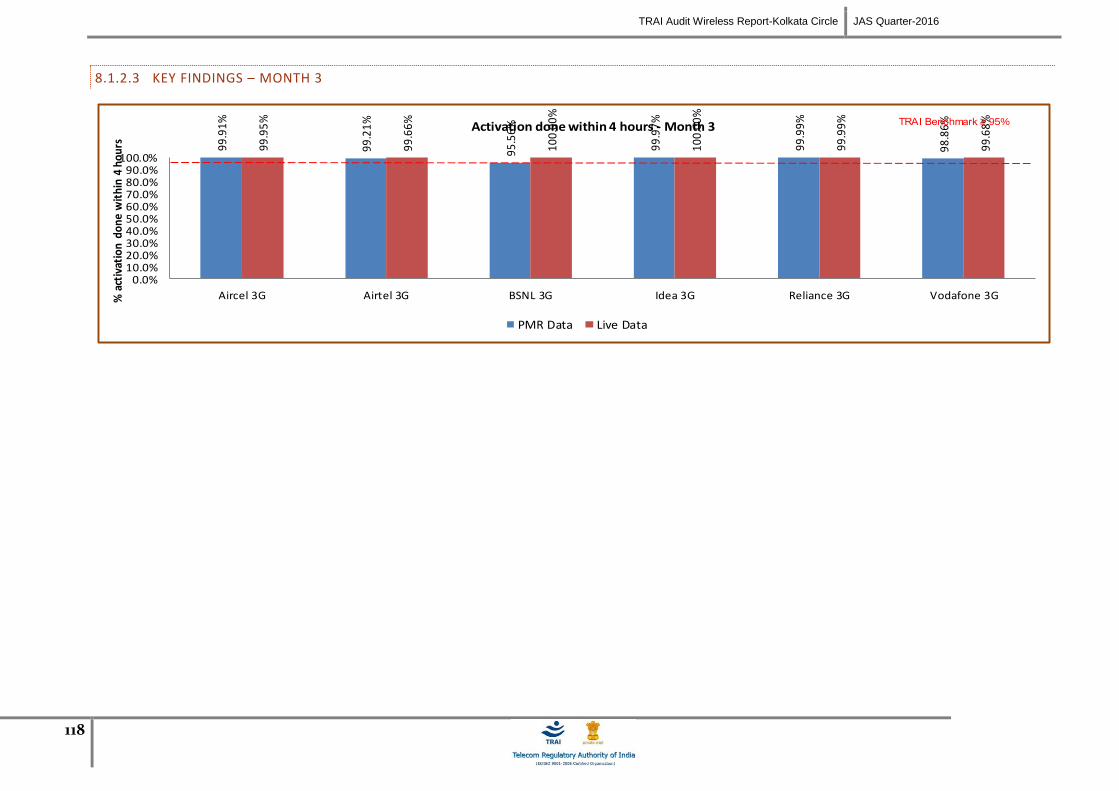
TRAI Audit Wireless Report-Kolkata Circle JAS Quarter-2016
118
8.1.2.3 KEY FINDINGS – MONTH 3
99
.91
%
99
.21
%
95.5
6%
99
.97
%
99
.99
%
98
.86
%
99.9
5%
99
.66
%
100.
00%
100.
00%
99
.99
%
99
.68
%
0.0%10.0%20.0%30.0%40.0%50.0%60.0%70.0%80.0%90.0%
100.0%
Aircel 3G Airtel 3G BSNL 3G Idea 3G Reliance 3G Vodafone 3G% a
ctiv
atio
n d
one
wit
hin
4 h
our
s Activation done within 4 hours - Month 3
PMR Data Live Data
TRAI Benchmark ≥ 95%

TRAI Audit Wireless Report-Kolkata Circle JAS Quarter-2016
119
8.2 PDP CONTEXT ACTIVATION SUCCESS RATE FOR 3G
8.2.1 PARAMETER DESCRIPTION
A Packet Data Protocol (PDP) context specifies access to an external packet-switching network. The data associated with the PDP context contains information such
as the type of packet-switching network, the Mobile Station PDP (MS PDP) address that is the IP address, the reference of Gateway GPRS Support Node (GGSN), and
the requested QoS. A PDP context is handled by the MS, Serving GPRS Support Node (SGSN) and GGSN and is identified by a mobile's PDP address within these
entities. Several PDP contexts can be activated at the same time within a given MS.
Measurement
This measurement provides the number of successfully completed PDP context activations. For these context activations, the GGSN is updated successfully and a
report of PDP context activation success is generated at GGSN.
PDP Context Activation Success Rate (%) = Number of successfully completed PDP context activations ×100
Total attempts of context activation
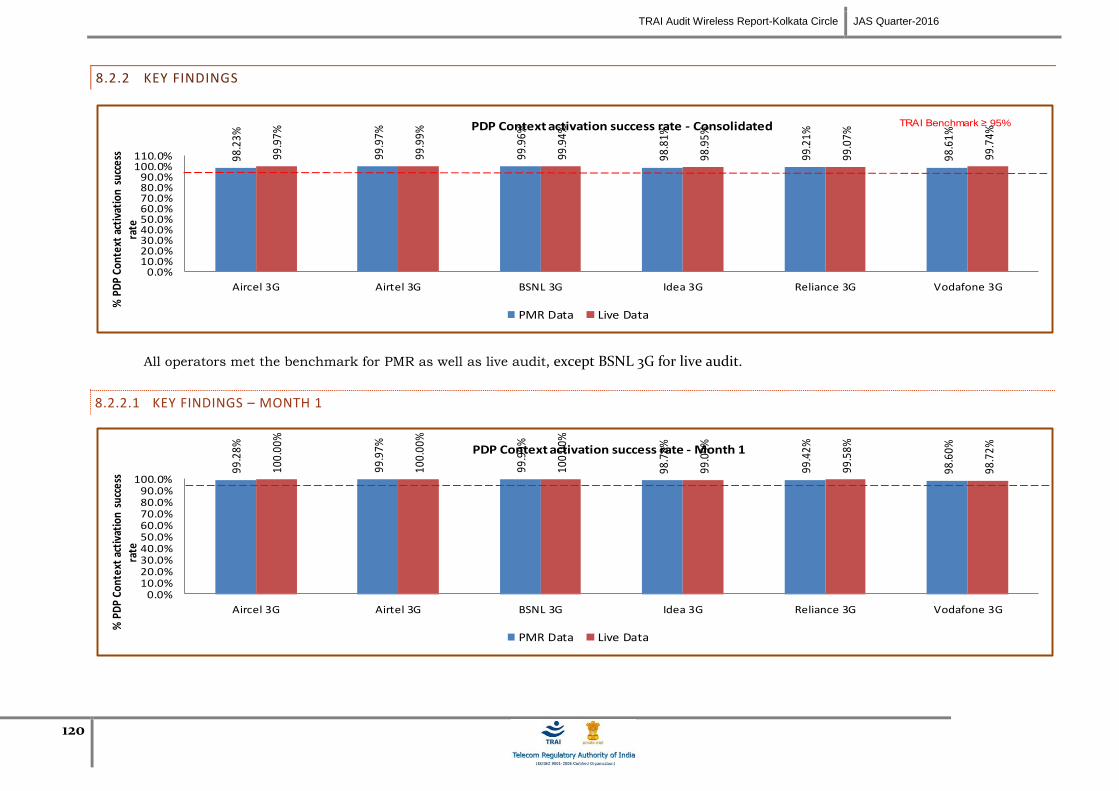
TRAI Audit Wireless Report-Kolkata Circle JAS Quarter-2016
120
8.2.2 KEY FINDINGS
98.2
3%
99.9
7%
99.9
6%
98.8
1%
99.2
1%
98.6
1%
99.9
7%
99.9
9%
99.9
4%
98.9
5%
99.0
7%
99.7
4%
0.0%10.0%20.0%30.0%40.0%50.0%60.0%70.0%80.0%90.0%
100.0%110.0%
Aircel 3G Airtel 3G BSNL 3G Idea 3G Reliance 3G Vodafone 3G
% P
DP
Cont
ext
acti
vati
on s
ucce
ss
rate
PDP Context activation success rate - Consolidated
PMR Data Live Data
TRAI Benchmark ≥ 95%
All operators met the benchmark for PMR as well as live audit, except BSNL 3G for live audit.
8.2.2.1 KEY FINDINGS – MONTH 1
99.2
8%
99.9
7%
99.9
9%
98.7
8%
99.4
2%
98.6
0%
100.
00%
100.
00%
100.
00%
99.0
9%
99.5
8%
98.7
2%
0.0%10.0%20.0%30.0%40.0%50.0%60.0%70.0%80.0%90.0%
100.0%
Aircel 3G Airtel 3G BSNL 3G Idea 3G Reliance 3G Vodafone 3G
% P
DP
Cont
ext
acti
vati
on s
ucce
ss
rate
PDP Context activation success rate - Month 1
PMR Data Live Data
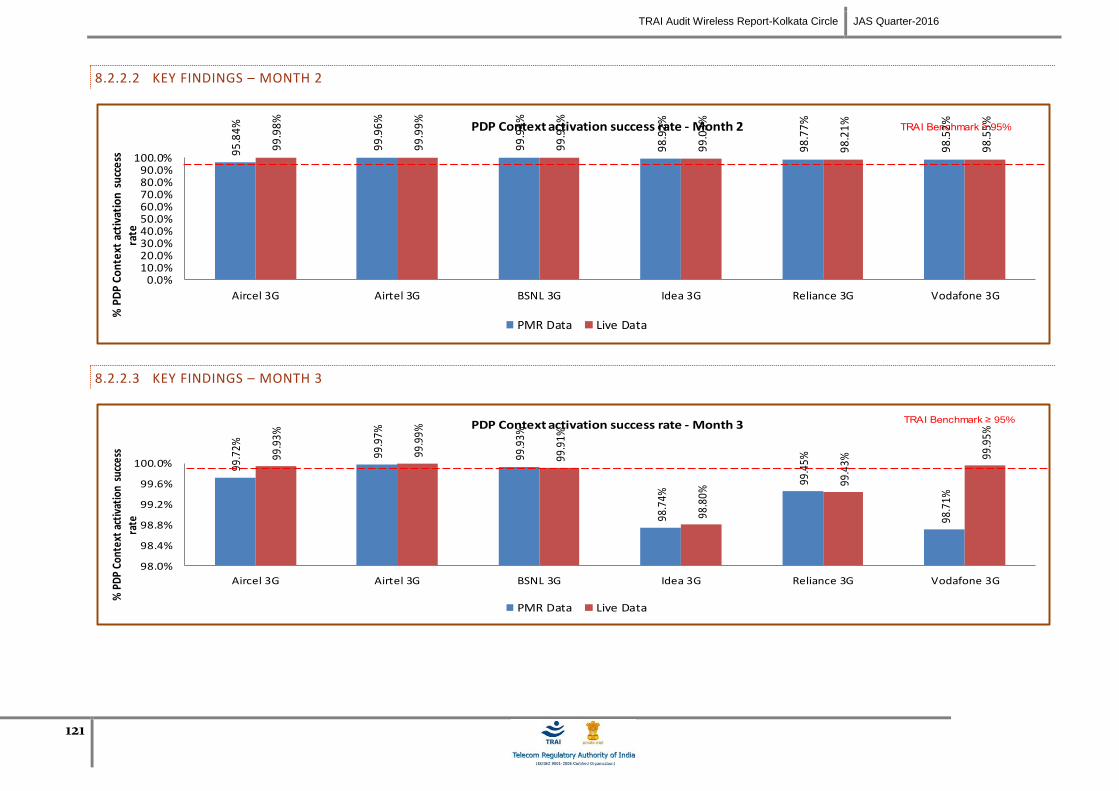
TRAI Audit Wireless Report-Kolkata Circle JAS Quarter-2016
121
8.2.2.2 KEY FINDINGS – MONTH 2
95
.84%
99.9
6%
99
.94
%
98
.92
%
98
.77
%
98
.52
%
99
.98
%
99
.99
%
99
.92
%
99
.03
%
98
.21
%
98
.55
%
0.0%10.0%20.0%30.0%40.0%50.0%60.0%70.0%80.0%90.0%
100.0%
Aircel 3G Airtel 3G BSNL 3G Idea 3G Reliance 3G Vodafone 3G
% P
DP
Co
nte
xt a
ctiv
atio
n s
ucc
ess
ra
te
PDP Context activation success rate - Month 2
PMR Data Live Data
TRAI Benchmark ≥ 95%
8.2.2.3 KEY FINDINGS – MONTH 3
99.7
2%
99.9
7%
99.9
3%
98.7
4%
99.4
5%
98.7
1%
99.9
3%
99.9
9%
99.9
1%
98.8
0%
99.4
3%
99.9
5%
98.0%
98.4%
98.8%
99.2%
99.6%
100.0%
Aircel 3G Airtel 3G BSNL 3G Idea 3G Reliance 3G Vodafone 3G
% P
DP
Cont
ext
acti
vati
on s
ucce
ss
rate
PDP Context activation success rate - Month 3
PMR Data Live Data
TRAI Benchmark ≥ 95%
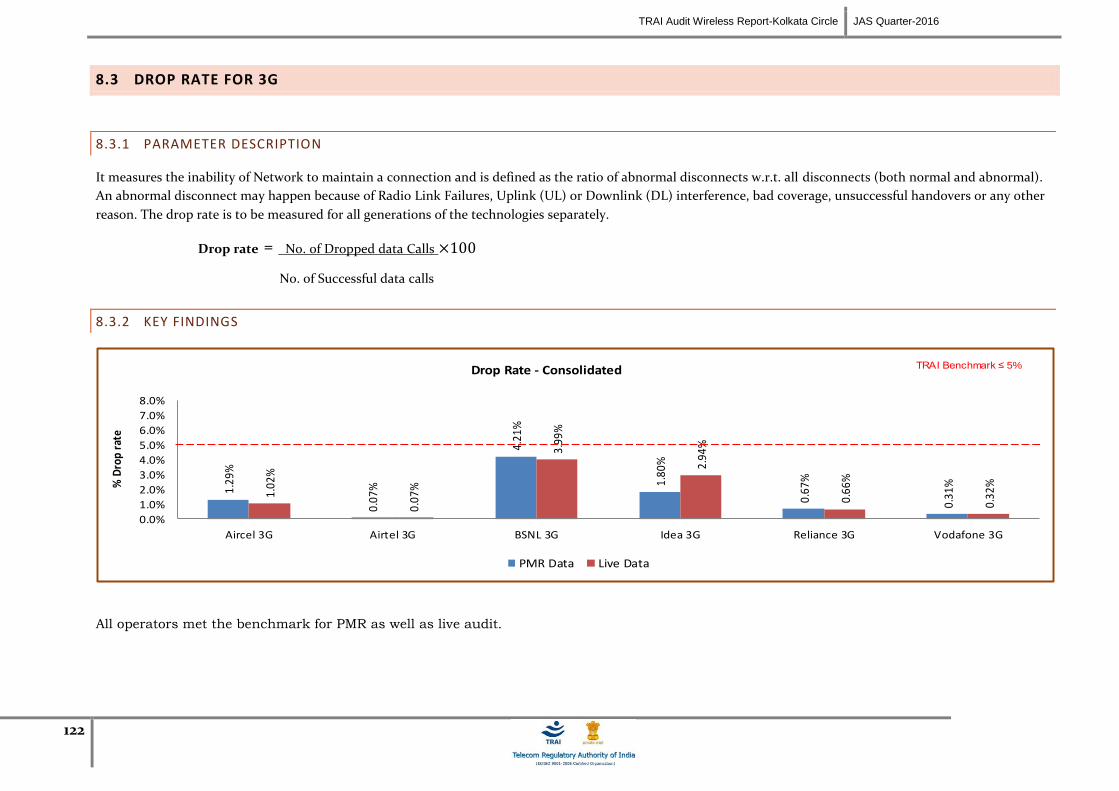
TRAI Audit Wireless Report-Kolkata Circle JAS Quarter-2016
122
8.3 DROP RATE FOR 3G
8.3.1 PARAMETER DESCRIPTION
It measures the inability of Network to maintain a connection and is defined as the ratio of abnormal disconnects w.r.t. all disconnects (both normal and abnormal).
An abnormal disconnect may happen because of Radio Link Failures, Uplink (UL) or Downlink (DL) interference, bad coverage, unsuccessful handovers or any other
reason. The drop rate is to be measured for all generations of the technologies separately.
Drop rate = No. of Dropped data Calls ×100
No. of Successful data calls
8.3.2 KEY FINDINGS
1.29
%
0.07
%
4.21
%
1.80
%
0.67
%
0.31
%
1.02
%
0.07
%
3.99
%
2.94
%
0.66
%
0.32
%
0.0%
1.0%
2.0%
3.0%
4.0%
5.0%
6.0%
7.0%
8.0%
Aircel 3G Airtel 3G BSNL 3G Idea 3G Reliance 3G Vodafone 3G
% D
rop
rate
Drop Rate - Consolidated
PMR Data Live Data
TRAI Benchmark ≤ 5%
All operators met the benchmark for PMR as well as live audit.

TRAI Audit Wireless Report-Kolkata Circle JAS Quarter-2016
123
8.3.2.1 KEY FINDINGS – MONTH 1
1.19
%
0.06
%
4.29
%
1.39
%
0.70
%
0.32
%
0.98
%
0.06
%
4.05
%
3.11
%
0.67
%
0.32
%
0.0%
1.0%
2.0%
3.0%
4.0%
5.0%
6.0%
7.0%
8.0%
Aircel 3G Airtel 3G BSNL 3G Idea 3G Reliance 3G Vodafone 3G
% D
rop
rate
Drop Rate - Month 1
PMR Data Live Data
TRAI Benchmark ≤ 5%
8.3.2.2 KEY FINDINGS – MONTH 2
1.42
%
0.08
%
4.30
%
2.15
%
0.68
%
0.31
%
1.12
%
0.08
%
3.91
%
2.89
%
0.73
%
0.32
%
0.0%
1.0%
2.0%
3.0%
4.0%
5.0%
6.0%
7.0%
8.0%
Aircel 3G Airtel 3G BSNL 3G Idea 3G Reliance 3G Vodafone 3G
% D
rop
rate
Drop Rate - Month 2
PMR Data Live Data
TRAI Benchmark ≤ 5%
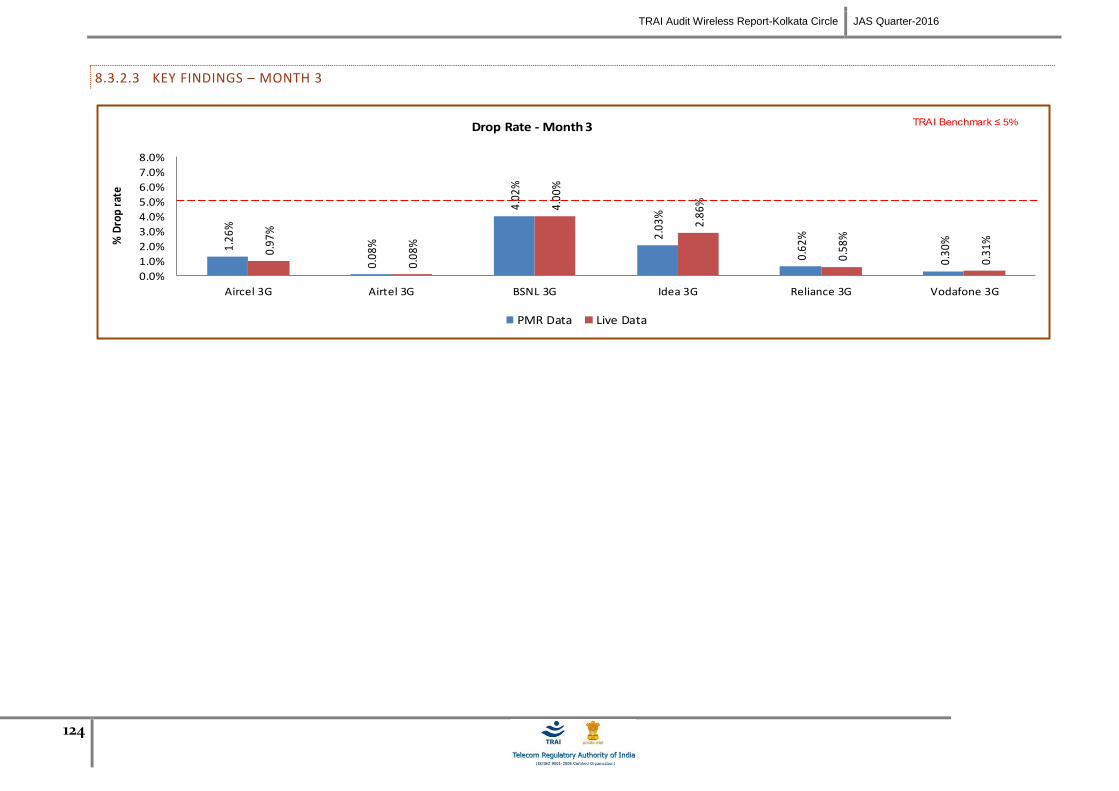
TRAI Audit Wireless Report-Kolkata Circle JAS Quarter-2016
124
8.3.2.3 KEY FINDINGS – MONTH 3
1.26
%
0.08
%
4.02
%
2.03
%
0.62
%
0.30
%
0.97
%
0.08
%
4.00
%
2.86
%
0.58
%
0.31
%
0.0%
1.0%
2.0%
3.0%
4.0%
5.0%
6.0%
7.0%
8.0%
Aircel 3G Airtel 3G BSNL 3G Idea 3G Reliance 3G Vodafone 3G
% D
rop
rate
Drop Rate - Month 3
PMR Data Live Data
TRAI Benchmark ≤ 5%
TRAI Audit Wireless Report-Kolkata Circle JAS Quarter-2016
125
9 PARAMETER DESCRIPTION AND DETAILED FINDINGS – NON-NETWORK PARAMETERS
9.1 METERING AND BILLING CREDIBILITY
The billing complaints for postpaid are calculated by averaging over one billing cycle in a quarter. For example, there are three billing cycles in a quarter, the data for
each billing cycle is calculated separately and then averaged over.
The charging complaints for prepaid are calculated by taking all complaints in a quarter.
9.1.1 PARAMETER DESCRIPTION
All the complaints related to billing/ charging as per clause 3.7.2 of QoS regulation of 20th
December, 2009 were covered. The types of billing complaints covered are
listed below.
Payments made and not credited to the subscriber account
Payment made on time but late payment charge levied wrongly
Wrong roaming charges
Double charges
Charging for toll free services
Local calls charged/billed as STD/ISD or vice versa
Calls or messages made disputed
Validity related complaints
Credit agreed to be given in resolution of complaint, but not accounted in the bill
Charging for services provided without consent
Charging not as per tariff plans or top up vouchers/ special packs etc.
Overcharging or undercharging

TRAI Audit Wireless Report-Kolkata Circle JAS Quarter-2016
126
In addition to the above, any billing complaint which leads to billing error, waiver, refund, credit, or any adjustment is also considered as valid billing complaint for calculating the number of disputed bills.
Computational Methodology:
Billing complaints per 100 bills issued (Post-paid) = (Total billing complaints** received during the relevant billing cycle / Total bills generated*
during the relevant billing cycle)*100
*Operator to include all types of bills generated for customers. This would include printed bills, online bills and any other forms of bills generated
**Billing complaints here shall include only dispute related issues (including those that may arise because of a lack of awareness at the subscribers’
end). It does not include any provisional issues (such as delayed dispatch of billing statements, etc.) in which the operator has opened a ticket
internally.
Charging complaints per 100 subscribers (Prepaid) = (Total charging complaints received during the quarter/ Total number of subscribers
reported by the operator at the end of the quarter) * 100
TRAI Benchmark: <= 0.1%
Audit Procedure:
Audit of billing complaint details for the complaints received during the quarter and used for arriving at the benchmark reported to TRAI would be
conducted
For Postpaid, the total billing complaints would be audited by averaging over billing cycles in a quarter
For Prepaid, the data of total charging complaints in a quarter would be taken for the purpose of audit
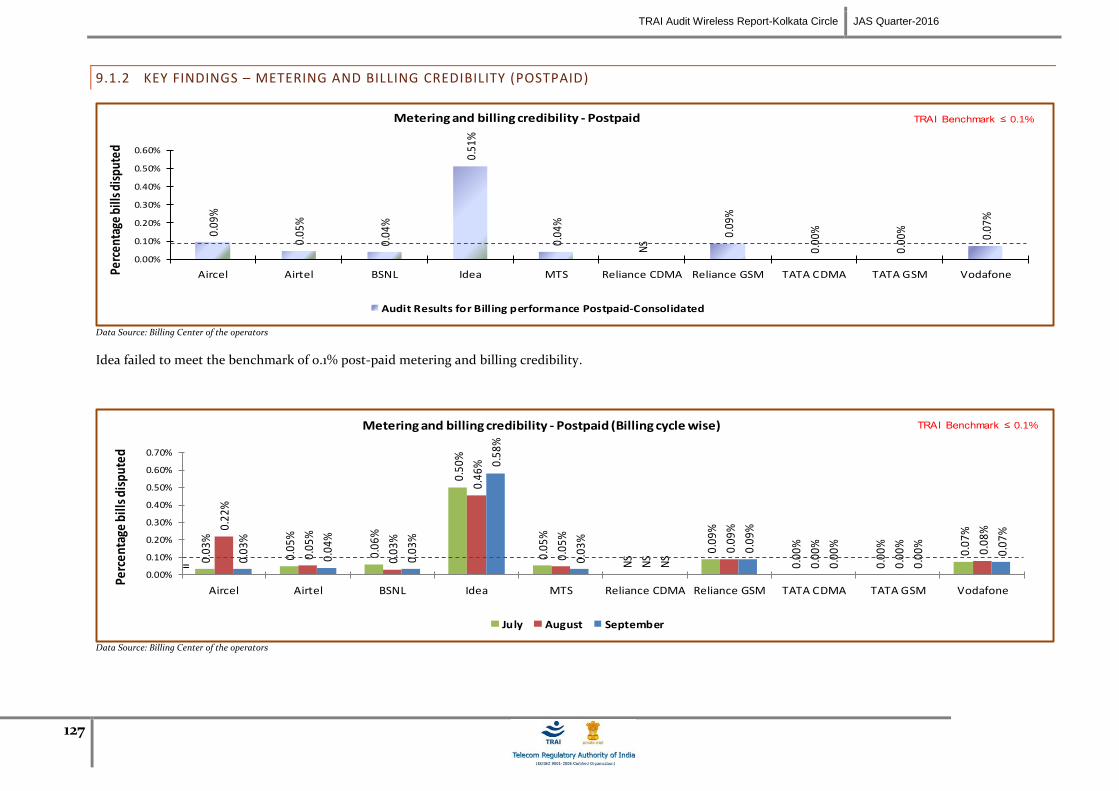
TRAI Audit Wireless Report-Kolkata Circle JAS Quarter-2016
127
9.1.2 KEY FINDINGS – METERING AND BILLING CREDIBILITY (POSTPAID)
0.09
%
0.05
%
0.04
%
0.51
%
0.04
%
NS
0.09
%
0.00
%
0.00
%
0.07
%
0.00%
0.10%
0.20%
0.30%
0.40%
0.50%
0.60%
Aircel Airtel BSNL Idea MTS Reliance CDMA Reliance GSM TATA CDMA TATA GSM VodafonePerc
enta
ge b
ills d
ispu
ted
Metering and billing credibility - Postpaid
Audit Results for Billing performance Postpaid-Consolidated
TRAI Benchmark ≤ 0.1%
Data Source: Billing Center of the operators
Idea failed to meet the benchmark of 0.1% post-paid metering and billing credibility.
0.03
%
0.05
%
0.06
%
0.50
%
0.05
%
NS
0.09
%
0.00
%
0.00
%
0.07
%0.22
%
0.05
%
0.03
%
0.46
%
0.05
%
NS
0.09
%
0.00
%
0.00
%
0.08
%
0.03
%
0.04
%
0.03
%
0.58
%
0.03
%
NS
0.09
%
0.00
%
0.00
%
0.07
%
0.00%
0.10%
0.20%
0.30%
0.40%
0.50%
0.60%
0.70%
Aircel Airtel BSNL Idea MTS Reliance CDMA Reliance GSM TATA CDMA TATA GSM Vodafone
Perc
enta
ge b
ills d
ispu
ted
Metering and billing credibility - Postpaid (Billing cycle wise)
July August September
=
TRAI Benchmark ≤ 0.1%
Data Source: Billing Center of the operators
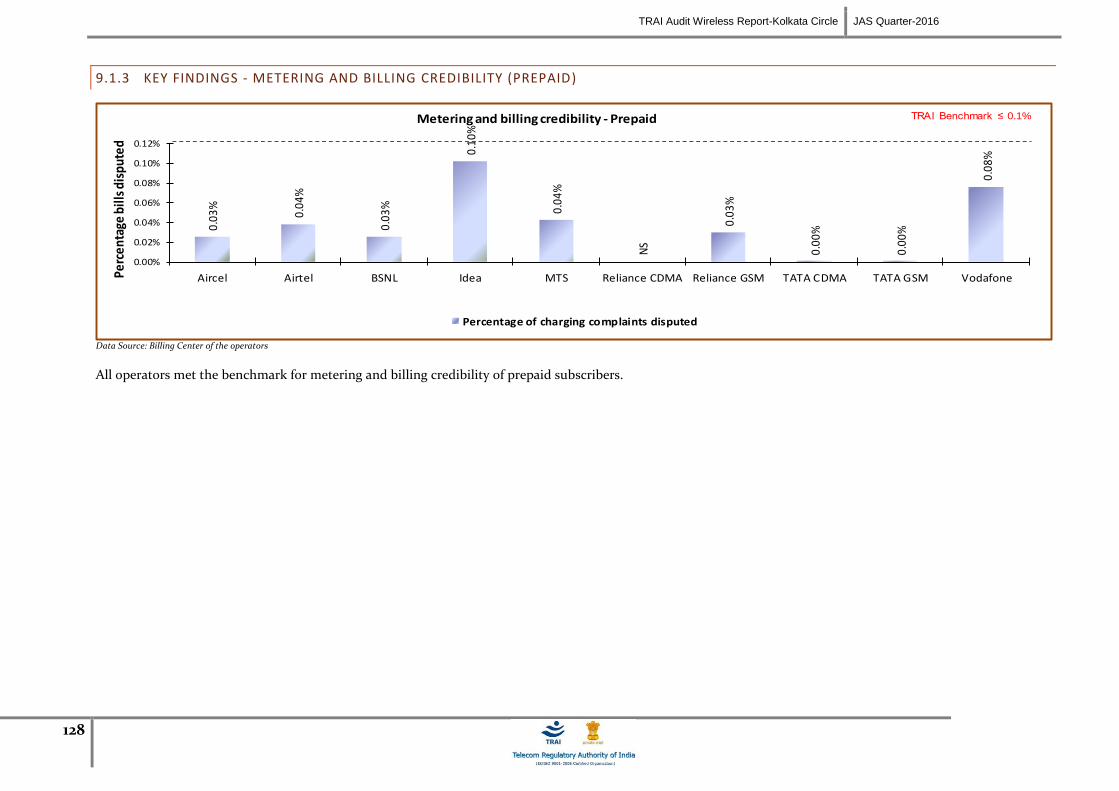
TRAI Audit Wireless Report-Kolkata Circle JAS Quarter-2016
128
9.1.3 KEY FINDINGS - METERING AND BILLING CREDIBILITY (PREPAID)
0.03
%
0.04
%
0.03
%
0.10
%
0.04
%
NS
0.03
%
0.00
%
0.00
%
0.08
%
0.00%
0.02%
0.04%
0.06%
0.08%
0.10%
0.12%
Aircel Airtel BSNL Idea MTS Reliance CDMA Reliance GSM TATA CDMA TATA GSM VodafonePerc
enta
ge b
ills d
ispu
ted
Metering and billing credibility - Prepaid
Percentage of charging complaints disputed
TRAI Benchmark ≤ 0.1%
Data Source: Billing Center of the operators
All operators met the benchmark for metering and billing credibility of prepaid subscribers.
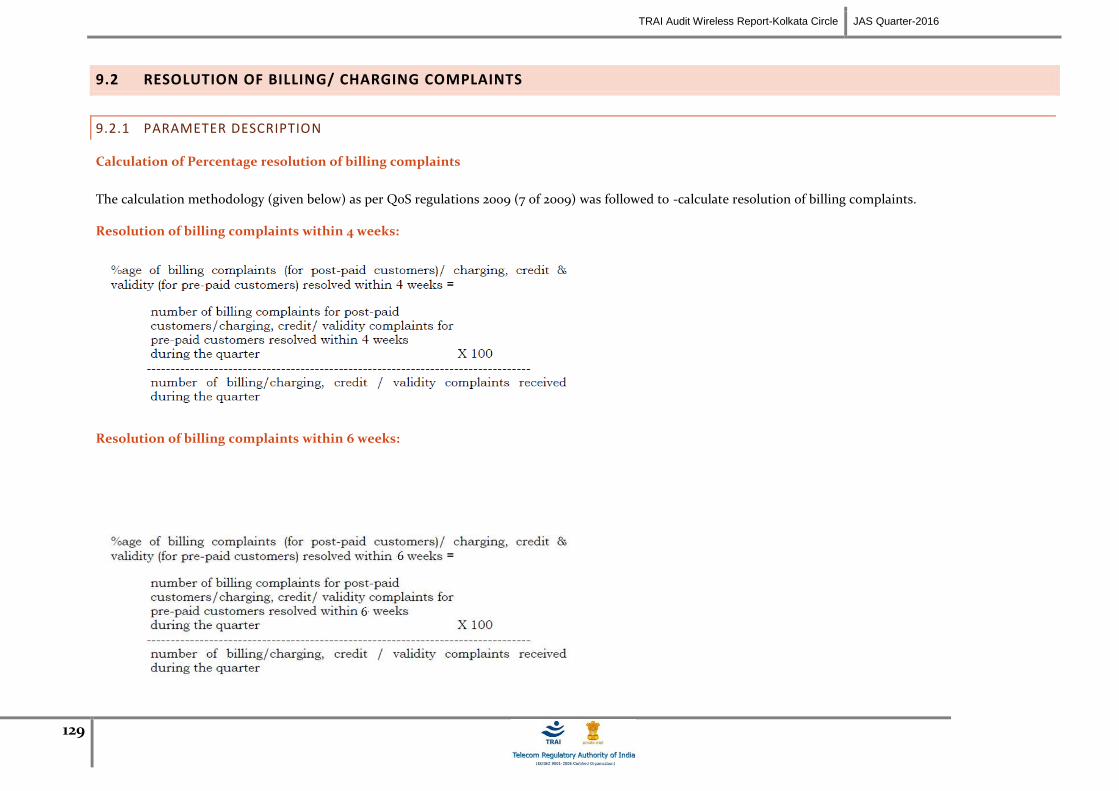
TRAI Audit Wireless Report-Kolkata Circle JAS Quarter-2016
129
9.2 RESOLUTION OF BILLING/ CHARGING COMPLAINTS
9.2.1 PARAMETER DESCRIPTION
Calculation of Percentage resolution of billing complaints
The calculation methodology (given below) as per QoS regulations 2009 (7 of 2009) was followed to -calculate resolution of billing complaints.
Resolution of billing complaints within 4 weeks:
Resolution of billing complaints within 6 weeks:
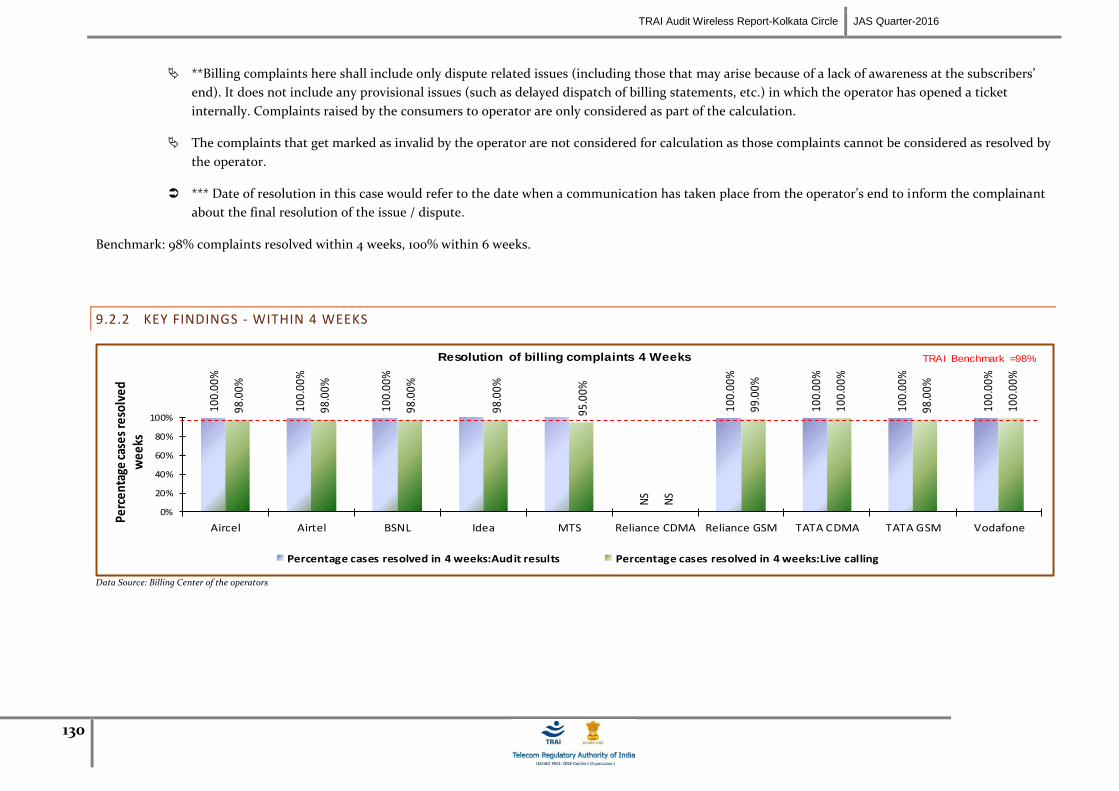
TRAI Audit Wireless Report-Kolkata Circle JAS Quarter-2016
130
**Billing complaints here shall include only dispute related issues (including those that may arise because of a lack of awareness at the subscribers’
end). It does not include any provisional issues (such as delayed dispatch of billing statements, etc.) in which the operator has opened a ticket
internally. Complaints raised by the consumers to operator are only considered as part of the calculation.
The complaints that get marked as invalid by the operator are not considered for calculation as those complaints cannot be considered as resolved by
the operator.
*** Date of resolution in this case would refer to the date when a communication has taken place from the operator’s end to inform the complainant
about the final resolution of the issue / dispute.
Benchmark: 98% complaints resolved within 4 weeks, 100% within 6 weeks.
9.2.2 KEY FINDINGS - WITHIN 4 WEEKS
100.
00%
100.
00%
100.
00%
NS
100.
00%
100.
00%
100.
00%
100.
00%
98.0
0%
98.0
0%
98.0
0%
98.0
0%
95.0
0%
NS
99.0
0%
100.
00%
98.0
0%
100.
00%
0%
20%
40%
60%
80%
100%
Aircel Airtel BSNL Idea MTS Reliance CDMA Reliance GSM TATA CDMA TATA GSM Vodafone
Perc
enta
ge ca
ses
reso
lved
w
eeks
Resolution of billing complaints 4 Weeks
Percentage cases resolved in 4 weeks:Audit results Percentage cases resolved in 4 weeks:Live calling
TRAI Benchmark =98%
Data Source: Billing Center of the operators
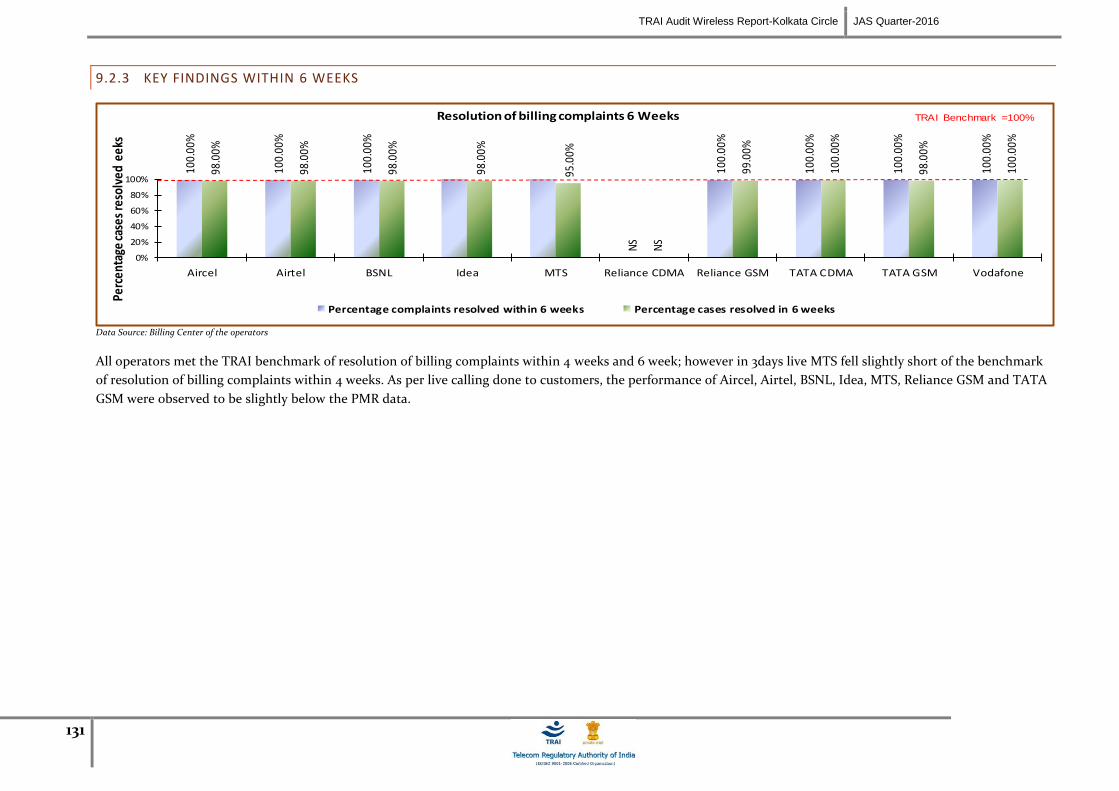
TRAI Audit Wireless Report-Kolkata Circle JAS Quarter-2016
131
9.2.3 KEY FINDINGS WITHIN 6 WEEKS
100.
00%
100.
00%
100.
00%
NS
100.
00%
100.
00%
100.
00%
100.
00%
98.0
0%
98.0
0%
98.0
0%
98.0
0%
95.0
0%
NS
99.0
0%
100.
00%
98.0
0%
100.
00%
0%
20%
40%
60%
80%
100%
Aircel Airtel BSNL Idea MTS Reliance CDMA Reliance GSM TATA CDMA TATA GSM Vodafone
Perc
enta
ge ca
ses
reso
lved
eek
sResolution of billing complaints 6 Weeks
Percentage complaints resolved within 6 weeks Percentage cases resolved in 6 weeks
TRAI Benchmark =100%
Data Source: Billing Center of the operators
All operators met the TRAI benchmark of resolution of billing complaints within 4 weeks and 6 week; however in 3days live MTS fell slightly short of the benchmark
of resolution of billing complaints within 4 weeks. As per live calling done to customers, the performance of Aircel, Airtel, BSNL, Idea, MTS, Reliance GSM and TATA
GSM were observed to be slightly below the PMR data.
TRAI Audit Wireless Report-Kolkata Circle JAS Quarter-2016
132
9.3 PERIOD OF APPLYING CREDIT/WAVIER
9.3.1 PARAMETER DESCRIPTION
Computational Methodology:
Period of applying credit waiver = (number of cases where credit waiver is applied within 7 days/ total number of cases eligible for credit waiver) * 100
TRAI Benchmark:
Period of applying credit waiver within 7 days: 100%
Audit Procedure:
Operator to provide details of:-
List of all eligible cases along with
Date of applying credit waiver to all the eligible cases.
Date of resolution of complaint for all eligible cases
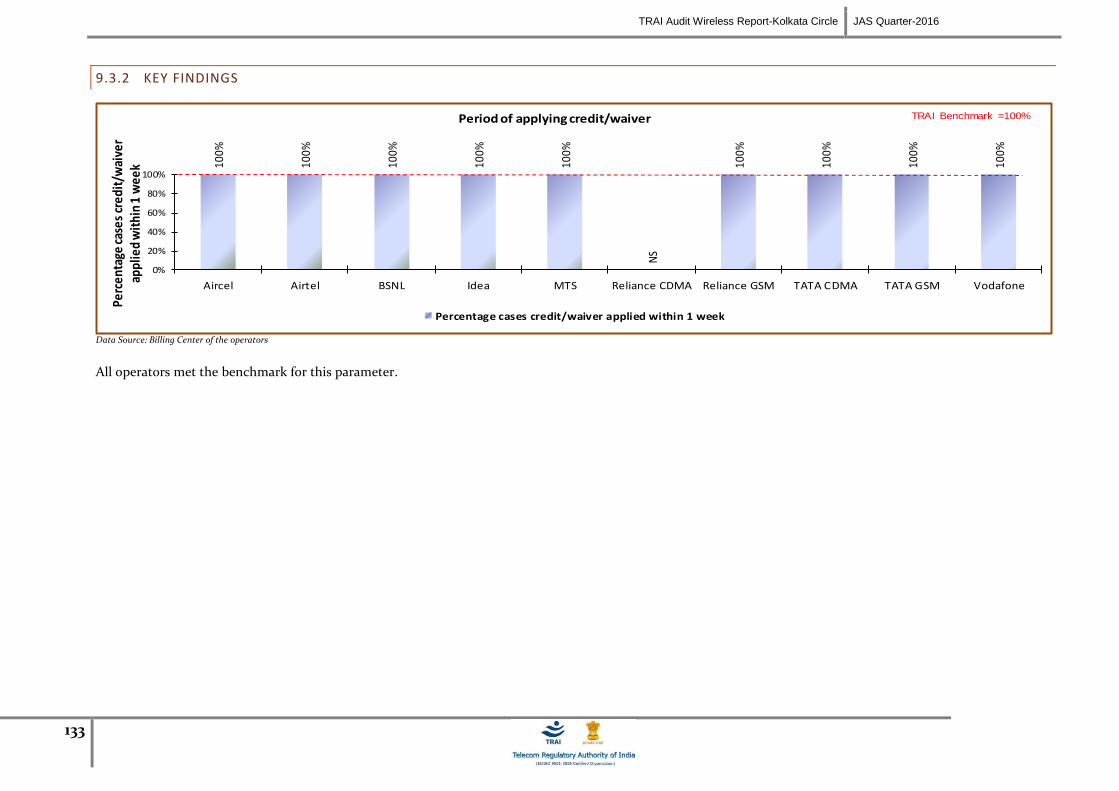
TRAI Audit Wireless Report-Kolkata Circle JAS Quarter-2016
133
9.3.2 KEY FINDINGS
100%
100%
100%
100%
100%
NS
100%
100%
100%
100%
0%
20%
40%
60%
80%
100%
Aircel Airtel BSNL Idea MTS Reliance CDMA Reliance GSM TATA CDMA TATA GSM Vodafone
Perc
enta
ge ca
ses
cred
it/w
aive
r ap
plie
d w
ithi
n 1
wee
kPeriod of applying credit/waiver
Percentage cases credit/waiver applied within 1 week
TRAI Benchmark =100%
Data Source: Billing Center of the operators
All operators met the benchmark for this parameter.

TRAI Audit Wireless Report-Kolkata Circle JAS Quarter-2016
134
9.4 CALL CENTRE PERFORMANCE-IVR
9.4.1 PARAMETER DESCRIPTION
Computational Methodology:
Call centre performance IVR = (Number of calls connected and answered by IVR/ All calls attempted to IVR) * 100
TRAI Benchmark: >= 95%
Audit Procedure:
Operators provide details of the following from their central call centre/ customer service database:
Total calls connected and answered by IVR
Total calls attempted to IVR
Also live calling is done to test the calls connected and answered by IVR
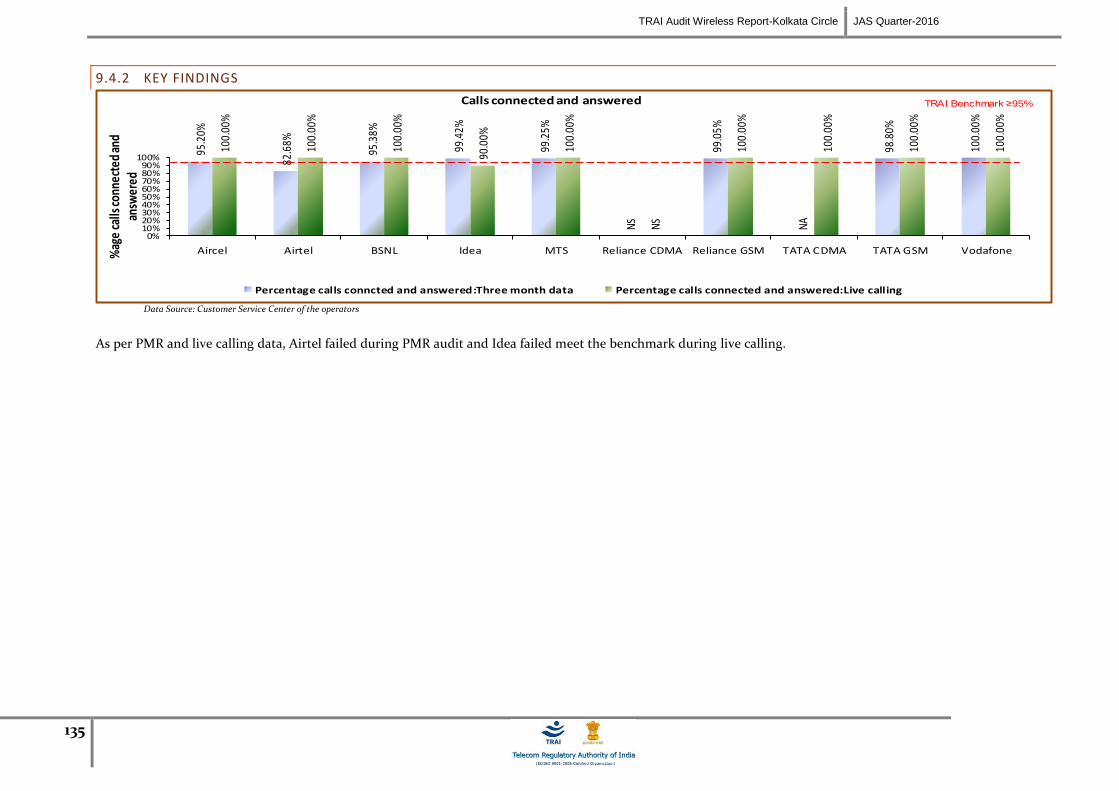
TRAI Audit Wireless Report-Kolkata Circle JAS Quarter-2016
135
9.4.2 KEY FINDINGS
95.2
0%
82.6
8%
95.3
8%
99.4
2%
99.2
5%
NS
99.0
5%
NA
98.8
0%
100.
00%
100.
00%
100.
00%
100.
00%
90.0
0%
100.
00%
NS
100.
00%
100.
00%
100.
00%
100.
00%
0%10%20%30%40%50%60%70%80%90%
100%
Aircel Airtel BSNL Idea MTS Reliance CDMA Reliance GSM TATA CDMA TATA GSM Vodafone%ag
e ca
lls co
nnec
ted
and
answ
ered
Calls connected and answered
Percentage calls conncted and answered:Three month data Percentage calls connected and answered:Live calling
TRAI Benchmark ≥95%
Data Source: Customer Service Center of the operators
As per PMR and live calling data, Airtel failed during PMR audit and Idea failed meet the benchmark during live calling.
TRAI Audit Wireless Report-Kolkata Circle JAS Quarter-2016
136
9.5 CALL CENTRE PERFORMANCE-VOICE TO VOICE
9.5.1 PARAMETER DESCRIPTION
Computational Methodology:
Call centre performance Voice to Voice = (Number of calls answered by operator within 90 seconds/ All calls attempted to connect to the operator) *
100
Audit Procedure:
Operators provide details of the following from their central call centre/ customer service database:
Total calls connected and answered by operator within 90 seconds
Total calls attempted to connect to the operator
Also live calling was done to test the calls answered within 90 seconds by the operator
Benchmark: 95% calls to be answered within 90 seconds
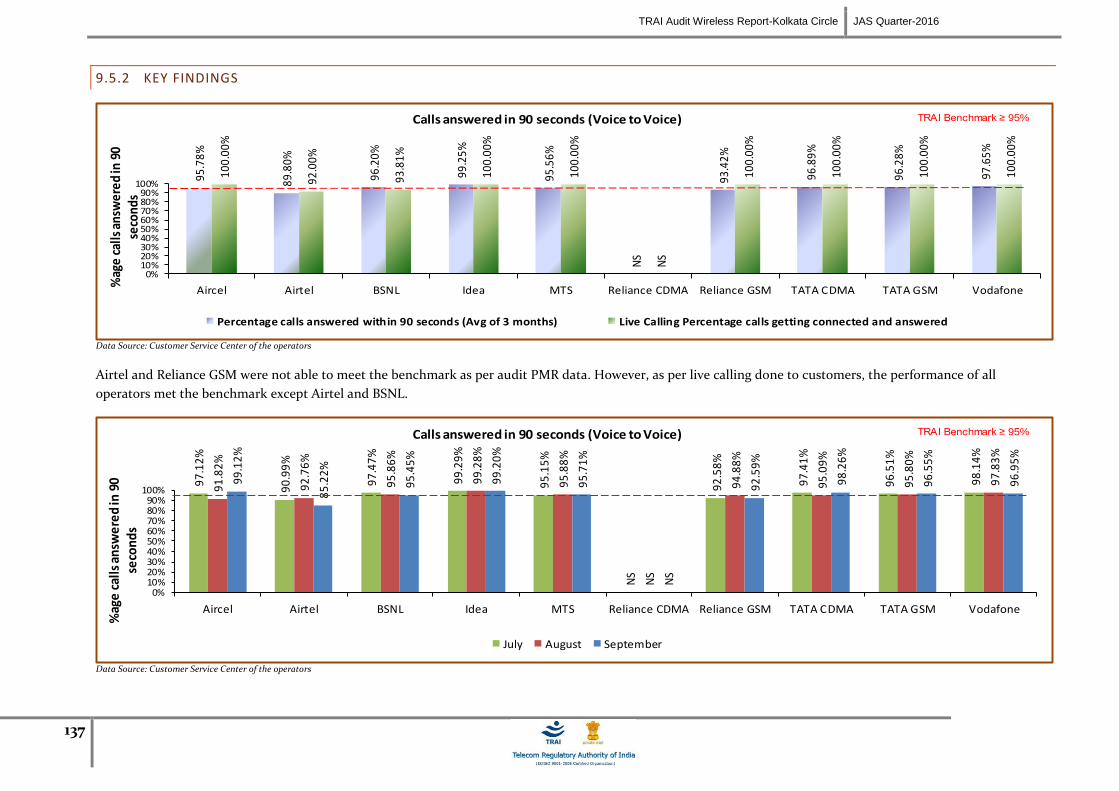
TRAI Audit Wireless Report-Kolkata Circle JAS Quarter-2016
137
9.5.2 KEY FINDINGS
95.7
8%
89.8
0%
96.2
0%
99.2
5%
95.5
6%
NS
93.4
2%
96.8
9%
96.2
8%
97.6
5%
100.
00%
92.0
0%
93.8
1%
100.
00%
100.
00%
NS
100.
00%
100.
00%
100.
00%
100.
00%
0%10%20%30%40%50%60%70%80%90%
100%
Aircel Airtel BSNL Idea MTS Reliance CDMA Reliance GSM TATA CDMA TATA GSM Vodafone
%ag
e ca
lls a
nsw
ered
in 9
0 se
cond
sCalls answered in 90 seconds (Voice to Voice)
Percentage calls answered within 90 seconds (Avg of 3 months) Live Calling Percentage calls getting connected and answered
TRAI Benchmark ≥ 95%
Data Source: Customer Service Center of the operators
Airtel and Reliance GSM were not able to meet the benchmark as per audit PMR data. However, as per live calling done to customers, the performance of all
operators met the benchmark except Airtel and BSNL.
97
.12
%
90
.99
%
97
.47
%
99
.29
%
95
.15
%
NS
92
.58
%
97
.41
%
96
.51
%
98
.14
%
91
.82
%
92
.76
%
95
.86
%
99
.28
%
95
.88
%
NS
94
.88
%
95
.09
%
95
.80
%
97
.83
%
99
.12
%
85
.22
%
95
.45
%
99
.20
%
95
.71
%
NS
92
.59
%
98
.26
%
96
.55
%
96
.95
%
0%10%20%30%40%50%60%70%80%90%
100%
Aircel Airtel BSNL Idea MTS Reliance CDMA Reliance GSM TATA CDMA TATA GSM Vodafone
%ag
e c
alls
an
swe
red
in 9
0 se
con
ds
Calls answered in 90 seconds (Voice to Voice)
July August September
TRAI Benchmark ≥ 95%
Data Source: Customer Service Center of the operators
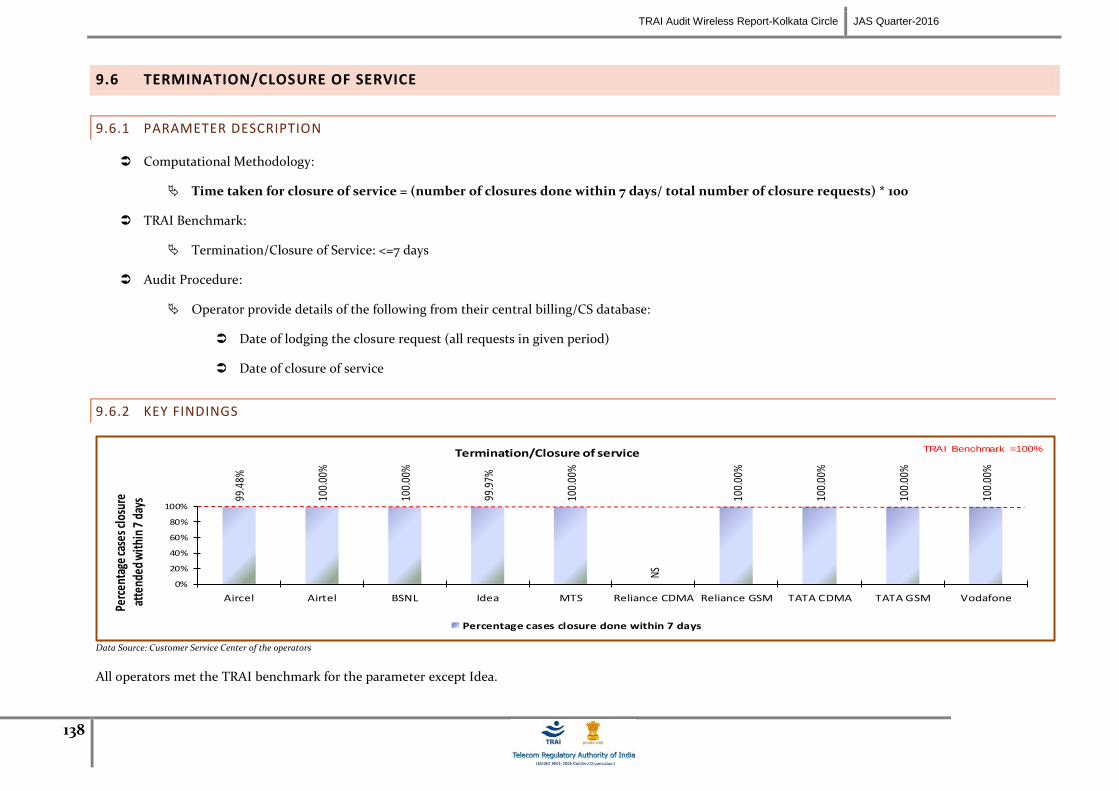
TRAI Audit Wireless Report-Kolkata Circle JAS Quarter-2016
138
9.6 TERMINATION/CLOSURE OF SERVICE
9.6.1 PARAMETER DESCRIPTION
Computational Methodology:
Time taken for closure of service = (number of closures done within 7 days/ total number of closure requests) * 100
TRAI Benchmark:
Termination/Closure of Service: <=7 days
Audit Procedure:
Operator provide details of the following from their central billing/CS database:
Date of lodging the closure request (all requests in given period)
Date of closure of service
9.6.2 KEY FINDINGS
99.4
8%
100.
00%
100.
00%
99.9
7%
100.
00%
NS
100.
00%
100.
00%
100.
00%
100.
00%
0%
20%
40%
60%
80%
100%
Aircel Airtel BSNL Idea MTS Reliance CDMA Reliance GSM TATA CDMA TATA GSM Vodafone
Perc
enta
ge ca
ses c
losu
re
atte
nded
with
in 7
days
Termination/Closure of service
Percentage cases closure done within 7 days
TRAI Benchmark =100%
Data Source: Customer Service Center of the operators
All operators met the TRAI benchmark for the parameter except Idea.

TRAI Audit Wireless Report-Kolkata Circle JAS Quarter-2016
139
9.7 REFUND OF DEPOSITS AFTER CLOSURE
9.7.1 PARAMETER DESCRIPTION
Computational Methodology:
Time taken for refund for deposit after closures = (number of cases of refund after closure done within 60 days/ total number of cases of
refund after closure) * 100
Any case where the operators need to return the amount back to consumers post closure of service in form of cheque/cash is considered to be refund.
TRAI Benchmark:
Time taken for refund for deposit after closures: 100% within 60 days
Audit Procedure:
Operator provide details of the following from their central billing/refund database:
Dates of completion of all ‘closure requests’ resulting in requirement of a refund by the operator.
Dates of refund pertaining to all closure request received during the relevant quarter
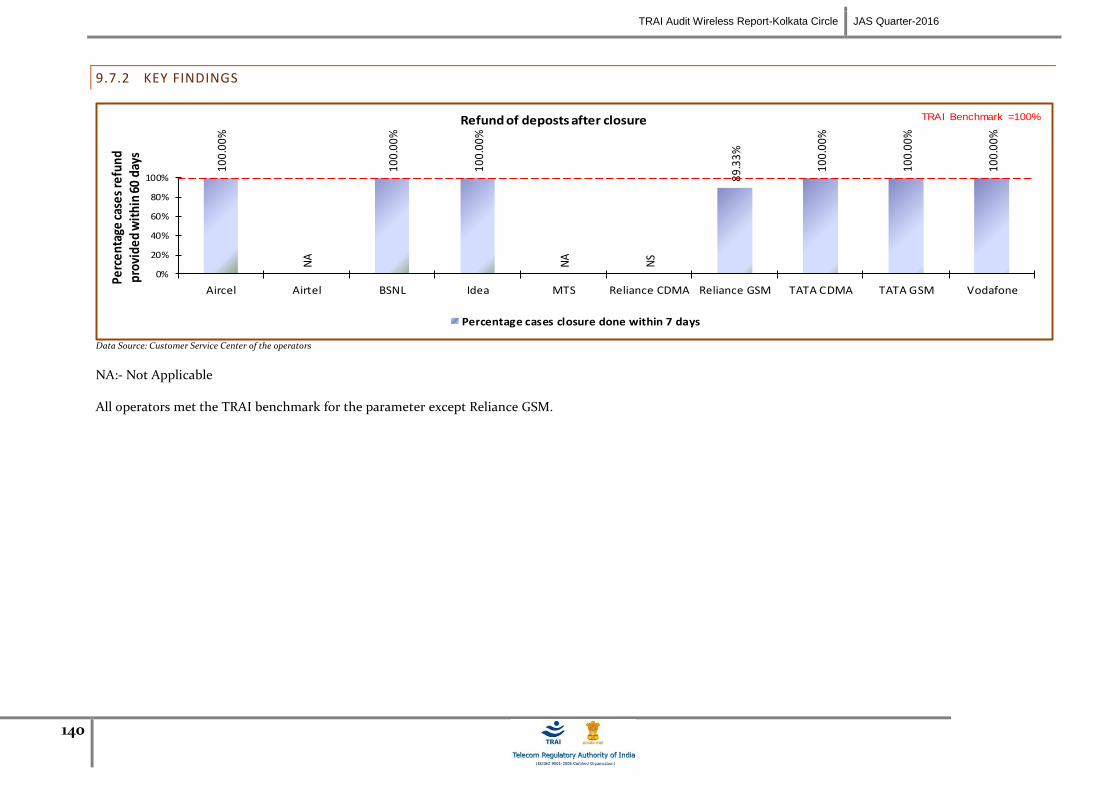
TRAI Audit Wireless Report-Kolkata Circle JAS Quarter-2016
140
9.7.2 KEY FINDINGS
100.
00%
NA
100.
00%
100.
00%
NA
NS
89.3
3%
100.
00%
100.
00%
100.
00%
0%
20%
40%
60%
80%
100%
Aircel Airtel BSNL Idea MTS Reliance CDMA Reliance GSM TATA CDMA TATA GSM Vodafone
Perc
enta
ge ca
ses
refu
nd
prov
ided
wit
hin
60 d
ays
Refund of deposts after closure
Percentage cases closure done within 7 days
TRAI Benchmark =100%
Data Source: Customer Service Center of the operators
NA:- Not Applicable
All operators met the TRAI benchmark for the parameter except Reliance GSM.

TRAI Audit Wireless Report-Kolkata Circle JAS Quarter-2016
141
10 DETAILED FINDINGS - DRIVE TEST DATA
10.1 OPERATOR ASSISTED DRIVE TEST - VOICE
The drive test was conducted simultaneously for all the operators present in the Kolkata circle. As per the new directive given by TRAI headquarters, drive test in the
quarter were conducted at a SSA level. SSAs have been defined in two categories by TRAI as per the criticality of the SSA.
3. Normal SSA
4. Difficult SSA
The drive test in Normal SSA was conducted for three days with minimum distance of 250 kilometers over three days. The drive test in difficult SSAs was conducted
for six days with minimum distance of 500 kilometers over six days. The selection of routes ensured that the maximum towns, villages, highways are covered as part of
drive test. The routes were selected post discussion with TRAI regional teams. The holding period for all test calls was 120 seconds and gap between calls was 10
seconds.
For measuring voice quality RxQual samples for GSM operators and Frame Error Rate (FERs) for CDMA service providers were measured. RxQual greater than 5
meant that the sample was not of appropriate voice quality and for CDMA operators FERs of more than 4 were considered bad. Call drops were measured by the
number of calls that were dropped to the total number of calls established during the drive test. Similarly CSSR was measured as the ratio of total calls established to
the total call attempts made. Signal strength was measured in Dbm with strength > -75 dbm for indoor, -85 dbm for in-vehicle and > -95 dbm outdoor routes.
The schedule and operators involved in the operator assisted drive test for Kolkata circle are given below.

TRAI Audit Wireless Report-Kolkata Circle JAS Quarter-2016
142
10.1.1 Kolkata SSA
10.1.1.1 Route Details - Kolkata SSA
The route maps given in the report are provided for the purpose of identifying the routes traversed during the drive tests. We observe three different colours
(Red/Green/Yellow) of the lines, which signify signal strength; however these maps are for a single operator and have not been referred to any findings in this report.
IMRB submits detailed operator wise Drive Test reports separately.

TRAI Audit Wireless Report-Kolkata Circle JAS Quarter-2016
143
10.1.1.2 Route Map - Kolkata DAY 1
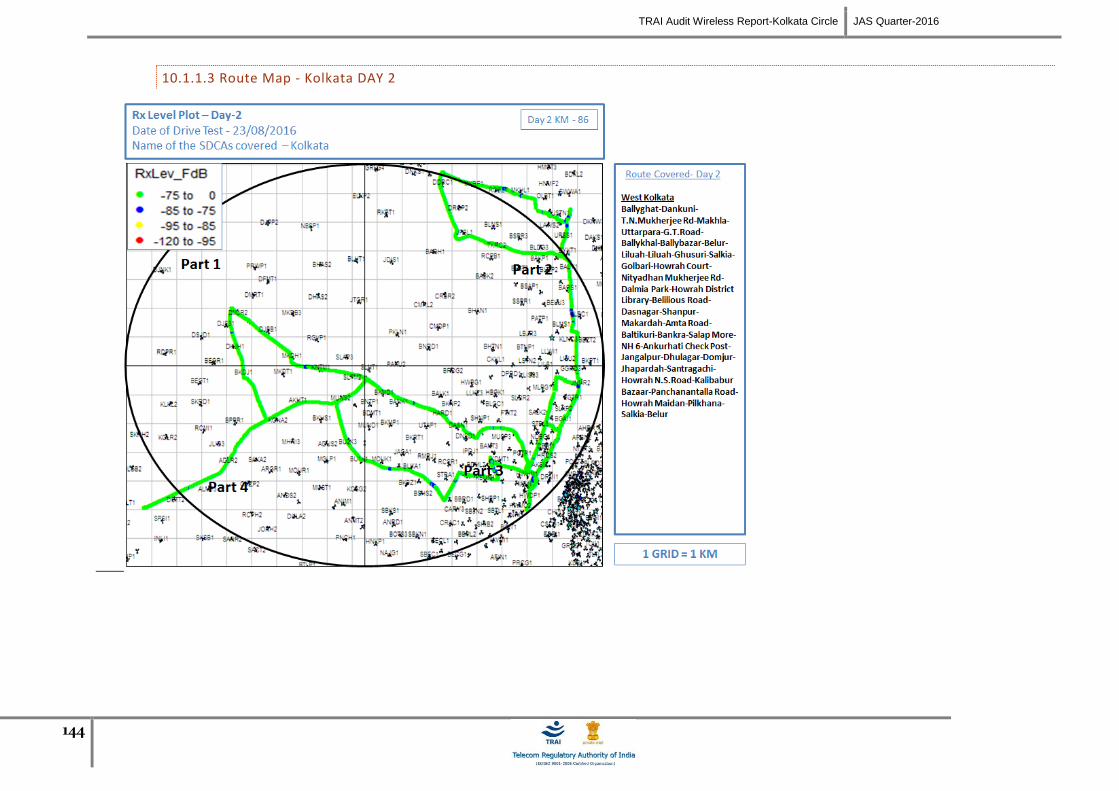
TRAI Audit Wireless Report-Kolkata Circle JAS Quarter-2016
144
10.1.1.3 Route Map - Kolkata DAY 2
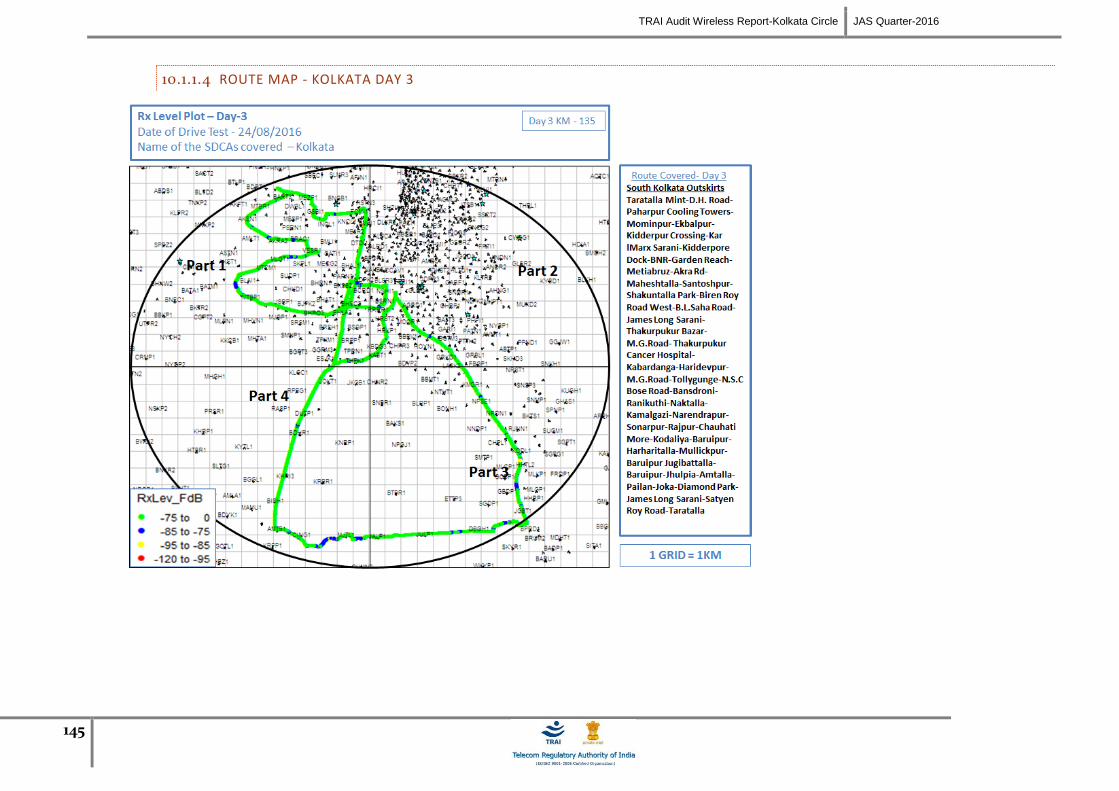
TRAI Audit Wireless Report-Kolkata Circle JAS Quarter-2016
145
10.1.1.4 ROUTE MAP - KOLKATA DAY 3

TRAI Audit Wireless Report-Kolkata Circle JAS Quarter-2016
146
10.1.1.1 Route Map - Kolkata DAY 4
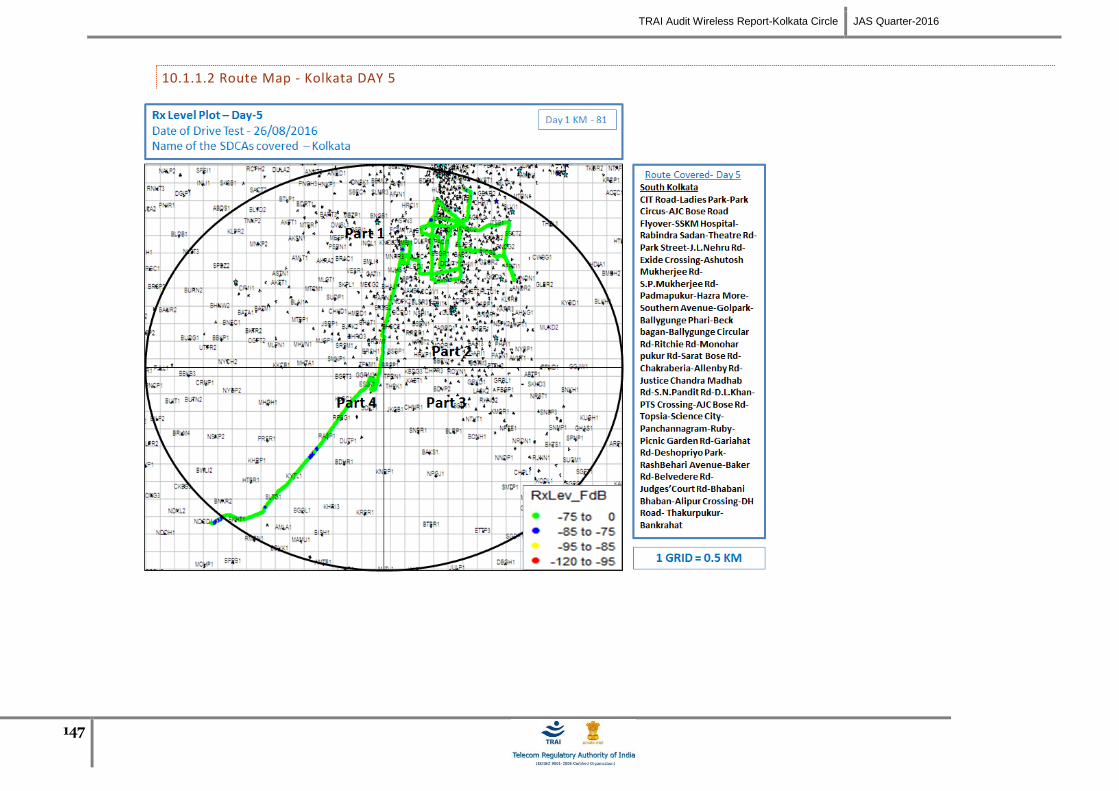
TRAI Audit Wireless Report-Kolkata Circle JAS Quarter-2016
147
10.1.1.2 Route Map - Kolkata DAY 5
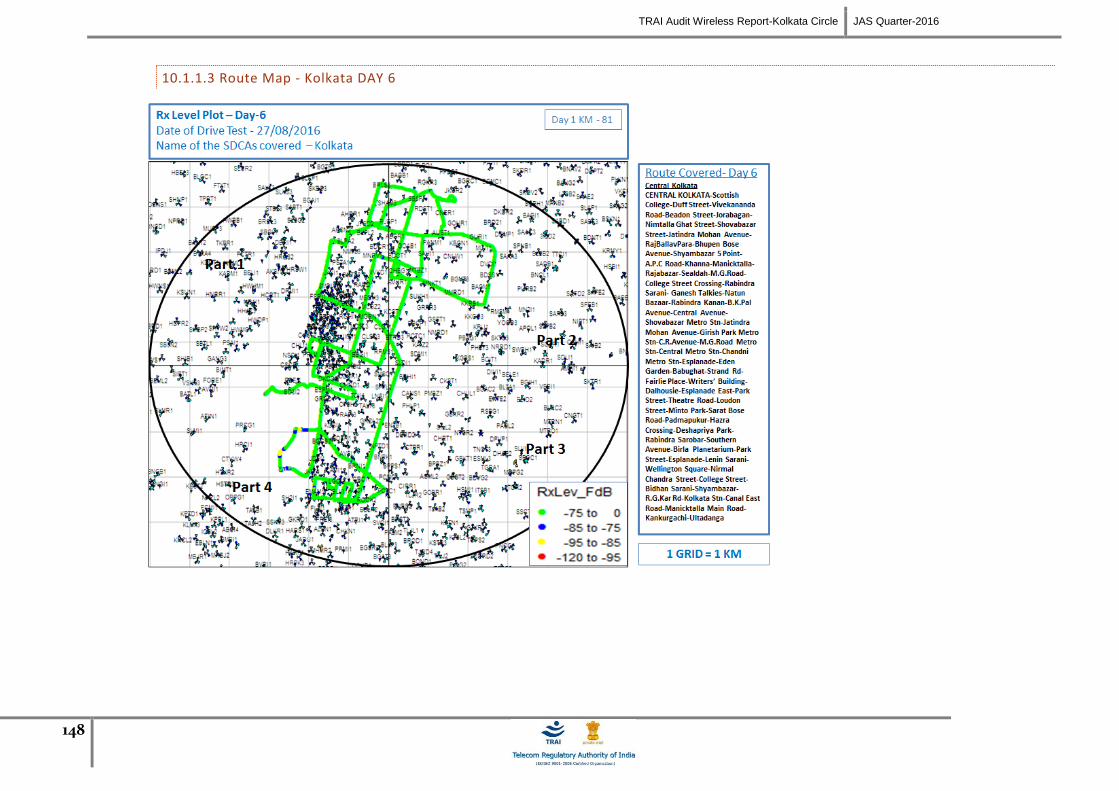
TRAI Audit Wireless Report-Kolkata Circle JAS Quarter-2016
148
10.1.1.3 Route Map - Kolkata DAY 6
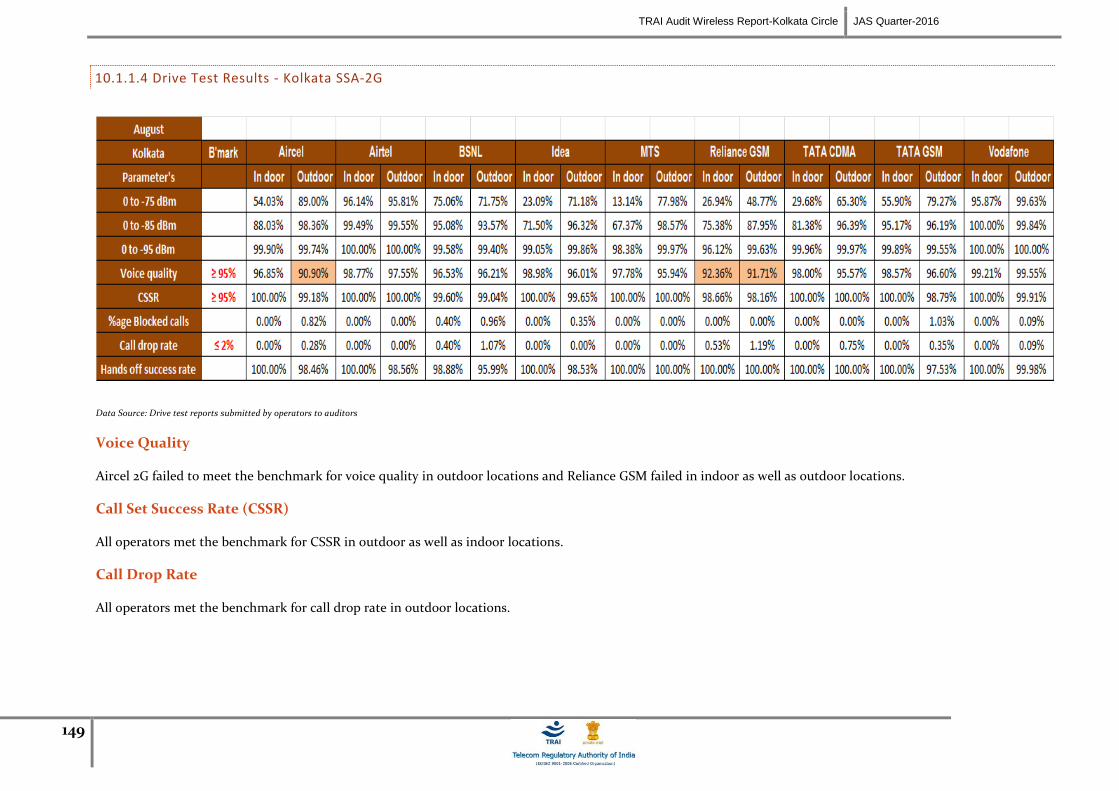
TRAI Audit Wireless Report-Kolkata Circle JAS Quarter-2016
149
10.1.1.4 Drive Test Results - Kolkata SSA-2G
Data Source: Drive test reports submitted by operators to auditors
Voice Quality
Aircel 2G failed to meet the benchmark for voice quality in outdoor locations and Reliance GSM failed in indoor as well as outdoor locations.
Call Set Success Rate (CSSR)
All operators met the benchmark for CSSR in outdoor as well as indoor locations.
Call Drop Rate
All operators met the benchmark for call drop rate in outdoor locations.
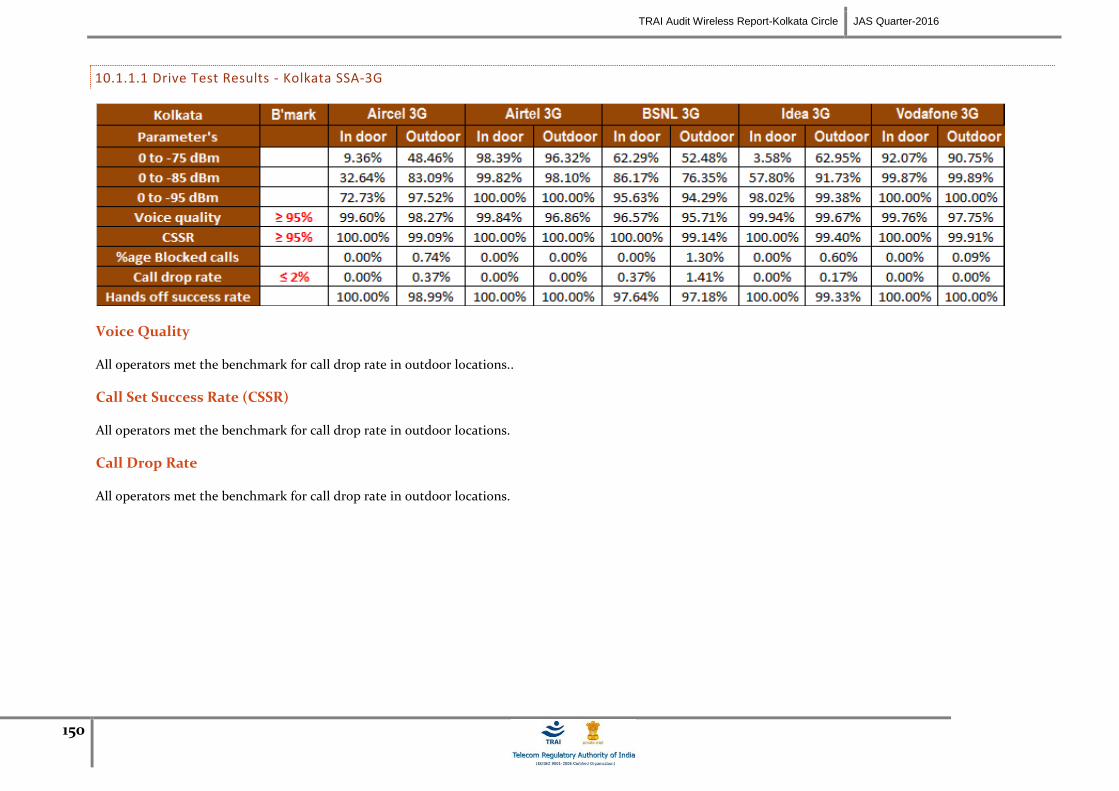
TRAI Audit Wireless Report-Kolkata Circle JAS Quarter-2016
150
10.1.1.1 Drive Test Results - Kolkata SSA-3G
Voice Quality
All operators met the benchmark for call drop rate in outdoor locations..
Call Set Success Rate (CSSR)
All operators met the benchmark for call drop rate in outdoor locations.
Call Drop Rate
All operators met the benchmark for call drop rate in outdoor locations.
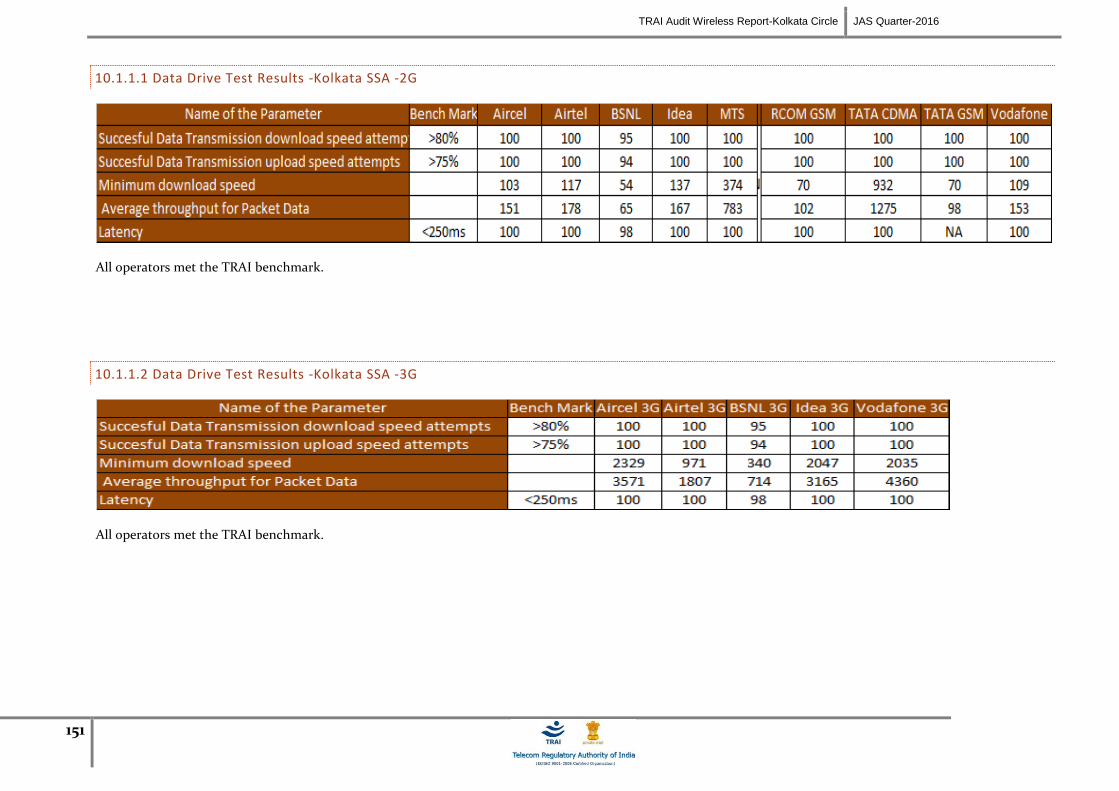
TRAI Audit Wireless Report-Kolkata Circle JAS Quarter-2016
151
10.1.1.1 Data Drive Test Results -Kolkata SSA -2G
All operators met the TRAI benchmark.
10.1.1.2 Data Drive Test Results -Kolkata SSA -3G
All operators met the TRAI benchmark.

TRAI Audit Wireless Report-Kolkata Circle JAS Quarter-2016
152
11 ANNEXURE – CONSOLIDATED-2G
11.1 NETWORK AVAILABILITY
Data Source: Operations and Maintenance Center (OMC) of the operators
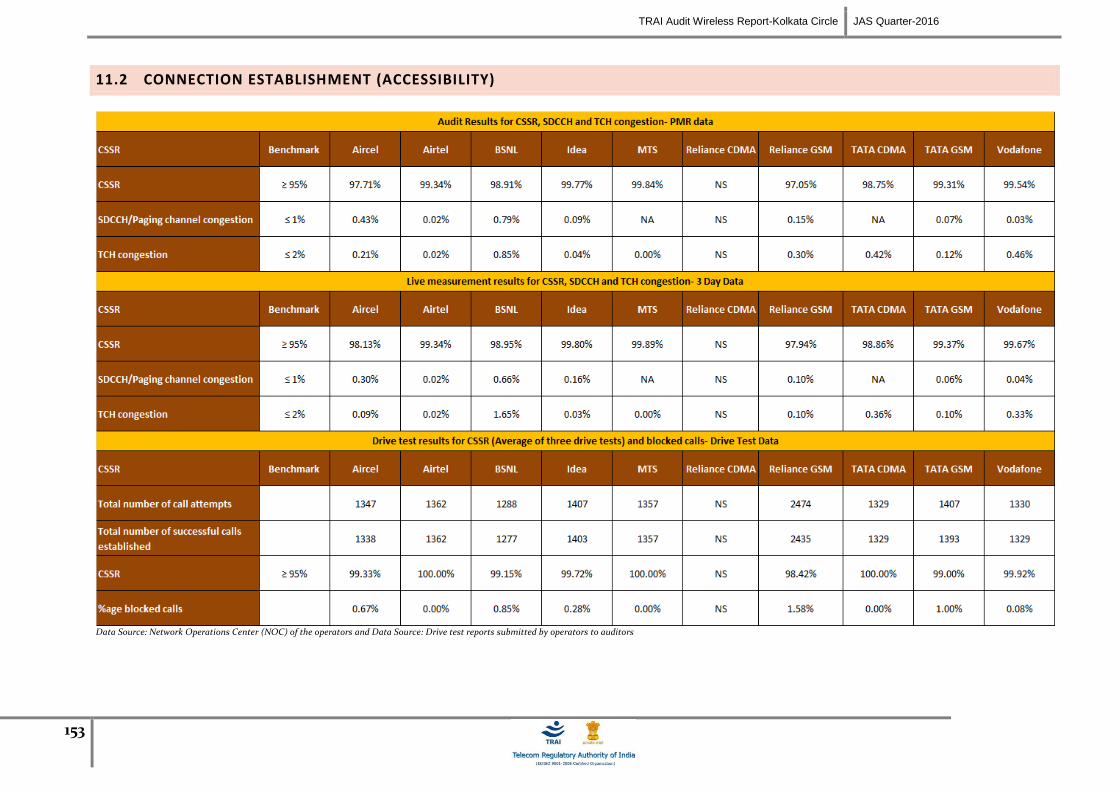
TRAI Audit Wireless Report-Kolkata Circle JAS Quarter-2016
153
11.2 CONNECTION ESTABLISHMENT (ACCESSIBILITY)
Data Source: Network Operations Center (NOC) of the operators and Data Source: Drive test reports submitted by operators to auditors
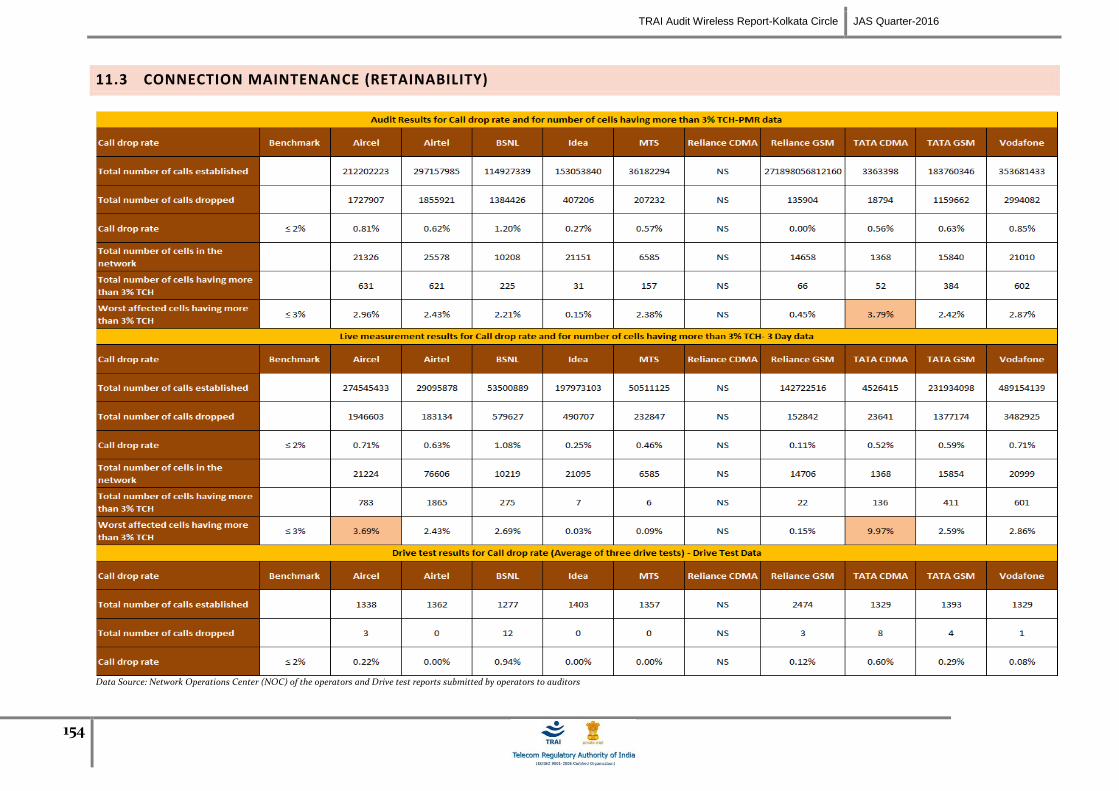
TRAI Audit Wireless Report-Kolkata Circle JAS Quarter-2016
154
11.3 CONNECTION MAINTENANCE (RETAINABILITY)
Data Source: Network Operations Center (NOC) of the operators and Drive test reports submitted by operators to auditors

TRAI Audit Wireless Report-Kolkata Circle JAS Quarter-2016
155
11.4 VOICE QUALITY
Data Source: Network Operations Center (NOC) of the operators and Drive test reports submitted by operators to auditors
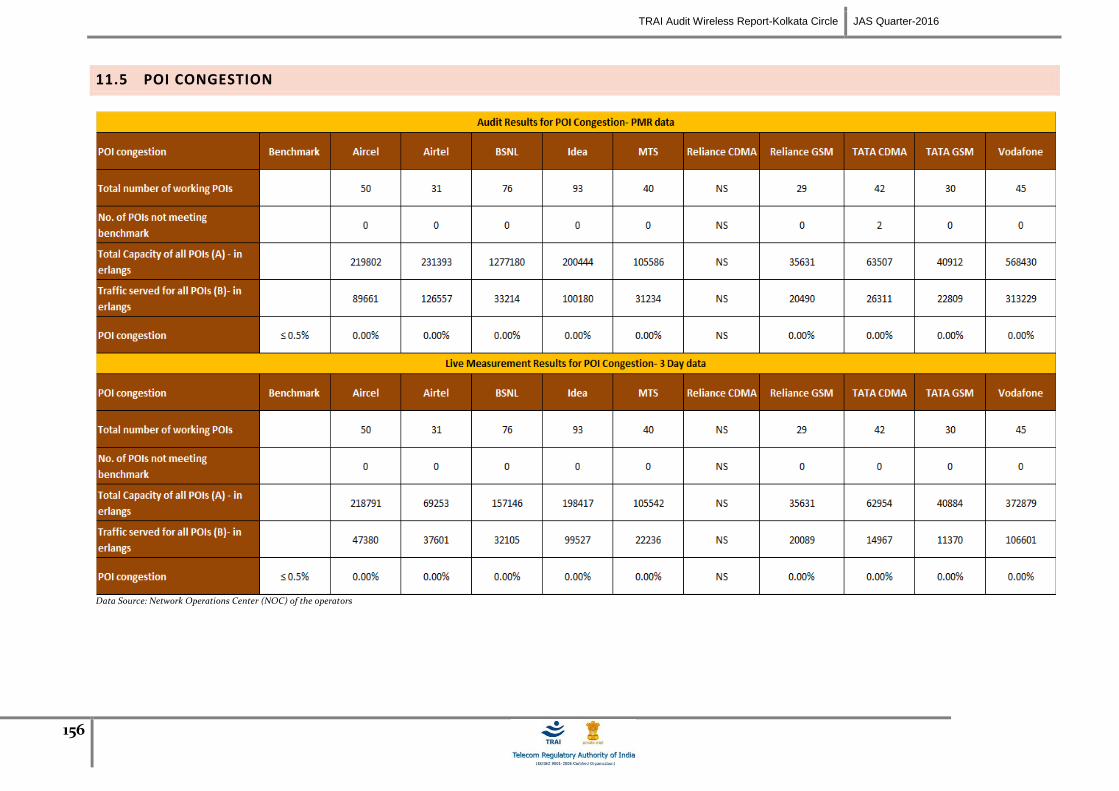
TRAI Audit Wireless Report-Kolkata Circle JAS Quarter-2016
156
11.5 POI CONGESTION
Data Source: Network Operations Center (NOC) of the operators

TRAI Audit Wireless Report-Kolkata Circle JAS Quarter-2016
157
11.6 ADDITIONAL NETWORK RELATED PARAMETERS
Data Source: Network Operations Center (NOC) of the operators
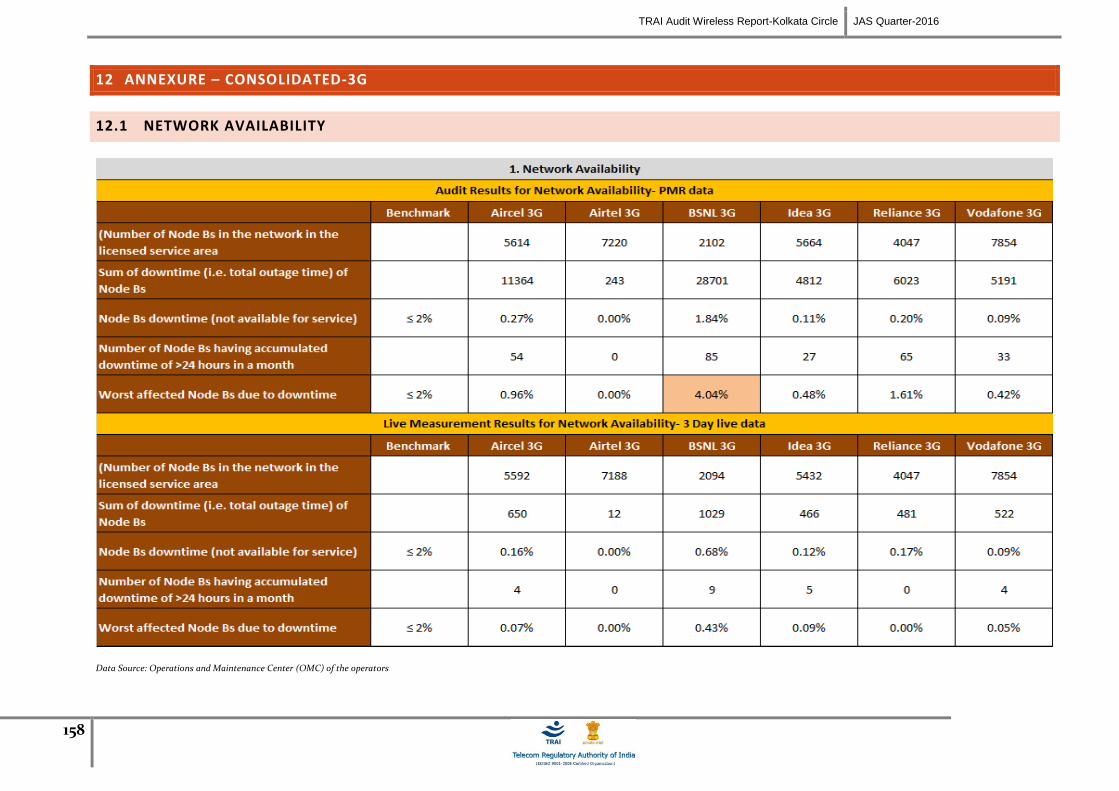
TRAI Audit Wireless Report-Kolkata Circle JAS Quarter-2016
158
12 ANNEXURE – CONSOLIDATED-3G
12.1 NETWORK AVAILABILITY
Data Source: Operations and Maintenance Center (OMC) of the operators

TRAI Audit Wireless Report-Kolkata Circle JAS Quarter-2016
159
12.2 CONNECTION ESTABLISHMENT (ACCESSIBILITY)
Data Source: Network Operations Center (NOC) of the operators and Data Source: Drive test reports submitted by operators to auditors
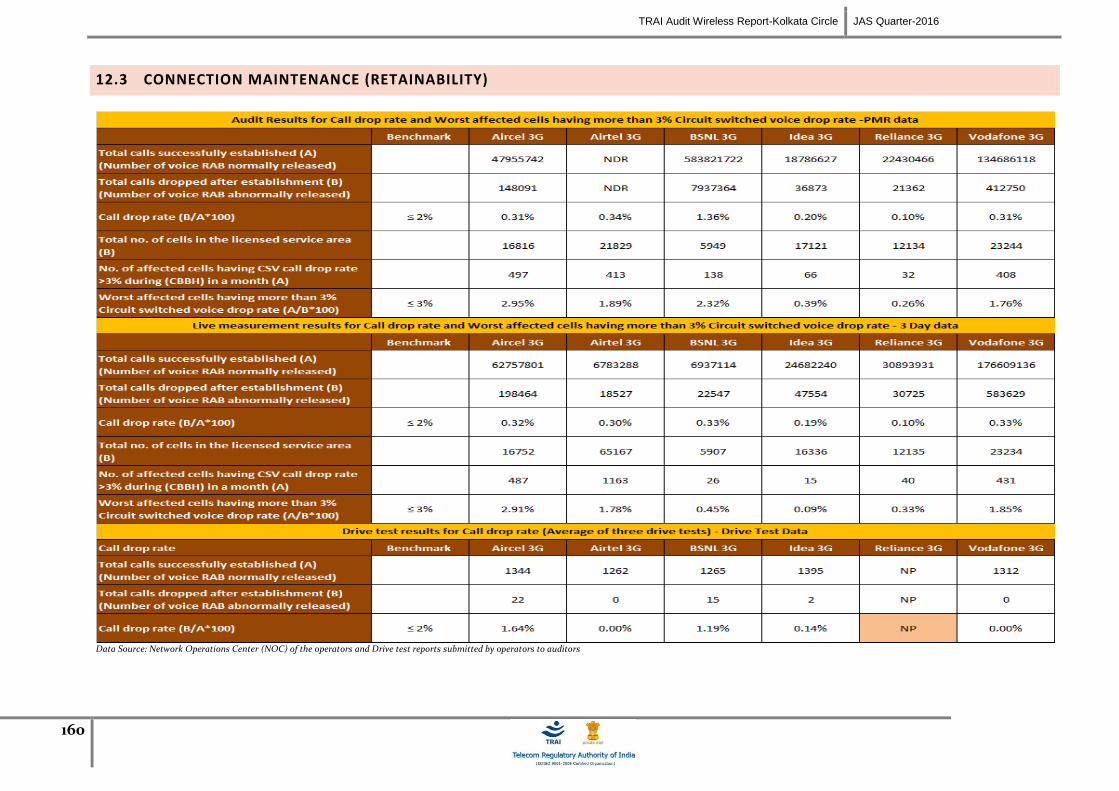
TRAI Audit Wireless Report-Kolkata Circle JAS Quarter-2016
160
12.3 CONNECTION MAINTENANCE (RETAINABILITY)
Data Source: Network Operations Center (NOC) of the operators and Drive test reports submitted by operators to auditors
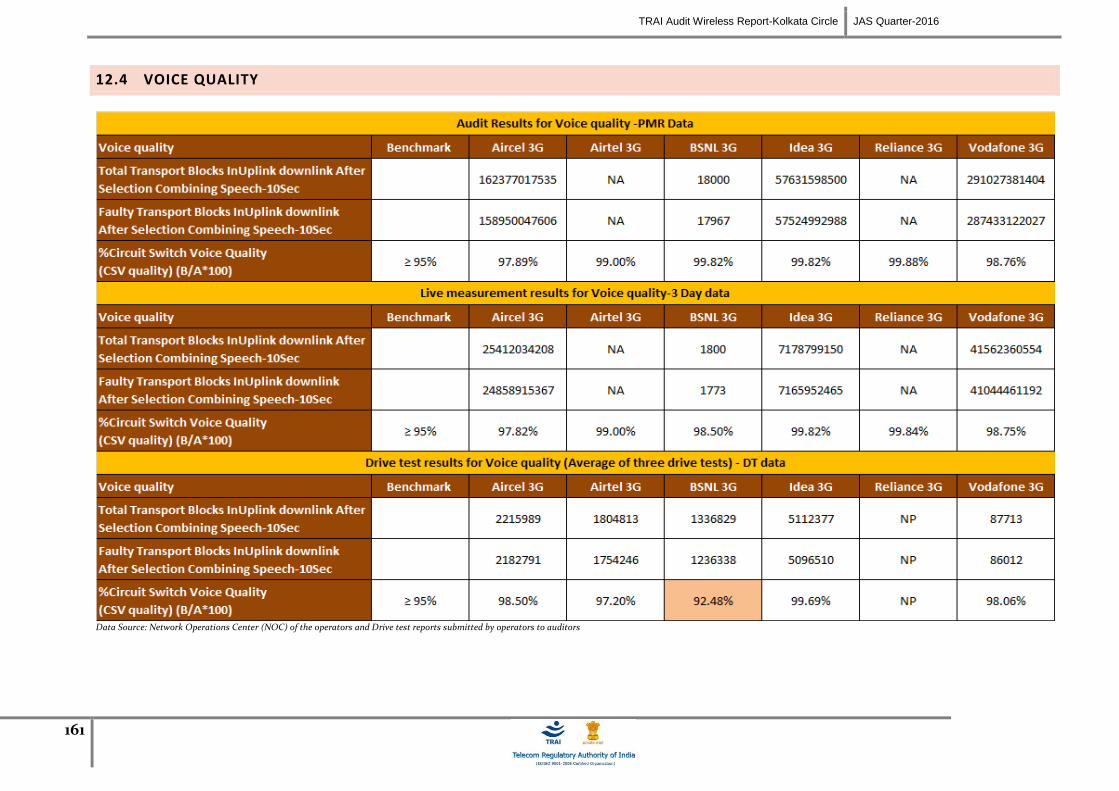
TRAI Audit Wireless Report-Kolkata Circle JAS Quarter-2016
161
12.4 VOICE QUALITY
Data Source: Network Operations Center (NOC) of the operators and Drive test reports submitted by operators to auditors
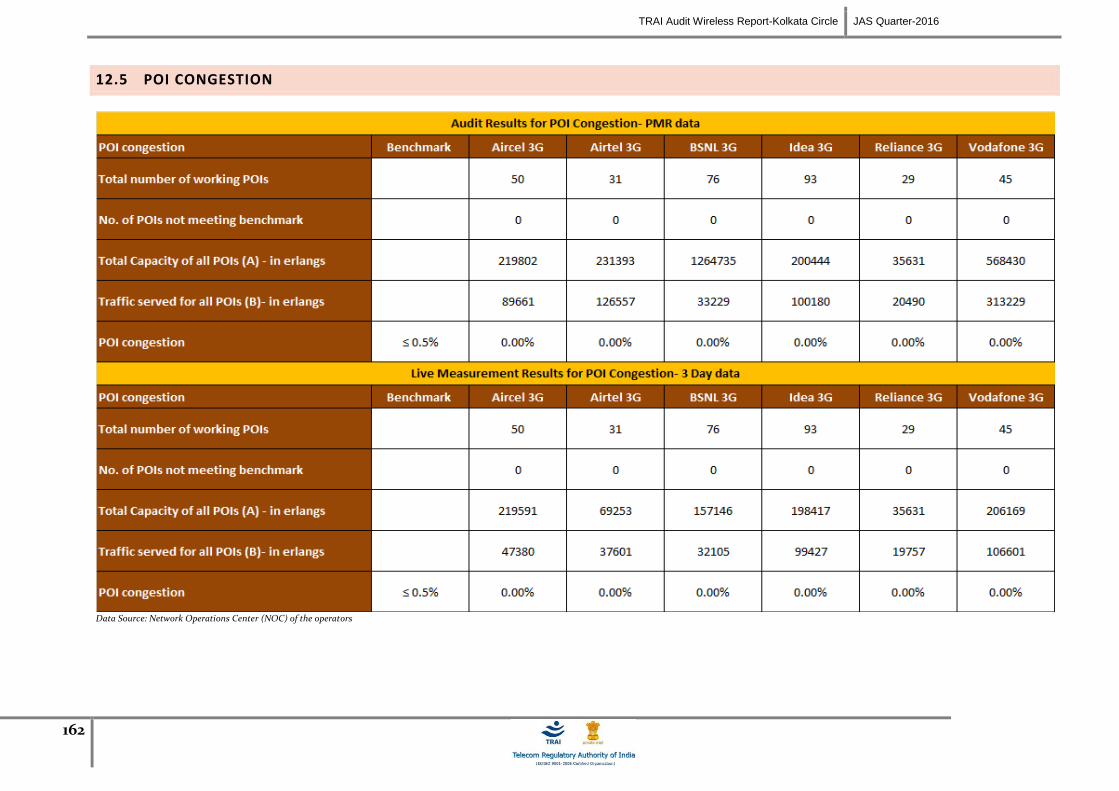
TRAI Audit Wireless Report-Kolkata Circle JAS Quarter-2016
162
12.5 POI CONGESTION
Data Source: Network Operations Center (NOC) of the operators

TRAI Audit Wireless Report-Kolkata Circle JAS Quarter-2016
163
12.6 ADDITIONAL NETWORK RELATED PARAMETERS
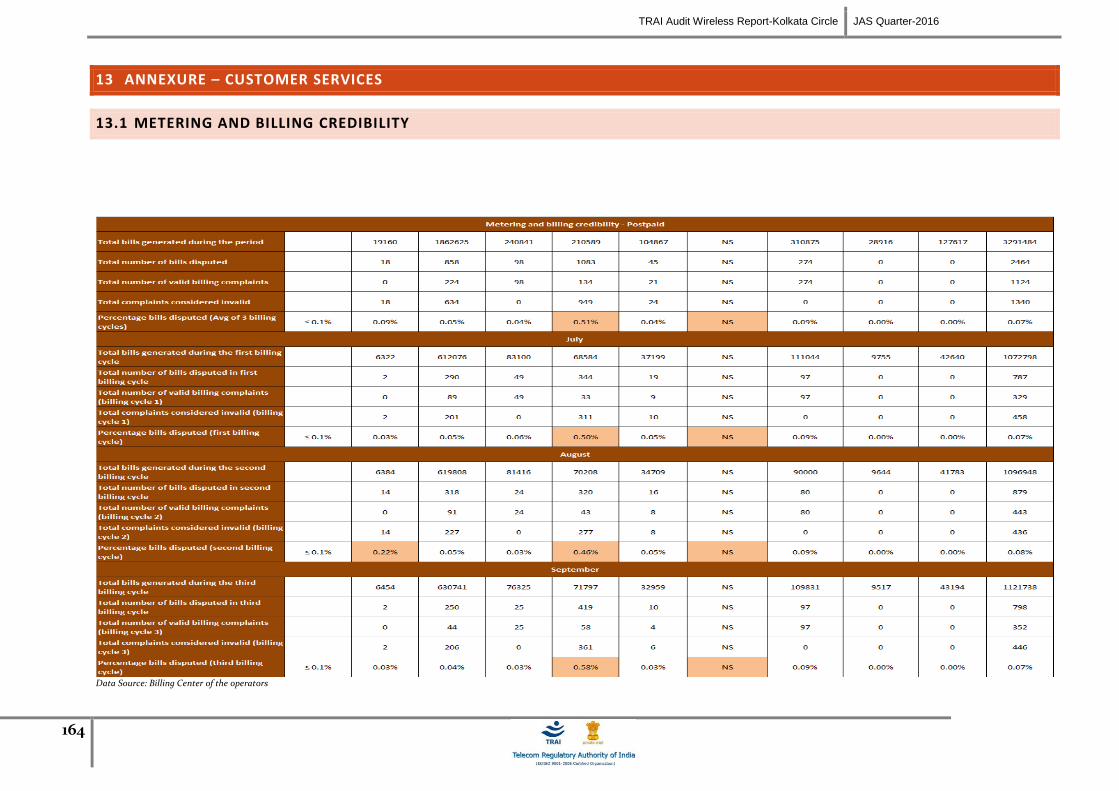
TRAI Audit Wireless Report-Kolkata Circle JAS Quarter-2016
164
13 ANNEXURE – CUSTOMER SERVICES
13.1 METERING AND BILLING CREDIBILITY
Data Source: Billing Center of the operators
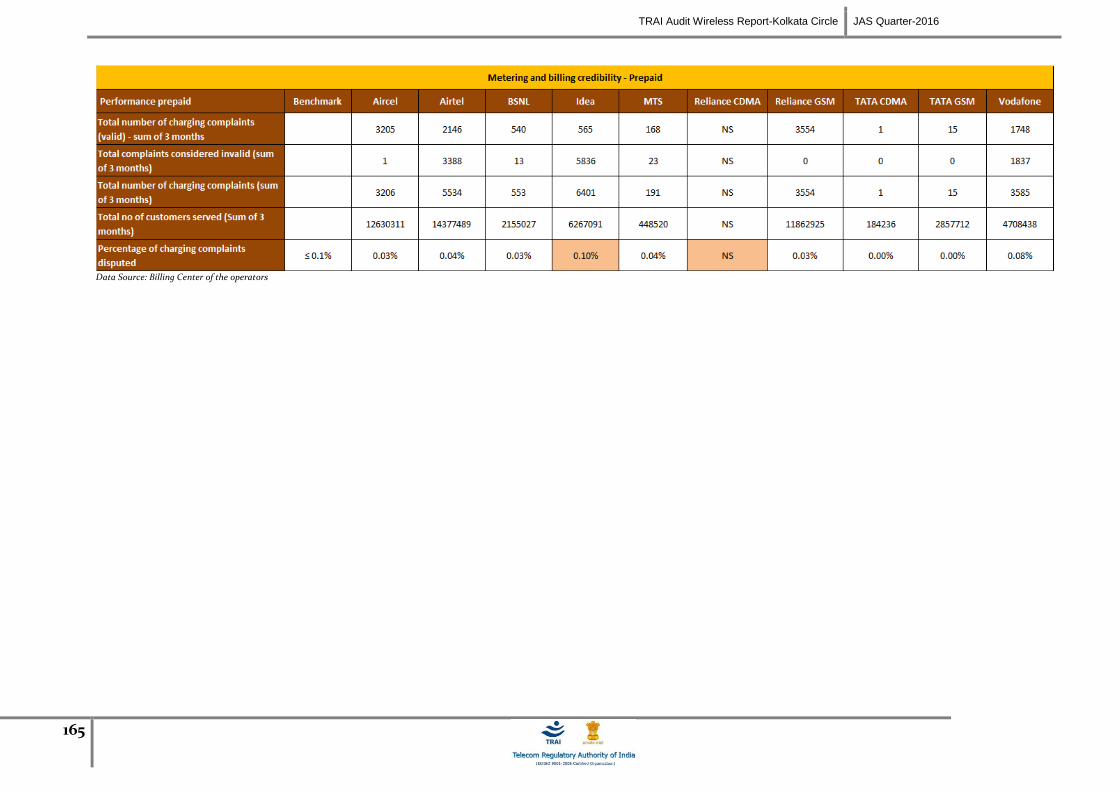
TRAI Audit Wireless Report-Kolkata Circle JAS Quarter-2016
165
Data Source: Billing Center of the operators
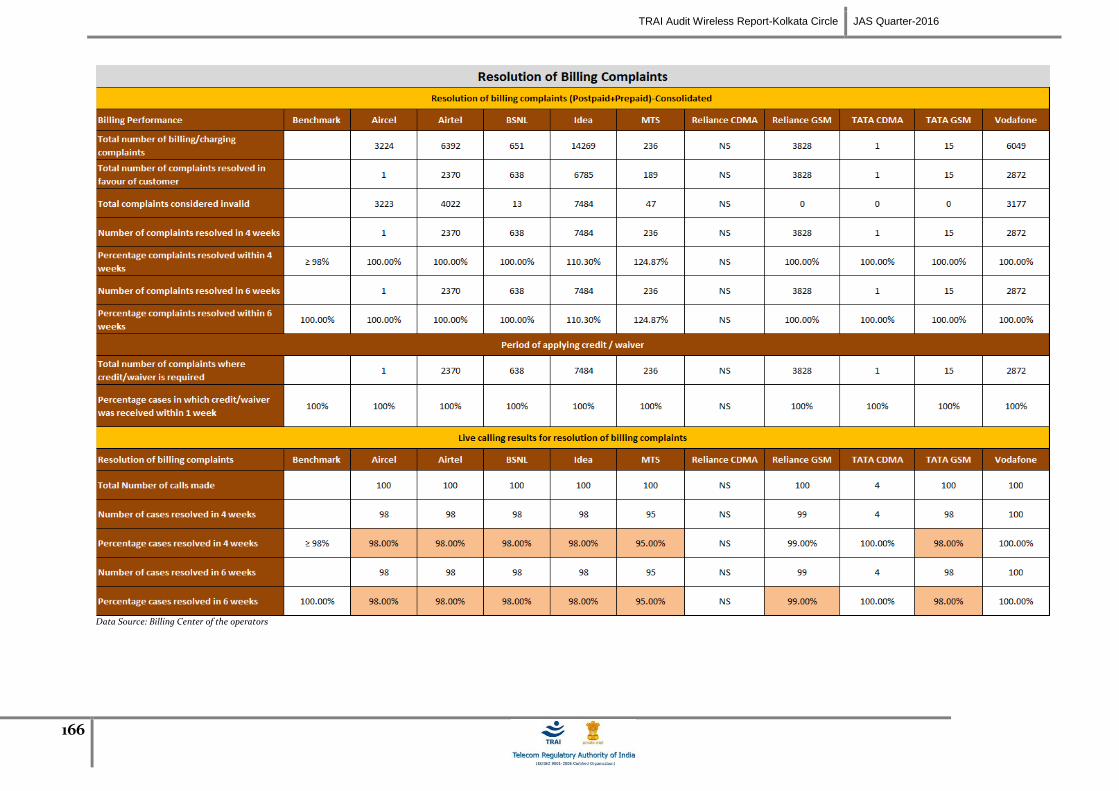
TRAI Audit Wireless Report-Kolkata Circle JAS Quarter-2016
166
Data Source: Billing Center of the operators
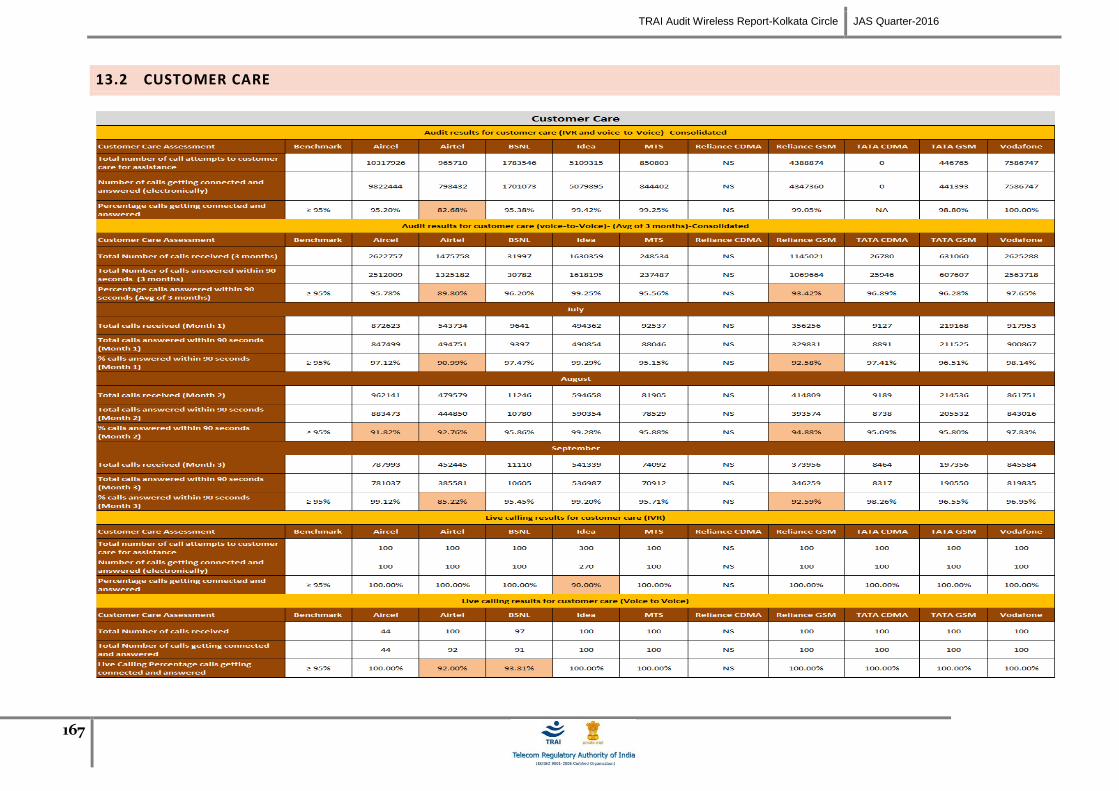
TRAI Audit Wireless Report-Kolkata Circle JAS Quarter-2016
167
13.2 CUSTOMER CARE
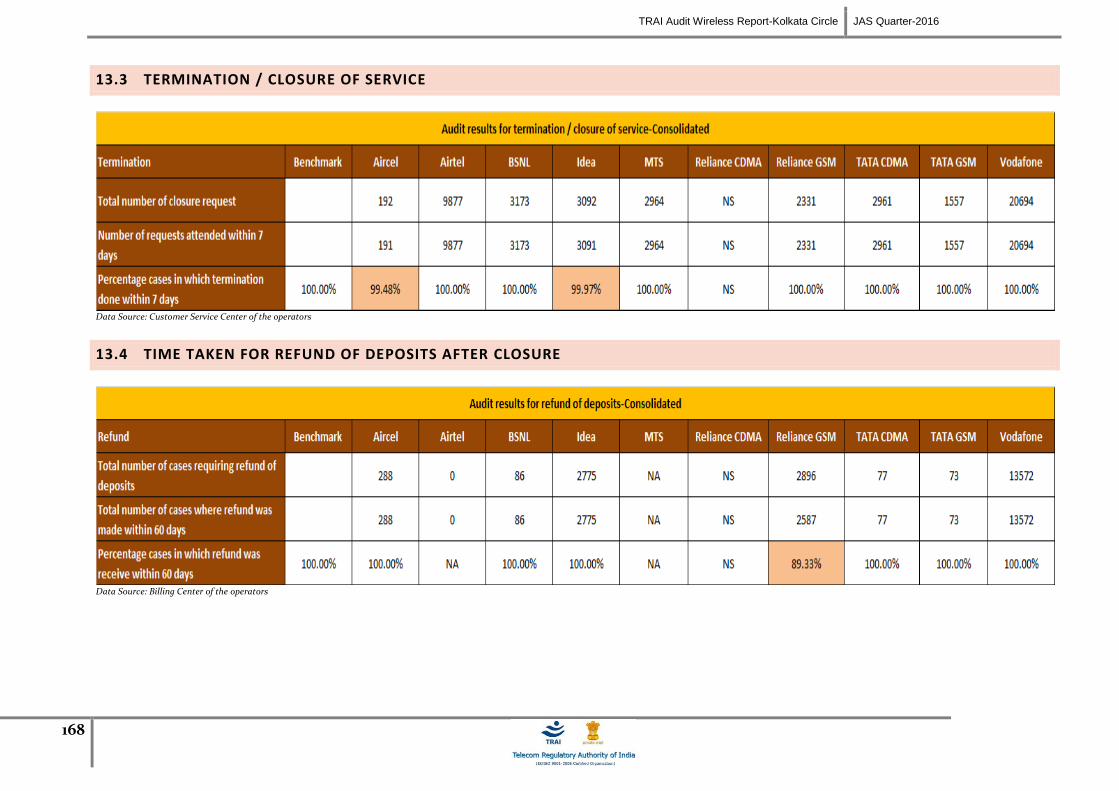
TRAI Audit Wireless Report-Kolkata Circle JAS Quarter-2016
168
13.3 TERMINATION / CLOSURE OF SERVICE
Data Source: Customer Service Center of the operators
13.4 TIME TAKEN FOR REFUND OF DEPOSITS AFTER CLOSURE
Data Source: Billing Center of the operators
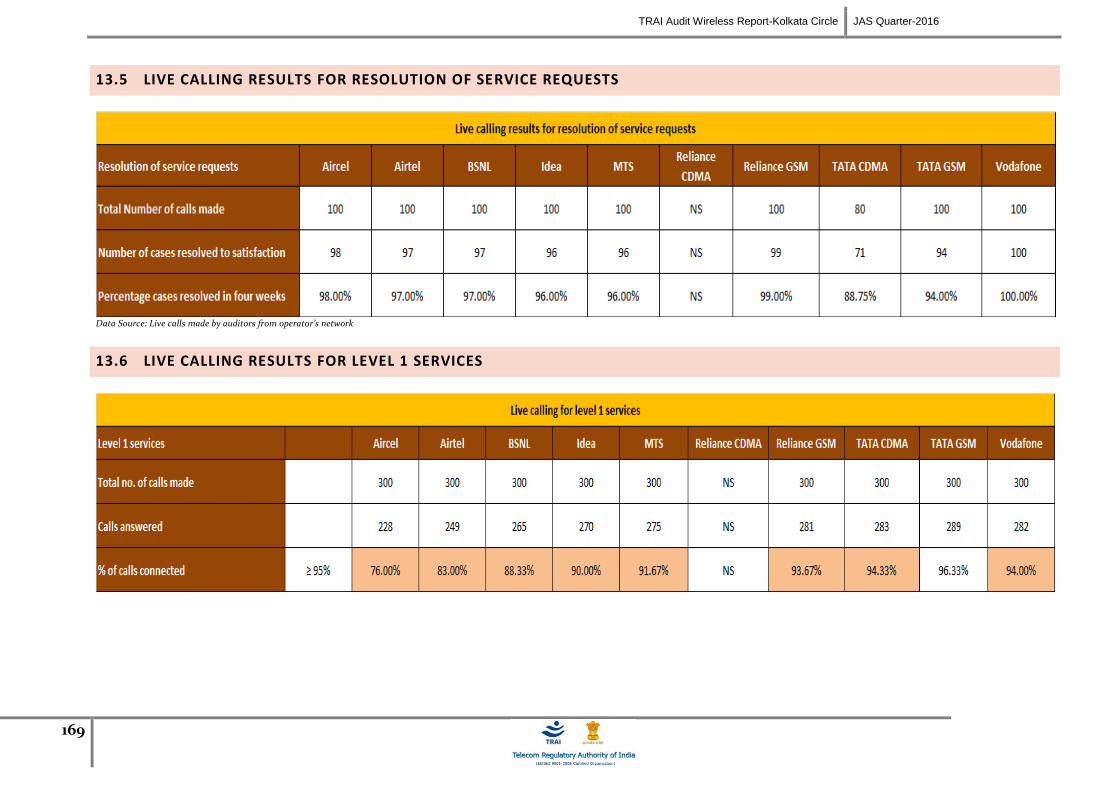
TRAI Audit Wireless Report-Kolkata Circle JAS Quarter-2016
169
13.5 LIVE CALLING RESULTS FOR RESOLUTION OF SERVICE REQUESTS
Data Source: Live calls made by auditors from operator’s network
13.6 LIVE CALLING RESULTS FOR LEVEL 1 SERVICES

170
13.7 LEVEL 1 SERVICE CALLS MADE
All the numbers given in mandatory list in Section 2.4.2.4.1 were tested. The following table provides the numbers that are activated for each operator. A tick () for
an operator signifies that the number was active for the operator.
Live calls were made to the active numbers to test the calls answered. The details of the same have been given below for each operator.
Aircel
Level 1 Number Type of Service Working Not
Working Calls
Made Calls
Connected
100 Police Y 18 14
101 Fire Y 18 14
102 Ambulance Y 18 14
104 Health Information Helpline N
108 Emergency and Disaster Management Helpline Y 18 14
138 All India Helpine for Passangers Y 18 14
149 Public Road Transport Utility Service N
181 Chief Minister Helpline N
182 Indian Railway Security Helpline N
1033 Road Accident Management Service N
1037 Public Grievance Cell DoT Hq as 'Telecom Consumer Grievance Redressal Helpline'
N
1056 Emergency Medical Services N
106X State of the Art Hospitals N
1063 Public Grievance Cell DoT Hq N
1064 Anti Corruption Helpline N
1070 Relief Commission for Natural Calamities Y 18 13
1071 Air Accident Helpline Y 17 13
1072 Rail Accident Helpline N

TRAI Audit Wireless Report-Kolkata Circle JAS Quarter-2016
171
1073 Road Accident Helpline Y 18 14
1077 Control Room for District Collector N
1090 Call Alart ( Crime Branch) Y 18 14
1091 Women Helpline Y 18 13
1097 National AIDS Helpline to NACO Y 17 13
1099 Central Accident and Trauma Services (CATS) N
10580 Educationa & Vocational Guidance and Counselling
N
10589 Mother and Child Tracking ( MCTH) N
10740 Central Pollution Control Board N
10741 Pollution Control Board N
1511 Police Related Service for all Metro Railway Project
N
1512 Prevention of Crime in Railway Y 18 13
1514 National Career Service(NCS) N
15100 Free Legal Service Helpline N
155304 Municipal Corporations N
155214 Labour Helpline N
1903 Sashastra Seema Bal (SSB) Y 18 13
1909 National Do Not Call Registry Y 17 13
1912 Complaint of Electricity Y 17 13
1916 Drinking Water Supply Y 17 13
1950 Election Commission of India Y 17 13
Airtel
Level 1 Number Type of Service Working Not
Working Calls
Made Calls
Connected
100 Police Y 20 17
101 Fire Y 20 17
102 Ambulance Y 20 17
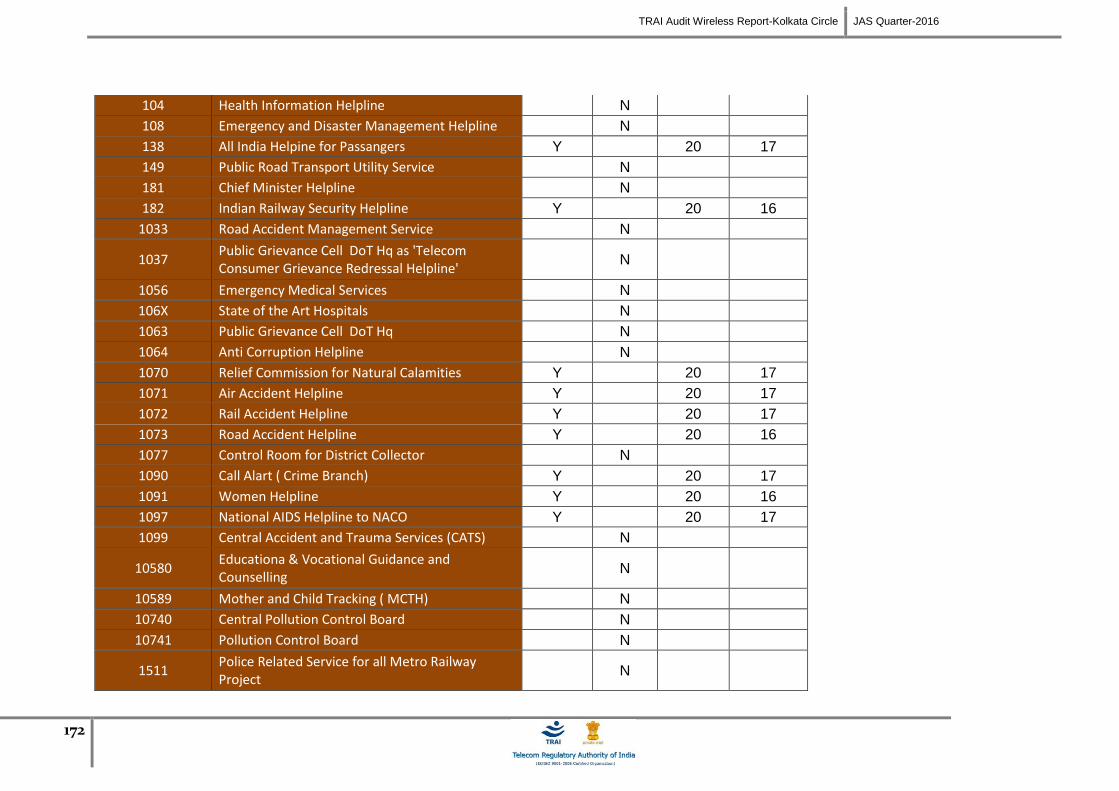
TRAI Audit Wireless Report-Kolkata Circle JAS Quarter-2016
172
104 Health Information Helpline N
108 Emergency and Disaster Management Helpline N
138 All India Helpine for Passangers Y 20 17
149 Public Road Transport Utility Service N
181 Chief Minister Helpline N
182 Indian Railway Security Helpline Y 20 16
1033 Road Accident Management Service N
1037 Public Grievance Cell DoT Hq as 'Telecom Consumer Grievance Redressal Helpline'
N
1056 Emergency Medical Services N
106X State of the Art Hospitals N
1063 Public Grievance Cell DoT Hq N
1064 Anti Corruption Helpline N
1070 Relief Commission for Natural Calamities Y 20 17
1071 Air Accident Helpline Y 20 17
1072 Rail Accident Helpline Y 20 17
1073 Road Accident Helpline Y 20 16
1077 Control Room for District Collector N
1090 Call Alart ( Crime Branch) Y 20 17
1091 Women Helpline Y 20 16
1097 National AIDS Helpline to NACO Y 20 17
1099 Central Accident and Trauma Services (CATS) N
10580 Educationa & Vocational Guidance and Counselling
N
10589 Mother and Child Tracking ( MCTH) N
10740 Central Pollution Control Board N
10741 Pollution Control Board N
1511 Police Related Service for all Metro Railway Project
N
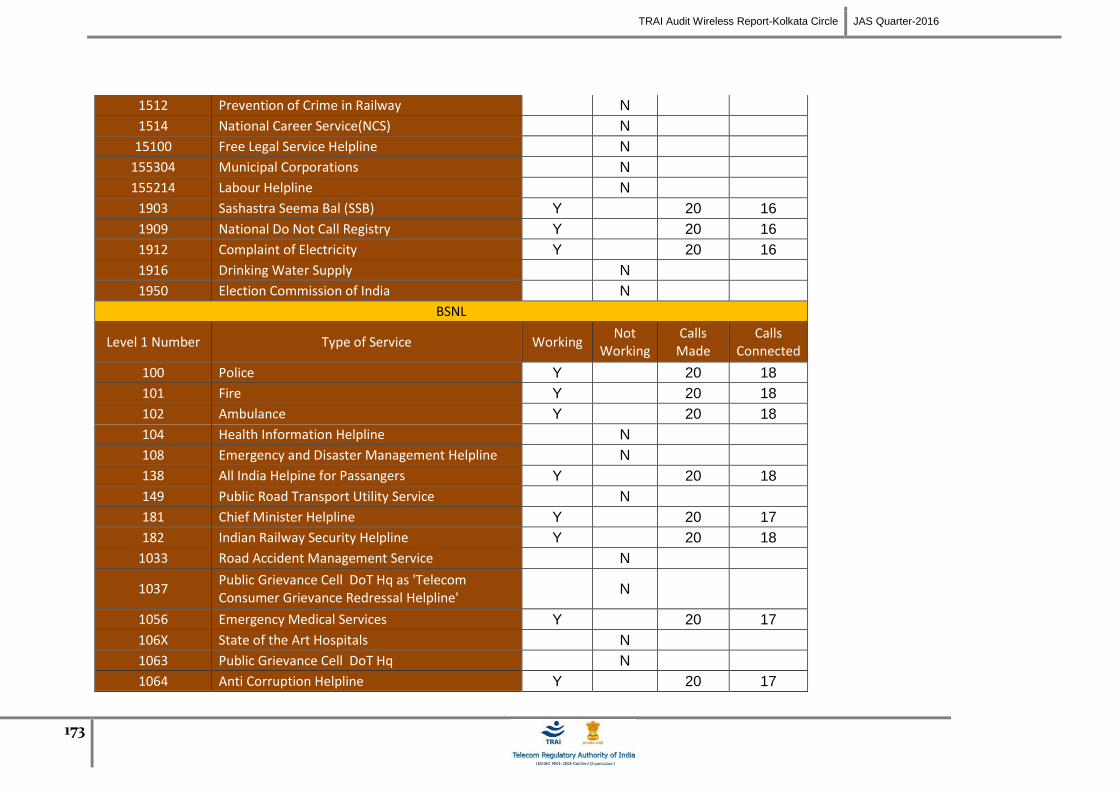
TRAI Audit Wireless Report-Kolkata Circle JAS Quarter-2016
173
1512 Prevention of Crime in Railway N
1514 National Career Service(NCS) N
15100 Free Legal Service Helpline N
155304 Municipal Corporations N
155214 Labour Helpline N
1903 Sashastra Seema Bal (SSB) Y 20 16
1909 National Do Not Call Registry Y 20 16
1912 Complaint of Electricity Y 20 16
1916 Drinking Water Supply N
1950 Election Commission of India N
BSNL
Level 1 Number Type of Service Working Not
Working Calls
Made Calls
Connected
100 Police Y 20 18
101 Fire Y 20 18
102 Ambulance Y 20 18
104 Health Information Helpline N
108 Emergency and Disaster Management Helpline N
138 All India Helpine for Passangers Y 20 18
149 Public Road Transport Utility Service N
181 Chief Minister Helpline Y 20 17
182 Indian Railway Security Helpline Y 20 18
1033 Road Accident Management Service N
1037 Public Grievance Cell DoT Hq as 'Telecom Consumer Grievance Redressal Helpline'
N
1056 Emergency Medical Services Y 20 17
106X State of the Art Hospitals N
1063 Public Grievance Cell DoT Hq N
1064 Anti Corruption Helpline Y 20 17
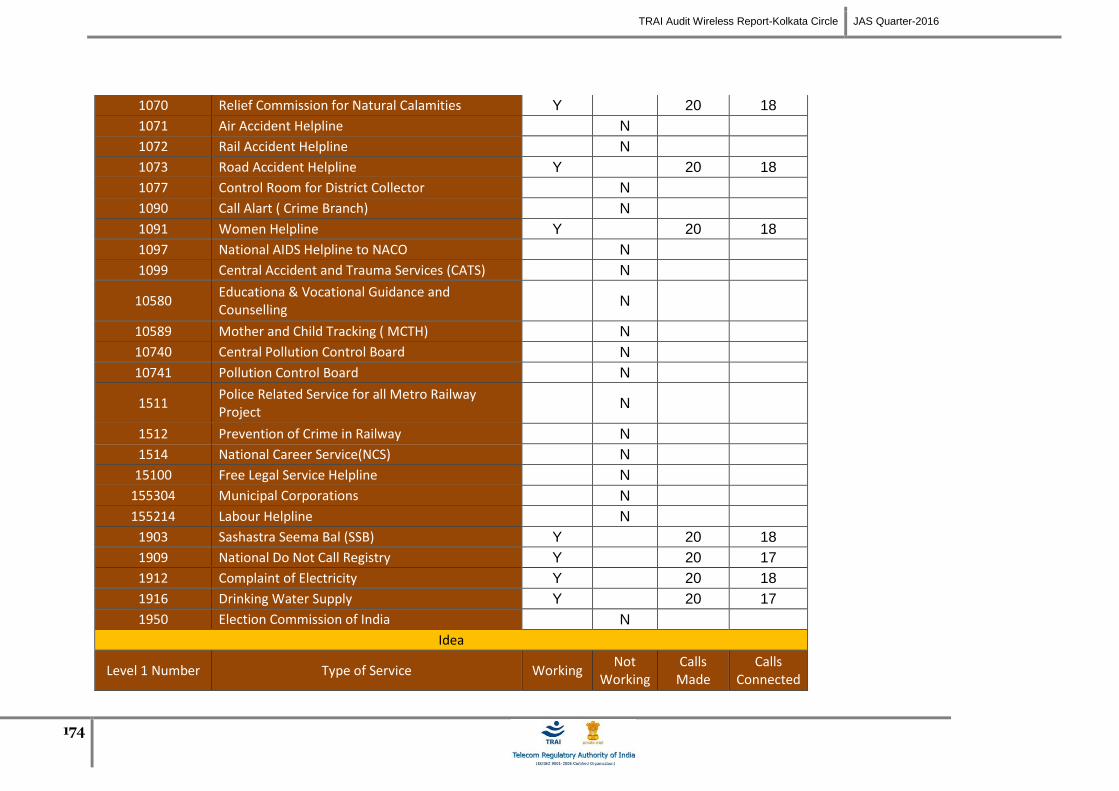
TRAI Audit Wireless Report-Kolkata Circle JAS Quarter-2016
174
1070 Relief Commission for Natural Calamities Y 20 18
1071 Air Accident Helpline N
1072 Rail Accident Helpline N
1073 Road Accident Helpline Y 20 18
1077 Control Room for District Collector N
1090 Call Alart ( Crime Branch) N
1091 Women Helpline Y 20 18
1097 National AIDS Helpline to NACO N
1099 Central Accident and Trauma Services (CATS) N
10580 Educationa & Vocational Guidance and Counselling
N
10589 Mother and Child Tracking ( MCTH) N
10740 Central Pollution Control Board N
10741 Pollution Control Board N
1511 Police Related Service for all Metro Railway Project
N
1512 Prevention of Crime in Railway N
1514 National Career Service(NCS) N
15100 Free Legal Service Helpline N
155304 Municipal Corporations N
155214 Labour Helpline N
1903 Sashastra Seema Bal (SSB) Y 20 18
1909 National Do Not Call Registry Y 20 17
1912 Complaint of Electricity Y 20 18
1916 Drinking Water Supply Y 20 17
1950 Election Commission of India N
Idea
Level 1 Number Type of Service Working Not
Working Calls
Made Calls
Connected
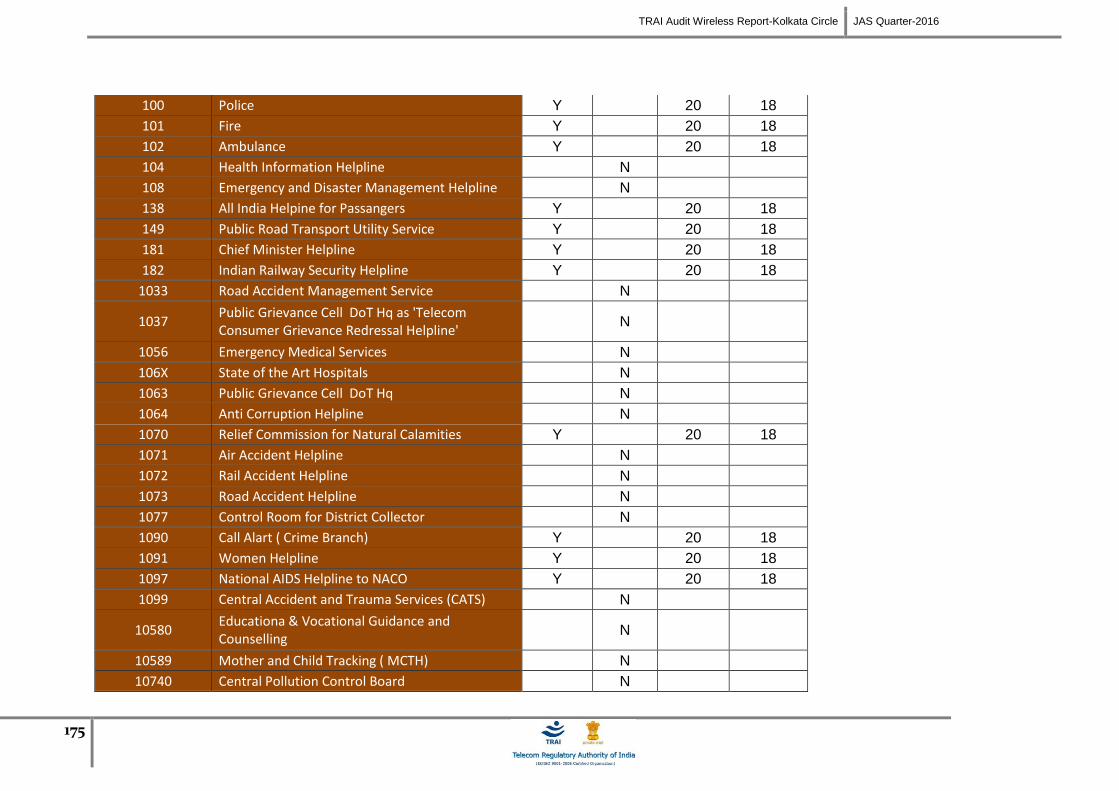
TRAI Audit Wireless Report-Kolkata Circle JAS Quarter-2016
175
100 Police Y 20 18
101 Fire Y 20 18
102 Ambulance Y 20 18
104 Health Information Helpline N
108 Emergency and Disaster Management Helpline N
138 All India Helpine for Passangers Y 20 18
149 Public Road Transport Utility Service Y 20 18
181 Chief Minister Helpline Y 20 18
182 Indian Railway Security Helpline Y 20 18
1033 Road Accident Management Service N
1037 Public Grievance Cell DoT Hq as 'Telecom Consumer Grievance Redressal Helpline'
N
1056 Emergency Medical Services N
106X State of the Art Hospitals N
1063 Public Grievance Cell DoT Hq N
1064 Anti Corruption Helpline N
1070 Relief Commission for Natural Calamities Y 20 18
1071 Air Accident Helpline N
1072 Rail Accident Helpline N
1073 Road Accident Helpline N
1077 Control Room for District Collector N
1090 Call Alart ( Crime Branch) Y 20 18
1091 Women Helpline Y 20 18
1097 National AIDS Helpline to NACO Y 20 18
1099 Central Accident and Trauma Services (CATS) N
10580 Educationa & Vocational Guidance and Counselling
N
10589 Mother and Child Tracking ( MCTH) N
10740 Central Pollution Control Board N
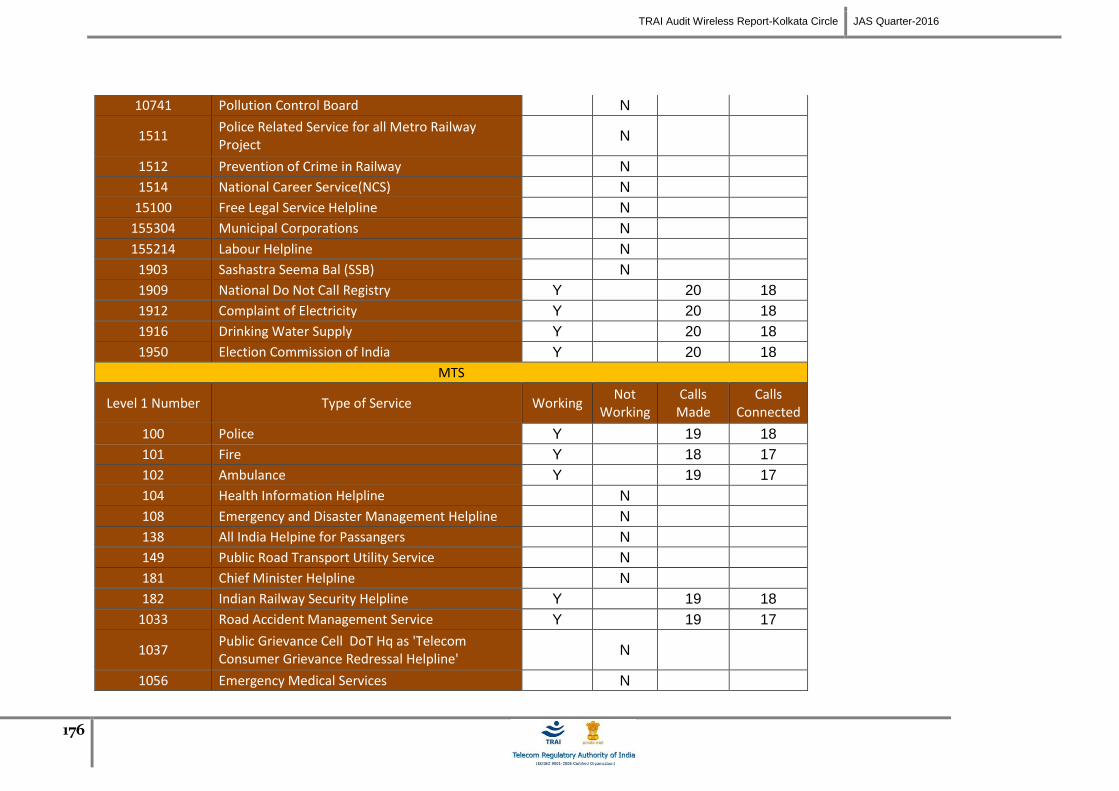
TRAI Audit Wireless Report-Kolkata Circle JAS Quarter-2016
176
10741 Pollution Control Board N
1511 Police Related Service for all Metro Railway Project
N
1512 Prevention of Crime in Railway N
1514 National Career Service(NCS) N
15100 Free Legal Service Helpline N
155304 Municipal Corporations N
155214 Labour Helpline N
1903 Sashastra Seema Bal (SSB) N
1909 National Do Not Call Registry Y 20 18
1912 Complaint of Electricity Y 20 18
1916 Drinking Water Supply Y 20 18
1950 Election Commission of India Y 20 18
MTS
Level 1 Number Type of Service Working Not
Working Calls
Made Calls
Connected
100 Police Y 19 18
101 Fire Y 18 17
102 Ambulance Y 19 17
104 Health Information Helpline N
108 Emergency and Disaster Management Helpline N
138 All India Helpine for Passangers N
149 Public Road Transport Utility Service N
181 Chief Minister Helpline N
182 Indian Railway Security Helpline Y 19 18
1033 Road Accident Management Service Y 19 17
1037 Public Grievance Cell DoT Hq as 'Telecom Consumer Grievance Redressal Helpline'
N
1056 Emergency Medical Services N

TRAI Audit Wireless Report-Kolkata Circle JAS Quarter-2016
177
106X State of the Art Hospitals N
1063 Public Grievance Cell DoT Hq N
1064 Anti Corruption Helpline N
1070 Relief Commission for Natural Calamities N
1071 Air Accident Helpline Y 19 18
1072 Rail Accident Helpline Y 19 17
1073 Road Accident Helpline Y 19 17
1077 Control Room for District Collector N
1090 Call Alart ( Crime Branch) N
1091 Women Helpline Y 18 17
1097 National AIDS Helpline to NACO Y 19 17
1099 Central Accident and Trauma Services (CATS) N
10580 Educationa & Vocational Guidance and Counselling
N
10589 Mother and Child Tracking ( MCTH) N
10740 Central Pollution Control Board N
10741 Pollution Control Board N
1511 Police Related Service for all Metro Railway Project
N
1512 Prevention of Crime in Railway Y 19 17
1514 National Career Service(NCS) N
15100 Free Legal Service Helpline N
155304 Municipal Corporations N
155214 Labour Helpline N
1903 Sashastra Seema Bal (SSB) Y 19 17
1909 National Do Not Call Registry Y 18 17
1912 Complaint of Electricity Y 19 17
1916 Drinking Water Supply Y 19 17
1950 Election Commission of India Y 18 17

TRAI Audit Wireless Report-Kolkata Circle JAS Quarter-2016
178
Reliance GSM
Level 1 Number Type of Service Working Not
Working Calls
Made Calls
Connected
100 Police Y 25 24
101 Fire Y 25 23
102 Ambulance N
104 Health Information Helpline N
108 Emergency and Disaster Management Helpline N
138 All India Helpine for Passangers N
149 Public Road Transport Utility Service N
181 Chief Minister Helpline N
182 Indian Railway Security Helpline N
1033 Road Accident Management Service N
1037 Public Grievance Cell DoT Hq as 'Telecom Consumer Grievance Redressal Helpline'
N
1056 Emergency Medical Services N
106X State of the Art Hospitals N
1063 Public Grievance Cell DoT Hq N
1064 Anti Corruption Helpline N
1070 Relief Commission for Natural Calamities Y 25 24
1071 Air Accident Helpline Y 25 23
1072 Rail Accident Helpline N
1073 Road Accident Helpline Y 25 24
1077 Control Room for District Collector N
1090 Call Alart ( Crime Branch) N
1091 Women Helpline Y 25 24
1097 National AIDS Helpline to NACO Y 25 24
1099 Central Accident and Trauma Services (CATS) N
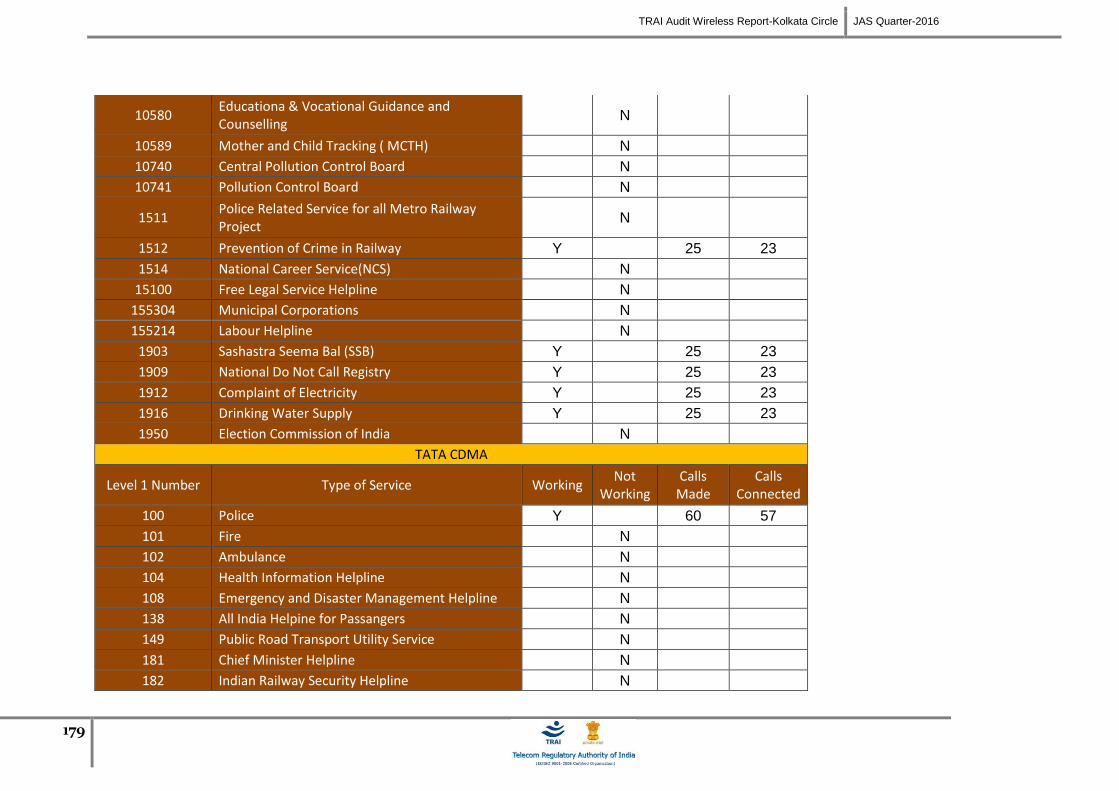
TRAI Audit Wireless Report-Kolkata Circle JAS Quarter-2016
179
10580 Educationa & Vocational Guidance and Counselling
N
10589 Mother and Child Tracking ( MCTH) N
10740 Central Pollution Control Board N
10741 Pollution Control Board N
1511 Police Related Service for all Metro Railway Project
N
1512 Prevention of Crime in Railway Y 25 23
1514 National Career Service(NCS) N
15100 Free Legal Service Helpline N
155304 Municipal Corporations N
155214 Labour Helpline N
1903 Sashastra Seema Bal (SSB) Y 25 23
1909 National Do Not Call Registry Y 25 23
1912 Complaint of Electricity Y 25 23
1916 Drinking Water Supply Y 25 23
1950 Election Commission of India N
TATA CDMA
Level 1 Number Type of Service Working Not
Working Calls
Made Calls
Connected
100 Police Y 60 57
101 Fire N
102 Ambulance N
104 Health Information Helpline N
108 Emergency and Disaster Management Helpline N
138 All India Helpine for Passangers N
149 Public Road Transport Utility Service N
181 Chief Minister Helpline N
182 Indian Railway Security Helpline N
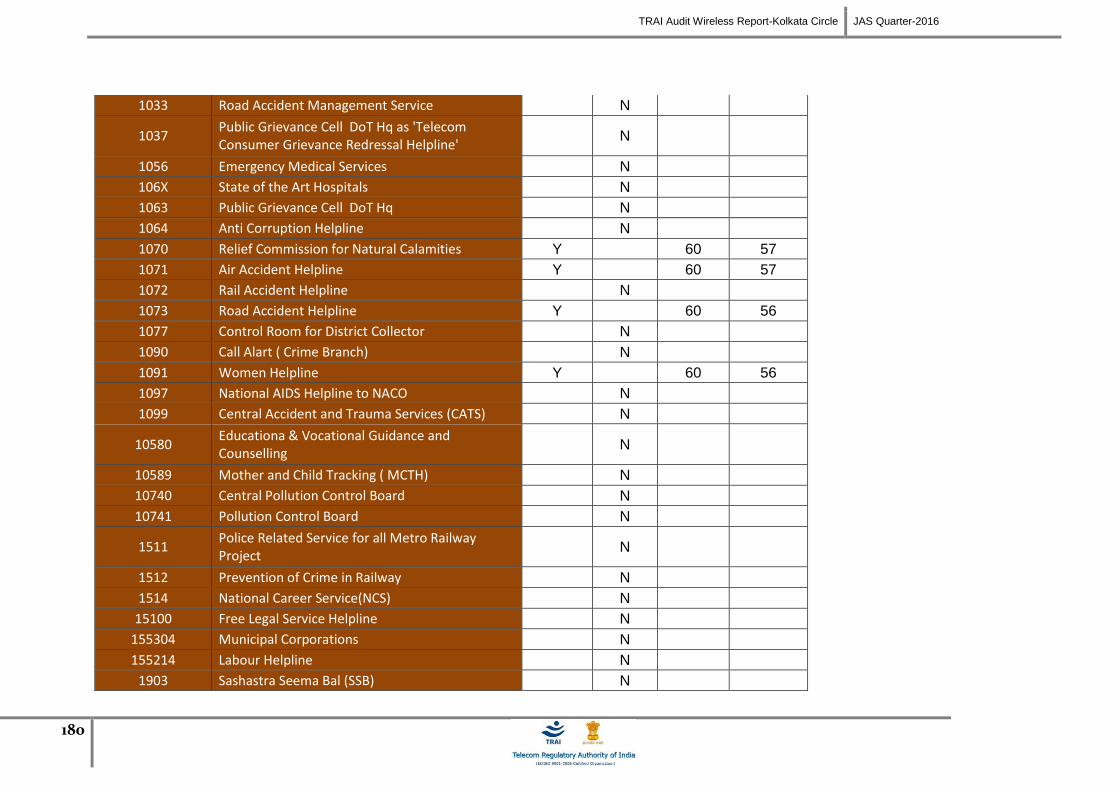
TRAI Audit Wireless Report-Kolkata Circle JAS Quarter-2016
180
1033 Road Accident Management Service N
1037 Public Grievance Cell DoT Hq as 'Telecom Consumer Grievance Redressal Helpline'
N
1056 Emergency Medical Services N
106X State of the Art Hospitals N
1063 Public Grievance Cell DoT Hq N
1064 Anti Corruption Helpline N
1070 Relief Commission for Natural Calamities Y 60 57
1071 Air Accident Helpline Y 60 57
1072 Rail Accident Helpline N
1073 Road Accident Helpline Y 60 56
1077 Control Room for District Collector N
1090 Call Alart ( Crime Branch) N
1091 Women Helpline Y 60 56
1097 National AIDS Helpline to NACO N
1099 Central Accident and Trauma Services (CATS) N
10580 Educationa & Vocational Guidance and Counselling
N
10589 Mother and Child Tracking ( MCTH) N
10740 Central Pollution Control Board N
10741 Pollution Control Board N
1511 Police Related Service for all Metro Railway Project
N
1512 Prevention of Crime in Railway N
1514 National Career Service(NCS) N
15100 Free Legal Service Helpline N
155304 Municipal Corporations N
155214 Labour Helpline N
1903 Sashastra Seema Bal (SSB) N
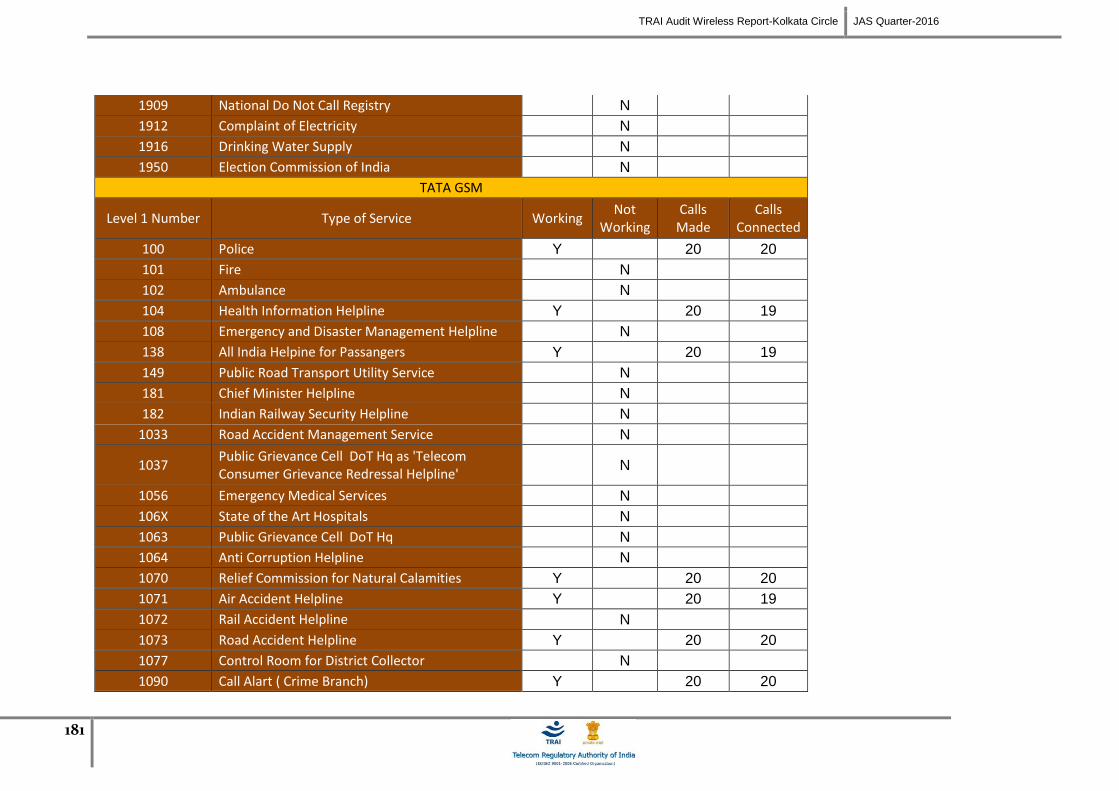
TRAI Audit Wireless Report-Kolkata Circle JAS Quarter-2016
181
1909 National Do Not Call Registry N
1912 Complaint of Electricity N
1916 Drinking Water Supply N
1950 Election Commission of India N
TATA GSM
Level 1 Number Type of Service Working Not
Working Calls
Made Calls
Connected
100 Police Y 20 20
101 Fire N
102 Ambulance N
104 Health Information Helpline Y 20 19
108 Emergency and Disaster Management Helpline N
138 All India Helpine for Passangers Y 20 19
149 Public Road Transport Utility Service N
181 Chief Minister Helpline N
182 Indian Railway Security Helpline N
1033 Road Accident Management Service N
1037 Public Grievance Cell DoT Hq as 'Telecom Consumer Grievance Redressal Helpline'
N
1056 Emergency Medical Services N
106X State of the Art Hospitals N
1063 Public Grievance Cell DoT Hq N
1064 Anti Corruption Helpline N
1070 Relief Commission for Natural Calamities Y 20 20
1071 Air Accident Helpline Y 20 19
1072 Rail Accident Helpline N
1073 Road Accident Helpline Y 20 20
1077 Control Room for District Collector N
1090 Call Alart ( Crime Branch) Y 20 20
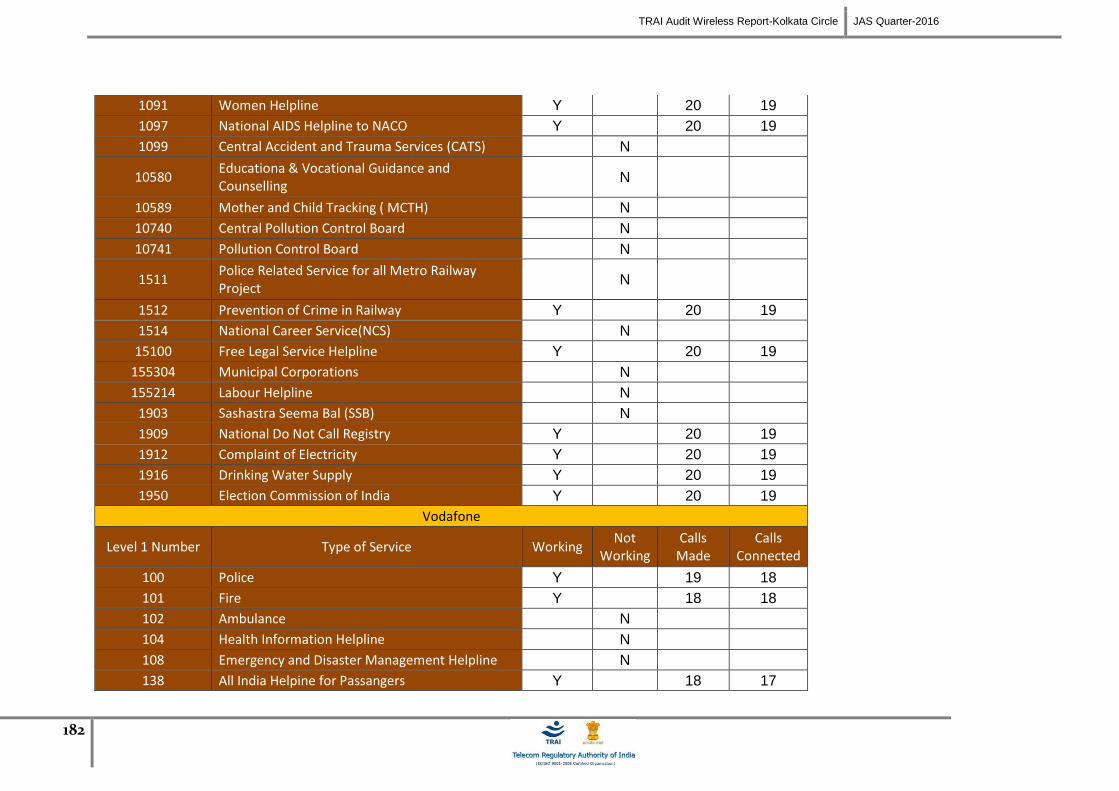
TRAI Audit Wireless Report-Kolkata Circle JAS Quarter-2016
182
1091 Women Helpline Y 20 19
1097 National AIDS Helpline to NACO Y 20 19
1099 Central Accident and Trauma Services (CATS) N
10580 Educationa & Vocational Guidance and Counselling
N
10589 Mother and Child Tracking ( MCTH) N
10740 Central Pollution Control Board N
10741 Pollution Control Board N
1511 Police Related Service for all Metro Railway Project
N
1512 Prevention of Crime in Railway Y 20 19
1514 National Career Service(NCS) N
15100 Free Legal Service Helpline Y 20 19
155304 Municipal Corporations N
155214 Labour Helpline N
1903 Sashastra Seema Bal (SSB) N
1909 National Do Not Call Registry Y 20 19
1912 Complaint of Electricity Y 20 19
1916 Drinking Water Supply Y 20 19
1950 Election Commission of India Y 20 19
Vodafone
Level 1 Number Type of Service Working Not
Working Calls
Made Calls
Connected
100 Police Y 19 18
101 Fire Y 18 18
102 Ambulance N
104 Health Information Helpline N
108 Emergency and Disaster Management Helpline N
138 All India Helpine for Passangers Y 18 17
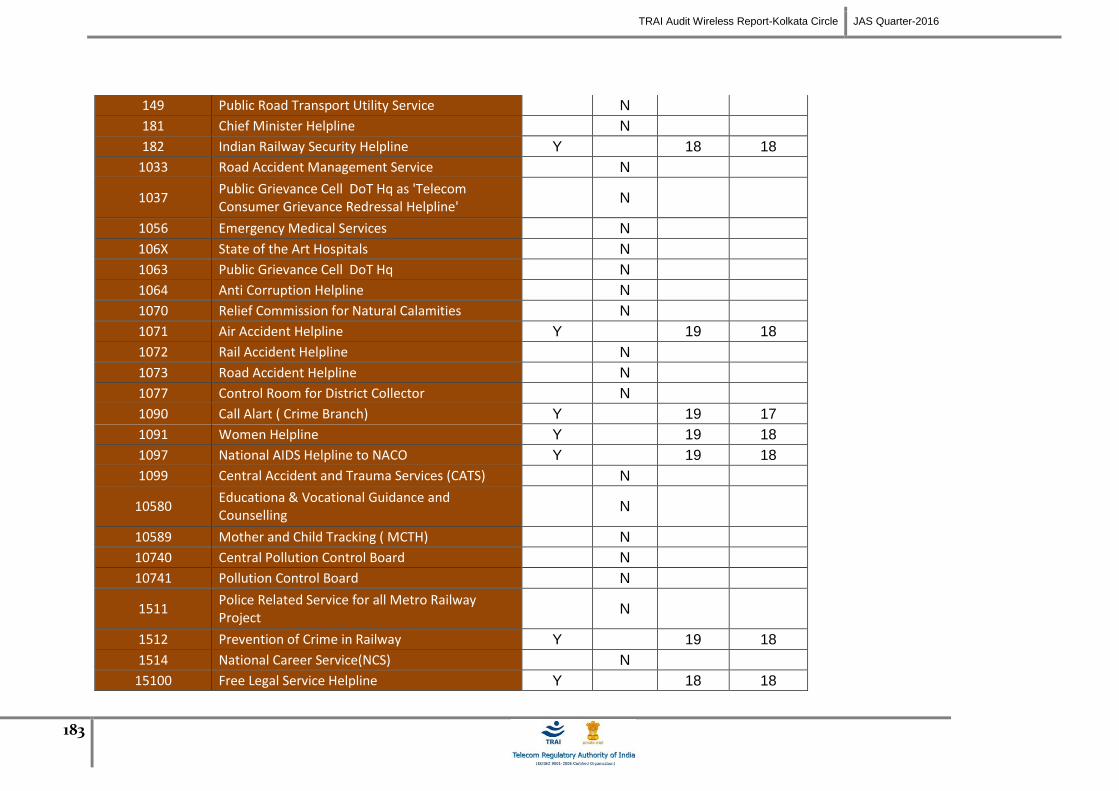
TRAI Audit Wireless Report-Kolkata Circle JAS Quarter-2016
183
149 Public Road Transport Utility Service N
181 Chief Minister Helpline N
182 Indian Railway Security Helpline Y 18 18
1033 Road Accident Management Service N
1037 Public Grievance Cell DoT Hq as 'Telecom Consumer Grievance Redressal Helpline'
N
1056 Emergency Medical Services N
106X State of the Art Hospitals N
1063 Public Grievance Cell DoT Hq N
1064 Anti Corruption Helpline N
1070 Relief Commission for Natural Calamities N
1071 Air Accident Helpline Y 19 18
1072 Rail Accident Helpline N
1073 Road Accident Helpline N
1077 Control Room for District Collector N
1090 Call Alart ( Crime Branch) Y 19 17
1091 Women Helpline Y 19 18
1097 National AIDS Helpline to NACO Y 19 18
1099 Central Accident and Trauma Services (CATS) N
10580 Educationa & Vocational Guidance and Counselling
N
10589 Mother and Child Tracking ( MCTH) N
10740 Central Pollution Control Board N
10741 Pollution Control Board N
1511 Police Related Service for all Metro Railway Project
N
1512 Prevention of Crime in Railway Y 19 18
1514 National Career Service(NCS) N
15100 Free Legal Service Helpline Y 18 18

TRAI Audit Wireless Report-Kolkata Circle JAS Quarter-2016
184
155304 Municipal Corporations N
155214 Labour Helpline Y 19 17
1903 Sashastra Seema Bal (SSB) Y 19 18
1909 National Do Not Call Registry Y 19 18
1912 Complaint of Electricity Y 19 17
1916 Drinking Water Supply Y 19 17
1950 Election Commission of India Y 19 17
Data Source: Live calls made by auditors from operator’s network
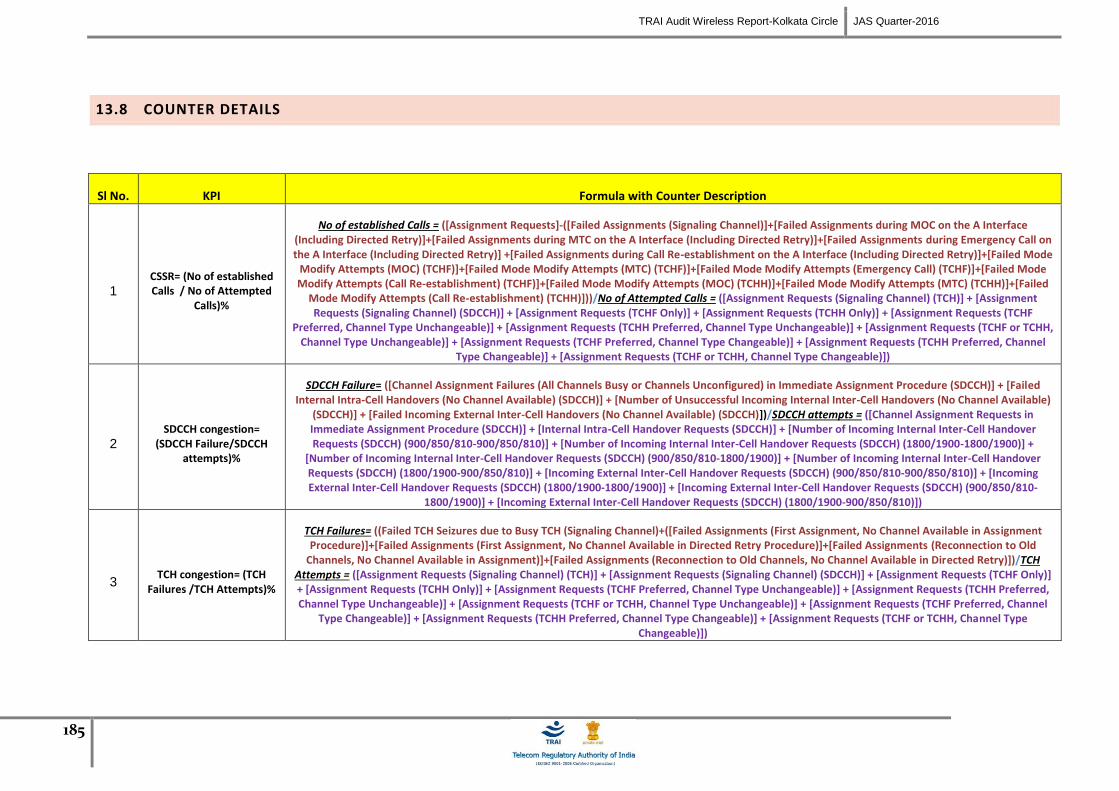
TRAI Audit Wireless Report-Kolkata Circle JAS Quarter-2016
185
13.8 COUNTER DETAILS
Sl No. KPI Formula with Counter Description
1 CSSR= (No of established Calls / No of Attempted
Calls)%
No of established Calls = ([Assignment Requests]-([Failed Assignments (Signaling Channel)]+[Failed Assignments during MOC on the A Interface (Including Directed Retry)]+[Failed Assignments during MTC on the A Interface (Including Directed Retry)]+[Failed Assignments during Emergency Call on the A Interface (Including Directed Retry)] +[Failed Assignments during Call Re-establishment on the A Interface (Including Directed Retry)]+[Failed Mode
Modify Attempts (MOC) (TCHF)]+[Failed Mode Modify Attempts (MTC) (TCHF)]+[Failed Mode Modify Attempts (Emergency Call) (TCHF)]+[Failed Mode Modify Attempts (Call Re-establishment) (TCHF)]+[Failed Mode Modify Attempts (MOC) (TCHH)]+[Failed Mode Modify Attempts (MTC) (TCHH)]+[Failed
Mode Modify Attempts (Call Re-establishment) (TCHH)]))/No of Attempted Calls = ([Assignment Requests (Signaling Channel) (TCH)] + [Assignment Requests (Signaling Channel) (SDCCH)] + [Assignment Requests (TCHF Only)] + [Assignment Requests (TCHH Only)] + [Assignment Requests (TCHF
Preferred, Channel Type Unchangeable)] + [Assignment Requests (TCHH Preferred, Channel Type Unchangeable)] + [Assignment Requests (TCHF or TCHH, Channel Type Unchangeable)] + [Assignment Requests (TCHF Preferred, Channel Type Changeable)] + [Assignment Requests (TCHH Preferred, Channel
Type Changeable)] + [Assignment Requests (TCHF or TCHH, Channel Type Changeable)])
2 SDCCH congestion=
(SDCCH Failure/SDCCH attempts)%
SDCCH Failure= ([Channel Assignment Failures (All Channels Busy or Channels Unconfigured) in Immediate Assignment Procedure (SDCCH)] + [Failed Internal Intra-Cell Handovers (No Channel Available) (SDCCH)] + [Number of Unsuccessful Incoming Internal Inter-Cell Handovers (No Channel Available)
(SDCCH)] + [Failed Incoming External Inter-Cell Handovers (No Channel Available) (SDCCH)])/SDCCH attempts = ([Channel Assignment Requests in Immediate Assignment Procedure (SDCCH)] + [Internal Intra-Cell Handover Requests (SDCCH)] + [Number of Incoming Internal Inter-Cell Handover Requests (SDCCH) (900/850/810-900/850/810)] + [Number of Incoming Internal Inter-Cell Handover Requests (SDCCH) (1800/1900-1800/1900)] +
[Number of Incoming Internal Inter-Cell Handover Requests (SDCCH) (900/850/810-1800/1900)] + [Number of Incoming Internal Inter-Cell Handover Requests (SDCCH) (1800/1900-900/850/810)] + [Incoming External Inter-Cell Handover Requests (SDCCH) (900/850/810-900/850/810)] + [Incoming External Inter-Cell Handover Requests (SDCCH) (1800/1900-1800/1900)] + [Incoming External Inter-Cell Handover Requests (SDCCH) (900/850/810-
1800/1900)] + [Incoming External Inter-Cell Handover Requests (SDCCH) (1800/1900-900/850/810)])
3 TCH congestion= (TCH
Failures /TCH Attempts)%
TCH Failures= ((Failed TCH Seizures due to Busy TCH (Signaling Channel)+([Failed Assignments (First Assignment, No Channel Available in Assignment Procedure)]+[Failed Assignments (First Assignment, No Channel Available in Directed Retry Procedure)]+[Failed Assignments (Reconnection to Old
Channels, No Channel Available in Assignment)]+[Failed Assignments (Reconnection to Old Channels, No Channel Available in Directed Retry)])/TCH Attempts = ([Assignment Requests (Signaling Channel) (TCH)] + [Assignment Requests (Signaling Channel) (SDCCH)] + [Assignment Requests (TCHF Only)] + [Assignment Requests (TCHH Only)] + [Assignment Requests (TCHF Preferred, Channel Type Unchangeable)] + [Assignment Requests (TCHH Preferred, Channel Type Unchangeable)] + [Assignment Requests (TCHF or TCHH, Channel Type Unchangeable)] + [Assignment Requests (TCHF Preferred, Channel
Type Changeable)] + [Assignment Requests (TCHH Preferred, Channel Type Changeable)] + [Assignment Requests (TCHF or TCHH, Channel Type Changeable)])
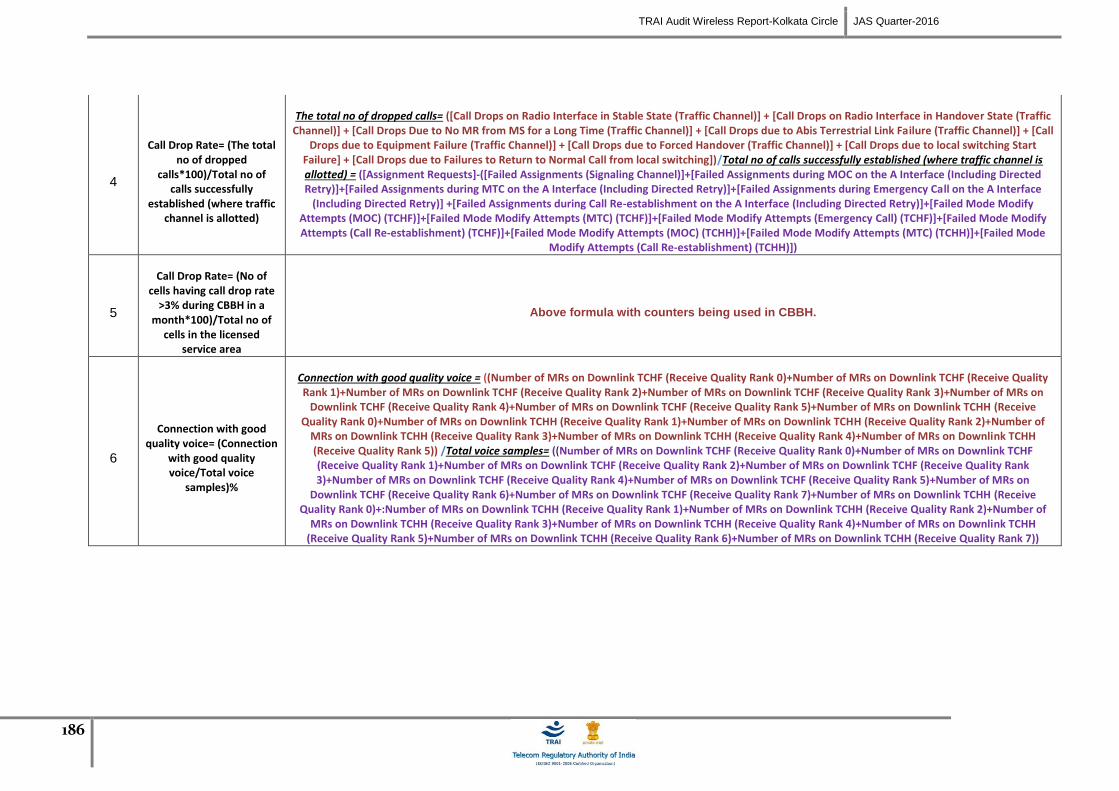
TRAI Audit Wireless Report-Kolkata Circle JAS Quarter-2016
186
4
Call Drop Rate= (The total no of dropped
calls*100)/Total no of calls successfully
established (where traffic channel is allotted)
The total no of dropped calls= ([Call Drops on Radio Interface in Stable State (Traffic Channel)] + [Call Drops on Radio Interface in Handover State (Traffic Channel)] + [Call Drops Due to No MR from MS for a Long Time (Traffic Channel)] + [Call Drops due to Abis Terrestrial Link Failure (Traffic Channel)] + [Call
Drops due to Equipment Failure (Traffic Channel)] + [Call Drops due to Forced Handover (Traffic Channel)] + [Call Drops due to local switching Start Failure] + [Call Drops due to Failures to Return to Normal Call from local switching])/Total no of calls successfully established (where traffic channel is allotted) = ([Assignment Requests]-([Failed Assignments (Signaling Channel)]+[Failed Assignments during MOC on the A Interface (Including Directed Retry)]+[Failed Assignments during MTC on the A Interface (Including Directed Retry)]+[Failed Assignments during Emergency Call on the A Interface
(Including Directed Retry)] +[Failed Assignments during Call Re-establishment on the A Interface (Including Directed Retry)]+[Failed Mode Modify Attempts (MOC) (TCHF)]+[Failed Mode Modify Attempts (MTC) (TCHF)]+[Failed Mode Modify Attempts (Emergency Call) (TCHF)]+[Failed Mode Modify Attempts (Call Re-establishment) (TCHF)]+[Failed Mode Modify Attempts (MOC) (TCHH)]+[Failed Mode Modify Attempts (MTC) (TCHH)]+[Failed Mode
Modify Attempts (Call Re-establishment) (TCHH)])
5
Call Drop Rate= (No of cells having call drop rate
>3% during CBBH in a month*100)/Total no of
cells in the licensed service area
Above formula with counters being used in CBBH.
6
Connection with good quality voice= (Connection
with good quality voice/Total voice
samples)%
Connection with good quality voice = ((Number of MRs on Downlink TCHF (Receive Quality Rank 0)+Number of MRs on Downlink TCHF (Receive Quality Rank 1)+Number of MRs on Downlink TCHF (Receive Quality Rank 2)+Number of MRs on Downlink TCHF (Receive Quality Rank 3)+Number of MRs on
Downlink TCHF (Receive Quality Rank 4)+Number of MRs on Downlink TCHF (Receive Quality Rank 5)+Number of MRs on Downlink TCHH (Receive Quality Rank 0)+Number of MRs on Downlink TCHH (Receive Quality Rank 1)+Number of MRs on Downlink TCHH (Receive Quality Rank 2)+Number of
MRs on Downlink TCHH (Receive Quality Rank 3)+Number of MRs on Downlink TCHH (Receive Quality Rank 4)+Number of MRs on Downlink TCHH (Receive Quality Rank 5)) /Total voice samples= ((Number of MRs on Downlink TCHF (Receive Quality Rank 0)+Number of MRs on Downlink TCHF (Receive Quality Rank 1)+Number of MRs on Downlink TCHF (Receive Quality Rank 2)+Number of MRs on Downlink TCHF (Receive Quality Rank 3)+Number of MRs on Downlink TCHF (Receive Quality Rank 4)+Number of MRs on Downlink TCHF (Receive Quality Rank 5)+Number of MRs on
Downlink TCHF (Receive Quality Rank 6)+Number of MRs on Downlink TCHF (Receive Quality Rank 7)+Number of MRs on Downlink TCHH (Receive Quality Rank 0)+:Number of MRs on Downlink TCHH (Receive Quality Rank 1)+Number of MRs on Downlink TCHH (Receive Quality Rank 2)+Number of
MRs on Downlink TCHH (Receive Quality Rank 3)+Number of MRs on Downlink TCHH (Receive Quality Rank 4)+Number of MRs on Downlink TCHH (Receive Quality Rank 5)+Number of MRs on Downlink TCHH (Receive Quality Rank 6)+Number of MRs on Downlink TCHH (Receive Quality Rank 7))
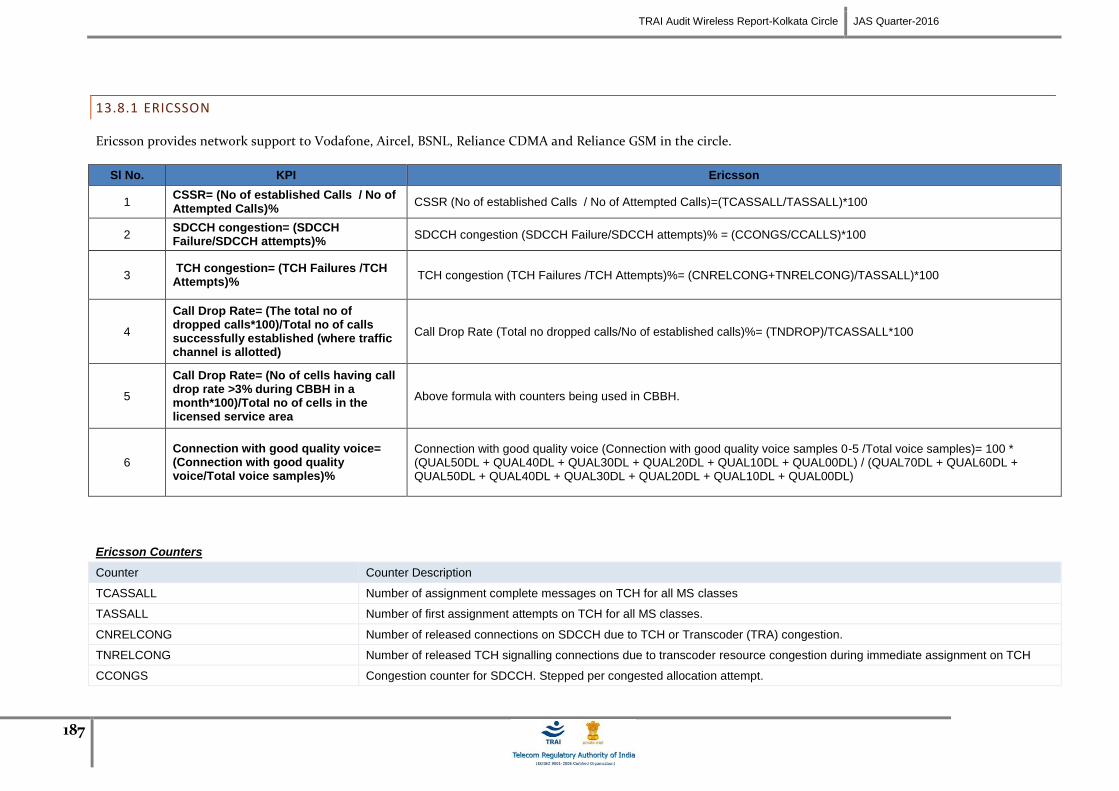
TRAI Audit Wireless Report-Kolkata Circle JAS Quarter-2016
187
13.8.1 ERICSSON
Ericsson provides network support to Vodafone, Aircel, BSNL, Reliance CDMA and Reliance GSM in the circle.
Sl No. KPI Ericsson
1 CSSR= (No of established Calls / No of Attempted Calls)%
CSSR (No of established Calls / No of Attempted Calls)=(TCASSALL/TASSALL)*100
2 SDCCH congestion= (SDCCH Failure/SDCCH attempts)%
SDCCH congestion (SDCCH Failure/SDCCH attempts)% = (CCONGS/CCALLS)*100
3 TCH congestion= (TCH Failures /TCH Attempts)%
TCH congestion (TCH Failures /TCH Attempts)%= (CNRELCONG+TNRELCONG)/TASSALL)*100
4
Call Drop Rate= (The total no of dropped calls*100)/Total no of calls successfully established (where traffic channel is allotted)
Call Drop Rate (Total no dropped calls/No of established calls)%= (TNDROP)/TCASSALL*100
5
Call Drop Rate= (No of cells having call drop rate >3% during CBBH in a month*100)/Total no of cells in the licensed service area
Above formula with counters being used in CBBH.
6
Connection with good quality voice= (Connection with good quality voice/Total voice samples)%
Connection with good quality voice (Connection with good quality voice samples 0-5 /Total voice samples)= 100 * (QUAL50DL + QUAL40DL + QUAL30DL + QUAL20DL + QUAL10DL + QUAL00DL) / (QUAL70DL + QUAL60DL + QUAL50DL + QUAL40DL + QUAL30DL + QUAL20DL + QUAL10DL + QUAL00DL)
Ericsson Counters
Counter Counter Description
TCASSALL Number of assignment complete messages on TCH for all MS classes
TASSALL Number of first assignment attempts on TCH for all MS classes.
CNRELCONG Number of released connections on SDCCH due to TCH or Transcoder (TRA) congestion.
TNRELCONG Number of released TCH signalling connections due to transcoder resource congestion during immediate assignment on TCH
CCONGS Congestion counter for SDCCH. Stepped per congested allocation attempt.
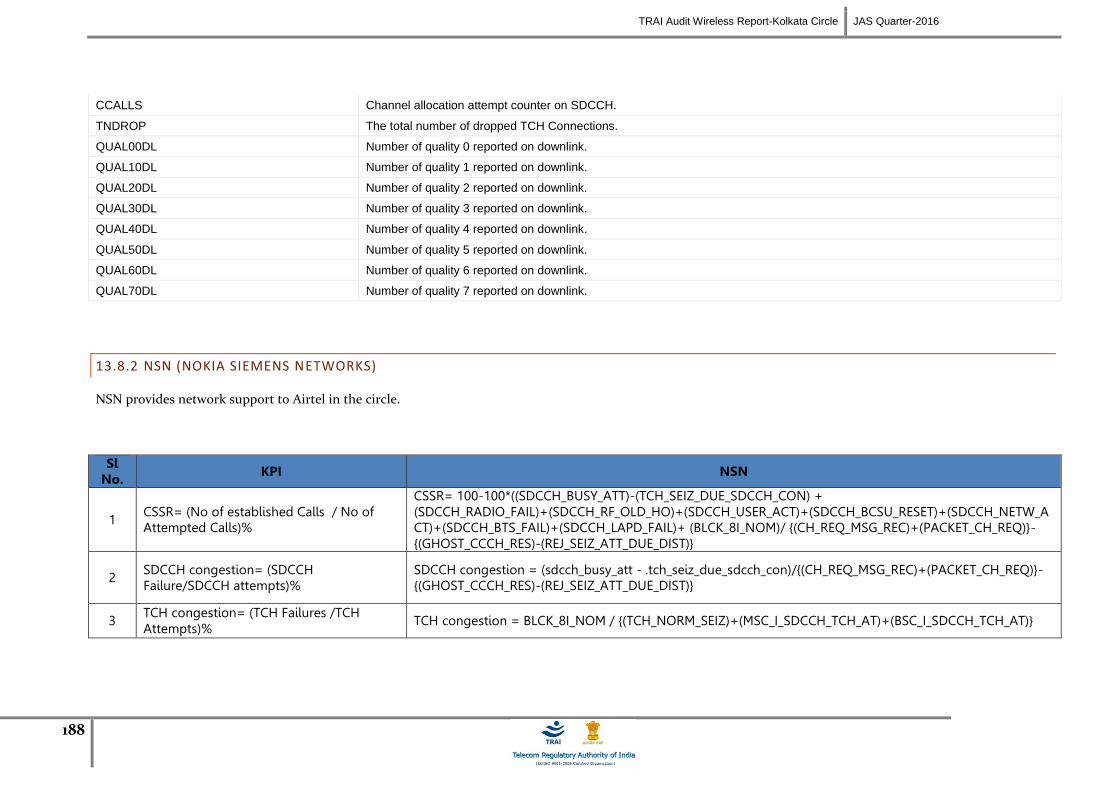
TRAI Audit Wireless Report-Kolkata Circle JAS Quarter-2016
188
CCALLS Channel allocation attempt counter on SDCCH.
TNDROP The total number of dropped TCH Connections.
QUAL00DL Number of quality 0 reported on downlink.
QUAL10DL Number of quality 1 reported on downlink.
QUAL20DL Number of quality 2 reported on downlink.
QUAL30DL Number of quality 3 reported on downlink.
QUAL40DL Number of quality 4 reported on downlink.
QUAL50DL Number of quality 5 reported on downlink.
QUAL60DL Number of quality 6 reported on downlink.
QUAL70DL Number of quality 7 reported on downlink.
13.8.2 NSN (NOKIA SIEMENS NETWORKS)
NSN provides network support to Airtel in the circle.
Sl No. KPI NSN
1 CSSR= (No of established Calls / No of Attempted Calls)%
CSSR= 100-100*((SDCCH_BUSY_ATT)-(TCH_SEIZ_DUE_SDCCH_CON) + (SDCCH_RADIO_FAIL)+(SDCCH_RF_OLD_HO)+(SDCCH_USER_ACT)+(SDCCH_BCSU_RESET)+(SDCCH_NETW_ACT)+(SDCCH_BTS_FAIL)+(SDCCH_LAPD_FAIL)+ (BLCK_8I_NOM)/ {(CH_REQ_MSG_REC)+(PACKET_CH_REQ)}-{(GHOST_CCCH_RES)-(REJ_SEIZ_ATT_DUE_DIST)}
2 SDCCH congestion= (SDCCH Failure/SDCCH attempts)%
SDCCH congestion = (sdcch_busy_att - .tch_seiz_due_sdcch_con)/{(CH_REQ_MSG_REC)+(PACKET_CH_REQ)}-{(GHOST_CCCH_RES)-(REJ_SEIZ_ATT_DUE_DIST)}
3 TCH congestion= (TCH Failures /TCH Attempts)%
TCH congestion = BLCK_8I_NOM / {(TCH_NORM_SEIZ)+(MSC_I_SDCCH_TCH_AT)+(BSC_I_SDCCH_TCH_AT)}
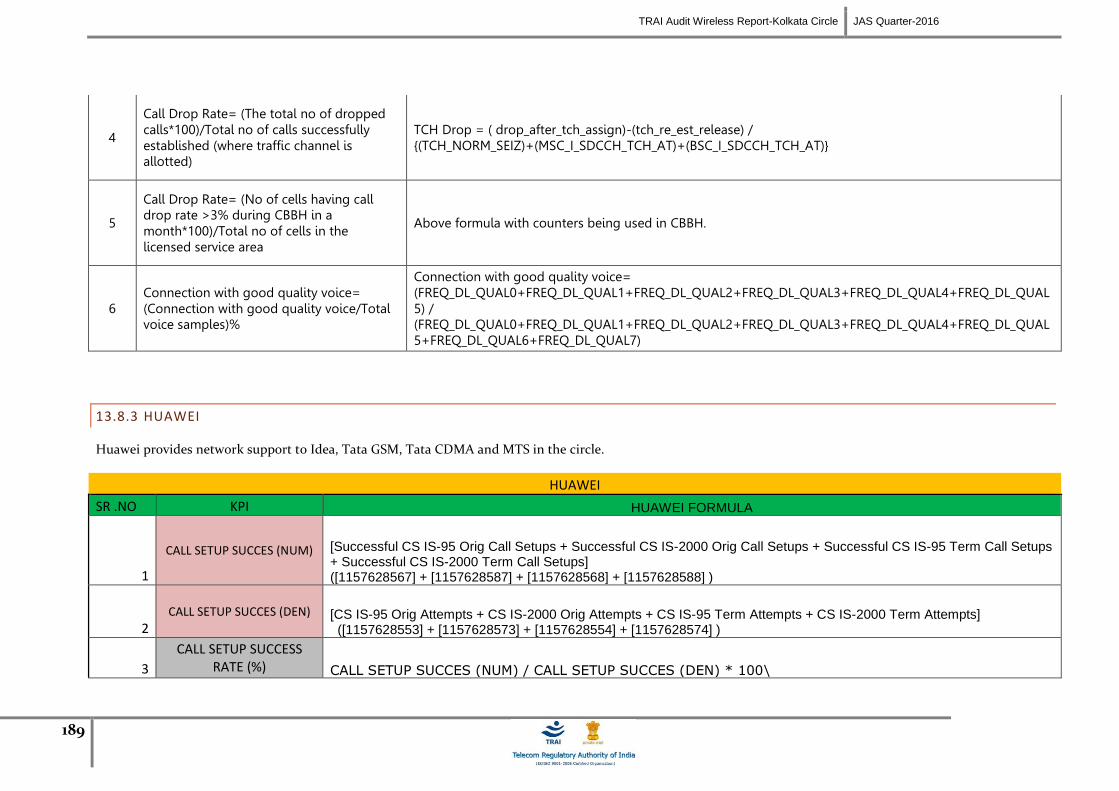
TRAI Audit Wireless Report-Kolkata Circle JAS Quarter-2016
189
4
Call Drop Rate= (The total no of dropped calls*100)/Total no of calls successfully established (where traffic channel is allotted)
TCH Drop = ( drop_after_tch_assign)-(tch_re_est_release) / {(TCH_NORM_SEIZ)+(MSC_I_SDCCH_TCH_AT)+(BSC_I_SDCCH_TCH_AT)}
5
Call Drop Rate= (No of cells having call drop rate >3% during CBBH in a month*100)/Total no of cells in the licensed service area
Above formula with counters being used in CBBH.
6 Connection with good quality voice= (Connection with good quality voice/Total voice samples)%
Connection with good quality voice= (FREQ_DL_QUAL0+FREQ_DL_QUAL1+FREQ_DL_QUAL2+FREQ_DL_QUAL3+FREQ_DL_QUAL4+FREQ_DL_QUAL5) / (FREQ_DL_QUAL0+FREQ_DL_QUAL1+FREQ_DL_QUAL2+FREQ_DL_QUAL3+FREQ_DL_QUAL4+FREQ_DL_QUAL5+FREQ_DL_QUAL6+FREQ_DL_QUAL7)
13.8.3 HUAWEI
Huawei provides network support to Idea, Tata GSM, Tata CDMA and MTS in the circle.
HUAWEI
SR .NO KPI HUAWEI FORMULA
1
CALL SETUP SUCCES (NUM)
[Successful CS IS-95 Orig Call Setups + Successful CS IS-2000 Orig Call Setups + Successful CS IS-95 Term Call Setups + Successful CS IS-2000 Term Call Setups] ([1157628567] + [1157628587] + [1157628568] + [1157628588] )
2 CALL SETUP SUCCES (DEN) [CS IS-95 Orig Attempts + CS IS-2000 Orig Attempts + CS IS-95 Term Attempts + CS IS-2000 Term Attempts]
([1157628553] + [1157628573] + [1157628554] + [1157628574] )
3
CALL SETUP SUCCESS RATE (%) CALL SETUP SUCCES (NUM) / CALL SETUP SUCCES (DEN) * 100\
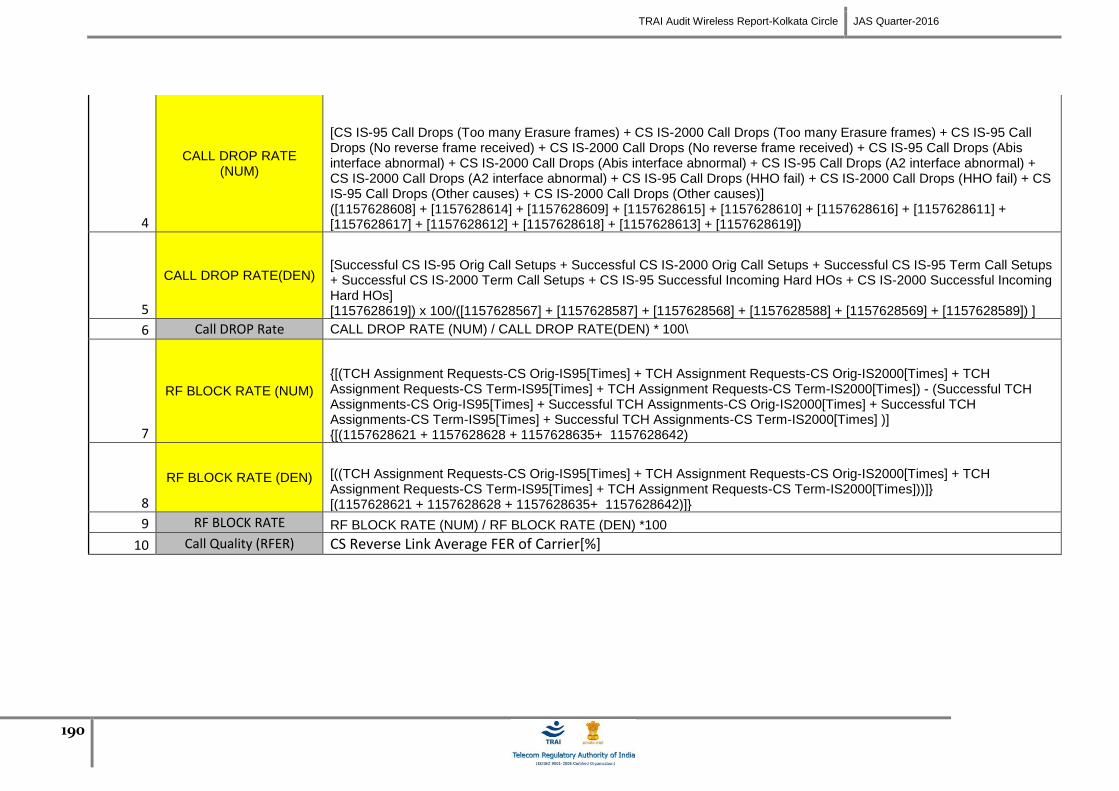
TRAI Audit Wireless Report-Kolkata Circle JAS Quarter-2016
190
4
CALL DROP RATE (NUM)
[CS IS-95 Call Drops (Too many Erasure frames) + CS IS-2000 Call Drops (Too many Erasure frames) + CS IS-95 Call Drops (No reverse frame received) + CS IS-2000 Call Drops (No reverse frame received) + CS IS-95 Call Drops (Abis interface abnormal) + CS IS-2000 Call Drops (Abis interface abnormal) + CS IS-95 Call Drops (A2 interface abnormal) + CS IS-2000 Call Drops (A2 interface abnormal) + CS IS-95 Call Drops (HHO fail) + CS IS-2000 Call Drops (HHO fail) + CS IS-95 Call Drops (Other causes) + CS IS-2000 Call Drops (Other causes)] ([1157628608] + [1157628614] + [1157628609] + [1157628615] + [1157628610] + [1157628616] + [1157628611] + [1157628617] + [1157628612] + [1157628618] + [1157628613] + [1157628619])
5
CALL DROP RATE(DEN) [Successful CS IS-95 Orig Call Setups + Successful CS IS-2000 Orig Call Setups + Successful CS IS-95 Term Call Setups + Successful CS IS-2000 Term Call Setups + CS IS-95 Successful Incoming Hard HOs + CS IS-2000 Successful Incoming Hard HOs] [1157628619]) x 100/([1157628567] + [1157628587] + [1157628568] + [1157628588] + [1157628569] + [1157628589]) ]
6 Call DROP Rate CALL DROP RATE (NUM) / CALL DROP RATE(DEN) * 100\
7
RF BLOCK RATE (NUM)
{[(TCH Assignment Requests-CS Orig-IS95[Times] + TCH Assignment Requests-CS Orig-IS2000[Times] + TCH Assignment Requests-CS Term-IS95[Times] + TCH Assignment Requests-CS Term-IS2000[Times]) - (Successful TCH Assignments-CS Orig-IS95[Times] + Successful TCH Assignments-CS Orig-IS2000[Times] + Successful TCH Assignments-CS Term-IS95[Times] + Successful TCH Assignments-CS Term-IS2000[Times] )] {[(1157628621 + 1157628628 + 1157628635+ 1157628642)
8
RF BLOCK RATE (DEN) [((TCH Assignment Requests-CS Orig-IS95[Times] + TCH Assignment Requests-CS Orig-IS2000[Times] + TCH Assignment Requests-CS Term-IS95[Times] + TCH Assignment Requests-CS Term-IS2000[Times]))]} [(1157628621 + 1157628628 + 1157628635+ 1157628642)]}
9 RF BLOCK RATE RF BLOCK RATE (NUM) / RF BLOCK RATE (DEN) *100
10 Call Quality (RFER) CS Reverse Link Average FER of Carrier[%]

TRAI Audit Wireless Report-Kolkata Circle JAS Quarter-2016
191
13.9 BLOCK SCHEMATIC DIAGRAMS
13.9.1 ERICSSON
Ericsson provides network support to Vodafone, Aircel, BSNL, Reliance CDMA and Reliance GSM in the
circle.
Ericsson
Mobile
BTS
BSS
MSC/GMSC
HLR
AUC
SIR
OGW
Server
Data to Auditor
OSS/OMCR
Base Transceiver
System
Base Station Sub
System
7 Days Storage
BTS BTS
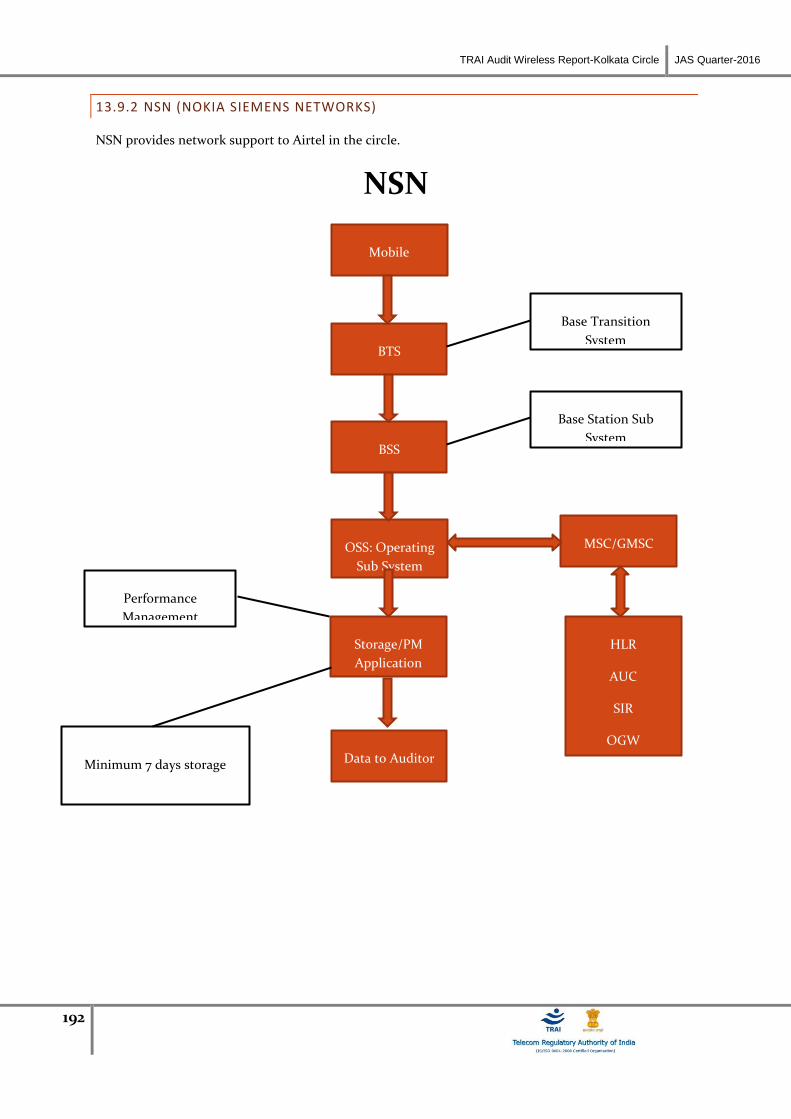
TRAI Audit Wireless Report-Kolkata Circle JAS Quarter-2016
192
13.9.2 NSN (NOKIA SIEMENS NETWORKS)
NSN provides network support to Airtel in the circle.
NSN
Mobile
BTS
BSS
MSC/GMSC
HLR
AUC
SIR
OGW
Storage/PM
Application
Data to Auditor
OSS: Operating
Sub System
Minimum 7 days storage
Base Transition
System
Base Station Sub
System
Performance
Management

193
13.9.3 HUAWEI
Huawei provides network support to Idea, Tata GSM, Tata CDMA and MTS in the circle.
Huawei
7 days data available
Mobile
BTS
BSS
MSC/GMSC
Data to Auditor
OSS/OMCR:
Operating Sub
System
Data Processing Server
Base Transition
System
Base Station Sub
System
Radio Related Reports
BTS BTS
Switch Reports
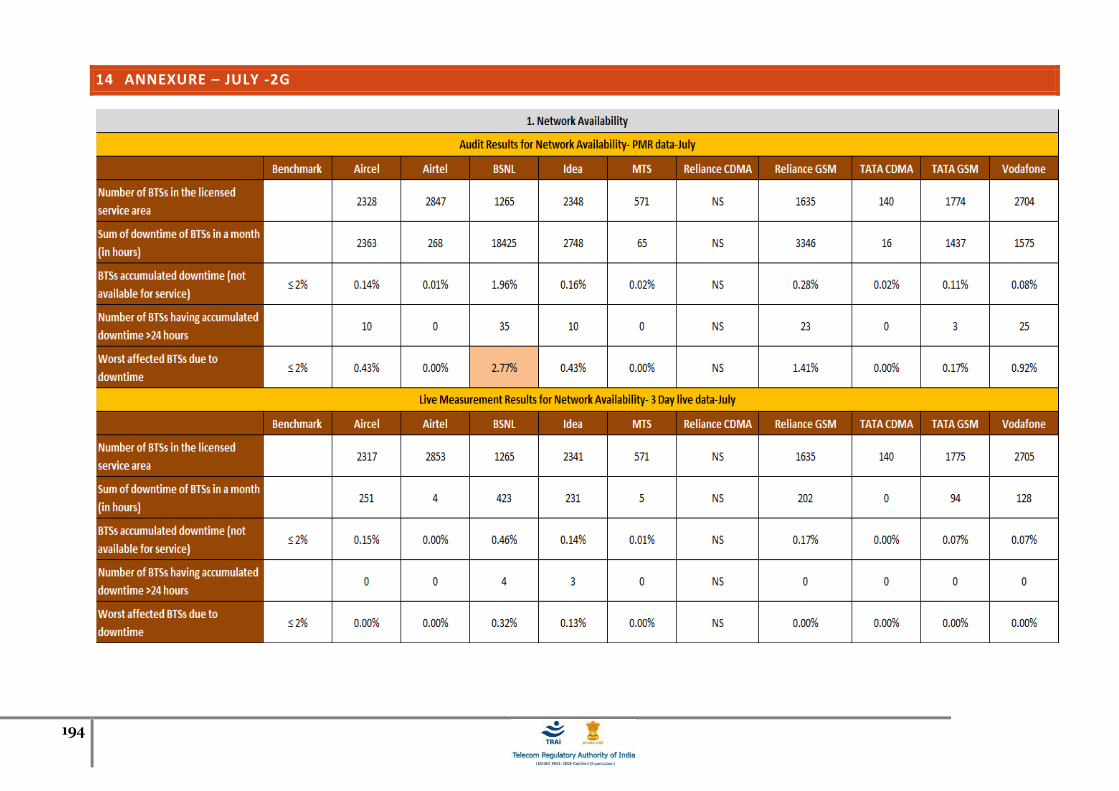
194
14 ANNEXURE – JULY -2G
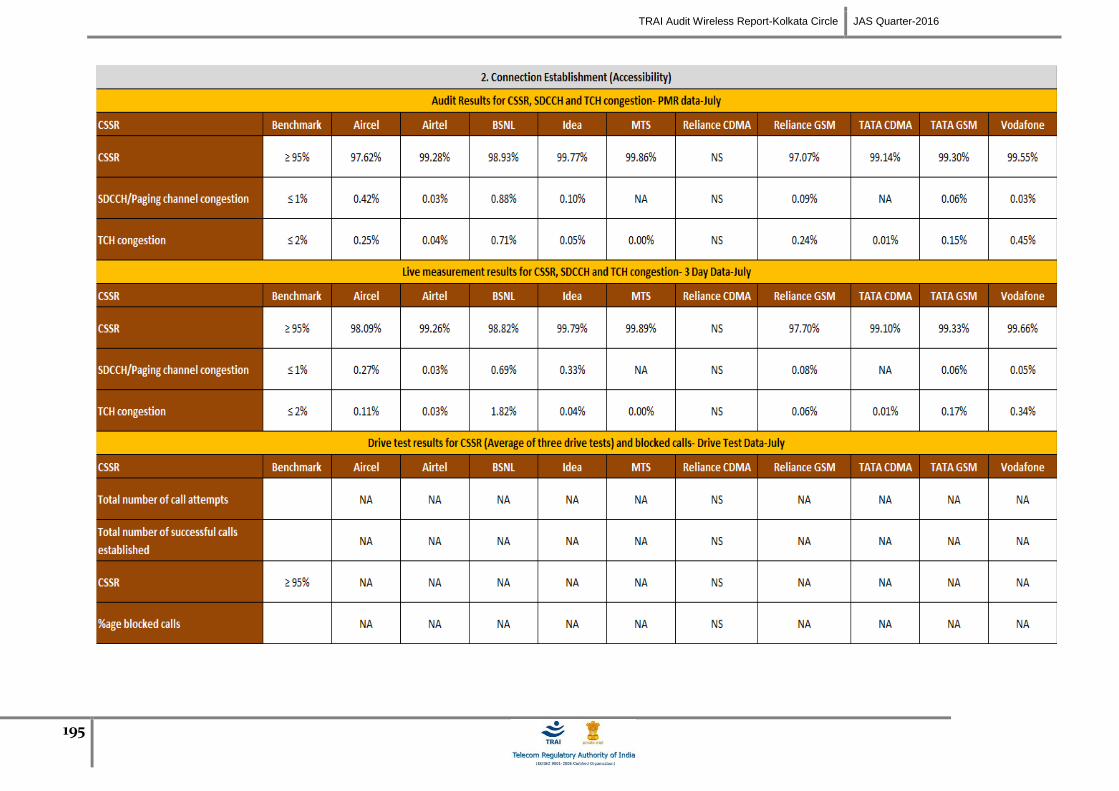
TRAI Audit Wireless Report-Kolkata Circle JAS Quarter-2016
195
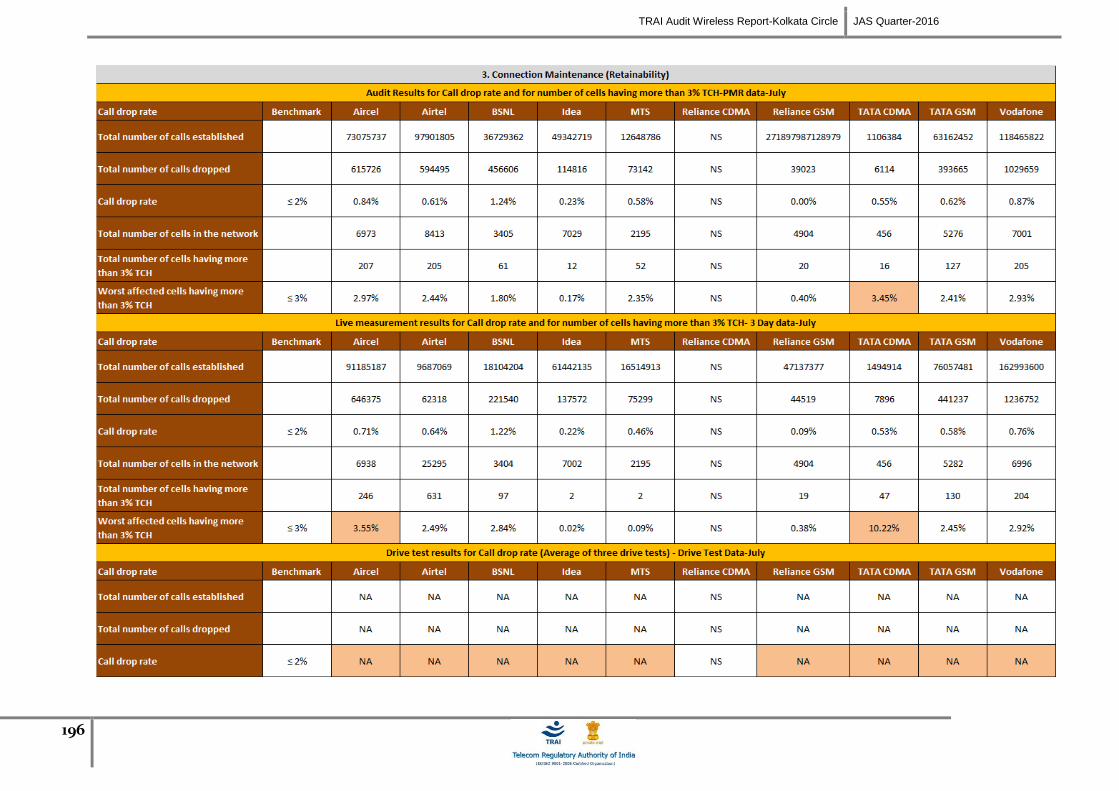
TRAI Audit Wireless Report-Kolkata Circle JAS Quarter-2016
196
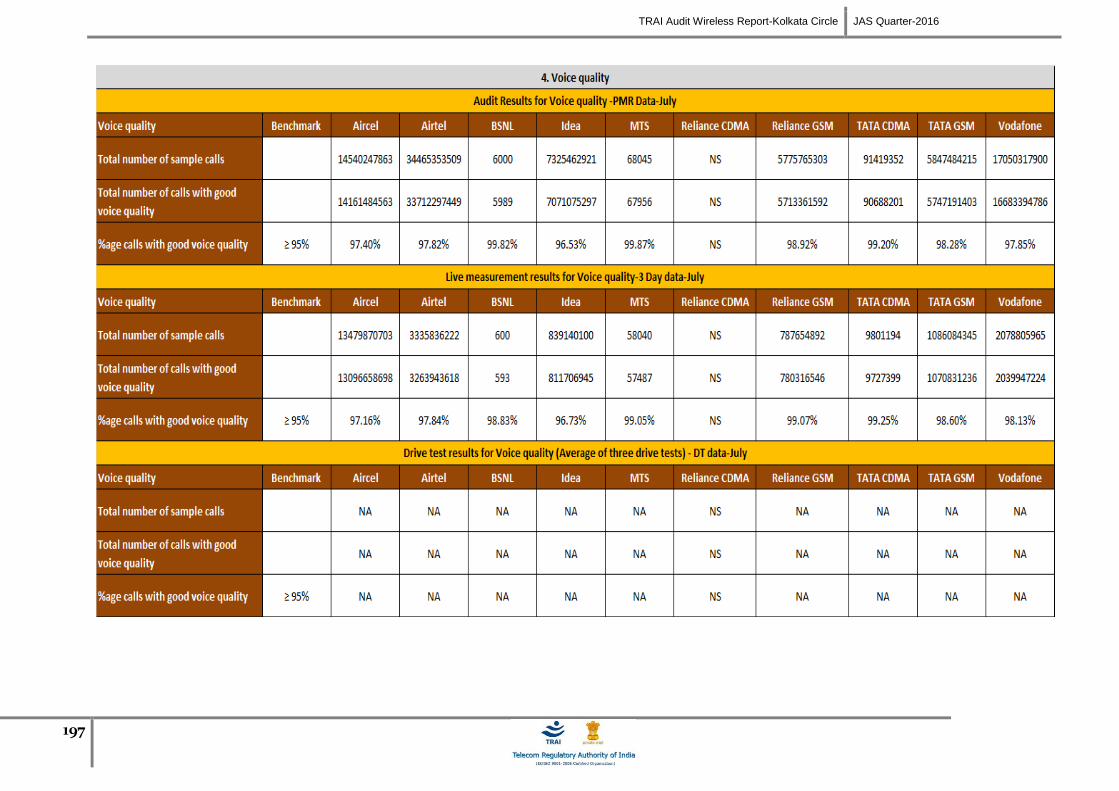
TRAI Audit Wireless Report-Kolkata Circle JAS Quarter-2016
197
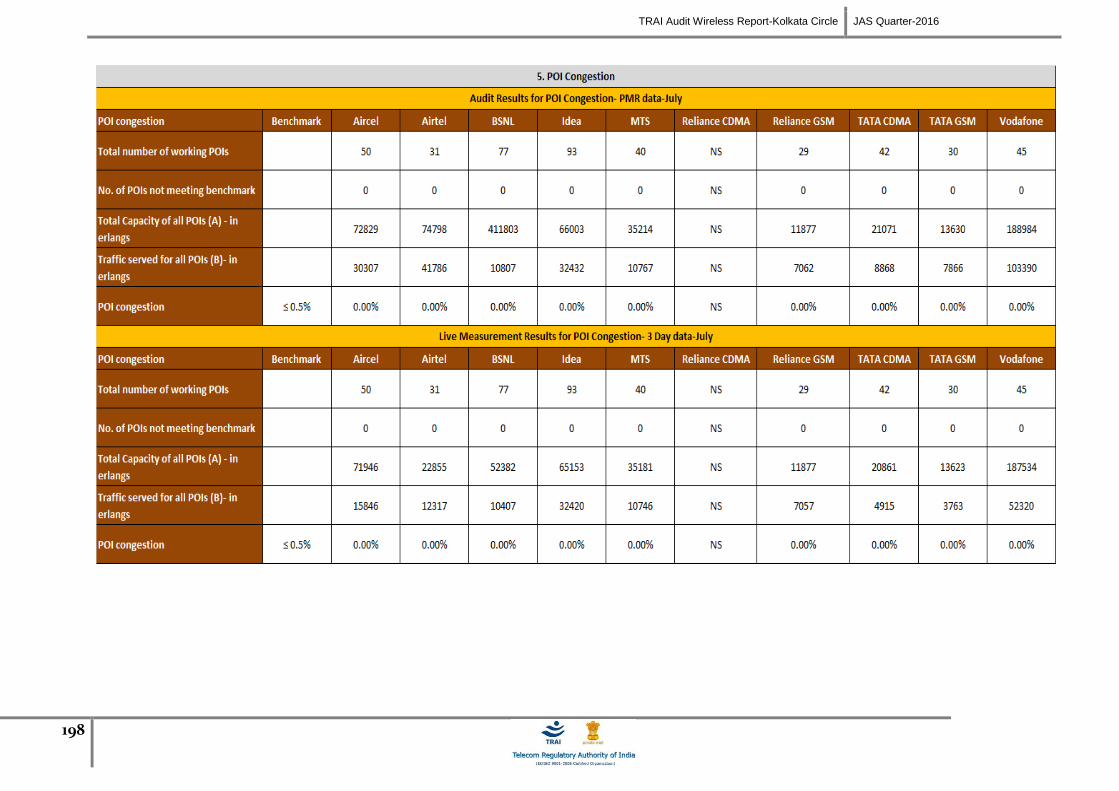
TRAI Audit Wireless Report-Kolkata Circle JAS Quarter-2016
198
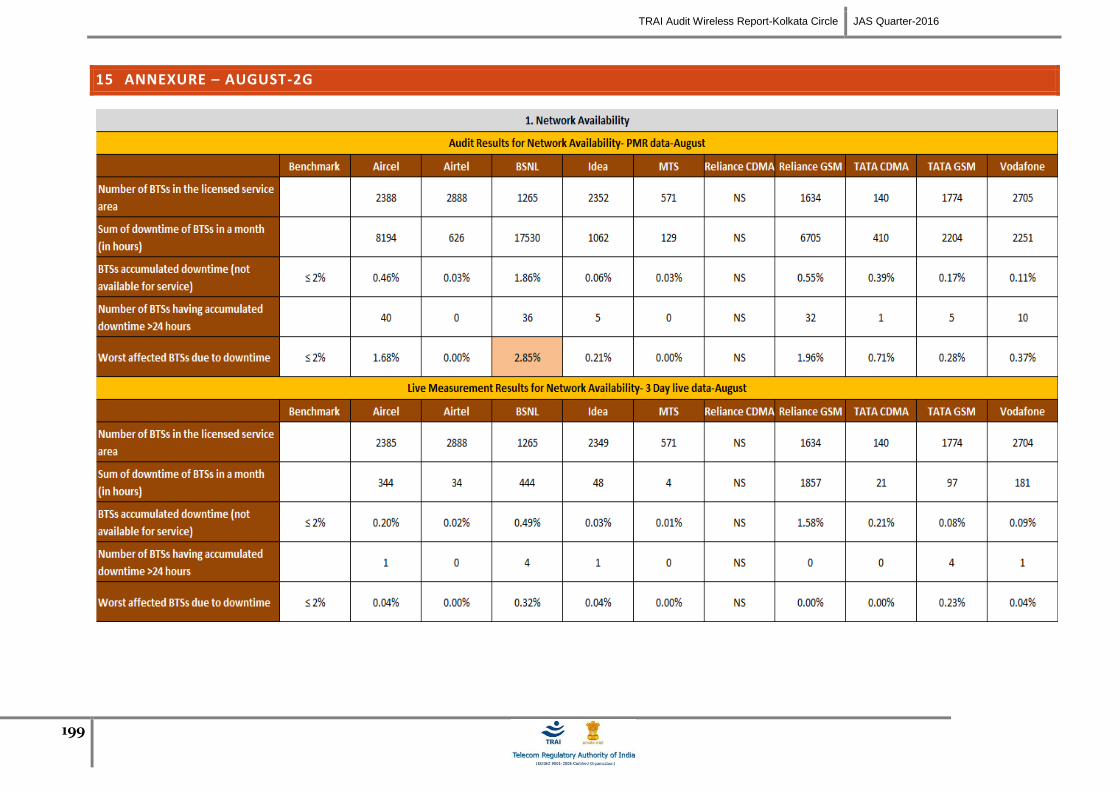
TRAI Audit Wireless Report-Kolkata Circle JAS Quarter-2016
199
15 ANNEXURE – AUGUST-2G
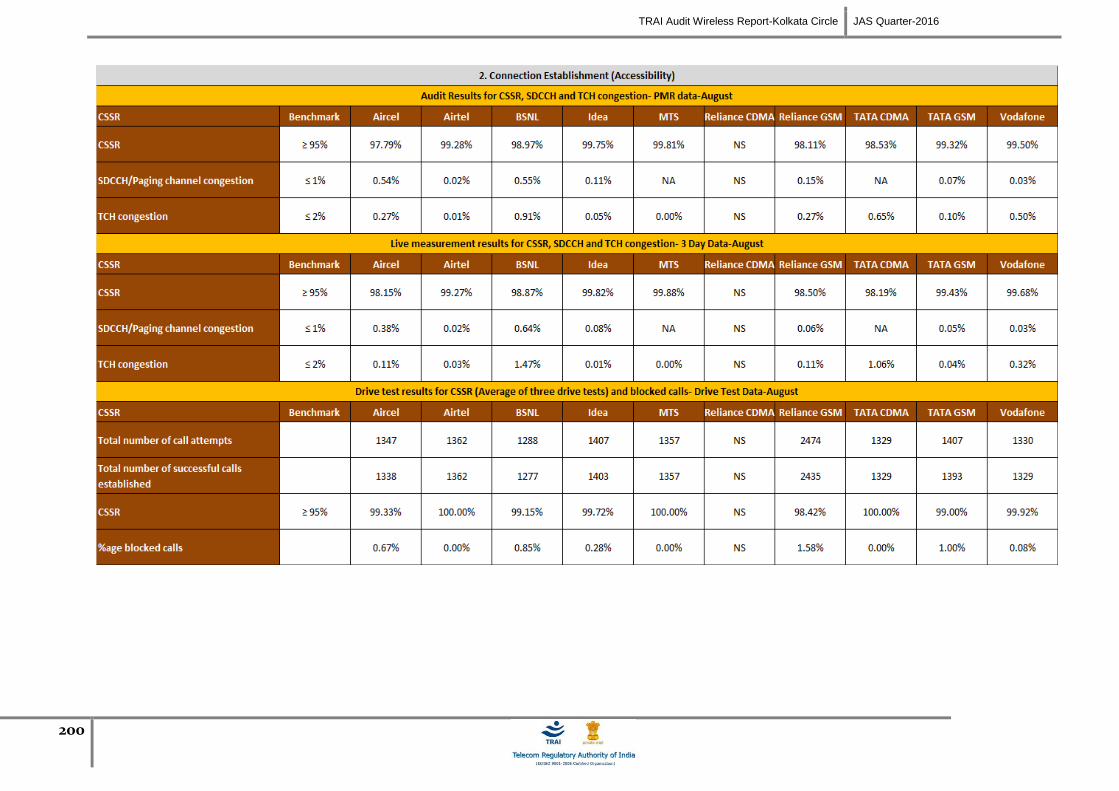
TRAI Audit Wireless Report-Kolkata Circle JAS Quarter-2016
200

TRAI Audit Wireless Report-Kolkata Circle JAS Quarter-2016
201
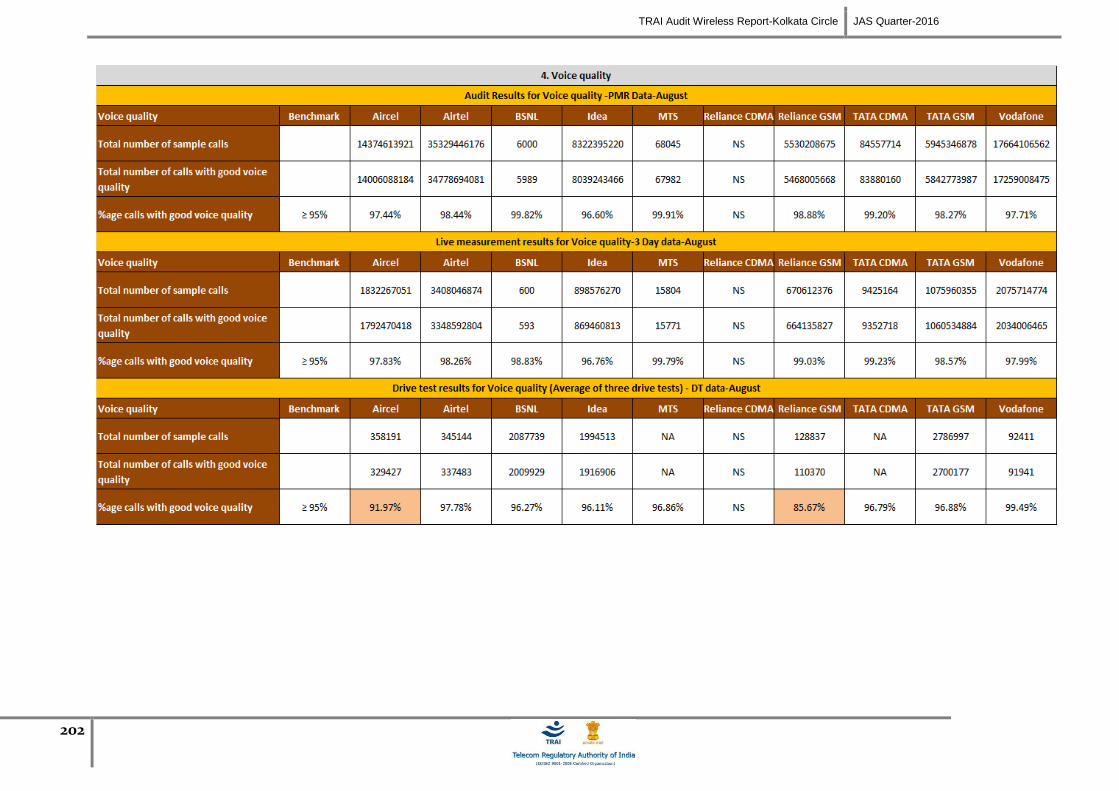
TRAI Audit Wireless Report-Kolkata Circle JAS Quarter-2016
202

TRAI Audit Wireless Report-Kolkata Circle JAS Quarter-2016
203
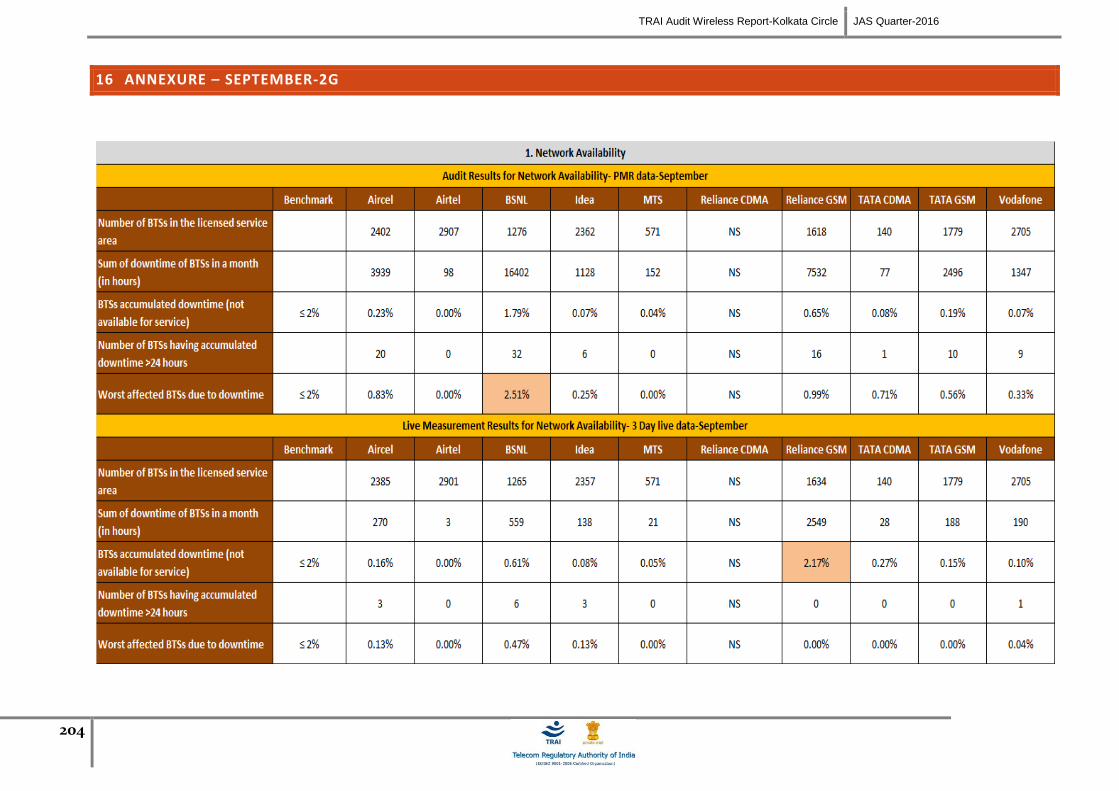
TRAI Audit Wireless Report-Kolkata Circle JAS Quarter-2016
204
16 ANNEXURE – SEPTEMBER-2G
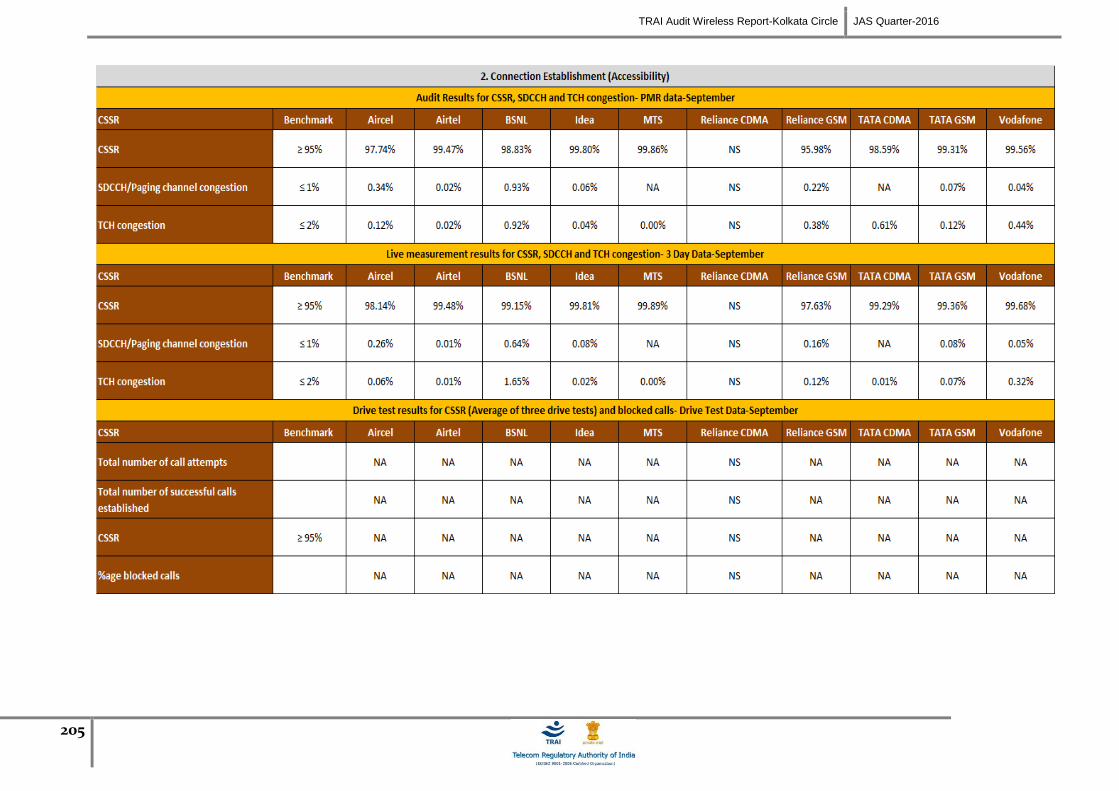
TRAI Audit Wireless Report-Kolkata Circle JAS Quarter-2016
205
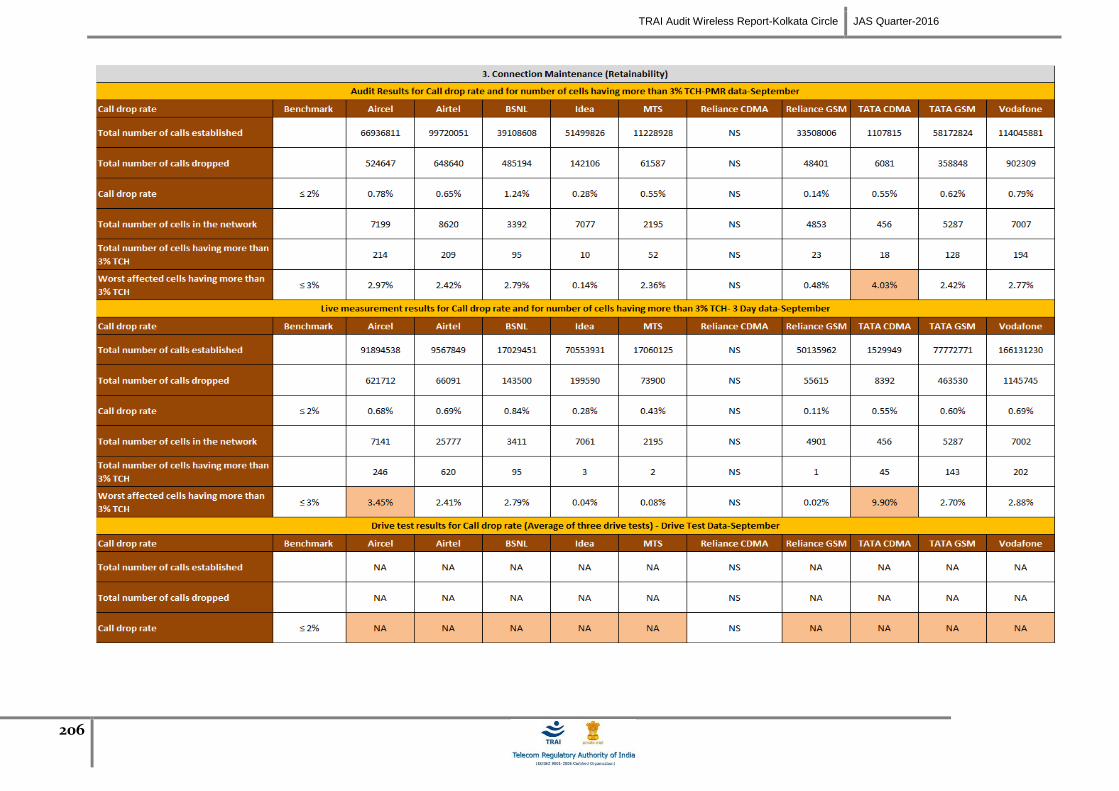
TRAI Audit Wireless Report-Kolkata Circle JAS Quarter-2016
206
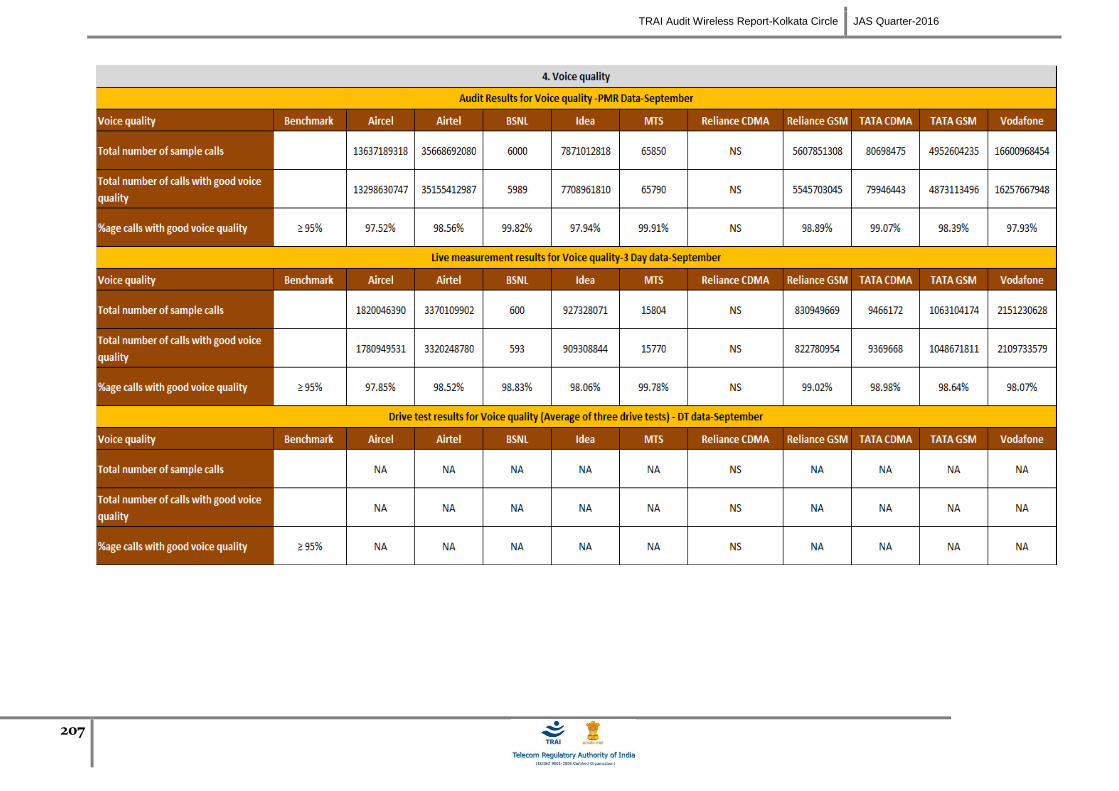
TRAI Audit Wireless Report-Kolkata Circle JAS Quarter-2016
207
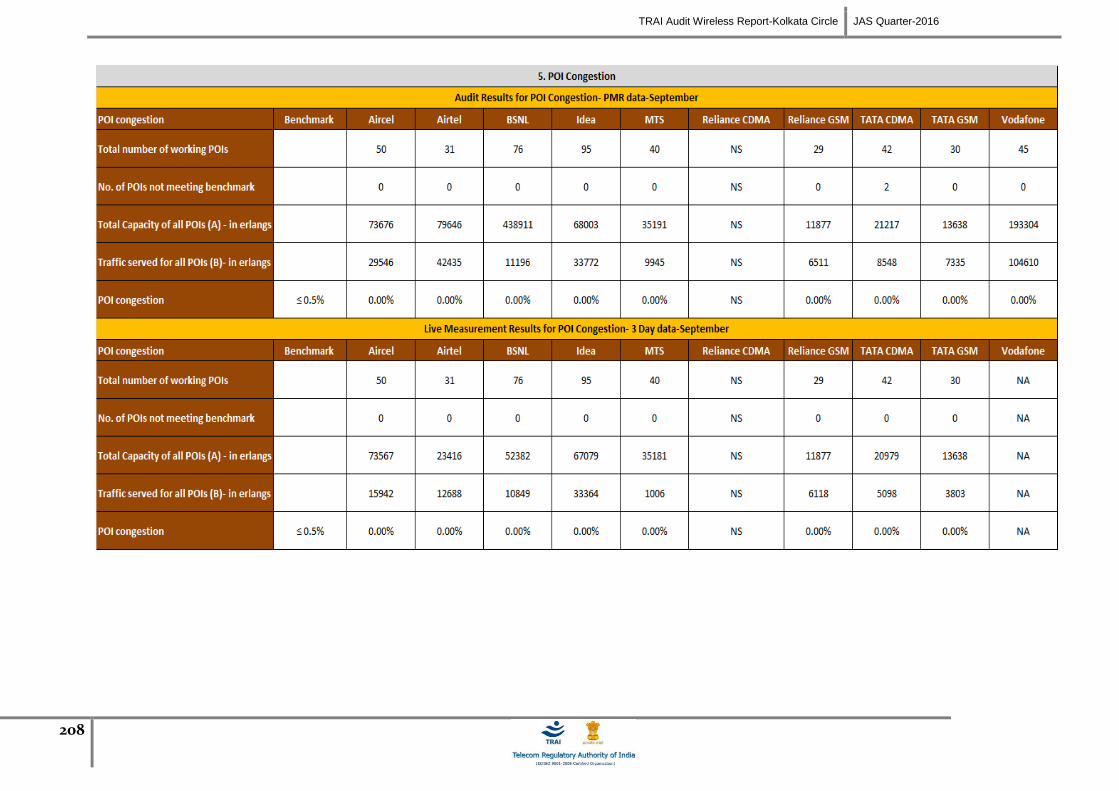
TRAI Audit Wireless Report-Kolkata Circle JAS Quarter-2016
208
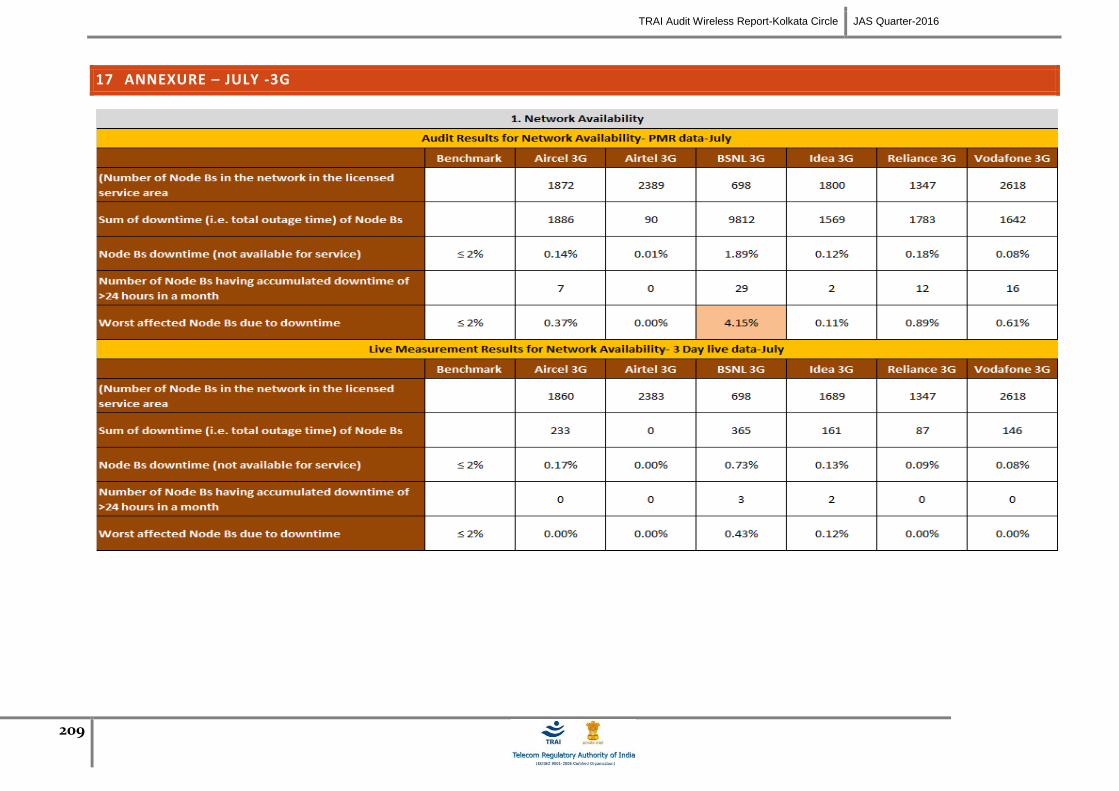
TRAI Audit Wireless Report-Kolkata Circle JAS Quarter-2016
209
17 ANNEXURE – JULY -3G
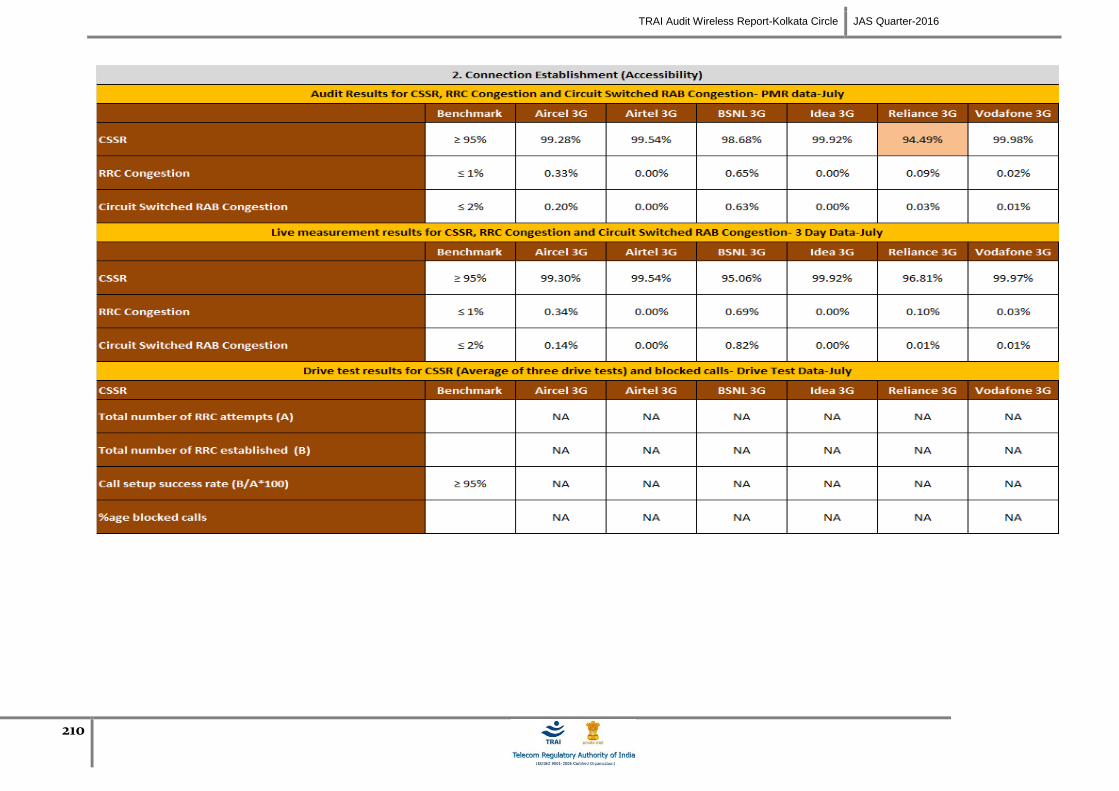
TRAI Audit Wireless Report-Kolkata Circle JAS Quarter-2016
210
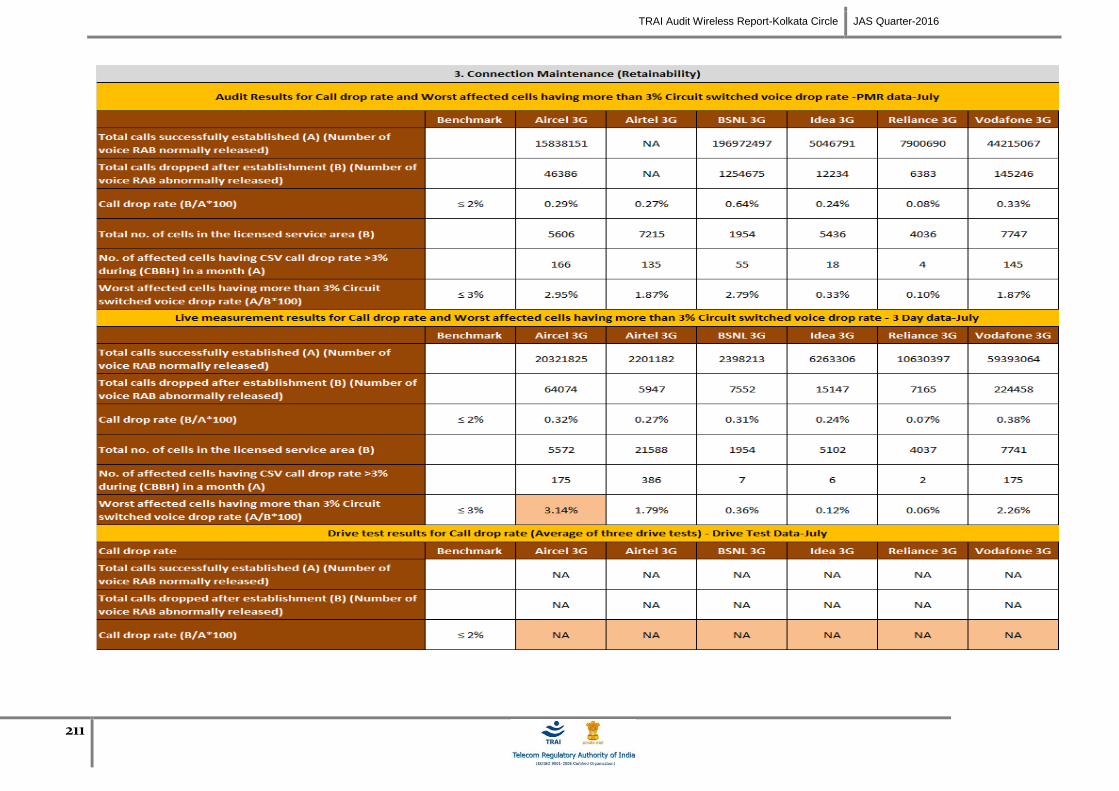
TRAI Audit Wireless Report-Kolkata Circle JAS Quarter-2016
211
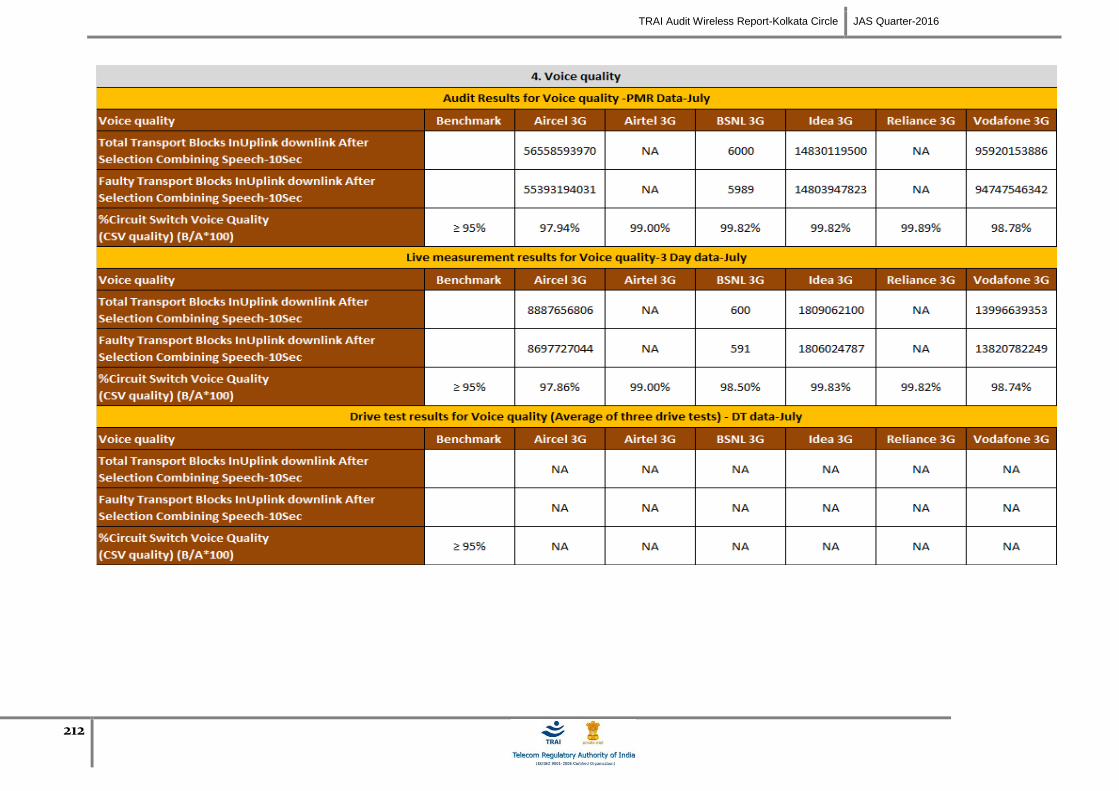
TRAI Audit Wireless Report-Kolkata Circle JAS Quarter-2016
212
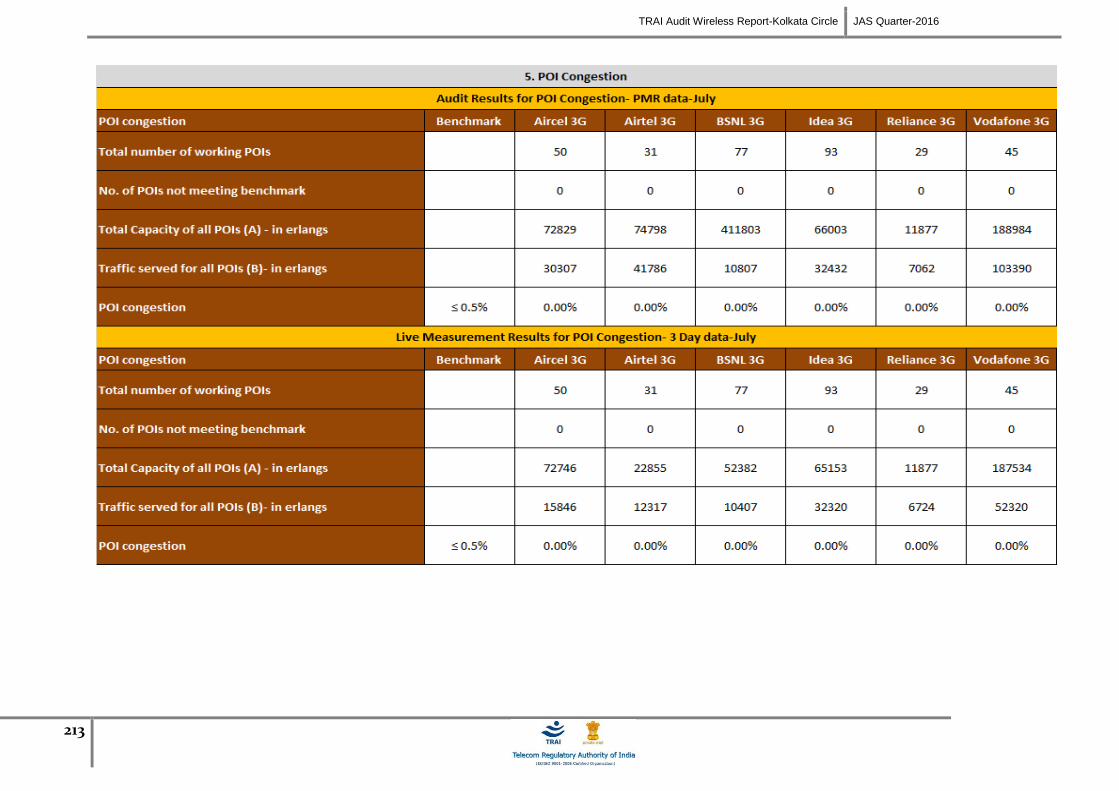
TRAI Audit Wireless Report-Kolkata Circle JAS Quarter-2016
213

TRAI Audit Wireless Report-Kolkata Circle JAS Quarter-2016
214
18 ANNEXURE – AUGUST-3G
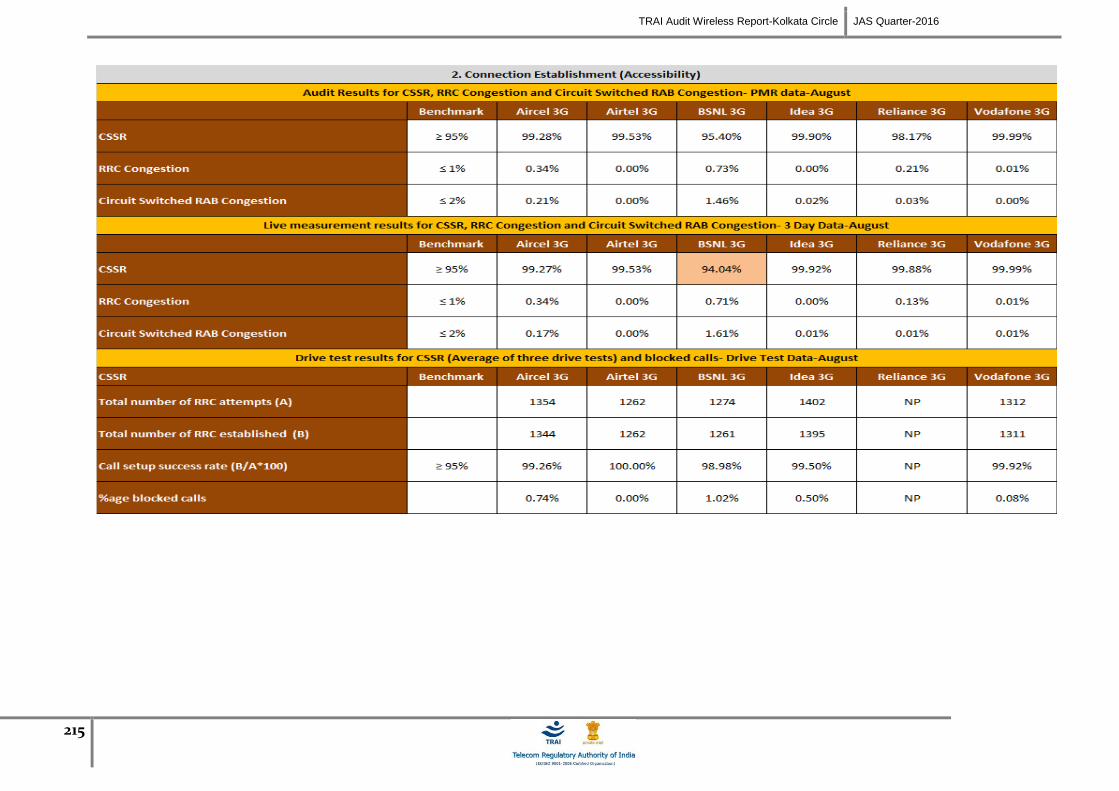
TRAI Audit Wireless Report-Kolkata Circle JAS Quarter-2016
215
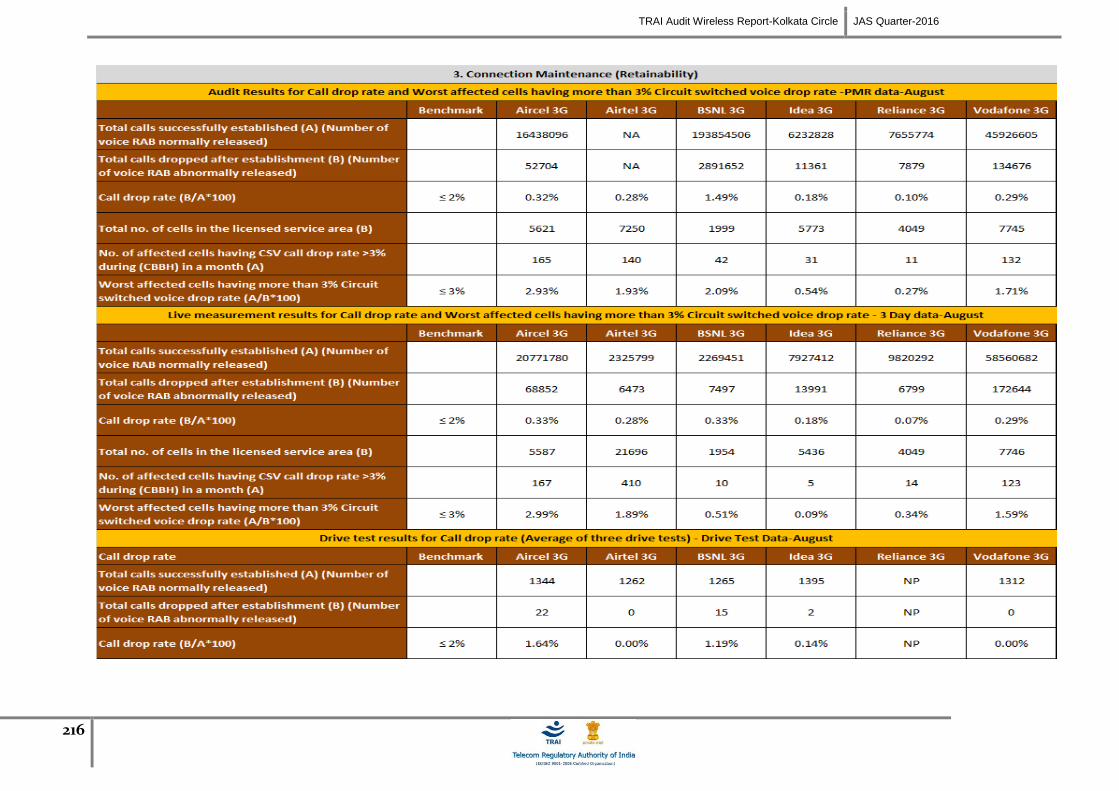
TRAI Audit Wireless Report-Kolkata Circle JAS Quarter-2016
216
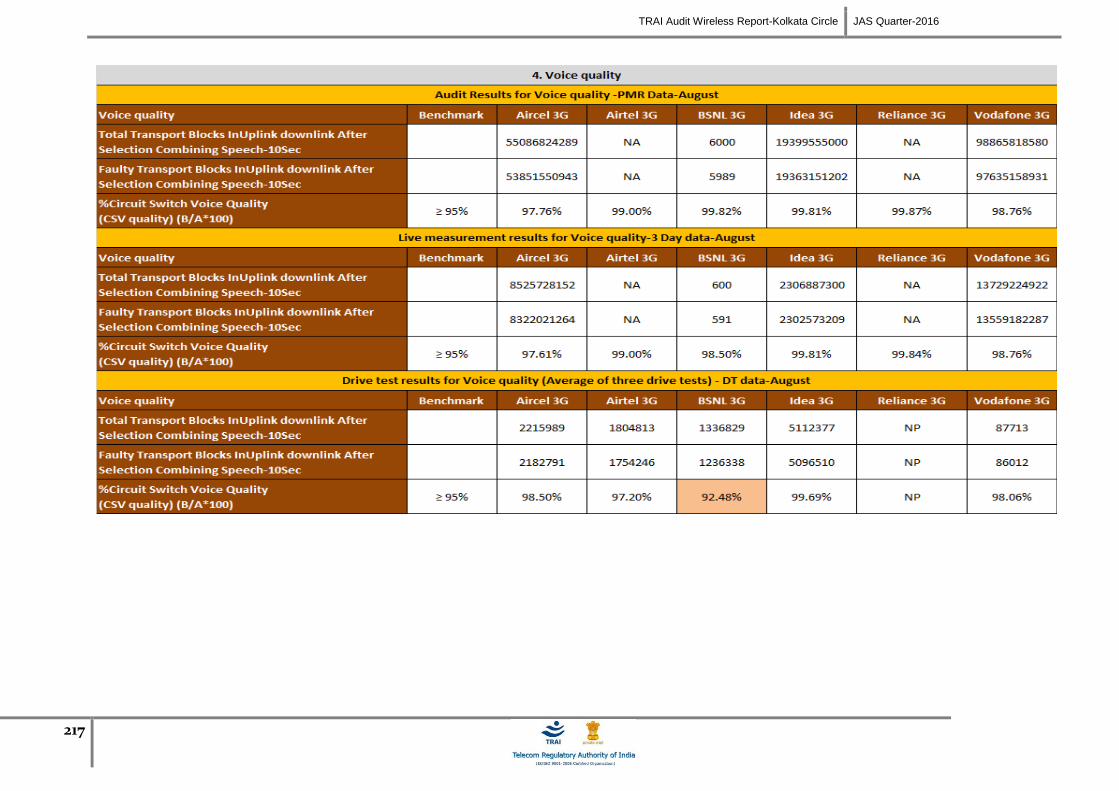
TRAI Audit Wireless Report-Kolkata Circle JAS Quarter-2016
217
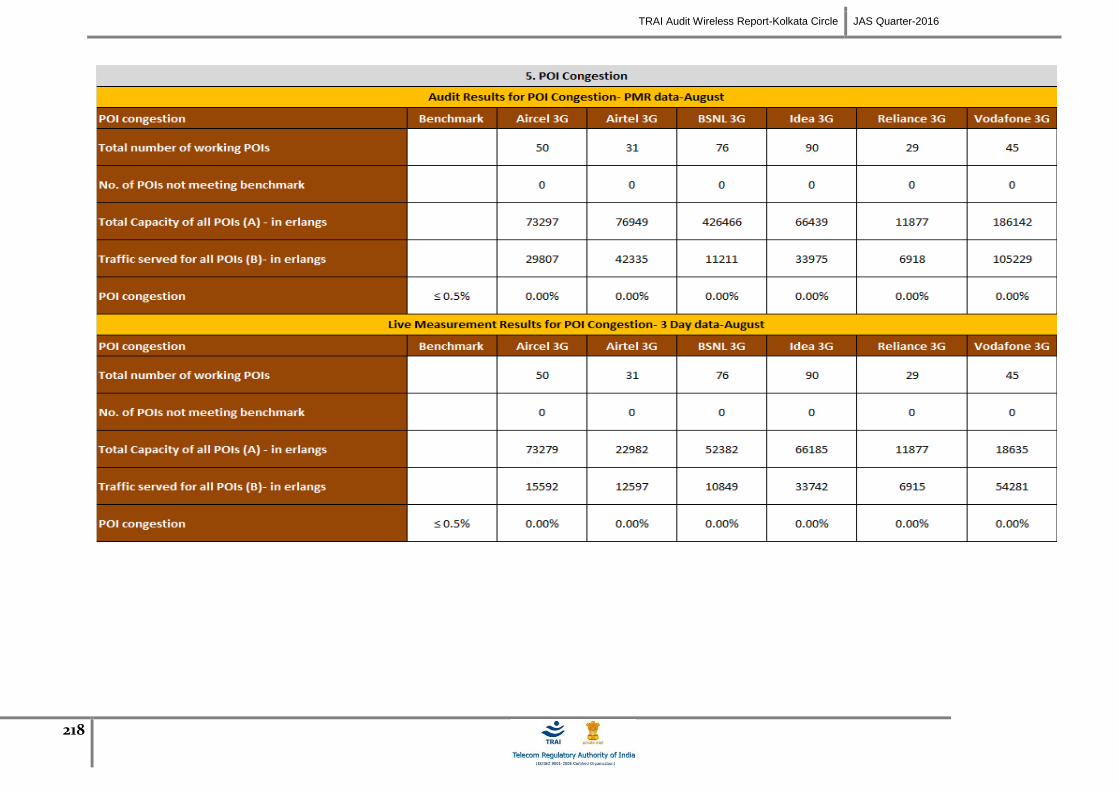
TRAI Audit Wireless Report-Kolkata Circle JAS Quarter-2016
218

TRAI Audit Wireless Report-Kolkata Circle JAS Quarter-2016
219
19 ANNEXURE – SEPTEMBER-3G

TRAI Audit Wireless Report-Kolkata Circle JAS Quarter-2016
220
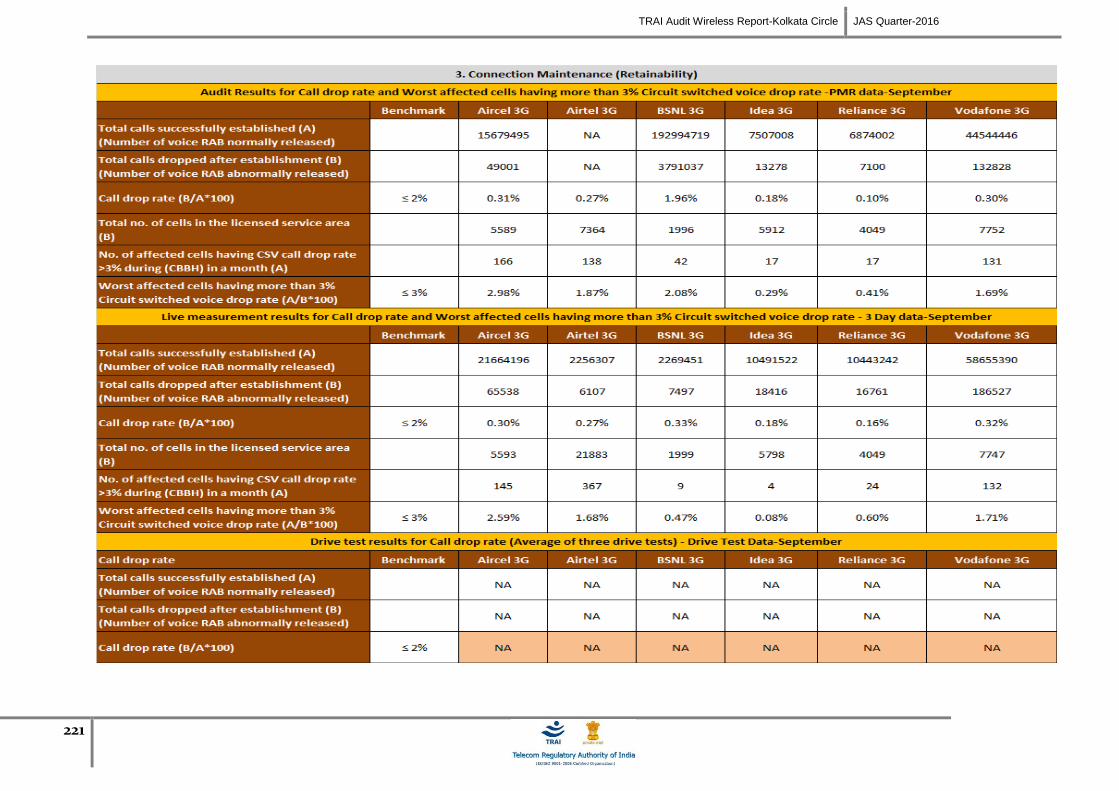
TRAI Audit Wireless Report-Kolkata Circle JAS Quarter-2016
221
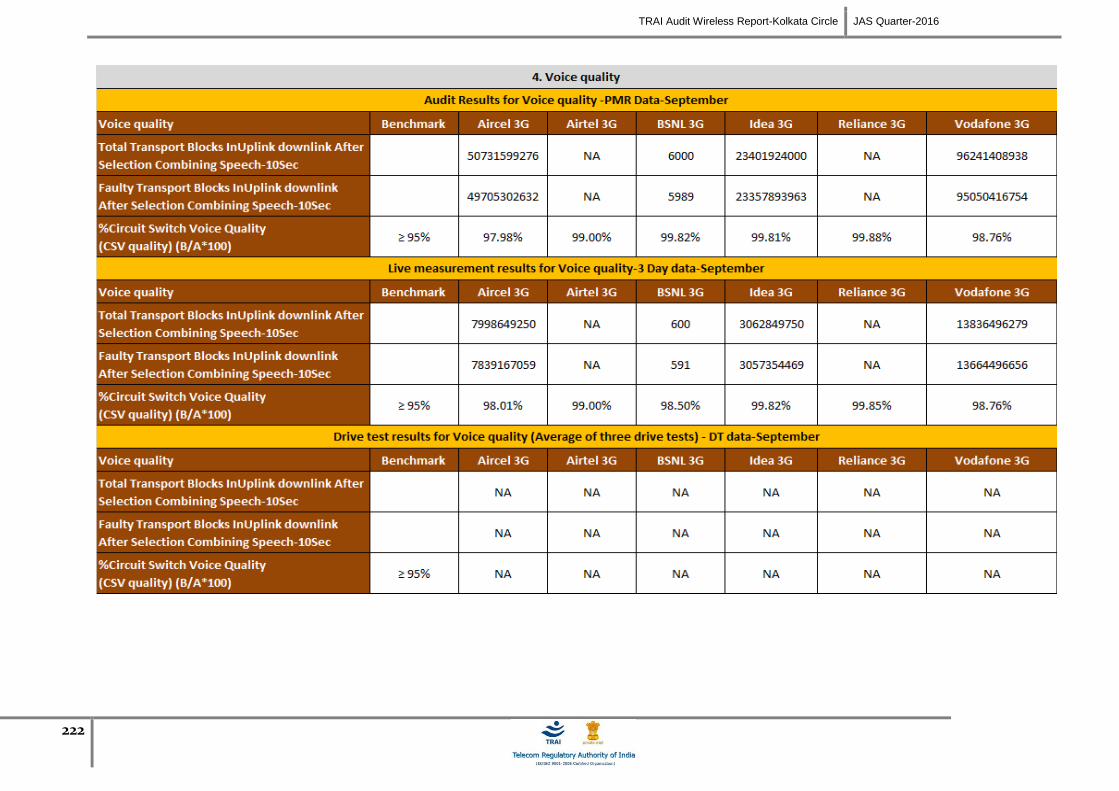
TRAI Audit Wireless Report-Kolkata Circle JAS Quarter-2016
222
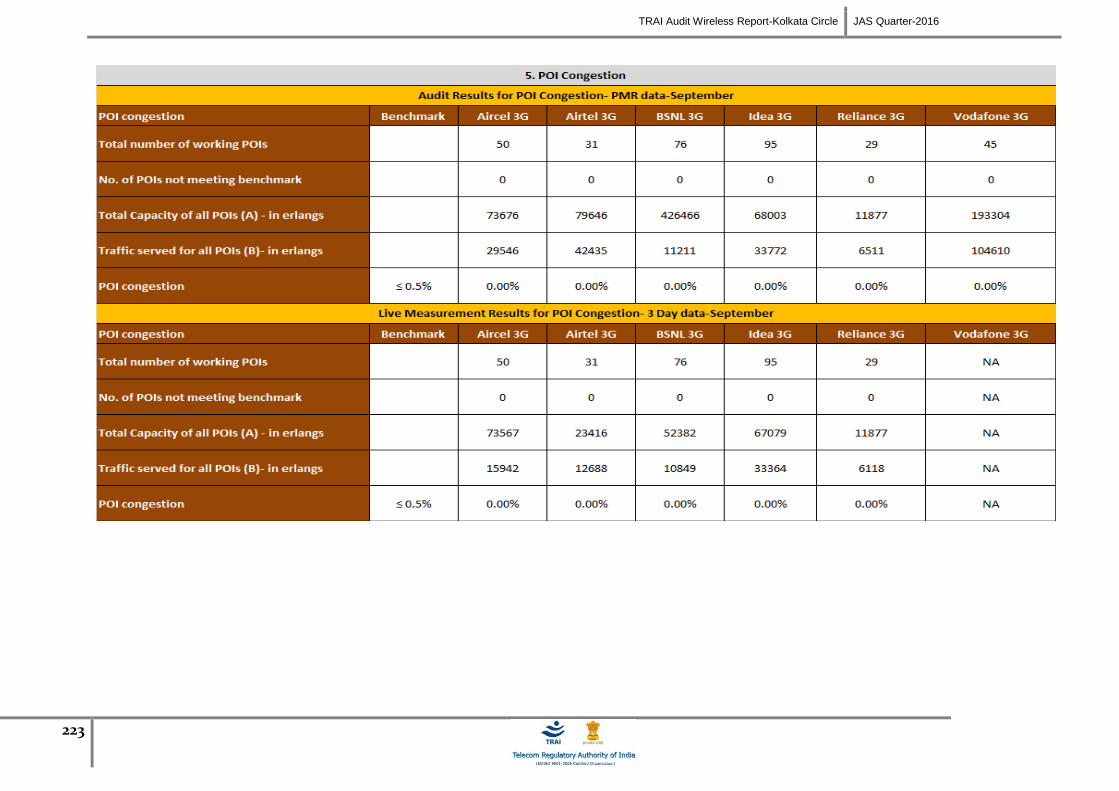
TRAI Audit Wireless Report-Kolkata Circle JAS Quarter-2016
223
224
20 ABBREVIATIONS
Following terms/abbreviations have been used in this report. This section provides meaning of the
abbreviations used in the report.
1. TRAI – Telecom Regulatory Authority of India
2. QoS – Quality of Service
3. JAS’16 – Refers to the quarter of July , August and September 2016
4. IMRB – Refers to IMRB International, the audit agency for this report
5. SSA – Secondary Switching Area
6. NOC – Network Operation Center
7. OMC – Operations and Maintenance Center
8. MSC – Mobile Switching Center
9. PMR – Performance Monitoring Reports
10. TCBH – Time Consistent Busy Hour
11. CBBH - Cell Bouncing Busy Hour
12. BTS – Base Transceiver Station
13. CSSR – Call Setup Success Rate
14. TCH – Traffic Channel
15. SDCCH – Standalone Dedicated Control Channel
16. CDR – Call Drop Rate
17. FER – Frame Error Rate
18. SIM – Subscriber Identity Module
19. GSM – Global System for Mobile
20. CDMA – Code Division Multiple Access
21. NA – Not Applicable
22. NC – Non Compliance
23. POI – Point of Interconnection
24. IVR – Interactive Voice Response
25. STD – Standard Trunk Dialing
26. ISD – International Subscriber Dialing
225
SCO 47, 5th
Floor, Old Judicial Complex, Sector 15
Part 1, Gurgaon, Haryana – 122001
+91 (124) 4217300
www.imrbint.com