tracking emerging diseases from space: geoinformatics for human health
TRANSCRIPT

© 2
01
4,
Nete
ler
et
al. -
htt
p:/
/gis
.cri
.fm
ach
.it/
Tracking emerging diseases from space: Geoinformatics for human
health
Markus Neteler
Joint work withM. Metz, D. Rocchini, M. Marcantonio, A Rizzoli
IFGI symposium - 11 June 2014"Geoinformatics: Solving global challenges?"

© 2
01
4,
Nete
ler
et
al. -
htt
p:/
/gis
.cri
.fm
ach
.it/
Fondazione Edmund Mach, Trento, Italy
● Founded 1874 as IASMA - Istituto Agrario San Michele all'Adige (north of Trento, Italy)
● Research Centre + Tech. Transfer Center + highschool, ~ 800 staff
● … of those 300 staff in research (Environmental research, Agro-Genetic research, Food safety)
http://cri.fmach.eu/
S. Michele all'Adige
© 2
01
4,
Nete
ler
et
al. -
htt
p:/
/gis
.cri
.fm
ach
.it/
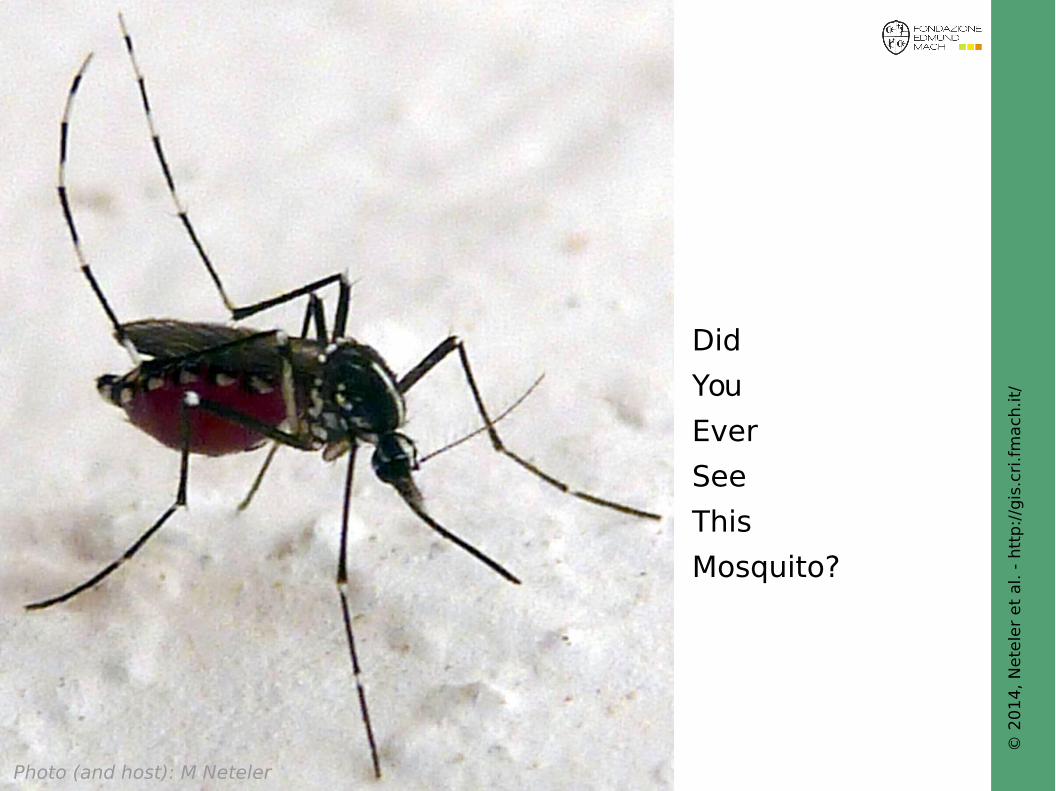
Did
You
Ever
See
This
Mosquito?
Photo (and host): M Neteler

© 2
01
4,
Nete
ler
et
al. -
htt
p:/
/gis
.cri
.fm
ach
.it/
Focus on zoonotic diseases
transmitted from animals to humans, usually by a vector (e.g., ticks, mosquitoes)reservoir hosts: wildlife and domestic animalszoonoses involve all types of agents (bacteria, parasites, viruses and others)
Zoonotic diseases cause major health problems in many countries.
They are driven by environmental andpathogen changes as well as political and cultural changes.
The problem: Emerging infectious diseases
http://healthmap.org/en/

© 2
01
4,
Nete
ler
et
al. -
htt
p:/
/gis
.cri
.fm
ach
.it/
http://www.thelancet.com/journals/laninf/article/PIIS1473-3099%2814%2970781-9/abstracthttp://www.ft.com/cms/s/2/dd4ac6c2-eb4b-11e3-bab6-00144feabdc0.html#axzz34GSWNYQU

© 2
01
4,
Nete
ler
et
al. -
htt
p:/
/gis
.cri
.fm
ach
.it/
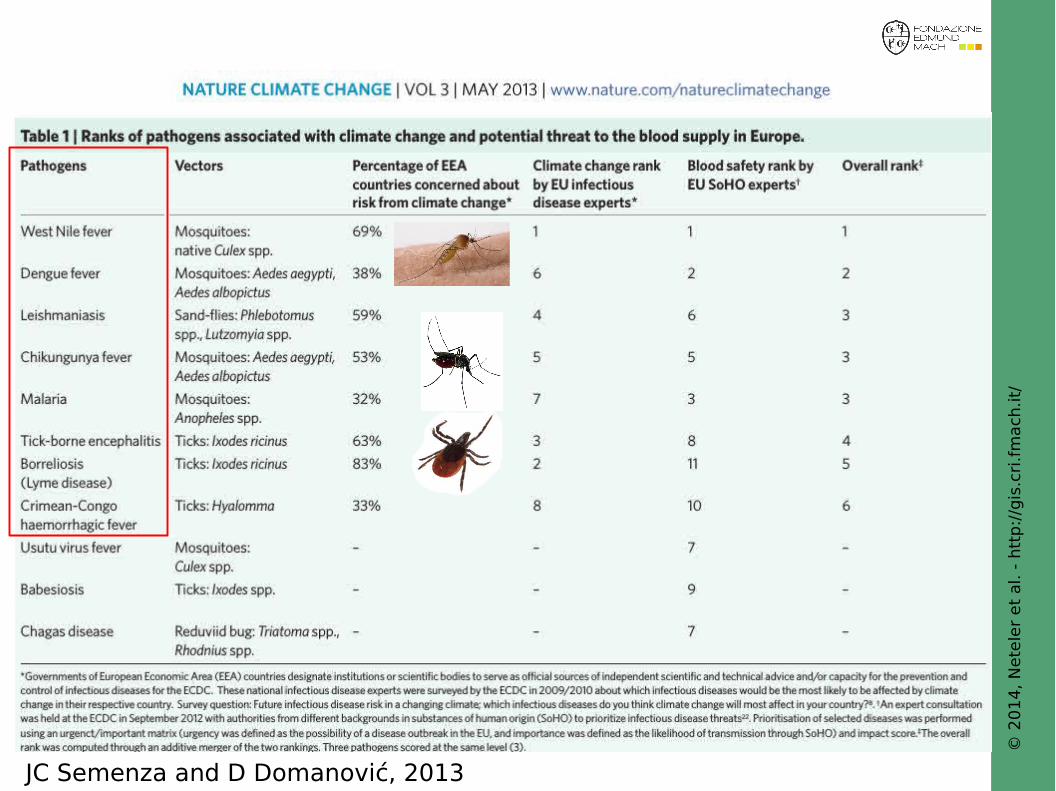
Infections causing also “hidden” problems ...
© 2
01
4,
Nete
ler
et
al. -
htt
p:/
/gis
.cri
.fm
ach
.it/
JC Semenza and D Domanović, 2013

© 2
01
4,
Nete
ler
et
al. -
htt
p:/
/gis
.cri
.fm
ach
.it/
Yellow fever Dengue
West Nile
Saint Louis encephalitis
Chikungunya
Spread of the tiger mosquito (Aedesalbopictus): infectious disease vectorsand globalization
De Llamballerie et al., 2008: Chikungunya
● Tiger mosquito: Disease vector● Spreads in Europe and elsewhere● Small containers, used tires
and lucky bamboo plants are relevant breeding sites
● >250 cases of Chikungunya innorthern Italy in 2007 (CHIKv imported by India traveler andwas then spread by Ae. albopictus)

© 2
01
4,
Nete
ler
et
al. -
htt
p:/
/gis
.cri
.fm
ach
.it/
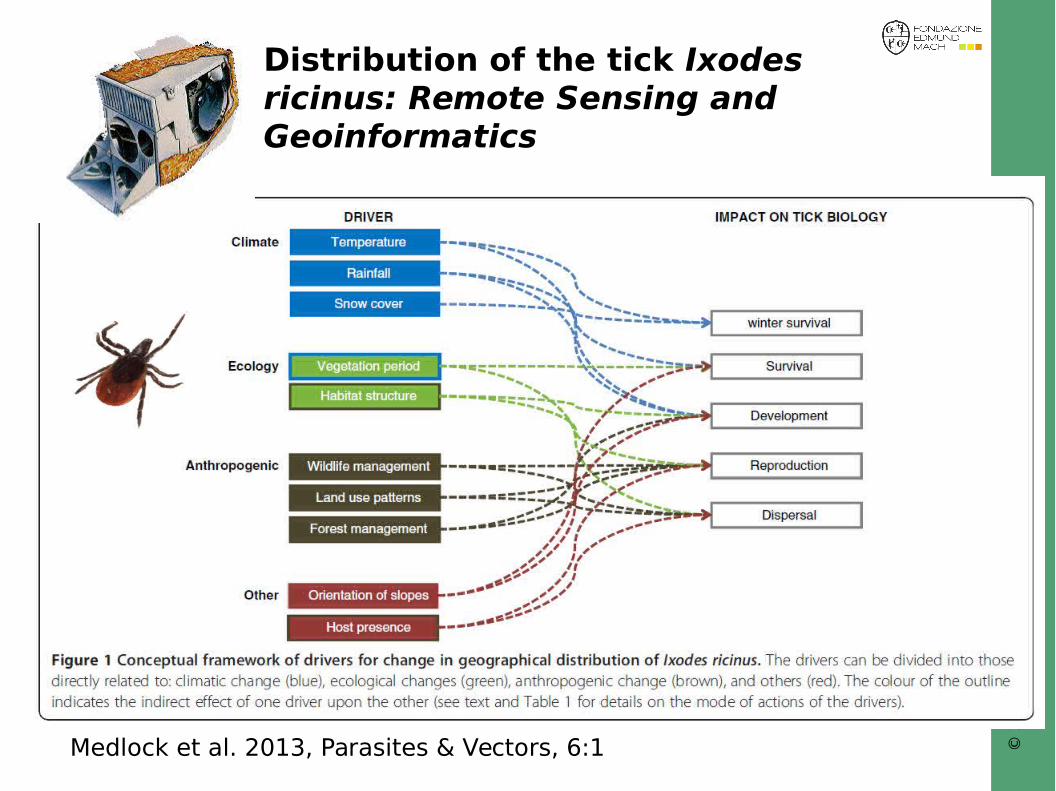
Medlock et al. 2013, Parasites & Vectors, 6:1
Distribution of the vector: Ixodes ricinus
Current known distribution of the tick species at ‘regional’ administrative level (NUTS3); based on published historical data and confirmed data provided by experts from the respective countries as part of the VBORNET project.
© 2
01
4,
Nete
ler
et
al. -
htt
p:/
/gis
.cri
.fm
ach
.it/
Medlock et al. 2013, Parasites & Vectors, 6:1
Distribution of the tick Ixodes ricinus: Remote Sensing and Geoinformatics

© 2
01
4,
Nete
ler
et
al. -
htt
p:/
/gis
.cri
.fm
ach
.it/
Environmental factors derived from Remote Sensing
Pathogens
Vectors
Hosts
Temperature
Precipitation
Topography
Land use
Vegetation cover
Moisture / Humidityproxies
(incomplete view)
e.g. SRTM, ASTER GDEM
e.g.MODIS based
e.g.MODIS based
… not covered here

© 2
01
4,
Nete
ler
et
al. -
htt
p:/
/gis
.cri
.fm
ach
.it/
What does remote sensing offer?Requirements: operational systems, regular observations, data access
Example: NASA Terra and Aqua satellites (MODIS sensor, 4 maps per day)
● Land surface temperature (LST)
● late frost periods
● hot summer temperatures
● autumnal temperature decrease
● annual/monthly minima/maxima
● Urban heat islands, …
● Normalized/Enhanced Difference Vegetation Index (NDVI/EVI)
● seasonal differences
● spring/autumn detection
● length of growing season
● Normalized Difference Water Index (NDWI)
● as humidity proxy (?)
● Maximum snow extent (SNOW)
Time series are essential

© 2
01
4,
Nete
ler
et
al. -
htt
p:/
/gis
.cri
.fm
ach
.it/
Temperature in space and time
Temperaturetime series
Average
Minimum
Maximum
Seasonal temperature:Winter, spring, summer, autumn
Spring warming, Autumnal cooling
Anomalies, Cool Night Index
Growing Degree Days (GDD)
Land Surface Temperaturefrom satellite
Late frost periods
Selected references:
● Kilpatrick et al 2011 (WNV transmission)
● ECDC 2009 (Aedes albopictus risk maps)
● Roiz et al 2011(Aedes albopictus distribution map)
● Randolph 2004 (tick seasonality)
● Tersago et al 2009 (Hantavirus)● Rios et al 2000 (Tubercolosis)
● Kalluri et al 2007 (mosquito abundance)
● Epstein et al 2002 (infectious diseases)
● Morand et al 2013 (infectious diseases)
● Peréz-Rodriguez et al 2013 (VB parasites)

© 2
01
4,
Nete
ler
et
al. -
htt
p:/
/gis
.cri
.fm
ach
.it/
EuroLST: MODIS LST daily time seriesExample: Land surface temperature for Sep 26 2012, 1:30 pm
Metz, Rocchini, Neteler, 2014: Rem SensEuroLST: http://gis.cri.fmach.it/eurolst/
Belluno
Reconstructed,i.e. gap-filled data

© 2
01
4,
Nete
ler
et
al. -
htt
p:/
/gis
.cri
.fm
ach
.it/
New EuroLST dataset:Comparison to other datasets(and advantages of using remote sensing time series)
DegreeCelsius
(reconstructed)
Metz, M.; Rocchini, D.; Neteler, M. 2014: Surface temperatures at the continental scale: Tracking changes with remote sensing at unprecedented detail. Remote Sensing. 2014, 6(5): 3822-3840 (DOI | HTML | PDF)
© 2
01
4,
Nete
ler
et
al. -
htt
p:/
/gis
.cri
.fm
ach
.it/
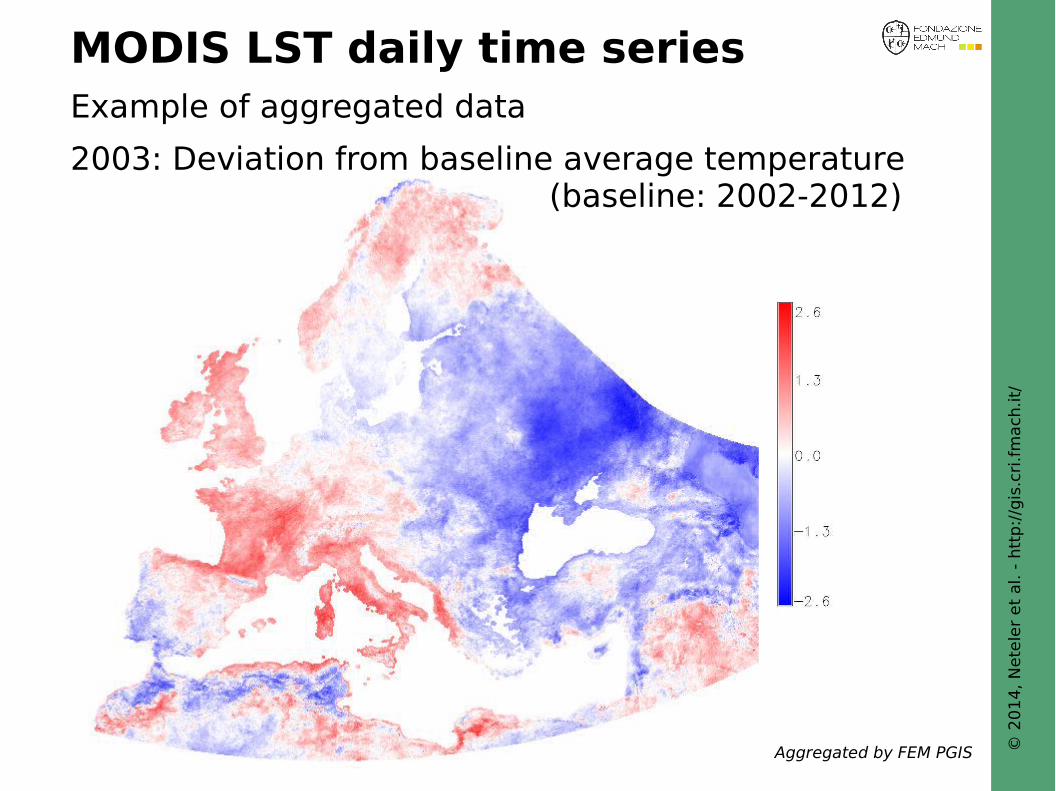
MODIS LST daily time seriesExample of aggregated data
2003: Deviation from baseline average temperature(baseline: 2002-2012)
Aggregated by FEM PGIS

© 2
01
4,
Nete
ler
et
al. -
htt
p:/
/gis
.cri
.fm
ach
.it/
BIOCLIM from reconstructed MODIS LST at 250m pixel resolution
BIO1 BIO2 BIO3 BIO4
BIO5 BIO6 BIO7 BIO10
BIO11BIO1: Annual mean temperature (°C*10)BIO2: Mean diurnal range (Mean monthly (max - min tem))BIO3: Isothermality ((bio2/bio7)*100)BIO4: Temperature seasonality (standard deviation * 100)BIO5: Maximum temperature of the warmest month (°C*10)BIO6: Minimum temperature of the coldest month (°C*10)BIO7: Temperature annual range (bio5 - bio6) (°C*10)BIO10: Mean temperature of the warmest quarter (°C*10)BIO11: Mean temperature of the coldest quarter (°C*10)
Metz, Rocchini, Neteler, 2014: Rem SensEuroLST: http://gis.cri.fmach.it/eurolst/

© 2
01
4,
Nete
ler
et
al. -
htt
p:/
/gis
.cri
.fm
ach
.it/
Examples:
“Hot” year 2003and effects
MODIS Land Surface Temperature
January 2004: Lake Garda still “warm” after hot 2003 summer--> local heating effect = insect overwintering facilitated
Metz, Rocchini, Neteler 2014.

© 2
01
4,
Nete
ler
et
al. -
htt
p:/
/gis
.cri
.fm
ach
.it/
Ae. albopictus winter survival from MODIS LST
Neteler et al., 2011: Int J Health Geogr, 10:49
2009:Positive trapNegative trap
Lakes as “heating” (Jan 2004):

© 2
01
4,
Nete
ler
et
al. -
htt
p:/
/gis
.cri
.fm
ach
.it/
Growing Degree Days from gap-filled MODIS LST
2003
2006
Grey: threshold not reached
Grey: threshold not reached
Number of Day-Of-Year (DOY) to reach 440 accumulated growing degree days (GDD) in the years 2003 and 2006:
● proxy for life-stage survival analysis of insect
● satellite-derived GDD are delivered as map, each pixel is“measured”
Data: EuroLST
440 GDD threshold

© 2
01
4,
Nete
ler
et
al. -
htt
p:/
/gis
.cri
.fm
ach
.it/
Precipitation in space and time
Precipitation Long-term average
Annual sum
Seasonal precipitation:Winter, spring, summer, autumn
Length of dry season / drought
Length of raining season
Anomalies
Selected references:
● Semenza & Menne 2009 (precipitation)
● Kilpatrick et al 2011 (precipitation – WNV transmission)
● Estrada-Peña et al 2008 (seasonal precip.)
● Epstein et al 2001 (seasonalprecip.)
● Reusken & Heyman 2013 (snow - hantavirus)
● Morand et al 2013 (precipitation – Typhoid fever)
● Greer et al. 2008 (precipitation – Trichinosis)
● Tourre et al. 2008 (precipitation – Epidemics)
● Srivatsava et al. 2001 (precipitation – Malaria vectors)
● Reisen et al 2008 (precipitation– mosquito abundance)
Presence of snow

© 2
01
4,
Nete
ler
et
al. -
htt
p:/
/gis
.cri
.fm
ach
.it/
ECA&D: gridded meteo data
Average annual precipitation
mm
ECA&D 25 km (gridded from meteo stations, daily)average annual precipitation (1981-2010)
http://www.ecad.eu/

© 2
01
4,
Nete
ler
et
al. -
htt
p:/
/gis
.cri
.fm
ach
.it/
GPCP V1.2 data: remote sensing based
Average annual precipitation
mm
NASA GPCP 1 degree (satellite based, daily)average annual precipitation (1997-2012)
http://precip.gsfc.nasa.gov/
Globallyavailable


© 2
01
4,
Nete
ler
et
al. -
htt
p:/
/gis
.cri
.fm
ach
.it/
Moisture/Humidity in time and space
Moisture / humidity proxies
Long-term average
Saturation deficit
Water stress
Tasseled Cap
DWSI (Disease Water Stress Index)
Selected references:
● DWSI: Brown et al. 2008● NDWI: Estallo et al. 2012
● Saturation deficit: Perret et al. 2000● Tasseled cap: Rodgers & Mather 2006
● Hashizume et al. 2008 (low humidity – Gastroenteritis)
● Baylis et al. 1998 (soil moisture– mosquito vectors)
● Kalluri et al 2007 (relative humidity– VB diseases)
NDWI (Normalized Differences Water Index)
© 2
01
4,
Nete
ler
et
al. -
htt
p:/
/gis
.cri
.fm
ach
.it/
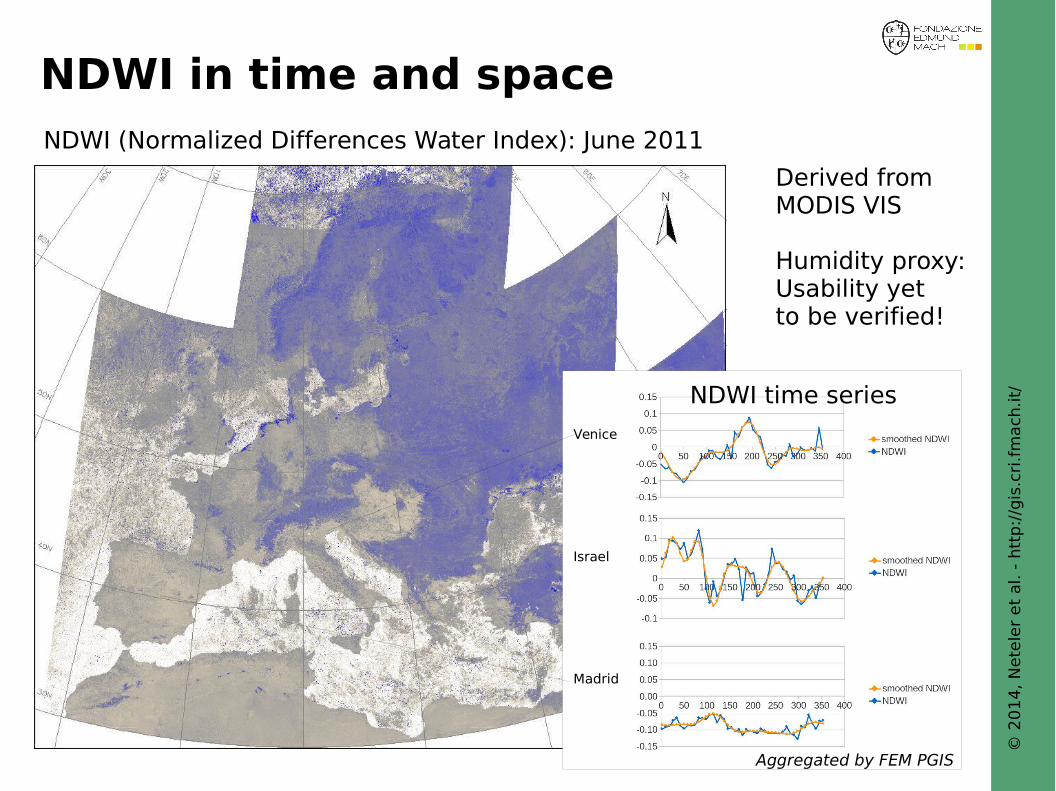
NDWI in time and spaceNDWI (Normalized Differences Water Index): June 2011
Venice
Israel
Madrid
NDWI time series
Derived fromMODIS VIS
Humidity proxy:Usability yetto be verified!
Aggregated by FEM PGIS
© 2
01
4,
Nete
ler
et
al. -
htt
p:/
/gis
.cri
.fm
ach
.it/
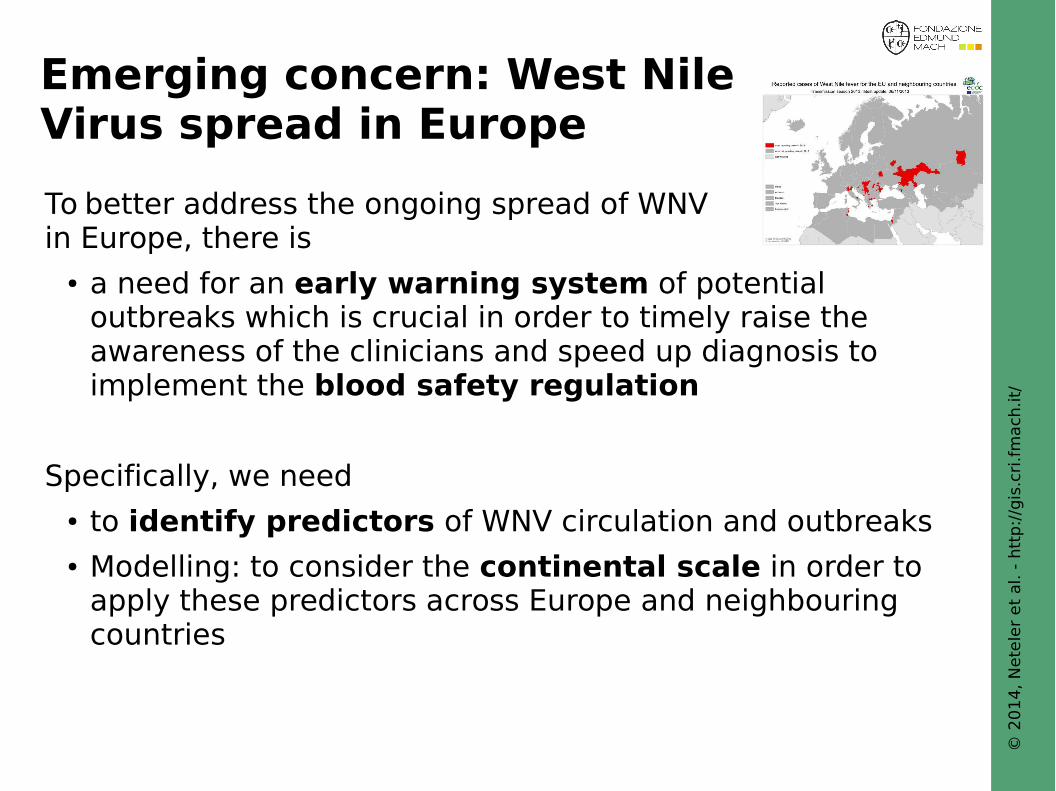
Emerging concern: West Nile Virus spread in Europe
To better address the ongoing spread of WNVin Europe, there is
● a need for an early warning system of potential outbreaks which is crucial in order to timely raise the awareness of the clinicians and speed up diagnosis to implement the blood safety regulation
Specifically, we need● to identify predictors of WNV circulation and outbreaks● Modelling: to consider the continental scale in order to
apply these predictors across Europe and neighbouring countries

© 2
01
4,
Nete
ler
et
al. -
htt
p:/
/gis
.cri
.fm
ach
.it/
WNV in Europe: complicated pattern
Marcantonio et al. (in prep.)

© 2
01
4,
Nete
ler
et
al. -
htt
p:/
/gis
.cri
.fm
ach
.it/
MethodologyWe are testing the association between West Nile Fever incidence and a wide range of potential predictors:
● including temperature data, land use, human presence, urbanization, water body density, landscape fragmentation and heterogeneity, protected areas
● avoiding weak interpolation methods from sparse point data by use of spatially continuous input data
● Use of multi-model inference to gain a consensus from multiple linear mixed models predicting WNV incidence at a scale of NUTS3/GAUL1 administrative units
Anomalies from LST PGIS HPC Precipitation NDWI Biomes: Anthromes
Globcover: land useNDVIMarcantonio et al. (in prep.)

© 2
01
4,
Nete
ler
et
al. -
htt
p:/
/gis
.cri
.fm
ach
.it/
Markus NetelerFondazione E. Mach (FEM)Centro Ricerca e InnovazioneGIS and Remote Sensing Unit38010 S. Michele all'Adige (Trento), Italyhttp://gis.cri.fmach.ithttp://www.osgeo.org
Conclusions
● Emerging diseases need to be considered among the “emerging themes” to be covered by integrated research strategies because of their dramatic impact on well being and economy
● Current and potential distribution of disease vectors (like Ae. albopictus) can be modelled at high resolution, relevant to many health projects
● New reconstructed high temporal resolution datasets allow for real modelling
● ... bring it all together in Geoinformatics!