topographic maps. a map that shows the surface features of the earth (natural and built)
TRANSCRIPT

Topographic Maps

A map that shows the surface features of the earth (natural and built).

The diagram on the left is a view from the side (cross profile view) such as you would see from a ship offshore.
The diagram at right is a view from above (map view) such as you would see from an airplane flying over the island.
The diagrams below show an island that is getting flooded as we raise the water level 10 ft above the original sea level.

Interpreting a Topographic Map:
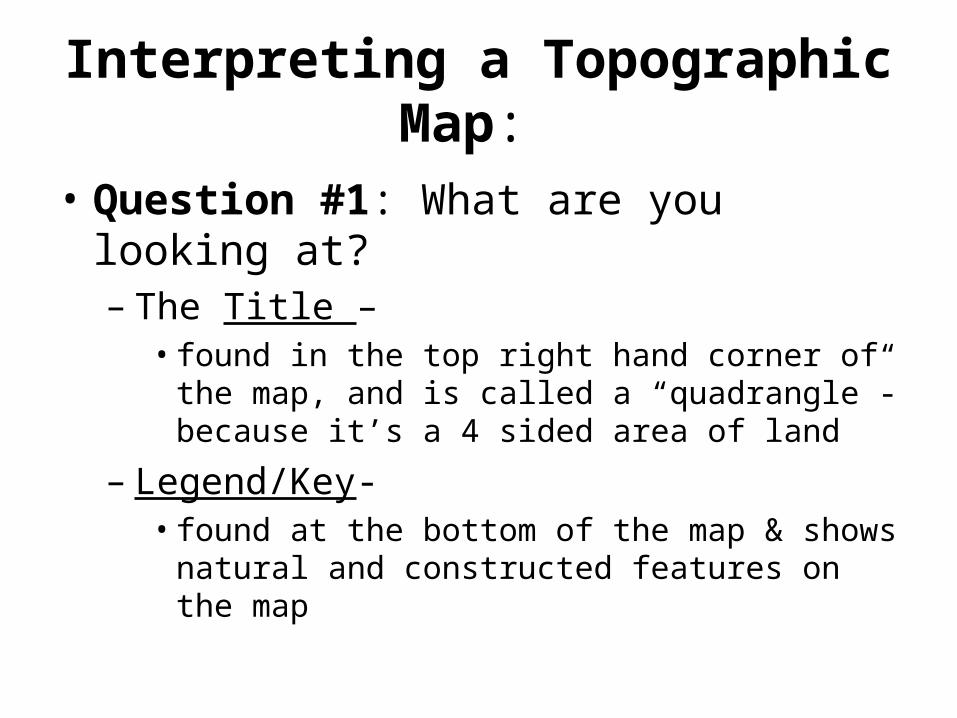
• Question #1: What are you looking at?– The Title –
• found in the top right hand corner of the map, and is called a “quadrangle”- because it’s a 4 sided area of land
– Legend/Key-• found at the bottom of the map & shows natural
and constructed features on the map
Latitude & Longitude
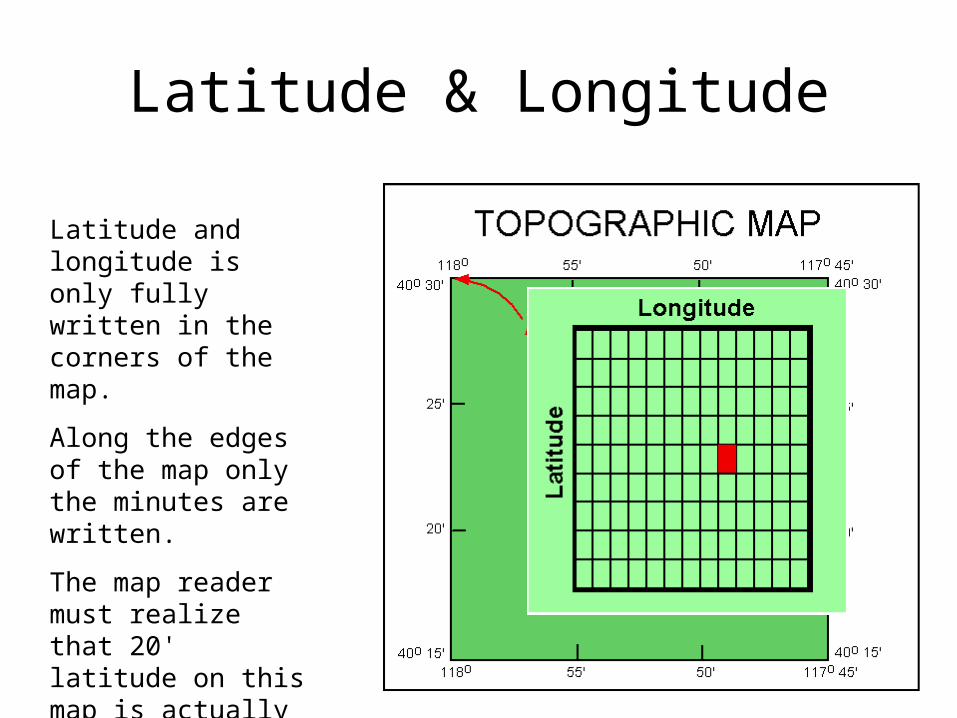
Latitude and longitude is only fully written in the corners of the map.
Along the edges of the map only the minutes are written.
The map reader must realize that 20' latitude on this map is actually 40° 20', because 20' lies in between 40° 15' and 40° 30'.
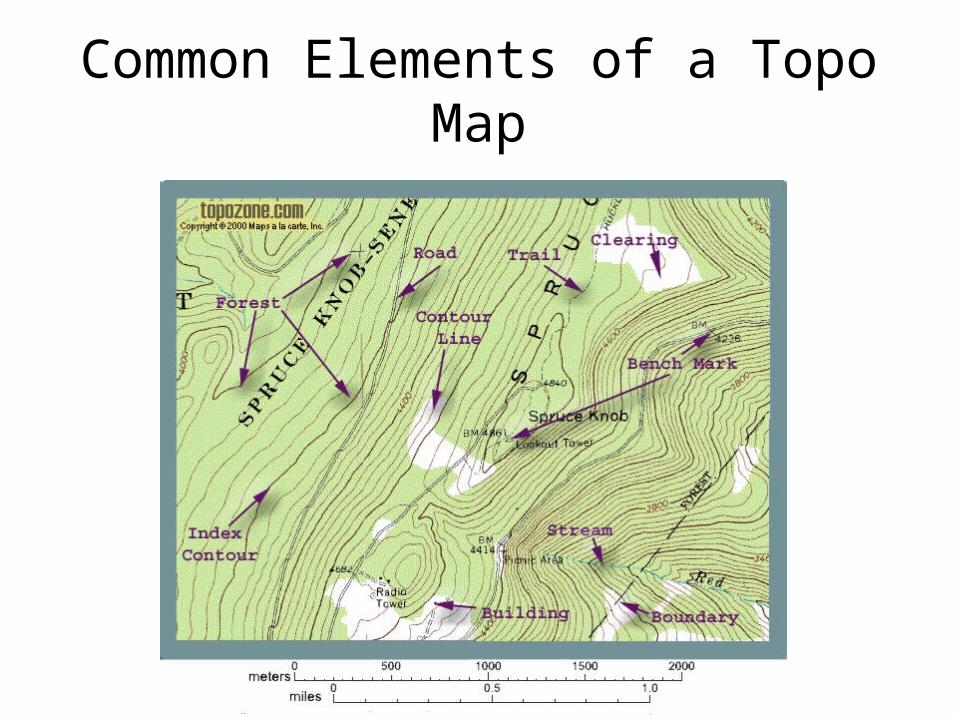
Common Elements of a Topo Map

Question #2: What distance is the map showing you?
• Scale -found at the bottom of the map. It’s the relationship between distance on the map and distance on the ground (real life)
• Fractional scale: ex: 1:24,000– 1 unit of measurement on the map (ex: 1 inch or 1 cm)
represents a certain number (in this case, 24,000) of the SAME units on the ground
• Graphic scale: shows a measure line with units

Question #3: What is the elevation being shown?• Elevation-
– height above (mean) sea level
• Contour lines are used to show changes in elevation. – Each contour line connects points on a
map that have the same elevation.
• Contour intervals- the difference in elevation between one contour line and the next. – The contour interval for each map is
always found somewhere on the map, usually at the bottom.

• Contour interval is based on:• The size of the map• The relief of the land
– Relief- the difference in elevation between the highest and lowest points on the map.
• Index contours –– contour lines that are marked in bold, with the elevation
written right on them. – Usually, every 5th contour line is an index contour
• Benchmarks: – show exact elevations on the map, marked with either
an “X” and the elevation, or a “BM” and the elevation

Rules for contouring:•Contour lines must be continuous (concentric/closed). The lines NEVER split or branch.•The elevation of all areas along the same contour line is the same.•When contour lines cross a river or stream they form a “U” or “V” shape, pointing upstream.•Widely spaced contour lines show a gradual slope
•Closely spaced contour lines show a steep slope (contour lines that are almost touching show a very steep slope or cliff)•Hills are shown with concentric, closed contour lines•Contour lines may never overlap.•Depressions are notes with hachures, which point down in elevation.