contour maps aka topographic maps. contour map: (topograpic map) shows elevation of various points...
TRANSCRIPT

Contour Maps
AKA Topographic Maps

Contour Map: (topograpic map)
shows elevation of various points on
the Earth’s surface.


•Maps show physical features of land, such as cliffs, valleys, hills, and depressions.


•Contour Lines: lines that connect points of equal elevation above sea level.


Are BOLDED Lines—they show the numerical values of the lines. All other lines are unlabeled.

Contour Interval: Difference in elevation between two contour lines


What is the contour interval of this map?

Points on contour lines

Points between contour lines

•Depression: hole or crater on the Earth’s surface, shown on a contour map by Hachured Lines

•• The first hachured line has the same elevation of the lowest contour lines between which it was found.


Highest possible points
This location is between 220 and 240
So the highest possible elevation at this point would be 239 m

Contour lines crossing a river
Contour lines bend upstream when crossing a river

Time to Practice!

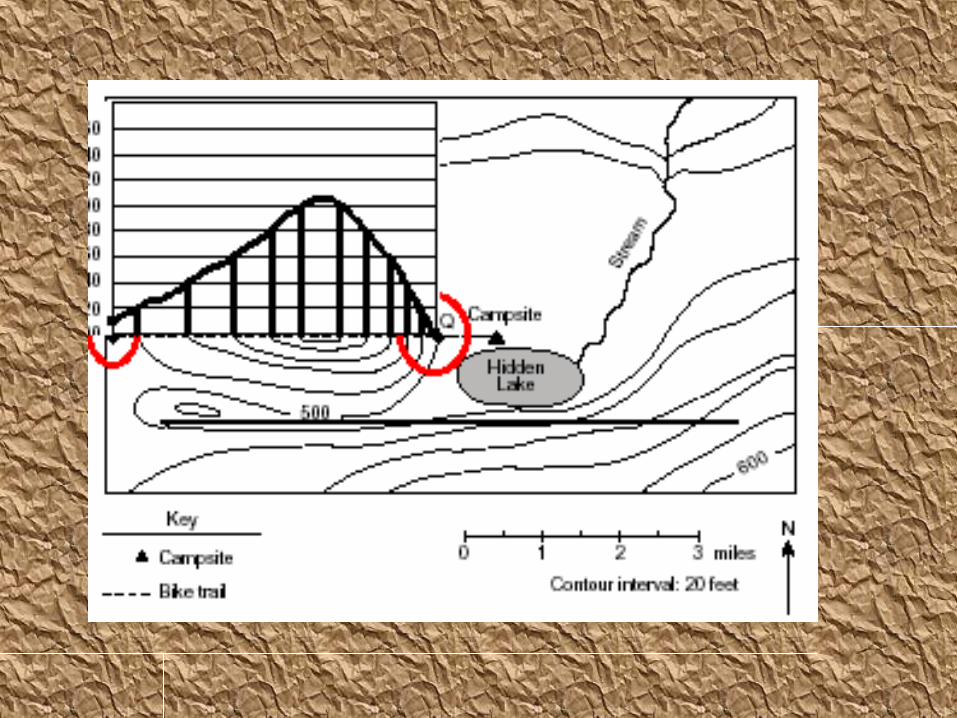
Topographic Profiles

•Profile: Shows the Hills and Valleys (ups and downs) on a line across any part of a contour map.

b


How to recognize a profile

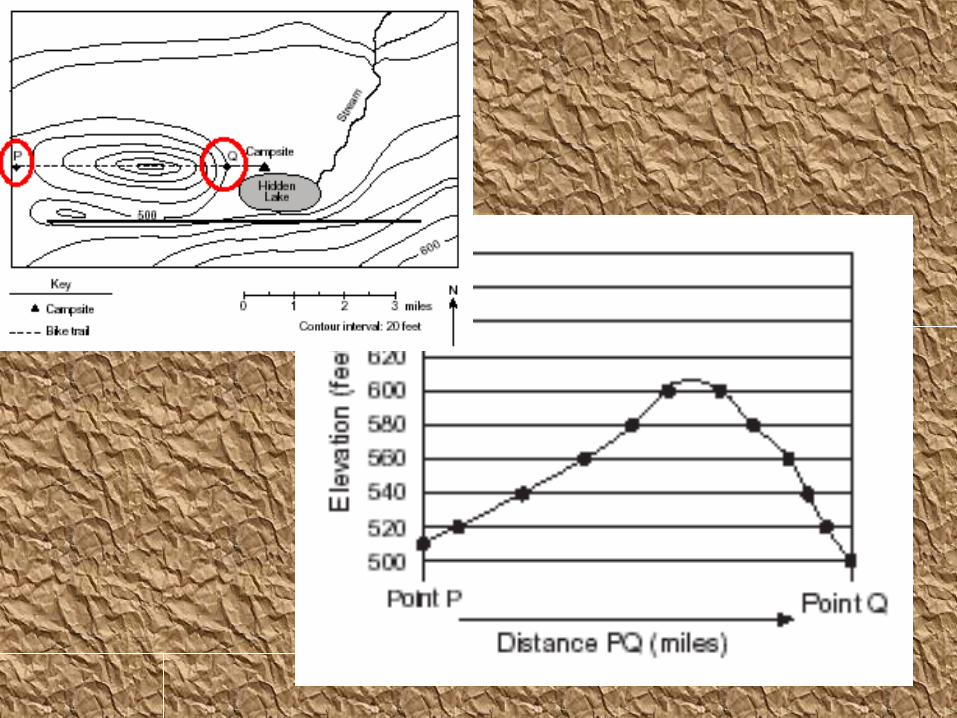
How to Draw a Topographic Profile


Notice how the line curves above the 40 mark, but below the 50


If the graph isn’t directly below the map…..


Time to make your profi les!