title: analysis of the resistivity imaging results
TRANSCRIPT

Title: Analysis of the resistivity imaging results conducted over karst voids in Klucze using Depth of Investigation Index
Author: Olga Krajewska, Michał Glazer, Jolanta Pierwoła
Citation style: Krajewska Olga, Glazer Michał, Pierwoła Jolanta. (2014). Analysis of the resistivity imaging results conducted over karst voids in Klucze using Depth of Investigation Index. "Contemporary Trends in Geoscience" (Vol. 3, iss. 1 (2014), s. 14-23), doi 10.2478/ctg-2014-0018
brought to you by COREView metadata, citation and similar papers at core.ac.uk

Contemp.Trends.Geosci.,3,2014,14-23 DOI:10.2478/ctg-2014-0018
14
Analysis of the resistivity imaging results conducted over karst voids in
Klucze using Depth of Investigation Index
Krajewska Olga1
Michał Glazer2
Pierwoła Jolanta3
1 Student Science Society of Geophysics, Faculty of Earth Sciences,
University of Silesia, Będzińska 60, 41-200 Sosnowiec,
[email protected] 2 Department of Geomorphology, Faculty of Earth Sciences,
University of Silesia, Będzińska 60, 41-200 Sosnowiec,
[email protected] 3Department of Applied Geology, Faculty of Earth Sciences,
University of Silesia, Będzińska 60, 41-200 Sosnowiec,
Abstract
Conducted by "Olkusz" Speleological Club exploratory works related to the Gieńkówka cave led only to its
partial opening. There are indications stating that this cave has continuation beyond its currently available parts.
In order to verify those assumptions resistivity imaging method has been used. During analysis of the resistivity
models obtained from field measurements the synthetic model, simulating the intersection of the cave corridor,
has been utilized. In order to assess the reliability of resistivity cross sections in terms of the presence of artifacts
left by the inversion process Depth of Investigation (DOI) index has been applied. For preparing DOI maps two
inversions on the same data set were carried out using different reference models. Then the results were
compared to each other.
High resistivity anomalies revealed on obtained models show strong correlation with actual caves known in
this area. In addition, similar anomalies have been found in place of the predicted continuity in Gieńkówka cave,
thus confirming the hypothesis made in this research. High DOI index values in the occurrence of caves pointing
to the instability of the inversion process in those areas.
Key words: Resistivity Imaging, Depth of Investigation Index, karst caves, Klucze
DOI: 10.2478/ctg-2014-0018
Received: 30th
June, 2014
Accepted: 4th
September, 2014
Introduction
Polish Jura Highland is characterized by one of
the largest concentration of caves in Poland.
Nearly 150 caves with a length over 40 meters
were found there and new ones are still being
discovered. The appraisal and exploration of
the caves are conducted by experienced
speleologists belonging to caving clubs
including clubs from Olkusz and Czestochowa.
Existing techniques utilized for caves searched
by speleological clubs are limited primarily to
observations of area where the favorable
conditions for their occurrence prevail.
Entrances are mostly sought in winter time
when warmer air from inside the caves causes
melting of the snow cover on the surface. This
may be a premise for the existence of karsts
voids.
Contemp.Trends.Geosci.,3,2014,14-23 DOI:10.2478/ctg-2014-0018
15
On the territory of Klucze community, near
Rodaki village, new caves have been
discovered during the last few years. Now,
after many exploratory expeditions they can be
classified as one of the longest caves in the
Polish Jura. They are Józef Cave and Rysia
Cave. But beyond them there are a number of
other, smaller voids. One of them is the
Gieńkówka cave. Its opening has been found
recently and only few explorations have been
made so far. Few bats have been observed after
opening the entrance hole for the first time,
what indicate that this cave possess connection
with another karst system in this region.
Speleological Club Olkusz is engaged in
exploration of this area. Members of this club
have managed to access only few meters into
the cave. Its currently recognized depth is 15
m. The end section of the Gieńkówka cave has
a very narrow slot and transition through it is
now impossible due to its size. Behind slot
there is a corridor, where floor descends to
greater depths but so far nothing more has been
documented. The inner recognition works have
been stopped at this point. Premises about
continuation of the Gieńkówka cave
contributed to the usage of resistivity imaging
method to confirm those assumptions. This
method has been used for karst cave detection
among others by Stepišnik and Mihevc (2008).
In cooperation with Speleological Club
Olkusz, 6 survey profiles have been designated
in order to confirm continuation of Gieńkówka
cave as well as to study already known caves.
Profiles have been located over the Józef and
Rysia caves as well as over the final parts of
Gieńkówka cave.
Site characteristic
The area of this study is placed in municipality
of Klucze. It belongs to Krakow-Czestochowa
Jurassic Highland. The location of
measurements is situated near Rodaki village,
on one of the nearby hills named Las
Mountain. Rodaki are located near the
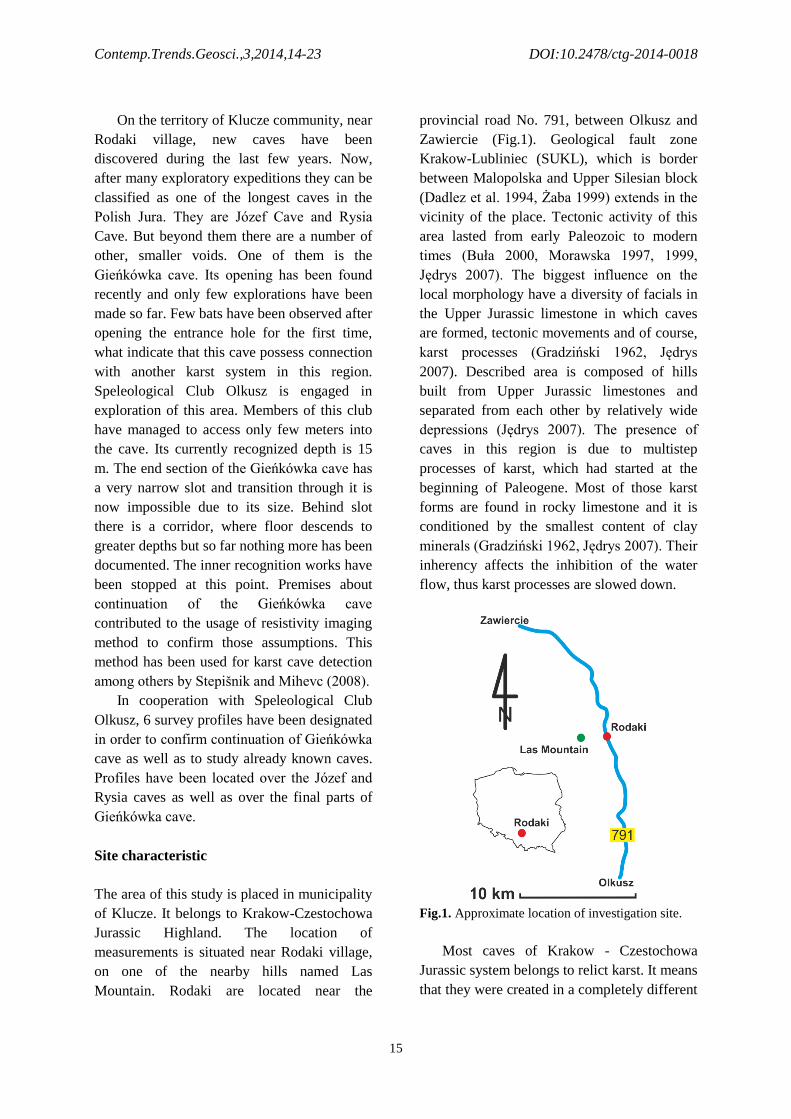
provincial road No. 791, between Olkusz and
Zawiercie (Fig.1). Geological fault zone
Krakow-Lubliniec (SUKL), which is border
between Malopolska and Upper Silesian block
(Dadlez et al. 1994, Żaba 1999) extends in the
vicinity of the place. Tectonic activity of this
area lasted from early Paleozoic to modern
times (Buła 2000, Morawska 1997, 1999,
Jędrys 2007). The biggest influence on the
local morphology have a diversity of facials in
the Upper Jurassic limestone in which caves
are formed, tectonic movements and of course,
karst processes (Gradziński 1962, Jędrys
2007). Described area is composed of hills
built from Upper Jurassic limestones and
separated from each other by relatively wide
depressions (Jędrys 2007). The presence of
caves in this region is due to multistep
processes of karst, which had started at the
beginning of Paleogene. Most of those karst
forms are found in rocky limestone and it is
conditioned by the smallest content of clay
minerals (Gradziński 1962, Jędrys 2007). Their
inherency affects the inhibition of the water
flow, thus karst processes are slowed down.
Fig.1. Approximate location of investigation site.
Most caves of Krakow - Czestochowa
Jurassic system belongs to relict karst. It means
that they were created in a completely different

Contemp.Trends.Geosci.,3,2014,14-23 DOI:10.2478/ctg-2014-0018
16
hydrogeological conditions than that prevail
today. Therefore, they are only the fragments
of ancient systems of water circulation
(Gradziński 2013). They were developed in the
sediments of the Upper Jurassic (Oxfordian),
with an average thickness of 150-200 m and
maximum to the 800 m. The caves of the area
have been created in crevices and clefts, which
spread in the local hills and that were
connected with extending near Krakow -
Lubliniec fault zone. The tectonic activity of
this zone was related to, among others,
intrusions of igneous rocks located between
Małopolska and Upper Silesian block.
All caves of this region possess vertical
development. Mentioned earlier Józef cave
reaches a depth of 41 meters and its length is
nearly 400 m. It extends toward the west-east
direction. Description of Rysia cave has not
been published yet, so it's hard to determine its
exact dimensions. Survey lines have been
located in such a way that they would partially
passed through the areas with already
identified caves and the cave, which
continuation is looked for (Fig. 2). Profile 1
passed over the Gieńkówka cave and has been
placed on its end parts already explored by
speleologist. Because the aim of the research
was to find its continuation, thus further
profiles have been moved in the north-west
direction.
Fig.2. Arrangement of profiles on the Las mountain.
Methodology
Electrical Resistivity Tomography has been
performed using ABEM Lund Imaging
System. Five profile lines have been
designated. It was an attempted to arrange
them parallel and at equal distances from each
other. As a result of complex morphology of
the terrain and its thick vegetation cover,
derogations from the primary assumptions
could not have been avoided. The distance
between two nearest profiles in the grid varies
from 0 (where they intersect one another) to 30
m. On every survey lines two cables with 21
take-outs have been used with 5 m basic
electrode spacing. Because both lateral and
Contemp.Trends.Geosci.,3,2014,14-23 DOI:10.2478/ctg-2014-0018
17
vertical resistivity variations were expected
Wenner-Schlumberger protocol was applied
(Loke 2014). Measurements have been
performed after heavy rains what in
combination with substantial soil cover
ensured good ground-electrode contact.
Significant denivelations on profile lines
forced incorporation of morphology into the
used modeling mesh process. Elevation data
has been acquired from topographical maps in
1:1000 scale.
The inversion of resistivity data was
carried out using Res2Dinv x64 ver. 4.03.13
program (RES2DINV manual, 2014). Caves as
targets of this investigation indicate sharp
resistivity changes in geological medium. This
is the reason for utilization L1 norm
smoothness constrained optimization method
to generate resistivity models that in the best
way would reconstruct orogen (Loke 2003). It
is also known as blocky inversion method. It
tends to minimize the absolute changes in
model resistivity values. During initial
processing no significant amount of data points
have been erased. Additional weighting factors
have been set at standard values for L1 norm in
Res2Dinv.
To assess the solidity of the prepared
models authors used an empirical Depth of
Investigation (DOI) index method. In its core
lies juxtaposition of two resistivity models
created from the same data set for different
reference models. In this way the information,
about how much influence on final results have
been made by parameters of optimization
equation and not by the field data, is obtained.
In places strongly dependent on measurements
it will approach 0, in contrast to 1 where
parameters of inversion decides purely on the
resistivity value (Oldenburg and Li, 1999).
DOI index value is determined for single cell
of the prepared model. In next step, map of
variations of this index is prepared and
overlaid on resistivity model created without
forcing the reference model. Single model cell
DOI value is given by (Oldenburg and Jones,
2007):
(1)
where, with modification from Deceuster et al.
(2014), and are the
logarithms of model cell resistivity obtained
from the first and second inversions, and
are the logarithm of first and second
uniform reference models resistivity values.
Merescot et al. (2003) recommended using
the reference models set at 0.1 and 10 times
arithmetic mean of the measured apparent
resistivity. This approach has been used in this
study. Formation of DOI index map requires
much wider model discretization than normal
processing. It is due to the need of verification
of DOI index behavior in the regions with
minimal information on the resistivity of
subsurface. The depth range of the inversion
models has been extended 3.5 times the
median depth of investigation of largest array
spacing used for this purpose. All constructed
DOI maps tended to increase its value above
0.9 in the bottom so there was no need for
scaling the results. In RES2DINV software
(RES2DINV manual, 2014) DOI preparation
routine, the greatest value of damping factor µ
responsible for impact on the reference model,
was chosen. In this paper DOI maps have been
trimmed to basic resistivity models.
Oldenburg and Li (1999) suggested 0.1 or
0.2 as the value of DOI index above which
interpretation of resistivity models should not
proceed. Oldenburg and Jones (2007) used
index of 0.3. In this paper DOI = 0.3 has been
chosen as the cut-off factor.
To check applied methodology synthetic
model for Wenner-Schlumberger array with
5 m electrode spacing has been created in
RES2DMOD software and subsequently
analyzed with DOI index (Fig. 3).

Contemp.Trends.Geosci.,3,2014,14-23 DOI:10.2478/ctg-2014-0018
18
Fig.3. Synthetic model of high resistivity vertical block and its inversion model generated from forward
modeling overlapped with DOI index map.
Results - synthetic modeling
Constructed model represents narrow vertical
high resistivity block, which is an
approximation of cave corridor. The data on
geometrical dimensions have been taken from
one of the known corridors of Józef cave. It
roof lies at the depth of 5 m. It is 2.5 m wide
and 15 m high. Resistivity of the block has
been set to 25000 Ωm and resistivity of the
background has been given value of 1000 Ωm
in order to match to the models obtained from
measurements on investigation site. It resulted
in anomaly that is over 20 m width and 25 m
high. Its resistivity reaches 2000 Ωm.
Furthermore distortions just beneath the
vertical block can be observed. In those parts
DOI index value rise up significantly to 0.3.
Results - field data
On resistivity cross sections starting from
profile line 1 and finishing on 5 anomalously
high resistivity areas are observed. They range
from 2500 up to 8000 Ωm. Their roofs are
located at depth of 5 to 10 m. On resistivity
cross sections 2 to 4 (Fig.s 5 to 7), in their
north eastern part, between 50 and 60 m of
profile length, there is narrow direct
connection to the surface. In profile 5 (Fig. 8)
it spreads widely over 30 m. Geometrical
dimensions of the most of high resistivity
anomalies are characterized by horizontal
extension. Their thickness does not exceed 15
m while their width can reach values over 50
m if distinctions between successive
maximums are considered. In most cases high
resistivity anomalies surroundings varies from

Contemp.Trends.Geosci.,3,2014,14-23 DOI:10.2478/ctg-2014-0018
19
1000 to 1500 Ωm. On the other hand, low
resistivity areas with 200 - 700 Ωm can be
distinguished in two cases. First one is
characterized by very thin thickness below 10
m and its emergence at the surface. It is clearly
visible on resistivity cross sections of profile 1
(Fig. 4) in its south western part. On the next
profiles it thins considerably but still, there is
no doubt about its existence. Second one
shows wide lateral distribution and is present
in all the profiles under the level with high
anomalies.
Imposed DOI maps on resistivity cross
sections possess tendency to increase its values
below high resistivity anomalies. On profiles 1
and 5 (Fig. 4 and 8) its maximum value
reaches 0.3. In these two profiles, DOI starts to
increase under anomalies. In the other
resistivity cross sections (Fig. 5 to 7) DOI can
reach up to 0.5 and it begins to increase in
areas directly occupied by high resistivity
anomalies. It correlates well with their higher
resistivity values and larger sizes.
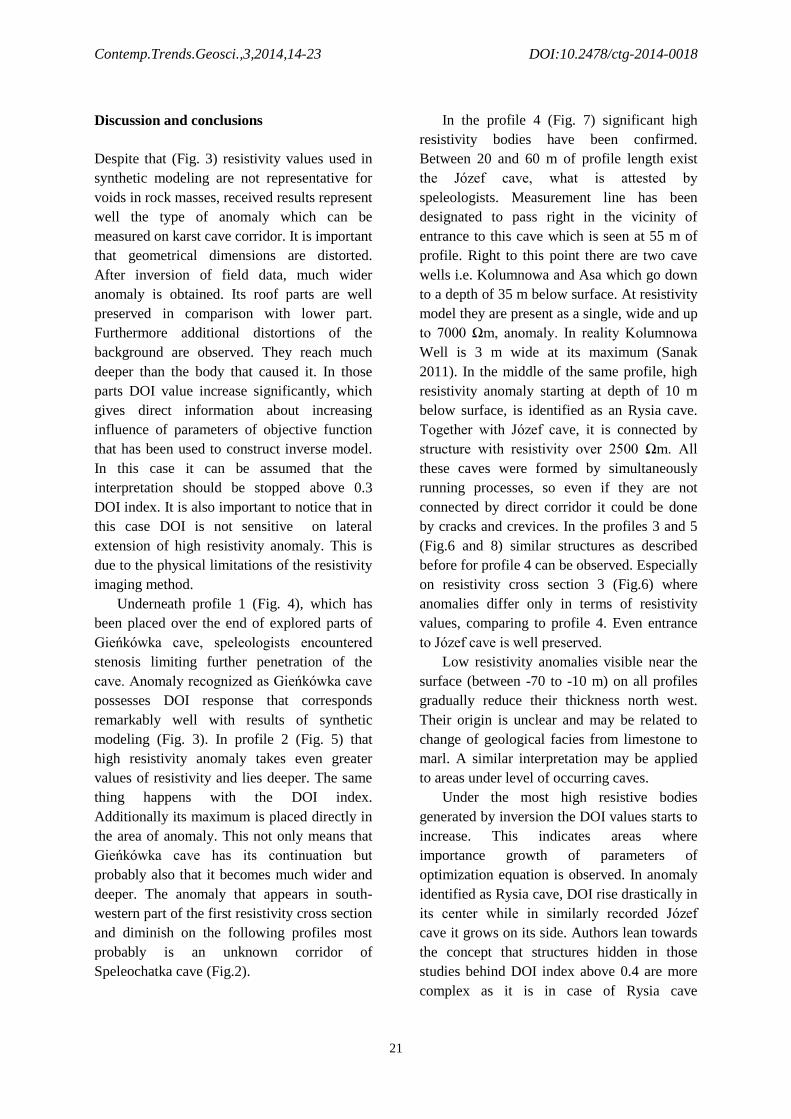
Fig.4. Resistivity cross-section from profile 1, overlapped with DOI index map.
Fig.5. Resistivity cross-section from profile 2, overlapped with DOI index map.

Contemp.Trends.Geosci.,3,2014,14-23 DOI:10.2478/ctg-2014-0018
20
Fig.6. Resistivity cross-section from profile 3, overlapped with DOI index map.
Fig.7. Resistivity cross-section from profile 4, overlapped with DOI index map.
Fig.8. Resistivity cross-section from profile 5, overlapped with DOI index map.
Contemp.Trends.Geosci.,3,2014,14-23 DOI:10.2478/ctg-2014-0018
21
Discussion and conclusions
Despite that (Fig. 3) resistivity values used in
synthetic modeling are not representative for
voids in rock masses, received results represent
well the type of anomaly which can be
measured on karst cave corridor. It is important
that geometrical dimensions are distorted.
After inversion of field data, much wider
anomaly is obtained. Its roof parts are well
preserved in comparison with lower part.
Furthermore additional distortions of the
background are observed. They reach much
deeper than the body that caused it. In those
parts DOI value increase significantly, which
gives direct information about increasing
influence of parameters of objective function
that has been used to construct inverse model.
In this case it can be assumed that the
interpretation should be stopped above 0.3
DOI index. It is also important to notice that in
this case DOI is not sensitive on lateral
extension of high resistivity anomaly. This is
due to the physical limitations of the resistivity
imaging method.
Underneath profile 1 (Fig. 4), which has
been placed over the end of explored parts of
Gieńkówka cave, speleologists encountered
stenosis limiting further penetration of the
cave. Anomaly recognized as Gieńkówka cave
possesses DOI response that corresponds
remarkably well with results of synthetic
modeling (Fig. 3). In profile 2 (Fig. 5) that
high resistivity anomaly takes even greater
values of resistivity and lies deeper. The same
thing happens with the DOI index.
Additionally its maximum is placed directly in
the area of anomaly. This not only means that
Gieńkówka cave has its continuation but
probably also that it becomes much wider and
deeper. The anomaly that appears in south-
western part of the first resistivity cross section
and diminish on the following profiles most
probably is an unknown corridor of
Speleochatka cave (Fig.2).
In the profile 4 (Fig. 7) significant high
resistivity bodies have been confirmed.
Between 20 and 60 m of profile length exist
the Józef cave, what is attested by
speleologists. Measurement line has been
designated to pass right in the vicinity of
entrance to this cave which is seen at 55 m of
profile. Right to this point there are two cave
wells i.e. Kolumnowa and Asa which go down
to a depth of 35 m below surface. At resistivity
model they are present as a single, wide and up
to 7000 Ωm, anomaly. In reality Kolumnowa
Well is 3 m wide at its maximum (Sanak
2011). In the middle of the same profile, high
resistivity anomaly starting at depth of 10 m
below surface, is identified as an Rysia cave.
Together with Józef cave, it is connected by
structure with resistivity over 2500 Ωm. All
these caves were formed by simultaneously
running processes, so even if they are not
connected by direct corridor it could be done
by cracks and crevices. In the profiles 3 and 5
(Fig.6 and 8) similar structures as described
before for profile 4 can be observed. Especially
on resistivity cross section 3 (Fig.6) where
anomalies differ only in terms of resistivity
values, comparing to profile 4. Even entrance
to Józef cave is well preserved.
Low resistivity anomalies visible near the
surface (between -70 to -10 m) on all profiles
gradually reduce their thickness north west.
Their origin is unclear and may be related to
change of geological facies from limestone to
marl. A similar interpretation may be applied
to areas under level of occurring caves.
Under the most high resistive bodies
generated by inversion the DOI values starts to
increase. This indicates areas where
importance growth of parameters of
optimization equation is observed. In anomaly
identified as Rysia cave, DOI rise drastically in
its center while in similarly recorded Józef
cave it grows on its side. Authors lean towards
the concept that structures hidden in those
studies behind DOI index above 0.4 are more
complex as it is in case of Rysia cave

Contemp.Trends.Geosci.,3,2014,14-23 DOI:10.2478/ctg-2014-0018
22
characterized by multitude small corridors
leaving the sides from main corridor or wells
and Józefa cave that possess a relatively simple
structure. It is indicator over complicated
nature of Gieńkówka cave continuation which
yet has to be confirmed by speleologists. In
case of those areas with high DOI index values
providing even the estimated depth of the
bottom of the caves should not be considered
as reliable.
Acknowledgements
The research has been partially supported by
Young Researchers Project founded by
University of Silesia. Special thanks for
members of Speleological Club Olkusz for
providing maps and their help in the field
work.
References:
Buła Z. (2000) Lower Palaeozoic of Upper
Silesia and the western Małopolska (Dolny
Paleozoik Górnego Śląska i Zachodniej
Małopolski), Pr. PIG.171, p. 63 (in Polish)
Dadlez R. Kowalczewski Z., Znosko J. (1994)
Some key problems of the pre-Permian
tectonics of Poland, Kwartalnik
Geologiczny, 38: pp. 169-190.
Deceuster J., Etienne A., Tanguy R., Nguyen
F., Kaufmann O. (2014) A modified DOI-
based method to statistically estimate the
depth of investigation of dc resistivity
surveys, Journal of Applied Geophysics,
103, pp. 172-185
Gradziński M. (2013) Phreatic caves of the
Polish Jura – palaeohydrological
conditions of their origin, Materiały 47,
Sympozjum Speleologicznego., Olsztyn.
(In Polish).
Gradziński R. (1962) Development of
underground karst forms in the southern
part of the Cracow Upland (Rozwój
podziemnych form krasowych
w południowej części Wyżyny
Krakowsko-Częstochowskiej),.Rocznik
Polskiego Towarzystwa Geologicznego 32,
pp. 429-492. (in Polish)
Ciołkiewicz A., Nowak J. (2013) Fulfilled
Dreams Cave (Jaskinia Spełnionych
marzeń), Jaskinie 72, (in Polish)
Jędrys J. (2007) Application of selected
geophysical methods for identification of
facies of Upper Jurassic formations in the
Kraków-Częstochowa Upland
(Zastosowanie wybranych metod
geofizycznych do rozpoznawania
facjalnego utworów górnojurajskich na
wyżynie Krakowsko-Częstochowskiej),
Rozprawa doktorska AGH, Kraków (in
Polish)
Loke M.H. (2014) Tutorial: 2-D and 3-D
electrical imaging; surveys in:
http://www.geoelectrical.com (Website
accessed 26.04.2014)
Loke M.H., Acworth I., Dahlin T. (2003)
A comparison of smooth and blocky
inversion methods in 2D electrical imaging
surveys, Exploration Geophysics 34, pp.
182-187
Marescot L., Loke M.H., Chapellier D.,
Delaloye R.,Lambiel C., Reynard E. (2003)
Assessing reliability of 2D resistivity
imaging in mountain permafrost studies
using the depth of investigation index
method, Near Surface Geophysics, 1(2),
pp. 57-67
Morawska A. (1997) The Lubliniec fracture
zone: Boundary of the Upper Silesian and
Małopolska Massifs, southern Poland. –
Ann. Soc. Geol. Polon. 67, pp. 429-437.
Oldenburg D. W., Jones F.H.M. (2007)
Inversion for Applied Geophysics;
Learning resources about geophysical
inversion, University of British Columbia:
Geophysical Inversion Facility,
http://www.eos.ubc.ca/ubcgif/iag/index.ht
m (Website accessed 26.04.2014)
Oldenburg D.W., Li Y. (1999) Estimating
depth of investigation in dc resistivity and
IP surveys, Geophysics 64(2), pp. 403-416.

Contemp.Trends.Geosci.,3,2014,14-23 DOI:10.2478/ctg-2014-0018
23
RES2DINV manual (2014)
http://www.geoelectrical.com (Website
accessed 26.04.2014)
Sanak A. (2011) Plan of Józef Cave,
http://www.jaskiniejury.pl/lista-
jaskin/jaskinie-wyzyny-krakowsko-
czestochowskiej/96-jozefa-402-metry
(Website accessed 01.06.2014)
Stepišnik U. Mihevc A. (2008) Investigation of
structure of various surface karst
formations in limestone and dolomite
bedrock with application of the electrical
resistivity imaging, Acta carsologica, 2008,
Vol 37, Issue 1, pp. 133-140
Żaba J. (1999) Structural evolution of the
Lower Palaeozoic formations at the
boundary of the Upper Silesia and
Małopolska Blocks. (Ewolucja strukturalna
utworów dolnopaleozoicznych w strefie
granicznej bloków górnośląskiego i
małopolskiego) Pr. PIG, p. 166 (in Polish)