electrical resistivity tomography imaging of leachate
TRANSCRIPT
1
ELECTRICAL RESISTIVITY TOMOGRAPHY IMAGING OF LEACHATE RECIRCULATION IN ORCHARD HILLS LANDFILL
Solenne Grellier Krishna Reddy
Janardhanan Gangathulasi University of Illinois at Chicago Department of Civil & Materials
Engineering Chicago, Illinois
Rana Adib
CReeD (Environment Energy and Waste Research Centre of Veolia)
Limay, FRANCE
Chris Peters
Veolia Environmental Services Davis Junction, Illinois
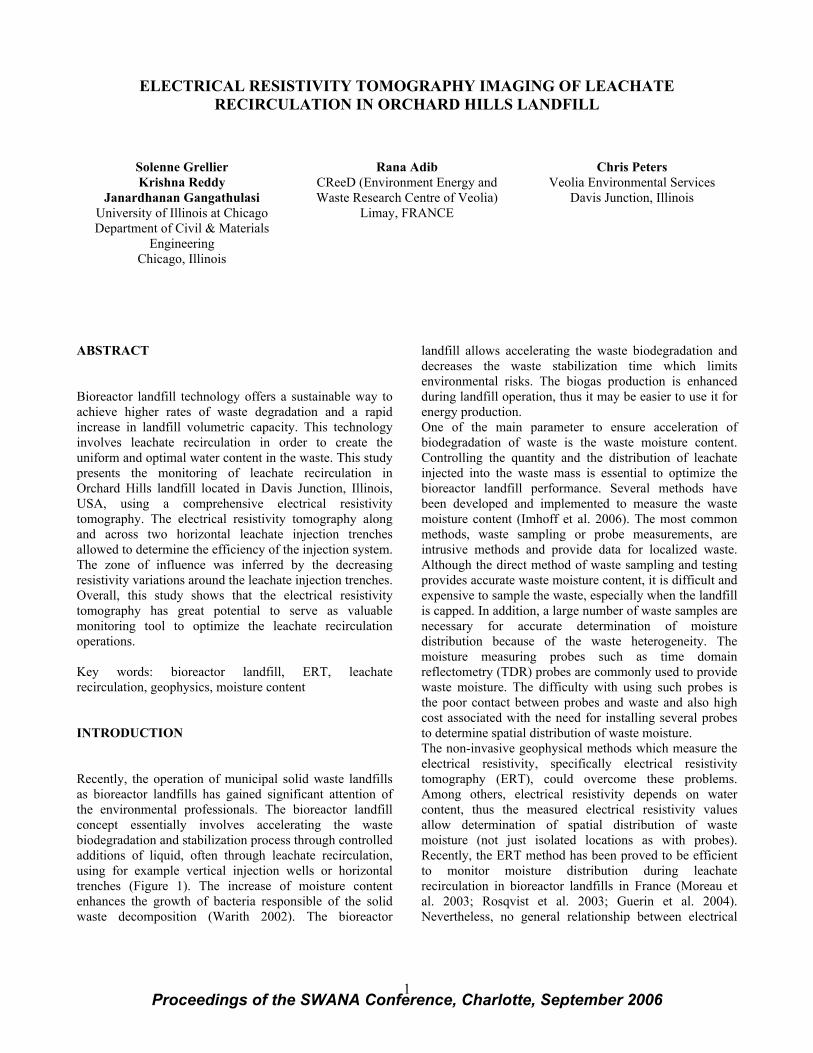
ABSTRACT Bioreactor landfill technology offers a sustainable way to achieve higher rates of waste degradation and a rapid increase in landfill volumetric capacity. This technology involves leachate recirculation in order to create the uniform and optimal water content in the waste. This study presents the monitoring of leachate recirculation in Orchard Hills landfill located in Davis Junction, Illinois, USA, using a comprehensive electrical resistivity tomography. The electrical resistivity tomography along and across two horizontal leachate injection trenches allowed to determine the efficiency of the injection system. The zone of influence was inferred by the decreasing resistivity variations around the leachate injection trenches. Overall, this study shows that the electrical resistivity tomography has great potential to serve as valuable monitoring tool to optimize the leachate recirculation operations. Key words: bioreactor landfill, ERT, leachate recirculation, geophysics, moisture content INTRODUCTION Recently, the operation of municipal solid waste landfills as bioreactor landfills has gained significant attention of the environmental professionals. The bioreactor landfill concept essentially involves accelerating the waste biodegradation and stabilization process through controlled additions of liquid, often through leachate recirculation, using for example vertical injection wells or horizontal trenches (Figure 1). The increase of moisture content enhances the growth of bacteria responsible of the solid waste decomposition (Warith 2002). The bioreactor
landfill allows accelerating the waste biodegradation and decreases the waste stabilization time which limits environmental risks. The biogas production is enhanced during landfill operation, thus it may be easier to use it for energy production. One of the main parameter to ensure acceleration of biodegradation of waste is the waste moisture content. Controlling the quantity and the distribution of leachate injected into the waste mass is essential to optimize the bioreactor landfill performance. Several methods have been developed and implemented to measure the waste moisture content (Imhoff et al. 2006). The most common methods, waste sampling or probe measurements, are intrusive methods and provide data for localized waste. Although the direct method of waste sampling and testing provides accurate waste moisture content, it is difficult and expensive to sample the waste, especially when the landfill is capped. In addition, a large number of waste samples are necessary for accurate determination of moisture distribution because of the waste heterogeneity. The moisture measuring probes such as time domain reflectometry (TDR) probes are commonly used to provide waste moisture. The difficulty with using such probes is the poor contact between probes and waste and also high cost associated with the need for installing several probes to determine spatial distribution of waste moisture. The non-invasive geophysical methods which measure the electrical resistivity, specifically electrical resistivity tomography (ERT), could overcome these problems. Among others, electrical resistivity depends on water content, thus the measured electrical resistivity values allow determination of spatial distribution of waste moisture (not just isolated locations as with probes). Recently, the ERT method has been proved to be efficient to monitor moisture distribution during leachate recirculation in bioreactor landfills in France (Moreau et al. 2003; Rosqvist et al. 2003; Guerin et al. 2004). Nevertheless, no general relationship between electrical
Proceedings of the SWANA Conference, Charlotte, September 2006
2
resistivity and moisture content is available for MSW. But Grellier (2005) showed that ERT is a suitable method to monitor the leachate recirculation in MSW, and it can provide an estimation of the variations of the moisture content during leachate recirculation events. To date, the ERT method has not been used to monitor moisture distribution in bioreactor landfills in the United States. Because of its proven success in France and distinct advantages over the common methods (sampling or probes), the ERT method has been used to monitor moisture distribution and evaluate the efficiency of leachate recirculation system at Orchard Hills landfill located in Davis Junction, Illinois, USA. This paper presents the initial results of this study and a more detailed monitoring program is currently in progress.
Leachate injection(horizontal trenches)
Biogas collecting
Leachates storageBiogas collecting
and reclaiming
Leachate collecting
Leachate injection(wells)
FIGURE 1: HORIZONTAL AND VERTICAL
LEACHATE INJECTION SYSTEMS (FROM VEOLIA ENVIRONMENTAL SERVICES)
METHODOLOGY Geophysical methods measuring the electrical resistivity have been used to follow the leachate flows (Dahlin 2001). These methods essentially consist of injecting an electrical current (I) through two metallic electrodes and measuring the potential difference (ΔV) between two other electrodes. The apparent resistivity (ρa) is given by the following
relationship: aVKIΔ
ρ = with K a geometrical factor
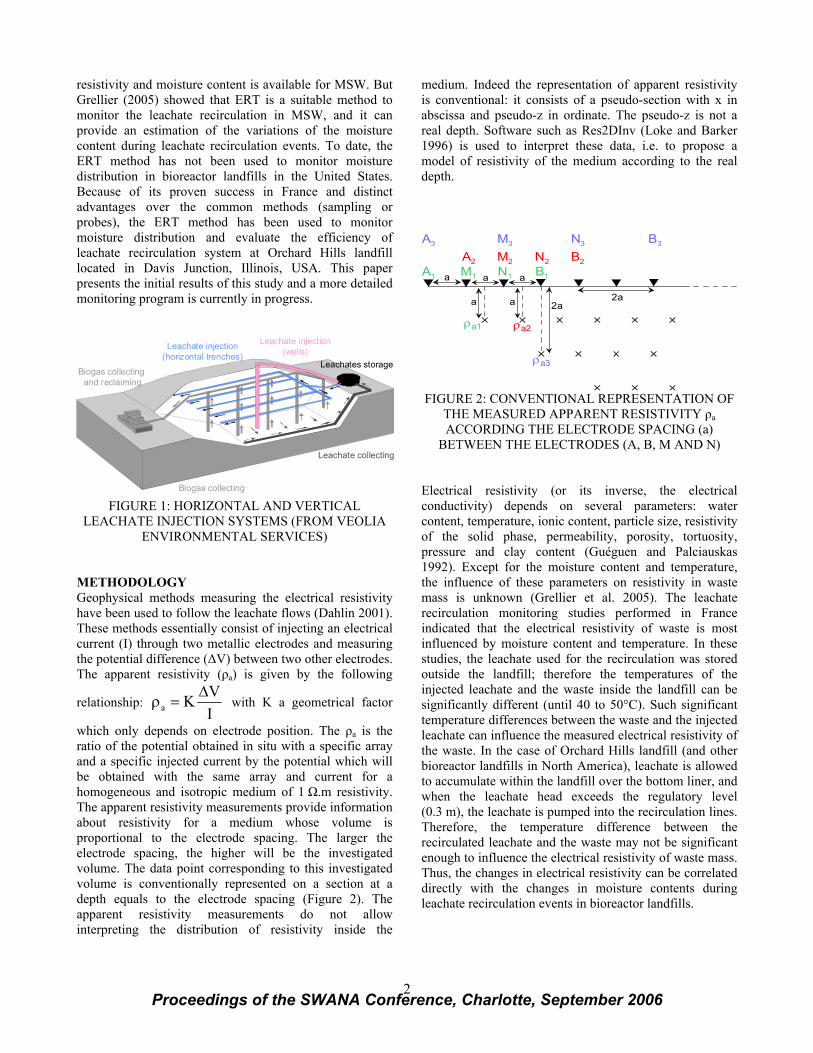
which only depends on electrode position. The ρa is the ratio of the potential obtained in situ with a specific array and a specific injected current by the potential which will be obtained with the same array and current for a homogeneous and isotropic medium of 1 Ω.m resistivity. The apparent resistivity measurements provide information about resistivity for a medium whose volume is proportional to the electrode spacing. The larger the electrode spacing, the higher will be the investigated volume. The data point corresponding to this investigated volume is conventionally represented on a section at a depth equals to the electrode spacing (Figure 2). The apparent resistivity measurements do not allow interpreting the distribution of resistivity inside the
medium. Indeed the representation of apparent resistivity is conventional: it consists of a pseudo-section with x in abscissa and pseudo-z in ordinate. The pseudo-z is not a real depth. Software such as Res2DInv (Loke and Barker 1996) is used to interpret these data, i.e. to propose a model of resistivity of the medium according to the real depth.
aA1 B1M1 N1a a
ρa1
a
A3
A2 B2M2 N2
M3 N3 B3
a 2a2a
ρa2
ρa3
FIGURE 2: CONVENTIONAL REPRESENTATION OF
THE MEASURED APPARENT RESISTIVITY ρa ACCORDING THE ELECTRODE SPACING (a)
BETWEEN THE ELECTRODES (A, B, M AND N)
Electrical resistivity (or its inverse, the electrical conductivity) depends on several parameters: water content, temperature, ionic content, particle size, resistivity of the solid phase, permeability, porosity, tortuosity, pressure and clay content (Guéguen and Palciauskas 1992). Except for the moisture content and temperature, the influence of these parameters on resistivity in waste mass is unknown (Grellier et al. 2005). The leachate recirculation monitoring studies performed in France indicated that the electrical resistivity of waste is most influenced by moisture content and temperature. In these studies, the leachate used for the recirculation was stored outside the landfill; therefore the temperatures of the injected leachate and the waste inside the landfill can be significantly different (until 40 to 50°C). Such significant temperature differences between the waste and the injected leachate can influence the measured electrical resistivity of the waste. In the case of Orchard Hills landfill (and other bioreactor landfills in North America), leachate is allowed to accumulate within the landfill over the bottom liner, and when the leachate head exceeds the regulatory level (0.3 m), the leachate is pumped into the recirculation lines. Therefore, the temperature difference between the recirculated leachate and the waste may not be significant enough to influence the electrical resistivity of waste mass. Thus, the changes in electrical resistivity can be correlated directly with the changes in moisture contents during leachate recirculation events in bioreactor landfills.
Proceedings of the SWANA Conference, Charlotte, September 2006
3
The ERT method has been well studied and it has shown that electrical current can flow through the waste mass (Carpenter et al, 1991; Haker et al. 1997; Berstone et al. 2000). These studies have been limited to landfills that were capped with low resistive materials such as soil covers (e.g., compacted clay layer). The Subtitle D landfills and most of the bioreactor landfills require a composite cover system consisting of a geomembrane liner in order to prevent infiltration of precipitation and emissions of landfill gas. Electrical current can not flow through such composite cover systems consisting of geomembrane liner; therefore, it is essential to place the electrodes just beneath the geomembrane. In the case of a long term monitoring, as the electrodes and associated cables have to be buried below the geomembrane and cover soil layers of the final cover system, it is critical to ensure that a good connection between the waste mass and the electrodes and cables is established at the time of the installation. Prior to the installation of the geomembrane liner, ERT can be conducted to evaluate the recirculation system without special requirements, and the same equipment can be used on several sites, minimizing the cost of the instrumentation. The ERT method can be implemented with different number of electrodes per line. The use of 48 electrodes per line can result in 684 x 2 measurements for an electrical imaging acquired with the pole-dipole array. Such large number of measurements requires about 2 hours and 15 minutes with a classic resistivity-meter. With such large time requirement, it is not possible to capture the snapshot of moisture distribution at any specified time during leachate recirculation. Therefore, it is important to quickly acquire the data in order not to obtain a biased resistivity distribution. A new generation resistivity-meter, the Syscal Pro designed for high productivity survey by IRIS Instruments, has been used for this study. To reduce time for data acquisition, further optimizations of sequences are required. The above methodology has been validated during monitoring of French bioreactors (Grellier 2005) and is adopted for this study. In order to evaluate the efficiency
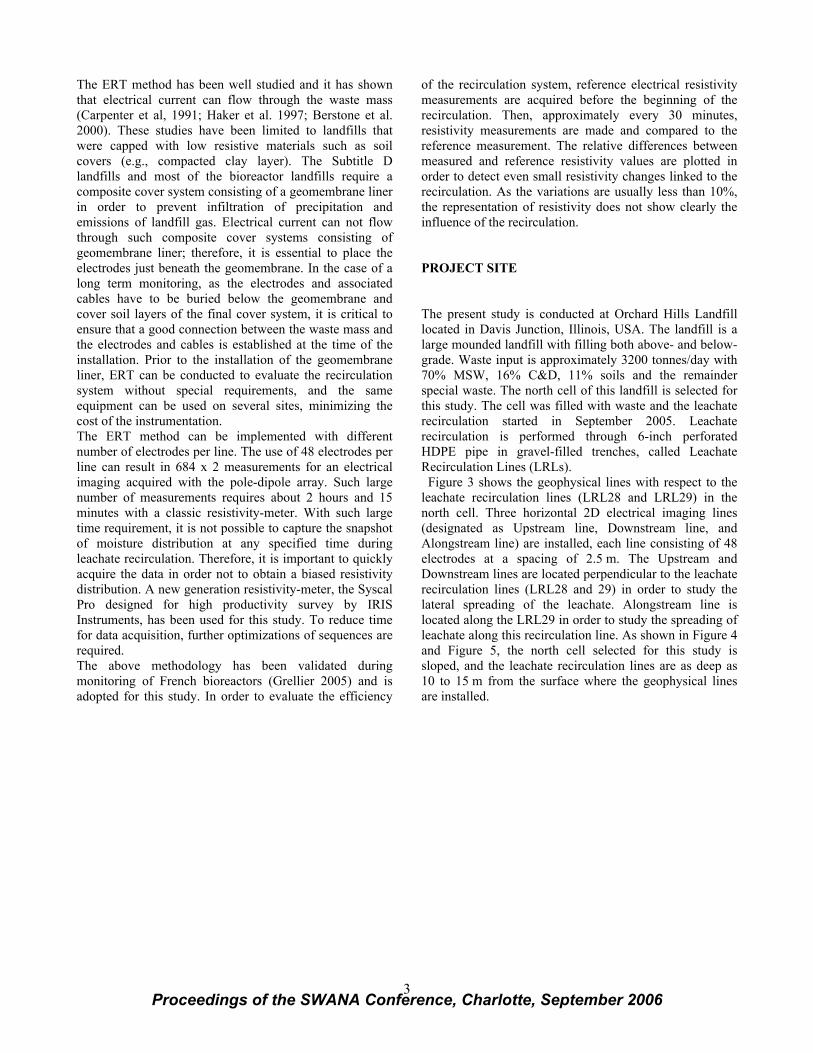
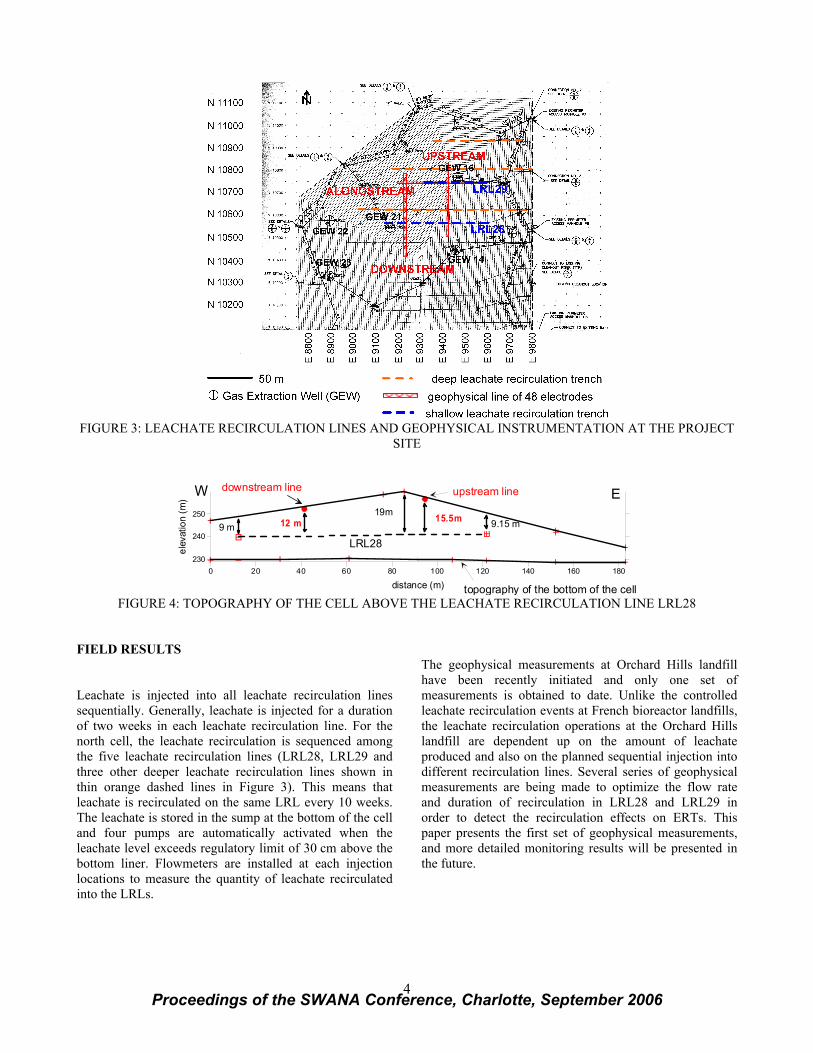
of the recirculation system, reference electrical resistivity measurements are acquired before the beginning of the recirculation. Then, approximately every 30 minutes, resistivity measurements are made and compared to the reference measurement. The relative differences between measured and reference resistivity values are plotted in order to detect even small resistivity changes linked to the recirculation. As the variations are usually less than 10%, the representation of resistivity does not show clearly the influence of the recirculation. PROJECT SITE The present study is conducted at Orchard Hills Landfill located in Davis Junction, Illinois, USA. The landfill is a large mounded landfill with filling both above- and below-grade. Waste input is approximately 3200 tonnes/day with 70% MSW, 16% C&D, 11% soils and the remainder special waste. The north cell of this landfill is selected for this study. The cell was filled with waste and the leachate recirculation started in September 2005. Leachate recirculation is performed through 6-inch perforated HDPE pipe in gravel-filled trenches, called Leachate Recirculation Lines (LRLs). Figure 3 shows the geophysical lines with respect to the leachate recirculation lines (LRL28 and LRL29) in the north cell. Three horizontal 2D electrical imaging lines (designated as Upstream line, Downstream line, and Alongstream line) are installed, each line consisting of 48 electrodes at a spacing of 2.5 m. The Upstream and Downstream lines are located perpendicular to the leachate recirculation lines (LRL28 and 29) in order to study the lateral spreading of the leachate. Alongstream line is located along the LRL29 in order to study the spreading of leachate along this recirculation line. As shown in Figure 4 and Figure 5, the north cell selected for this study is sloped, and the leachate recirculation lines are as deep as 10 to 15 m from the surface where the geophysical lines are installed.
Proceedings of the SWANA Conference, Charlotte, September 2006
4
FIGURE 3: LEACHATE RECIRCULATION LINES AND GEOPHYSICAL INSTRUMENTATION AT THE PROJECT
SITE
EW
LRL289 m
19m
downstream line upstream line
15.5m12 m
0 20 40 60 80 100 120 140 160 180
distance (m)
230
240
250
elev
atio
n (m
)
topography of the bottom of the cell
9.15 m
FIGURE 4: TOPOGRAPHY OF THE CELL ABOVE THE LEACHATE RECIRCULATION LINE LRL28
FIELD RESULTS Leachate is injected into all leachate recirculation lines sequentially. Generally, leachate is injected for a duration of two weeks in each leachate recirculation line. For the north cell, the leachate recirculation is sequenced among the five leachate recirculation lines (LRL28, LRL29 and three other deeper leachate recirculation lines shown in thin orange dashed lines in Figure 3). This means that leachate is recirculated on the same LRL every 10 weeks. The leachate is stored in the sump at the bottom of the cell and four pumps are automatically activated when the leachate level exceeds regulatory limit of 30 cm above the bottom liner. Flowmeters are installed at each injection locations to measure the quantity of leachate recirculated into the LRLs.
The geophysical measurements at Orchard Hills landfill have been recently initiated and only one set of measurements is obtained to date. Unlike the controlled leachate recirculation events at French bioreactor landfills, the leachate recirculation operations at the Orchard Hills landfill are dependent up on the amount of leachate produced and also on the planned sequential injection into different recirculation lines. Several series of geophysical measurements are being made to optimize the flow rate and duration of recirculation in LRL28 and LRL29 in order to detect the recirculation effects on ERTs. This paper presents the first set of geophysical measurements, and more detailed monitoring results will be presented in the future.
Proceedings of the SWANA Conference, Charlotte, September 2006
5
EW7.6 m
13.6mdownstream line
upstream line
11.7m
0 20 40 60 80 100 120 140 160 180 200
distance (m)
220
230
240
250
elev
atio
n (m
)
topography of the bottom of the cell
10.3 m
LRL29
alongstream line
FIGURE 5: TOPOGRAPHY OF THE CELL ABOVE THE LEACHATE RECIRCULATION LINE LRL29
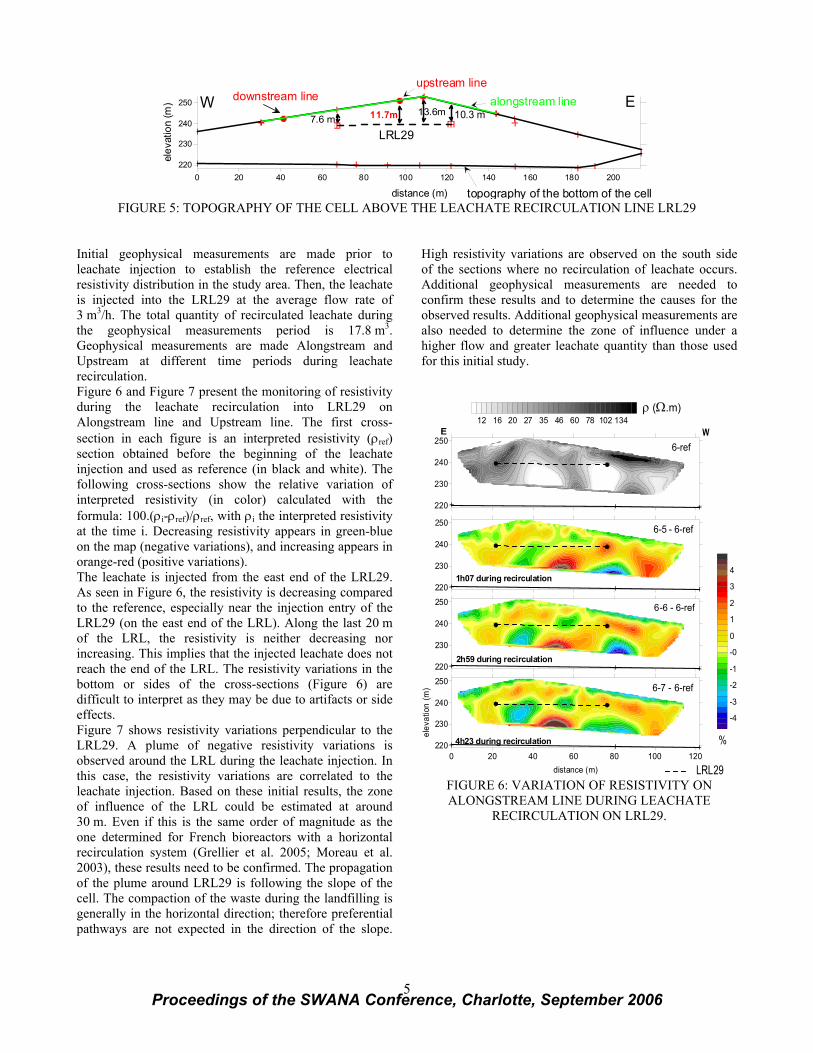
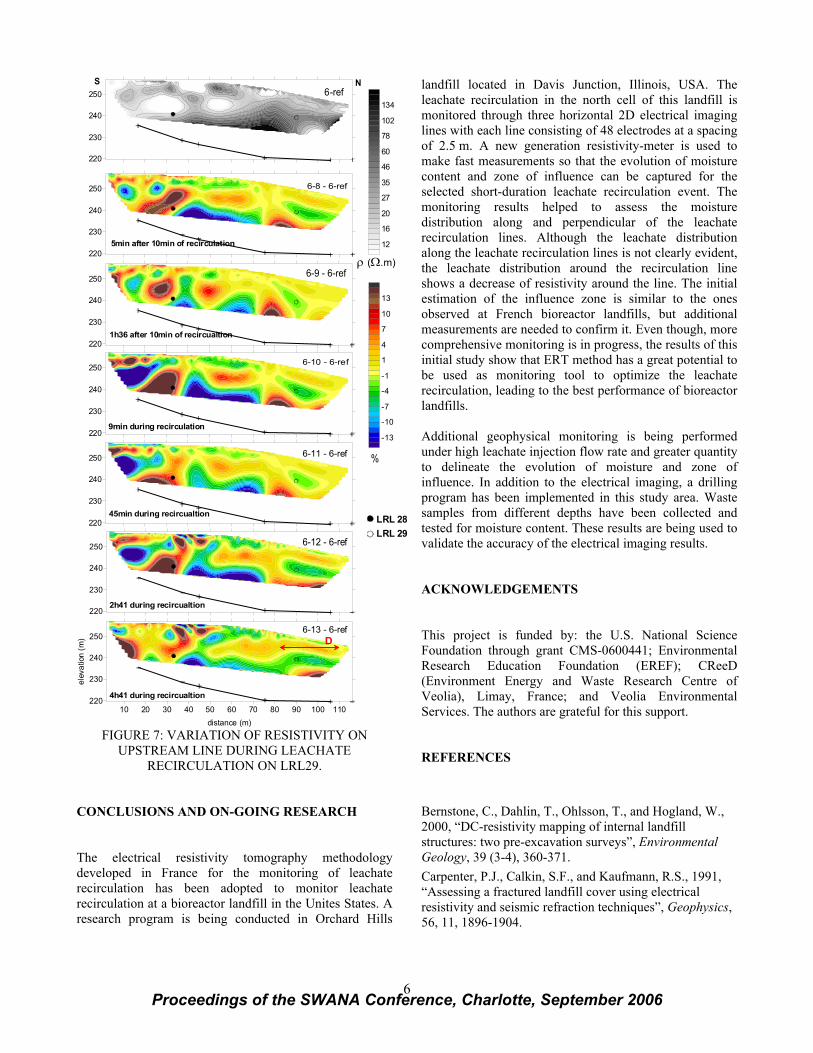
Initial geophysical measurements are made prior to leachate injection to establish the reference electrical resistivity distribution in the study area. Then, the leachate is injected into the LRL29 at the average flow rate of 3 m3/h. The total quantity of recirculated leachate during the geophysical measurements period is 17.8 m3. Geophysical measurements are made Alongstream and Upstream at different time periods during leachate recirculation. Figure 6 and Figure 7 present the monitoring of resistivity during the leachate recirculation into LRL29 on Alongstream line and Upstream line. The first cross-section in each figure is an interpreted resistivity (ρref) section obtained before the beginning of the leachate injection and used as reference (in black and white). The following cross-sections show the relative variation of interpreted resistivity (in color) calculated with the formula: 100.(ρi-ρref)/ρref, with ρi the interpreted resistivity at the time i. Decreasing resistivity appears in green-blue on the map (negative variations), and increasing appears in orange-red (positive variations). The leachate is injected from the east end of the LRL29. As seen in Figure 6, the resistivity is decreasing compared to the reference, especially near the injection entry of the LRL29 (on the east end of the LRL). Along the last 20 m of the LRL, the resistivity is neither decreasing nor increasing. This implies that the injected leachate does not reach the end of the LRL. The resistivity variations in the bottom or sides of the cross-sections (Figure 6) are difficult to interpret as they may be due to artifacts or side effects. Figure 7 shows resistivity variations perpendicular to the LRL29. A plume of negative resistivity variations is observed around the LRL during the leachate injection. In this case, the resistivity variations are correlated to the leachate injection. Based on these initial results, the zone of influence of the LRL could be estimated at around 30 m. Even if this is the same order of magnitude as the one determined for French bioreactors with a horizontal recirculation system (Grellier et al. 2005; Moreau et al. 2003), these results need to be confirmed. The propagation of the plume around LRL29 is following the slope of the cell. The compaction of the waste during the landfilling is generally in the horizontal direction; therefore preferential pathways are not expected in the direction of the slope.
High resistivity variations are observed on the south side of the sections where no recirculation of leachate occurs. Additional geophysical measurements are needed to confirm these results and to determine the causes for the observed results. Additional geophysical measurements are also needed to determine the zone of influence under a higher flow and greater leachate quantity than those used for this initial study.
220
230
240
250
12 16 20 27 35 46 60 78 102 134
6-ref
-4
-3
-2
-1
-0
0
1
2
3
4
220
230
240
250
220
230
240
250
0 20 40 60 80 100 120distance (m)
220
230
240
250
elev
atio
n (m
)
6-5 - 6-ref
6-6 - 6-ref
6-7 - 6-ref
1h07 during recirculation
2h59 during recirculation
4h23 during recirculation
E W
ρ (Ω.m)
%
LRL29 FIGURE 6: VARIATION OF RESISTIVITY ON ALONGSTREAM LINE DURING LEACHATE
RECIRCULATION ON LRL29.
Proceedings of the SWANA Conference, Charlotte, September 2006
6
220
230
240
250
12
16
20
27
35
46
60
78
102
1346-ref
220
230
240
250
-13
-10
-7
-4
-1
1
4
7
10
13
220
230
240
250
220
230
240
250
220
230
240
250
6-8 - 6-ref
6-9 - 6-ref
6-10 - 6-ref
6-11 - 6-ref
5min after 10min of recirculation
1h36 after 10min of recircualtion
9min during recirculation
45min during recircualtion
S N
ρ (Ω.m)
%
220
230
240
250 6-12 - 6-ref
2h41 during recircualtion
10 20 30 40 50 60 70 80 90 100 110distance (m)
220
230
240
250
elev
atio
n (m
)
6-13 - 6-ref
4h41 during recircualtion
LRL 28LRL 29
D
FIGURE 7: VARIATION OF RESISTIVITY ON
UPSTREAM LINE DURING LEACHATE RECIRCULATION ON LRL29.
CONCLUSIONS AND ON-GOING RESEARCH The electrical resistivity tomography methodology developed in France for the monitoring of leachate recirculation has been adopted to monitor leachate recirculation at a bioreactor landfill in the Unites States. A research program is being conducted in Orchard Hills
landfill located in Davis Junction, Illinois, USA. The leachate recirculation in the north cell of this landfill is monitored through three horizontal 2D electrical imaging lines with each line consisting of 48 electrodes at a spacing of 2.5 m. A new generation resistivity-meter is used to make fast measurements so that the evolution of moisture content and zone of influence can be captured for the selected short-duration leachate recirculation event. The monitoring results helped to assess the moisture distribution along and perpendicular of the leachate recirculation lines. Although the leachate distribution along the leachate recirculation lines is not clearly evident, the leachate distribution around the recirculation line shows a decrease of resistivity around the line. The initial estimation of the influence zone is similar to the ones observed at French bioreactor landfills, but additional measurements are needed to confirm it. Even though, more comprehensive monitoring is in progress, the results of this initial study show that ERT method has a great potential to be used as monitoring tool to optimize the leachate recirculation, leading to the best performance of bioreactor landfills. Additional geophysical monitoring is being performed under high leachate injection flow rate and greater quantity to delineate the evolution of moisture and zone of influence. In addition to the electrical imaging, a drilling program has been implemented in this study area. Waste samples from different depths have been collected and tested for moisture content. These results are being used to validate the accuracy of the electrical imaging results. ACKNOWLEDGEMENTS This project is funded by: the U.S. National Science Foundation through grant CMS-0600441; Environmental Research Education Foundation (EREF); CReeD (Environment Energy and Waste Research Centre of Veolia), Limay, France; and Veolia Environmental Services. The authors are grateful for this support.
REFERENCES Bernstone, C., Dahlin, T., Ohlsson, T., and Hogland, W., 2000, “DC-resistivity mapping of internal landfill structures: two pre-excavation surveys”, Environmental Geology, 39 (3-4), 360-371. Carpenter, P.J., Calkin, S.F., and Kaufmann, R.S., 1991, “Assessing a fractured landfill cover using electrical resistivity and seismic refraction techniques”, Geophysics, 56, 11, 1896-1904.
Proceedings of the SWANA Conference, Charlotte, September 2006

7
Dahlin, T., 2001, “The development of DC resistivity imaging techniques”, Computers & Geosciences, 27 (9), 1019-1029. Grellier S., 2005, “Suivi hydrologique des centres de stockage de déchet-bioréacteurs par mesures géophysiques”, PhD thesis, Université Pierre et Marie Curie, Paris, 238 p. Grellier, S., Bouyé, J.M., Guérin, R., Robain, H., and Skhiri, N., 2005, “Electrical Resistivity Tomography (ERT) applied to moisture measurements in bioreactor: principles, in situ measurements and results”, International Workshop “Hydro-Physico-Mechanics of Landfills”, Grenoble (France), 21-22 March. Guéguen Y., and Palciauskas V., 1992, “Introduction à la physique des roches”, Hermann, éditeurs des sciences et des arts, 299 p.
Guérin, R., Munoz, M.L., Aran, C., Laperrelle, C., Hidra, M., Drouart, E., and Grellier, S, 2004, “Leachate recirculation: moisture content assessment by means of a geophysical technique”. Waste Management, 24 (8), 785-794 Haker, C.D., Rix, G.J., and Lai, C.G., 1997, “Dynamic properties of municipal solid waste landfills from surface wave tests”, Proc SAGEEP’97 (Symposium on the Application of Geophysics to Engineering and Environmental Problems), Environmental and Engineering Geophysical Society, Wheat Ridge (USA), 301-310. Imhoff, P.T., Reinhart, D.R., Englund, M., Guérin, R., Gawande, N., Han, B., Jonnalagadda, S., Townsend, T.G., and Yazdani, R., 2006, “Review of state of the art methods for measuring water in landfills”, Waste Management, in press. Loke, M.H., and Barker, R.D., 1996, “Rapid least-square inversion of apparent resistivity pseudosections by a quasi-Newton method”, Geophysical Prospecting, 44 (2), 131-152. Moreau, S., Bouyé, J.M., Barina, G., and Oberti, O., 2003, “Electrical resistivity survey to investigate the influence of leachate recirculation in a MSW landfill”, Proceedings of the 9th International Waste Management and Landfill Symposium, Session C02, CISA publ. Rosqvist, H., Dahlin, T., Fourie, A., Röhrs, L., Bengtsson, A., and Larsson, M., 2003, “Mapping of leachate plumes at two landfill sites in South Africa using geoelectrical imaging techniques”, Proceedings of the 9th International Waste Management and Landfill Symposium, Session C02, CISA publ. Warith, M., 2002, “Bioreactor landfills: experimental and field results”, Waste Management, 22 (1), 7-17.
Proceedings of the SWANA Conference, Charlotte, September 2006