geophysical parameters determination using 2-d resistivity...
TRANSCRIPT

GEOPHYSICAL PARAMETERS
DETERMINATION USING 2-D RESISTIVITY
IMAGING AND GROUND PENETRATING
RADAR FOR SUBSURFACE STRUCTURES
MUHAMAD AFIQ BIN SAHARUDIN
UNIVERSITI SAINS MALAYSIA
2017

GEOPHYSICAL PARAMETERS
DETERMINATION USING 2-D RESISTIVITY
IMAGING AND GROUND PENETRATING
RADAR FOR SUBSURFACE STRUCTURES
by
MUHAMAD AFIQ BIN SAHARUDIN
Thesis submitted in fulfillment of the requirements
for the degree of
Master of Science
August 2017

ii
ACKNOWLEDGEMENT
In The name of Allah S.W.T, the Most Beneficent and Merciful. Praise to Allah.
First of all, I would like to express my sincere gratitude to my main
supervisor, Dr. Nordiana Mohd Muztaza who always keeps on assisting me and
guiding me towards the end. Her enthusiastic encouragement and constructive
criticism really help me to develop to become a better person. Not to forget, my co-
supervisors Dr. Nur Azwin Ismail and Prof. Dr. Mohd. Nawawi Mohd Nordin for
being supportive all the time and continue to guide me during my research program. I
would also like to thanks Assoc. Prof. Dr. Rosli Saad and Dr. Andy Anderson Bery
for sharing most of their valuable knowledge and experiences. Million thanks go to
all Geophysics lab staffs starting with Mr. Yaakub Othman, Mr. Azmi Abdullah and
Mr. Abdul Jamil Yusof for their time and effort in assisting me in the research
period.
Special thanks to all my fellow friends which are very helpful towards me by
assisting me and share the knowledge that they had with me; Mr. Hazrul Hisham bin
Badrul Hisham, Mr. Taqiuddin bin Zakaria, Mr. Tarmizi, Mr. Fauzi Andika, Mr. Kiu
Yap Chong, Mr. Mark bin Jinmin, Mr. Muhammad Iqbal Mubarak bin Faharul
Azman, Mr. Azim Hilmy bin Mohd Yusof, Mr. Muhamad Hafizuddin bin Mohd
Mansor, Mr. Amsir, Mr. Sabirin Trianda, Mr. Rais bin Yusoh, Mr. Yakubu Mingyi
Samuel, Mr. Muhammad Sabiu Bala, Ms. Rose Nadia binti Abu Samah, Ms. Umi
Maslinda binti Anuar, Ms. Nordiana binti Ahmad Nawawi, Ms. Nabila binti
Sulaiman, and Ms. Nur Amalina binti Khoirul Anuar.

iii
I would like to express my sincere appreciation towards my beloved parents
Saharudin bin Mohd Sahari and Norhaiza binti Abas, my brother Muhamad Fahmi
bin Saharudin, and two of my younger sisters Anis Suraya binti Saharudin and Anis
Sofea binti Saharudin who always been there for me and trusted me to finish my
master research program with flying colors.
I want to thank Kementerian Pengajian Tinggi (KPT) for providing the
schorlarship scheme known as MyMaster programme. I also want to thank Dr.
Nordiana Mohd Muztaza for providing the Research University Grant (RUI) with the
title “Geophysical Application and Approaches in Engineering and Environmental
Problems” (1001/PFIZIK/811323). Lastly, I want to thank all that not mention here
such as the Geophysics undergraduate students for keep on give me strength to
complete this master program.

iv
TABLE OF CONTENTS
Acknowledgement ii
Table of contents iv
List of tables vii
List of figures viii
List of symbols
List of abbreviations
xi
xiii
Abstrak xiv
Abstract xvi
CHAPTER 1 INTRODUCTION 1
1.0 Background 1
1.1 Problem statements 3
1.2
1.3
1.4
1.5
Research objectives
Scope of study
Motivation and research novelty
Layout of thesis
5
5
6
6
CHAPTER 2
LITERATURE REVIEW
8
2.0 Introduction 8
2.1
2.2
2-D Resistivity Imaging theory
Ground Penetrating Radar (GPR) theory
10
14
2.3 Previous study 16
2.4
CHAPTER 3
Chapter summary
RESEARCH METHODOLOGY
33
36
3.0 Introduction 36
3.1 Geological setting 38

v
3.2 Survey equipments 42
3.3
3.4
3.5
Data acquisition
3.3.1 Air-filled cavity: SoLLAT (USM)
3.3.2 In-filled cavity: Desasiswa Bakti Permai (Bunker)
3.3.3 In-filled cavity: Convocation site (Man-made hole)
3.3.4 In-filled cavity: Bukit Keteri, Chuping, Perlis
3.3.5 In-filled cavity: Bukit Kalong, Kodiang, Kedah
3.3.6 In-filled cavity: Gunung Baling, Baling, Kedah
3.3.7 In-filled cavity: Batu Papan, Kelantan
3.3.8 In-filled cavity: Batu Neng, Kelantan
3.3.9 In-filled cavity: Gua Musang, Kelantan
Data processing
Chapter summary
42
43
45
47
48
50
51
53
54
56
57
62
CHAPTER 4 RESULTS AND DISCUSSIONS 64
4.0 Introduction 64
4.1 Air-filled cavity: SoLLAT 65
4.2
4.3
In-filled cavities
4.2.1 In-filled cavity: Desasiswa Bakti Permai (Bunker)
4.2.2 In-filled cavity: Convocation site (Man-made hole)
4.2.3 In-filled cavity: Bukit Keteri, Chuping, Perlis
4.2.4 In-filled cavity: Bukit Kalong, Kodiang, Kedah
4.2.5 In-filled cavity: Gunung Baling, Baling, Kedah
4.2.6 In-filled cavity: Batu Papan, Kelantan
4.2.7 In-filled cavity: Batu Neng, Kelantan
4.2.8 In-filled cavity: Gua Musang, Kelantan
Chapter summary
68
68
71
74
77
80
83
86
89
92

vi
CHAPTER 5 CONCLUSION AND RECOMMENDATIONS 98
5.0 Conclusion 98
5.1 Recommendations 100
REFERENCES
101
APPENDICES
LIST OF PUBLICATIONS
vii
LIST OF TABLES
Page
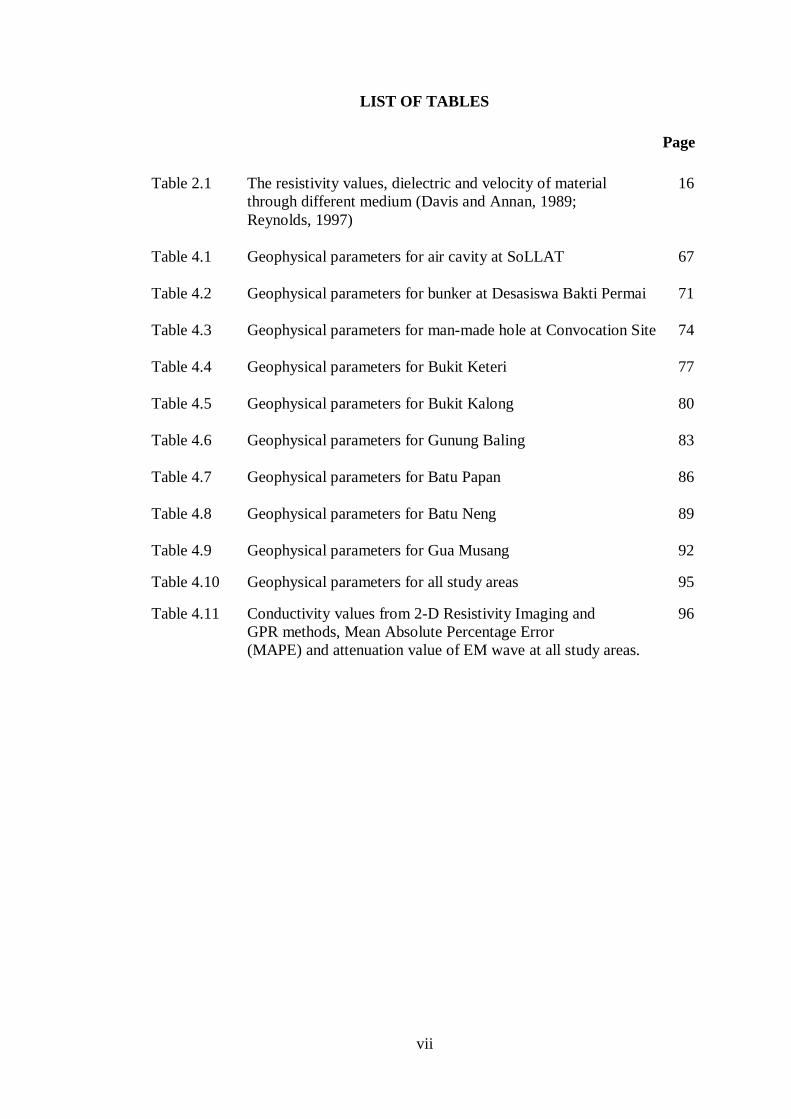
Table 2.1 The resistivity values, dielectric and velocity of material 16
through different medium (Davis and Annan, 1989;
Reynolds, 1997)
Table 4.1 Geophysical parameters for air cavity at SoLLAT 67
Table 4.2 Geophysical parameters for bunker at Desasiswa Bakti Permai 71
Table 4.3 Geophysical parameters for man-made hole at Convocation Site 74
Table 4.4 Geophysical parameters for Bukit Keteri 77
Table 4.5 Geophysical parameters for Bukit Kalong 80
Table 4.6 Geophysical parameters for Gunung Baling 83
Table 4.7 Geophysical parameters for Batu Papan 86
Table 4.8 Geophysical parameters for Batu Neng 89
Table 4.9 Geophysical parameters for Gua Musang 92
Table 4.10 Geophysical parameters for all study areas 95
Table 4.11 Conductivity values from 2-D Resistivity Imaging and 96
GPR methods, Mean Absolute Percentage Error
(MAPE) and attenuation value of EM wave at all study areas.

viii
LIST OF FIGURES
Page
Figure 2.1 Four electrodes array for the basic 2-D Resistivity Imaging 11
measurement
Figure 2.2 The arrangement for 2-D Resistivity Imaging survey and 12
the sequence of measurements used to build up the resistivity
section (modified from Loke, 1999)
Figure 2.3 Resistivity common array and their geometric factors 13
(modified from Loke and Barker, 1996)
Figure 2.4 Basic principle of the GPR (modified from Jol, 2009) 14
Figure 3.1 Research flowchart 37
Figure 3.2 Geological map of Pulau Pinang (modified from Geological map 38
of Peninsular Malaysia, 1985)
Figure 3.3 Geological map of Perlis (modified from Geological map of 39
Peninsular Malaysia, 1985)
Figure 3.4 Geological map of Kedah (modified from Geological map of 40
Peninsular Malaysia, 1985)
Figure 3.5 Geological map of Kelantan (modified from Geological map of 41
Peninsular Malaysia, 1985)
Figure 3.6 Study area at USM (SoLLAT) (Google Earth, 2016) 43
Figure 3.7 The study area at SoLLAT 44
Figure 3.8 The air cavity structure 44
Figure 3.9 Study area at USM (Bunker) (Google Earth, 2016) 45
Figure 3.10 The study area at Desasiswa Bakti Permai 46
Figure 3.11 The bunker structure at Desasiswa Bakti Permai 46
Figure 3.12 Study area at USM (Convocation site) (Google Earth, 2016) 47
Figure 3.13 The study area at Convocation site 48
Figure 3.14 Study area at Bukit Keteri, Perlis (Google Earth, 2016) 49
Figure 3.15 Geophysical survey conducted at Bukit Keteri 49
Figure 3.16 Study area at Bukit Kalong, Kedah (Google Earth, 2016) 50

ix
Figure 3.17 GPR survey conducted at Bukit Kalong 51
Figure 3.18 Study area at Gunung Baling, Kedah (Google Earth, 2016) 52
Figure 3.19 2-D Resistivity Imaging survey conducted at Gunung Baling 52
Figure 3.20 Study area at Batu Papan, Kelantan (Google Earth, 2016) 53
Figure 3.21 GPR survey conducted at Batu Papan 54
Figure 3.22 Study area at Batu Neng, Kelantan (Google Earth, 2016) 55
Figure 3.23 2-D Resistivity Imaging survey at Batu Neng 55
Figure 3.24 Study area at Gua Musang, Kelantan (Google Earth, 2016) 56
Figure 3.25 2-D Resistivity Imaging survey at Gua Musang 57
Figure 3.26 Simplified schematic of GPR method 58
Figure 3.27 2-D Resistivity Imaging processing flowchart 61
Figure 3.28 GPR processing flowchart 61
Figure 4.1 Inversion model of 2-D Resistivity Imaging at SoLLAT 66
Figure 4.2 GPR section that represents the air-cavity at SoLLAT 66
Figure 4.3 Trace graph of the air-cavity at SoLLAT 67
Figure 4.4 Inversion model of 2-D Resistivity Imaging at Desasiswa Bakti 69
Permai
Figure 4.5 GPR section start at 7-30 m that represents the bunker at 69
Desasiswa Bakti Permai
Figure 4.6 Trace graph that represents the bunker at Desasiswa Bakti Permai 70
Figure 4.7 Inversion model of 2-D Resistivity Imaging at Convocation site 71
Figure 4.8 GPR section that represents the man-made hole at Convocation site 72
Figure 4.9 Trace graph that represents the man-made hole at Convocation site 73
Figure 4.10 Inversion model of 2-D Resistivity Imaging at Bukit Keteri 75
Figure 4.11 GPR section from 0-30 m at Bukit Keteri 75
Figure 4.12 GPR section from 30-60 m at Bukit Keteri 76
Figure 4.13 Trace graph of Bukit Keteri 76
Figure 4.14 Inversion model of 2-D Resistivity Imaging at Bukit Kalong 78

x
Figure 4.15 GPR section from 0-35 m at Bukit Kalong 78
Figure 4.16 GPR section from 35-70 m at Bukit Kalong 79
Figure 4.17 Trace graph of Bukit Kalong 79
Figure 4.18 Inversion model of 2-D Resistivity Imaging at Gunung Baling 81
Figure 4.19 GPR section of Gunung Baling 81
Figure 4.20 Trace graph of Gunung Baling 82
Figure 4.21 Inversion model of 2-D Resistivity Imaging at Batu Papan 83
Figure 4.22 GPR section of Batu Papan 84
Figure 4.23 Trace graph of Batu Papan 85
Figure 4.24 Inversion model of 2-D Resistivity Imaging at Batu Neng 87
Figure 4.25 GPR section of Batu Neng 87
Figure 4.26 Trace graph of Batu Neng 88
Figure 4.27 Inversion model of 2-D Resistivity Imaging at Gua Musang 90
Figure 4.28 GPR section of Gua Musang 90
Figure 4.29 Trace graph of Gua Musang 91
Figure 4.30 Bar chart of conductivity values for all study areas 96
Figure 4.31 Bar chart of the attenuation value of EM wave for all study areas 97

xi
LIST OF SYMBOLS
A Cross-sectional area
a Electrode spacing
d Depth
dB Decibel
g Gram
I Current
k Geometric factor
km Kilometer
kg Kilogram
L Length
m Meter
mS Millisiemens
n Nano
R Resistance
s Second
t Time travel
V Velocity
ω Angular frequency
α Attenuation
σ Conductivity
εr Dielectric permittivity
µ Magnetic permeability constant
Ω Ohm

xii
% Percentage
Resistivity
< Less than
ore than

xiii
LIST OF ABBREVIATIONS
ASCII American Standard Code for Information Interchange
E Easting
EM Electromagnetic
EMR Electromagnetic radiation
GPR Ground Penetrating Radar
MAPE Mean Absolute Percentage Error
N Northing
N-S North South
RES2DINV Resistivity 2-D Inversion software
RES2DMOD Resistivity 2-D Modeling software
RQD Rock Quality Design
SAS Signal Averaging System
SMART Stormwater Management and Road Tunnel
SoLLAT School of Languages, Literacies, and Translation
S-N South North
TBM Tunnel Boring Machine
USM Universiti Sains Malaysia
VES Vertical Electrical Sounding
W-E West East
2-D Two-Dimensional
3-D Three-Dimensional

xiv
PENENTUAN PARAMETER GEOFIZIK MENGGUNAKAN PENGIMEJAN
KEBERINTANGAN 2-D DAN RADAR TUSUKAN BUMI UNTUK
STRUKTUR SUBPERMUKAAN
ABSTRAK
Kaedah pengimejan keberintangan 2-D dan radar tusukan bumi adalah
kaedah geofizik yang boleh digunakan untuk mengkaji subpermukaan. Kawasan
kajian terletak di Pulau Pinang, Perlis, Kedah dan Kelantan. Kajian ini menggunakan
susun atur Pole-Dipole dan Wenner Schlumberger bagi kaedah pengimejan
keberintangan 2-D dan antenna 250 MHz bagi kaedah radar tusukan bumi bagi
kesemua kawasan kajian. Objektif kajian ini adalah untuk mengesan dan mengenal
pasti kemungkinan tanda kenal yang mewakili rongga–rongga dengan menggunakan
kaedah pengimejan keberintangan 2-D dan radar tusukan bumi, untuk menghubung
kaitkan parameter geofizikal seperti nilai konduktiviti daripada kaedah pengimejan
keberingtangan 2-D dan radar tusukan bumi, perambatan halaju gelombang
elektromagnetik (EM), ketelusan dielektrik, nilai pengurangan gelombang EM dan
Ralat Peratusan Purata Mutlak yang diperolehi dari kaedah pengimejan
keberintangan 2-D dan radar tusukan bumi dan akhir sekali, untuk membezakan
parameter geofizikal antara rongga berisi udara, struktur konkrit dan rongga yang
berisi sedimen. Nilai keberintangan yang lebih tinggi bermula dari 500-800 Ωm
mewakili rongga berisi udara manakala nilai keberintangan bermula dari 5-250 Ωm
menunjukkan rongga yang berisi yang berkait dengan struktur konkrit dan nilai
keberintangan bermula dari 5-60 Ωm mewakili rongga berisi sedimen. Nilai
konduktiviti terhitung bermula dengan rongga yang berisi udara ialah 0.0016 S/m
dan bagi rongga yang berisi yang berkait dengan struktur konkrit pula ialah 0.0926

xv
S/m dan 0.0772 S/m. Nilai konduktiviti terhitung bagi semua kawasan kes kajian
bermula dengan nilai tertinggi 0.0148 S/m dan nilai yang terendah ialah 0.0053 S/m.
Nilai pengurangan gelombang EM bagi rongga yang berisi yang berkait dengan
struktur konkrit adalah lebih tinggi dengan nilai 57.0448 dB/m dan 41.5438 dB/m
berbanding dengan 0.9672 dB/m bagi rongga berisi udara. Nilai pengurangan
gelombang EM bagi rongga berisi sedimen bermula dgn nilai pengurangan tertinggi
adalah 8.9725 dB/m dan yang terendah adalah 2.9447 dB/m. Kesimpulannya,
kesemua objektif dalam kajian ini berjaya dicapai dan kaedah pengimejan
keberintangan 2-D dan radar tusukan bumi berjaya membezakan antara parameter
geofizikal bagi rongga berisi udara, struktur konkrit dan rongga berisi sedimen.

xvi
GEOPHYSICAL PARAMETERS DETERMINATION USING 2-D
RESISTIVITY IMAGING AND GROUND PENETRATING RADAR FOR
SUBSURFACE STRUCTURES
ABSTRACT
2-D Resistivity Imaging and Ground Penetrating Radar (GPR) methods are
geophysical methods that can be used to study the subsurface. The study areas are
located at Pulau Pinang, Perlis, Kedah and Kelantan. This research using the Pole-
Dipole and Wenner Schlumberger arrays as for the 2-D Resistivity Imaging method
and 250 MHz antenna as for the Ground Penetrating Radar (GPR) method at all the
study locations. The objectives of this research are to detect and identify the possible
signatures that signifies the cavities by using 2-D Resistivity Imaging and GPR
methods, to correlate the geophysical parameters such as conductivity values from 2-
D Resistivity and GPR, velocities of the EM wave propagation, dielectric
permittivity, attenuation values of EM wave and Mean Absolute Percentage Error
(MAPE) values that can be obtain from 2-D Resistivity Imaging and GPR methods
and lastly, to distinguish the geophysical parameters between air filled cavity,
concrete structures and sediments filled cavity. A higher resistivity value starting
from 500-800 Ωm indicates the air-filled cavity while resistivity value starting from
5-250 Ωm indicates the in-filled cavity associated with concrete structures and
resistivity value starting from 5-60 Ωm represents the sediment filled cavity. The
calculated conductivity values for the field models starting with the air filled cavity is
0.0016 S/m and for in-filled cavities associated with concrete structure are 0.0926
S/m and 0.0772 S/m. The calculated conductivity values for all case studies starting
with the highest value 0.0148 S/m and the lowest value is 0.0053 S/m. The

xvii
attenuation value of EM wave for the in-filled cavity associated with concrete
structure is much higher with 57.0448 dB/m and 41.5438 dB/m compared with
0.9672 dB/m for the air-filled cavity. The attenuation value of EM wave of sediments
filled cavities starting with the highest attenuation value is 8.9725 dB/m and the
lowest is 2.9447 dB/m. In conclusion, the objectives in this research were
successfully achieved and 2-D Resistivity Imaging and GPR methods were able to
differentiate between the geophysical parameters for air-filled cavity, concrete
structure and sediments filled cavity.

1
CHAPTER 1
INTRODUCTION
1.0 Background
There are many differences related to geophysical studies and geotechnical
studies. Basically, both of them have one objective, to represent an accurate data
about the subsurface but in different kind of field. Geotechnical studies are usually
used by the engineers to map ground subsurface and environmental works.
Geophysical studies provide additional data for engineers to improve the work and it
is cost effective. Geophysical studies can be used to determine the subsurface
structures such as depth of bedrock, nature of overburden materials and near surface
structures such as sinkholes, cavities, voids, faults and boulders. Appropriate
geophysical method has to be based on objectives and site conditions to produce a
good result and has the ability to produce an accurate data for future use.
Basically, geophysical methods consist of some regular methods such as
microgravity, seismic, magnetic, Ground Penetrating Radar (GPR) and 2-D
Resistivity Imaging. Each of geophysical methods has their own limitation.
Regarding some of the limitation of each method, it is crucial to not only depend on
one method in order to achieve a good and accurate result. It is also depends on the
financial provided, the survey area and the most important thing is the objective of
the survey.
There are several approaches are available to gather information about
ground subsurface. The best solution is direct observation of the sediments and rocks

2
but of course this is rarely possible in terms of financially and work rates.
Commonly, when subsurface information is necessary, it acquired the physical
measurements to be applied to the ground subsurface in order to deduce the
subsurface over substantial are in a reasonable time-frame and in a cost-effective
manner (Burger et al., 2006).
Cavity or void is an empty space inside a solid body or object. The detection
of cavities and tunnels at study area using geophysical methods has gained wide
interest in the past few decades. The discovery of cavities is important since the
presence of natural voids or cavities at the subsurface particularly at limestone area
which may causes some severe problems that can be related with engineering
management (Sum et al., 1996). A variety of geophysical methods can be used to
study about the presence of caves and voids at all types of subsurface materials.
Physical contrast between a cave and the surrounding rocks can be detected using the
geophysical methods. For example, the resistivity value that indicates the void is
higher than the surrounding materials, hence 2-D Resistivity Imaging is used
successfully (Noel and Xu, 1992; Manzanilla et al., 1994). The geophysical methods
such as 2-D Resistivity Imaging method are most likely to be successful if it is used
in conjunction with other methods since the limestone will also have high resistivity
value. (El-Qady et al., 2006). Cavities in the limestone area are considered one of the
major concerns to engineers with many catastrophic events occurring associated with
the cavities in the limestone bedrock. The cavities have various sizes and thicknesses
and occur at various depths. A survey was conducted to investigate the size of cavity
based on borehole data in Ipoh area showed that they are mostly <3 m in thickness
(Tan, 1988). According to Ting, (1985) and Ting et al., (1993), the most common
cavity size is <1 m. In any case, occasional large cavities >3 m can still be

3
encountered at a particular site. Therefore, the detection and identification of the
detailed configuration of the cavity system at a particular construction site can be
considered as major efforts for site investigation. The detection and identification of
cavities can be considered as a major effort is because it can help the people to
understand more about the subsurface area.
Based on the 2-D Resistivity Imaging results, it shows that the difference in
resistivity value between an air-filled cavity and the surrounding limestone may be
the most outstanding physical feature of a cave, hence this is the main reason for the
2-D Resistivity Imaging method has been the most widely method used for cave
detection (Elawadi et al., 2001; Ushijima et al., 1989; Smith, 1986). Based on
geological engineering and environmental management prospect, Ground Penetrating
Radar (GPR) has been a very useful method for mapping shallow targets (Fisher et
al., 1992). GPR method is based on the detection of electromagnetic (EM) wave
reflections from short bursts of EM wave emitted by a portable radar transmitter
(Conyers and Goodman, 1997). The subsurface imaging by GPR will give the best
resolution for the GPR results if the subsurface area is made up of dry fine grained
materials because of low conductivity value that allows the EM wave to propagate
properly (Reynolds, 1997).
1.1 Problem statements
Most known caves that have visible entrances are because of natural erosion
causing the roof to collapse hence exposing the cave. Detection undiscovered caves
that related with karst topographic area is important in the evaluation in terms of the
environmental problems such as land subsidence and development of sinkholes.

4
Naturally formed enormous void in karst topography may lead to sudden and
catastrophic events, while as for the fine particles that slowly migrate at the
subsurface area may cause gradational ground subsidence. Any engineering and
environmental problems related with karst topography such as land subsidence and
development of large sinkholes may lead to much costly expenditure for building
any structures on top of karst environment if the engineers unable to encounter those
problems.
Various geophysical methods can be used for detecting karst voids in
subsurface. All of the geophysical methods measured physical contrast of the voids
and the surrounding materials. The incompetent to differentiate the geophysical
parameters between air filled cavity, concrete structures and in-filled cavity has lead
to this research to be conducted. Geophysical methods allow large areas to be
covered in a short period of time and represent an efficient and cost effective way in
detecting subsurface heterogeneities at the karst environment, including voids,
subsidence, and sinkholes. All such methods have shown great potential for
accurately mapping subsurface under certain conditions, but 2-D Resistivity Imaging
method is considered as one of the most promising methods for karst voids (Roth and
Nyquist, 2003). Ground Penetrating Radar (GPR) also can be considered as one of
the geophysical method that is useful to detect the cavities or voids with diameters
less than 10 m in subsurface (Collins et al., 1994; Benito et al., 1995; Harris et al.,
1995). Geophysical or geotechnical methods unable to stand alone and this may lead
to data misinterpretation.

5
1.2 Research objectives
The objectives of this research are;
i. To detect and identify the possible signatures that signifies the cavities by
using 2-D Resistivity Imaging and GPR methods.
ii. To correlate the velocity of EM wave, dielectric permittivity, EM
attenuation value, conductivity value from 2-D Resistivity Imaging and
GPR, and Mean Absolute Percentage Error (MAPE) value obtained from
both geophysical methods.
iii. To distinguish the geophysical parameters between air-filled cavity,
concrete structures and sediments filled cavity.
1.3 Scope of study
Two geophysical methods which are 2-D Resistivity Imaging and GPR were
applied at various locations throughout Malaysia for the cavity detection and
identification. The methods were used with the main purpose of to integrate both
geophysical methods and obtaining the geophysical parameters. There are two main
field models in this research. The field models can be divided into two major groups
which are air-filled cavity and in-filled cavity. The geophysical parameters obtained
by integrating 2-D Resistivity Imaging and GPR are, velocity of the EM wave,
dielectric permittivity, attenuation of the EM wave, conductivity value of the ground
subsurface, and Mean Absolute Percentage Error (MAPE) value. The study was
conducted at Pulau Pinang as for air filled and in-filled cavity field models while at
Perlis, Kedah and Kelantan as for case studies related to those types of cavities.

6
1.4 Motivation and research novelty
Based on previous studies, the cavities can be classified into two major types
air-filled and in-filled cavity as referred to 2-D Resistivity Imaging results. The GPR
results only provide hyperbolic curves from radargram that indicate the cavities
either air-filled or in-filled cavity. This research was conducted in order to scrutinize
the difference between geophysical parameters of the air-filled and in-filled cavity
which represent by the conductivity value from 2-D Resistivity Imaging and GPR
methods. The difference between the in-filled cavity and concrete structures also can
be distinguished precisely after obtaining the geophysical parameter which is the
attenuation value of EM wave related with all the characterization regarding types of
cavities.
1.5 Layout of thesis
The contents of this dissertation are structured as follows;
Chapter 1, the background of this research is introduced. Problem statements
and research objectives to be achieved related with this research are highlighted.
Furthermore, the scope of study, motivation and research novelty as well as the
layout of thesis are presented in this chapter.
Chapter 2 includes fundamental theory about the 2-D Resistivity Imaging and
GPR methods. The previous studies using the 2-D Resistivity Imaging and GPR
methods applied in the engineering proposes and problems related in detecting karst
features such as sinkholes, pinnacles and cavities in limestone formation are also

7
being discussed in this chapter. The research gaps for this research as compared with
other previous studies also being discussed in this chapter.
Chapter 3 includes about the research flowchart. This research applied 2-D
Resistivity Imaging and GPR methods at various study areas located throughout
Malaysia such as Pulau Pinang, Perlis, Kedah and Kelantan were described. The
geological maps for each study area also being explained in this chapter. This chapter
also discussed about the research involves the calculation of geophysical parameters
indicating the air-filled or in-filled cavity such as EM wave velocity, dielectric
permittivity, attenuation value of EM wave, conductivity value from 2-D Resistivity
and GPR, and Mean Absolute Percentage Error (MAPE) value.
In Chapter 4, the final data is being shown. The detail information or data
involving the signatures of the cavities from 2-D Resistivity Imaging and GPR
methods, the geophysical parameters that distinguished between air-filled cavity,
concrete structures and sediment filled cavity being discussed and the possible depth
of the cavities at study area well explained.
Finally, Chapter 5 concluded that the 2-D Resistivity Imaging and GPR study
in detecting cavities and geophysical parameters associated with air-filled cavity,
concrete structures and sediments filled cavity were highlighted. Finally, the
recommendations for future research involving 2-D Resistivity Imaging and GPR
methods or using other methods are proposed.
8
CHAPTER 2
LITERATURE REVIEW
2.0 Introduction
Karst topography basically is an area that is majorly made up of limestone
and other carbonate rocks such as dolomite, gypsum and marble. Karst topography or
features such as pinnacles, cavities, and underground tunnels presents some of the
most challenging conditions for designing or constructing new structures or rebuilds
old buildings on top of the karst areas. This is because of highly variable conditions
that often related to karst areas, which may increases in site development costs that
can occur both during and after construction without proper understanding of the
subsurface condition that is largely covered by karst. With proper selected and
applied geophysical method, it significantly provide better prediction of development
costs and better selection of appropriate foundations in the planning stage rather than
during and after construction processes.
Recently, cavities detection using geophysical surveys has become common
in field of exploration geophysics. Geophysical methods such as the 2-D Resistivity
Imaging, seismic reflection, Ground Penetrating Radar (GPR), gravity, or magnetic
have their own purposes that is different from other methods in terms of their
parameters of the subsurface phenomena. Some of the methods have been used for
shallow subsurface investigation in bedrock mapping, detecting abandoned coal
mine, determining the bedrock or faults and detection of karst topography such as
sinkholes, cavities, and pinnacles. All the methods depend on presence of contrast in

9
the subsurface and also the environment factor such as for magnetic survey that may
encounter some difficulties when there is metal object nearby (Pullan and Hunter,
1990).
2-D Resistivity Imaging method is based on injecting electrical current into
the subsurface using electrodes, known as current electrodes (C1 and C2) and then
measuring potential between electrodes known as potential electrodes (P1 and P2).
The measured potential allows for the determination of the resistivity values in which
the value of apparent resistivity can be calculated by multiplying the resistance by an
appropriate geometric factor. The geometric factor depends on the type of acquisition
array used during the survey conducted (Sheriff, 1999). The apparent resistivity is
then being inverted to obtain true subsurface resistivity and provide information
about thickness and depth of individual resistivity layers within the subsurface area.
The step to produce inversion model of the 2-D Resistivity Imaging results is
consider as an essential step in all modern 2-D Resistivity Imaging surveys for the
subsurface analysis. Fundamentally, a mathematical procedure was used to calculate
apparent resistivity value of the subsurface by which physical parameter distribution
is estimated based on field measurements (Telford et al., 1990; Reynolds, 2000; Loke
and Barker, 1995).
The GPR data can be obtained by distributing EM waves from transmitting
antenna into the subsurface and later on being reflected diffracted by features
coincide to the changes in the electrical properties of the earth materials. EM waves
that were reflected and diffracted toward the surface receive by a receiving antenna.
The time travel of the EM waves are measured and converted into depth penetration
profile between the targets and the antenna. By analyzing some of characteristic
properties of the returned EM waves, all the details such as dimensions of the target

10
at the subsurface and possible depth about the target can be obtained (Daniels et al.,
1988; Davis and Annan, 1989).
2.1 2-D Resistivity Imaging theory
Given these measurement it is possible to solve numerically for a resistivity
distribution that results in a set of calculated resistivity measurements that best fits
with the measured response (El-Qady et al., 2006). The survey data is processed to
produce the inversion model sections of thickness and individual resistivity values of
each layer of the subsurface. The common electrode arrays that being used in
resistivity survey are Pole-Pole, Pole-Dipole, Wenner, Wenner-Schlumberger and
Schlumberger array. The major variation of 2-D Resistivity Imaging results depends
on an array used during the survey, the electrode spacing and the condition of the
survey area whether the ground area is wet or dry.
The method consists of placing electrodes along the 2-D Resistivity Imaging
survey line using certain electrode spacing that depends on the purposes of the study
as this will affect depth and resolution of the data required. A higher resolution is
obtained if the electrodes are placed closer, while for widely spaced electrodes, a
greater depth can be obtained or investigated with lower resolution (Sasaki, 1992).
The electrode arrangement was connected to a measuring device with specific control
system was used to select the group of electrodes that should function simultaneously
in any particular electronic arrangement. For each arrangement, the resistivity value
of the subsurface are measured and attributed to a specific geometric point of the
subsurface.

11
Figure 2.1: Four electrodes array for the basic 2-D Resistivity Imaging measurement.
2-D Resistivity Imaging surveys have been used for many decades in
geotechnical investigations. Figure 2.2 shows the arrangement of 2-D Resistivity
Imaging survey in order to produce resistivity inversion model. More recently, it
been used for environmental surveys in detecting karstic features such as pinnacles,
sinkholes and cavities. The purpose of 2-D Resistivity Imaging surveys are to
determine the subsurface resistivity distribution by making measurements on the
ground surface. The measurements estimate true resistivity of subsurface can be
estimated. The ground resistivity value is related to various geological parameters
such as mineral and fluid content, porosity and degree of water saturation (Loke,
1999).
The resistivity measurements shown in Figure 2.1 are normally made by
injecting current (I) into the ground and the value of potential difference (V) is
calculated (Loke, 1999) and electrical resistance is measured according to Ohm’s law
(Equation 2.1):
I
VR (2.1)
C1 P1 P2 C2

12
Where;
R : Resistance of the conductor.
The SI unit for resistance is volts per ampere or Ohm (Ω). The resistivity can
be calculated by using Equation 2.2;
A
LρR (2.2)
Where;
: Resistivity of the conductor material (Ωm),
L : Length of the conductor (m)
A : Cross-sectional area (m2)
The calculated resistivity value is not a true resistivity of the subsurface, but
an apparent value which is the resistivity of a homogeneous ground which will give
the same resistance value for the same electrode arrangement. The relationship
between apparent and true resistivity is a complex relationship. To determine the true
subsurface resistivity, an inversion of the measured apparent resistivity values using
a computer program must be carried out (Loke, 1999; 2004).
Figure 2.2: The arrangement for 2-D Resistivity Imaging survey and the sequence of
measurements used to build up the resistivity section (modified from Loke, 1999).

13
The choice of the best array in a field survey depends on type of structure to
be mapped, sensitivity of the resistivity meter and background noise level. In
practice, the arrays that are most commonly used for 2-D imaging surveys are Pole-
Dipole, Dipole-Dipole, Wenner-Schlumberger, Wenner Alpha, and Pole-Pole.
Among the characteristics of an array that should be considered are the sensitivity of
the array to vertical and horizontal changes in the subsurface resistivity, depth of
investigation, horizontal data coverage and signal strength (ABEM, 2006). Based on
this research in identifying and detecting karst features, most of the study areas used
Pole-Dipole array in order to get deeper depth of penetration. The other study areas
such as at Perlis, Kedah, and Kelantan, the arrays used were Pole-Dipole and
Wenner-Schlumberger. Figure 2.3 shows the common array used in 2-D Resistivity
Imaging survey with their geometric factor “k”.
Figure 2.3: Resistivity common array and their geometric factors (modified from
Loke and Barker, 1996).

14
2.2 Ground Penetrating Radar (GPR) theory
GPR is a geophysical method used to investigate ground subsurface with high
resolution imaging. The depth range of GPR is limited by the electrical
conductivity of the ground and frequency of the antenna used. The Ground
Penetrating Radar (GPR) use the reflections of short bursts of electromagnetic energy
with a range of frequencies being transmitted into the ground and register the
reflected pulses as functions of time and position of the antenna pair along a survey
line (Figure 2.4).
Figure 2.4: Basic principle of the GPR (modified from Jol, 2009).
Historically, the development of GPR derives from the use of radio echo
sounding to determine any certain targets at subsurface (Milsom, 2003). Dry soils
can be consider as a good medium for the GPR application, since higher radio-
frequencies can be used for a given depth of investigation, which implies a better
resolution of the buried structures (María et al., 2011). It was soon realized that some
penetration was being achieved into the deeper depth of investigation, although
unlikely to ever amount to more than a few tens of meters, could be increased by
εa=1
ε1
ε2 < ε1

15
processing techniques virtually identical to those applied to seismic reflection data.
GPR is now widely used to study about the shallow subsurface at landfill,
construction, archaeological sites and many other survey sites.
GPR signals are recorded by transmitting and receiving the EM waves which
propagates at the subsurface area, with high frequency, typically between 10 and
1000 MHz, as a periodic disturbance. EM waves have both electric and magnetic
characteristics, which are perpendicular to each other. GPR can map the variations of
the electrical and magnetic characteristics of the subsurface geological materials
since all those materials have significant differences for the electrical and magnetic
value. The depth penetration and resolution of the results obtained really depend on
the electromagnetic properties of the geological materials located in the subsurface
area and through which the EM waves propagate and based on the type of antenna
that is used for the survey purposes. Therefore, EM wave propagation decreases as
the conductivity of the subsurface area or the frequency of the emitted signal
increases. For a single GPR survey profile, higher frequency antennas will produce
higher resolution with shallower depth of penetration and vice versa if the lower
frequency being applied (Davis and Annan, 1989).
Table 2.1 shows the resistivity values, dielectric values and velocity of
material through different medium. The given velocity values were used to calculate
the depth of the target.

16
Table 2.1: The resistivity values, dielectric and velocity of material through different
medium (Davis and Annan, 1989; Reynolds, 1997).
Material Resistivity values (Ωm) Dielectric permittivity,
(εr) Velocity (mm/ns)
Limestone 50 - 103 7 - 9 100 - 113
Sand (dry) 30 - 225 3 - 6 120 - 170
Clay soil 1 × 10² 3 173
Clay (wet) 30 - 100 8 - 15 86 - 110
Granite 3 × 10² - 106 5 - 8 106 - 120
Concrete 80 - 500 6 - 8 55 - 112
2.3 Previous study
Previously many researchers have conducted various researches about the
karst features such as cavities, pinnacles, and sinkholes at subsurface area. In karst
topography, detection of cavities is considered as top priority. Al-Zoubi et al. (2012)
stated that the identification of cavities, fractures and collapse zones can be
considered as one of the most difficult subsurface investigations. The Dead Sea
sinkholes at surface are caused by development of dissolution cavities forming in salt
layers located at a depth of 40-50 m from the top surface. Development of karstic
cavities causes the variations in properties and structure of both salt and its overlain
sediments; density, porosity, electrical conductivity, seismic velocity and many
more. The geophysical method used for sinkholes assessment and identification is
seismic refraction method which used for mapping of salt layer, 2-D Resistivity
Imaging was used in order to facilitate detection of high resistivity zones associated
with air-filled cavities and decompaction of the subsurface. Ground penetrating radar
(GPR) is used to allow detection of subsurface faults, buried voids and sinkholes.
Electromagnetic radiation (EMR) was used to measures the electromagnetic radiation
(EMR) emitted from cracks which dimensions in micro-scales that located within the
rocks and estimates the active faults and cracks along the surveyed profiles.
17
Microgravity and Magnitometry methods are used for search of zones with the mass
deficit and zones of magnetic anomalies as those zones are considered as zones of
karst. Nano-Seismic was developed to detect and identify the extremely low-energy
signals generated by soil falling into cavities.
The other research conducted by Kwon et al. (2000) stated that there are
several geophysical methods were applied over the Manjang cave area in Cheju
Island to compare the effectiveness of each method for exploration of underground
cavities. The geophysical methods used are gravity, magnetic, 2-D Resistivity
Imaging and Ground Penetrating Radar (GPR) survey, of which instruments are
portable and operations are relatively economical and there are seven survey lines in
total. In the case of magnetic method, two-dimensional grid-type surveys were
carried out to cover the survey area. The geophysical survey results reveal the
characteristic responses of each method relatively well. Among the applied methods,
the electric resistivity methods appeared to be one of the most effective method in
detecting the Manjang Cave and surrounding miscellaneous cavities. The gravity and
magnetic data are contaminated easily by various noises and do not show the
definitive responses enough to locate and delineate the Manjang cave. But those two
geophysical methods provide useful information in verifying with the Dipole-Dipole
2-D Resistivity Imaging survey results. The grid-type 2-D magnetic survey data
show the trend of cave development well, and it may be used as a reconnaissance
regional survey for determining survey lines for further detailed explorations. The
GPR data show very sensitive response to the various shallow volcanic structures
such as thin spaces between lava flows and small cavities, but unable to identify the
response of the main cave. Although each geophysical method provides its own

18
useful information, the integrated interpretation of multiple survey data is most
effective for investigation of the underground caves.
Choi et al. (2013) discussed about detection of cavities using 2-D Resistivity
Imaging and optical borehole imaging methods to identify underground cavities and
determine ground subsidence rate at the study area affected by land subsidence due
to abandoned underground mines. At the first study area, the anomalous zones of low
resistivity ranging from 100-150 Ωm were observed and confirmed as an abandoned
underground mine by subsequent borehole drilling and optical borehole imaging.
Although the 2-D Resistivity Imaging survey was unavailable due to the paved
surface of the second study area, the method able to locate another abandoned
underground mine with the collapsed mine shaft based on the distribution of the ore
veins and later on being confirmed by borehole drilling method. In addition, the
measured vertical displacements of underground features indicating underground
subsidence by conducting optical borehole imaging 6 times over a period of 43 days
at the second study area. The displacement magnitude at the deep segment caused by
subsidence appeared to be 3 times larger than those at the shallow segment.
Similarly, the displacement duration at the deep segment was 4 times longer than
those at the shallow segment. Therefore, the combination of 2-D Resistivity Imaging
and optical borehole imaging methods can be effectively applicable to detect and
monitor ground subsidence caused by underground cavities.
Farooq et al. (2012) discussed about determining the extent of the karst voids
using 2-D Resistivity Imaging technique to investigate the subsurface geology
beneath the proposed road network construction. This investigation was aimed at
imaging karstic voids and detecting the prone areas that could be affected by ground
subsidence through the collapse of cavities beneath a road segment overlying such
19
features. The survey data set consisted of eleven 2-D Resistivity Imaging profiles
acquired using Dipole-Dipole array with the 2-D Resistivity Imaging profiles (100 m
and 300 m length) with the electrode spacing of 5 m. The inverted 2-D Resistivity
Imaging profiles provide a clear view of weathered soils, the distribution of weak
areas or karst voids and bedrock. Several low resistivity areas were identified and
later on subsequent drilling of such anomalous areas led to the discovery of several
weak zones or clay-filled underground cavities beneath the road network
construction area. This proves that the drilling results had excellent correlation with
the inverted 2-D Resistivity Imaging profiles thus the 2-D Resistivity Imaging is an
excellent technique in delineating the karstic voids even on a complex geological
structures. An action plan regarding the discovery of the weak zones will involved
the consolidation grouting work has been suggested prior to road construction.
Carrière et al. (2013) highlighted the efficiency of geophysical techniques
used to study about the structure of karst in which can be classified as unsaturated
zone where soil cover is thin or absent in typical Mediterranean environment. The
geophysical technique applied to the research area is Ground Penetrating Radar
(GPR) and 2-D Resistivity Imaging. The GPR results will provide a near surface
high resolution imaging and thus the relevant geological information such as
stratifications and fractures can be obtained from the results. The 2-D Resistivity
Imaging inversion profiles will show strong lateral and vertical variations for the
subsurface area. These variations can explain about the general geological structuring
and feature orientation below the surface. 2-D Resistivity Imaging profiles are able to
displays up to 40 m below the surface but it will have a low resolution integrative
technique. Basically, limestone study area will have about more than 2000 Ωm of
resistivity value. However, the 2-D Resistivity Imaging profiles reveal some several

20
zones of moderate resistivity value around 900 Ωm at depth more than 5-7 m. In
these zones a stratification change corresponding to slanted bedding it can be clearly
identified by GPR results as both of those two methods being correlated. The
combination of both GPR and 2-D Resistivity Imaging data can allow a well-
established geological interpretation to be made. The presence of perennial water
flow point at 35 m below the surface can be explained by these moderate resistivity
zones with slanted beddings.
Kang and Hsu (2013) explained about the study to detect and locate the
cavities in a coastal dyke using the Ground Penetrating Radar method (GPR). The
hidden cavities in a coastal dyke are the key indications of possible soil subsidence
of the subsurface area or seepage piping within the soil of the dyke. A series of
numerical simulations and field tests were conducted at the research area. The results
show that the size of cavities influenced by the average area difference curve that can
be obtained from GPR signals. By using the average area difference curve obtained,
shallow cavities in a coastal dyke can be identified effectively.
Roth et al. (2002) discussed about the geotechnical investigations in
northeastern Pennsylvania that have various structural failures regarding sinkholes
The geotechnical technique used is primarily relied upon intrusive probe tests, either
through borings or air-track drillings. The used of non-intrusive Ground Penetrating
Radar (GPR) and electromagnetic methods are limited due to silty clay soils
overlying the carbonate bedrock. However, multi 2-D Resistivity Imaging testing can
be considered as suitable method for locating subsurface features associated with
sinkhole formation in these areas. The bedrock at the site is located between 1 m and
approximately 10 m below the surface in which the subsurface area primarily
dominated by silty clay after 70 resistivity survey lines were conducted at the site.