time:3 hoursmock 2016 - prelim websitemaths.stithian.com/new caps 2016 prelim papers/bishops... ·...
TRANSCRIPT

Candidate’s Number: Maths Set Teacher’s Initials:
BISHOPSGRADE 12
MATHEMATICSPAPER 2
Time: 3 hours Mock 2016Total: 150 marks SMcP/GGINSTRUCTIONS AND INFORMATION:
Read the following instructions carefully before answering the questions.1. This paper consists of 10 questions.2. Answer ALL the questions in the Answer Booklet provided, writing
neatly and legibly.3. Clearly show ALL calculations, diagrams, graphs et cetera that you have used
todetermine your answers.
4. Diagrams are NOT necessarily drawn to scale.5. Answers only will NOT necessarily be awarded full marks.6. You may use an approved scientific calculator (non-programmable and
non-graphical), unless stated otherwise.7. Where appropriate, round off answers to TWO decimal places, unless
stated otherwise.8. An INFORMATION SHEET is printed on the last page.
HAND THIS QUESTION PAPER IN WITH YOUR ANSWER BOOKLET.Fill in the information at the top of the page.

M O C K 2 0 1 6 | G r a d e 1 2 | M a t h s P a p e r 2 | P a g e | 2QUESTION 1
The histogram above shows the ages of staff in a school.
1.1 Use the histogram to complete the cumulative frequency table below. (2)
Age Frequency Cumulative Frequency
25 < A ≤30 2 230 < A ≤35 8 1035 < A ≤4040 < A ≤4545 < A ≤50
50 < A ≤5555 < A ≤6060 < A ≤65 6

M O C K 2 0 1 6 | G r a d e 1 2 | M a t h s P a p e r 2 | P a g e | 3
1.2 Draw a cumulative frequency graph on the set of axes provided to represent
the data in the table. (3)
1.3 Use your cumulative frequency graph to find an estimate for the median age. (2)
1.4 Use your cumulative frequency graph to find an estimate for the percentage of teachers older than 50 years. (2)
1.5 Use your cumulative frequency graph to draw a box and whisker diagram
for the given data. Use the number line provided. (3)
1.6 Comment on the skewness of the data. (1)
[13]

M O C K 2 0 1 6 | G r a d e 1 2 | M a t h s P a p e r 2 | P a g e | 4
QUESTION 2
In the table below, the scores in beam and floor events of 13 gymnasts who participated at the Rio 2016 Games are given. A typical score under today's rules ranges from13 to 16 points.
A scatterplot diagram is also given to show the correlation between the two events.
Beamx 13.666 13.066 13.2 13.6 14.366 13.7 14.866 13.2 13.866 13.9 13.8 13.8 14.666
Floory 14.733 14.133 13.233 13.766 13.9 14.3 15.433 13.833 13.933 14.133 14.233 14.075 14.9

M O C K 2 0 1 6 | G r a d e 1 2 | M a t h s P a p e r 2 | P a g e | 5
2.1 Use your calculator to determine the equation of the least squares regressionline y = A + B x. Give your answers correct to 4 decimal places. (3)
2.2 Calculate the value of r, the correlation coefficient for the data, correct to
4 decimal places. (2)
2.3 Discuss the correlation between the two sets of data. (2)
2.4 Use the least squares regression line found in 2.1 to predict what a gymnast is likely to score for the floor event if she were to obtain a score of 14,5 for the
beam event. (2)
[9]

M O C K 2 0 1 6 | G r a d e 1 2 | M a t h s P a p e r 2 | P a g e | 6
QUESTION 3
In the diagram below, A(−3; 4) , B(4; 8), C(5; 0) and D are the vertices of
parallelogram ABCD. BC is extended to E to meet DE which is parallel to the x-axis.
3.1 Determine the equation of line BE. (4) 3.2 Determine the coordinates of D. (2)
3.3 Determine the coordinates of P, where P is the point of intersection of the diagonals of ABCD. (2)
3.4 Prove that ABCD is a rhombus. (3)
3.5 Calculate the size of . (4)
3.6 Calculate the length of DE. (3)
3.7 Calculate the area of ∆ABC. (4)
[22]

M O C K 2 0 1 6 | G r a d e 1 2 | M a t h s P a p e r 2 | P a g e | 7
QUESTION 4
The circle with centre P has the equation . QS is a tangent to the circle at Q and SR is a tangent to the circle at R(6; 9)S is the point of intersection of the two tangents.
Answers to this question should be left in surd form where necessary.
4.1 Write down the coordinates of P and the length of PQ. (3)
4.2 If the equation of the tangent to the circle at Q is y = 2x, determine thecoordinates of Q. (5)
4.3 Show that the tangent at R has the equation . (4)
4.4 Determine the length of SQ. (3)
[15]

M O C K 2 0 1 6 | G r a d e 1 2 | M a t h s P a p e r 2 | P a g e | 8
QUESTION 5
NO CALCULATOR MAY BE USED IN THIS QUESTION
5.1 If determine:
5.1.1 (2)
5.1.2 (2)
5.1.3 (4)
5.2 Given:
5.2.1 Prove the identity. (5)
5.2.2 Determine all the values of x for which the identity is undefined. (3)
5.3 Simplify (4)
[20]

M O C K 2 0 1 6 | G r a d e 1 2 | M a t h s P a p e r 2 | P a g e | 9
QUESTION 6
The graph of is drawn below
6.1 Write down the period of f. (1)
6.2 Write down the range of . (2)
6.3 Draw the graph of on the same set of axes as f (x).Show all turning points and intercepts with the axes. (3)
6.4 Solve for x if f (x) = g(x) and . (6)
6.5 Use the graphs to determine the value(s) of x for which:
6.5.1 in the interval (1)
6.5.2 in the interval (2)
[15]

M O C K 2 0 1 6 | G r a d e 1 2 | M a t h s P a p e r 2 | P a g e | 10
QUESTION 7 7.1
O is the centre of the circle. AB = 18 cm, AC = 14 cm and BC = 8 cm.
7.1.1 Calculate the size of . (3)7.1.2 Calculate the radius of the circle correct to one decimal
place.(4)
7.2 In the diagram, and .

M O C K 2 0 1 6 | G r a d e 1 2 | M a t h s P a p e r 2 | P a g e | 117.2.1
Find in term of α and β. (1)
7.2.2 Prove that . (6)
[14]

M O C K 2 0 1 6 | G r a d e 1 2 | M a t h s P a p e r 2 | P a g e | 12
QUESTION 8
8.1 O is the centre of the circle, and ST is a tangent to the circle at T.
Use the diagram to prove the theorem which states that . (5)

M O C K 2 0 1 6 | G r a d e 1 2 | M a t h s P a p e r 2 | P a g e | 13
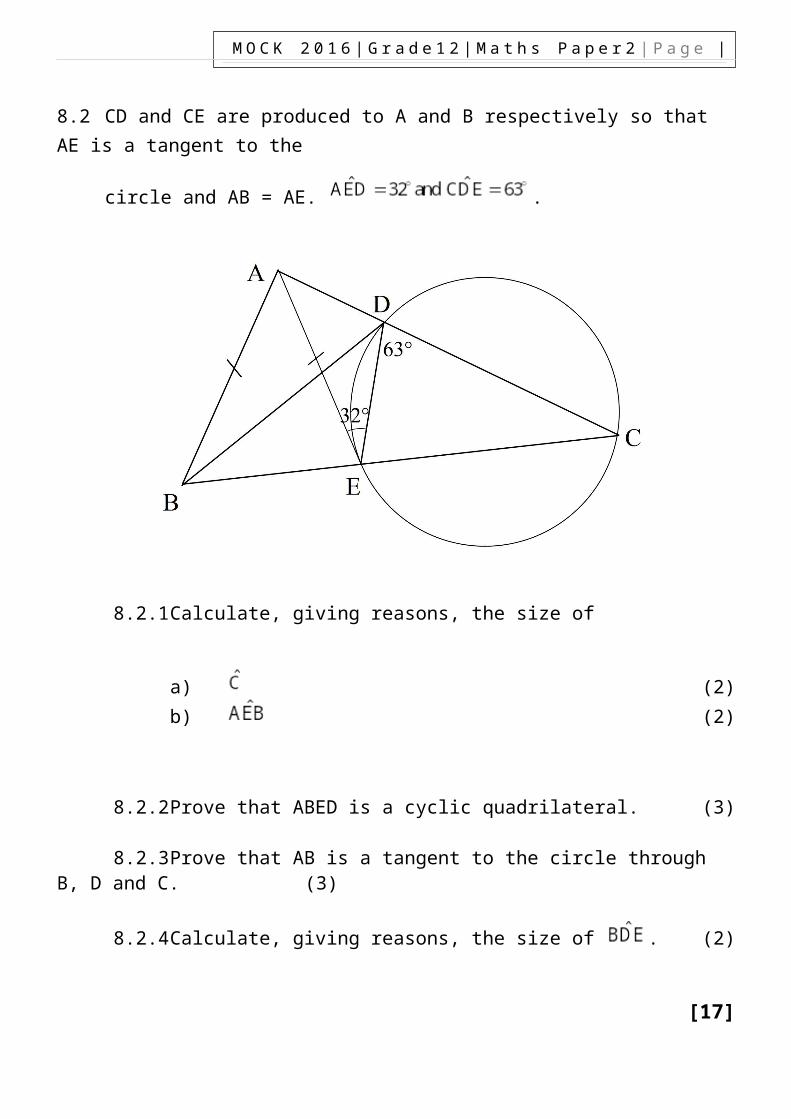
8.2 CD and CE are produced to A and B respectively so that AE is a tangent to the
circle and AB = AE. .
8.2.1 Calculate, giving reasons, the size of
a) (2)b) (2)
8.2.2 Prove that ABED is a cyclic quadrilateral. (3)
8.2.3 Prove that AB is a tangent to the circle through B, D and C. (3)
8.2.4 Calculate, giving reasons, the size of . (2)
[17]

M O C K 2 0 1 6 | G r a d e 1 2 | M a t h s P a p e r 2 | P a g e | 14
QUESTION 9
In D is the midpoint of AB, CD || EF and .
9.1 Determine, with reasons, the value of . (4)
9.2 Find the value of (no reasons required). (3)
[7]
M O C K 2 0 1 6 | G r a d e 1 2 | M a t h s P a p e r 2 | P a g e | 15
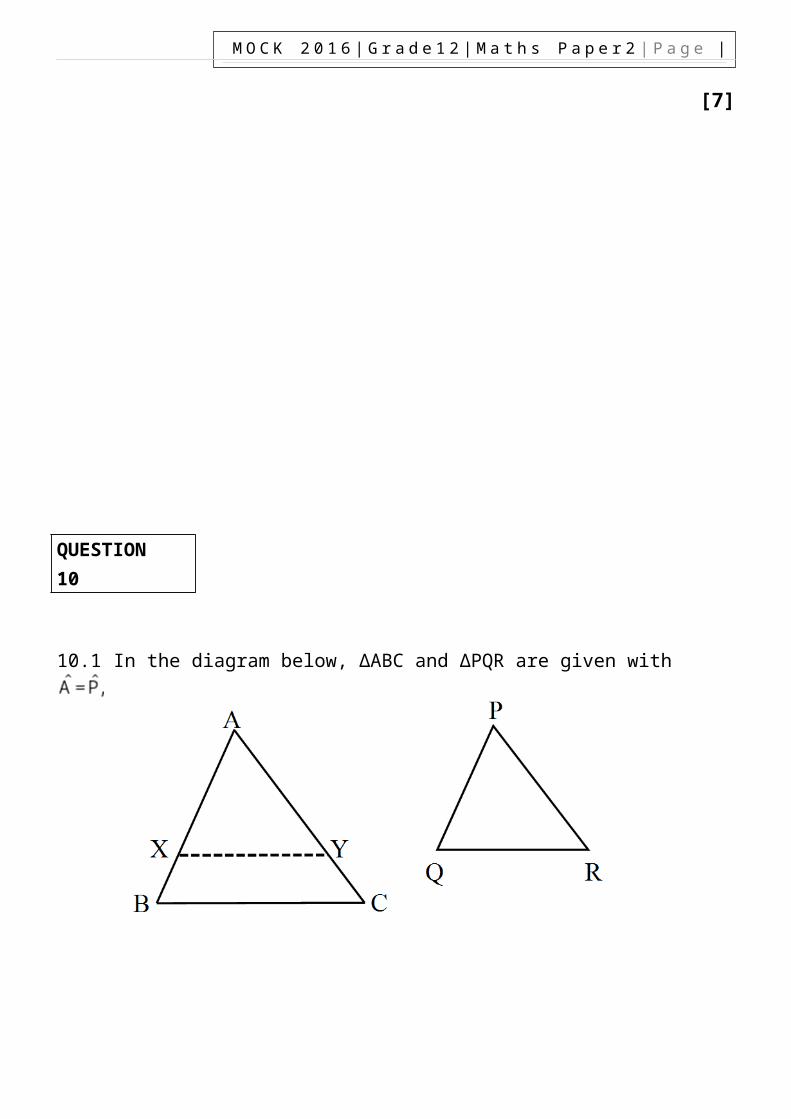
QUESTION 10
10.1 In the diagram below, ∆ABC and ∆PQR are given with .
Line XY is drawn so that AX = PQ and AY = PR. Use the diagram to prove
10.1.1 XY || BC (4)
10.1.2 (2)

M O C K 2 0 1 6 | G r a d e 1 2 | M a t h s P a p e r 2 | P a g e | 16
10.2
In the diagram the circle with centre O has a radius twice that of the circle with centre T.
SRQ is a tangent to both circles. POTQ is a straight line.
10.2.1 Prove that ∆ PST ||| ∆ SRT. (4)
10.2.2 If the radius of the smaller circle is r, find the length of ST in terms of r. (4)
10.2.3 Determine the size of . (3)
10.2.4 Hence determine the length of SQ in terms of r. (1)
[18]
M O C K 2 0 1 6 | G r a d e 1 2 | M a t h s P a p e r 2 | P a g e | 17
INFORMATION SHEET
; ;
M
In ABC:
P(A or B) = P(A) + P(B) – P(A and B)