thethebucbuckk stays herestays here
TRANSCRIPT

203 North LaSalle Street, Suite 2600 | Chicago, Illinois 60601-1231 | T 312.641.4464 | F 312 641 7185 | www.ctpf.org | [email protected]
P E N S I O N S M A T T E REducation and Advocacy Initiative
Chicago Teachers’ Pension Fund
2016
Understanding the economic impact of CTPF benefit payments on the State of
Illinois and the City of Chicago
$ $ $ $ $
TheTheSTAYS HERESTAYS HERE
BUCKBUCK

2
EXECUTIVE SUMMARY
Chicago Teachers’ Pension Fund (CTPF) educators make an immeasurable impact on children: educating, nurturing, and helping them grow into productive citizens and future leaders. An educator’s impact extends far beyond the classroom – active and retired educators are also consumers, taxpayers, and voters – who live and work primarily in Chicago and surrounding communities.
This report examines the impact that CTPF educators have outside the classroom, and the economic benefit pensions have on Chicago and the State of Illinois.
The first part of this report examines the number of CTPF members and their benefit payments by legislative district. Information is shown for legislators in the State of Illinois along with a breakout of legislators who have constituents in the City of Chicago. The second part of the report details how CTPF benefit payments impact the economy of the State of Illinois and the City of Chicago.
Pension payments, which are not tied to market returns, enable annuitants to spend – even in times of recession, providing an important stimulus for local economies.
Section two also examines the “ripple effect” pensions create on the local economy. By applying multipliers from the U.S. Department of Commerce Bureau of Economic Analysis, we can begin to understand the important role that CTPF pension dollars play in providing jobs and economic stimuli.
Data shows that about 85% of CTPF annuitants live in the State of Illinois, and about 50% of those annuitants live in the City of Chicago.
CTPF benefit payments contribute:n�� $1.2 billion in direct payments to annuitants in the State of Illinois n�� $1.7 billion in total economic impact in the State of Illinoisn�� $606 million in payments to annuitants in the City of Chicagon�� $885 million in total economic impact on the City of Chicago
Pension benefit payments and their ripple effect help support jobs including:n�� 12,949 jobs in the State of Illinoisn�� 6,613 jobs in the City of Chicago alone
We call upon the legislators of the State of Illinois to examine the facts about pensions and to understand that CTPF annuitants value their benefits – but more importantly – spend their benefits at home in Illinois.
Terms:Active Member: individual who are currently paying into CTPF. Inactive Member: individual who have contributions on deposit with CTPF but are not currently paying into the system. Annuitant: member who receive a retirement, survivor, or disability benefit from CTPF. Unknown Legislator: Illinois members for whom the legislative district was undetermined. Sources: Bureau of Economic Analysis, United States Department of Commerce. CTPF data on file as of January 1, 2016.
“
”
CTPF Pensions help support 12,949 jobs in the State of Illinois including 6,613 in the City of Chicago.
CTPF Board of TrusteesJay C. Rehak President
Lois W. Ashford Vice President
Bernice Eshoo Financial Secretary
Robert F. Bures Recording Secretary
Jeffery Blackwell
Mark F. Furlong
Tina Padilla
Walter E. Pilditch
Mary Sharon Reilly
Jerry Travlos
Gail D. Ward
Raymond Wohl
Charles A. BurbridgeExecutive Director

3
District Illinois State Senator
Active and Inactive
Members AnnuitantsTotal
Members
Total Annual Payments to Annuitants
Total Economic Impact of
Benefit Payments
Jobs Supported by Benefit Payments
1 Antonio Muñoz (D) 1,681 183 1,864 $9,313,161 $13,610,254 102
2 Omar Aquino (D) 2,448 247 2,695 $11,843,605 $17,308,244 129
3 Mattie Hunter (D) 1,731 672 2,403 $36,026,313 $52,648,854 393
4 Kimberly A. Lightford (D) 945 691 1,636 $36,689,626 $53,618,219 401
5 Patricia Van Pelt (D) 2,070 307 2,377 $14,632,636 $21,384,134 160
6 John J. Cullerton (D) 3,777 734 4,511 $38,553,421 $56,341,970 421
7 Heather A. Steans (D) 3,018 761 3,779 $36,150,448 $52,830,265 395
8 Ira I. Silverstein (D) 2,111 1,405 3,516 $71,730,551 $104,827,027 783
9 Daniel Biss (D) 864 1,091 1,955 $53,175,295 $77,710,376 581
10 John G. Mulroe (D) 2,569 805 3,374 $39,660,014 $57,959,144 433
11 Martin A. Sandoval (D) 1,467 237 1,704 $11,659,882 $17,039,752 127
12 Steven M. Landek (D) 468 174 642 $8,513,981 $12,442,332 93
13 Kwame Raoul (D) 2,812 1,822 4,634 $104,744,279 $153,073,289 1,144
14 Emil Jones, III (D) 2,044 1,651 3,695 $88,326,151 $129,079,837 964
15 Napoleon Harris, III (D) 737 933 1,670 $52,490,440 $76,709,529 573
16 Jacqueline Y. Collins (D) 1,622 850 2,472 $42,906,864 $62,704,090 469
17 Donne E. Trotter (D) 2,001 1,993 3,994 $113,086,425 $165,264,502 1,235
18 Bill Cunningham (D) 2,811 1,787 4,598 $96,101,837 $140,443,225 1,049
19 Michael E. Hastings (D) 708 1,077 1,785 $60,781,466 $88,826,035 664
20 Iris Y. Martinez (D) 2,696 334 3,030 $16,186,091 $23,654,353 177
21 Michael Connelly (R) 260 141 401 $5,479,349 $8,007,521 60
22 Michael Noland (D) 84 70 154 $3,163,307 $4,622,857 35
23 Thomas Cullerton (D) 202 181 383 $8,816,484 $12,884,410 96
24 Chris Nybo (R) 412 363 775 $16,605,990 $24,267,994 181
25 Jim Oberweis (R) 125 79 204 $2,829,600 $4,135,177 31
26 Dan McConchie (R) 173 195 368 $7,596,488 $11,101,508 83
27 Matt Murphy (R) 392 367 759 $15,916,560 $23,260,460 174
28 Laura M. Murphy (D) 368 380 748 $18,744,799 $27,393,649 205
29 Julie A. Morrison (D) 422 579 1,001 $24,823,801 $36,277,502 271
PART 1: CTPF MEMBERS AND ANNUITANTS BY ILLINOIS SENATE DISTRICT
P E N S I O N S M A T T E R

4
District Illinois State Senator
Active and Inactive
Members AnnuitantsTotal
Members
Total Annual Payments to Annuitants
Total Economic Impact of
Benefit Payments
Jobs Supported by Benefit Payments
30 Terry Link (D) 165 213 378 $8,973,557 $13,113,956 98
31 Melinda Bush (D) 102 95 197 $4,213,116 $6,157,048 46
32 Pamela J. Althoff (R) 82 81 163 $3,602,724 $5,265,021 39
33 Karen McConnaughay (R) 138 168 306 $7,837,143 $11,453,200 86
34 Steve Stadelman (D) 26 29 55 $942,128 $1,376,826 10
35 Dave Syverson (R) 38 36 74 $1,024,813 $1,497,662 11
36 Neil Anderson (R) 15 9 24 $235,317 $343,892 3
37 Chuck Weaver (R) 16 9 25 $222,117 $324,602 2
38 Sue Rezin (R) 46 40 86 $1,522,750 $2,225,347 17
39 Don Harmon (D) 820 506 1,326 $26,109,947 $38,157,076 285
40 Toi W. Hutchinson (D) 289 487 776 $26,971,998 $39,416,877 295
41 Christine Radogno (R) 431 507 938 $25,816,461 $37,728,176 282
42 Linda Holmes (D) 85 55 140 $2,453,051 $3,584,889 27
43 Pat McGuire (D) 145 102 247 $5,073,940 $7,415,056 55
44 William E. Brady (R) 16 12 28 $252,670 $369,253 3
45 Tim Bivins (R) 23 42 65 $1,548,686 $2,263,250 17
46 David Koehler (D) 13 8 21 $121,295 $177,261 1
47 John M. Sullivan (D) 9 8 17 $213,570 $312,111 2
48 Andy Manar (D) 7 6 13 $164,475 $240,364 2
49 Jennifer Bertino-Tarrant (D) 208 183 391 $8,137,720 $11,892,464 89
50 Wm. Sam McCann (R) 9 27 36 $803,162 $1,173,741 9
51 Chapin Rose (R) 12 9 21 $264,528 $386,582 3
52 Scott M. Bennett (D) 30 20 50 $341,977 $499,766 4
53 Jason Barickman (R) 14 15 29 $426,465 $623,236 5
54 Kyle McCarter (R) 5 8 13 $279,416 $408,338 3
55 Dale A. Righter (R) 6 5 11 $227,888 $333,035 2
56 William R. Haine (D) 5 4 9 $166,020 $242,622 2
57 James F. Clayborne, Jr. (D) 3 4 7 $221,996 $324,426 2
58 David S. Luechtefeld (R) 4 13 17 $315,440 $460,984 3
59 Gary Forby (D) 5 14 19 $618,861 $904,403 7
Unknown legislator 385 209 594 $10,243,514 $14,969,871 112
44,170 23,033 67,203 $1,185,895,610 $1,733,067,844 12,949
5
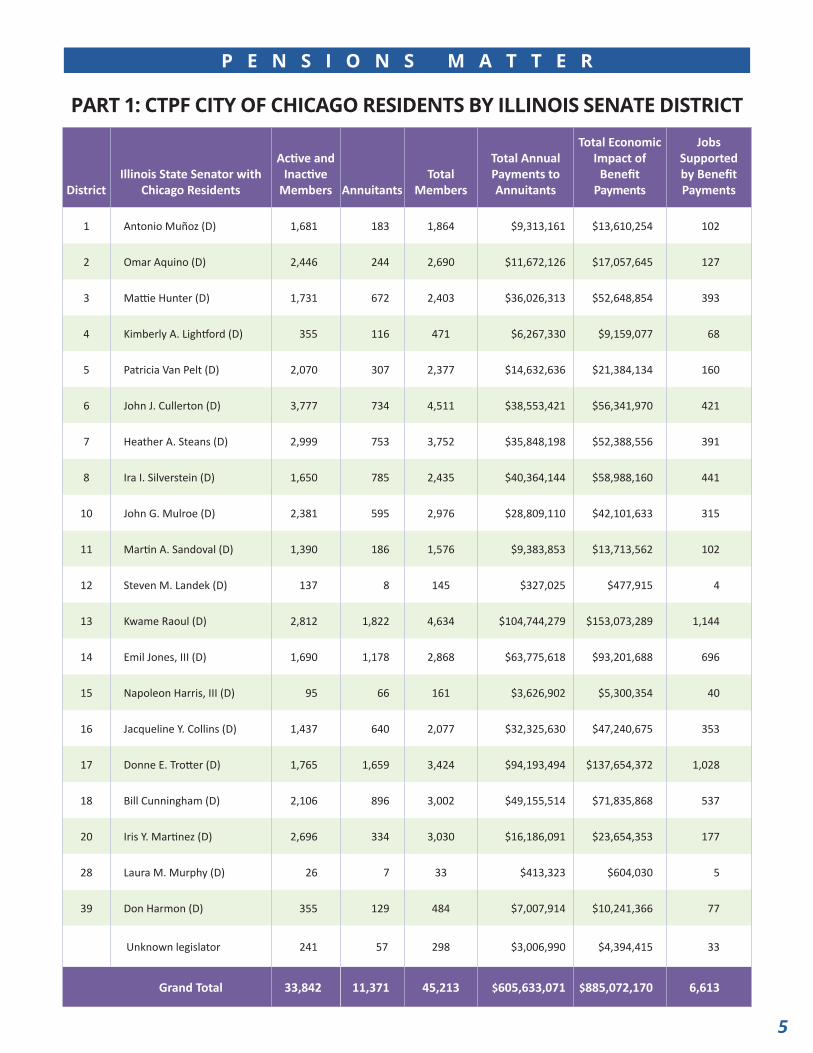
PART 1: CTPF CITY OF CHICAGO RESIDENTS BY ILLINOIS SENATE DISTRICT
DistrictIllinois State Senator with
Chicago Residents
Active and Inactive
Members AnnuitantsTotal
Members
Total Annual Payments to Annuitants
Total Economic Impact of
Benefit Payments
Jobs Supported by Benefit Payments
1 Antonio Muñoz (D) 1,681 183 1,864 $9,313,161 $13,610,254 102
2 Omar Aquino (D) 2,446 244 2,690 $11,672,126 $17,057,645 127
3 Mattie Hunter (D) 1,731 672 2,403 $36,026,313 $52,648,854 393
4 Kimberly A. Lightford (D) 355 116 471 $6,267,330 $9,159,077 68
5 Patricia Van Pelt (D) 2,070 307 2,377 $14,632,636 $21,384,134 160
6 John J. Cullerton (D) 3,777 734 4,511 $38,553,421 $56,341,970 421
7 Heather A. Steans (D) 2,999 753 3,752 $35,848,198 $52,388,556 391
8 Ira I. Silverstein (D) 1,650 785 2,435 $40,364,144 $58,988,160 441
10 John G. Mulroe (D) 2,381 595 2,976 $28,809,110 $42,101,633 315
11 Martin A. Sandoval (D) 1,390 186 1,576 $9,383,853 $13,713,562 102
12 Steven M. Landek (D) 137 8 145 $327,025 $477,915 4
13 Kwame Raoul (D) 2,812 1,822 4,634 $104,744,279 $153,073,289 1,144
14 Emil Jones, III (D) 1,690 1,178 2,868 $63,775,618 $93,201,688 696
15 Napoleon Harris, III (D) 95 66 161 $3,626,902 $5,300,354 40
16 Jacqueline Y. Collins (D) 1,437 640 2,077 $32,325,630 $47,240,675 353
17 Donne E. Trotter (D) 1,765 1,659 3,424 $94,193,494 $137,654,372 1,028
18 Bill Cunningham (D) 2,106 896 3,002 $49,155,514 $71,835,868 537
20 Iris Y. Martinez (D) 2,696 334 3,030 $16,186,091 $23,654,353 177
28 Laura M. Murphy (D) 26 7 33 $413,323 $604,030 5
39 Don Harmon (D) 355 129 484 $7,007,914 $10,241,366 77
Unknown legislator 241 57 298 $3,006,990 $4,394,415 33
Grand Total 33,842 11,371 45,213 $605,633,071 $885,072,170 6,613
P E N S I O N S M A T T E R

6
PART 1: CTPF MEMBERS AND ANNUITANTS BY ILLINOIS HOUSE DISTRICT
DistrictIllinois State
Representative
Active and Inactive
Members AnnuitantsTotal
Members
Total Annual Payments to Annuitants
Total Economic Impact of
Benefit Payments
Jobs Supported by Benefit Payments
1 Daniel J. Burke (D) 641 96 737 $4,674,737 $6,831,660 51
2 Edward J. Acevedo (D) 1,040 87 1,127 $4,638,425 $6,778,594 51
3 Luis Arroyo (D) 954 152 1,106 $7,543,102 $11,023,489 82
4 Cynthia Soto (D) 1,494 95 1,589 $4,300,503 $6,284,755 47
5 Kenneth Dunkin (D) 1,018 464 1,482 $25,294,947 $36,966,035 276
6 Sonya M. Harper (D) 713 208 921 $10,731,366 $15,682,819 117
7 Emanuel Chris Welch (D) 356 431 787 $22,825,267 $33,356,845 249
8 La Shawn K. Ford (D) 589 260 849 $13,864,359 $20,261,374 151
9 Arthur Turner (D) 1,042 162 1,204 $7,783,141 $11,374,282 85
10 Pamela Reaves-Harris (D) 1,027 145 1,172 $6,849,495 $10,009,852 75
11 Ann M. Williams (D) 2,011 242 2,253 $13,210,562 $19,305,916 144
12 Sara Feigenholtz (D) 1,756 490 2,246 $25,230,213 $36,871,433 275
13 Gregory Harris (D) 1,717 315 2,032 $14,927,596 $21,815,189 163
14 Kelly M. Cassidy (D) 1,301 446 1,747 $21,222,852 $31,015,076 232
15 John C. D’Amico (D) 1,200 704 1,904 $37,168,179 $54,317,576 406
16 Louis Lang (D) 911 701 1,612 $34,562,372 $50,509,450 377
17 Laura Fine (D) 494 664 1,158 $33,072,519 $48,332,180 361
18 Robyn Gabel (D) 368 426 794 $20,061,061 $29,317,235 219
19 Robert Martwick (D) 1,544 387 1,931 $18,979,236 $27,736,255 207
20 Michael P. McAuliffe (R) 1,024 418 1,442 $20,680,778 $30,222,889 226
21 Silvana Tabares (D) 380 77 457 $3,768,283 $5,506,968 41
22 Michael J. Madigan (D) 1,087 160 1,247 $7,891,600 $11,532,784 86
23 Michael J. Zalewski (D) 183 92 275 $4,614,675 $6,743,887 50
24 Elizabeth Hernandez (D) 285 82 367 $3,899,305 $5,698,445 43
25 Barbara Flynn Currie (D) 1,517 1,085 2,602 $62,874,736 $91,885,139 687
26 Christian L. Mitchell (D) 1,295 737 2,032 $41,869,543 $61,188,150 457
27 Monique D. Davis (D) 1,407 1,031 2,438 $54,983,225 $80,352,485 600
28 Robert Rita (D) 637 620 1,257 $33,342,926 $48,727,352 364
29 Thaddeus M. Jones (D) 448 705 1,153 $40,402,509 $59,044,227 441
30 William Davis (D) 288 228 516 $12,087,931 $17,665,302 132
31 Mary E. Flowers (D) 878 561 1,439 $28,961,121 $42,323,782 316
32 André Thapedi (D) 744 289 1,033 $13,945,743 $20,380,308 152
33 Marcus C. Evans, Jr. (D) 1,075 988 2,063 $56,674,767 $82,824,504 619
34 Elgie R. Sims, Jr. (D) 923 1,004 1,927 $56,402,896 $82,427,193 616
35 Frances Ann Hurley (D) 1,942 965 2,907 $50,210,798 $73,378,060 548
36 Kelly M. Burke (D) 867 822 1,689 $45,891,040 $67,065,165 501
37 Margo McDermed (R) 222 263 485 $13,829,680 $20,210,694 151
38 Al Riley (D) 486 814 1,300 $46,951,787 $68,615,341 513
P E N S I O N S M A T T E R

7
DistrictIllinois State
Representative
Active and Inactive
Members AnnuitantsTotal
Members
Total Annual Payments to Annuitants
Total Economic Impact of
Benefit Payments
Jobs Supported by Benefit Payments
39 Will Guzzardi (D) 1,275 162 1,437 $7,776,769 $11,364,971 85
40 Jaime M. Andrade, Jr. (D) 1,421 172 1,593 $8,409,321 $12,289,382 92
41 Grant Wehrli (R) 153 64 217 $2,829,306 $4,134,748 31
42 Jeanne M. Ives (R) 107 77 184 $2,650,043 $3,872,772 29
43 Anna Moeller (D) 22 12 34 $445,468 $651,007 5
44 Fred Crespo (D) 62 58 120 $2,717,839 $3,971,851 30
45 Christine Winger (R) 103 106 209 $5,240,497 $7,658,462 57
46 Deb Conroy (D) 99 74 173 $3,513,094 $5,134,036 38
47 Patricia R. Bellock (R) 255 222 477 $10,693,885 $15,628,044 117
48 Peter Breen (R) 157 141 298 $5,912,105 $8,639,950 65
49 Mike Fortner (R) 66 42 108 $1,281,648 $1,873,001 14
50 Keith R. Wheeler (R) 59 37 96 $1,547,952 $2,262,176 17
51 Ed Sullivan (R) 101 151 252 $5,775,239 $8,439,934 63
52 David McSweeney (R) 72 44 116 $1,821,249 $2,661,574 20
53 David Harris (R) 235 254 489 $11,399,728 $16,659,563 124
54 Thomas R. Morrison (R) 157 113 270 $4,516,831 $6,600,897 49
55 Martin J. Moylan (D) 252 304 556 $15,357,906 $22,444,044 168
56 Michelle Mussman (D) 116 76 192 $3,386,893 $4,949,605 37
57 Elaine Nekritz (D) 163 268 431 $11,853,944 $17,323,353 129
58 Scott Drury (D) 259 311 570 $12,969,857 $18,954,149 142
59 Carol Sente (D) 132 187 319 $8,157,345 $11,921,145 89
60 Rita Mayfield (D) 33 24 57 $814,063 $1,189,672 9
61 Sheri Jesiel (R) 45 33 78 $1,515,067 $2,214,119 17
62 Sam Yingling (D) 57 62 119 $2,698,049 $3,942,929 29
63 Jack D. Franks (D) 24 29 53 $1,304,282 $1,906,077 14
64 Barbara Wheeler (R) 58 52 110 $2,298,443 $3,358,944 25
65 Steven A. Andersson (R) 66 117 183 $5,723,700 $8,364,615 62
66 Michael W. Tryon (R) 72 51 123 $2,113,443 $3,088,585 23
67 Litesa E. Wallace (D) 10 3 13 $74,992 $109,594 1
68 John M. Cabello (R) 16 26 42 $867,136 $1,267,232 9
69 Joe Sosnowski (R) 13 7 20 $171,743 $250,986 2
70 Robert W. Pritchard (R) 25 28 53 $794,587 $1,161,209 9
71 Mike Smiddy (D) 6 6 12 $216,549 $316,465 2
72 Patrick J. Verschoore (D) 9 3 12 $18,768 $27,427 –
73 David R. Leitch (R) 8 4 12 $147,123 $215,006 2
74 Donald L. Moffitt (R) 7 5 12 $74,994 $109,596 1
75 David A. Welter (R) 35 29 64 $1,126,225 $1,645,866 12
76 Andrew F. Skoog (D) 10 10 20 $327,278 $478,284 4
77 Kathleen Willis (D) 74 61 135 $2,653,308 $3,877,544 29
78 Camille Y. Lilly (D) 746 445 1,191 $23,456,639 $34,279,532 256
79 Katherine Cloonen (D) 24 21 45 $835,064 $1,220,363 9
80 Anthony DeLuca (D) 265 466 731 $26,136,934 $38,196,515 285

8
DistrictIllinois State
Representative
Active and Inactive
Members AnnuitantsTotal
Members
Total Annual Payments to Annuitants
Total Economic Impact of
Benefit Payments
Jobs Supported by Benefit Payments
81 David S. Olsen (R) 200 168 368 $8,558,533 $12,507,440 93
82 Jim Durkin (R) 231 339 570 $17,257,928 $25,220,736 188
83 Linda Chapa LaVia (D) 7 20 27 $905,618 $1,323,470 10
84 Stephanie A. Kifowit (D) 78 35 113 $1,547,434 $2,261,420 17
85 Emily McAsey (D) 118 83 201 $4,233,222 $6,186,430 46
86 Lawrence Walsh, Jr. (D) 27 19 46 $840,719 $1,228,626 9
87 Tim Butler (R) 6 2 8 $11,702 $17,101 –
88 Keith P. Sommer (R) 10 10 20 $240,969 $352,152 3
89 Brian W. Stewart (R) 10 34 44 $1,300,319 $1,900,286 14
90 Tom Demmer (R) 13 8 21 $248,367 $362,964 3
91 Michael D. Unes (R) 6 2 8 $15,730 $22,988 –
92 Jehan Gordon-Booth (D) 7 6 13 $105,565 $154,273 1
93 Norine K. Hammond (R) 3 6 9 $150,068 $219,309 2
94 Randy E. Frese (R) 6 2 8 $63,502 $92,802 1
95 Avery Bourne (R) 2 – 2 – – –
96 Sue Scherer (D) 5 6 11 $164,475 $240,364 2
97 Mark Batinick (R) 102 69 171 $3,168,428 $4,630,341 35
98 Natalie A. Manley (D) 106 114 220 $4,969,291 $7,262,123 54
99 Sara Wojcicki Jimenez (R) 8 19 27 $536,224 $783,638 6
100 C. D. Davidsmeyer (R) 1 8 9 $266,938 $390,104 3
101 Bill Mitchell (R) 8 2 10 $1,679 $2,453 –
102 Adam M. Brown (R) 4 7 11 $262,850 $384,129 3
103 Carol Ammons (D) 20 11 31 $230,124 $336,303 3
104 Chad Hays (R) 9 9 18 $111,854 $163,463 1
105 Dan Brady (R) 10 6 16 $170,386 $249,003 2
106 Thomas M. Bennett (R) 4 9 13 $256,079 $374,233 3
107 John Cavaletto (R) 2 6 8 $261,323 $381,897 3
108 Charles Meier (R) 3 2 5 $18,093 $26,441 –
109 David B. Reis (R) 1 3 4 $124,083 $181,334 1
110 Reginald Phillips (R) 5 2 7 $103,805 $151,701 1
111 Daniel V. Beiser (D) 2 1 3 $60,466 $88,365 1
112 Dwight Kay (R) 3 3 6 $105,554 $154,257 1
113 Jay Hoffman (D) 1 4 5 $221,996 $324,426 2
114 Eddie Lee Jackson, Sr. (D) 2 – 2 – – –
115 Terri Bryant (R) 4 10 14 $187,137 $273,483 2
116 Jerry Costello, II (D) – 3 3 $128,303 $187,502 1
117 John Bradley (D) 4 7 11 $405,953 $593,260 4
118 Brandon W. Phelps (D) 1 7 8 $212,907 $311,142 2
Unknown legislator 408 218 626 $10,599,408 $15,489,974 116
Grand Total 44,170 23,033 67,203 $1,185,895,610 $1,733,067,844 12,949

9
DistrictIllinois State Representative
with Chicago Residents
Active and Inactive
Members AnnuitantsTotal
Members
Total Annual Payments to Annuitants
Total Economic Impact of
Benefit Payments
Jobs Supported by Benefit
1 Daniel J. Burke (D) 641 96 737 $4,674,737 $6,831,660 51
2 Edward J. Acevedo (D) 1,040 87 1,127 $4,638,425 $6,778,594 51
3 Luis Arroyo (D) 952 149 1,101 $7,371,623 $10,772,890 80
4 Cynthia Soto (D) 1,494 95 1,589 $4,300,503 $6,284,755 47
5 Kenneth Dunkin (D) 1,018 464 1,482 $25,294,947 $36,966,035 276
6 Sonya M. Harper (D) 713 208 921 $10,731,366 $15,682,819 117
8 La Shawn K. Ford (D) 355 116 471 $6,267,330 $9,159,077 68
9 Arthur Turner (D) 1,042 162 1,204 $7,783,141 $11,374,282 85
10 Pamela Reaves-Harris (D) 1,027 145 1,172 $6,849,495 $10,009,852 75
11 Ann M. Williams (D) 2,011 242 2,253 $13,210,562 $19,305,916 144
12 Sara Feigenholtz (D) 1,756 490 2,246 $25,230,213 $36,871,433 275
13 Gregory Harris (D) 1,717 315 2,032 $14,927,596 $21,815,189 163
14 Kelly M. Cassidy (D) 1,282 438 1,720 $20,920,602 $30,573,368 228
15 John C. D’Amico (D) 1,016 469 1,485 $25,228,448 $36,868,854 275
16 Louis Lang (D) 634 316 950 $15,135,696 $22,119,306 165
19 Robert Martwick, Jr. (D) 1,504 361 1,865 $17,761,294 $25,956,356 194
20 Michael P. McAuliffe (R) 876 234 1,110 $11,047,815 $16,145,277 121
21 Silvana Tabares (D) 310 30 340 $1,612,261 $2,356,158 18
22 Michael J. Madigan (D) 1,080 156 1,236 $7,771,592 $11,357,404 85
23 Michael J. Zalewski (D) 7 – 7 – – –
24 Elizabeth Hernandez (D) 130 8 138 $327,025 $477,915 4
25 Barbara Flynn Currie (D) 1,517 1,085 2,602 $62,874,736 $91,885,139 687
26 Christian L. Mitchell (D) 1,295 737 2,032 $41,869,543 $61,188,150 457
27 Monique D. Davis (D) 1,237 794 2,031 $42,510,677 $62,125,103 464
28 Robert Rita (D) 453 384 837 $21,264,941 $31,076,585 232
29 Thaddeus M. Jones (D) 95 66 161 $3,626,902 $5,300,354 40
31 Mary E. Flowers (D) 763 406 1,169 $20,944,026 $30,607,600 229
32 André Thapedi (D) 674 234 908 $11,381,603 $16,633,075 124
33 Marcus C. Evans, Jr. (D) 949 882 1,831 $51,219,801 $74,852,617 559
34 Elgie R. Sims, Jr. (D) 813 776 1,589 $42,964,931 $62,788,951 469
35 Frances Ann Hurley (D) 1,754 698 2,452 $37,388,023 $54,638,857 408
36 Kelly M. Burke (D) 352 198 550 $11,767,491 $17,197,012 128
39 Will Guzzardi (D) 1,275 162 1,437 $7,776,769 $11,364,971 85
40 Jaime M. Andrade, Jr. (D) 1,421 172 1,593 $8,409,321 $12,289,382 92
55 Martin J. Moylan (D) 26 7 33 $413,323 $604,030 5
78 Camille Y. Lilly (D) 355 129 484 $7,007,914 $10,241,366 77
Unknown legislator 256 60 316 $3,128,399 $4,571,842 34
Grand Total 33,840 11,371 45,211 $605,633,071 $885,072,170 6,613
PART 1: CTPF CITY OF CHICAGO RESIDENTS BY ILLINOIS HOUSE DISTRICTP E N S I O N S M A T T E R

THESE FORMER TEACHERS CAN TELL YOU BEING RETIRED DOESN’T MEAN YOU STOP BEING A PART OF THE COMMUNITY
FUND DEMOGRAPHICSA majority of CTPF’s members, about 91% of all active members and annuitants (including retirees, survivors, and members with disabilities receiving pensions), live in the State of Illinois. Approximately 85% of CTPF’s annuitants live in Illinois and about half of those members reside in the City of Chicago. CTPF annuitants spend their pensions close to home, benefiting the state and local economies.
CALCULATING TOTAL ECONOMIC IMPACTEconomic activity includes CTPF Benefit payments and all additional economic activity in Illinois generated by those payments. Economic multipliers measure the direct and indirect effect of payments made to CTPF annuitants. Multipliers are supplied by the U.S. Department of Commerce, Bureau of Economic Analysis.
JOBS CREATEDMoney spent in Illinois translates into jobs for Illinois residents. Multipliers are supplied by the U.S. Department of Commerce Bureau of Economic Analysis. The job creation factor is 10.9190 per million.
CASE STUDY: STAYING CLOSE TO HOME, FRIENDS, COMMUNITY
10
TheTheSTAYS HERESTAYS HERE
BUCKBUCKTheTheSTAYS HERESTAYS HERE
BUCKBUCK
We stopped by a Mather LifeWays Café on Chicago’s south side earlier this year to spend some time visiting with a few of CTPF’s retired teachers. Every day our members gather at this neighborhood location to take a class, socialize with friends, have a meal or learn to use the computer.
“You can go there, and over a cup of coffee you can talk about current events and what goes on in the neighborhood,” said Annette Robinson, former Beethoven Career Academy teacher with 25 years of service. “For those people who live alone this is especially important.”
These teachers represent just a few of the thousands of retirees who still live in the city. They have their homes here, pay taxes here and do their shopping in the neighborhoods where they have lived most of their lives.
Why do they stay? Because of their pension, these teachers are able to stay in the communities and be the role models they have been all their lives.
“We need people in the community with experience to keep the community stable and to keep it working properly,” explained Barbara McCoy, former Healy North Alternative High School Teacher with 25 years of service.
REGION: ILLINOIS, INDUSTRY, HOUSEHOLDS
n Data used in this report: $1.19 billion in payments to 23,033 annuitants residing in Illinois
n Total impact is based on CTPF benefit payments multiplied by the U.S. Bureau of Economic Analysis total output multiplier of 1.4614
n 1.4614 x $1.19 billion = $1.7 billion in economic activity in Illinois
n 1.4614 x $606 million = $885 million in economic activity in Chicago
11
PENSIONS MATTERIT’S TIME TO UNDERSTAND THE BIG PICTURE WHEN WE LOOK AT PENSIONS. A pension is an efficient vehicle for providing retirement security. The National Institute on Retirement Security estimates that a Defined Benefit (pension) plan can provide benefits at about half the cost associated with a 401(k) plan.
CTPF BENEFITS ARE EARNED DURING A LIFETIME OF SERVICE. The average annual payment in 2015 was about $46,947 for a member who retired with 28 years of service.
CTPF MEMBERS ARE SAVERS. CTPF members have been contributing to pensions since 1895, more than 40 years before Social Security was established. CTPF members do not receive Social Security retirement payments and rely on pensions for financial security.
CTPF MEMBERS ARE SPENDERS. Every dollar paid out in pension benefits generates $1.46 in economic activity for the State – a solid return in any economy. But in tough economic times, pensions matter more – because pensioners with guaranteed income can continue to spend.
CTPF MEMBERS STAY IN ILLINOIS. More than 85% of CTPF annuitants live in Illinois, and about 50% of those members live in the City of Chicago.
CTPF MEMBERS DRIVE THE ECONOMY. Pension benefits are returned to Illinois and generate additional revenue through the ripple effect on the economy. Pension revenue helps to generate more than 12,949 jobs statewide with 6,613 in Chicago.
CTPF PENSIONS MATTER to
Chicago and Illinois.
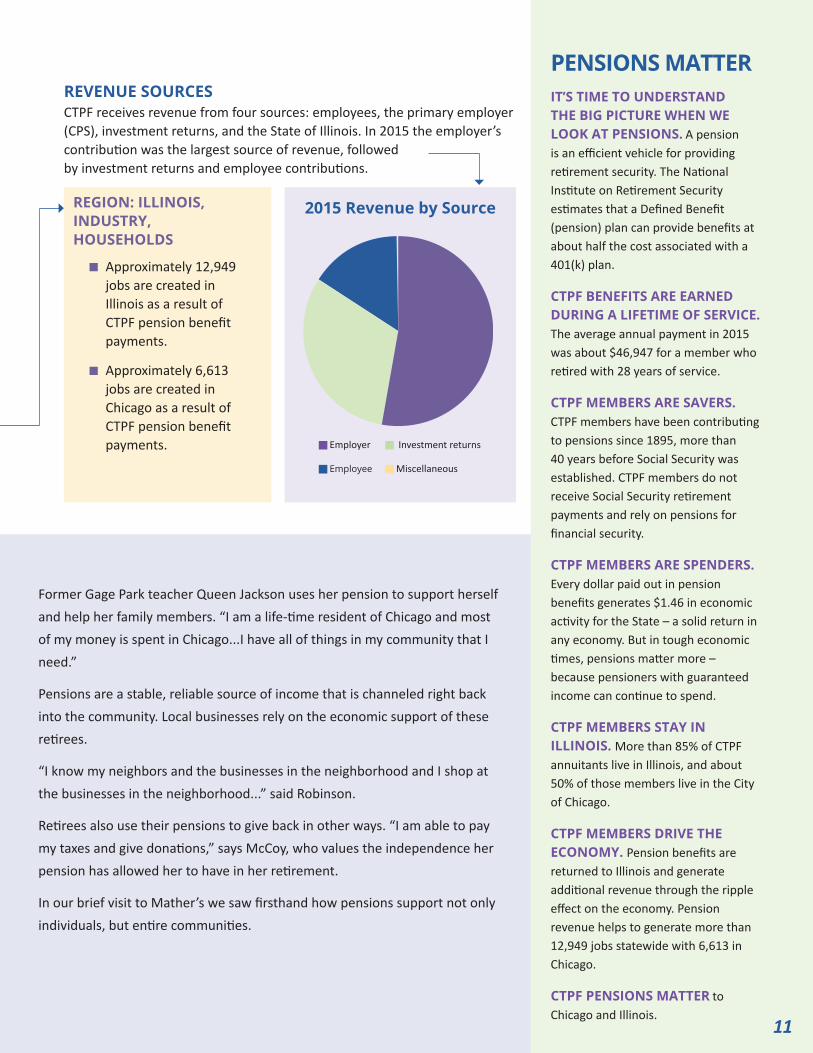
REVENUE SOURCESCTPF receives revenue from four sources: employees, the primary employer (CPS), investment returns, and the State of Illinois. In 2015 the employer’s contribution was the largest source of revenue, followed by investment returns and employee contributions.
Former Gage Park teacher Queen Jackson uses her pension to support herself and help her family members. “I am a life-time resident of Chicago and most of my money is spent in Chicago...I have all of things in my community that I need.”
Pensions are a stable, reliable source of income that is channeled right back into the community. Local businesses rely on the economic support of these retirees.
“I know my neighbors and the businesses in the neighborhood and I shop at the businesses in the neighborhood...” said Robinson.
Retirees also use their pensions to give back in other ways. “I am able to pay my taxes and give donations,” says McCoy, who values the independence her pension has allowed her to have in her retirement.
In our brief visit to Mather’s we saw firsthand how pensions support not only individuals, but entire communities.
n Employer n Investment returns
n Employee n Miscellaneous
REGION: ILLINOIS, INDUSTRY, HOUSEHOLDS
n Approximately 12,949 jobs are created in Illinois as a result of CTPF pension benefit payments.
n Approximately 6,613 jobs are created in Chicago as a result of CTPF pension benefit payments.
2015 Revenue by Source

CHICAGO TEACHERS’ IMPACT EXTENDS BEYOND CLASSROOM
TheTheSTAYS HERESTAYS HERE
BUCKBUCK
NOTE: CTPF CALCULATES ESTIMATES OF TOTAL ECONOMIC IMPACT AND JOBS SUPPORTED BY MULTIPLYINGBENEFIT PAYMENTS BY TOTAL OUTPUT MULTIPLIERS SUPPLIED BY THE U.S. DEPARTMENT OF COMMERCE,BUREAU OF ECONOMIC ANALYSIS.
ILLINOISILLINOIS
CHICAGOCHICAGO
$1.7 BILLIONIN TOTAL ECONOMIC IMPACTIN ILLINOIS
$1.2 BILLION MADE INDIRECT PENSION PAYMENTS
TO ANNUITANTS LIVING IN ILLINOISRESULTS IN...
OF CTPF ANNUITANTS STAY IN ILLINOIS, WITH HALF OF THOSE MEMBERS RESIDING IN CHICAGO
12,949JOBS SUPPORTEDIN ILLINOIS
$885 MILLIONIN TOTAL ECONOMIC IMPACTIN CHICAGO
$606 MILLIONIN DIRECT PENSION PAYMENTSMADE TO ANNUITANTS LIVING IN CHICAGO
6,613JOBS SUPPORTEDIN CHICAGO
85%
RESULTS IN...