thermal comfort assessment based on measurement and
TRANSCRIPT
Thermal Comfort Assessment Based on Measurement and Questionnaire Surveys in a Large Mechanically Ventilated Space Ali Alzaid1, Maria Kolokotroni1, Hazim Awbi2 1 Mechanical Engineering, Brunel University London Uxbridge, Middlesex UB8 3PH, UK, [email protected]
[email protected] 2 School of Built Environment, University of Reading Reading RG6 6UA, UK, [email protected] Abstract: This paper presents a thermal comfort study in a large occupied office (floor-to-ceiling height >5m) ventilated by a simple mixing ventilation system. The evaluation was conducted during the summer seasons of 2016 and 2017 using three different tools; (a) long term monitoring, (b) short term detailed measurements and (c) occupant questionnaire. Long term monitoring included air temperature and relative humidity at several locations and heights within the space with external conditions retrieved form a weather station on the roof of the building. The short term spot measurements included air temperature, relative humidity and air speed each at three vertical occupancy heights and the inlet diffusers. The surveys involved collection data using questionnaires developed based on ISO 10551. Analysis of long term data using temperature clouds indicate that the building can be approximated to be free running. A comparison between the measurement (analysed using PMV/PPD and adaptive thermal comfort) and the questionnaire surveys’ results show good agreement between predictions and occupant evaluation. The existing ventilation system was able to meet the requirement for thermal comfort in this large enclosure. However, with regards to the air movement, it did not achieve the recommended levels and this has affected occupant responses. Keywords: Large space, Thermal comfort, Experimental measurement, occupant questionnaire
1. Introduction Ventilation of large spaces differs from that for spaces with a small volume, especially those with ceiling height of 3m or less. According to Li et al. (2009), an enclosure with more than 5 meters floor-to-ceiling height can be considered as a large space. In such spaces, when warm air under the effect of buoyancy rises, a positive temperature gradient between floor and ceiling is formed, known as stratification (Calay et al. 2000) and the air flow pattern should be arranged and controlled to ensure an acceptable indoor air quality and thermal comfort in the occupied zone without the need for excessive air flow rates (Heiselberg et al. 1998). Mateus & Carrilho da Graça (2017) carried out an extensive literature survey of HVAC systems’ performance in large spaces; they found that three types of room air distribution strategies are commonly used. These are displacement ventilation, mixing ventilation and underfloor air distribution systems. Furthermore, their review revealed that very few studies are available which make a comparison between ventilation model simulations and measured air temperature in large spaces. These measurements are needed for commissioning, diagnostic and assessment purposes. However, the considerable volume and envelope area associated with large spaces add to the difficulty of measurements (International Energy Agency (IEA) 1998).
The goal of any ventilation system is to create a suitable microclimate in the ventilated place. In this case, microclimate refers to the thermal environment and air quality. These two factors are essential to the comfort of the occupants of the spaces (Awbi 2003). The thermal balance can be affected by several factors which are physical activity, clothing resistance and environmental parameters such as air temperature, mean radiant temperature, air humidity and air velocity. To predict the thermal sensation for the body as a whole, the Predicted Mean Vote (PMV) index can be used for estimating or evaluating the above factors. The percentage of the people who are dissatisfied with the thermal environment is measured by Predicted Percentage Dissatisfied (PPD) index. Furthermore, thermal discomfort can be generated by unwanted heating or cooling of one nominated segment of the body. This is known as local discomfort and can be caused by four factors which are draft, vertical air temperature differences, radiant temperature asymmetry and cold or warm floors (ISO 2005). In parallel, the adaptive model of thermal comfort is also used to estimate comfort conditions. It starts with behavioural adaptation which is made by people to stay comfortable rather than comply with the theory of heat exchange. Such adaption is a two-way process. The person adapts himself to suit the environmental by such action like changing clothes. He also adapts his thermal environment to suit himself by opening windows or adjusting the heating or cooling provision (Humphreys et al. 2013). A recent review study by Nicol (2017) shows that a very wide range of indoor temperature is found in mechanically controlled buildings. The paper explained this range using the adaptive approach, considering mechanical conditioning systems as a robust adaptive way used by occupants to control the indoor temperature to their various climate, building and lifestyles. The study proposed that the current indoor temperatures guidelines in dwellings can be adjusted to be more flexible. This paper presents a thermal comfort study for a large occupied open plan office located in south England during the summer season for the years 2016 and 2017. This large office is supplied by a mechanical overhead mixing ventilation cooling system which operates during the summer months. The purpose of the survey is to understand the thermal conditions provided by the current ventilation system with measurements analysed in terms of current thermal comfort guidelines and research findings for buildings which are not free running (FR) and relate these to occupants’ satisfaction.
2. Description of the case-study and ventilation system A large open plan office used by research staff and students was chosen as the case-study of large space because its floor-to-ceiling height is 6m.The enclosure has dimensions of 15.5m
x14m x 6m and a floor area of 201 𝐦𝟐 with brick external walls and metal roof which includes two large skylights. Two big rectangle windows are located on the south facing wall of the building with dimensions 3.5m x 1.1m and 4.2m x 1.1m. There is one door at each end wall of the building. The large open plan office includes 12 personal computers, peak occupancy of 12 occupants in summer 2016 while there were 24 personal computers and 24 occupants in summer 2017. It also includes artificial lighting comprising of 46 luminaires each equipped with two 49 W lamps. The total internal heat gain in the office was 27 W/𝐦𝟐
in summer 2016 while it was 42.8 W/𝐦𝟐 in summer 2017. Furthermore, the external heat gain due to solar radiation has a substantial impact on the performance of the ventilation system in the office and on the thermal comfort as well. Thus, the solar heat gain through

the office’s ceiling and absorbed and passing through the office’ windows were 1130W and 1803W respectively calculated for one representative hour in the summer. The office is equipped with a mechanical cooling overhead mixing ventilation system which operates during the summer months. The external air is delivered into the building interior through a 13m long cylindrical supply duct with 0.7m diameter. This duct has eight air diffusers located at a height of 3.7 m above the floor with dimension of 0.8m x 0.15m and divided into seven segments. Air exhaust is via two return grills located at a height of 3.7m with dimensions 1.0m x 0.5m each, see Figure 1.
Figure 1. Sketch and photo of the researchers' office at studied building.
The measurements were carried out during the summer of 2016 over a period of 28 days from 24/8/2016 to 21/9/2016 which can be considered late summer season in London. During this period and according to the weather station mounted on the building (about 3m above the roof), the external average temperature was 18.5˚C, the maximum was 28.9˚C, the minimum temperature was 11.3˚C while solar radiation reached a maximum of 740
W/𝒎𝟐. On the other hand, the external average relative humidity for the same periods was 80%, the maximum was 100% and the minimum was 39.4 %. For the summer of 2017, measurements were carried out for three months from 21/6/2017 to 19/9/2017. The first month started from 21/6/2017 to 19/7/2017 while the second and the third months began from 22/7/2017 to 19/8/2017 and from 22/8/2017 to 19/9/2017 respectively. During this period the mean outdoor temperature was 17.3˚C, the maximum was 34.7˚C, and the minimum temperature was 6.6˚C while solar radiation reached 943 W/𝐦𝟐. On the other hand, the outdoor air was generally humid with an average relative humidity of 75.6%, the maximum of 99.8% and the minimum of 30.2 %. In general, these periods of the year can be considered the hottest months in London.
3. Methodology Thermal comfort in this large open plan office was evaluated using three different tools which were: long-term monitoring during the summer of 2016 and 2017, spot detailed measurements for a short time in summer 2016 and 2017 and occupant questionnaire surveys only in summer 2017.
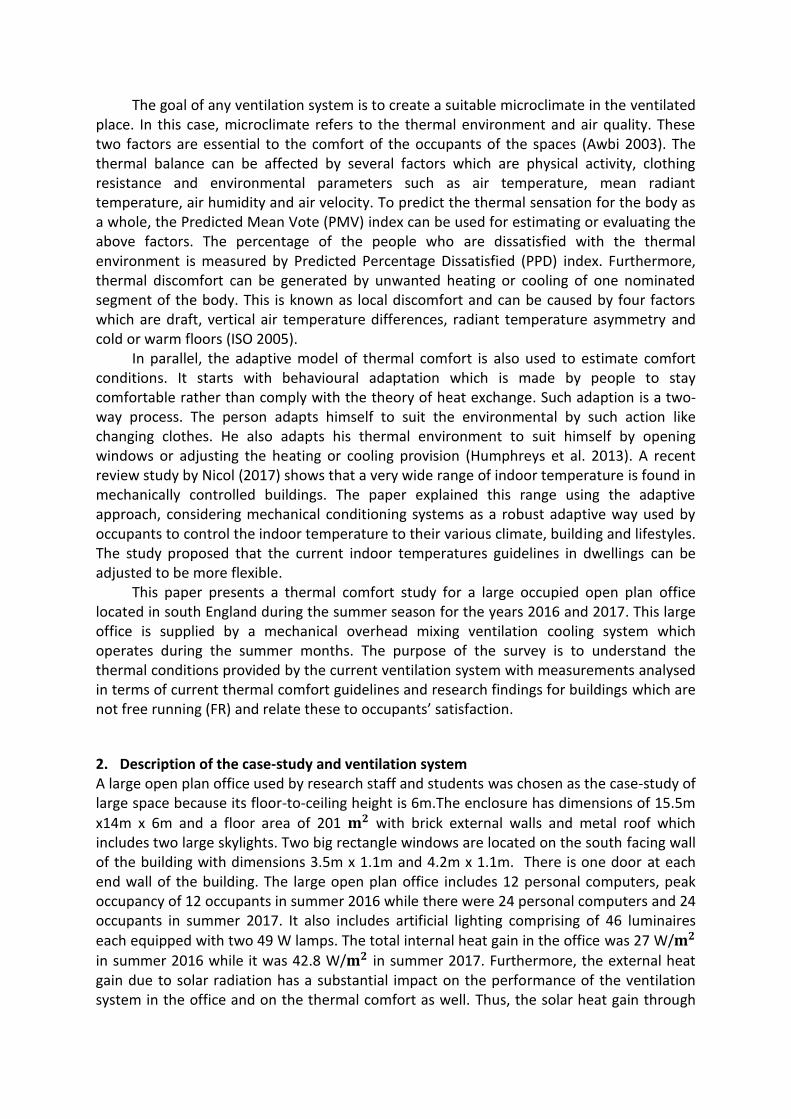
3.1. Long-term monitoring survey Air temperature and relative humidity were measured using nine HOBO Temp/RH data loggers attached to three columns (C1, C5 and C8) which are located at three different heights of 0.1, 1.2 and 1.8m, for measuring the temperature and relative humidity distributions between the floor and standing height, see Figure 2. In addition, eight HOBO Temp/RH data loggers were used to measure the air temperature at the eight diffusers and four more loggers were mounted at heights of 4m and 5m in two different locations to measure the air temperature and relative humidity in the area above the occupied zone. The accuracy of the air temperature measurement is ± 0.21˚C and ± 3.5% for the relative humidity measurements (HOBO n.d.).
Figure 2. Schematic layout of the researchers' office building and HOBO Temp/RH data logger location attached to the columns (C1, C5, C8) at three different heights of 0.1, 1.2 and 1.8m. S1-S7 are the location of spot measurements while D1-D8 indicates the location of the diffusers.
3.2. Spot detailed measurement survey The spot detailed measurements were carried out during two summer seasons. The measurements were conducted in the summer of 2016 over five days from 5/9/2016 to 9/9/2016 at three different times of a day (11:00, 13:00 and 15:00). In the summer of 2017, the measurements were performed over three days on 31/8/ 2017, 5/9/2017 and 11/9/2017. The environmental parameters were obtained for seven different spots as shown in Figure 2, chosen to represent typical positions of the occupants. At each spot, measurements of air temperature, air speed, and relative humidity were taken at heights of 0.1m (foot level), 1.2m (head level of a seated individual) and 1.8m (head level of a standing individual) above the floor. These parameters were measured over two minutes with a sampling interval of ten seconds by using a TA465 AirFlow instrument. The accuracy of the air speed measurement is estimated to be ± 0.015 m/s or ± 3% while the error of measured temperature is estimated to be ± 0.3 ˚C. In addition a CPS Thermo Anemometer AM50 were used to measure the air speed at the eight diffusers for two different days 31/8/2017 and 11/9/2017 at 13:00 where the accuracy of this anemometer was ± 3%. The air speed at the eight diffusers were also measured twice in the summer of 2016 by using the TA465 AirFlow instrument on 6/9/2016 and 8/9/2016 at 13:00.
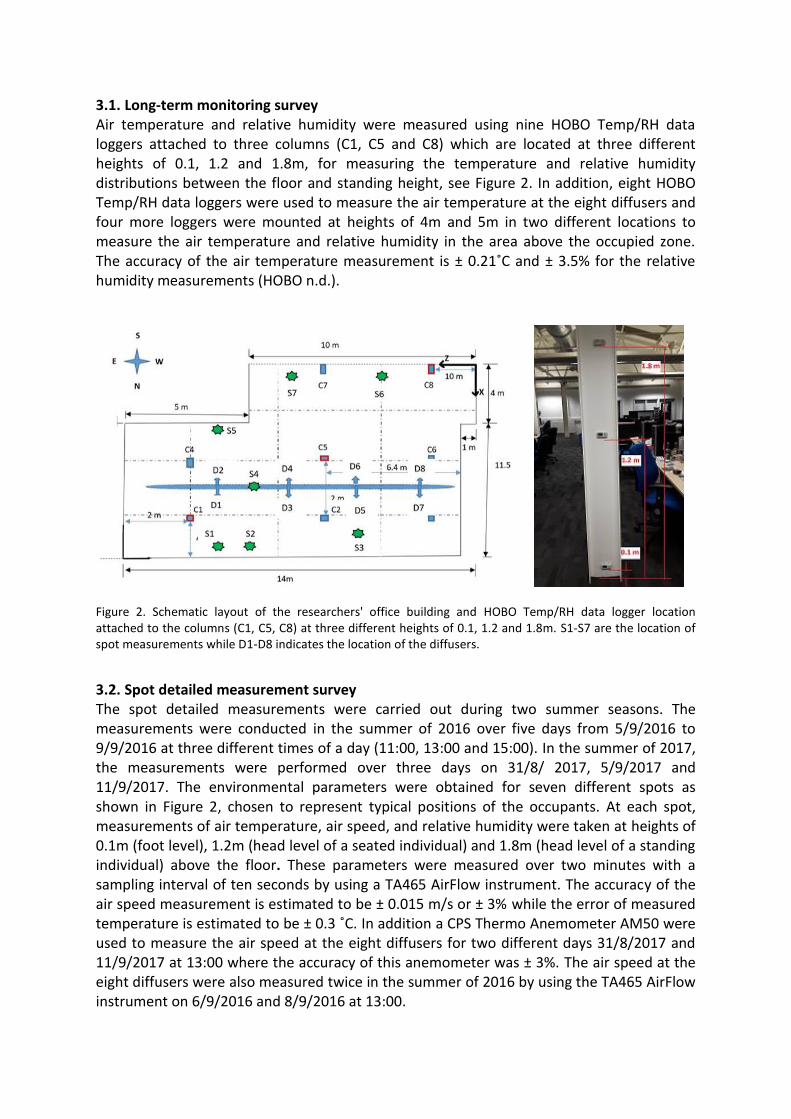
3.3. Questionnaire survey The research staff who work at the open-plan office investigated were recruited for this study in summer 2017. The participants consisted of young females and males who have various ethnic origins and nationalities.The subjective study involved collection of data using questionnaires which were developed on the basis of ISO 10551 (Iso 2001) and guided by recent literature (Ricciardi et al. (2016) Zhao et al. (2017)) . The questionnaire was developed to assess the thermal environment based on the occupant's thermal sensation vote and air movement in the office. This assessment will be made based on judgements at the head and foot levels and overall comfort sensation as well as an individual preference for different conditions. ASHRAE seven points thermal sensations scale (from – 3 to +3) were used to evaluate thermal sensations and rate the impressions of comfort with regard to air movement. This is to collect the quantified thermal sensation of the occupants. A similar seven-point scale is used for the thermal preference vote for direct comparison with the thermal sensation vote. The freshness of air was used to assess the air quality inside the office. The questionnaire also addressed the clothing garments for the participants to obtain the clothing insulation value. In addition to that, the participants had to indicate their location on the office’s plan. The rating scales for these parameters are shown in Table 1. Besides that, PMV, PPD and several other aspects were considered to elaborate the questionnaires as proposed by Ricciardi et al. (2016), (Ricciardi & Buratti 2015) and (Buratti & Ricciardi 2009) see Table 2. The subjects were required to make only one choice from the scale for each question. Both questionnaire distribution and measurements were carried out at 15:00 each day, in order to allow the participants to adjust to the environmental condition after the lunch break.
Table 1. Rating scales for subjective evaluation parameters
Parameters Rating Scales
-3 -2 -1 0 +1 +2 +3 Thermal
Sensation (TS)
Cold Cool Slightly cool Neither hot
nor cold Slightly warm Warm Hot
Thermal Preference (TP)
Much cooler
Cooler Slightly cooler
Without change
Slightly warmer
Warmer Much warmer
Air Movement (AM)
Very still Still Slightly still Acceptable Slightly draughty
Draughty Very draughty
Air movement Preference
(AMP)
Much more air
movement
More air movement
Slightly more air
movement
Without change
Slightly less air movement
Less air movement
Much less air movement
Relative Humidity
(RH) Very dry Dry Slightly dry Neutral Slightly humid Humid Very humid
Relative Humidity
Preference (RHP)
Much drier Drier Slightly drier Without change
Slightly more humid More humid
Much more humid
Thermal Comfort
(TC) Comfortable
Slightly comfortable Uncomfortable
Very uncomfortable
Air quality (AQ)
Very fresh Fresh Slightly Fresh Neutral Slightly stuffy Stuffy Very stuffy
Air Quality Preference
(AQP) Acceptable
Slightly acceptable Unacceptable
Very unacceptable
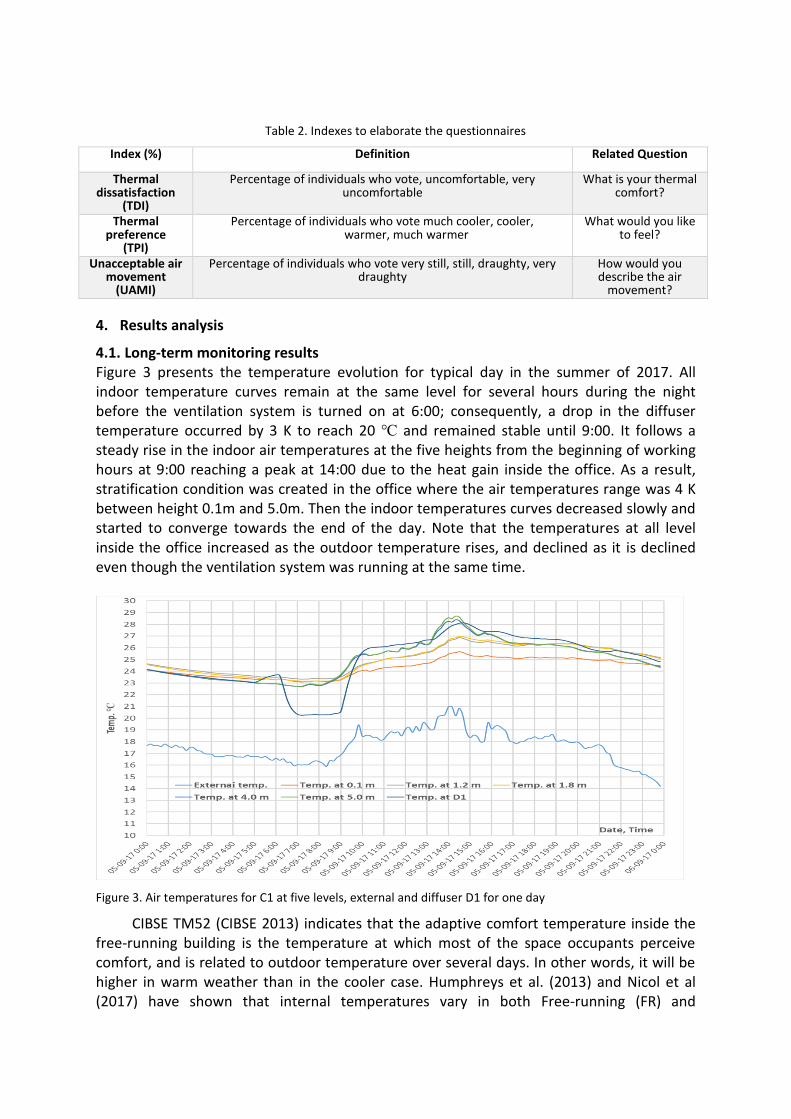
Table 2. Indexes to elaborate the questionnaires
Index (%) Definition Related Question
Thermal dissatisfaction
(TDI)
Percentage of individuals who vote, uncomfortable, very uncomfortable
What is your thermal comfort?
Thermal preference
(TPI)
Percentage of individuals who vote much cooler, cooler, warmer, much warmer
What would you like to feel?
Unacceptable air movement
(UAMI)
Percentage of individuals who vote very still, still, draughty, very draughty
How would you describe the air
movement?
4. Results analysis
4.1. Long-term monitoring results Figure 3 presents the temperature evolution for typical day in the summer of 2017. All indoor temperature curves remain at the same level for several hours during the night before the ventilation system is turned on at 6:00; consequently, a drop in the diffuser temperature occurred by 3 K to reach 20 ℃ and remained stable until 9:00. It follows a steady rise in the indoor air temperatures at the five heights from the beginning of working hours at 9:00 reaching a peak at 14:00 due to the heat gain inside the office. As a result, stratification condition was created in the office where the air temperatures range was 4 K between height 0.1m and 5.0m. Then the indoor temperatures curves decreased slowly and started to converge towards the end of the day. Note that the temperatures at all level inside the office increased as the outdoor temperature rises, and declined as it is declined even though the ventilation system was running at the same time.
Figure 3. Air temperatures for C1 at five levels, external and diffuser D1 for one day
CIBSE TM52 (CIBSE 2013) indicates that the adaptive comfort temperature inside the free-running building is the temperature at which most of the space occupants perceive comfort, and is related to outdoor temperature over several days. In other words, it will be higher in warm weather than in the cooler case. Humphreys et al. (2013) and Nicol et al (2017) have shown that internal temperatures vary in both Free-running (FR) and
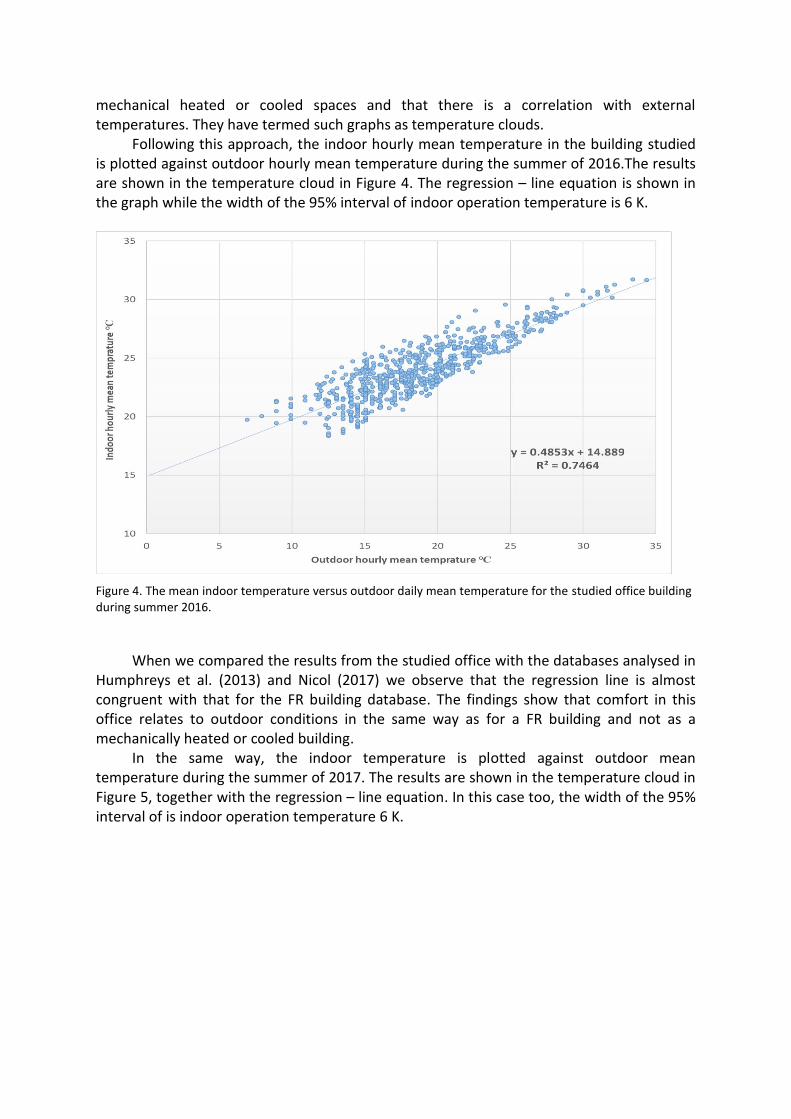
mechanical heated or cooled spaces and that there is a correlation with external temperatures. They have termed such graphs as temperature clouds. Following this approach, the indoor hourly mean temperature in the building studied is plotted against outdoor hourly mean temperature during the summer of 2016.The results are shown in the temperature cloud in Figure 4. The regression – line equation is shown in the graph while the width of the 95% interval of indoor operation temperature is 6 K.
Figure 4. The mean indoor temperature versus outdoor daily mean temperature for the studied office building during summer 2016.
When we compared the results from the studied office with the databases analysed in Humphreys et al. (2013) and Nicol (2017) we observe that the regression line is almost congruent with that for the FR building database. The findings show that comfort in this office relates to outdoor conditions in the same way as for a FR building and not as a mechanically heated or cooled building. In the same way, the indoor temperature is plotted against outdoor mean temperature during the summer of 2017. The results are shown in the temperature cloud in Figure 5, together with the regression – line equation. In this case too, the width of the 95% interval of is indoor operation temperature 6 K.
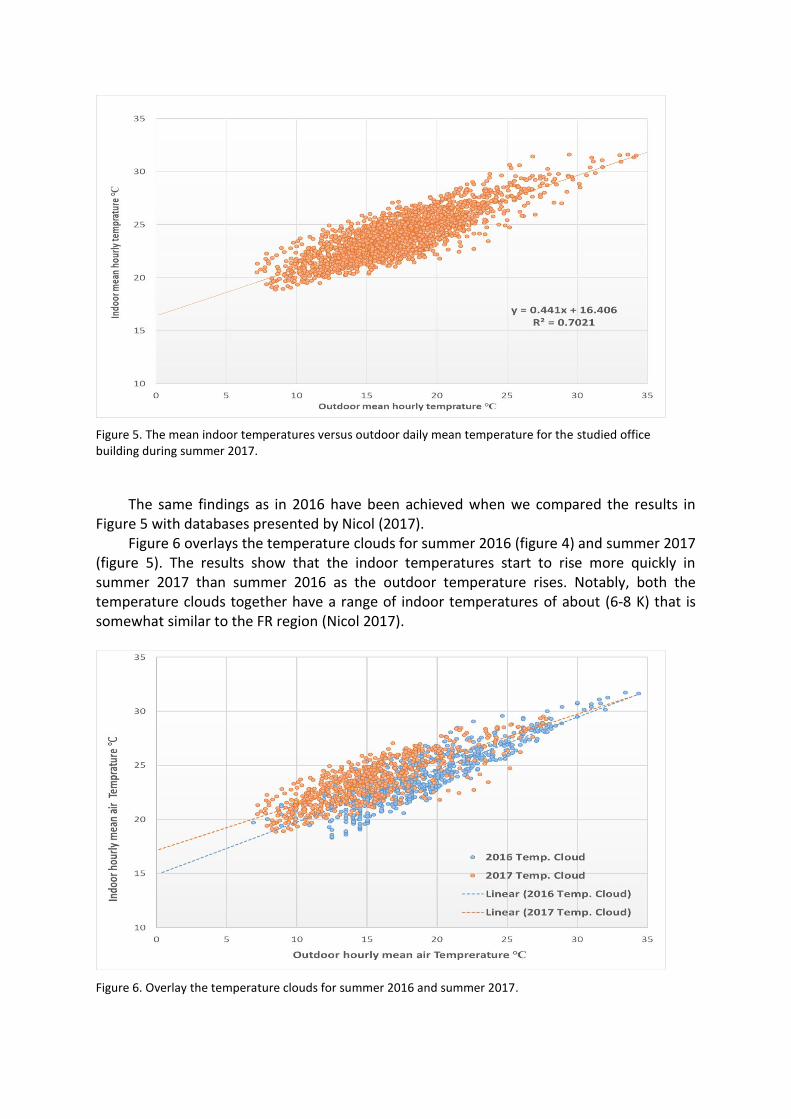
Figure 5. The mean indoor temperatures versus outdoor daily mean temperature for the studied office building during summer 2017.
The same findings as in 2016 have been achieved when we compared the results in Figure 5 with databases presented by Nicol (2017). Figure 6 overlays the temperature clouds for summer 2016 (figure 4) and summer 2017 (figure 5). The results show that the indoor temperatures start to rise more quickly in summer 2017 than summer 2016 as the outdoor temperature rises. Notably, both the temperature clouds together have a range of indoor temperatures of about (6-8 K) that is somewhat similar to the FR region (Nicol 2017).
Figure 6. Overlay the temperature clouds for summer 2016 and summer 2017.
Taking into consideration the findings above we present the long term monitored temperatures of the mechanically ventilated spaces studied according to European standard BS EN15251 (2007) for FR buildings, using the equation which relates the comfort temperature to the outdoor temperature as follows:
𝐓𝐜𝐨𝐦𝐩 = 𝟎. 𝟑𝟑 𝐓𝐫𝐦 + 𝟏𝟖. 𝟖 (𝟏)
Where 𝐓𝐫𝐦 is the exponentially weighted running mean of the daily mean outdoor air temperature as the measure of the outdoor temperature and can be calculated by the following equation
𝐓𝐫𝐦 = (𝐓𝐨𝐝−𝟏 + 𝐓𝐨𝐝−𝟐 + 𝐓𝐨𝐝−𝟑 + 𝐓𝐨𝐝−𝟒 + 𝐓𝐨𝐝−𝟓 + 𝐓𝐨𝐝−𝟔 + 𝐓𝐨𝐝−𝟕)/𝟑. 𝟖 (𝟐) Since the office is located in renovation building the suggested category by BS EN15251 is a
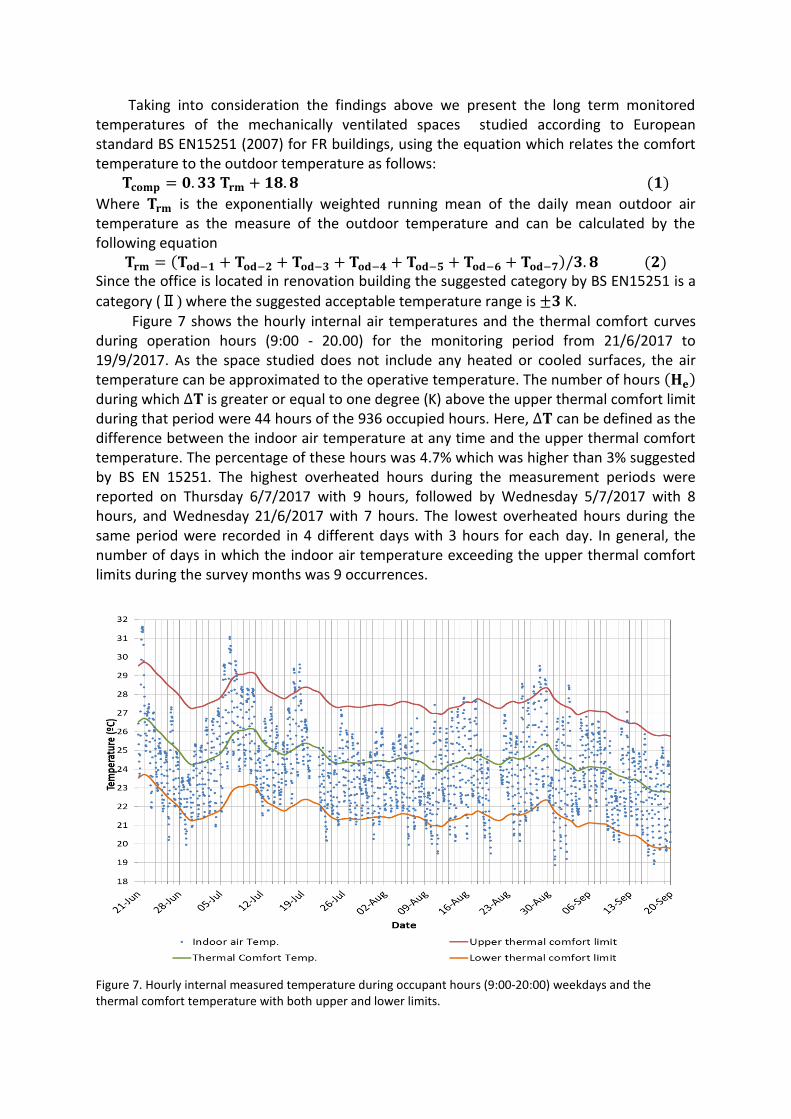
category (Ⅱ) where the suggested acceptable temperature range is ±𝟑 K. Figure 7 shows the hourly internal air temperatures and the thermal comfort curves during operation hours (9:00 - 20.00) for the monitoring period from 21/6/2017 to 19/9/2017. As the space studied does not include any heated or cooled surfaces, the air temperature can be approximated to the operative temperature. The number of hours (𝐇𝐞) during which ∆𝐓 is greater or equal to one degree (K) above the upper thermal comfort limit during that period were 44 hours of the 936 occupied hours. Here, ∆𝐓 can be defined as the difference between the indoor air temperature at any time and the upper thermal comfort temperature. The percentage of these hours was 4.7% which was higher than 3% suggested by BS EN 15251. The highest overheated hours during the measurement periods were reported on Thursday 6/7/2017 with 9 hours, followed by Wednesday 5/7/2017 with 8 hours, and Wednesday 21/6/2017 with 7 hours. The lowest overheated hours during the same period were recorded in 4 different days with 3 hours for each day. In general, the number of days in which the indoor air temperature exceeding the upper thermal comfort limits during the survey months was 9 occurrences.
Figure 7. Hourly internal measured temperature during occupant hours (9:00-20:00) weekdays and the thermal comfort temperature with both upper and lower limits.

4.2. Spot detailed measurement results The acquisition of thermal-hygrometric parameters defined by UNI EN ISO 7730/2005 (ISO 2005), UNI EN ISO 10551/2001 and ASHRAE standard 55/2004 (ASHRAE 2004) was the base for the measurement methodology to evaluate comfort at specific points within the occupied zone in the studying large space using PMV and PPD indices to consider air speed and direction and relative humidity. This is because low air speed was measured in the office which has an impact on thermal comfort as will be discussed in section 4.3. The measured values of the thermal comfort parameters are tabulated in Table 3 for several days during summer 2016 and summer 2017.
Table 3. Synthesis of measured data for several days during summer 2016 and 2017
Date Height
(m)
Mean air temp.
(℃)
Mean air speed (m/s)
RH (%) Metabolic
rate (met)
Clothing insulation
(clo) PMV PPD (%)
5/9/2016 1.2 24.3 0.18 67.6 1.2 0.5 -0.18 6 7/9/2016 1.2 25.7 0.19 51.1 1.2 0.5 +0.07 5 9/9/2016 1.2 25.0 0.2 55.9 1.2 0.5 -0.12 5
31/8/2017 1.2 26.2 0.03 45.1 1.2 0.5 +0.46 9 5/9/2017 1.2 26.1 0.03 56.5 1.2 0.5 +0.50 11
11/9/2017 0.1 25.7 0.02 42.9
1.2 0.5 +0.3 7.0 1.2 26.0 0.04 42.9 1.8 26.2 0.0 42.5
The PMV was calculated using a spreadsheet based on the algorithm given in ISO 7730 standard (ISO 2005) . The result of PMV values were near to zero or lower in the summer of 2016 while the values were higher than zero for all the three days in summer 2017. In fact, all of the PMV values were in the recommended internal range by ISO 7730 which is -0.5+ 0.5. Note that the temperature was within adaptive thermal comfort limits as calculated and shown in Figure 7. Moreover, PPD is the predicted percentage of dissatisfied and calculated in accordance with PMV index; its values were in the suggested range between 0 to 15 percent (ISO 7730) for both summer 2016 and 2017 days. Also, the relative humidity in the office was generally within the comfort limits, ranging from 51% to 67% and from 42% to 44% for summer of 2017. Furthermore, in 11/9/2017 the air temperature at height 1.8m (head level) is higher than that at 0.1m (foot level) with a mean vertical temperature difference was 0.5 ℃. If this difference was 3 ℃ or more, warm discomfort could be perceived at the head, and cold discomfort can be felt at the feet, while the occupant is thermally neutral as a whole. In addition to that, there was no draft at any day due to significantly low air velocities which were near to zero particularly for summer of 2017. Both air draft and vertical temperature difference are the main reasons for causing local discomfort (ASHRAE 2004)(Fathollahzadeh et al. 2016).
4.3. Questionnaire survey results A total amount of 50 questionnaires were collected during three days and processed. Table 4 shows the results of the questionnaires analysis, Table 4 Questionnaires numbers, date and analysis: synthesis of main results
Date Number of
questionnaires MPVq TDI (%) TPI (%) UAMI (%)
31/8/2017 14 0.25 28 0 50
5/9/2017 16 0.8 19 19 63
11/9/2017 20 0.25 15 5 60
For the first day 31/8/2017 the actual mean vote PMVq was found to be slightly warm
(i.e. 0.25) where about half of the people were dissatisfied with air movement. Similarly, the PMVq for day 5/9/2017 was 0.8 which appeared to be slightly warm and a very low air
movement were observed which makes 63% of the office occupants’ discomfort. Consequently the thermal dissatisfaction index (TDI) was 19% in that day. In the same way, the questionnaires data for 11/9/2017 revealed a thermal sensation oriented towards hot where PMVq value was 0.25 in the office that day. About 5% (TPI) of people preferred to
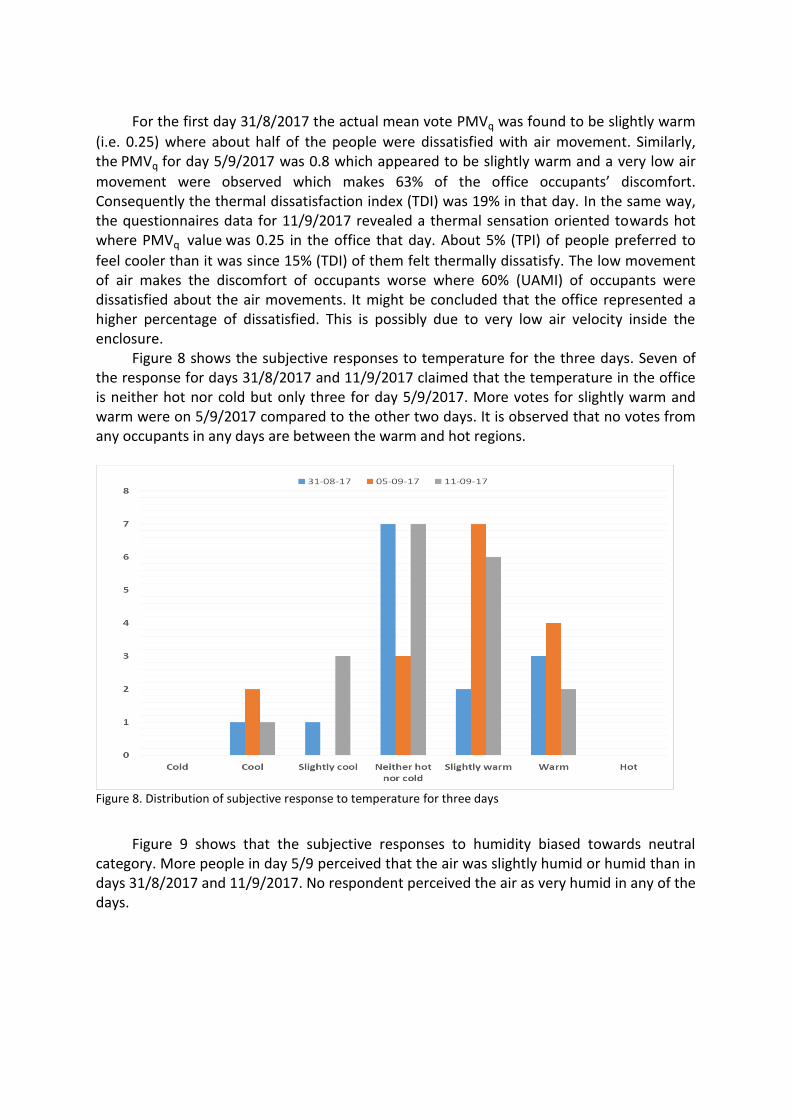
feel cooler than it was since 15% (TDI) of them felt thermally dissatisfy. The low movement of air makes the discomfort of occupants worse where 60% (UAMI) of occupants were dissatisfied about the air movements. It might be concluded that the office represented a higher percentage of dissatisfied. This is possibly due to very low air velocity inside the enclosure. Figure 8 shows the subjective responses to temperature for the three days. Seven of the response for days 31/8/2017 and 11/9/2017 claimed that the temperature in the office is neither hot nor cold but only three for day 5/9/2017. More votes for slightly warm and warm were on 5/9/2017 compared to the other two days. It is observed that no votes from any occupants in any days are between the warm and hot regions.
Figure 8. Distribution of subjective response to temperature for three days
Figure 9 shows that the subjective responses to humidity biased towards neutral category. More people in day 5/9 perceived that the air was slightly humid or humid than in days 31/8/2017 and 11/9/2017. No respondent perceived the air as very humid in any of the days.
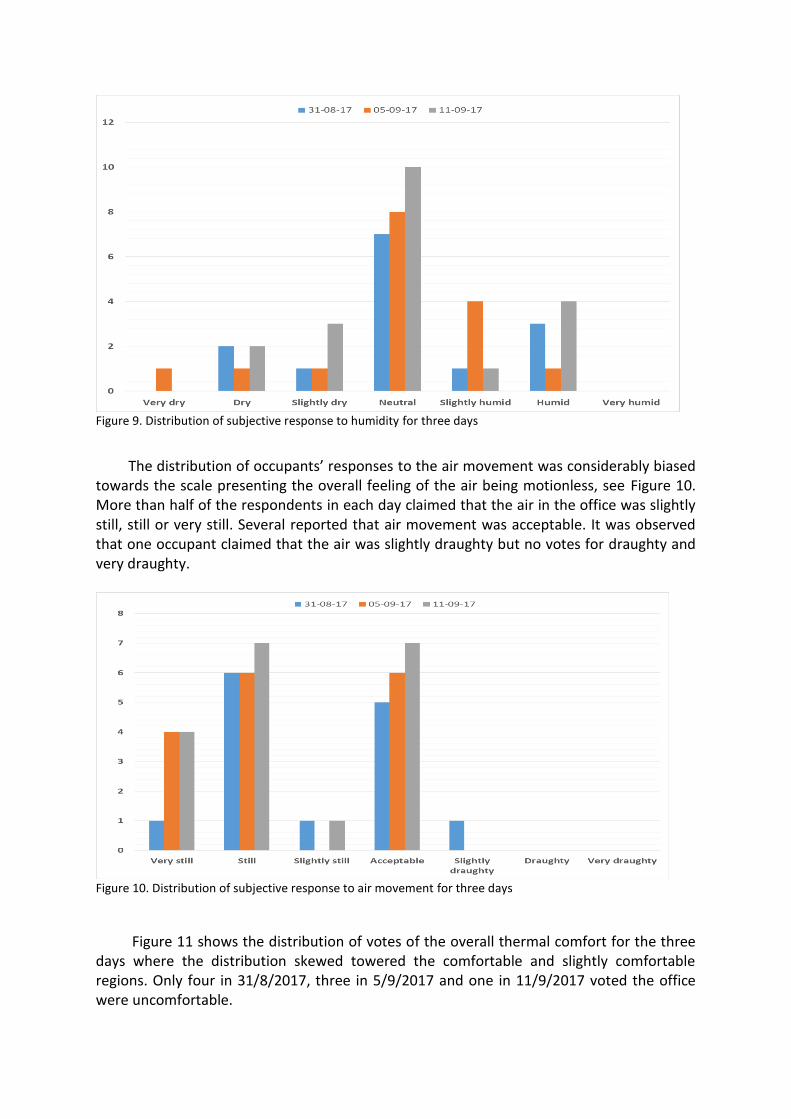
Figure 9. Distribution of subjective response to humidity for three days
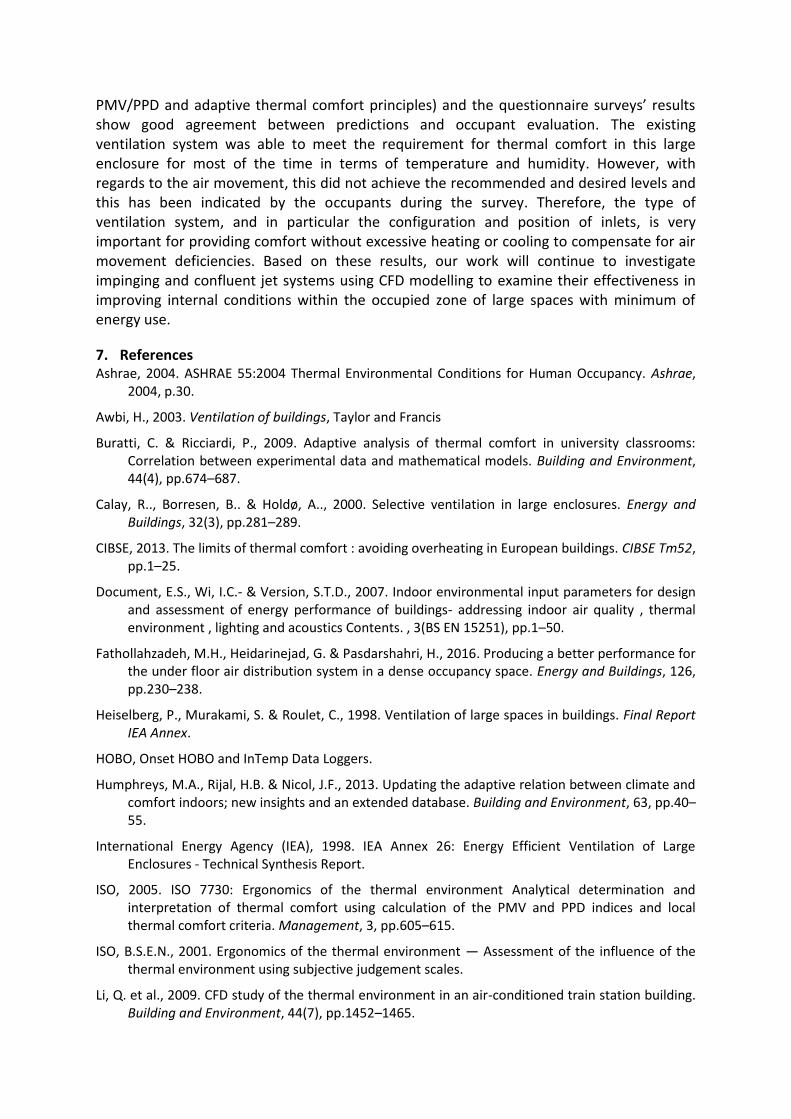
The distribution of occupants’ responses to the air movement was considerably biased towards the scale presenting the overall feeling of the air being motionless, see Figure 10. More than half of the respondents in each day claimed that the air in the office was slightly still, still or very still. Several reported that air movement was acceptable. It was observed that one occupant claimed that the air was slightly draughty but no votes for draughty and very draughty.
Figure 10. Distribution of subjective response to air movement for three days
Figure 11 shows the distribution of votes of the overall thermal comfort for the three days where the distribution skewed towered the comfortable and slightly comfortable regions. Only four in 31/8/2017, three in 5/9/2017 and one in 11/9/2017 voted the office were uncomfortable.

.
Figure 11. Distribution of subjective response to overall comfort for three days
5. Discussion In this paper, three different tools have been used to evaluate the thermal comfort of a mechanically ventilated large space. The first was based on data from the long-term monitoring survey of air temperature and the correlation of of the indoor air temperature with outdoor temperature was calculated for the summer of 2016 (Figure 4) and the summer of 2017 (Figure 5). It was observed that both results are comparable with correlations using similar analysis. Nicol (2017) points out that typically for FR buildings the regression slope is between 0.5 and 0.6 between indoor operative temperature and outdoor air temperature which is similar to the regression slopes for both summers 2016 and 2017. Accordingly, the researchers’ office can be treated as FR building although it has a mechanical ventilation system. Looking at the range of indoor temperature and outdoor temperature (Figure 3), this remained stable at 6-7 K throughout the day. CIBSE TM50 (CIBSE 2013) table 2 suggested that the acceptable temperature range for a new or renovation free-running building is ±𝟑K; from Figure 7 nine occurrences in which the indoor air temperature exceeded the upper thermal comfort limits in summer 2017.The second tool used in this paper was short term detailed measurements to include air speed at different heights in the occupied zone. The comfort temperature for occupants is assumed to be most satisfied when both PMV and PPD are closed to minimum values. Therefore, the calculated PMV and PPD values for the assigned days were in the recommended range by ISO 7730. The last tool was a questionnaire survey in which the occupants reported that the office was generally neutral. However, a high percentage of them claimed that the air movement was not acceptable in all the assessed days during the summer of 2017. Teli et al. (2016) mentions that people do not have the same metabolism, cultures and familiarity with available adaptive opportunities for particular heating or cooling systems.
6. Conclusion This paper presented results from three tools used to evaluate the thermal comfort of a large space office building. The comparisons between the measurement (analysed using
PMV/PPD and adaptive thermal comfort principles) and the questionnaire surveys’ results show good agreement between predictions and occupant evaluation. The existing ventilation system was able to meet the requirement for thermal comfort in this large enclosure for most of the time in terms of temperature and humidity. However, with regards to the air movement, this did not achieve the recommended and desired levels and this has been indicated by the occupants during the survey. Therefore, the type of ventilation system, and in particular the configuration and position of inlets, is very important for providing comfort without excessive heating or cooling to compensate for air movement deficiencies. Based on these results, our work will continue to investigate impinging and confluent jet systems using CFD modelling to examine their effectiveness in improving internal conditions within the occupied zone of large spaces with minimum of energy use.
7. References Ashrae, 2004. ASHRAE 55:2004 Thermal Environmental Conditions for Human Occupancy. Ashrae,
2004, p.30.
Awbi, H., 2003. Ventilation of buildings, Taylor and Francis
Buratti, C. & Ricciardi, P., 2009. Adaptive analysis of thermal comfort in university classrooms: Correlation between experimental data and mathematical models. Building and Environment, 44(4), pp.674–687.
Calay, R.., Borresen, B.. & Holdø, A.., 2000. Selective ventilation in large enclosures. Energy and Buildings, 32(3), pp.281–289.
CIBSE, 2013. The limits of thermal comfort : avoiding overheating in European buildings. CIBSE Tm52, pp.1–25.
Document, E.S., Wi, I.C.- & Version, S.T.D., 2007. Indoor environmental input parameters for design and assessment of energy performance of buildings- addressing indoor air quality , thermal environment , lighting and acoustics Contents. , 3(BS EN 15251), pp.1–50.
Fathollahzadeh, M.H., Heidarinejad, G. & Pasdarshahri, H., 2016. Producing a better performance for the under floor air distribution system in a dense occupancy space. Energy and Buildings, 126, pp.230–238.
Heiselberg, P., Murakami, S. & Roulet, C., 1998. Ventilation of large spaces in buildings. Final Report IEA Annex.
HOBO, Onset HOBO and InTemp Data Loggers.
Humphreys, M.A., Rijal, H.B. & Nicol, J.F., 2013. Updating the adaptive relation between climate and comfort indoors; new insights and an extended database. Building and Environment, 63, pp.40–55.
International Energy Agency (IEA), 1998. IEA Annex 26: Energy Efficient Ventilation of Large Enclosures - Technical Synthesis Report.
ISO, 2005. ISO 7730: Ergonomics of the thermal environment Analytical determination and interpretation of thermal comfort using calculation of the PMV and PPD indices and local thermal comfort criteria. Management, 3, pp.605–615.
ISO, B.S.E.N., 2001. Ergonomics of the thermal environment — Assessment of the influence of the thermal environment using subjective judgement scales.
Li, Q. et al., 2009. CFD study of the thermal environment in an air-conditioned train station building. Building and Environment, 44(7), pp.1452–1465.
Mateus, N.M. & Carrilho da Graça, G., 2017. Simulated and measured performance of displacement ventilation systems in large rooms. Building and Environment, 114, pp.470–482.
Nicol, F., 2017. Temperature and adaptive comfort in heated, cooled and free-running dwellings. Building Research and Information, 45(7), pp.730–744.
Ricciardi, P. & Buratti, C., 2015. Thermal comfort in the Fraschini theatre (Pavia, Italy): Correlation between data from questionnaires, measurements, and mathematical model. Energy and Buildings, 99, pp.243–252.
Ricciardi, P., Ziletti, A. & Buratti, C., 2016. Evaluation of thermal comfort in an historical Italian opera theatre by the calculation of the neutral comfort temperature. Building and Environment, 102, pp.116–127.
Teli, D. et al., 2016. Thermal adaptation to high indoor temperatures during winter in two UK social housing tower blocks. Windsor 2016, (April), pp.7–10.
Zhao, X., Yu, W. & Tan, D., 2017. Thermal Comfort Study Based on Questionnaire Survey among Occupants in Different Climate Zones in China. International Journal of Environmental Science and Development, 8(6), pp.430–434.